Embed Size (px)
Citation preview

*** ENVIRONMENTAL ACTION COMMITTEE OF WEST MARIN *** Protecting West Marin Since 1971
June 5, 2012
Dear Acting Inspector General Kendall, Dr. Morgenweck, and Dr. Machlis,
The Environmental Action Committee of West Marin has reviewed Dr. Corey Goodman's April 24,
2012 complaint to the Inspector General and Department of the Interior claiming that the Park
Service made false representations, concealed data, and engaged in deception and fraud. Dr.
Goodman’s analysis is fundamentally flawed. To ensure trust and accountability in science, Dr.
Goodman’s most recent complaints of misconduct must be rejected. We submit the attached
technical analysis to support this conclusion.
The attached analysis was conducted by Dr. Dominique M. Richard, a specialist in systems science
with expertise in statistics and acoustics. Dr. Richard’s analysis of Dr. Goodman’s recent
allegations follows EAC’s March 27th
letter to Secretary Salazar, and April 2nd
letter addressed to
you, highlighting Dr. Goodman’s fatally-flawed scientific methods and analysis. Dr. Richard details
Dr. Goodman’s faulty scientific methods, uncovers mathematical errors, highlights the effect of
“cherry-picked” data, and overall rejects the conclusions of Dr. Goodman’s complaint. This is
important to each of your agencies because Dr. Goodman’s unscientific analysis and conclusions
provide the foundation for his accusations of misconduct and fraud.
It is unfortunate that several elected officials, such Senator Dianne Feinstein, Representative Darrell
Issa, and Marin County Supervisor Steve Kinsey, continue to rely upon Dr. Goodman’s flawed
science. This is inappropriate and a disservice to such an important debate involving public lands
policy. Dr. Goodman has far exceeded his self-claimed role as a "neutral" scientist, and instead is
apparently trying to twist the Park Service's science to undermine the agency’s credibility in the eye
of the public and elected officials. As a result of continued charges of wrongdoing by Dr. Goodman,
each of your agencies is now expending significant resources to investigate his latest round of
unreasonable claims.
In the following analysis, you will find that Dr. Goodman’s major claims are not well founded. An
examination of his alternative analysis reveals that it is defective and therefore must be rejected. We
would be happy to answer any questions that you may have.
Thank you for your consideration of our concerns and technical analysis.
Respectfully submitted,
Amy Trainer, Executive Director
Environmental Action Committee of West Marin

Cc: Congresswoman Lynn Woolsey
Senator Dianne Feinstein
Senator Barbara Boxer
Senator Jeff Bingaman
Democratic Leader Nancy Pelosi
Dr. Ralph J. Cicerone, President of the National Academy of Sciences and Chair of the
National Research Council

Executive Summary
Dr. Goodman faults the Park Service‟s September 2011 Draft Environmental Impact Statement
(DEIS) for its analysis of oyster-operation-generated noise and further accuses the NPS of
engaging in knowing deception, misrepresentation, concealment, and other actions that are
elements of the definition of fraud. As shown below, because Dr. Goodman‟s analysis contains
fatal flaws, his conclusions about boat speed and resulting sound impacts must be rejected.
This document first reviews in detail the criticisms of the DEIS soundscape analysis, and finds
that all major criticisms are not well founded. It then examines the critic‟s alternative analysis
and finds that it is fatally flawed. The attached appendices provide a detailed technical statistical
examination of key errors in Dr. Goodman‟s methodology.
In summary, Dr. Goodman‟s latest charge of misconduct against the Park Service fails because:
1. The DEIS assumption that sound from Main Channel boats would be obstructed by the bluff is
confirmed, is consistent with the operating restrictions in place for seal protections, and the NPS
corresponding analysis is correct;
2. Dr. Goodman‟s attempt to inflate the natural ambient sound level for Drakes Estero is flawed;
3. The Park Service used a range of ambient sound levels in its analysis, which contradicts Dr.
Goodman‟s claims that the DEIS used a fabricated lowest ambient sound level and further
contradicts Dr. Goodman‟s claims of NPS bias;
4. Dr. Goodman‟s calculations ignore the effect of atmospheric absorption, which is .001976
dBA per meter (3.28 feet), and thus his claims about the DEIS ambient sound calculations are
incorrect;
5. Dr. Goodman‟s alternative analysis of oyster operation impacts on the soundscape is beset by
a number of inconsistencies and factual inaccuracies;
6. Dr. Goodman relies on the ENVIRON study conducted for the oyster company for data to
represent motorboat noise but that data was not collected under normal operating conditions and
understates the motorboat sound in the Estero;
7. Dr. Goodman‟s analysis of impacts to harbor seals is significantly understated; and
8. Dr. Goodman‟s data and analysis demonstrates the reasonableness of the DEIS‟s assumption
that the microphone would not pick up any/enough data from the West or Lateral Channels to be
useful, given the improbably necessary combinations of motorboat dBA levels, distance, ambient
levels, atmospheric attenuation and other uncontrolled variables.

I. Rejection of Dr. Goodman’s Criticisms of DEIS Soundscape Impacts.
Summary: Dr. Goodman‟s analysis and the DBOC-sponsored ENVIRON report allege
shortcomings in the DEIS, including:
A. Use of reference noise sources rather than direct measurements on site;
B. Failure to use ambient microphone data;
C. Ambient Sound Bias re: Leq vs. L50;
D. Ambient Sound Bias re: Natural v. Existing;
E. Use of unprecedented Lowest Metric; and
F. Miscalculated Ambient Sound.
Each of these criticisms is addressed below in detail, with analysis showing that Dr. Goodman‟s
criticisms of the DEIS must be rejected.
A. Why Dr. Goodman’s ‘Reference Noise Sources’ Complaint Must Be Rejected.
The DEIS measured the sound levels from multiple human-made oyster operation noise sources
by using acoustic measurements made in earlier published noise studies (also referred to as
library data).1 The library data were extrapolated to operations and local conditions in Drakes
Estero, taking into account frequency of equipment use, and distance.
Dr. Goodman‟s analysis criticizes the September 2011 DEIS for relying on library data and not
commissioning and utilizing a new, unique, local measurement of noise generated by the oyster
operations. This criticism fails to acknowledge that the NPS used its standard practice in
preparing the sound and noise level impacts section of the DEIS and that the DEIS likely
underestimated impacts2.
Dr. Goodman is further critical of the March 2012 ATKINS independent peer review of the
DEIS for not considering and deferring to noise measurement data produced by a December
2011 oyster company commissioned study performed by ENVIRON.3
The March 2012 ATKINS peer review of the DEIS was simply that – a review of the DEIS
document itself – and was not a review of any of the more than 52,000 public comments (which
includes the ENVIRON report). Procedurally, it would be inappropriate for a peer review to
consider the ENVIRON report or any of the other public comments, which will be considered by
NPS as they prepare the Final EIS. Substantively, the ENVIRON report contains numerous fatal
flaws and was criticized in EAC‟s previous letter for failing to achieve appropriate scientific
standards.4
1 The NPS’s use and reliance on such published noise studies or “library data” is standard practice and was not
unique to the Drakes Estero DEIS. 2 4/2/12 EAC letter to Salazar http://www.savepointreyeswilderness.org/wp-
content/uploads/2012/04/EAC_to_Dr__R__Morgenweck_DOI_With_DETAIL.pdf 3 ENVIRON December 2011.
4 4/2/12 EAC letter to Salazar http://www.savepointreyeswilderness.org/wp-
content/uploads/2012/04/EAC_to_Dr__R__Morgenweck_DOI_With_DETAIL.pdf

B. Why Dr. Goodman’s ‘Failure to Use Ambient Noise Data” Complaint Must Be Rejected.
In a study to assess the potential impacts of Air Tours on the soundscape of the Point Reyes
National Seashore, the NPS placed four omnidirectional microphones at widely separated
locations in the park. One microphone, PORE004, was located back from the bluff on the east
shore of Drakes Estero. The Goodman analysis criticizes the DEIS for not using data from this
microphone to assess the impact of oyster operations on the soundscape of the estero.
Dr. Goodman states, “*The+ DEIS simply stated that the bluff below the microphone likely blocked the sound path from boats to microphone.“ Dr. Goodman proceeds to assert, “As shown here, that [DEIS claim] was incorrect. The sound path was un-obstructed.5” However, the dashed-line boat route data submitted by DBOC on which DEIS noise impacts
were estimated (see Figure 4-1 below of the DEIS) do not show any boat traffic at all in the Main
Channel. 6 Furthermore, even if the DEIS could have known about traffic in the Main Channel,
the PORE004 microphone is approximately 135 feet back from the edge of the bluff, obstructing
the direct path of sound from a boat operating in portions of the Main Channel near the bluff:
Figure 4-1, DEIS
5 Goodman Pt. 4 slide 7.
6 Again, Dr. Goodman accuses the DEIS for not recognizing that DBOC would withhold data indicating that boats in
the Main Channel could be heard on the NPS microphone. Only after NPS did its study on boat data (requested from and provided by DBOC) did DBOC then release additional data (which inadvertently reveals harbor seal protection violations) in attempts to criticize NPS (for failing to analyze boat trip data that DBOC had withheld).This is not unusual. In the Marine Mammal Commission proceedings, NPS asked DBOC for detailed harvest data, but DBOC declined. NPS then analyzed the data that it had to produce the Becker 2011 Report. DBOC then produced selective data in attempts to criticize NPS for failing to the analyze data that DBOC had withheld.

Google Earth data is a course indicator,7 but nevertheless does show GPS points near the bluff to
be obstructed. Photographs taken from the microphone site similarly show GPS points near the
bluff to be obstructed. Noise measured by the Volpe microphone from GPS points near the bluff
show are significantly below projected levels. The two statistical analyses in Appendix 1.a and
b. also show GPS points near the bluff are likely obstructed. These five different approaches all
show the DEIS statement to be correct – sound paths from boats operating near the bluff are
obstructed. This is where the oyster boats should be, because the California Coastal
Commission‟s (CCC) Seal Protection Area restricts the boats to operate only east of the red line
in Figure 1 (below), relatively close to the bluff.
But Figure 28 (below) clearly shows GPS points to the left of the mid-channel, in violation of the
seal protection area. Such points may well have an unobstructed path to the microphone, but
even if DBOC had provided information to the DEIS about boat traffic in the Main Channel, the
DEIS had no reason to assume that boat sounds would be coming from those unpermitted
locations. The DEIS assumed that DBOC boats would be operating only outside the restricted
area, consistent with the harbor seal protection regulations.9
Figure 1: from CCC-W6-12-2007 Figure 2: From Goodman Part 4 Slide 42 1/14/10
The DEIS assumption that sound from Main Channel boats would be obstructed by the bluff is
consistent with the operating restrictions in place for seal protection and corresponding analysis
is correct.
C. Why Dr. Goodman’s ‘Ambient Sound Bias’ Claim re: Leq vs. L50’ is Incorrect.
7 Google Earth shows the same microphone site at four different elevations (67 feet, 68 feet, 56 feet and 64 feet in
Part 4 Slides 28, 29, 31 and 32 respectively). 8 Dr. Goodman’s Part 4 Slide #42.
9 DBOC seems to claim to the NPS through Dr. Goodman that its boats use the west portion of the Main Channel where their noise is “un-obstructed,” yet also has claimed to the CCC that its boats never use the west portion of the Main Channel because that would violate the Seal Protection Area. A similar contradiction in DBOC claims to different agencies was described in a 3/12/12 Save Our Seashore letter to CCC that noted that DBOC’s two pupping-season west-end Lateral Channel claims (to the National Academy that its boats were “expressly prohibited” and to the CCC that is boats were “always allowed”) could also not both be true.
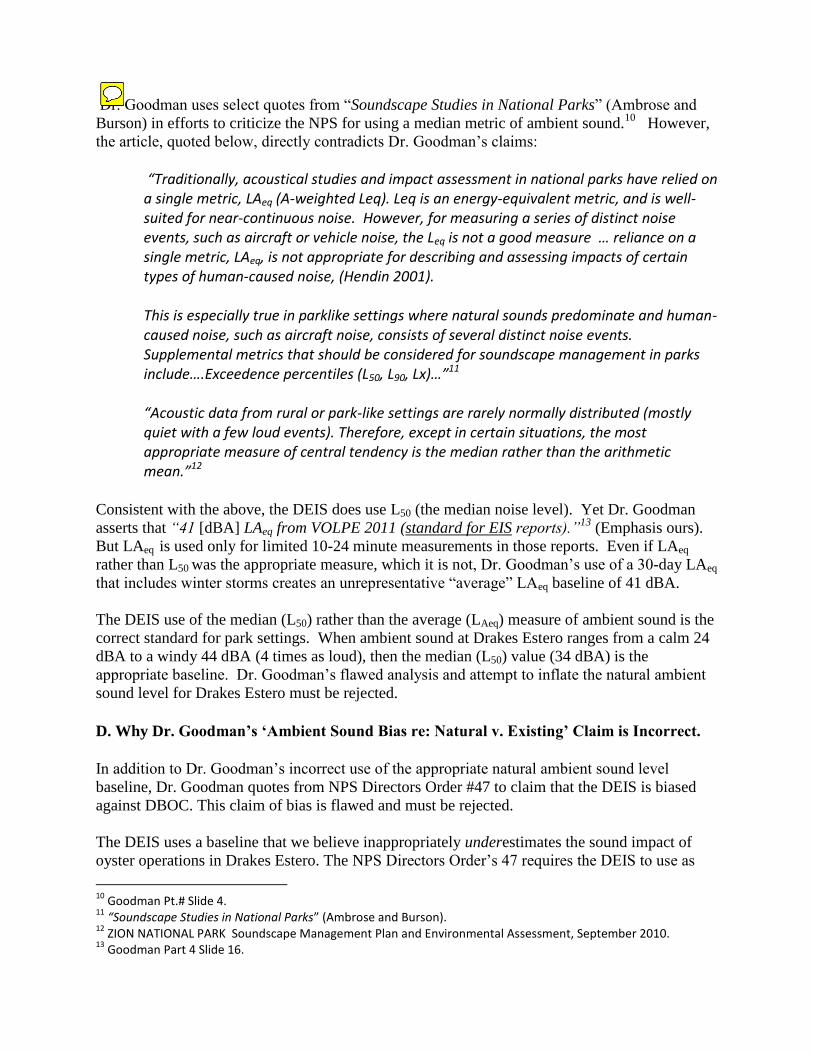
Dr. Goodman uses select quotes from “Soundscape Studies in National Parks” (Ambrose and
Burson) in efforts to criticize the NPS for using a median metric of ambient sound.10
However,
the article, quoted below, directly contradicts Dr. Goodman‟s claims:
“Traditionally, acoustical studies and impact assessment in national parks have relied on a single metric, LAeq (A-weighted Leq). Leq is an energy-equivalent metric, and is well-suited for near-continuous noise. However, for measuring a series of distinct noise events, such as aircraft or vehicle noise, the Leq is not a good measure … reliance on a single metric, LAeq, is not appropriate for describing and assessing impacts of certain types of human-caused noise, (Hendin 2001). This is especially true in parklike settings where natural sounds predominate and human-caused noise, such as aircraft noise, consists of several distinct noise events. Supplemental metrics that should be considered for soundscape management in parks include….Exceedence percentiles (L50, L90, Lx)…”11
“Acoustic data from rural or park-like settings are rarely normally distributed (mostly quiet with a few loud events). Therefore, except in certain situations, the most appropriate measure of central tendency is the median rather than the arithmetic mean.”12
Consistent with the above, the DEIS does use L50 (the median noise level). Yet Dr. Goodman
asserts that “41 [dBA] LAeq from VOLPE 2011 (standard for EIS reports).”13
(Emphasis ours).
But LAeq is used only for limited 10-24 minute measurements in those reports. Even if LAeq
rather than L50 was the appropriate measure, which it is not, Dr. Goodman‟s use of a 30-day LAeq
that includes winter storms creates an unrepresentative “average” LAeq baseline of 41 dBA.
The DEIS use of the median (L50) rather than the average (LAeq) measure of ambient sound is the
correct standard for park settings. When ambient sound at Drakes Estero ranges from a calm 24
dBA to a windy 44 dBA (4 times as loud), then the median (L50) value (34 dBA) is the
appropriate baseline. Dr. Goodman‟s flawed analysis and attempt to inflate the natural ambient
sound level for Drakes Estero must be rejected.
D. Why Dr. Goodman’s ‘Ambient Sound Bias re: Natural v. Existing’ Claim is Incorrect.
In addition to Dr. Goodman‟s incorrect use of the appropriate natural ambient sound level
baseline, Dr. Goodman quotes from NPS Directors Order #47 to claim that the DEIS is biased
against DBOC. This claim of bias is flawed and must be rejected.
The DEIS uses a baseline that we believe inappropriately underestimates the sound impact of
oyster operations in Drakes Estero. The NPS Directors Order‟s 47 requires the DEIS to use as
10
Goodman Pt.# Slide 4. 11
“Soundscape Studies in National Parks” (Ambrose and Burson). 12
ZION NATIONAL PARK Soundscape Management Plan and Environmental Assessment, September 2010. 13
Goodman Part 4 Slide 16.

the environmental baseline the “natural ambient”. Volpe provides an L50 value (only) of 32.2
dBA for daytime “natural ambient”.14
The DEIS‟s use of an L50 value of 33.8 dBA for daytime
“existing ambient” includes human caused noise, which results in a higher ambient sound level,
and thus understates the sound impact of oyster operations.
Furthermore, Directors Order 47 also states, “where it is not possible to measure the natural
ambient sound level with certainty because of high levels of human-caused sound, or where it is
prohibitively expensive to measure natural ambient sound levels…. this level will be estimated
using a statistic called L90, the sound level that is exceeded 90 percent of the time.” Thus, once
the DEIS abandoned the Volpe daytime L50 “natural ambient” level of 32.2, the default metric
should have been the daytime L90 “existing ambient,” which Volpe shows at 25.7 dBA.
These NPS errors inappropriately favor DBOC. If corrected in the Final EIS, the estimated sound
impact of oyster operations should increase, showing even greater adverse impacts to this
designated wilderness area from oyster operations.
E. Why Dr. Goodman’s ‘Lowest Ambient Sound Level Bias’ Claim is Incorrect.
Dr. Goodman asserts that in Tables 4-2 through 4-5 the DEIS incorrectly used the calmest day 24
dBA level, “an unprecedented metric”, and thereby overstated noise impacts from the oyster
operation.15
Contrary to his assertion, the DEIS used a range of ambient sound levels in these
tables to demonstrate the range of possible noise dissipation distances under varying conditions.
The tables show the distance at which sound from the oyster operations would dissipate to the
ambient level, when that level ranges from 44 dBA to 24 dBA.16
The tables also show how
different noise levels (35, 52, and 71 dBAs) impact different kinds of communications
(classroom teacher‟s, group leader‟s and personal conversation respectively).17
Table 4-2, DEIS
The DEIS states (emphasis ours) “A sample of how motorboat sound would be dissipated over
water on a calm day is displayed in table 4-2 below.”18
The “calm day” example (bottom row in
Table 4-2) uses 24 dBA (the lowest daily ambient figure) from Volpe Figure 14. Similarly, the
“windiest day” (third row in table 4-2) example uses 44 DBA, the highest daily natural ambient
14
All dBA figures from Volpe, Table 8. 15
Goodman Part 3 slide 7. 16
Although Dr. Goodman claims the lowest ambient level is “not found in VOLPE” the range of ambient noise is indeed found in Volpe Figure 14. 17
DEIS, p. 202, 355. 18
DEIS pg. 355.

sound level. With such a range of natural ambient sound levels (the windiest day almost 4 times
louder than the calmest day), the DEIS appropriately provided these Tables to demonstrate how
this extreme range of ambient sound levels could affect noise dissipation distances.
In summary, the NPS used a range of ambient sound levels in its analysis, which contradicts Dr.
Goodman‟s claims that the DEIS used a fabricated lowest ambient sound level and further
contradicts Dr. Goodman‟s claims of NPS bias. F. Why Dr. Goodman’s Ambient Sound Calculation is Incorrect.
Dr. Goodman asserts that DEIS Tables 4-2, 4-3 and 4-4 “contain calculation errors.”19
However, the DEIS description states “A sample of how motorboat sound would be dissipated
over water on a calm day is displayed in table 4-2 below. These distances assume spherical
spreading loss and nominal atmospheric absorption value for the noise (400 hertz [Hz], 59
degrees Fahrenheit, 50 percent humidity).20
”
Dr. Goodman‟s calculations ignore the effect of atmospheric absorption, which is .001976 dBA
per meter (3.28 feet).21
As can be seen below, the figures in Table 4-2 do match, as do the
figures in Tables 4-3 and 4-4.22
Dr. Goodman‟s claim that the DEIS ambient sound calculations
are incorrect is simply wrong.
Distance(ft.) Spherical Dissipation Atmospheric Absorption Net vs. Table 4-2
50 71 < .001976 x 50/3.28 = 0.03 > 70.97 71
435 71-[20*log(435/50) = 52.21 < .001976 x 435/3.28 = 0.27 > 51.94 52
1048 71-[20*log(1048/50) = 44.57 < .001976 x 1048/3.28 = 0.64 > 43.93 44
2,658 71-[20*log(2658/50) = 36.49 < .001976 x 2658/3.28 = 1.62 > 34.87 35
7,062 71-[20*log(7062/50) = 28.00 < .001976 x 7062/3.28 = 4.31 > 23.69 24
II. Rejection of Dr. Goodman’s Alternative Sound Analysis.
Summary: Dr. Goodman‟s documents provide an alternative analysis of oyster operation
impacts on the soundscape of Drakes Estero wilderness area. However, Dr. Goodman‟s use of
obstructed noise data understate impacts, since the varying topography and vegetation of the
bluffs obstruct noise (see Appendices 1 a-b). These same bluffs reflect that noise back to harbor
seals. None of this addresses the potentially most significant impact: underwater noise on
the seals. Other uncontrolled variables confound Dr. Goodman‟s attempt to deduce (through
ex-post facto analysis) the very data that ENVIRON had the opportunity to test for under
completely controlled condition. Even so (if one ignores uncontrolled variables and analytic
errors), Dr. Goodman‟s data23
indicates that during the 20% of the times analyzed (9 out of 45),
19
Goodman Pt. 3 page Slide 41. 20
DEIS pg. 355. 21
http://resource.npl.co.uk/acoustics/techguides/absorption/ 22
Our 17,650 foot calculation in Table 4-4 results in a net of 23.41 vs. 24, which we attribute to a rounding error. 23
Goodman Part 4 Slide 59.

when DBOC boat operates at or beyond 16 mph, it produces: “70-71 dBA at 50 feet”which
supports the DEIS representative boat noise level that Dr. Goodman objects to.
However, Dr. Goodman‟s alternative analysis contains key, fatal defects, including:
A. Ignoring DEIS Definition of Major Impact;
B. Unobstructed Sound Paths Errors;
C. Unrepresentative Motorboat Noise Test;
D. Boat Speed Calculation Errors;
E. Failure to Hear Boat Noise Errors;
F. Inappropriate Averaging of Ambient Sound Data;
G. Conversation Recorded in Motoring Boat; and
H. Why Dr. Goodman‟s „Harbor Seal Impact” Analyses are Deficient.
These components are addressed below with analysis showing the flaws in Dr. Goodman‟s use
and reliance upon each of them.
A. Why Dr. Goodman’s Analysis Ignores the DEIS Definition of Major Impact.
The DEIS states, “The two motorboats together run up to 8 hours (or 12 40-minute trips) per
day, six days a week. According to DBOC, boats travel to a site, are shut off while DBOC staff
work, and are turned back on for travel to the next site. DBOC estimates that the motors are
running for about a quarter of the time that the boat is being used in Drakes Estero24
. According
to this assumption, motorboat use impacts the natural soundscape for an intermittent two hours
a day.”25
Consequently, we estimate based on DEIS Figure 4-2:
Schooner: 7,000‟ x 3 trips each day / 5280 = 3.98 mi
Home: 12,000‟ x 3 trips each day / 5280 = 6.82 mi
Creamery: 14, 500‟ x 3 trips each day / 5280 = 8.24 mi
Lateral/Barries 14,500‟ x 3 trips each day / 5280 = 8.24 mi
12 trips 27.27 mi
If the average “transit” is speed of averages about 15 mph (see Appendices 1 a and b), then these
above trips would take roughly the two hours estimated by the DEIS from DBOC‟s own supplied
data. No overlap should be credited since these are two geographically-distinct noise sources.
While the DEIS ignores “tending time” during which it assumes (based on DBOC‟s information)
that the boat motor is “off,” Dr. Goodman‟s data now makes clear that the boat motor is actually
on for short periods and operating at slow speeds during these tending (or “search”) times. The
DEIS may consequently understate the total impact by including only the 2-hours of “transit”
times.
24
(DBOC [Lunny], pers. comm., 2011h). 25
DEIS at pg. 354.

Furthermore, the DEIS defines as a “major” impact: “Human-caused noise would be at a level
that causes vocal communication to be difficult between people separated by less than 16 feet,
and the natural soundscape is interfered with more than 10 percent of the time.”26
The DEIS
further defines that level as ≥ 40 dBA at 16 feet,27
which equals 30 dBA at 50 feet.28
Thus the effect of Dr. Goodman‟s entire analysis is not that it disagrees that the DEIS found
DBOC noise to be a major impact, but rather that it disagrees with the amount by which the
DEIS found the intensity of DBOC noise to be a major impact. Whether at a distance of 50 feet
the DBOC boats produce a maximum of 60 dBA (as Dr. Goodman claims) or 71 dBA as the
DEIS claims, in either case the mixture of boat speeds and dBAs within the two hours of boat
operations creates significant impacts.
B. Why Dr. Goodman’s ‘Unobstructed Sound Paths Claim is Defective.
Dr. Goodman asserts that all of the sound paths in his analysis are unobstructed29
and “this can
be directly tested using Google earth elevation profiles...to determine if the sound path…was
obstructed as suggested in the DEIS.”30
However, Dr. Goodman‟s Google Earth data do not provide a consistent elevation for the NPS
microphone, indicating four different elevations (67 feet, 68 feet, 56 feet and 64 feet in Part 4
Slides 28, 29, 31 and 32 respectively). Furthermore, the elevation profiles and their related
Google Earth satellite photos do not appear to match. For example, when the large boat graphic
overlay is removed from Dr. Goodman‟s Slide 29 the cross section shows the bluff edge half
way between the boat site and the microphone site, whereas on the red “path” of the satellite
photo the bluff face is two-thirds of the way from the boat to the microphone. These small
discrepancies suggest that the elevation profiles do not have adequate precision to be other than
approximations. Such inconsistent approximations do not support Dr. Goodman‟s resulting
conclusions that require a consistent, set microphone elevation figure.
Photographs taken from the microphone site31
support our claim that GPS points in the half of
the Main Channel closest to the bluffs are obstructed, despite Dr. Goodman‟s claim that Google
elevations show them not to be. Inspection using a simple ruler also calls into question reliance
on these Google elevation profiles. On Slide 29, a ruler line from the microphone site (at top
right of the cross section) to the now-exposed boat location (at the far right of the waterline)
intersects the ground. This contradicts Dr. Goodman‟s assertion that this noise path is un-
obstructed. Additionally, noise paths from points closer to the microphone certainly are
obstructed (e.g. the cluster of 5 points 071-17 to 071-21 just above the midway point of the red
line in Slide 29).
26
DEIS pg. 351. 27
DEIS Table 3-4. 28
http://www.sengpielaudio.com/calculator-distance.htm 29
Goodman Part 4 page 33 & 34. 30
Goodman Part 4 page 25. 31
Appendix 5

Slide 28 (1/14/10): Line from microphone to GPS 071-04 is barely above ground.
32
Slide 29 (1/14/10): Line from microphone to GPS Point 071-14 is obstructed by the ground.
33
32
Goodman Pt. 4 33
ibid

Based on the “ruler line analysis” of Slides 28 and 29, it appears that when GPS sites are within
roughly 45° of perpendicular to the bluff face (a 90°view that includes the two sites with cross
sections) and are also in the western third of the Main Channel (farthest from the bluff), they are
likely un-obstructed. Conversely, those sites within this 90° view but in the eastern third of the
channel (closest to the bluff) are almost certainly obstructed. The status of those sites with this
view but in the middle third of the Channel is indeterminate. Also, the paths to sites outside this
90° view cannot be determined without additional cross sections.
Thus, although of limited precision, Google cross-sections could help to determine data points
that are unequivocally either obstructed or un-obstructed, with a possibly large middle range of
unknown data points.
However, Dr. Goodman did not include cross-sections that might provide some confidence that
each of his sound paths is indeed un-obstructed, nor did he provide longitude and latitude data,
which was seemingly readily available (see his Slide 62 below). In sum, Dr. Goodman omitted
key information showing that many of the data points he relies upon have noise paths that are in
fact obstructed by the bluff. 34
Goodman Part 4 Slide 62
C. Why DBOC’s ‘Motorboat Noise Test ’ is Defective.
The DEIS represented oyster motorboat noise at 71 dBA at a distance of 50 feet, using test data
from a New Jersey site, whereas the ENVIRON study conducted for the oyster company
represented motorboat noise at 59-60 dBA. However the ENVIRON data were not collected
under normal operating conditions and understate the motorboat sound in the estero.35
The standard acoustic “pass-by test” is done at full throttle, after which adjustments can be made
for slower speeds that customarily produce lower dBAs. The photo of the ENVIRON acoustic
34
SEE APPENDIX 4, Outlining other examples of Dr. Goodman’s practice of selectively using data that supports his position while omitting key data that does not, also known as “cherry picking” data. 35
4/2/12 EAC letter to Salazar http://www.savepointreyeswilderness.org/wp-content/uploads/2012/04/EAC_to_Dr__R__Morgenweck_DOI_With_DETAIL.pdf

test (below left) showed DBOC‟s boat (with 1 occupant and unloaded) travelling at a much
slower speed compared to speeds shown in the NPS photo below right (typically with 2-3
occupants).36
The ENVIRON test, although it collected “actual” site data, is unrepresentative of
typical operations and is inappropriate for use by the NPS.
Dr. Goodman‟s purported “linear regressions”37
use an X-axis biased on his predetermined
outcome ( 60 dBA) instead of a straight-forward X-axis of dBAs, which (by listing “71 dBA”
instead of “+1.1”) would make clearer that tests confirmed the NPS upper range estimate.
Dr. Goodman also ignores the strong tidal currents in Drakes Estero, mostly in the Main
Channel. A tidal adjustment of 3 mph could mean that a boat going 15 mph at full-throttle
with current could be measured as going 18 mph but only against current only 12 mph. Similarly,
Dr. Goodman‟s analysis does not account for different numbers of employees or loads in the
boat, which could result in different speeds and sound impacts. Such confounding data could
explain the seeming lack of correlation between measured dBAs and boats speeds over ~13 mph
as shown in Appendix 1-a.
D. Why Dr. Goodman’s ‘Boat Speed Measurements’ are Defective.
The boat speeds reported by Dr. Goodman are not consistent. Part 4 Slide 62 (above) shows 4
speed calculations but only 4 data points. Because speed is calculated by comparing the distance
between two points to elapsed time, calculation of 4 speeds require 5 data points, not 4.
Moreover, there should be consistency between three of the calculated speeds when checked
against the four available data points. However, calculations using the distances between the
GPS latitude/longitude points and the elapsed times results in speeds of 25.8 mph, 28.2 mph, and
12.7 mph38
(The speed discrepancies are greater than can be accounted for by short (e.g. 5
36
http://www.nps.gov/pore/readingroom/Photos/2008/UEF/03_March/11/PM/ at 3:19:13 37
Goodman Pt. 4 Slides 46 and 59. 38 The Distance between 07:31:16 and 07:31:21 (38 03.059'N 122 56.705'W and 38 03.028'N 122 56.703'W) is
0.0358 miles. The elapsed time is 7:31:21–7:31:16 = 5 Sec x 720 = 3600 Sec = 1 Hr. Therefore, the calculated
speed is: 0.0358 x 720 = 25.776 MPH

seconds) time intervals. Only one of these three calculated times corresponds to the speeds on
Dr. Goodman‟s Slide 62 (above).
Given the limited data, it is not possible to know with certainty whether a) the DBOC-sourced
elapsed time data is wrong, b) whether the DBOC-sourced data is correct but Dr. Goodman‟s
speed calculations are wrong, or c) whether oyster boats do travel at the significantly higher
speeds (and if so, then the Main Channel speeds that do not exceed 18 mph, as reported by Dr.
Goodman, are unrepresentative).
E. Why Dr. Goodman’s ’ Failure to Hear Boat Noise Criticism is Defective.
Dr. Goodman argues that the failure to register motorboat sounds in the bluff-top microphone
recordings demonstrates that the oyster company motorboats emit lower sound levels than
assumed by the DEIS. However, this argument is based on assumed low values for ambient
sound, and omits entirely the attenuation along the sound path to the microphone. Assumptions
underlying each of these bases are not well founded and do not lend support to his argument. To
the contrary, they lend support to the reasonableness of the DEIS in each of the instances
analyzed by Dr. Goodman.
Windy-day conditions raised the ambient sound levels on both the 7/21/09 and 7/22/09
instances39
. Given that windy days create the highest ambient sound levels that would
drown out distant boat noise, it is thus hardly surprising that (contrary to Dr. Goodman‟s
claim), noise from the 7/21 or 7/22/09 boat would not be picked up by the microphone
Dr. Goodman‟s analysis of January 14, 2009 AM does not account for atmospheric
absorption that reduces the 71 dBA at the boat 3850 feet away in the West Channel to
30.95 at the microphone.40
Dr. Goodman admits that “at this hour, the PORE 004 L50 =
39.4” With attenuated boat noise significantly lower than the background sound, it is thus
not surprising that (contrary to Dr. Goodman‟s claim) the microphone did not pick up the
boat noise. Furthermore, Dr. Goodman‟s analysis does not account for transit speeds
ranging from 13 – 18 mph, with uncorrelated dBAs ranging from 55 to 72 (see
Appendices 1 a-b).41
This boat would need to produce over 64.05 dBAs to register on the
microphone even if the ambient sound level (after atmospheric absorption) dropped to the
lowest ever recorded level (24 dBA)42
. Given the unlikelihood of such combinations, it
appears reasonable that the DEIS chose to ignore them.
The Distance between 07:31:21 and 07:31:30 (38 03.089'N 122 56.709'W and 38 03.028'N 122 56.703'W) is 0.0705
miles. The elapsed time is 7:31:30-7:31:21 = 9 Sec x 400 = 3600 Sec = 1 Hr. Therefore, the calculated speed is:
0.0705 x 400 = 28.2 MPH
The Distance between 07:31:30 and 07:31:50 (38 03.089'N 122 56.709'W and 38 03.150'N 122 56.706'W) is 0.0704
miles. The elapsed time is 7:31:50-7:31:30 = 20 Sec x 180 = 3600 Sec = 1 Hr. Therefore, the calculated speed is:
.0704 x 180 = 12.672 MPH
39
Goodman Slides 71, 74 note 7/21/09 and 7/22/09 trips were on a “windy day”. 40
http://resource.npl.co.uk/acoustics/techguides/absorption/ 41
Pt. 4 Slide 59. 42
*(64 dBA at 50’) – (20*log(3850/50)) = 26.27] – [.001976*3850/3.28 = 2.32] = 23.95 dBA at 3850 feet.
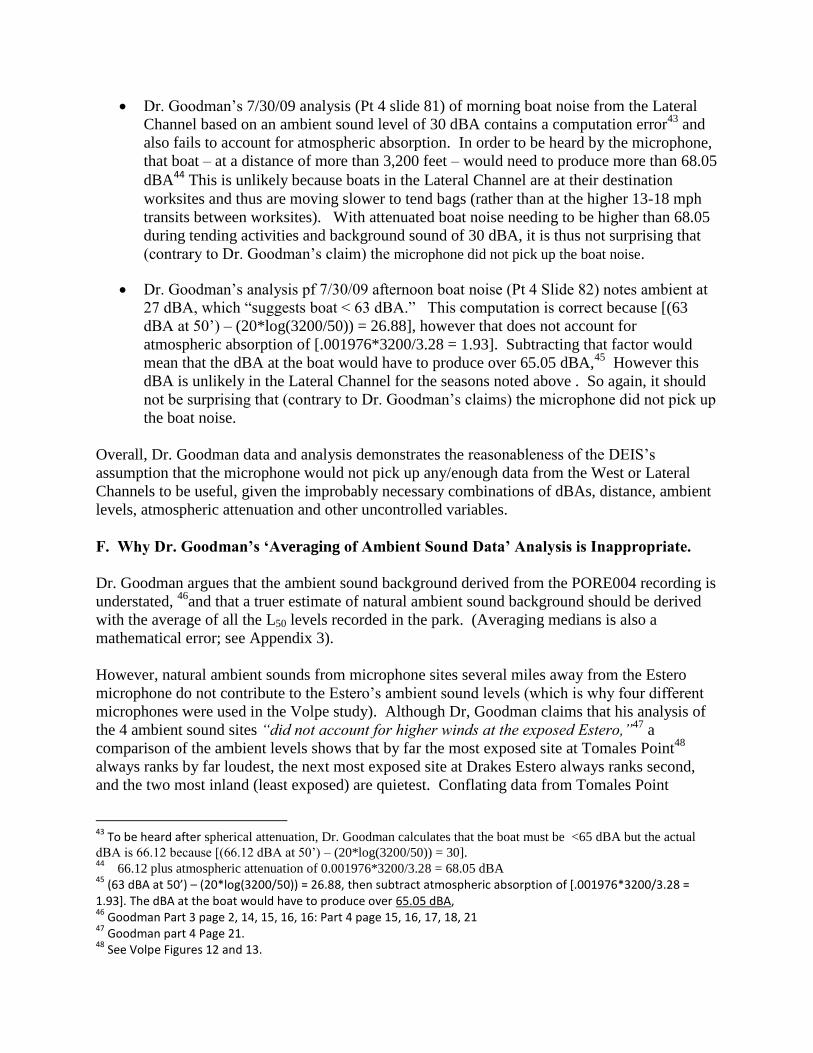
Dr. Goodman‟s 7/30/09 analysis (Pt 4 slide 81) of morning boat noise from the Lateral
Channel based on an ambient sound level of 30 dBA contains a computation error43
and
also fails to account for atmospheric absorption. In order to be heard by the microphone,
that boat – at a distance of more than 3,200 feet – would need to produce more than 68.05
dBA44
This is unlikely because boats in the Lateral Channel are at their destination
worksites and thus are moving slower to tend bags (rather than at the higher 13-18 mph
transits between worksites). With attenuated boat noise needing to be higher than 68.05
during tending activities and background sound of 30 dBA, it is thus not surprising that
(contrary to Dr. Goodman‟s claim) the microphone did not pick up the boat noise.
Dr. Goodman‟s analysis pf 7/30/09 afternoon boat noise (Pt 4 Slide 82) notes ambient at
27 dBA, which “suggests boat < 63 dBA.” This computation is correct because [(63
dBA at 50‟) – (20*log(3200/50)) = 26.88], however that does not account for
atmospheric absorption of [.001976*3200/3.28 = 1.93]. Subtracting that factor would
mean that the dBA at the boat would have to produce over 65.05 dBA,45
However this
dBA is unlikely in the Lateral Channel for the seasons noted above . So again, it should
not be surprising that (contrary to Dr. Goodman‟s claims) the microphone did not pick up
the boat noise.
Overall, Dr. Goodman data and analysis demonstrates the reasonableness of the DEIS‟s
assumption that the microphone would not pick up any/enough data from the West or Lateral
Channels to be useful, given the improbably necessary combinations of dBAs, distance, ambient
levels, atmospheric attenuation and other uncontrolled variables.
F. Why Dr. Goodman’s ‘Averaging of Ambient Sound Data’ Analysis is Inappropriate.
Dr. Goodman argues that the ambient sound background derived from the PORE004 recording is
understated, 46
and that a truer estimate of natural ambient sound background should be derived
with the average of all the L50 levels recorded in the park. (Averaging medians is also a
mathematical error; see Appendix 3).
However, natural ambient sounds from microphone sites several miles away from the Estero
microphone do not contribute to the Estero‟s ambient sound levels (which is why four different
microphones were used in the Volpe study). Although Dr, Goodman claims that his analysis of
the 4 ambient sound sites “did not account for higher winds at the exposed Estero,”47
a
comparison of the ambient levels shows that by far the most exposed site at Tomales Point48
always ranks by far loudest, the next most exposed site at Drakes Estero always ranks second,
and the two most inland (least exposed) are quietest. Conflating data from Tomales Point
43
To be heard after spherical attenuation, Dr. Goodman calculates that the boat must be <65 dBA but the actual
dBA is 66.12 because [(66.12 dBA at 50‟) – (20*log(3200/50)) = 30]. 44
66.12 plus atmospheric attenuation of 0.001976*3200/3.28 = 68.05 dBA 45
(63 dBA at 50’) – (20*log(3200/50)) = 26.88, then subtract atmospheric absorption of [.001976*3200/3.28 = 1.93]. The dBA at the boat would have to produce over 65.05 dBA, 46
Goodman Part 3 page 2, 14, 15, 16, 16: Part 4 page 15, 16, 17, 18, 21 47
Goodman part 4 Page 21. 48
See Volpe Figures 12 and 13.

directly exposed to the prevailing northwest winds blowing unabated from the ocean biases the
ambient sound average upward. Furthermore, conflating day and night acoustic conditions,
and conflating summer and winter introduces additional bias, particularly in regard to impacts on
park visitation, which occurs primarily in the daytime during the summer.
In short, integrating all four microphone sites would add distortion, increase the level of the
natural ambient sound background, and thereby mask the sound effect of DBOC‟s operation. Dr.
Goodman‟s suggestion that NPS average the levels recorded by other microphones must be
rejected.
G. Why Dr. Goodman’s ‘Conversation Recorded in Motoring Boat’ Analysis is Deficient.
The ENVIRON study did not report motorboat noise measurements made while occupants were
conducting conversations. However, Dr. Goodman claims that an audio recording of NPS and
Vanasse Hangen Brustlin, Inc., (VHB), employees with the oyster company owner travelling in
an oyster boat demonstrates that engine noise during this recording must have been significantly
less that the value used in the DEIS.49
The February 16, 2011 recording is not accompanied by documentation of conditions, including
boat speed, wind, and distance from engine and between passengers. It is not possible to
determine whether the motor noise recorded on this trip is representative of regular operations by
oyster employees. Dr. Goodman‟s claims are insufficiently documented and cannot be relied
upon.
H. Why Dr. Goodman’s ‘Harbor Seal Impact” Analyses are Deficient.
Dr. Goodman claims the July 28, 2009 event (Slide 75) shows no seal disturbance. The
spectrogram provided by Dr. Goodman indicates a boat in the Main Channel passed-by at ~8:38
and returned at ~8:56.
However, in NPS photos at
http://www.nps.gov/pore/readingroom/Photos/2009/2009%20OB/7.28/
Images #9880 to #9880-#9892 (8:24 am to 8:36 am) show a sleeping seal
image #9893 (8:37 am): the first flush occurs (seal head visible in water at right edge of
photo)
Image #9894 (8:38 am): boat wake is visible at the same time the boat dBAs are noted in
the Volpe record. 2nd flushed seal is still visible in water at right of photo.
Images # 9895 to #9911 (8:39 am to 8:55 am): Seals re-haul and then sleep unmoving.
Image #9912 (8:56 am): The returning wake is visible at the same time the final spike in
dBA is noted in the Volpe record.
Image #9913 (8:57 am): The second flush occurs with several seal heads visible in water
at right of photo.
Images # 9914-#9919 (8:58 am to 9:03 am): Seals still disturbed in water.
49
Goodman Pt. 3 Slide 40.

Images #9920 - #9930 (904 am to 9:14 am): seal back to sleep
Dr. Goodman notes (Slide 77) that the NPS seal observer noted no disturbance on 7/29/09 and
included a photo from the NPS camera to document that lack of observance. Note that the
7/29/09 seals are roughly in the same location that they were in the above photos from 7/28/09
when Dr. Goodman also noted that the Volpe microphone recorded a boat pass-by. Though he
had access to all photos, Dr. Goodman chose to include the photo of the 7/29/09 boat pass-by
that did not flush the seals, but he chose to not include photos of the 7/28/09 boat pass-by which
evidences a heretofore undisclosed harbor seal disturbance. This selective treatment or cherry-
picking of data is not unusual behavior by Dr. Goodman50
.
To further buttress his unlikely theoretical calculations, Dr. Goodman accuses that “NPS
scientists knew DBOC boats were not that loud [dBA] from direct observation. NPS has video
recordings of DBOC boats and seals. This video was made at 2:05 pm on May 15, 2008 by NPS
scientist Sarah Codde. Video made from a location near PORE 004 microphone and NPS secret
cameras. Video showed a DBOC boat travelling north in west channel. It was a calm day. Audio
portion of video recorded shore birds down on Drakes Estero. Boat engine was not heard on
audio. This contradicted the DEIS.”51
Using a calculation based on ENVIRON‟s biased unrepresentative motorboat test at 59 dBA and
a biased Leq ambient level of 41 dBA, Dr. Goodman calculates the impact circle (shown on
Slide 18) as 59 dBA at 50 feet – [20 * log(400/50)] = 41 dBA at 400 feet. He thus concludes that
the May 15 video could not possibly have picked up the motor boat noise.
However unlike the previous records analyzed, the video (screenshot below) of the event shows
the boat operating at what appears to be a “cruising” speed and thus likely generating dBA in the
“cruising” speed range.
If we assume Dr. Goodman‟s use of 3850 feet (in Slide 31) is right for this boat (in a previous
calculation, we assumed 3200 feet) then our revised calculation using the NPS figure of 71 dBA
shows:
[(71 dBA at 50‟) – (20*log(3850/50)) = 33.27] – [.001976*3850/3.28 = 2.32] = 30.95 dBA at
3850 feet, so the ambient sound would need to be higher than 31 dBA if the boat was not to be
heard by the microphone. But also unlike the previous analyses, a lower than median ambient
50
See Appendix 4 51
Goodman Pt. 4 Slide 10. See Appendix 4.

level appears likely at the time of the May 15 event. The video52 picked up little wind sound,
little movement of vegetation, but did pick up the sound of seals calling ~1,450 feet from the
camera (Dr. Goodman‟s 3,850 feet from camera to boat less his 2,400 feet from seals to boat).
Thus, although no ambient sound measurements were taken on May 15, 2008, it seems very
likely that the ambient sound level on that calm day was below the 31 dBA that would enable the
microphone to pick up the boat and similarly cause nursing seals and their pups to be flushed
into the water by the motor noise. If that day was quiet enough that seal voices can be heard
from 1,450 feet, then it seems substantially more than likely that a motor boat could be heard by
those same seals at a distance of 2,400 feet.
But theoretical calculations aside, it is also clear from that May 15, 2008(a) video that the
microphone did pick up that motorboat noise and that the nursing seals and their pups sleeping
on that sandbar were in fact flushed into the water by the boat noise. A review of that video
reveals two unnatural sounds: the high steady whine of the video camera itself heard throughout
the video and the low rumbling drone of the boat motor (sounding like a passing airplane)
emerging from the background sounds roughly halfway through the video and becoming louder
as the video progresses to its end. A comparison with the May 15 (b) video taken an hour later
makes this motor noise more apparent.
This video combined with contemporaneous NPS photos were described by the Marine Mammal
Commission Report as “convincing evidence of seal disturbance.” Thus as evidence of the
disturbance flushing nursing seals and pups into the water, we have:
1. The photos showing disturbance;
2. The video showing disturbance;
3. The motorboat noise that can be heard on the video; and
4. The testimony of the observer that a seal disturbance occurred.
52
http://www.nps.gov/pore/parkmgmt/loader.cfm?csModule=security/getfile&PageID=39842

Page 1
TECHNICAL APPENDICES
The following appendices address technical issues that surfaced in Dr. Goodman’s critique of the NPS Draft Environmental Impact statement relative to the special use permit for Drakes Bay Oyster Company.
This analysis proceeds in three steps:
1. The argument in appendix 1a and 1b contends that Dr. Goodman’s estimation of the average speed and average sound level of the oyster boat is flawed because it relies strongly on one atypical trip which skews the results toward lower values. It also seeks to perform a more accurate evaluation of these critical measures by separately analyzing strata of the data presented by Dr. Goodman to draw a more realistic picture of boat utilization at DBOC. The result of this analysis, validated by the boat utilization as DBOC describes it in the DEIS, yields much higher noise levels than those presented in Dr. Goodman’s analysis.
2. Appendix 2 further contends that the data collected from the PORE004 microphone used in the VOLPE study was inaccurately translated into boat sound levels because this translation ignored significant acoustic attenuation components such as air absorption, the effect of a barrier (e.g., bluff) and excess attenuation over ground. The addition of these attenuations in the analysis further increases the estimation of the sound level that a boat generates.
3. Appendix 3 rejects the notion that the integration of regional auditory scenes (PORE001-PORE004) could represent the background noise level of a specific locale (e.g. The Estero/PORE004). It also supports the view that percentiles (i.e., Lx’s) are the appropriate metrics to address the analysis of natural auditory scenes composed of many diverse discrete (and potentially loud) events overlaid on a noisy background. Using an averaging technique in this situation, as Dr. Goodman suggests, would slightly inflate the background noise but reject sound events significant enough (e.g. bird calls) to define the character of the auditory scene.
Appendix 4 provides other examples of Dr. Goodman’s practice of selectively using data that supports his position while omitting key data that does not, also known as “cherry picking” data. Appendix 5 provides photographs supporting our claim that GPS points in the half of the Main Channel closest to the bluffs are obstructed. Appendix 6 provides Dr. Dominique Richard’s CV.

Page 2
TECHNICAL APPENDIX #1 a: REVIEW OF DR. GOODMAN’S BOAT NOISE ANALYSIS
To argue that DBOC oyster boats have less of an acoustical impact than that claimed in the NPS Draft Environmental Impact statement (DEIS), Dr. Goodman and ENVIRON used data measured by the PORE004 microphone and GPS records from DBOC boats used in four different trips in the Main Channel of the Estero. PORE004 recorded time-of-day and concurrent sound level in dBA, and the GPS provided a time and concurrent geo-position of the boat. The two data sets were merged using their respective time stamps. From this it was possible to infer the average speed of the boat between recorded geographic points.
With this information Dr. Goodman plotted the graph of Slide 46, which shows the relationship between boat speed on the vertical axis and sound level expressed in Bel on the horizontal axis (i.e., ten decibels referenced to a 60dB sound intensity) for the trip that occurred January 14, 2010. Using linear regression he then noted a strong correlation (AdjR2 = 0.71) between these points, implying that the noise level of a boat can be reliably evaluated from its speed.
To complement his analysis he then added the other three trips, repeated the regression procedure to estimate the average velocity and average noise level over those four trips. From this he concluded the average speed to be approximately 11 mph for a noise level of 60dB (or Zero on the normalized Bel plot), significantly lower that the 71dB NPS uses (Slides 58-59 when sound levels are expressed in Bel ref 60 dB, and Figure 1 below where sound level are simply expressed in decibels).
We repeated this analysis and found several discrepancies and raised several questions. First the average speed estimate seems to be derived from the regression intercept (10.89), which has nothing to do with averages; the actual average speed across all data points is 10.2 mph or approximately 10 mph.
Figure 1: replication of Dr. Goodman’s slide 58 (part 4) with identification of 1/14/10 trip vs. other trips and a change of sound level metric to decibel

Page 3
This point notwithstanding, these procedures and the resulting graph raise several methodological questions:
Does the regression average actually provide the proper average for this analysis?
Why are the majority of the data points recorded after January 14 above the regression line while the points characteristic of the January 14 trip are below?
Why does adding more data points to the analysis reduce the measure of fit (AdjR2) from 0.71 to 0.40, if the relationship between boat speed and noise level is so strong?
Is regression the proper tool to calculate the boat’s average speed?
Using regression to evaluate the average speed of a boat over those four trips does not account for each trip but, instead, conflates every data point to implicitly assume that all data points came from the same experiment (same boat, same day, same operational characteristics). Yet, in the pictures of the trajectory of these trips (slide 26) a distinct difference is noted between the trip of January 14, which is slow and meandering, and the other three trips which are fast and direct. A distinction between a search pattern (as exhibited in oyster bag servicing) and a cruising pattern (as exhibited in transit to, and between tending sites) emerges from the data. In addition, the segregation of points on each side of the regression line suggests that the boat behavior in a search pattern is significantly different from that in a cruising pattern.
To properly evaluate the average speed of a boat during visits to the Main Channel, in this instance, (and throughout the Estero otherwise), it is necessary to differentiate the two types of trips, calculate their respective average speed and average noise level and weigh them appropriately according to their frequency of occurrence. To do this, however, it is not sufficient to distinguish the data points of the January 14 trip from the other three trips because each trip may combine the two types of behavior; for instance, the January 14 trip speed ranges from 2 mph (search pattern) and 18 mph (cruising pattern) even though its average speed is 7.8 mph; nonetheless, excluding the January 14 trip from the data set

Page 4
results in an average speed significantly higher than 7.8 mph and a complete collapse of any correlation between speed and noise level.
Exploiting the distinction between operating regimes
The distinction between cruise speed and search speed explains the discrepancy between the coefficient of determinations of the regression (R2) with the January 14 data alone (0.71) and that with all the data available (0.40) because the difference in average speed between the January 14 trip and the others breaks down the claimed “strong” linear relationship between speed and noise level exhibited with the January 14 trip on slide 46 (part 4).
To truly estimate the average speed of the oyster boats it becomes necessary to segregate the data in terms of operating regimes (i.e., speed). To distinguish these two regimes the data was sorted in descending order of speed to show that, with a few exceptions, all the data point for the three trips beyond the January 14 trip were at high speed and similarly the majority of the data points for the January 14 trip were at low speed, the differentiation between high and low being clearly delimited at 13 mph, which is the boundary between a large cluster of January 14 data points and a large cluster of the other three trips data points (see Table 1).
This speed discrimination helps calculate an average search speed (5.92 mph) and an average cruise speed (15.10 mph) with which we can estimate the average boat speed using a weighted average of each of these two new classes (above 13 mph, and below 13 mph). While we have limited data by which to weight this division, we could estimate the relative frequency of these trips given their purpose, which is to comply with a water sampling protocol mandated by the Department of Public Health: “Rapid testing of samples for PSP and DA is extremely important” (DE-MP-2009 pg 5). These trips are therefore presumed to be weekly and to include a cruising trip to the sampling point, the sampling activity itself, when the boat slows down or stops and a trip back to base at cruising speed. From this it can be assumed that these trips systematically follow a cruising pattern, yet acknowledge the possible rare occurrence (e.g. once a year) of a trip similar to the one observed on January 14, 2010 yielding a 51:1 ratio between cruising and searching modalities.
TABLE 1: SPEED DISCRIMINATION BETWEEN SEARCH MODE AND CRUISING MODE
Cruising Mode Search mode
MPH dB TRIP MPH dB TRIP
18 71.00 01/14/10 12 56.25 01/14/10
18 59.80 OTHER 11 64.50 01/14/10
17 71.25 OTHER 11 64.00 01/14/10
17 70.25 OTHER 11 61.25 01/14/10
17 66.25 01/14/10 10 63.90 01/14/10
17 64.25 01/14/10 10 61.75 01/14/10
17 56.00 OTHER 10 53.75 01/14/10
16 64.00 OTHER 9 63.50 01/14/10
16 56.50 OTHER 7 56.00 OTHER
15 66.75 OTHER 7 55.75 01/14/10
15 60.00 OTHER 6 57.75 01/14/10

Page 5
15 55.00 OTHER 6 53.25 01/14/10
14 68.25 OTHER 5 57.75 01/14/10
14 66.50 OTHER 5 52.75 01/14/10
13 68.25 OTHER 3 54.00 01/14/10
13 66.50 OTHER 3 53.50 OTHER
13 66.00 OTHER 3 48.75 01/14/10
13 61.75 OTHER 3 43.25 01/14/10
13 59.75 OTHER 2 62.00 OTHER
13 58.50 OTHER 2 52.75 01/14/10
13 56.75 OTHER 2 50.00 01/14/10
2 47.75 01/14/10
BOUNDARY 2 47.50 01/14/10
0 53.75 01/14/10
If so then:
As noted earlier, we used this 15 mph average to confirm that the two hours per workday (when the DBOC motor is “on”) is at “cruising” speed traveling to and from the worksites (12 trips per day).
Furthermore, as alluded to before, the relationship between speed and noise level established with the January 14 trip does not hold at higher speed: a regression analysis of the data points beyond 13 mph yields an insignificant correlation (R2 = 0.0274). This situation may be due to the outboard motor characteristics, tidal current or for other unidentified reasons. As a consequence a null model could best characterize the distribution of sound level at speed exceeding 13 mph. On the basis of the central limit theorem this distribution can be safely assumed to be normal (see Figure 2) with a mean of 63.49 dB and a standard deviation of 5.20 dB derived from the set of data points with speed equal to or exceeding 13 mph. This assumption allows for a better determination of sound levels at cruising speed as summarized below.
Table 2
Prob (dB > 60) = 74.89%
Prob (dB > 65) = 38.58%
Prob (dB > 70) = 10.54%
Table 3
Prob (dB < 60 ) = 25.11%
Prob (60 < dB < 65) = 36.30%
Prob (65 < dB < 70) = 28.04%
Prob (dB > 70 ) = 10.54%

Page 6
Where Prob (inequality) stands for the probability that the sound level exceeds a given value (Table 2) or falls between two given values (Table 3)
This analysis confirms that Dr. Goodman’s analysis significantly underestimates boat noise because during the 2 hours per workday of “cruising” time, there is a 74.89% probability that DBOC boat noise exceeds the 60 dBA maximum from the pass-by test by ENVIRON. This analysis also supports the 71 dBA maximum claimed by NPS based on the pass-by test by NOISE UNLIMITED by showing that during these two hours, there is a 10.54% probability that DBOC boat noise exceeds 70 dBA.

Page 7
Figure 2: high speed sound level histogram and cumulative function with associated underlying normal distribution.

Page 8
TECHNICAL APPENDIX #1 b: REVIEW OF DR. GOODMAN’S BOAT NOISE ANALYSIS –ALTERNATE METHOD
There may be data problems confounding the approach presented in appendix 1a. Indeed, this analyses may not simply be a combination of search vs. cruise data, but also of potentially acoustically obscured and un-obscured data. Furthermore, because the “search pattern” appears most often at the base of the bluff in the four trips analyzed by Dr. Goodman, there may be a significant overlap between slow speeds and obscured data.
Instead of using speed discrimination to conduct this analysis, we considered removing the data points with the weakest sound levels found in the recording of the PORE004 microphone used in the VOLPE study, and account for the topography and travel direction of the trips. In effect, this approach seeks to remove signals that may have been attenuated by the bluff and, as a consequence, corrupt the data set. Of the 24 points with microphone sound level less than 35dB, 21 were removed and the other three kept at their low intensity because their signal attenuation was clearly caused by distance (points 077-01 077-02 and 077-03 in the January 15 dataset).
This alternate analysis yields an average sound level of 62.76dB at an average speed of 12.36 mph for the trip of January 14, 2010 and an average sound level of 64.75dB at an average speed of 14.69 mph for the other three trips. With the 51:1 weights (see Appendix 1a) these numbers yields an overall average sound level of 64.25dB at an average speed of 14.11mph. As seen previously, in the range of higher speed, the correlation between speed and sound level remains weak at best (R2 = 0.1336), so a null model is again appropriate to evaluate the sound impact using means (64.25dB) and standard deviation (4.78dB) of the set of sound level measured for unobstructed cruise regimes. The following probabilities result:
Table 4
Prob (dB > 60) = 81.29%
Prob (dB > 65) = 43.80%
Prob (dB > 70) = 11.50%
Table 5
Prob (dB < 60 ) = 18.71%
Prob (60 < dB < 65) = 37.49%
Prob (65 < dB < 70) = 32.31%
Prob (dB > 70 ) = 11.50%
This second analysis again confirms that Dr. Goodman’s analysis significantly underestimates boat noise because during the 2 hours per workday of “cruising” time, there is a 81.29% probability that DBOC boat noise exceeds the 60 dBA maximum from the pass-by test by ENVIRON. This second analysis also supports the 71 dBA maximum claimed by NPS based on the pass-by test by NOISE UNLIMITED by showing that during these two hours, there is a 11.50% probability that DBOC boat noise exceeds 70 dBA.
These probabilities could be used to estimate the overall acoustic impact in terms of intensity and duration as required in the DEIS.

Page 9
SUMMARY OF APPENDICES 1-a AND 1-b Although this Main Channel data does not likely represent the soundscape of the Estero as a whole, it shows that the DBOC boats operate a significant portion of the time at conditions that produce sound louder than 70dB, as the DEIS estimated from its New Jersey data.
These analyses also confirm that the slow-speed test done by ENVIRON is not representative of overall noise impacts in the Estero as demonstrated by the systematic underestimation of the actual sound level recorded by the PORE004 microphone.

Page 10
TECHNICAL APPENDIX #2: REVIEW OF DR. GOODMAN’S UNACKNOWLEDGED UNCERTAINTIES
Notwithstanding the conclusion of appendix 1a and 1b, the measurements of sound level taken from the PORE004 microphone used in the VOLPE study may underestimate the sound level of the boat because of the topology of the terrain. Indeed, the propagation of sound waves from the boat is a spherical wave that impinges upon a number of obstacles (see Figure 3 for an illustration of these various interactions):
1. Upon hitting the water surface, this wave transmits energy in the water by refraction. This underwater wave will remain “trapped” in that medium because of the significant impedance mismatch between air and water and be complemented with the vibrations of the boat hull resonating with the motor vibration as well as with the noise generated by the propeller’s cavitations.
2. This original wave also contributes energy in the air by reflection, thus adding to the direct component of the wave that travels in the air. This airborne spherical wave expands upward and sideways to hit various obstacles, the bluff on the bank of the Estero being the most prominent.
3. Upon hitting the bluff the energy of the wave is partially absorbed in the material of the bluff (Sandstone), and the remainder is reflected in a direction that is the mirror image of the angle of incidence (most dissipating upward, but some likely reflecting back into the Estero, thus amplifying impacts for creatures such as seals . This also creates a “virtual” sound source which appear to come from the below the bluff (similar to the effect that can be observed with the noise barriers build along highways1).
Figure 3: Simplified Pattern of wave propagation in an environment structurally similar to the Estero
4. This complex field of sound waves then propagates without obstacle (barring the existence of non-isotrope pressure fields associated with wind and possibly scattering from rain, fog or other diffused medium)
1 Kotzen, Benz, English Colin (2009) Environmental Noise Barriers, Chapter 3 pp 41-66. London: Spon Press.
Page 11
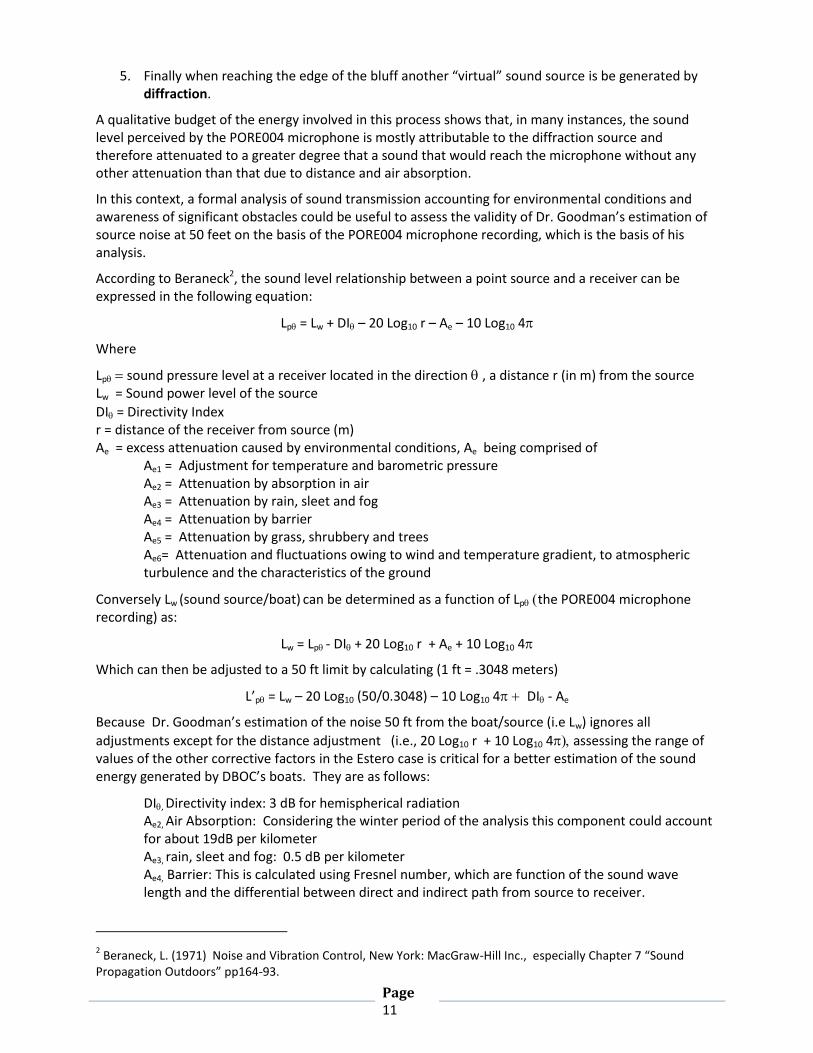
5. Finally when reaching the edge of the bluff another “virtual” sound source is be generated by diffraction.
A qualitative budget of the energy involved in this process shows that, in many instances, the sound level perceived by the PORE004 microphone is mostly attributable to the diffraction source and therefore attenuated to a greater degree that a sound that would reach the microphone without any other attenuation than that due to distance and air absorption.
In this context, a formal analysis of sound transmission accounting for environmental conditions and awareness of significant obstacles could be useful to assess the validity of Dr. Goodman’s estimation of source noise at 50 feet on the basis of the PORE004 microphone recording, which is the basis of his analysis.
According to Beraneck2, the sound level relationship between a point source and a receiver can be expressed in the following equation:
Lp = Lw + DI – 20 Log10 r – Ae – 10 Log10 4
Where
Lp sound pressure level at a receiver located in the direction , a distance r (in m) from the source Lw = Sound power level of the source
DI = Directivity Index r = distance of the receiver from source (m) Ae = excess attenuation caused by environmental conditions, Ae being comprised of
Ae1 = Adjustment for temperature and barometric pressure Ae2 = Attenuation by absorption in air Ae3 = Attenuation by rain, sleet and fog Ae4 = Attenuation by barrier Ae5 = Attenuation by grass, shrubbery and trees Ae6= Attenuation and fluctuations owing to wind and temperature gradient, to atmospheric turbulence and the characteristics of the ground
Conversely Lw (sound source/boat) can be determined as a function of Lpthe PORE004 microphone recording) as:
Lw = Lp- DI + 20 Log10 r + Ae + 10 Log10 4
Which can then be adjusted to a 50 ft limit by calculating (1 ft = .3048 meters)
L’p = Lw – 20 Log10 (50/0.3048) – 10 Log10 4 DI - Ae
Because Dr. Goodman’s estimation of the noise 50 ft from the boat/source (i.e Lw) ignores all
adjustments except for the distance adjustment (i.e., 20 Log10 r + 10 Log10 4 assessing the range of values of the other corrective factors in the Estero case is critical for a better estimation of the sound energy generated by DBOC’s boats. They are as follows:
DI, Directivity index: 3 dB for hemispherical radiation Ae2, Air Absorption: Considering the winter period of the analysis this component could account for about 19dB per kilometerAe3, rain, sleet and fog: 0.5 dB per kilometer Ae4, Barrier: This is calculated using Fresnel number, which are function of the sound wave length and the differential between direct and indirect path from source to receiver.
2 Beraneck, L. (1971) Noise and Vibration Control, New York: MacGraw-Hill Inc., especially Chapter 7 “Sound
Propagation Outdoors” pp164-93.

Page 12
Ae5, grass, shrubbery and trees: can be approximated with the empirical equation:
r
Where f is the frequency of the sound (Hz) and r is the path length through shrubbery or over grass (m)3 Ae6 Atmospheric inhomogeneities: conservatively this component may account for as little as 8dB per kilometer over fields covered with sparse shrubbery and 3 dB per kilometer over water.
With this assessment we can, for instance, evaluate the sound power of the third data point from the January 29 trip (156-03), using altitude information derived from an approximate onsite survey (Bluff height = 35ft, elevation of microphone with respect to the top of the bluff = 20ft, 2D distance between top of the bluff and microphone = 250ft, 2D distance between boat and microphone = 483ft). These assumptions yield the following attenuation components4:
DI = 3dB 20 Log10 148.17 = 43.42 dB Ae1 = Adjustment for temperature and barometric pressure = 0 dB Ae2 = Attenuation by absorption in air = 2.82 dB Ae3 = Attenuation by rain, sleet, and fog = 0.07 dB Ae4 = Attenuation by barrier = 8.38 dB Ae5 = Attenuation by grass, shrubbery and trees = 6.42 dB Ae6= Attenuation and fluctuations owing to wind and temperature gradient, to atmospheric turbulence and the characteristics of the ground = 1.14 dB
With these attenuation estimates, the 40 dB microphone reading for the data point 156-03 translates to 110.25 dB at the source or 77.96 dB @50 feet, a significant increase from the 66 or 68 dB that Dr. Goodman estimated and a value which more than supports the 71 dB assumption taken in the DEIS. In a systematic analysis using this data, the distribution of sound level (see Appendix 1a and 1b, tables 2-5) would shift upwards and the probability of exceeding 70 dB at 50 ft would also significantly increase. However, this analysis also points out the multiple unacknowledged uncertainties in much of Dr. Goodman’s data.
In conclusion, NPS was right to ignore the data from the VOLPE study since, as a system using a multidirectional microphone directed upwards, it was designed for broad field measurements which would include sounds from the non-obstructed part of the Estero on the west as well as sounds from the Point Reyes peninsula east of the Estero (e.g. Estero de Limantour), sound emanating south from the ocean, and north from the ridge. It also integrated noise from aircraft as well as bird sounds flying over the peninsula. In a word, the VOLPE study was designed to establish an ambient sound baseline but was not designed to focus on DBOC activity and, as the above analysis shows, it is difficult to use it for that purpose. Thus, as NPS determined, it is not appropriate to rely on it for the DEIS analysis of DBOC noise.
3 in cases of frequency-specific attenuation we use a geometric average of the attenuation calculated for the
center frequency of one third octave bands from 50 Hz to 10,000 Hz.
4 This analysis assumes that boats generate sounds with a white noise spectrum. In reality, because boats noise
typically have a signature (i.e. a spectrum with a subset of discrete frequencies that account for a large fraction of the sound energy), the estimation of Ae4 and Ae5 by be marginally adjusted up or down depending of the signature characteristics. Finally, although the microphones used in the VOLPE experiment were characterized as omni-directional, variation in their directional characteristics may also minimally affect the estimation of the overall
attenuation.

Page 13
TECHNICAL APPENDIX 3: REVIEW OF DR. GOODMAN’S AMBIENT SOUND BASELINE
The output of the 2009-2010 VOLPE study includes the continuous recording of four microphones (PORE001 to PORE004) placed in four different locations in the Point Reyes National Seashore. These recordings were identified by location, time of day (i.e., day vs. night) and season - over winter (January February 2009) and summer (July August 2010). In that study an L50 defined as the median of all recorded sound levels derived from the histograms of the sound level occurrences for each locale, particular season and specific time of day was used to characterize the natural ambient sound background.
To argue that the natural ambient sound background derived from the PORE004 recording is underestimated, Dr. Goodman exploited the VOLPE information to argue that a truer estimate of natural ambient sound background should be derived with the average of all the L50’s recorded in the park.
This approach is suspect for two reasons.
1. From a strictly mathematical standpoint, averaging median values across several distributions does not necessarily yield the median of the combined distribution. Unless the component distributions are reasonably symmetrical (i.e., low skewness) and have center of mass (i.e., mean) almost equal, the median of the combined distribution would be significantly different from the average of the individual medians. In the VOLPE study one such case is encountered with the summer distributions for the Site PORE001. Indeed, Figure 31 in the VOLPE report shows the day and night distributions are clearly disjointed and, as a consequence, the median of the combined distribution will be significantly smaller than the average of the median for day and the median for night.
2. Aggregating the data adds confusion and produces an artificial, non-representative and louder natural ambient sound background.
Indeed the VOLPE study was designed to assess possible impact of future Air Tours, not the impact of DBOC. As a result the four sites (including the Estero site PORE004) were distributed in various locations in the park. In contrast, the current DEIS only asks to assess the noise level in the Estero, which is certainly not affected by PORE001 (visitor center) which is several miles away from the Estero on the other side of the ridge nor by PORE002 (woodland on the ridge) which is very unlikely to contribute to the Estro’s soundscape because of the significant attenuation observed in wooded areas or PORE003 (Pierce Point) which is separated by miles of hills and pastures from the Estero.
Furthermore, conflating day and night is a distortion in all cases and most particularly for the summer of site PORE001, and conflating summer and winter is also a distortion as can be seen for site PORE002. In any case day and night activity should be analyzed separately especially in trying to assess the impact of a business which only operates in daylight.
In short, integrating all four microphone sites artificially inflates the level of the natural ambient sound background, and thereby masks the sound impact of DBOC’s operation.
Dr Goodman also suggested substituting the LAeq metric for the L50 metric (i.e, substituting the mean for the median). This is problematic in the case of the VOLPE study where a few strong events (e.g. airplane noise) overwhelmed the background soundscape. The problem with this approach is that the mean (LAeq) smoothes out data, essentially removing large and quick changes that are indicative of quick transitions between disparate states; in contrast the median is able to identify strong discontinuities (i.e. jumps) in data which is what was the focus of the VOLPE study. There are many other metrics that can achieve the same goal: skewness (the third moment of a distribution, a measure of symmetry) and kurtosis (fourth moment of a distribution, a measure of “pointedness”) or more simply the ratio of maximum to mean comes to mind, but averaging is not one of them.

Page 14
APPENDIX 4: DR. GOODMAN’S RECENT HISTORY OF CHERRY-PICKING DATA
Dr. Goodman has repeatedly cherry-picked data5 in making public presentations in support of his attacks on the NPS and its scientists. In his 8 29/11 letter to the Marine Mammal Commission (MMC), Dr. Goodman accused NPS scientists of using a map that was “inaccurate and misleading” because there was “no record” of seals and oyster beds overlapping at the west end of the Lateral Channel.6
To support his claim, Dr. Goodman chose to use a specific California Department of Fish and Game (CDFG) map from the MMC website. This CDFG map provided general harbor seal haul-out locations, but no specific count or location data. Dr. Goodman misleadingly and incorrectly referred to this CDFG map as the “Harbor seal haul-out areas map used by Tom Moore (CDFG) on May 20, 1991.”7
However, Dr. Goodman chose not to select the other CDFG map on the MMC website, which showed the specific counts and locations of harbor seals based on Moore’s actual May 20 survey. This ignored map squarely contradicted Dr. Goodman’s erroneous assertion that there was no record of seals overlapping areas with oyster bags in the west end of the lateral channel. As the MMC stated in their report, it was “difficult to determine” seal locations from the map Dr. Goodman used because no specific seal count or location data existed on that map, whereas the map Dr. Goodman chose not to use was “notable” for its accuracy.”8
As another example of Dr. Goodman’s cherry-picking of data, DBOC’s Permit from the NPS closes the Lateral Channel to motorboats during the harbor seal breeding season March 1-June 30.9 In a 3/1/12 Op-Ed,10 Dr. Goodman chose a misleading aerial photo to claim that DBOC boats do not violate this seal protection area, even though a second aerial photo he had access to contradicted his claim.
Dr. Goodman had earlier used both photos in his 8/29/11 letter to the MMC to criticize the NPS.11 Yet the photo Dr. Goodman selected for his Op-Ed did not show the full Lateral Channel (a fact he did not disclose to the public). He nevertheless used the photo to incorrectly assert that the position of the DBOC boat was at the end of the Lateral Channel and was allowed by DBOC’s permit. Had Dr. Goodman used the other photograph from his August 29th letter, which shows the full Lateral Channel and thus allows the viewer to see the boat’s position deep within that off-limits channel during the seasonal closure, his defense of DBOC would have collapsed. Also, Dr. Goodman’s Op-Ed came nearly 6 months after the California Coastal Commission had independently reviewed the photos, and stated, “A photograph of Drakes Estero recently displayed by Corey Goodman, dated April, 26, 2011 … demonstrates the presence of a motorized vessel apparently in support of aquaculture activities within the Lateral Channel….”12
A third example of Dr. Goodman’s cherry-picking of data is his attempt to attack NPS’s data regarding harbor seals and disturbances.13 Initially, he argued that NPS’s analyses could not be credited because
5 8/11/21/11 MMC Report, at page 49: “‘Cherry-picking’ refers to the selective treatment of specific data, usually
because of the influence of individual data points on the outcome of a particular analysis.” 6 8/29/11 corr. from Dr. Goodman to MMC: “Analysis of Becker 2011,” at page 16: “Becker’s Figure 1 gave false
impression that oyster bags are within seal haul-outs – map is inaccurate and misleading.” 7 Ibid. at page 19.
8 11/21/11 MMC Report, at page 44.
9 DBOC NPS Special Use Permit, Exhibit C.
10 C. Goodman, West Marin Citizen, 3/1/12 Guest Column, “A picture is worth a thousand words.”
11 8/29/11 corr. from Dr. Goodman to MMC: “Analysis of Becker 2011,” at Part 2 page 12 (partial view of channel)
& page 33 (full view of channel). 12
9/29/11 corr. from California Coastal Commission to Drakes Bay Oyster Company. 13
8/29/11 corr. from Dr. Goodman to MMC: “Analysis of Becker 2011.”

Page 15
NPS needed to locate and incorporate data from the 1970’s and 1980’s.14 When NPS did just that15 and the additional data served to reinforce the NPS conclusions with which Dr. Goodman disagreed, Dr. Goodman then reversed course and asked the MMC to exclude from the scientific analysis some of the very same data he had previously insisted should be included, specifically data from 1982 and 1983, as well as other data from 2003 and 2004.16 However, the Commission responded (emphasis ours): “Selective treatment can involve the addition or removal of data if the reason for either course is simply to influence the outcome of an analysis. Any data point used in an analysis should be determined in advance based on its inherent properties rather than its potential influence.”17 Dr. Goodman’s ex post facto request to eliminate selected data was an apparent attempt to influence the statistically significant correlation between increased oyster harvests and decreased harbor seal counts established in the peer-reviewed NPS study. Thus, the Marine Mammal Commission rejected Dr. Goodman’s request: “The Commission does not agree that data from 1982 and 1983 necessarily should be excluded… [and] the Commission believes [it] is more appropriate…to retain [2003 and 2004].”18
14
<http://mmc.gov/drakes_estero/pdfs/ltr_becke_mms_92208.pdf>.
15 11/21/11 MMC Report, at page 49.
16 Ibid. at page 50.
17 Ibid.
18 Ibid.

APPENDIX 5: PHOTOGRAPHS (courtesy of Tom Baty)
Photo #1 from pg. 67 of the Volpe NPS ambient sound study1 is from the microphone site identified as 38.04913° 122.93488° looking west, or roughly perpendicular to the bluff edge. The microphone is set ~135 feet back from the bluff edge. The Main Channel runs right to left along the bottom of the picture (and bluff face)
Photo #2 is the from the same microphone site 38.04913° 122.93488°,
but at low tide looking west, or roughly perpendicular to the bluff edge. This view is the same as the Volpe photo above, but low tide makes visible the far (western) edge of the Main Channel (but not that channel’s close edge, which is obstructed by the bluff edge).
Photo #3 also faces west but from the edge of the bluff…see beach in lower left). Comparing Photo #2 to #3, it is clear that roughly, only the outer (western) third of the Main Channel is un-obstructed from the microphone site. This supports the “ruler line analysis” that similarly showed sites in only the outer third of Main Channel are un-obstructed.
1 http://www.nps.gov/pore/parkmgmt/upload/planning_atmp_background_report_faa_baseline_ambient_sound_levels_1103.pdf

DOMINIQUE M. RICHARD, PH.D. PO Box 863 Tel: 415-669-7500
215 Via de la Vista Cell: 415-250-5618
Inverness, CA 94937 Email:[email protected]
QUALIFICATIONS
Academic Qualifications: Doctorate from the University of Pennsylvania with emphasis on
Decision Support System design, signal processing, pattern recognition, statistics and data
management as well as significant experience with teaching and research. Author of articles
in peer-reviewed journals and active participant in various international conferences.
Business Expertise: Consultant to Fortune 300 companies applying systemic, statistics and
management science techniques to improve strategic and operational business
management. Proven record with the execution of several million-dollar projects with ROI
obtained within a year of completion.
International Experience: Consultant to several subsidiaries of Saint-Gobain (France) a glass
and building materials manufacturer and to Norton Corporation (USA), which governs an
integrated worldwide business in abrasives and ceramics. Fluent in French and English.
Proficient in Japanese, Mandarin Chinese and German.
EDUCATION
Ph.D. Systems Engineering - University of Pennsylvania, Philadelphia, PA 1989
M .S. Engineering Acoustics - The Pennsylvania State University, University Park, PA 1975
Diplôme d'ingénieur (MSMech-EE) - ESME Sudria, Paris VI FRANCE 1972
P.C I. (Physics & Chemistry): Université de Rouen, FRANCE 1969
Mathematiques Speciales, Lycée Corneille, Rouen, FRANCE 1969
Mathematiques Superieures, Lycée Corneille, Rouen, FRANCE 1968
Baccalauréat Philosophie 1968
Baccalauréat Mathematiques Elementaires 1967
PATENT
Inventor of the patent entitled “Method for forecasting and generating optimal delivery schedules for
vehicles involved in delivering propane and other consumables to end customers”. Patent 7676404.
RELEVANT SKILLS
Expert in statistics, mathematical programming and simulations software (SAS, GPSS, CPLEX)
Expert in Microsoft suite (EXCEL, ACCESS, WORD, PROJECT, OUTLOOK, POWERPOINT)
Proficient in several programming languages (SAS, VB, C, FORTRAN, MATLAB)
Proficient in several operating systems (WINDOWS XP, UNIX, MAC)
Proficient in several databases (ORACLE, AS/400, ADABASE)
Proficient in GIS technology
Proficient in non-numerical analysis software
Fluent in French and English
Reading ability in German
Intermediate abilities in Japanese and Mandarin Chinese
ACADEMIC EXPERIENCE
Visiting Scholar - University of California, Berkeley; Berkeley, CA 1999-2001
Adjunct Professor (EE, IE, COMPSC) - PSU, Great Valley; Malvern, PA 1985-1996
Lecturer (SYSTEM) - The University of Pennsylvania. Philadelphia, PA 1990

DOMINIQUE M. RICHARD, PH.D. Page 2
PROFESSIONAL EXPERIENCE
MANAGEMENT SCIENCE CONSULTANT Self-Employed 1991 – Present
Consulted with a variety of industries using systemics and management science techniques to
scope strategic and operational conditions and provide optimal solutions for their management.
Managed implementation of the resulting computer systems.
Accomplishments
Conducted a plant operational audit yielding recommendations for changes in
operation, which resulted in an immediate 10% productivity improvement.
Designed and implemented a forecasting system for the 1.5 million customers of a
national commodity distributor and implemented a customer delivery selection function
trading off the frequency of delivery with the risk associated with service interruption.
This system yielded a yearly $20 million improvement in distribution costs.
Prototyped a routing system designed to group deliveries of consumables into optimal
geographical clusters to minimize distance traveled and reduce frequency of delivery.
This system is expected to bring in a 12% reduction in distribution costs including
energy savings.
MANAGEMENT SCIENCE SPECIALIST
Manager, CertainTeed Corp. Blue Bell, PA 1985–1991
Analyst, CertainTeed Corp. Blue Bell, PA 1978–1985
Led a multifunctional team to develop application software using mathematical techniques, to
support manufacturing information system design and implementation, and to assess new
information technology. Designed, presented and discussed management reports to support
strategic decisions.
Accomplishments
Evaluated options in plant locations as well as acquisition with a capacity and
distribution model designed to minimize the total cost of operation. The outcome of
this process resulted in an acquisition that increased total revenue by more than 35%.
Assessed company-wide warehouse capacity and recommended targeted expansion to
improve logistics. This generated a $12 million savings in logistics cost in the year
following a $2 million capital investment in “brick and mortar”.
Headed the 6-month effort of a task force chartered to assess the status of a bonded
abrasive (grinding wheels) operation to recommend steps to modernize worldwide
production, marketing and distribution of these products. The results of this effort were
used to devise a strategic vision for the future of the bonded abrasive division and, in
collaboration with MIT, to identify a set of key organizational and technical
recommendations for the successful implementation of this vision.
Analyzed the trade-off between equipment purchase and lease by estimating the effect
of these strategies on productivity to determine an optimal procurement time. This
saved hundreds of thousands of dollars through postponed computer equipment
procurement.
PRIOR EXPERIENCE
Research engineer in fracture mechanics – Ceramic Finishing Company, State College, PA
1977 - 1978
Consultant in acoustics – American Hospital Supply Saint-Ouen L'Aumone FRANCE
1976 - 1977
DOMINIQUE M. RICHARD, PH.D. Page 3
VOLUNTEER WORK
Chair of a working group of the Sanctuary Advisory Council of the Gulf of Farallones National
Marine Sanctuary dealing with the development of a vessel management plan and of
mooring regulations for Tomales Bay, CA 2007 - 2009
Primary Chair-at-large for Marin and Sonoma Coast on the Sanctuary Advisory Council of the
Gulf of Farallones National Marine Sanctuary 2006 – Present
“Citizen scientist” for the Beach Watch program of the Gulf of Farallones National Marine
sanctuary. 2003 – Present
Hazmat trained participant, as a beach surveyor, in the oil clean up effort following the Cosco
Busan Oil Spill in San Francisco Bay. 2007
Environmental Forum of Marin training – Commitment to advocate for environmental issues
in local politics and professional practice. 2003-2004
PUBLICATIONS
D. Richard. “Samarkand to Chang’an to … Now " Organised Sound Vol 13 No. 2 (August 2008): 97-
102.
D. Richard. "L’Important c’est les Lunettes" Cultural Studies Vol 17 No. 3/4 (2003): 349-366.
(May/July 2003)
D. Richard. "Holtzwege on Mont Fuji: a Doctrine of No-Aesthetics for computer and Electro-Acoustic
Music." Organised Sound Vol 5 No. 3 (December 2000): 127-133.
D. Richard. "Music as Handwerk, the middle way between Vorhandenheit and Zuhandenheit." ICMC
Berlin 2000 proceeding, : 5-7, August 27 -September 1 2000, Berlin, Germany.
D. Richard. "The Beast's Glove: The tactile and the Digital in Computer Music." ICMC Thessaloniki
1997 proceeding, : 149-51, September 25-30 1997, Thessaloniki, Greece.
D. Richard. "Voices in the Desert: The Ontology of the Electroacoustic Community." Organised Sound
Vol 2 No. 1: 5-11, 1997.
D. Richard. "Code-Note-Music: An Epistemological Investigation of Algorithmic Music." Organised
Sound Vol 1 No. 3: 173-77, 1996.
D. Richard. "The Happy Few: Rarity and the Recognition of Style." Proceeding of the fourth
International conference for music perception and cognition (ICMPC): 175-76: 395-400,
August 11, 1996, McGill University, Montreal Canada.
D. Richard. "Computer music and the Pre(Anti(Post(Non(Modern))))." ICMC Banff 1995 proceeding :
569-572, September 3-7 1995, Banff, Alberta, Canada.
D. Richard. "Name that Tune: the Turing Test Revisited." Proceeding of the third International
conference for music perception and cognition (ICMPC): 175-176. July 23-27, 1994,
Université de Liège, Liège, Belgium.
D. Richard. "Computer Music and the Post-Modern: A Case of Schizophrenia." Computer Music
Journal, 18:4 26-34.
D. Richard. "Short Circuit: The Computer Music Edison Complex." ICMC San Jose 1992 proceeding,
October 14-18 1992, San Jose, California, USA.
D. Richard. "Why Simulate When you Can Get the Real Thing?" ICMC Montreal 1991 proceeding,
October 16-20 1991, Montreal, Canada.
D. Richard. "Gödel Tune: Formal Models in Music Recognition Systems." ICMC Glasgow 1990
proceeding, September 10-15 1990, Glasgow, Scotland.
D. Richard. "Automatic Pitch Resolution in Polyphonic Music Recordings." 1989 IEEE ASSP Workshop
on applications of signal processing to audio and acoustics, October 15-18, Mohonk
Mountain House; New Platz, New York.
D. Richard. "A Connectionist Model for Automatic Polyphonic Music Recognition using a Cultural Code."
Ph.D. Dissertation, University of Pennsylvania, Philadelphia, 1989.

DOMINIQUE M. RICHARD, PH.D. Page 4
D. Richard. "Pitch Determination in a Musical Context." Proc. 13th. Annual Northeast Bioengineering
Conference, K.R. Foster, ed., Institute of Electrical and Electronics Engineers, Inc. (1987) 252-
54.
H.P. Kirshner & D. Richard. "Fracture Stress-Reflecting Spots Relations in Hot-Pressed Alumina."
Journal of Material Science 15(1980) 1319-1321.
D. Richard & H.P. Kirshner. "Theory of Elastic-Plastic Impact on Ceramics." Proc. 5th Int. Conf. on
Erosion by Solid and Liquid Impact. Cambridge, England (Sept. 3-6 1979).
H.P. Kirshner and R.M. Gruver & D. Richard. "Localized Impact Damage in Transformation-Toughened
Zirconia." Material Sciences and Engineering, 40(1979) 49-57.
H.P. Kirshner and R.M. Gruver & D. Richard. "A Fractographic Criterion for Subcritical Crack Growth
Boundaries at Internal Fracture Origins in Hot Pressed Silicon Nitride." Journal of Material
Science 14(1979) 2713-2720.
H.P. Kirshner and R.M. Gruver & D. Richard. "Fragmentation and Damage Penetration During Abrasive
Machining of Ceramics." In The Science of Ceramic Machining and Surface Finishing II, B.J.
Hockey and R.W. Rice, ed., National Bureau of Standards Special Publication 562.
D. Richard. "A Theoretical Inquiry Concerning Artistic Research and an Experimental Study of the
Perception of Artistic Media." Master's Thesis, the Pennsylvania State University, State
College, 1975.
PRESENTATIONS
International:
"Technology & Aesthetics." Invited speaker at the International Computer Music conference
held in Berlin, Germany, August - September 2000.
"Understanding Foucault’s Space of Freedom in Musical Creation." Paper presented at the
International Computer Music conference held in Berlin, Germany, August - September 2000.
"Music and Responsibility." Paper presented at the International Computer Music conference
held in Thessaloniki, Greece, September 1997.
"What is a Contemporary?: Crossreading Boulez's 2nd Piano Sonata and Beethoven's
HammerKlavier Op 106." Paper presented at the Fourth International Conference on Music
Perception and Cognition held at McGill University, Montreal, Quebec, Canada, August 1996.
"Assessing Computer Music with Latour's 'Hypermicrosociology' of Technology." Paper
presented at the International Computer Music conference held at the Banff Center, Alberta,
Canada, September 1995.
"Music: a Challenge to Models of Cognition." Paper presented at the Third International
Conference for Music perception and cognition held at l’Université de Liège, Belgium. July 23-
27, 1994.
"Breaking the Sound Barrier." Paper presented at the First International Conference of Acoustic
Ecology held at the Banff Center for the Arts. August 1993.
"Computer Music and the (Post)modern." Paper presented at the International Computer Music
Conference held at the San Jose State University, San Jose, October 1992
"Music/Technology: Reflection on/of(f) Knowledge." Paper presented at the Second
International Conference on Music Perception and Cognition held at UCLA, Los Angeles,
February 1992
"Recent Advance in Machine Cognition and its Impact on Computer Music." Paper presented at
the International Computer Music Conference held at McGill University, Montréal, October
1991
"How many Constellations are there in the sky?: an Inquiry Concerning Musical Research."
Paper presented at Resonant Intervals, an interdisciplinary conference held at the University
of Calgary, Calgary, Alberta, Canada. May 1991.
"Formal System and Music Recognition: can Computers Understand Music." Paper presented
at the International Computer Music Conference held in Glasgow, Scotland, September 1990.

DOMINIQUE M. RICHARD, PH.D. Page 5
"Analytical Modeling of the Elastic Plastic Transition in Ceramics." Paper presented at the 5th
international conference on erosion by Solid and Liquid impacts held in Cambridge, England,
September 1979.

DOMINIQUE M. RICHARD, PH.D. Page 6
National:
" Wilderness: Voicing a frame of exclusion, initiating new dialogues” Paper presented at the
NCA conference held in New Orleans, November 2011..
"The Possible/Real & the Virtual/Actual in Computer Music." Paper presented at the Annual
Conference on Music Perception and Cognition held at the MIT Media Lab, July 1997.
"Flipping the Coin: the Cultural Side of Latour's Symmetrical Anthropology." Paper presented
at the annual ICA conference held in Chicago, May 1996.
"Chaotic Variations in M on a Theme by Deleuze." Paper presented at the Annual Conference
on Music Perception and Cognition held at the University of California, Berkeley, June 1995.
" Dirichlet's Conditions of Performance: Principle of Music Decomposition." Paper presented
at the Annual Conference on Music Perception and Cognition held at the University of
Pennsylvania, Philadelphia, June 1993.
"Multidrop Shipments: a Solution Using Clustering Technique and a Posteriori Optimization of
Marginal Costs." Paper presented at the National Joint ORSA/TIMS conference held in
Chicago, May 1993.
"Use of Jelineck's Statistical Acoustic Processor in Music Recognition." Paper presented at
the 1989 IEEE workshop on applications of signal processing to audio and acoustics held at
Mohonk Mountain House; New Platz, New York. October 1989.
"The Use of SAS, OMNI and MPSX in Scheduling Fiberglass Insulation: A Combinatorial + 2
MIP Formulation of the Cutting Stock Problem." Magen User Group XXII held in San Diego, CA.
August 1988.
"Design Requirements in a Music Editor." Paper presented at the 13th annual Northeast
Bioengineering conference held at the University of Pennsylvania, April 1987.
Graduate Seminar:
"Survey of Speech Recognition System Methodologies." Graduate seminar presented to the
school of engineering at the University of Pennsylvania. April 1985.
"The Compositional Principles of Xenakis' Stochastic Music." Graduate seminar presented to
advanced composition students at the Pennsylvania State University, May 1975.