Embed Size (px)
Citation preview

RESEARCH ARTICLE10.1002/2015JC011000
Dynamics of wind-driven upwelling off the northeastern coastof Hainan IslandPeigen Lin1, Peng Cheng1, Jianping Gan2, and Jianyu Hu1
1State Key Laboratory of Marine Environmental Science, College of Ocean and Earth Sciences, Xiamen University, Xiamen,Fujian, China, 2Division of Environment and Department of Mathematics, Hong Kong University of Science andTechnology, Hong Kong, China
Abstract Both observational and reanalysis sea surface temperature data reveal that upwelling occursfrequently off the northeastern coast of Hainan Island (downstream of the change in topography off Ton-gluo Cape), which cannot be attributed to the along-shelf wind alone. To identify dynamics of the upwell-ing, we conduct a numerical experiment using an idealized topography that is simplified from the actualtopography off the eastern and northeastern coasts of Hainan Island. The result indicates that the upwellingdownstream of the change in topography is associated with onshore cross-isobath transport. Analysis ofthe vertically integrated momentum balance shows that the upwelling-linked onshore transport is primarilyintensified by the along-isobath barotropic pressure gradient force (PGT), but is weakened by the along-isobath baroclinic pressure gradient force (PGC). The along-isobath PGT is linked to the advection of relativevorticity, the bottom stress curl and the gradient of momentum flux in vorticity equation. On the otherhand, the PGC-related process is diagnosed by potential vorticity (PV) balance. Similar to the negative PVterm from wind stress, the negative PV terms of the joint effect of baroclinicity and relief and the baroclinicbottom pressure torque weaken the upwelling-linked onshore transport downstream of the change intopography. The onshore transport is enhanced by the positive PV from bottom stress. In addition, thecross-isobath forces play an important role in upwelling intensification in the shallow nearshore region.
1. Introduction
Upwelling prevails in the northern South China Sea (SCS) during summer [Guan and Chen, 1964; Wu and Li,2003]. The upwelling off the northeastern coast of Hainan Island (or the Hainan northeastern upwelling;HNEU) is normally centered north of the Tongluo Cape (the schematic extent noted by red circle in Figure 1).The HNEU has been discussed generally in the Qiongdong upwelling system [see Xie et al., 2012 for areview], which is one of the most important topics of oceanographic studies in the SCS. Wind-driven Ekmantransport along the east coast of Hainan Island is believed to drive the upwelling system [Han et al., 1990],with mean delay time of 2.2 days [Jing et al., 2015]. Ekman pumping induced by the wind stress curl also con-tributes to the generation of the upwelling [Jing et al., 2009]. Using a high-resolution three-dimensionalhydrodynamic model, Su and Pohlmann [2009] indicated that along-shelf topographic variation affects thelocation of the upwelling center and noted that the vertical mixing due to the internal wave is important forthe upwelling. In addition, fresh water from rivers tends to inhibit the upwelling outcropping to surface inthe nearshore area [Gan et al., 2009b; Su et al., 2011].
A few studies have analyzed the HNEU specifically. Yu [1987] pointed out that the HNEU might be an eddy-driven upwelling that is intensified by southwesterly wind in the summer. Li [1990] speculated that thenortheastward current, affected by the bottom topography and the changing coastline, causes a vertical cir-culation and induces the HNEU. This was later confirmed by Li et al. [2012] using the Princeton OceanModel. They showed that the enhanced large-scale circulation flows along the east coast of Hainan Islandand turns toward the northeast shelf, subsequently, intensifying the HNEU; and the bottom topography isimportant in this process. In addition to wind, eddies and currents, tides are also important drivers in theHNEU area [Song et al., 2012].
Previous studies have revealed the existence of the HNEU and have described its basic characteristics,but the dynamics of the HNEU, particularly the roles of topography and baroclinic effects, remain
Key Points:� An upwelling off the northeastern
coast of Hainan Island (HNEU) wasobserved in summer 2009� The HNEU is mainly intensified by
along-isobath barotropic pressuregradient force� Baroclinic processes make negative
contributions to the HNEU
Correspondence to:J. Hu,[email protected]
Citation:Lin, P., P. Cheng, J. Gan, and J. Hu(2016), Dynamics of wind-drivenupwelling off the northeastern coast ofHainan Island, J. Geophys. Res. Oceans,121, doi:10.1002/2015JC011000.
Received 23 MAY 2015
Accepted 13 JAN 2016
Accepted article online 19 JAN 2016
VC 2016. American Geophysical Union.
All Rights Reserved.
LIN ET AL. UPWELLING DYNAMICS OFF HAINAN ISLAND 1
Journal of Geophysical Research: Oceans
PUBLICATIONS

unclear. The shelf off the easterncoast of Hainan Island is steep andwidens substantially to the north-east from the shelf off TongluoCape (Figure 1). Accordingly, thesouthwest-northeast coastline andisobaths turn their orientation tosouth-north. This special topogra-phy plays an important role in thegeneration of coastal upwelling.Under upwelling-favorable windforcing, coastal upwelling is intensi-fied to a greater extent over a nar-row shelf with a steep slope thanover a wide shelf with a gentleslope [Gan et al., 2009a; Gu et al.,2012; Chen et al., 2013]. Thealongshore-varying topography con-trols the location and intensity ofcoastal upwelling [Song et al., 2001;Gan and Allen, 2002]. Particularly,coastal upwelling intensifies at the
downstream of a cape [Barth et al., 2000] and a canyon [Allen, 1996]. Pringle [2002] analyzed the linearbarotropic potential vorticity (PV) balance and suggested that upwelling-linked onshore transportforced by wind is intensified in the bottom boundary layer where the shelf narrows downwind. Thistopography-induced cross-shore transport has been found to largely link with an along-isobath pres-sure gradient force [Gan et al., 2009a]. Weisberg et al. [2001] suggested that bottom pressure torque,the curl of vertically integrated pressure gradient force, balances the relative vorticity over the shelfbreak and the bottom stress torque over the inner shelf in situations where the surface and bottomboundary layers are dynamically important. In barotropic PV balance, the along-isobath pressure gra-dient force was found to be induced by the net stress curl in the water column over a shelf with weakstratification [Gan et al., 2013], and by advection of vorticity as well off a coastal cape and over a sub-merged valley [Liu and Gan, 2014, 2015].
It is also worthwhile to identify the effect of density field on upwelling. Stratification may reinforcethe wind-driven cross-shelf circulation and then upwelling [Weisberg et al., 2000]. The wind-driven sur-face offshore transport is offset by the return flow in bottom layer under weak stratification (Burgernumber S � 1) and in the interior layer under strong stratification (S� 1) [Lentz and Chapman, 2004].The cross-shelf circulation tends to be reduced and the wind-driven upwelling can be confined atnearshore region in stratified condition [Lentz, 2001; Austin and Lentz, 2002]. Gan et al. [2009b] sug-gested that horizontal density gradient, generating along-isobath baroclinic pressure gradient force,modifies the alongshore distribution of cross-isobath transport under wind forcing. The barocliniceffect is manifested primarily through the joint effect of baroclinicity and relief (JEBAR) term [Ganet al., 2013].
In addition, cross-shelf circulation is generally linked to along-shelf momentum but is rarely attributed tocross-shelf forcing terms (cross-shelf wind stress and pressure gradient force). Horwitz and Lentz [2014]derived an empirical relationship between the cross-shelf density gradient and cross-shelf transport. Gener-ally, the cross-shelf wind stress is more significant than the along-shelf wind stress in driving the cross-shelfcirculation over an inner continental shelf [Tilburg, 2003; Fewings et al., 2008].
Developing a realistic numerical model to simulate the HNEU could help explain the dynamics of the HNEU,but it would still be difficult to explore the contribution of a particular process. This study, therefore, con-ducted process-oriented idealized numerical experiments that are configured based on the basic character-istics of the HNEU and explored the dynamic processes. Of most interest are the effects of flow-topographyinteraction, baroclinic dynamics, and cross-isobath forces on the HNEU.
Figure 1. Sampling stations (dots) off the eastern and northeastern coasts ofHainan Island for the cruise in summer 2009. The red and blue circles note theschematic locations of the upwellings off northeastern and eastern coasts ofHainan Island, respectively. The geography of the area in the dashed box is ideal-ized for the model simulation. Bathymetric contours are in meters.
Journal of Geophysical Research: Oceans 10.1002/2015JC011000
LIN ET AL. UPWELLING DYNAMICS OFF HAINAN ISLAND 2

2. Materials and Methods
2.1. Hydrographic ObservationsA cruise covering 81 sampling stationswas conducted in the northern SCSfrom 16 July to 15 August 2009. Thebottom topography of the study areaand the observation stations are shownin Figure 1. Temperature and salinitydata were obtained using Seabird SBE911 and 917 conductivity, temperature,and depth (CTD) profilers.
2.2. Reanalysis DataThe daily, high-resolution (1/20� 31/20�)
sea surface temperature (SST) data produced by the Operational SST and Sea Ice Analysis (OSTIA) system (http://ghrsst-pp.metoffice.com/pages/latest_analysis/ostia.html) are used to generate a weekly averaged data set forthe summers (June, July and August) of 2006–2012. The daily blended wind data with a resolution of 0.25� forthe same time period are produced by the National Climatic Data Center (NCDC; https://www.ncdc.noaa.gov/oa/rsad/air-sea/seawinds.html). We calculated the weekly wind data to match the timescale of the SST images.
The fuzzy c-means (FCM) algorithm, a pixel classification method that has been successfully applied inupwelling studies [e.g., Sousa et al., 2008; Chen et al., 2012], is used to identify upwelling regions fromweekly SST images. The FCM classifies pixels in each image into c fuzzy clusters based on the iterativeapproximation from initial clusters.
2.3. Numerical ExperimentThe Regional Ocean Modeling System (ROMS), which is a free-surface, hydrostatic, primitive equationsocean model [Shchepetkin and McWilliams, 2005], is used to examine the dynamics of the HNEU. The modeldomain (Figure 2), with dimensions of 500 km 3 300 km, is an idealized geography of regions off the coastsof eastern Hainan Island and southern Guangdong (Figure 1, dashed box). The land located northwest ofthe model domain represents the Hainan Island and the Leizhou Peninsula. The western domain(x< 200 km) with a 50 km wide continental shelf (depth< 100 m) refers to the shelf off the eastern coast ofHainan Island, while the eastern domain (x> 300 km) with a 196 km wide shelf is simplified from the shelfoff the coast of Guangdong. The central domain (between x 5 200 km and x 5 300 km) represents the shelfoff the northeastern coast of Hainan Island. Accordingly, the change in topography off Tongluo Cape is atx 5 200 km in the model domain. The water depth increases from 10 m off the northern coast to 200 m atthe southern boundary. A radiation boundary condition is imposed on the southern boundary. FollowingGan et al. [2005], a periodic boundary condition is chosen for the eastern and western boundaries. To applythis periodic boundary condition properly, an extended computational domain (not shown) is added nextto the existing eastern boundary. This extended domain is west-east symmetric with the domain shown inFigure 2. Specifically, the eastward-extended domain also has dimensions of 500 km 3 300 km with a landto the northeast, so the topography conditions on the eastern and western boundaries are matched.
The model grid has 2 km horizontal resolution and 30 vertical levels. It is initialized with a horizontally uniformdensity profile (N2 5 4.65 3 1024 s22) that is spatially averaged from all in situ data during the cruise in 2009.The initial velocity and surface elevation are set to zero. The model is forced by a spatially uniform westerly wind(5 m s21) that is representative of the mean southwesterly monsoon in the region during summer. The Mellor-Yamada 2.5 turbulence closure scheme [Mellor and Yamada, 1982] is applied to calculate vertical mixing. Themodel is run for 15 days, and the result on Day 8 when first reaching a quasi steady state, is used for analyses.
3. Results
3.1. Spatial Distribution of the UpwellingA low-temperature and high-salinity core with a temperature of approximately 26.5�C and a salinity of 33.6psu was located off the northeastern coast of Hainan Island at a depth of 3 m (Figures 3a and 3c). The
Figure 2. Domain of the idealized numerical model. The coordinate system (p, n)is a rotation from (x, y) where the coordinate p is parallel to the isobaths and thecoordinate n is normal to the isobaths. Contours denote water depth in meters.
Journal of Geophysical Research: Oceans 10.1002/2015JC011000
LIN ET AL. UPWELLING DYNAMICS OFF HAINAN ISLAND 3

extent of cold and salty water at the 30 m depth covered the shelves off the eastern and northeasterncoasts of Hainan Island (Figures 3b and 3d). The nearshore temperature was about 3�C lower than the tem-perature in the offshore region, and the salinity exceeded 34 psu in the nearshore region.
Figure 4b shows the result of the FCM algorithm with c 5 4 clusters applied to the weekly SST image for theperiod 20–26 July 2009 (Figure 4a). The upwelling region is represented by cluster c1 (blue) in the FCMimage, corresponding to the relatively cooler water in the SST image; this matches the hydrographic obser-vations (Figure 3a) well.
The correlation coefficients (significance level >95%) between the time series of each SST pixel and thearea-averaged weekly wind components in different directions (0�–90�, rotating clockwise from northward)were calculated for the study area (110�–113.5�E, 18.5�–22�N). Figure 5a shows that the maximum (blackline) and the mean (gray line) correlations increase as the angle of wind component direction increases andare maximized at 25� and 35� , respectively. As such, we chose the time series of the wind component at30� for the correlation analysis with the SST pixels.
Based on all the FCM images, the probability of upwelling occurrence is defined as the ratio of the numberof upwelling events to the total number of SST images. The contours of upwelling probability show abanded structure near the eastern and northeastern coasts of Hainan Island (Figure 5b). The locations of
Figure 3. Distributions of temperature (top) and salinity (bottom) at depths of 3 m (a and c) and 30 m (b and d) during the cruise in summer 2009.
Journal of Geophysical Research: Oceans 10.1002/2015JC011000
LIN ET AL. UPWELLING DYNAMICS OFF HAINAN ISLAND 4
the two cores with relatively high probabilities (>60%) indicate that the upwelling presents most frequentlyoff the northeastern and eastern coasts of Hainan Island, respectively. The former refers general extent ofthe HNEU, which we focus on in this study.
The correlation coefficients between the time series of wind stress component in the 308 direction and the timeseries of the SST at each pixel from 2006 to 2012 are negative in the domain (Figure 5b). The high-correlationband (correlation coefficient<20.4) has two branches: one extends along the contour of upwelling probabilitytoward the northeastern coast of Hainan Island, which implies that the upwelling in this region is correlatedwith the southwesterly wind; the other extends to the east along the 75 m isobath (see details in section 4).
3.2. Model Results3.2.1. Upwelling Characteristics and Cross-Isobath TransportFor convenience, the change in topography at x 5 200 km in the model domain will be represented as‘‘Point T.’’ The direction of current nearshore will be referred to as the ‘‘downstream’’ direction.
In Figure 6a, the temperature at a depth of 3 m is apparently low along the coast in the western and centraldomains. Under the upwelling-favorable wind, the nearshore currents are spun up and flow along the coastlinewith an eastward branch that appears offshore around Point T (Figure 6b). The onshore depth-integrated veloc-ity reaches its maximum downstream of Point T along the 60 m isobath. It suggests that the upwelling is linkedto the onshore cross-isobath transport, which can be intensified by the particular topography.
To study the horizontal and vertical variations of the cross-isobath transport associated with the upwelling,we transformed the momentum equations to a rotating coordinate system in which p indicates the along-isobath direction and n indicates the normal direction of isobaths (Figure 2). Under stratified conditions, thebaroclinic processes driven by the density field have significant effects on the upwelling. Hence, the pres-sure gradient force terms are decomposed into the baroclinic and barotropic pressure gradient forces. Thealong-isobath vertically integrated momentum balance [Huthnance, 1984] is:
ACC
@
@t
ð2h1
2h2
vpdz
zfflfflfflfflfflfflfflffl}|fflfflfflfflfflfflfflffl{1
GMF
@
@n
ð2h1
2h2
unvpdz1@
@p
ð2h1
2h2
vpvpdz
zfflfflfflfflfflfflfflfflfflfflfflfflfflfflfflfflfflfflfflfflfflfflfflfflfflfflfflffl}|fflfflfflfflfflfflfflfflfflfflfflfflfflfflfflfflfflfflfflfflfflfflfflfflfflfflfflffl{1
Coriolis force
fð2h1
2h2
undz
zfflfflfflfflfflfflffl}|fflfflfflfflfflfflffl{
PGC
52@v@p
2gq0
@h1
@p
ð0
2h1
qdz02@h2
@p
ð0
2h2
qdz0� �zfflfflfflfflfflfflfflfflfflfflfflfflfflfflfflfflfflfflfflfflfflfflfflfflfflfflfflfflfflfflfflfflfflfflfflfflfflfflffl}|fflfflfflfflfflfflfflfflfflfflfflfflfflfflfflfflfflfflfflfflfflfflfflfflfflfflfflfflfflfflfflfflfflfflfflfflfflfflffl{
1
PGT1HVI1VVIð2h1
2h2
2g@f@p
1Khr2vp1sp
q0
� �dz
zfflfflfflfflfflfflfflfflfflfflfflfflfflfflfflfflfflfflfflfflfflfflfflfflfflfflfflffl}|fflfflfflfflfflfflfflfflfflfflfflfflfflfflfflfflfflfflfflfflfflfflfflfflfflfflfflffl{;(1)
and the cross isobath vertically integrated momentum balance is
Figure 4. (a) Weekly OSTIA SST (8C) image for the period 20–26 July 2009; and (b) the corresponding FCM 4-partition image with the upwelling area colored in blue.
Journal of Geophysical Research: Oceans 10.1002/2015JC011000
LIN ET AL. UPWELLING DYNAMICS OFF HAINAN ISLAND 5

@
@t
ð2h1
2h2
undz1@
@n
ð2h1
2h2
unundz1@
@p
ð2h1
2h2
unvpdz2fð2h1
2h2
vpdz
52@v@n
2gq0
@h1
@n
ð0
2h1
qdz02@h2
@n
ð0
2h2
qdz0� �
1
ð2h1
2h2
2g@f@n
1Khr2un1sn
q0
� �dz;
(2)
where
v5gq0
ð2h1
2h2
ð0
2zqdz’
� �dz; (3)
f is the surface elevation, the Coriolis parameter f 5 1024 s21, the reference density q05 1025 kg m23, andthe depth –h1 (–h2) is the upper (lower) limit of the vertical integral. Un5
Ð2h1
2h2undz and V p5
Ð2h1
2h2vpdz are
the cross-isobath and along-isobath transports integrated from –h1 to –h2, respectively. The terms on theleft-hand side of equation (1) are thealong-isobath acceleration (ACC) ofthe along-isobath transport, the gradi-ent of cross-isobath and along-isobathnonlinear momentum flux (GMF), andthe Coriolis force. On the right-handside, the baroclinic pressure gradientforce (PGC) consists of three terms: theterm with v is related to JEBAR (ana-lyzed in section 3.2.3), and the othertwo terms represent the interactionbetween bottom pressure gradientforce and topography. The barotropicpressure gradient force (PGT; thefourth term) depends only on thewater surface slope. The fifth term isthe horizontal viscosity (HVI), followedby the vertical viscosity (VVI).
To estimate Un, in this analysis, weassumed that the water column hasthree layers: the surface layer, the inte-rior layer, and the bottom layer [Lentzand Chapman, 2004]. The surface layerbegins at the surface (h1 5 0; the sur-face elevation is small in comparisonwith the water depth) and ends at thedepth (–h2) where the first zero veloc-ity anomaly (obtained by subtractingthe depth-averaged velocity) of thecross-isobath flow appeared. The layerfrom the second zero crossing ofvelocity anomaly (–h1) to the bottom(h2 5 H) is considered as the bottomlayer [Lentz, 2001].
The cross-isobath velocity anomaly hasa two-layer vertical structure along the60 m isobath (the interface of thesetwo layers is shown in Figure 9b).Based on equation (1), the driving fac-tors of cross-isobath transports in thesurface layer (US) and the bottom layer
Figure 5. (a) Maximum and area-averaged correlation coefficients (significancelevel >95%) between the SST time series of each pixel and area-averaged esti-mates of different weekly wind stress components from 08 (northward) to 908
(eastward) for the summers of 2006–2012. (b) Spatial distribution of correlationcoefficients between the wind stress component in the 308 direction and the SSTat each pixel from 2006 to 2012. The 20.4 correlation coefficient contour (bluecontour), and the 30% and 60% contours of upwelling probability (bold black con-tours) are highlighted, Bathymetric contours (thin black contours) are in meters.
Journal of Geophysical Research: Oceans 10.1002/2015JC011000
LIN ET AL. UPWELLING DYNAMICS OFF HAINAN ISLAND 6

(UB) along the 60 m isobath are shown in Figure 7. In the western domain, US (Figure 7a, dashed black line)is generated by the uniform offshore wind-driven transport which is expressed as the transport related tothe vertical viscosity in the surface layer (Figure 7a, light blue line). The bottom stress (the vertical viscosityin the bottom layer) drives the onshore transport (Figure 7c, light blue line) to counteract US. It clearly sug-gests that the Ekman process is primary in the western domain.
The spatial variation in cross-isobath transport in the central domain is, however, very different. In the sur-face layer, the US is offshore around Point T and is onshore downstream. The maximum magnitudes of theoffshore and onshore US are 4.8 m2 s21 and 22 m2 s21, respectively. The pattern of PGT-induced transport(Figure. 7a, blue line) in the surface layer agreed with the US, suggesting that the cross-isobath transport inthe surface layer is primarily geostrophic. The PGC-induced transport (Figure 7a, red line) is roughly zerodownstream of Point T. The maximum cross-isobath nonlinear momentum flux term is balanced by thealong-isobath nonlinear momentum flux term (Figure 7b). As a result, the total nonlinear momentum fluxterm is small but has a similar pattern to the PGT along the isobath.
The geostrophic transport induced by the pressure gradient force in the bottom layer has a similar spatialvariation to that in the surface layer but has a larger magnitude. In particular downstream of Point T, thePGT-induced UB is almost 3 times larger than the PGT-induced US. The UB from the PGC shows a distributionopposite to that from the PGT, but these two components do not balance each other (Figure 7c). Althoughthe bottom Ekman transport induced by vertical viscosity is small, it is an indispensable component in thedynamic process. Since the two nonlinear momentum flux terms balance each other (Figure 7d), the totalnonlinear momentum flux term has the same sign as the PGT term but is 10 times smaller in magnitude.The contributions of the horizontal viscosity are small in both layers.
Here, the PGC only contains the v-related term, because the other two terms are zero when themomentum equations are integrated throughout the entire water column (Figure 7e). The contribu-tions of PGT and PGC to transport throughout the water column are similar to their contributions insurface and bottom layers, respectively. The transports induced by vertical viscosity in these twolayers are balanced along the 60 m isobath except around Point T. The total nonlinear momentumflux term makes a positive contribution to the cross-isobath transport throughout the water column(Figure 7f).
Figure 6. (a) Depth-averaged velocity vectors (m s21) superimposed on temperature (8C, color) at a depth of 3 m; (b) depth-integratedtransport (m2 s21) normal to the isobaths, with the positive (negative) values denoting offshore (onshore) direction as shown in Figure 2.The red line in Figure 6b denotes the section selected for analysis.
Journal of Geophysical Research: Oceans 10.1002/2015JC011000
LIN ET AL. UPWELLING DYNAMICS OFF HAINAN ISLAND 7

The momentum balance analysis suggests that the along-isobath PGT is the primary driving factor for theintensified cross-isobath transport linked to the upwelling in the central domain, while the along-isobathPGC acts in the opposite way.3.2.2. Barotropic Pressure Gradient ForceTo assess the effect factors of the along-isobath PGT, we use the steady depth-integrated vorticity equationobtained from equations (1) and (2) with h1 5 0 and h2 5 H (for details see appendix of Gan et al. [2013]):
2g@f@p
5@H@n
� �21
J w; �n� �
1@H@n
@
@p
�u21�v 2
2
� �1@H@n
@
@p
ð0
2H
qgq0
dz 2r3ss
q0
� �1r3
sb
q0
� �2r3
ð0
2HHVIð Þdz
� �(4)
where H is the water depth, J is the Jacobian determinant, and w is the transport streamfunction defined byU52@w=@y and V5@w=@x. The depth-averaged relative vorticity is �n5@�v=@x2@�u=@y, where �u and �v aredepth-averaged velocities. The wind stress and bottom stress are ss and sb5 sj2H. The bold symbols repre-sent vectors. The first two terms on the right-hand side of equation (4), the advection of relative vorticityand the gradient of nonlinear momentum flux, are both derived from the nonlinear advection terms in themomentum equations. The third term is along-isobath bottom PGC. The fourth term is wind stress curl,which is zero because the model is forced by spatially uniform wind. The fifth term is bottom stress curl andthe last term is horizontal viscous vorticity. The depth-integrated term with v is zero after cross-differentiation, and the advection of planetary vorticity equals zero because the Coriolis parameter f is con-stant in this study.
Figure 7. Cross-isobath transport (m2 s21) across the 60 m isobath attributable to terms of the along-isobath vertically integrated momentum equation, including (a, c, e) barotropicpressure gradient force (PGT, blue line), baroclinic pressure gradient force (PGC, red line), vertical viscosity (VVI, light blue line), and vertically-integrated transport (US or UB, dashed blackline) and (b, d, f) acceleration (ACC, black line), horizontal viscosity (HVI, green line), cross-isobath nonlinear momentum flux (GMF, blue line), along-isobath GMF (red line), and GMF (lightblue line) in Figures 7a and 7b the surface layer, (Figures 7c, 7d) the bottom layer, and (Figures 7e, 7f) throughout water column. The positive (negative) values denote offshore (onshore)cross-isobath transport. The shaded area refers to the central domain.
Journal of Geophysical Research: Oceans 10.1002/2015JC011000
LIN ET AL. UPWELLING DYNAMICS OFF HAINAN ISLAND 8
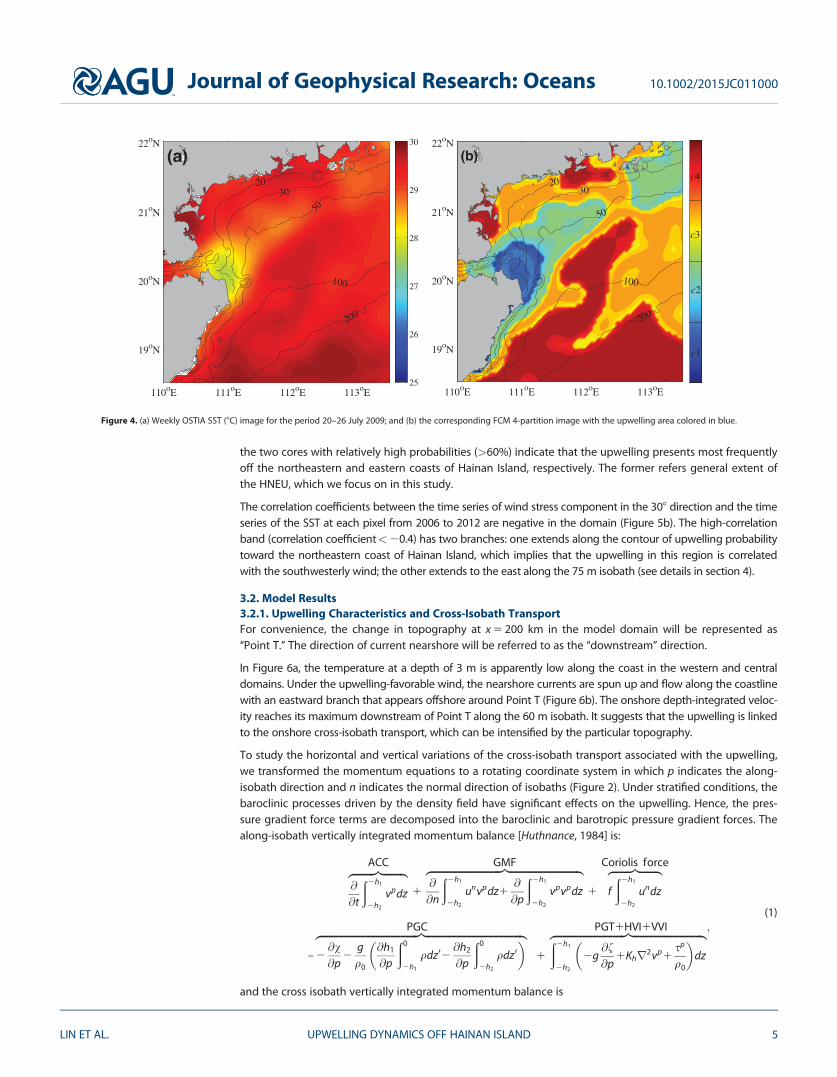
Each term in the vorticity equation(equation (4)) along the 60 m isobath ispresented in Figure 8. The advection ofrelative vorticity (blue line) varies withthe along-isobath PGT (dashed blackline). The advection of relative vorticityis associated with the cyclonic or anticy-clonic movement of current along thechanging bottom topography. Liu andGan [2014] pointed out that the bottomstress curl (gray line), which consists ofthe bottom curvature and the bottomshear vorticity, is another importantterm affecting the along-isobath PGT.Similarly, in our results, the bottomstress curl enhances the along-isobathPGT downstream of Point T. The gradi-
ent of nonlinear momentum flux (green line) is negative in the central domain owing to the decreasing along-isobath depth-averaged velocities. In other words, this term has a similar effect as the bottom stress curl on thealong-isobath PGT. As a term originating from nonlinear advection terms in the momentum equations, nonlinearmomentum flux is important in the region where the nonlinear process is significant. The small effect of horizon-tal viscous vorticity (light blue line), however, can be neglected.
The along-isobath bottom PGC (Figure 8, red line) displays a similar distribution to the along-isobath PGT.To reveal the spatial variation in the along-isobath PGT, we present the surface elevation along the 60 misobath in Figure 9a. Generally, the surface elevation plunges around Point T and then gradually increasesdownstream in the central domain. Corresponding to this pattern of surface elevation, the along-isobathPGT enhances the onshore transport of denser water downstream of Point T (Figure 9b), and in turn,changes the along-isobath density gradient resulting in the along-isobath bottom PGC.
The advection of relative vorticity and the along-isobath PGT are nearly in-phase. The bottom stress curl isalso a critical PGT-derived term downstream of Point T. Although its magnitude is small, the gradient ofnonlinear momentum flux has a positive effect on the along-isobath PGT. As negative feedback, the along-isobath bottom PGC counteracts the along-isobath PGT.3.2.3. Potential Vorticity DynamicsBecause the PGC is important for weakening the onshore transport and, in turn, the upwelling, we identified thebaroclinic dynamics using the baroclinic PV balance without barotropic characteristics. The curl of the depth-
averaged momentum equation [e.g.,Huthnance, 1984; Gan et al., 2013] isrewritten based on equations (1) and (2):
@�n@t
52J �w; �n� �
2J w;fH
� �1J v;
1H
� �
2gHq0
Jð0
2Hqdz;
1H
� �
1r3ss
Hq0
� �2r3
sb
Hq0
� �;
(5)
where �w is the streamfunction, �u52@�w=@y and �v5@�w=@x.
The left-hand side of equation (5) is thePV acceleration term referring to thetemporal variation of PV. On the right-hand side, the first two terms are the
Figure 8. Along the 60 m isobath, terms (m2 s21) in the vorticity equation derivedfrom depth-integrated momentum balances including PGT (dashed black line),PGC at bottom (red line), advection of relative vorticity (RVA, blue line), gradient ofmomentum flux (GMF, green line), bottom stress curl (BS.Curl, gray line), and hori-zontal viscous vorticity (HVI.Curl, light blue line). The shaded area refers to the cen-tral domain.
Figure 9. Along the 60 m isobath, (a) the distribution of surface elevation (m) and (b)the sectional distributions of cross-isobath velocity (m s21, color) with the interfacebetween surface and bottom layers (black line) are shown and density contours areoverlaid (kg m23). The shaded area in Figure 9a refers to the central domain. The posi-tive (negative) values in Figure 9b denote offshore (onshore) cross-isobath velocity.
Journal of Geophysical Research: Oceans 10.1002/2015JC011000
LIN ET AL. UPWELLING DYNAMICS OFF HAINAN ISLAND 9

advections of relative and planetaryPV. The third term is the JEBAR term,and the fourth term is the baroclinicbottom pressure torque as related tothe density field of the water column.The last two terms (the fifth and sixth)are the PV terms induced by windstress and bottom stress, respectively.The HVI-induced PV is not taken intoaccount owing to its small magnitude.
The PV acceleration is relatively small(Figure 10a). The advection of relativePV term (Figure 10b) is positive aroundPoint T and is negative downstream.The positive and negative advectionsof relative PV are related to anticy-clonic and cyclonic movements ofcoastal currents, respectively. Theadvection of relative PV is balanced bythe advection of planetary PV (Figure10c), which is only related to the bot-tom topography due to the constant fin this study. As noted by Mertz andWright [1992], the depth-averagedpressure torque (Figure 10d) consistsof the JEBAR term and the PV termassociated with the bottom pressuretorque. The latter, in this study, is neg-ative over the onshore area of the cen-tral domain except in the regionaround Point T. However, JEBAR canbe eliminated when the water columnis homogeneous or when the bottomtopography is flat [Gan et al., 2013]. Asthe PV components associated withdensity field and topography, the bar-oclinic bottom pressure torque andthe JEBAR have similar distributions(not shown). Myers et al. [1996] indi-cated that JEBAR is analogous to thePV from wind stress (Figure 10e).Therefore, downstream of Point T, thenegative JEBAR and the baroclinic bot-tom pressure torque terms weaken theupwelling-linked onshore transport.The effect of JEBAR and baroclinic bot-tom pressure torque terms can also beexplained with respect to momentumbalance. After depth integration, thePGC term in equations (1) and (2) only
remains the component involving v (related to JEBAR term in PV equations). As shown in Figure 7e, the v-related component of the PGC term weakens the onshore transport downstream of Point T. The effect ofthe baroclinic bottom pressure torque term on PV balance also lends further support to the results of the
Figure 10. Spatial distribution of the terms (310210 m21 s22) in the potential vor-ticity equation (i.e., equation (6)) derived from depth-averaged momentum balan-ces, including (a) PV acceleration, (b) advection of relative PV, (c) advection ofplanetary PV, (d) depth-averaged pressure torque (JEBAR 1 baroclinic bottompressure torque), (e) PV from wind stress, and (f) PV from bottom stress.
Journal of Geophysical Research: Oceans 10.1002/2015JC011000
LIN ET AL. UPWELLING DYNAMICS OFF HAINAN ISLAND 10

vorticity analysis; that is, the baroclinic bottom pressure gradient force plays a negative role in the along-isobath PGT, which is directly related to the upwelling-linked onshore transport downstream of Point T.
Because of the uniform wind forcing used in this model, the negative PV from wind stress (Figure 10e)depends only on the water depth and is primarily offset by the positive PV from the bottom stress (Figure10f). The bottom stress is one of the main PV-generating factors enhancing the onshore transport linked tothe upwelling in the central domain. We have investigated how the PV from bottom stress balances the PVfrom wind stress, and have determined the effects of the interaction between along-isobath flow andtopography on the upwelling process. Assuming that the bottom velocity ub5U=H, the bottom stress isrelated to cross-isobath transport [Pringle, 2002]:
sb5q0rub5q0rUH; (6)
where r � 2Cdjubj based on the assumption that the contribution of bottom shear vorticity is larger thanthat of bottom curvature [Liu and Gan, 2014]. Cd is the drag coefficient. Here, r is computed from the sb andU of the model outputs. The PV terms related to wind and bottom stresses (the last two terms in equation(5)) are expanded to the following [Pringle, 2002]:
r3ss
Hq0
� �2r3
sb
Hq0
� �5
sps
q0
@
@n1H
� �2
spb
q0
@
@n1H
� �2r
�nH
21R
snb
Hq0: (7)
Since no wind stress curl in this study, the wind-driven PV is replaced by the first term on the right-handside of equation (7). This term is a combination of the along-isobath wind stress and a coefficient account-ing for shelf slope. Similarly, the PV related to both bottom stress and shelf slope (the second term on theright-hand side) is proportional to the PV term from bottom stress in PV balance. Generally, the steeper theslope, the more PV is generated, and vice versa [Gu et al., 2012]. The last two terms in equation (7) arerelated to relative vorticity and curvature vorticity. The latter is a function of the curvature radius of the iso-baths, R. The cyclonically curving isobaths (R> 0) can form an offshore transport through the forcing of bot-tom stress [Gill, 1982].
The PV balance analysis indicates that the negative JEBAR and the baroclinic bottom pressure torque termsweaken the upwelling-linked onshore transport downstream of Point T. In contrast, the onshore transport isintensified by the advection of relative and planetary PV terms. The wind stress-induced PV is balanced bythe bottom stress-induced PV which is associated with process of current-topography interaction.3.2.4. Cross-Isobath Pressure Gradient Force and Wind StressIn addition to the primary contributors to upwelling (i.e., the along-isobath wind and pressure gradientforces), cross-isobath wind and pressure gradient forces further enhance upwelling over a shallow innershelf [L€u et al., 2006; Horwitz and Lentz, 2014].
To diagnose the effects of cross-isobath forces on the upwelling-linked onshore transport, by utilizing equa-tion (6), we reduce the steady and linear equations of depth-integrated motion without horizontal viscosityterms (equations (1) and (2)) to:
2Pn
q01fV p1
sns
q02r
Un
H50; (8)
2Pp
q02fUn1
sps
q02r
V p
H50; (9)
where –Pn=q0 and –Pp=q0 are the cross-isobath and along-isobath depth-integrated pressure gradient forceterms, respectively. These two equations are combined to an equation of Un:
Un5 11r2
f 2H2
� �21
21f
Pp
q02
rf 2H
Pn
q01
sps
fq01
rfH
sns
fq0
� �: (10)
It suggests that Un is linked to the pressure gradient force (the first term on the right-hand side) and windstress (the third term) not only in the along-isobath direction, but also in the cross-isobath direction (thesecond and fourth terms). Figure 11 shows the variations in cross-isobath transport induced by these fourterms along the cross-shelf section (the red line in Figure 6b).
Journal of Geophysical Research: Oceans 10.1002/2015JC011000
LIN ET AL. UPWELLING DYNAMICS OFF HAINAN ISLAND 11

Because the averaged r (5 2.3 3 1024
m s21 in this study; r 5 5 3 1024 ms21 in the study of Pringle [2002]) hasthe same order of magnitude to f 5 13 1024 s21, the coefficient11r2=f 2H2ð Þ21 is determined by
water depth H. In the offshore area,the coefficient is close to 1, owing tothe relatively large H. Thus, the firstand third terms represent cross-isobath geostrophic transport andcross-isobath Ekman transport,respectively. In the offshore area(depth> 30 m), the transport inducedby the cross-isobath pressure gradi-ent force approaches 20.5 m2 s21
(Figure 11). The along-isobath pres-sure gradient force still determinesthe total cross-isobath transport. Itincreases until it reaches its maximumamplitude at a depth of roughly
60 m. The along-isobath wind stress is crucial to offshore transport, while effect of the cross-isobathwind is negligible.
In the nearshore area (depth< 30 m), instead of the along-isobath pressure gradient force, the cross-isobathpressure gradient force plays an essential role in the total transport. The geostrophic cross-isobath circulationmoves the denser (lighter) water onshore (offshore) so that the cross-isobath density gradient is built up instratified water. Horwitz and Lentz [2014] pointed out that the cross-shelf density gradient is critical to the cross-shelf transport over the inner shelf. In their study, an inner shelf is typically 10 m deep. As the minimum depthof the model was set to 10 m in our study, Figure 11 cannot show the conditions at depths less than 10 m. How-ever, the cross-isobath and along-isobath wind stresses tend to be equal toward the coast. Lentz and Fewings[2012] noted that the cross-isobath wind stress becomes the primary force driving the cross-isobath transportover the inner shelf. The coefficient in equation (10) is small in the shallow nearshore area. The transport bycross-isobath wind stress tends to be Un50:32sn
s = f q0ð Þ, which is the empirical formula under weakly stratifiedconditions [Tilburg, 2003]. Consequently, the cross-isobath pressure gradient force is associated with theupwelling-linked onshore transport in the nearshore region. The contribution of the cross-isobath wind stressneeds to be considered over the shallow nearshore shelf but could be neglected in the offshore region.
4. Discussion and Summary
Based on the correlations between upwelling-favorable wind and SST in Figure 5b, a high-correlation bandhas a branch extending eastward along the 75 m isobath. The SST images from satellites and models inmany studies [e.g., Jing et al., 2011; Li et al., 2012] have shown that the upwelling signal frequently extendsoffshore to the east from the nearshore shelf off Tongluo Cape. Based on the hull-mounted ACDP measure-ments, Jing et al. [2015] showed that an eastward jet of the upwelled cold water moved away from thenortheastern coast of Hainan Island. The numerical simulation in our study provides reasonable evidencesthat the upwelled water is offshore transported around Point T (Figure 6). The offshore transport aroundPoint T and the onshore transport downstream show a dipole-like pattern. The offshore transport tends tobe driven by the mechanisms (primarily geostrophic and Ekman balances), which is similar to those drivingthe onshore transport downstream (Figure 7). The offshore transport around Point T is enhanced by along-isobath PGT and wind stress, but is weakened by along-isobath PGC and bottom stress. It is worth notingthat the eastward jet around Point T happens mostly in the surface layer (Figures 7 and 9). The offshoretransport can also be explained by the PV balance (Figure 10). Around Point T, the offshore transport isattributed to the PV from wind stress and the advection of PV. The advection of PV is dissipated due to thecurrent-topography interaction around Point T. In addition, the last two terms obtained from the bottom
Figure 11. Cross-isobath transports, along the selected cross-shelf section shownin Figure 6b that are generated by the along-isobath pressure gradient force(blue) and wind stress (green) and the cross-isobath pressure gradient force (red)and wind stress (pink). The total transport (dashed black) is also shown. The posi-tive (negative) values denote offshore (onshore) cross-isobath transport.
Journal of Geophysical Research: Oceans 10.1002/2015JC011000
LIN ET AL. UPWELLING DYNAMICS OFF HAINAN ISLAND 12

stress-induced PV term in equation (7) reduce offshore transport around Point T where the current flowscyclonically owing to the topography.
In this study, both the observations in summer 2009 and the reanalysis data clearly present the HNEU. Theprobability of upwelling estimated from FCM images has two high values centers (> 60%) in the regions offthe eastern and northeastern coasts of Hainan Island, respectively. The upwelling off the eastern and north-eastern coasts of Hainan Island is highly correlated with the wind component in 30� . To analyze the dynam-ics of the wind-driven upwelling process, a numerical experiment with idealized topography off the coastsof Hainan Island and Guangdong is conducted to simulate the HNEU. The corresponding onshore cross-isobath transport controls the upwelling downstream of the change in topography.
The vertically integrated momentum equations suggest that cross-isobath transport in the surface layeralong the 60 m isobath has a similar distribution to that in the bottom layer, but has much smaller magni-tudes. The along-isobath PGT is the primary mechanism intensifying the upwelling-linked onshore transportdownstream of Point T, but the along-isobath PGC acts to retard it.
As the primary driver of the upwelling-linked onshore transport downstream of Point T, the along-isobathPGT primarily originates from the advection of relative vorticity, the gradient of momentum flux and thebottom stress curl. Furthermore, the along-isobath PGT has a dynamical balance with the along-isobath bot-tom PGC through variations in along-isobath surface elevation and density gradient.
On the other hand, the PGC-related baroclinic dynamics, weakening the upwelling, in the stratified water arereflected in the PV balance. The advection of planetary PV is partly balanced by the advection of relative PV.The JEBAR and the baroclinic bottom pressure torque terms dissipate the PV weakening the onshore transportdownstream of Point T. The PV from wind stress is balanced by the PV from bottom stress which consists ofthree components related to bottom Ekman transport, relative vorticity, and curvature of bottom topography.
The study also identifies the importance of the cross-isobath force terms. The cross-isobath pressure gradi-ent force plays an essential role in the upwelling-linked onshore transport in the nearshore regions(depth< 30 m), where the contribution of the cross-isobath wind stress increases shoreward.
Our modeling study may have limitations as the flow-topography interaction is much more complicated inthe real ocean than in the idealized topography used here. During summer, the SCS circulation enhancesthe onshore transport in the bottom boundary layer over the shelf off the eastern and northeastern coastsof Hainan Island [Li et al., 2012]. The bottom Ekman transport may be underestimated because the modelignores the along-shelf background current. We also omitted the effects of the freshwater flux on the near-shore area off the southern coast of Guangdong (Figure 3) and of the tides which can cause the deeperwater to mix with the surface water on the continental shelf of the northern SCS.
ReferencesAllen, S. E. (1996), Topographically generated, subinertial flows within a finite length canyon, J. Phys. Oceanogr., 26, 1608–1632.Austin, J. A., and S. J. Lentz (2002), The inner shelf response to wind-driven upwelling and downwelling, J. Phys. Oceanogr., 32(7),
2171–2193.Barth, J. A., S. D. Pierce, and R. L. Smith (2000), A separating coastal upwelling jet at Cape Blanco, Oregon and its connection to the Califor-
nia Current System, Deep Sea Res., Part II, 47, 783–810.Chen, Z., X.-H. Yan, Y. H. Jo, L. Jiang, and Y. Jiang (2012), A study of Benguela upwelling system using different upwelling indices derived
from remotely sensed data, Cont. Shelf Res., 45, 27–33.Chen, Z. Y., X.-H. Yan, Y. W. Jiang, and L. D. Jiang (2013), Roles of shelf slope and wind on upwelling: A case study off east and west coasts
of the US, Ocean Modell., 69, 136–145.Fewings, M., S. J. Lentz, and J. Fredericks (2008), Observations of cross-shelf flow driven by cross-shelf winds on the inner continental shelf,
J. Phys. Oceanogr., 38(11), 2358–2378.Gan, J. and J. S. Allen (2002), A modeling study of shelf circulation off northern California in the region of the Coastal Ocean Dynamics
Experiment, Response to relaxation of upwelling, J. Geophys. Res., 107(C9), 3123, doi:10.1029/2000JC000768.Gan, J., J. Allen, and R. Samelson (2005), On open boundary conditions in a limited-area coastal model off Oregon. Part 2: Response to
wind forcing from a regional mesoscale atmospheric model, Ocean Modell., 8, 113–115.Gan, J., A. Cheung, X. Guo, and L. Li (2009a), Intensified upwelling over a widened shelf in the northeastern South China Sea, J. Geophys.
Res., 114, C09019, doi:10.1029/2007JC004660.Gan, J., L. Li, D. X. Wang, and X. G. Guo (2009b), Interaction of a river plume with coastal upwelling in the northeastern South China Sea,
Cont. Shelf Res., 29, 728–740.Gan, J., H. San Ho, and L. Liang, (2013), Dynamics of intensified downwelling circulation over a widened shelf in the northeastern South
China Sea, J. Phys. Oceanogr., 43(1), 80–94.Gill, A. E. (1982), Atmosphere-Ocean Dynamics, Academic, San Diego, Calif.
AcknowledgmentsThe authors thank three anonymousreviewers for suggestions thatimproved this manuscript. This workwas supported by the National BasicResearch Program of China (projects2015CB954004 and 2009CB421208),the National Natural ScienceFoundation of China (projects41276006 and U1405233), and theHong Kong Research Grant Council(project 16202514). The authorsacknowledge the Met Office forproviding OSTIA SST data and theNational Climatic Data Center forproviding wind data. We also thankZhenyu Sun, Jia Zhu, and the crew ofR/V Dongfanghong 2 for their help withcollecting data which are available fromthe corresponding author at e-mail:[email protected], and Laifang Li, JohnHodgkiss, and Susan Sholi for help withEnglish editing.
Journal of Geophysical Research: Oceans 10.1002/2015JC011000
LIN ET AL. UPWELLING DYNAMICS OFF HAINAN ISLAND 13

Gu, Y., J. Pan, and H. Lin (2012), Remote sensing observation and numerical modeling of an upwelling jet in Guangdong coastal water,J. Geophys. Res., 117, C08019, doi:10.1029/2012JC007922.
Guan, B. X., and S. J. Chen (1964), Ocean Current System in East China Sea and South China Sea [in Chinese], Inst. of Oceanol., Chin. Acad. ofSci., Qingdao.
Han Y.W., M. B. Wang, and K. M. Ma (1990), The lowest surface water temperature area of China sea in summer: The upwelling along theeast coast of Hainan Island [in Chinese], Oceanol. Limnol. Sin., 21(3), 267–275.
Horwitz, R., and S. J. Lentz (2014), Inner-shelf response to cross-shelf wind stress: The importance of the cross-shelf density gradient in anidealized numerical model and field observations, J. Phys. Oceanogr., 44(1), 86–103.
Huthnance, J. M. (1984), Slope currents and ‘‘JEBAR,’’ J. Phys. Oceanogr., 14, 795–810.Jing, Z. Y., Y. Q. Qi, Z. L. Hua, and H. Zhang (2009), Numerical study on the summer upwelling system in the northern continental shelf of
the South China Sea, Cont. Shelf Res., 29(2), 467–478.Jing, Z., Y. Qi, and Y. Du (2011), Upwelling in the continental shelf of northern South China Sea associated with 1997–1998 El Ni~no, J. Geo-
phys. Res., 116, C02033, doi:10.1029/2010JC006598.Jing, Z., Y. Qi, Y. Du, S. Zhang, and L. Xie (2015), Summer upwelling and thermal fronts in the northwestern South China Sea: Observational
analysis of two mesoscale mapping surveys, J. Geophys. Res. Oceans, 120, 1993–2006, doi:10.1002/2014JC010601.Lentz, S. J. (2001), The influence of stratification on the wind-driven cross-shelf circulation over the north Carolina shelf, J. Phys. Oceanogr.,
31(9), 2749–2760.Lentz, S. J., and D. C. Chapman (2004), The importance of nonlinear cross-shelf momentum flux during wind-driven coastal upwelling,
J. Phys. Oceanogr., 34(11), 2444–2457.Lentz, S. J., and M. R. Fewings (2012), The wind-and wave-driven inner-shelf circulation, Annu. Rev. Mar. Sci., 4, 317–343, doi:10.1146/
annurev-marine-120709-142745.Li, L. (1990), A study on the summer upwellings in shelf waters west to Zhujiang River mouth [in Chinese], J. Oceanogr. Taiwan, 9(4),
338–346.Li, Y., S. Peng, W. Yang, and D. Wang (2012), Numerical simulation of the structure and variation of upwelling off the east coast of Hainan
Island using QuikSCAT winds, Chin. J. Oceanol. Limnol., 30, 1068–1081.Liu, Z., and J. Gan (2014), Modeling study of variable upwelling circulation in the East China Sea: Response to a coastal promontory, J. Phys.
Oceanogr., 44(4), 1078–1094.Liu, Z., and J. Gan (2015), Upwelling induced by the frictional stress curl and vertical squeezing of the vortex tube over a submerged valley
in the East China Sea, J. Geophys. Res. Oceans, 120, 2571–2587, doi:10.1002/2015JC010715.L€u, X., F. Qiao, C. Xia, J. Zhu, and Y. Yuan (2006), Upwelling off Yangtze River estuary in summer, J. Geophys. Res., 111, C11S08, doi:10.1029/
2005JC003250.Mellor, G. L., and T. Yamada (1982), Development of a turbulence closure model for geophysical fluid problems, Rev. Geophys., 20, 851–
875.Mertz, G., and D. G. Wright (1992), Interpretations of the JEBAR term, J. Phys. Oceanogr., 22(3), 301–305.Myers, P. G., A. F. Fanning, and A. J. Weaver (1996), JEBAR, bottom pressure torque, and Gulf Stream separation, J. Phys. Oceanogr., 26,
671–683.Pringle, J. (2002), Enhancement of wind-driven upwelling and downwelling by alongshore bathymetric variability, J. Phys. Oceanogr., 32,
3101–3112.Shchepetkin, A. F., and J. C. McWilliams (2005), Regional Ocean Model System: A split-explicit ocean model with a free surface and
topography-following vertical coordinate, Ocean Modell., 9, 347–404.Song, Y. T., D. B. Haidvogel, and S. M. Glenn (2001), Effects of topographic variability on the formation of upwelling centers off New Jersey:
A theoretical model, J. Geophys. Res., 106, 9223–9240.Song, X., Z. Lai, R. Ji, C. Chen, J. Zhang, L. Huang, J. Yin, Y. Wang, S. Lian, and X. Zhu (2012), Summertime primary production in northwest
South China Sea: Interaction of coastal eddy, upwelling and biological processes, Cont. Shelf Res., 48, 110–121.Sousa, F. M., S. Nascimento, H. Casimiro, and D. Boutov (2008), Identification of upwelling areas on sea surface temperature images using
fuzzy clustering, Remote Sens. Environ. 112(6), 2817–2823.Su, J., and T. Pohlmann (2009), Wind and topography influence on an upwelling system at the eastern Hainan coast, J. Geophys. Res., 114,
C06017, doi:10.1029/2008JC005018.Su, J., J. Wang, T. Pohlmann, and D. Xu (2011), The influence of meteorological variation on the upwelling system off eastern Hainan during
summer 2007–2008, Ocean Dyn., 61(6), 717–730.Tilburg, C. E. (2003), Across-shelf transport on a continental shelf: Do across-shelf winds matter?, J. Phys. Oceanogr., 33(12), 2675–2688.Weisberg, R. H., B. D. Black, and Z. Li (2000), An upwelling case study on Florida’s west coast, J. Geophys. Res., 105, 459–469.Weisberg, R. H., Z. Li, and F. Muller-Karger (2001), West Florida shelf response to local wind forcing: April 1998, J. Geophys. Res., 106,
239–262.Wu, R. S., and L. Li (2003), Summarization of study on upwelling system in the South China Sea (in Chinese), J. Oceanogr. Taiwan, 22(2),
277–278.Xie L. L., S. W. Zhang, and H. Zhao (2012), Overview of studies on Qiongdong upwelling, J. Trop. Oceanogr., 31(4), 35–41.Yu W. Q. (1987), A preliminary approach of the upwelling for the northern South China Sea [in Chinese]. Mar. Sci., 6, 7–10.
Journal of Geophysical Research: Oceans 10.1002/2015JC011000
LIN ET AL. UPWELLING DYNAMICS OFF HAINAN ISLAND 14

![UPWELLING, EKMAN MASS TRANSPORT AND EL NIÑO, ENS O & …ocw.umb.edu/environmental-earth-and-ocean-sciences/eeos-630-biol… · on Ekman transport and upwelling.] Comments on upwelling](https://img.dokumen.tips/doc/110x75/606d25ba60c7861ff966b665/upwelling-ekman-mass-transport-and-el-nio-ens-o-ocwumbeduenvironmental-earth-and-ocean-scienceseeos-630-biol.jpg)