Embed Size (px)
Citation preview

General rights Copyright and moral rights for the publications made accessible in the public portal are retained by the authors and/or other copyright owners and it is a condition of accessing publications that users recognise and abide by the legal requirements associated with these rights.
Users may download and print one copy of any publication from the public portal for the purpose of private study or research.
You may not further distribute the material or use it for any profit-making activity or commercial gain
You may freely distribute the URL identifying the publication in the public portal If you believe that this document breaches copyright please contact us providing details, and we will remove access to the work immediately and investigate your claim.
Downloaded from orbit.dtu.dk on: Apr 29, 2019
Dynamics of chromosome segregation in Escherichia coli
Nielsen, Henrik Jørck
Publication date:2007
Link back to DTU Orbit
Citation (APA):Nielsen, H. J. (2007). Dynamics of chromosome segregation in Escherichia coli.


Dynamics of Chromosome segregation
in Escherichia coli
Ph.D.-thesis by
Henrik Jørck Nielsen
October 2006
BioCentrum
Technical University of Denmark
Kgs. Lyngby
Denmark

Picture on front page is from (Nielsen et al., 2006a) and was used as cover photo on
Molecular Microbiology 61(2) 2006.

Preface
This report is the result of my pre-doctoral work in the years 2003 to 2006 in Flemming
Hansen’s laboratory in Denmark and Stuart Austin’s laboratory at the National Cancer
Institute in the USA.
The study was sponsored by the Danish Government as a ph.d.-scholarship
administered by the Technical University of Denmark. The study was supervised by
Flemming G. Hansen, Biocentrum, DTU.
Acknowledgements
I would like to thank my supervisor Flemming Hansen for excellent guidance and
friendship during my 5 years in his laboratory.
I thank Dr. Stuart Austin (NCI) for his great abilities as mentor and excellent guidance
during my many stays at NCI-Frederick. I am also grateful for the kindness and hospitality
given to me by Stuart Austin and his lovely family at numerous occasions.
I thank the lab technicians here at DTU and at NCI Susanne Koefod and Brenda Youngren
without which the results presented in this thesis could not have been produced.
Many thanks to my friend and former colleague Jesper Ottesen for help with proof reading
of this thesis.
I thank the Danish Government and DTU for funding this study as well as the Otto
Mønsted foundation, the Oticon foundation, the Poul V. Andersen foundation and the Frant
Alling foundation for the additional fundings making my trip to NCI possible.
Finally I thank my wife and children for their support and understanding during many of
the late hours.


Dynamics of chromosome segregation
i
Contents
Abstract.......................................................................................................................iii
Abstract in Danish / Resume på Dansk..................................................................... v
List of publications....................................................................................................vii
Abbreviations and nomenclature.............................................................................. ix
1 Introduction .......................................................................................................... 1
1.1 The cell cycle 1
1.2 Applied chromosome labeling techniques 7
1.3 Models for Chromosome Segregation 9
1.4 Position of replication 14
1.5 Dynamics and organization of the replicating chromosome 19
2 Results ................................................................................................................. 25
2.1 Counting and measuring cells 25
2.2 Optimizing the P1-par labeling system 26
2.3 Time-lapse studies and flowcells 28
2.4 Progressive chromosome segregation 30
2.5 Developing a pMT1-par labeling system 33
2.6 Separate replichores localize to separate cell halves 34
2.7 Stickiness 35
3 Discussion............................................................................................................ 39
3.1 A model for chromosome segregation 39
3.2 Perspectives 46
4 Bibliography ..................................................................................................... 511
5 Co-author statements ......................................................................................... 59
6 Papers and manuscripts..................................................................................... 61
Paper 1 An automated and highly efficient method for counting
and measuring foci in rod shaped bacteria 6 pages
Paper II Progressive segregation of the Escherichia coli
chromosome 11pages
Supplementary material for Paper II 1 page
Paper III The Escherichia coli chromosome is organized with the
left and right chromosome arms in separate cell halves 8 pages
Supplementary material for Paper III 3 pages

Henrik Jørck Nielsen Ph.D.-Thesis
ii

Dynamics of chromosome segregation
iii
Abstract
Since the 1960’es the conformation and segregation of the chromosome in Escherichia coli
has been a subject of interest for many scientists. However, after 40 years of research, we
still know incredibly little about how the chromosome is organized inside the cell, how it
manages to duplicate this incredibly big molecule and separate the two daughter
chromosomes and how it makes sure that the daughter cells receives one copy each. The
fully extended chromosome is two orders of magnitude larger than the cell in which it is
contained. Hence the chromosome is heavily compacted in the cell, and it is obvious that
structured cellular actions are required to unpack it, as required for its replication, and
refold the two daughter chromosomes separately without getting them entangled in the
process each generation.
The intention of the study was initially to find out how the chromosome is organized in
the cell by labeling specific parts of it. Later the dynamics of chromosome segregation was
included.
Investigating chromosome organization by labeling of specific loci was already a
widely used technique when I started on this thesis, but the data acquisition and treatment
was slow and generally poorly described. There was a great need for an automatic
standardized method capable of identifying the number and position of fluorescent foci in
cells on photomicrographs fast and precise. A major part of my three-year study was
devoted to the development of such a procedure. The result which is described in the
accompanying Paper I, is a macro (program) written for the image analysis software Image
Pro Plus capable of measuring the physical outline of cells, counting the number of foci
within, and measuring their intra-cellular position. 1000 cells are processed in 3 minutes.
The development of this fast and reliable method enabled us to start the analysis on the
distribution of various chromosomal loci inside slowly growing cells. With the actual
counting and measuring no longer being any problem we could easily analyze 14 loci
distributed on the E.coli chromosome. More than 15.000 cells were analyzed in total. The
results are described in the accompanying Paper II and show clearly that the chromosome
is segregated progressively. An unexpected delay between the replication and segregation
of markers was also observed and led to a new model on the timing of chromosomal
segregation (the Sister Loci Cohesion Model). The results of Paper II also strongly

Henrik Jørck Nielsen Ph.D.-Thesis
iv
indicated that the chromosome is not replicated in a central factory but by separated and
migrating replication forks. A result confirmed by others.
Finally we developed a new labeling system compatible with the existing labeling
system based on the P1 par system. Using the new system, which is based on the pMT1
par system from Yersenia pestis, we labeled loci on opposite sides of the E.coli
chromosome simultaneously and were able to show that the E.coli chromosome is
organized with one chromosomal arm in each cell half. This astounding result is described
in Paper III.
Adding the results of the thesis together with known data results in the following
description of the chromosome dynamics of slowly growing E.coli cells:
The chromosome of slow growing cells is organized with the origin at the cell center
when it is newborn. It has one chromosomal arm on one side of the center and the other
chromosomal arm on the other side. The terminus is at the new pole but migrates to the
center soon after cell division. Replication is initiated at the origin at the cell center. The
duplicated origins stay together for a short while and then migrate to the cell quarters. As
the origins migrate away from the center the replication forks split up too and are from this
point found on opposite sides of the cell center but randomly distributed. Supposedly the
forks track along the two chromosomal arms that are separated to each cell half. As the
forks replicate the two arms, the duplicated loci stay together for a while at the non-central
position where they were replicated. This delay is the same for all loci. Thus segregation is
progressive at a rate comparable to the rate of replication but segregation is delayed with
respect to replication. After the delay one of the replicated loci is segregated to the other
side of the cell center and the other one stays where it is. This way of segregating the
chromosome ultimately leads to the placement of the two arms of the chromosome on each
side of the cell quarter. Finally the replication forks meet at the terminus in the cell center
and the replication is complete. The terminus does not separate until cell division where
after it migrates to the new cell center and the original configuration is re-established.

Dynamics of chromosome segregation
v
Abstract in Danish / Resume på Dansk
Siden 60’erne har man forsøgt at klarlægge kromosomernes organisering og segregering i
Escherichia coli. Men selv efter 40 år ved vi stadig meget lidt om hvordan kromosomet er
organiseret inde i cellen, hvordan det lykkes cellen at duplikere dette meget store molekyle
og separere de to datter-kromosomer, samt hvordan det sikres at hver dattercelle kun får ét
kromosom hver. Det fuldt udstrakte cirkulære E.coli kromosom er over 100 gange større
end cellen hvori det indeholdes. Kromosomet er derfor pakket godt sammen og det er
indlysende at der må findes strukturerede cellulære processer der hver generation pakker
kromosomet op når det skal repliceres og pakker de to datter-kromosomer sammen igen
hver for sig uden at de bliver viklet ind i hinanden.
Formålet med dette projekt var oprindeligt at finde ud af hvordan kromosomet er
organiseret inde i cellen, men blev senere udvidet til også at omfatte kromosom-
segregationsdynamik.
Studier over kromosomets organisering i cellen ved hjælp af mærkning af specifikke
kromosomale loci var allerede en udbredt metode da jeg startede mit Ph.D.-studie. Data
opsamling og behandling var dog langsom og generelt dårligt beskrevet. Der var et udtalt
behov for en automomatisk og standardiseret metode til at identificere antal og lokalisering
af foci i celler hurtigt og præcist. En stor del af mit 3-årige Ph.D.-studieforløb er gået med
at udvikle en sådan metode. Resultatet som er beskrevet i Paper I er et program (makro)
skrevet til det digitale billedebehandlings- og analyseprogram Image Pro Plus der er i stand
til måle de fysiske dimensioner af celler og tælle antal af foci inden i samt måle disse foci’s
intracellulære positioner. 1000 celler bliver talt og målt på cirka 3 minutter.
Udviklingen af denne hurtige og pålidelige metode satte os i stand til at begynde
analyser af positioneringen af forskellige kromosomale loci i langsomt voksende celler. Da
det ikke længere var noget problem at tælle og måle et stort antal celler kunne vi nemt
analysere 14 loci fordelt jævnt over E.coli kromosomet. Flere end 15.000 celler blev
analyseret i alt. Resultatet er beskrevet i Paper II og viser med al tydelighed at kromosomet
segregeres progressivt. En uventet forsinkelse i mellem replikation og segregation af
kromosomet blev observeret og ledte til en ny model for timingen af segregationen af
kromosomet (the Sister Loci Cohesion Model). Resultaterne præsenteret i Paper II

Henrik Jørck Nielsen Ph.D.-Thesis
vi
indikerer også at kromosomet ikke replicers i en central fabrik (factory) men af separerede
replikationsgafler i bevægelse. Et resultat bekræftet af andre.
Endelig har vi udviklet et nyt mærkningssystem til mærkning af kromosomale loci som
er kompatibelt med det eksisterende system baseret på P1 par systemet. Dette nye system
som er baseret på pMT1 par systemet fra Yersenia pestis har vi brugt til at mærke loci
placeret på modsatte sider af E.coli kromosomet (hver side af origin) og vist at E.coli
kromosomet er organiseret med en kromosomal arm i hver cellehalvdel. Dette utrolige
resultat er beskrevet i Paper III.
Ved at sammenholde resultaterne fra dette Ph.D-studie med eksisterende data kommer
jeg frem til følgende skitse for kromosomets organisering i langsomt voksende E.coli:
Kromosomet i langsomt voksende E.coli celler er organiseret med dets origin i midten
af den nyfødte celle. Herfra går de to kromosomale arme (de to halvdele af det cirkulære
kromosom) ud til hver sin side således at den ene arm er i den ene cellehalvdel og den
anden arm i den anden cellehalvdel. Terminus er ved cellens nyeste pol men migrerer til
midten af cellen kort tid efter celledelingen. Replikationen bliver initieret ved
kromosomets origin i midten af cellen. De duplikerede origins forbliver sammen for en tid,
hvorefter de migrerer i hver sin retning til de to kvartpositioner i cellen. Idet de to origins
migrerer fra midten adskilles også de to replikationsgafler som indtil da har befundet sig i
centrum af cellen. Herefter fordeles de temmeligt tilfældigt omkring midten men på hver
side af den. De løber givetvis langs hver deres kromosomale arm i hver deres halvdel af
cellen. Det duplikerede DNA som skabes efterhånden som de to replikationsgafler
replicerer hver deres arm forbliver sammen for en tid der hvor de blev repliceret; ligesom
det var tilfældet for de to origins. Denne forsinkelse i mellem replikation og separation er
den samme for alle loci. Segregationen af kromosomerne er derfor progressiv med en
hastighed der nøje svarer til hastigheden af replikationen skønt segregationen dog er
forsinket i forhold til replikationen. Efter forsinkelsen vil ét af de replicerede loci
segregeres til den anden side af cellecentrum hvorimod den anden bliver hvor den er. Det
er således tilsyneladende kun den ene datter-streng der segregeres i hver cellehalvdel.
Denne måde at segregere kromosomerne på fører til sidst til at de to kromosomarme i hver
deres cellehalvdel placeres på hver deres side af cellens kvartposition. Til sidst mødes
replikationsgaflerne ved terminus i midten af cellen og replikationen er tilendebragt.
Terminus segregerer ikke før celledelingen, hvorefter den migrerer til midten af den nye
celle og udgangspunktet for kromosomorganiseringen er genskabt.

Dynamics of chromosome segregation
vii
List of publications
The scientific results of this thesis have been described in the following papers referred to
in chapter 1 mainly by author and year and in chapters 2 and 3 by their roman numerals.
I. Nielsen, Henrik J. & Hansen, Flemming G. (2006). An automated and highly
efficient method for counting and measuring foci in rod shaped bacteria.
Manuscript.
II. Nielsen, Henrik J., Li, Yongfang, Youngren, Brenda, Hansen, Flemming G. &
Austin, Stuart (2006). Progressive segregation of the Escherichia coli
chromosome. Molecular Microbiology 61(2), 383-393.
III. Nielsen, Henrik J., Ottesen, Jesper R., Youngren, Brenda, Austin, Stuart &
Hansen, Flemming G. (2006). The Escherichia coli chromosome is organized
with the left and right chromosome arms in separate cell halves. Molecular
Microbiology 62(2), 331-338.

Henrik Jørck Nielsen Ph.D.-Thesis
viii

Dynamics of chromosome segregation
ix
Abbreviations and nomenclature
GFP Green Fluorescent Protein
CFP Cyan Fluorescent Protein
yGFP yellow Green Fluorescent Protein (see Paper III)
Early, intermediate, and late markers refer to markers that are replicated early, mid-way or
late in the replication cycle. There is no specific boundary between them but in general the
early markers refer to the first third of the chromosome that is replicated and the
intermediate and later markers are the middle and last thirds respectively.

Henrik Jørck Nielsen Ph.D.-Thesis
x

Dynamics of chromosome segregation
1
1 Introduction
In this chapter I present basic knowledge important for understanding chromosome
dynamics. I begin with the cell cycle of bacteria. Then follows a description of the
different methods used to label and follow chromosomal loci in the cell and a presentation
of the current models on chromosome segregation. Looking at the position of the
replication forks is of great interest when studying chromosome dynamics and is discussed
separately in the following section. Lastly I describe the published data that have led to the
different models on chromosome segregation and give a complete review of the present
results and opinions on chromosome organization and segregation in E.coli.
I show how incompatible many of the reports on chromosome dynamics in E.coli are,
and in a search for a consensus try to isolate the published data that in general is in
agreement as well as sort out where the individual authors could possibly be wrong. From
this and from our own results I conclude on the actual organization of the E.coli
chromosome and establish new models that explains not only the latest results in the field
but also many of the older results.
1.1 The cell cycle
The cell cycle refers to the cyclic progression of macromolecular events leading to cell
division and to two basically identical daughter clones. These events repeat themselves in
the daughter cells leading to division once again and four new clones one generation later.
Therefore it is referred to as the cell cycle as it is a cycle of events that repeats itself in
every cell from newborn to division. In a balanced culture where all rate coefficients are
constant and equivalent, these events are basically the same in each and every cell,
although the natural variation from clone to clone is significant (Koch, 1996). When
discussing the cell cycle of E.coli often only the DNA replication is considered although
the cell cycle embraces all events leading to the cell division. In this thesis too the
emphasis will be on the parts of the cell cycle that involves replication as well as
segregation of the DNA.

Henrik Jørck Nielsen Ph.D.-Thesis
2
1.1.1 Defining the cell cycle
The cell cycle of the E.coli cell is essentially defined by the inter-initiation time (I), which
is the time it takes for the cell to build up an initiation potential. This potential is reached
when the cell reaches the initiation mass (Donachie, 1968); a mass that does not vary
considerably with the growth rate (Koppes and Nanninga, 1980). Once the initiation mass
is achieved the cell initiates DNA replication from all origins (Skarstad et al., 1986), and
the replication period (C) begins. This period is followed by the D-period which is the
period from termination of replication to cell division. When the cell initiates replication it
immediately begins building up the next initiation potential which will lead to the next
initiation of replication after one inter-initiation time I. Hence in balanced growth the ‘cell
cycle is a cyclic achievement every I minutes of the capacity to initiate chromosome
replication followed by cell division C+D minutes later’ (Helmstetter, 1996), and the
generation time is dictated by and equal to the inter-initiation time I. Thus the events
required for division often begins before the previous division (when C+D>I).
At slow growth rates the cell cycle is very simple: At some time after cell division the
initiation potential is achieved. When no DNA replication is ongoing in this period as it is
the case at very low growth rates, this period is referred to as the B-period. Then the cell
initiates its only origin, the B-period ends and the C-period begins. DNA replication is
terminated C minutes later and the cell finally divides after further D minutes segregating
two non-replicating chromosomes to each daughter cell. B-periods are often seen in E.coli
B/r strains at slow growth but only observed for the K-12 strains at very slow growth
(Michelsen et al., 2003), for example in minimal succinate media.
When C+D equals I there is no B-period as cells initiate at cell division. If C+D>I and
C<I initiation occurs before cell division but after termination of the previous round of
replication. Hence replication is initiated from two origins and daughter cells receive a
replicating chromosome but there is no overlapping replication, i.e. chromosomes do not
have more than two replication forks at any time. This can be observed when E.coli K-12
grows in minimal glycerol media.
At moderate growth rates where C I there will be ongoing replication in the cell at all
times as the previous round of replication will not terminate before the next begins.
Daughter cells will in this case receive well replicated chromosomes. Many E.coli strains
show continuous replication (C~I) when grown in minimal glucose media (Michelsen et
al., 2003). When C>I replication of chromosomes is initiated before the previous round is
terminated resulting in multi fork replication, i.e. when the same chromosome is being
replicated from several positions by 6 replication forks or more (as many as 14 forks can
replicate from the same chromosome, at C 2I)

Dynamics of chromosome segregation
3
At very high growth rates the replication of the chromosomes that are segregated to
each daughter cell at cell division was initiated as much as 3 generations before. This
example is true when realistically I, C, and D equals 20, 40, and 20 minutes. These cells
are actually born with two separate chromosomes as the D-period leading to cell division
starts at the previous cell division. Cells also initiate at cell division and are thus born with
8 origins but only 1-2 termini. Such an extreme situation can for some strains be obtained
by growth in L broth supplemented with glucose.
The B-,C-, and D-periods of the bacterial cell cycle are often compared to the analogue
phases of the eukaryotic cell cycle. One should be careful when doing such comparisons
though. The D-period for example, which is the period from termination of replication to
cell division, is often compared to the G2/M phase of eukaryotes, although they only share
the fact that they lie in between termination of DNA replication and cell division. Bacteria
don’t show any resemblance with the eukaryotic chromosome partitioning process.
Consequently one should be careful comparing the bacterial D-period with the eukaryotic
G2/M phase. When C+D>I, initiation of the next C-period takes place during the D-period,
which is not possible in eukaryotes. Hence, in this case, any resemblance to the eukaryotic
G2/M phase is gone and comparison of the two becomes meaningless. For that reason,
only the B,C, and D terms are used in this thesis when referring to phases of the bacterial
cell cycle.
1.1.2 Initiation of replication
Replication is initiated once and only once in the balanced bacterial cell cycle (Skarstad et
al., 1986). Initiation occurs when initiator proteins (DnaA) binds five 9-mer sequences
known as DnaA boxes in the OriC region and create the initiation complex (Messer and
Weigel, 1996). This happens when the cell reaches its initiation mass (Donachie, 1968).
The initiation mass defined as the mass per origin where the cells initiate is constant for a
given strain over a range of growth rates (Churchward et al., 1981). Initiation occurs from
all origins in the cell almost at once with an extraordinary precise timing (Boye and
Lobner-Olesen, 1991). Furthermore every origin initiates only once. As important as it is
that the cell initiates every cell cycle from all origins, just as important is it to ensure that
newly replicated origins do not immediately re-initiate but wait until the next cell cycle.
This is regulated by the Dam and SeqA proteins.
The function of the SeqA protein is to bind newly formed origins after initiation of
replication and protect them from further initiation; a process called sequestration (Slater et
al., 1995). This process is part of the initiation mechanism that ensures that every origin is
initiated once and only once when the initiation mass of the cell is achieved. SeqA

Henrik Jørck Nielsen Ph.D.-Thesis
4
recognizes and sequesters the origins because the newly formed daughter origins, as well
as newly formed DNA in general, are hemi-methylated at GATC sites. GATC sites are
found throughout the chromosome of E.coli and normally methylated at the N6 position of
the adenines on both strands by the methyl transferase enzyme Dam (Bakker and Smith,
1989). Newly synthesized DNA formed during replication is only methylated on one
strand because the other has just been created and not yet methylated. SeqA recognizes
these hemi-methylated GATC sites and binds to them (Fujikawa et al., 2004), preventing a
second initiation event at the origin (von Freiesleben et al., 1994). Eventually Dam will re-
methylate these GATC sites, but at that point the initiation potential has dropped because
DnaA (the initiator protein) has been titrated by high affinity DnaA boxes on the newly
formed chromosomes (Hansen et al., 1991). The time window where origins are
sequestered and protected from re-initiation is referred to as the eclipse period and defines
the theoretical minimal length of the inter-initiation time I. As expected the eclipse period
shortens if Dam methylase is over expressed, indicating that the eclipse corresponds to the
period of origin hemi-methylation (von Freiesleben et al., 2000).
SeqA has two functional domains. An N-terminal multimerization domain (residues 1-
50) and the C-terminal DNA binding domain (residues 51-181) (Guarne et al., 2002). It
binds DNA as a dimer and oligomerizes on the DNA. Both features, the DNA binding as
well as the ability to oligomerize, is important for the proteins function in initiation
regulation in vivo (Guarne et al., 2005). As expected a strain deleted for either the SeqA or
Dam proteins is asynchronous in its initiation of DNA replication as it is impaired in its
ability to prevent re-initiation of newly formed origins (Boye et al., 1996; Boye and
Lobner-Olesen, 1990).
1.1.3 Elongation
Once the replication has been initiated two so-called replication forks are formed at each
origin. The replication forks replicate one arm of the chromosome each going bi-
directionally from the origin and meeting in the terminus region. The term ‘fork’ is used
because one double strand of DNA is coming in and two are coming out of the replication
complex, thus forming a fork of DNA. The replication speed is constant from initiation to
termination under normal conditions (Atlung and Hansen, 1993).
The main component of the forks besides of course the DNA is the polymerase III
holoenzyme which does the actual strand synthesis. There are two active holoenzymes,
each synthesizing one new daughter strand using one of the parental strands as template
(semi-conservative replication). In front of the holoenzymes the DNA is melted by DnaB
and single stranded DNA is protected by the single strand DNA binding protein SSB until

Dynamics of chromosome segregation
5
it reaches the polymerase. As the polymerase III can only add deoxy ribonucleotides to the
3’-hydroxyl end of the DNA, there will be a leading and a lagging strand. The leading
strand is the 5’-3’ strand that is continuously replicated. The other strand is in the 3’-5’
direction and is replicated discontinuously in so-called Okazaki fragments before they are
ligated (Okazaki and Okazaki, 1969). Before and after the forks topoisomerases act to
release the helical tension created by the replication.
Knowing the physical position of the replication forks in the cell is important for
clarifying the spatial dynamics of chromosome replication and segregation and is discussed
separately later.
1.1.4 Termination of replication
Termination occurs when the replication forks collide in the TerC region of the
chromosome opposite to the OriC. ter sites in the terminus region ensures that one fork do
not go through the terminus region but stop and wait for the other fork (Pelletier et al.,
1988). Upon termination the two completed chromosomes will be interlinked, or catenated
(Sundin and Varshavsky, 1981). Before they can be segregated they have to be de-
catenated. This is done by topoisomerase IV (Deibler et al., 2001). Occasionally sister
chromosomes will recombine and form one dimeric structure. This has to be resolved into
two separate chromosomes before the chromosomes can segregate. Resolution happens at
the 28 base pair recombination site dif site in the terminus region by the XerC and XerD
resolvases (Sherratt et al., 2004). FtsK is responsible for recruiting the resolvases to the dif
site (Massey et al., 2004). FtsK is a very large 1329 aa protein that is vital for the cell. It
consists of two domains separated by a long ~700aa linker. The ~500 aa C-terminal
domain activates the Xer recombination complex in a ATP-dependent manner. It is
however the ~200aa N-terminal membrane spanning domain of the protein with unknown
function that is vital for the cell (Wang and Lutkenhaus, 1998).
1.1.5 Determining cell cycle parameters
The cell cycle was originally measured using synchronized cells (Helmstetter and
Cummings, 1963). Synchronized cells are all at the same point in the cell division cycle;
all initiating at the same time and all dividing at the same time etc. Hence by taking
samples from a culture of synchronized cells at different points in time the variation in cell
size and DNA content through the cell cycle can be determined.
Synchronized cells can be obtained from so-called baby machines. A baby machine is
as it implies a machine that produces newborn ‘baby’ cells. A popular technique used in
baby-machines for much of the work on bacterial cell cycle research is the membrane

Henrik Jørck Nielsen Ph.D.-Thesis
6
elution technique. Cells are attached to a nitro cellulose membrane, optionally coated with
poly-D-Lysine. The immobilized cells grow and divide normally on the filter when
continuously flushed with fresh media releasing newborn cells into the effluent (Cooper
and Helmstetter, 1968; Helmstetter et al., 1992; Helmstetter and Cummings, 1963). These
newborn cells are then collected and grown in small batches. Cell growth and division are
measured with standard techniques (optical density, colony forming units etc.) and DNA
synthesis periods and synthesis rates are determined by for example measuring the
incorporation of radioactive or fluorescent nucleotides. These kind of experiments were
popular in the 70’es and revealed most of the basic knowledge on the bacterial cell cycle
(Helmstetter and Pierucci, 1976; Pierucci and Helmstetter, 1976)
Today bacterial cell cycle parameters are nearly always measured using a flow
cytometer. In the 80’es flow cytometry became sensitive enough to be used on bacteria. In
the flow cytometer cells are flushed in a water beam rapidly across a microscopy slide.
Before the cells are put in the flow cytometer they are fixed and the DNA is labeled with
fluorescent dyes. As they pass across the slide in the flow cytometer they are exposed to a
beam of exciting light and fluorescence is measured for each cell as well as light scatter.
These two values are directly proportional to the DNA content and the cell size
respectively. Methods were developed to use this technique on E.coli revealing detailed
information on the relationship between DNA content and cell size (Boye et al., 1983).
Using computer simulations of the cell cycle based on the knowledge of the cell cycle
obtained from the early experiments using synchronized cultures and fitting these to
experimentally obtained DNA distributions from a flow cytometer it ultimately became
possible to analyze a sample of exponentially growing cells and determine the length of the
C, D and B periods directly (Skarstad et al., 1985).
The implementation of flow cytometry made it possible to take a sample from any
exponentially growing culture in any experiment and determine the cell cycle parameters
for that particular culture. That has been used in this work to verify that any culture used
for a chromosome segregation study is growing normally and to determine the C and D
periods directly in that culture, and not from some other experiment.
The model used in this work to simulate the cell cycle parameters from the DNA
distribution of exponentially growing cells and to determine the length of C and D periods
is slightly different from the one used and described by Skarstad (Skarstad et al., 1985).
Skarstad assumed that the coefficient of variation is the same for all measured DNA
contents. It has however been shown recently that this assumption is possibly incorrect
(Michelsen et al., 2003); instead there is a described linear correlation. Changing the
assumption on the variation of DNA content gives better simulations and better

Dynamics of chromosome segregation
7
determinations of the cell cycle parameters (Michelsen et al., 2003). This modified version
of Skarstad’s original model has been used in the present work.
1.2 Applied chromosome labeling techniques
Most of the present knowledge on bacterial chromosome dynamics is based on the
development 10 years ago of techniques for labeling chromosomal loci inside the cell,
techniques that practically revolutionized the field. They have been used to visualize the
position of the origin, the terminus or other markers in cells under different conditions. The
results from these labeling experiments form the basis for all of the models on
chromosome segregation. Here follows a short description of them including the one used
in this work.
1.2.1 The repressor / operator system
In 1997 the first system capable of visualizing the position of specific parts of the
chromosome inside the living cell was published for bacillus subtilis (Webb et al., 1997)
and later the same year for E.coli (Gordon et al., 1997). The authors inserted 256 tandem
repeats (Straight et al., 1996) of the lactose operon operator into the chromosome near the
origin or terminus of replication. Then they fused the green fluorescent protein GFP to the
lac repressor LacI and expressed the fusion protein from a plasmid. The repressor fusion
protein bound the operator repeats and resulted in green fluorescent foci at either the origin
or the terminus. This was the first time specific and discrete DNA loci had been visualized
in living cells of E.coli. The system was however quite genetically unstable as the tandem
repeats tended to cross out by homologous recombination. For that reason the first system
was developed in a strain incapable of doing any homologous recombination. A system
was later developed without this problem by inserting 10 bp of random sequence between
240 repeats (Lau et al., 2003).
This system is only capable of visualizing one locus, or alternatively more loci but all
using the same color. The single color restriction of the Lac operator/LacI-GFP system was
later circumvented by using it in combination with a similar system using the tetracycline
operator and repressor (Lau et al., 2003) or a system using the phage lambda c1
repressor/operator (Fekete and Chattoraj, 2005).
1.2.2 Fluorescent In Situ Hybridization
In 1998 the first results using Fluorescent In Situ Hybridization (FISH) to visualize the
DNA loci was published from Hiraga’s lab (Niki and Hiraga, 1998). The method uses

Henrik Jørck Nielsen Ph.D.-Thesis
8
specific fluorescent DNA probes that are hybridized to the chromosomal DNA inside fixed
and gently lysed cells. This method has the advantage that several distinct loci can be
labeled at once. On the other hand a major downside is that cells have to be fixed and are
completely dead introducing the possibility of artifacts and excluding the possibility of
doing time-lapse experiments. The FISH technique was soon adapted to other organisms
such as Caulobacter crescentus (Jensen and Shapiro, 1999) and used with success. The lac
operator/LacI-GFP system was eventually made for the C. crescentus too and actually
showed to produce results comparable with the FISH method (Viollier et al., 2004).
1.2.3 P1 partitioning system
A third system was developed and published in 2002 (Li et al., 2002). This system is based
on the partitioning system of the plasmid phage P1. The plasmid contains a sequence parS
that is bound by the P1 encoded ParB protein. The ParB protein spreads out from the parS
to the adjacent DNA. Hence when labeled with GFP, ParB forms fluorescent foci inside
the cell if a parS sequence is present. ParA binds to the ParB and is required for normal
partitioning, but Li at al. made a truncated version of the ParB removing the first 30 amino
acids from the protein making it incapable of binding to the ParA protein, though still
capable of binding parS and forming foci in the cell.
This method has the advantage over the FISH method that it works in living cells. It
also has an advantage over the repressor/operator system since it is completely genetically
stable, and the parS site is small and easily inserted in any strain (286 bp for the parS
containing insert compared to 7440 bp for 240 lacO repeats). On the downside however it
only allows one color, so only one locus can be visualized at a time.
Very recently a similar system using the pMT1 ParB and parS was developed in our
lab (Nielsen et al., 2006). This system is completely compatible with the P1 labeling
system and thus provides the possibility of visualizing two different loci with two different
colors at the same time.
1.2.4 Data acquisition
When labeling specific loci of the chromosome using any of the techniques described
above the cells have to be analyzed by fluorescence microscopy in order to produce images
that can be measured for intracellular positions of the labeled DNA. Usually a combination
of phase contrast and fluorescence microscopy is used. The first shows the outline of the
cell very clearly, and when the fluorescent image is overlaid on the phase contrast image
the exact position of the foci inside the cell can be easily measured.

Dynamics of chromosome segregation
9
Phase contrast microscopy is very suitable for this purpose as it produces clearly
defined cells with high contrast and does not have the problem of creating shadows as
Differential Interference Contrast microscopy does. Alternatively membrane dyes can be
used and thus foci as well as the cell outline determined by fluorescence microscopy alone.
This is theoretically a better solution as it reveals the true outline of the cell. In phase
contrast microscopy the cell to background boundary, which is the one used for
measurements, is not necessarily the same as the true cell outline because of the ‘Halo’
effect of phase contrast microscopy. This is nevertheless the preferred method. Cell
membrane dyes can arguably interfere with cell physiology although that would not be a
problem in FISH experiments.
The inaccuracy in using phase contrast microscopy for determining cell outlines can be
minimized and at least kept constant for all cells by maintaining a high level of cell to
background contrast and by defining the boundary between cell and background using a
threshold value calculated on the basis of this contrast value consistently for all cells
(Paper I). Unfortunately it is usually not reported how the cell outline is determined in
experiments using phase contrast microscopy. Hence it is difficult to know how much
variation in the end result is introduced from this step.
Measurements of the position of foci inside the cell consist very often only on
measuring the distance from one pole to the center of each focus. These measurements are
almost always done manually, aided by some software (MetaMorph, Object Image, IP Lab
Spectrum, Image Pro Plus etc.). The user will manually determine where the poles and foci
centers are, and the software will then calculate the pole to foci distances. The method of
determining where the poles and foci are, if any, is never reported. What is the pole? Is it
the very end of the cell, the point where it starts converging, or somewhere in between?
That is usually decided by the person operating the software and therefore a lot of variation
is expected to be introduced in this step.
As a part of this thesis I have developed a fully automatic method of measuring cell
outline, size, and position of foci. Not only does that minimize the variations associated
with the manual methods mentioned above, but more importantly it speeds up the process
tremendously. 1000 cells are measured in less than five minutes, a task that would take at
least 4 hours using the old manual method. The method is described in Paper I.
1.3 Models for Chromosome Segregation
In the following the different major models presented by scientist in the field of bacterial
chromosome segregation during the last 10 years is presented. Only a brief and general

Henrik Jørck Nielsen Ph.D.-Thesis
10
description is given as details on the results supporting or disputing the different models
are reviewed in later chapters.
1.3.1 The Extrusion-Capture Model
This model was originally described in 1974 (Dingman, 1974) but was refined and given
the present name in 2001 (Lemon and Grossman, 2001). Basically it assumes that much of
the force necessary for separating the two daughter chromosomes is provided by
replication itself. The nascent chromosomes forming in the trail of the replication are
completely relaxed, unfolded, and untangled. This is therefore the perfect time to separate
the chromosomes. For many years the DNA polymerases was thought to track along the
DNA inside the cell, replicating the DNA along the way. This model however assumes that
the two replication forks involved in the bi-directional replication of the chromosome are
linked together and positioned in the center of the cell (Figure 1.1A). The forks stay there
throughout the replication pulling the DNA in for replication and pushing, or Extruding,
the nascent chromosomes out. This is the central replication factory. If the replication
factory is in fact held in place by somehow anchoring it to the cell membrane or some
structure present at the cell center, the assumption is liable that it could progressively pull
the entire chromosome through the factory (Lemon and Grossman, 2001). In order for
segregation to take place it is important that the forming chromosomes are directed to
opposite cell halves. The Capture-Extrusion model state that if only the origins are directed
away from the middle and Captured at the quarter positions the rest of the DNA will
automatically follow, condensing around the captured origins and eventually form the new
nucleoids. Hence the most important events in this model is the replication at a central
replication factory, the directed extrusion of the newly formed DNA away from the factory
and the capture and holding of the chromosomes (see (Sawitzke and Austin, 2001) for a
review).
1.3.2 The Sister Chromosome Cohesion Model
In opposition to the widely accepted Extrusion-Capture model Hiraga and coworkers have
proposed the Sister Chromosome Cohesion Model (Hiraga et al., 2000; Sunako et al.,
2001). This Model describes the segregation process in a way that is much more similar to
the segregation of eukaryotic chromosomes. Chromosomes are thought to stay paired
together for the entire or much of the replication period and then actively segregate as a
unit before the cell divides (Figure 1.1B). This would require an additional and so far
unknown segregation mechanism in the cell. Mitotic like spindles have been proposed but
no evidence for their existence presented. The consensus seem to be that chromosomes

Dynamics of chromosome segregation
11
stay cohered together 1/3-2/3 of the C-period (Molina and Skarstad, 2004; Sunako et al.,
2001). They are then separated before the rest of the replication runs to termination.
An implication of this model is that the replication forks do not have to be centrally
located; in fact they would be expected not to be but to track along the DNA. Determining
the location of the replication forks has therefore been an important factor in finding the
correct model and will be discussed separately.
1.3.3 The Sister Loci Cohesion Model
This is the model proposed by the author of this thesis based on the results of this work and
presented in the accompanying Paper II. It is to some extent a hybrid of the two previous
Figure 1.1 Two models for chromosome segregation.
A. The extrusion–capture model: after initiation from the central ‘factory site’ (open triangle) the origins (circles) move out
toward the poles followed by the newly replicated sequences (thin lines). Unreplicated DNA (thick line) is fed into the
factory, and the terminus (square) is drawn to the cell centre toward the replication forks (closed triangles). Chromosome
markers are segregated progressively as they are replicated, finishing with the terminus.
B. The sister chromosome cohesion model: after initiation, the sister sequences cohere and become paired along their length
as they are replicated. Late in the cell cycle, the origin and other markers segregate together. One version of the model is
drawn. In a variant, the sister regions pair as shown, but the replication forks remain at the cell centre (Hiraga et al., 2000).
Figure and text taken directly from (Li et al., 2002)

Henrik Jørck Nielsen Ph.D.-Thesis
12
models. It only considers the temporal relationship between replication and segregation.
The spatial relationship is described next in the Home and Away Segregation Model.
Duplicated loci stay paired together for some time after replication. After a delay they
are then segregated to opposite sides of the cell center. This delay is constant for all loci, so
that segregation is progressive and happens at the same rate as the replication but with a
temporal offset equal to the delay. During this delay the cell has time to do any repair and
other recombinational activities that require two homologous double stranded DNA
molecules. Once separated the two chromosomes do not go back across the middle.
This model resembles the Sister Chromosome Cohesion model in that they both
suggest cohesion of daughter chromosomes. However where the later propose that the
cohesion is maintained for the entire length of the chromosomes and then lost at once as
chromosomes are separated as units this model suggests that sister cohesion is lost
progressively from the origin towards the terminus following replication but delayed with
respect to it.
The idea of progressive segregation on the other hand resembles the Capture-Extrusion
model. There is a major difference though. As the segregation of loci are delayed
significantly compared to their replication in this model the process of replication is not
likely to drive the segregation. Hence another so far unknown segregation mechanism is
needed.
1.3.4 The Home and Away Segregation Model
This model is also a result of the present work. It is based on the results presented in the
accompanying papers II and III as well as the recent work of Wang and coworkers (Wang
et al., 2005).
The chromosome is organized with the origin and the terminus at the middle, one arm
of the chromosome in one half of the cell and the other arm in the other half (Nielsen et al.,
2006; Wang et al., 2006). Since the origin is in the middle initiation occurs here. As
replication progresses the forks separate and migrates in opposite directions following the
organization of the chromosome and ends up in separate cell halves. They eventually come
back to the cell center at termination of replication as the terminus is located here. The
replication forks track along the DNA duplicating loci at the intracellular position in which
they are located. As described previously for the Sister Loci Cohesion Model, loci are
thought to stay together for a while before they segregate although that is not critical for
this model. Once sister loci segregate one stays where it is, this is the Home locus, and the
other is taken to the other half of the cell - that is the Away locus. The Away locus is put
just on the other side of the cell center on the inside of the DNA already present in that cell

Dynamics of chromosome segregation
13
half. The segregation pattern is the same for the other arm of the chromosome replicated
by the other fork in the opposite half of the cell. The pre-division cell will thus have two
chromosomes, one in each cell half. They each consist of two arms: One that stayed Home
and one that came from the fork in the other half of the cell (the Away-copy of the other
chromosomal arm). The Home loci are close to the old poles and the Away loci are close
to the division septum. Thus the original configuration is restored.

Henrik Jørck Nielsen Ph.D.-Thesis
14
1.4 Position of replication
The identification of the position of the replication forks is important for testing the models
described above. If the forks are not located together in a central factory throughout the
replication period, basic central factory models as the Extrusion-Capture model are
incorrect. Note that the position of the replication forks has not been under investigation
directly in this thesis, but speculations about their positions can be inferred from the
results.
1.4.1 Visualizing the replication forks directly
Lemon and Grossman have visualized the PolC subunit of the replisome in Bacillus
subtilis presenting evidence supporting the central factory model. The position of the
replication apparatus was visualized directly using a fusion protein consisting of the
catalytic subunit PolC fused to the fluorescent protein GFP (Lemon and Grossman, 1998).
This PolC-GFP protein supported DNA replication in vivo and localized as discrete foci in
the cell only when the cell was replicating its DNA. In slowly growing cells there was
mostly only one focus that always localized to the middle of the cell. Some cells had 2 foci
which localized to the quarters. At faster growth rates cells had more foci, but they always
localized as one focus in the middle, two foci at the quarters or a combination with one
focus at each quarter and one in the middle. These data suggested that replication takes
place in a stationary replisome in the middle of the cell and that the DNA is pulled
through, as originally proposed by Dingman (Dingman, 1974). Lemon and Grossman have
further presented proof of this theory by looking at the position of a specific chromosomal
region where the replication was blocked (Lemon and Grossman, 2000). The DNA in this
replication block localized to mid-cell and was shown to co localize with the DNA
polymerase tau subunit. Upon release of the replication block the chromosomal region
duplicated and migrated to the cell quarters.
However, as correctly pointed out by Hiraga and coworkers (Hiraga et al., 2000), the
results by Lemon and Grossman can easily be re-interpreted as replication forks separating
from the middle to the quarters. Since Lemon and Grossman do not relate their results to
the cell cycle and cell length or in other ways satisfyingly justify that the two PolC-GFP
foci could not have represented only one replicating chromosome, their results can be
interpreted as either fixed or separating and migrating replication forks. Similarly the
replication block results can be challenged and claimed to support the sister chromosome
cohesion model. Since the locus under investigation is rather close to the origin it is likely
to replicate at the middle of the cell according to models with migrating replication forks

Dynamics of chromosome segregation
15
as well. Also, we question the conclusion that replication takes place in the middle just
because the blocked locus and it’s associated replication fork are found in the middle. It is
possible that segregation takes place in the middle and that the replication block causes the
stalled fork to get stuck in the segregation apparatus located in the middle of the cell. A
hypothesis supported by results from our lab on studies of segregation blocks (see section
2.7).
These challenges to the results of Lemon and Grossman emphasize the importance of
knowing the exact cell cycle in the cells under analysis. The position of forks has to be
related to the progress of the replication in order to convincingly claim that forks are either
fixed or migrating. An observation of two foci when C+D<I is clear evidence for migrating
forks whereas if C+D>I it depends on the cell length of the cells containing two foci as
pointed out by Hiraga and coworkers. As it will be described in later sections, results
concerning the dynamics of the chromosome are disturbingly often published without
determining the basic cell cycle parameters.
Bates and Kleckner visualized the polymerase directly in synchronized E.coli cells
(Bates and Kleckner, 2005) with a DnaX-GFP fusion protein developed by Andrew Wright
(Tufts University, Boston). In this study the cell cycle was determined and the authors
showed that virtually all forks (DnaX-GFP foci) came a part 1/3 into the C-period. The
separated forks localized rather haphazardly between the cell quarters. The cells were
grown in minimal succinate media with C+D<I. Thus the results can only be interpreted as
replication forks migrating away from each others.
1.4.2 Using SeqA as marker for the replication forks
SeqA does not only bind GATC sites in the origin as described earlier. Other hemi-
methylated GATC sites spread evenly throughout the chromosome are bound when
properly spaced. SeqA binds a hemi-methylated GATC sequence if another sequence like
it is present close to it on the same piece of DNA within three helical turns (Brendler and
Austin, 1999). Furthermore binding only occurs when the two sequences follow specific
spacing rules where optimal binding occur at spacings of 7, 12, 21, and 31 bp (Brendler et
al., 2000). Once bound further SeqA can oligomerize on to the SeqA-DNA complex.
During the replication of the chromosome tracts of hemi-methylated DNA strands are
formed behind the replication forks. The length of these tracts depends on the rate of re-
methylation by the Dam protein. Using kinetic data from the work of Campbell and
Kleckner, Brendler et al. calculated that these tracts should consist of ~100 suitably spaced
pairs of GATC sites (Brendler et al., 2000). Using immunostaining of fixed cells (Molina
and Skarstad, 2004; Yamazoe et al., 2005) or a GFP-SeqA fusion protein in living cells

Henrik Jørck Nielsen Ph.D.-Thesis
16
(Brendler et al., 2000; Onogi et al., 1999) these tracts can be visualized as foci in the cell.
SeqA only forms foci in actively replicating cells (Hiraga et al., 2000). As expected the
presence of Dam methylase is also required for formation of foci (Onogi et al., 1999) The
number of foci depends on the growth rate and can be anywhere from 0 (no replication) to
16 (Brendler et al., 2000; Molina and Skarstad, 2004). Each focus probably represents one
of these tracts.
As these tracts consist of newly formed DNA and newly formed DNA is expected to
be found mainly at the replication forks, the SeqA foci are generally thought co localize
with the replication forks. This assumption seems to be true as the SeqA foci co localize
with newly formed DNA as shown by pulse labeling the DNA with 5-bromodeoxyuridine
(BrdU) (Adachi et al., 2005; Molina and Skarstad, 2004).
The reports on numbers and distribution of these clusters of SeqA molecules in the
cells vary considerably. At a moderate growth rate in glucose minimal media scientists
agree that cells have no foci or one SeqA-focus when newborn. This focus then seems to
split up in two foci that jumps rapidly to the cell quarter positions (Brendler et al., 2000;
Hiraga et al., 1998; Hiraga et al., 2000) as confirmed by time-lapse microscopy (Onogi et
al., 1999). At faster growth rates in rich media the number of reported foci depends
somewhat on the technique (GFP fusion or immunostaining) as well as the reporting
laboratory. Accordingly Onogi et al. observed 2 to 4 SeqA-foci in cells growing in glucose
media supplemeted with amino acids (Onogi et al., 1999) where Molina and Skarstad have
reported up to 8 in a similar media (Molina and Skarstad, 2004). Brendler and Austin
reported as many as 14 SeqA-foci in some cells growing in L media with the majority of
cells having 4 to 8 foci (Brendler et al., 2000). Onogi et al. saw only 2 to 4 foci in a time-
lapse study of cells growing in similar media (Onogi et al., 1999).
Figure 1.2 Separation of replication forks.
Upper figure represents three-step temperature shifts for
synchronous initiation of only one round of chromosome
replication. Lower figure represents the number of cells
with SeqA foci. Approximately 300 cells were counted
in each sample. Open circles, cells with one SeqA focus;
open diamonds, cells with two closely located SeqA foci;
solid circles, cells with two separated SeqA foci; open
triangles, cells with three SeqA foci; solid triangles, cells
with four SeqA foci.
Figure and text taken from Yamazoe et al., 2005.

Dynamics of chromosome segregation
17
It is difficult to conclude anything about the number and positions of separated
replication forks when reports vary so much, and accordingly most of these experiments
really have not lead to any insight on whether forks come apart or not.
One convincing study used synchronized cells (Yamazoe et al., 2005). The strain used
had a temperature sensitive dnaC mutation allowing it to only initiate DNA replication at
permissive temperature. By keeping the culture at non-permissive temperature and shifting
it to permissive temperature briefly every 60 minutes, the cells become very synchronous
in their replication. After 3 cycles most cells have only one chromosome which initiates at
the shift to permissive temperature leading to cell division one generation later. After one
such initiation, the number and position of SeqA foci were followed over time for one
generation by immunostaining (Figure 1.2). At initiation there was one central focus, this
then split up after 12 minutes (at 42 degrees) into two foci that migrated rapidly to the
quarters. After 40 minutes the replication was terminated and the two foci merged in the
middle as one. As there where only one round of replication initiated from a single origin
each focus must have represented one replication fork and the results thus support a
separating replication forks model.
1.4.3 Visualizing newly replicated DNA in the cell
Newly synthesized DNA in the cell has been visualized by pulse labeling the chromosome
with 5-bromodeoxyuridine (BrdU). Subsequent fixation of the cells and immunostaining of
the BrdU containing DNA reveals the position of the newly replicated DNA. In one study
using this method newly replicated DNA was found either in the middle or at the quarters
of the cell (Adachi et al., 2005) very similar to many of the reports on SeqA localization.
Unfortunately the cell cycle parameters were not determined and the authors could not
make any conclusions as to whether the replication forks were separating or if they were
looking at separate replication factories at either the middle or the quarters.
In another study the cell cycle parameters were in fact determined (Molina and
Skarstad, 2004). The general result was that too few foci were seen to support either the
separating fork or replication factory model. In stead the authors proposed a model with
central replication super factories with as many as 8 to 12 polymerases equivalent to 4-6
forks or 2-3 ‘normal’ factories. Although that is not necessarily incorrect, the model is
based on these results only and has not been confirmed by other experiments.
Koppes and co-workers used electron-microscopic autoradiography of cells pulse
labeled with 3H-thymine to visualize the position of newly replicated DNA (Koppes et al.,
1999). This was, in contrast to the experiments described above, done in an E.coli B/r
strain. The cells were grown slowly with a very long B-period and replicating cells had

Henrik Jørck Nielsen Ph.D.-Thesis
18
only two origins and two replication forks (as mentioned earlier B/r strains have shorter D-
periods and longer B-periods than K-12 strains). It was shown that newly replicated DNA
is mainly found in the middle of the cell around the time of initiation. Halfway through the
C-period the distribution of newly replicated DNA becomes very broad and in the end it is
clearly off-center. From the results the authors conclude that most or perhaps all
replication takes place at the cell center. The observation of broad distributions halfway
though the C-period and onwards is justified by the presence of more than one class of
cells; some replicating the terminus in the middle and others with replicated and separated
termini. This explanation is plausible for the cells close to termination and division but
does not satisfyingly explain why the distribution broadens already halfway through the C-
period. With the introduction of the Home and Away Segregation Model, the observations
can easily be explained. The pulse duration was quite long, 10 minutes, so it is possible
that the initial sister loci cohesion has been overcome at the time of sample acquisition.
This assumption is supported by the fact that the D-period of these B/r cells were only 12
minutes, hence the period of sister loci cohesion is probably less than that. If newly
replicated DNA loci in cells in mid-C-period have escaped sister loci cohesion they will
according to the Home and Away Segregation Model end up with one copy at the position
of replication, that would be off-center for intermediate loci replicated in the mid-C-period,
and the other locus would end up just across the cell center. That goes for the other fork
too, resulting in newly replicated DNA being present at the quarters and the center. Add
some cell to cell variability of the position of the forks and the replicated markers, and you
end up with a quite broad distribution of newly replicated DNA in the cells; exactly as
reported by Koppes and colleagues.
1.4.4 Replication forks can separate
As described a lot of work has been done on determining the position and dynamics of the
replication forks. There is broad agreement on the position of forks; separated or not they
tend to localize to mid-cell or the quarters. When there are more forks, the pattern is less
obvious and poorly investigated. The reports on the number of forks are more divergent for
all growth rates and very often not correlated to the cell cycle making interpretations on
fork associations impossible.
Two experiments using synchronized cells with only one replicating chromosome have
shown that initiation occurs in the middle and that forks migrates in opposite directions
towards the quarter position by visualizing forks directly (Bates and Kleckner, 2005) or
indirectly (Adachi et al., 2006). These results are very convincing if not definitive, leaving
us with no doubt that forks can separate during replication. The question is if that is normal

Dynamics of chromosome segregation
19
or only occurs at low growth rates. The results are contradicted by those of Molina et al..
These results are for faster growing cells though, which might possibly explain the
difference. According to Bates and Kleckner the forks are very dynamic once separated,
and not located at a fixed quarter positions. That would fit well with the idea of forks
tracking along the DNA. This study is one of very few where the actual polymerase has
been labeled and should thus be weighted accordingly. Adachi et al. do not describe the
localization pattern of the SeqA foci in their study.
In this thesis focus is on the simple cell cycle with just one replicating chromosome.
Under these conditions it is not only possible but very likely that replication forks separate.
1.5 Dynamics and organization of the replicating chromosome
The development of these techniques for visualizing DNA loci in bacteria has accelerated
the research in chromosome dynamics tremendously. The following is a mini-review of
most of the important discoveries including the results from this work. Focus is on the
location of chromosomal markers in the cell. The relation of this information to the
dynamics of the replication forks will be summed up in the discussion.
1.5.1 The origin
The pioneering work of Gordon and co workers in 1997 showed that the origins are mainly
located very close to the cell poles (Gordon et al., 1997). This was the first paper where
DNA loci had been visualized in living cells of E.coli, and they used the lacO/LacI-GFP
system. There were however several factors in the study that made the results questionable.
First of all, although the experiments where ground-breaking and original for the time, the
quality of the pictures were not very good compared to later published results from similar
experiments. It is doubtful that they were able to recognize all foci in all cells. But more
importantly the authors did not know the cell cycle parameters. Hence they did not know
how many origins to expect. The fact is that they only observed cells with either 2 or 4 foci
but the cells likely had at least from 4 to 8 origins (Michelsen et al., 2003). Perhaps the
cells were sick or in another way affected by the labeling system used, in which case the
value of the observations are dubious. Supporting that the cells were affected and not
growing normally is the size distribution of the cells. They were grown in LB and thus
expected to be quite large, but reported to be in the range of 1-2 µm, which is a lot smaller
than normal (Begg and Donachie, 1978). Except from one study from the same lab
(Gordon et al., 2002), the result that the origins are located at the cell poles were never
reproduced. No other group has published similar results for E.coli. It has later been shown

Henrik Jørck Nielsen Ph.D.-Thesis
20
repeatedly that the origins normally are located in the middle, at the quarters or at the 1/8,
3/8, 5/8 and 7/8 positions of the cell depending on the number of loci in the cell (Lau et al.,
2003; Li et al., 2002; Niki et al., 2000; Niki and Hiraga, 1998)
Another of the very first experiments where the location of origin and terminus was
determined in growing cells of E. coli used FISH of fixed cells (Niki and Hiraga, 1998). In
this study the origin was found to be located in one end of the nucleoid at cell birth and the
terminus in the opposite end. The terminus was very near the cell pole whereas the origin
was somewhat closer to the quarter position due to the asymmetric position of nucleoids in
newborn E. coli cells. They further found that the origin appeared to duplicate at the
quarter position where after one stayed and the other went to the other quarter. This is in
contrast to later publications where the origin usually duplicates at mid-cell. The terminus
migrated to mid-cell around the time where the origin duplicated. The authors verified the
results in a later publication where they also showed that only the cells growing at a
moderate growth rate (52-55 min doubling time) had the origin towards the old pole when
newborn (Niki et al., 2000). At lower growth rates the cells where born with the origin at
mid-cell. Apparently it localized to mid-cell before initiation of replication. Presumably the
faster growing cells did not ‘have time to’ put the origin at mid-cell prior to initiation. The
results by Niki and Hiraga are quite convincing. They do not determine the cell cycle
parameters however, but nor do they claim to present evidence for any of the chromosome
segregation models.
Later publications on the position of the origin have in general confirmed the above
observations (Bates and Kleckner, 2005; Lau et al., 2003; Li et al., 2002; Nielsen et al.,
2006a; Wang et al., 2005). Li and coworkers showed that origin labeled with the GFP-
parB/parS system separated after initiation with a delay of 1/5 of the generation time and
localized to the cell quarters in cells growing in minimal glucose media supplemented with
low levels of casaminoacids (Li et al., 2002). Even at faster growth rates the origins are at
the quarters when present in two copies (Lau et al., 2003). These cells end up with 4
origins at the 1/8, 3/7, 5/8 and 7/8 positions. The off center positioning of the origin
towards the new pole at cell birth has been reproduced at very slow growth rates (Bates
and Kleckner, 2005). The origin will under these conditions migrate to the cell center
before it is duplicated.
The consensus is thus that in slow growing cells the cell has one origin at the cell
center at cell birth or soon after. This origin duplicates and migrates to the quarters,
perhaps all the way to the poles of the nucloid. When it divides the cell once again has one
origin at or close to the center. Less evidence exists for faster growing cells, but it seems

Dynamics of chromosome segregation
21
that the pattern is very much the same, i.e. they start out having 2 origins, one at each
quarter that duplicates and end up at the 1/8, 3/7, 5/8 and 7/8 positions
1.5.2 The Terminus
Pre-division cells
The terminus is without doubt located in the center of the cell before cell division (Bates
and Kleckner, 2005; Gordon et al., 1997; Lau et al., 2003; Li et al., 2002; Li et al., 2003;
Nielsen et al., 2006; Niki and Hiraga, 1998). The terminus also duplicates at mid-cell and
the two sister copies stay there until and usually beyond cell division (Nielsen et al., 2006;
Niki et al., 2000; Niki and Hiraga, 1998). FtsK is believed to play a role in positioning the
terminus in the middle, supported by the results of Li and coworkers where they showed
that an ftsK C-terminal deletion mutant often did not position the terminus properly (Li et
al., 2003).
Lau et al. reported that the terminus is asymmetrically positioned relative to the middle
of the cell, very often being on the new pole proximate side of the center (Lau et al., 2003).
They showed that the FtsZ-ring assembles at the middle/quarter prior to the migration of
the terminus from the pole/middle, and that the terminus stays on the inner side of the
FtsZ-ring.
Post-division cells
The terminus is found close to the new pole in newborn cells (Niki and Hiraga, 1998) and,
depending on the growth rate, it migrates to mid-cell soon after cell division. It appears
that at faster growth rates this migration happens almost instantly after division (Li et al.,
2003; Niki and Hiraga, 1998) whereas in slower growing cells the terminus can stay at the
end of the nucloid for as much as half a generation (Li et al., 2003).
This migration, often referred to as a ‘jump’ as it is a very rapid movement, has been
reported to coincide with another jump in the cell in a FISH experiment using slowly
growing synchronized E.coli cells (Bates and Kleckner, 2005). The duplicated origin copy
that resided in the same half of the cell as the terminus (i.e. is the new pole half) was found
to locate between the quarter and mid-cell soon after duplication of the origin foci. At the
same time the other origin localized to the quarter in the other half of the cell and the
terminus was still at the pole. When the terminus ‘jumped’ to the middle of the cell, the
origin in the same half of the cell made a smaller jump to the quarter position where after
the two origins where positioned symmetrically at the quarters and the terminus in the
middle.

Henrik Jørck Nielsen Ph.D.-Thesis
22
Assymetric distribution of terminus proximal markers
Wang et al. found that terminus proximal markers were very often positioned
asymmetrically. A locus 200 kb left of the dif site was frequently found close to the pole in
one end of the cell and a locus 200 kb to the right of dif in the other end close to the other
pole (Wang et al., 2005). Both these sites are in the terminus region and fairly close to the
dif site, and they separate very late in the cell cycle. It was surprising to find that two loci
positioned only 400 kb from each other are located in each end of the cell. Naturally the
DNA in between, containing the dif site, has to span the nucloid from one end to the other.
In time-lapse they further showed that these loci migrated from the pole to the middle at
the time of replication and then one stayed in the middle and the other returned to the pole
it came from.
Based on this discovery Wang et al. (2005) proposed a model where the entire left arm
of the chromosome is in the left half of the cell and the entire right chromosomal arm is in
the right half with the origin and terminus in the middle connecting the two halves.
Following initiation the origins migrates to the quarter positions and the replicated left
chromosomal arm goes to the outside of the left origin and on the inside of the right origin
where as the right chromosomal arm goes to the outside of the right origin and to the inside
of the left origin after duplication. This way of organizing the DNA would ensure that the
origin and terminus ends up in at the quarter; or middle of the coming daughter cell. Wang
et al. further proposed that (for example) the leading strand would always end up on the
outside and the lagging strand on the inside. This model is basically a slightly less detailed
version of the Home and Away Segregation Model.
1.5.3 Intermediate markers
There has not been done nearly as much work on the position and dynamics of the DNA
between the origin and the terminus as there has for these two loci in particular. It is
understandable that the position of the origin and terminus are the first to be investigated,
as these were expected to give away the most information. That assumption is possibly
incorrect because these two loci are located very symmetrically in the cell. The localization
patterns of the origin and terminus are quite trivial whereas intermediate loci have turned
out to show more complex and very asymmetric localization patterns. This has very
recently led to insight into the general organization of the entire chromosome as described
in the following.
At slow growth rates the chromosome is organized with one arm in one half of the cell
and the other arm in the other half. The first results indicating this organization was
published 6 years ago by Niki and coworkers. They showed that the cell is born with the

Dynamics of chromosome segregation
23
origin and terminus at mid-cell, the 70’ locus in one end of the cell, and the 20’ locus in the
other end at slow growth (Niki et al., 2000). This was a minor result of the paper and was
not given much attention. Recently similar results have been produced (Nielsen et al.,
2006; Wang et al., 2006). With the origin and terminus in the middle of the cell and the
two arms in opposite sides, it seems that the chromosome is actually organized as a
condensed ring inside the cell; at least at slow growth rates.
1.5.4 The centromere like sequence: migS
If there is a specific sequence responsible for the localization of the origin it has not been
identified. Such a sequence would have to be located outside the minimal oriC sequence as
it has been shown that OriC plasmids carrying the minimal oriC region do not localize in
the cell, and are easily lost without an additional partitioning system as for example the
sopABC present on the plasmid (Niki and Hiraga, 1999).
In a search for a sequence responsible for the positioning of the origins, Yamaichi and
Niki identified a 25 bp sequence in the yijF open reading frame located at 89 min on the
chromosomal map, 5 min clockwise to the origin (Yamaichi and Niki, 2004). Without this
sequence, named migS (for Migration Site), origins tend to be much closer together in cells
with two separated origins. Other than that it does not have any significant effect on the
cell cycle and growth rate.
Fekete and Chattoraj have further shown that cells segregate the 89’ locus earlier than
the origin and segregate this locus further out (Fekete and Chattoraj, 2005). However
without the migS sequence this locus segregates in line with the origin. These results too
indicate a role for migS in origin segregation, but are in direct contrast to our own results
(paper II). We usually find that the 89’ region is delayed in its segregation.
So far no other function has been found for this seemingly redundant site, and its role
and importance in the chromosome segregation remains elusive.
1.5.5 The timing of segregation
There has not been put much effort into the determination of the timing of the segregation.
That may be surprising as this is quite important and could reveal a lot about which of the
segregation models is closer to the truth.
Of course loci can not segregate before they are actually replicated. Either they
segregate right after replication or some time after. Exact knowledge of the replication
cycle is therefore imperative in order to learn anything about the timing of segregation.
Bates and Kleckner did an attempt to relate the timing of segregation to the replication.
They used synchronous cells of known replication cycle and found that markers segregated

Henrik Jørck Nielsen Ph.D.-Thesis
24
some time after replication, thus supporting a Sister Cohesion Model. Unfortunately they
only looked at 2 markers beside the origin and terminus. Hence their conclusion that what
they see is Sister Chromosome Cohesion is doubtful. That kind of cohesion would mean a
longer delay between replication and segregation at earlier markers and a shorter delay for
later markers. We do not think that 2 markers outside the origin/terminus region are
enough to determine if there are such differences in the replication-segregation delay.
Furthermore the C and D periods determined for the strain they used are very different
from what is normally seen for that strain (F.G. Hansen, personal communication), so
possibly the timing of replication was not known in the study by Bates and Kleckner
(cooper microcommentary ref ??).
In our first paper we have looked at the timing of segregation of 14 markers (Nielsen et
al., 2006a). We used 14 different strains with known cell cycle parameters. This study too
revealed that there is a delay between replication and segregation. Due to the high number
of loci examined we were able to determine that this segregation delay is constant for all
markers, thus supporting the Sister Loci Cohesion model and not the sister Chromosome
Cohesion model. In fact this study was the one that lead to the Sister Loci Cohesion
Model. This segregation pattern was also seen at higher growth rates with continuous
replication (see section 2.4). Hence it is clear that the chromosome is segregated
progressively at slow and moderate growth rates.

Dynamics of chromosome segregation
25
2 Results
In the following the most important results of my 3 year study is presented. The major
results are also described in the accompanying papers (I, II, and III). The results are
presented more or less in the chronological order in which they were obtained. Some of the
results have already been mentioned in the introduction and some of them will be
discussed next in the discussion. However I feel it necessary to explain exactly what I have
been doing in this three year Ph.D. project, including some of the minor and/or preliminary
results.
2.1 Counting and measuring cells
When I began this work most chromosome labeling studies were focused on labeling the
origin and terminus of replication and determining the localization patterns of these
markers. I wanted to expand the number of sites to cover the entire chromosome in order to
get a better and more detailed picture of the chromosome organization, and I also wanted
to investigate the localization of these markers in the cell at many different growth rates
with varying number of chromosome equivalents optionally adding different mutations to
the strains too. The main challenge in order to do this was not the creation of the strains
nor growing them and taking pictures, but rather the very time consuming job of measuring
the cells and counting the foci within.
The minimum number of cells that needs to be counted for a given experiment (one
marker at one set of growth conditions) is around 1000 to get decent results but preferably
1500 or more. Using manual measuring a dataset of 1000 cells takes in the range of 3-5
hours. Hence a dataset consisting of 14 different markers as the one published in the
accompanying paper (II) would take around 60 hours; and 90 hours or more if 1500 cells
per marker are to be measured. That is just for one set of growth conditions. If one wants
to do different growth rates and/or specific mutations too the amount of time spent
counting and measuring cells is endless.
So I decided to develop a fully automatic computerized method for counting and
measuring cells and their foci. This was my first objective of this study. Instead of creating
a new program from nothing I decided to use one of the advanced digital image analysis

Henrik Jørck Nielsen Ph.D.-Thesis
26
programs that allow programming of macros connecting the relevant functions of the
software. I chose Image Pro Plus which is a very useful and versatile program containing
programmable features that can outline, count and measure objects saving me a lot of time
that I would otherwise have to use programming these functions myself.
A description of the macro I made is found in the accompanying paper (I). It is capable
of automatically identifying the cells from phase contrast images and measuring the length
and width of them. Subsequently it goes through the fluorescence signal from each cell
individually counting and measuring the foci within. The algorithms and procedures used
for finding the foci are very effective identifying more than 99% of all foci. Closely
located pairs of foci are resolved using a separate procedure. The macro also inspects cells
for invagination of the cell membrane and gives invaginated cells a score reflecting the
degree of invagination. This is very useful for isolating the dividing cells in the resulting
dataset and analyzing these separately.
The macro was validated by comparing the result of counting the same dataset
manually and automatically. As presented in the accompanying paper (I), the macro does a
much better job at measuring cells consistently than by measuring by hand. Not
surprisingly manual counting is best for identifying the foci, but nevertheless the macro
identifies 99% of them. Furthermore the macro is more consistent in deciding whether or
not very faint and doubtful foci should be counted or not where this decision depends very
much on the person doing the inspection when measuring cells manually. Most importantly
of course is the speed of the process. The macro counts 1000 cells in 3-5 minutes
depending on the quality of the pictures, whereas manual counting of the same number of
cells takes 3-5 hours. Hence 14 different datasets (for 14 different markers) of 1500 cells
each is done in an hour or so; a job that would take weeks by manual counting.
2.2 Optimizing the P1-par labeling system
The labeling system used to map the intracellular position of markers in this study is the
GFP-P1-ParB/parS system developed by Li at al. (Li et al., 2002). The original procedure
as they reported it was to induce the GFP-ParB from the upstream lac promotor at 100 µM
IPTG for three hours before sampling. I wanted to change this pulse induction to a lower
and continuous induction, first of all because we did not know how the high induction
affects the balanced growth of the cells, secondly because we were experimenting with
growing the cells in a chemostat where continuous induction of course is desirable, and
finally because continuous induction is better suited for long term time-lapse studies.

Dynamics of chromosome segregation
27
While experimenting with the best choice of induction level I realized that the total
number of foci observed was much higher when inducing continuously with 20 µM IPTG
or lower compared to the 100 µM pulse induction. It turned out that the 100 µM pulse
induction made very large foci often containing 2 or more of the labeled loci. As presented
in the accompanying paper (II) the observed number of foci in the cells got very close to
the actual number of loci present when induction was absent (0 µM IPTG) relying only on
the basal expression from the lac promoter. We already knew this was not the case when
pulse inducing with 100 µM IPTG (compare the results in Nielsen et al. (2006) with Li et
al. (2000)). Thus further experiments were carried out without IPTG induction.
The presence of fewer foci is not a result of fewer loci or less DNA in the cells in
general. That would be very unlikely as the growth rate of the cells is not affected by the
induction. Cells can grow at full (>100 µM IPTG) induction continuously at normal
growth rate. Furthermore flow cytometry analysis showed similar DNA/mass ratios in the
induced and non-induced cells. Therefore the only possible explanation is that two or more
loci stick together in single foci.
This conclusion was strengthened when looking at the patterns of foci localization,
which are very different between the two induction strategies. As seen on Figure 2.1, the
high level short term induction creates fewer foci (less blue dots in the figure). In the larger
cells were two foci are expected very often only one focus is observed in the center of the
cell. This turned out to be a general phenomenon: When two or more loci stick together in
one focus at high GFP-ParB concentrations the focus locates to the cell center (or
0
0.5
1
1 2 3 4 5 6
Cell Length (µm)
Rel
ativ
e fo
ci p
osi
tio
n
0.5
1
0
0.5
1
1 2 3 4 5 6
Cell Length (µm)
Rel
ativ
e fo
ci p
osi
tio
n
0.5
1Figure 2.1 Stickiness.
The number and pattern of observed foci are shown
under conditions with and without stickiness for the
same strain. A strain expressing GFP-P1-ParB with
a parS site inserted at 21’ on the chromosomal map
was grown in the absence of IPTG (upper panel) or
with 100 µM IPTG (lower panel) for 6 generations
in ABT glycerol minimal media at 32 degrees. The
number of foci and their relative position on the
long axis is shown as function of cell size. Cells
containing one focus are represented with a black
dot and cells with two foci with blue dots. 2000
cells are plotted in each panel.

Henrik Jørck Nielsen Ph.D.-Thesis
28
alternatively the cell quarters for higher growth rates, data not shown). We call this
phenomenon ‘stickiness’. Stickiness is an interesting effect in itself but unwanted when
investigating the normal position and segregation of markers. Therefore chromosomal
labeling studies were done under conditions without stickiness. An investigation on
stickiness has begun and the preliminary results is presented in section 2.7.
2.3 Time-lapse studies and flowcells
In parallel to the still-image analysis I have experimented a lot with time-lapse studies. In a
time-lapse study a few cells sitting on the slide is followed over time by photographing
them at regular intervals. Time-lapse has the advantage that it allows us to track the
movement of specific foci inside the cells directly. It is not necessary to infer the dynamics
of the foci from statistical analysis of a lot of snap shot images. A major disadvantage
though is that it is time consuming and very few cells can be analysed at a time limited by
the small size of the field.
Most time-lapse studies in the field of chromosome dynamics are done on agarose
slabs. Cells are grown to balanced state in a liquid culture and then transferred to a 1-2 mm
thick agar slab on a microscope slide and covered with a cover glass. The slab contains the
same media as was in the liquid culture and cells will thus continue to grow on the slide,
for a while at least. The slide is mounted under the objective and the growth of the cells
monitored.
There are several major problems with this technique. First of all and most importantly
the cells will get out of balanced growth soon after they are put on the slab because the
oxygen concentration in the slab will drop and quickly become limiting. The nutrients will
last longer but will eventually run out too. The temperature is another problem but can be
controlled by heated stages. The result is that cells often only grow on the slide for a few
generations (depending on the media) and then stop.
A few generations are not enough to do extensive studies on the dynamics of foci
inside the cells. Furthermore, because the cells are not balanced, the cell cycle parameters
will not be known and the relation between replication and movement of foci in the cell
can not be established. Therefore I decided to experiment with doing continuous time-lapse
of cells growing on a fixed surface with fresh media constantly flowing past the cells
providing balanced growth conditions and cell growth for many generations.

Dynamics of chromosome segregation
29
2.3.1 Designing a flowcell
In biofilm research the use of flowcells is widespread. A flowcell is a chamber with a tube
going in and out of it and a glass slide on one side functioning as cover slide so that the
flowcell can be mounted on a microscope. Fresh media is lead into the chamber through
the tubing and cells grown on the inside of the glass surface. Unfortunately the
commercially available flowcells are unsuitable for phase contrast microscopy.
Commercially flowcells are designed for confocal or differential interference contrast
microscopy. They are too thick to do phase contrast or brightfield microscopy because the
condenser collector lens can not get close enough to the focal plane. Furthermore they only
have one glass side; the bottom is made of plastic with a refractive index incompatible with
a phase contrast or brightfield microscopy setup.
So I had to design my own flow cell that was thinner and made entirely of glass. After
a few unsuccessful constructs I realized that this was a very simple task. I simply bend the
ends of a capillary glass tube and glued it to a glass cover slide (Figure 2.2). The cells grew
on the inside of the glass tube and fresh media could be pumped through the rubber tubing
mounted on the bend ends of the glass tube. Immersion oil was applied directly to the glass
tube and the whole thing mounted on the microscope stage. Cells were injected through the
mounted rubber tubes with a syringe and needle. The capillary glass tube was coated on
the inside with poly-L-lysine before being glued on so that the injected cells would attach
to the glass surface. After injecting the cells the pump was turned on pumping fresh media
through the tube. The temperature was kept constant at 32 degrees in the microscopy room
to keep the media from cooling down the stage.
This construct worked great and allowed the monitoring of cells for many generations.
Figure 2.2 Flowcell construct.
The flowcell used for time-lapse studies. An 8 cm
capillary glass tube was heated 1 cm from each end
and bend to a 45 degree angle. The glass tube was
then glued to a glass slide at the ends and
immersion oil was put between the tube and the
glass slide at the middle. Rubber tubing was
mounted at the ends of the glass tube and
everything disinfected before balanced cells were
injected into the flowcell using a syringe and
needle. The flowcell was then mounted on the
microscope and fresh media was pumped though it
continuously.

Henrik Jørck Nielsen Ph.D.-Thesis
30
2.3.2 Short term time-lapse
Unfortunately it turned out that time-lapse was not all that great after all. While just
looking at the cells growing in the flowcell I observed that foci were very mobile and
moved a lot inside the cells. Therefore I did some very short term time-lapse experiments.
It turned out that foci are so mobile inside the cell that the position of a focus can change
as much as half a micron in seconds (see paper II). Hence when doing time-lapse
experiments with e.g. 5 minutes between the images the significance of the recorded
position of the foci is very low because they might very well have been located elsewhere
just seconds before or after. With this discovery the need of a good statistical basis and a
large number of cells increases dramatically and the value of time-lapse experiments
becomes dubious. Therefore we decided to stop time-lapse experiments and switch entirely
to statistical still image analysis of large number of cells.
2.4 Progressive chromosome segregation
Using the previously described macro I analyzed 14 strains with a parS insertion at 14
different chromosomal positions. The insertion coordinates were 4’, 15’, 21’,28’, 33’, 41’,
45’, 54’, 64’, 74’, 79’, 84’, 89’, and 93’. The strains were created by Young Fang Li at Dr.
Austin’s laboratory. I grew the strains in ABT glycerol minimal media to get a DNA
replication cycle without overlapping C and D periods, thus keeping the chromosome
segregation pattern as simple as possible. The results clearly showed that the chromosome
is segregated progressively and also gave clues to the general organization of the
chromosome as described in the accompanying paper (II). Furthermore it was shown that
there is a constant delay between replication and segregation of markers. This is what we
call sister loci cohesion.
The result of a similar series of experiments done in ABT glucose minimal media
supplemented with 0.05% casaminoacids is shown in Figure 2.3. These results have not
been published. There are clear similarities between the distributions of loci under the two
different growth conditions. The origin and its proximal markers tend to locate further
towards the pole than later replicated markers for example. The asymmetry of intermediate
markers is also evident, although perhaps to a lesser extent.

Dynamics of chromosome segregation
31
Figure 2.3 Positions of chromosomal loci in cells growing in glucose media.
The relative positions of foci are presented for cells with the P1 parS at the indicated positions on the chromosomal map (central
panel). Foci from cells with one focus are represented by black dots showing the distance to the nearest pole, foci from cells
with two foci are represented with a blue dot (the focus which is closest to a pole) and a red dot. Foci from cells with three or
four foci are shown with orange dots (the foci nearest to a pole) and green dots. All cells are oriented so that the sum of
distances from the pole to each focus in every cell is lowest. In all panels data from 1400 cells are presented. The strain labeled
at 3.8’ grew poorly in the glucose media and data from this strain is therefore omitted.

Henrik Jørck Nielsen Ph.D.-Thesis
32
One major difference though is the much more compact distribution of markers in the cells
growing in the richer media. The markers seem to be constrained to smaller and better
defined areas of the cell at the higher growth rate. This could be a result of more DNA
content of these cells that have a
higher DNA replication activity and a
need for better organization of this
DNA.
Flow cytometry analysis showed
that the cells have a C period of 55
minutes and a D period of 43 minutes
at a generation time of 55 minutes.
Thus DNA replication is initiated 12
minutes after cell division at the same
time the previous round of replication
is terminated and cells have from 2 to
4 origins. The timing of segregation
compared to replication for the
different markers is shown in Figure
2.4. As with the glycerol cells a
progressive segregation is observed.
Furthermore the delay between
replication and segregation (sister
Figure 2.4 Progressive segregation.
The timing of segregation is shown for cells grown
in glycerol (upper panel) and glucose (lower panel).
The purple line indicates the time of replication of
the chromosomal markers according to the distance
from the origin (x-axis) as found by flow cytometry.
The dots are the average time of segregation for the
markers investigated. For the glucose experiment,
loci going from two to four copies are plotted in the
lower part (the first generation) and loci going from
one to two copies are plotted in the upper part
(second generation). The black line is the
segregation trendline. Outliers as the 79’ and 33’
markers and for glycerol the 89’ marker too do not
contribute to the trendline. The hatched lines
represent the previous and following rounds of
replication and segregation.
Glucose media
1
Replication
Separation
0
1
2
-50 -30 -10 10 30 50
Distance from origin (minutes)
Glycerol media
Cel
l ag
e (g
ener
atio
ns)
Replication
Separation
0
1
2
-50 -30 -10 10 30 50
0
Glucose media
1
Replication
Separation
0
1
2
-50 -30 -10 10 30 50
Distance from origin (minutes)
Glycerol media
Cel
l ag
e (g
ener
atio
ns)
Replication
Separation
0
1
2
-50 -30 -10 10 30 50
0

Dynamics of chromosome segregation
33
loci cohesion) seen in the glycerol experiment is also reproduced. The average delay was
0.17 generations (20 minutes) in the glycerol experiment and 0.22 generations (12
minutes) in the glucose experiment. These values are quite comparable which may reflect
the nature of this sister loci cohesion. Exceptions to the general delay are the marker at the
terminus and the 79’ locus. The exception at 89’ in glycerol behaves normal in the glucose
experiment, whereas the 79’ locus segregates early in both experiments. The terminus
segregates very late as expected of this region.
Combining these results show that the chromosome is progressively segregated both at
slow and moderate growth rates and that there is a delay between replication and
segregation of about 20% of the cell cycle. It is very difficult to claim chromosome
cohesion for extensive parts of the chromosome in the light of these results and the sister
chromosome cohesion model can therefore not be correct.
2.5 Developing a pMT1-par labeling system
A major disadvantage of the P1-par labeling system compared to others is that it only
allows labeling of one marker or alternatively more markers but all with the same color.
When we observed the asymmetric nature of the localization of intermediate markers in the
cell (Paper II) we realized that it would be very useful to be able to record the position of
one locus with respect to another. Hence we needed an additional labeling system with its
own specificity and its own color.
For this we cloned the partitioning system of the pMT1 virulence plasmid from
Yersenia pestis. This system is very similar to the partitioning system of the P1 plasmid. It
consists of the same three elements, the parA and parB genes and a parS site. It has been
shown that the pMT1 and P1 partitioning systems are functionally compatible meaning
that the presence of one of them in the cell does not affect the function of the other
(Youngren et al., 2000). Furthermore substituting the ParB in one system with the
homologue protein from the other system, or substituting both the ParB and ParA, results
in non functional partitioning. These results suggest that the ParB protein of the pMT1
system does not bind the P1-parS sequence and vice versa, and a pMT1-par based labeling
system is therefore expected to be compatible with the P1-par based system.
We constructed a GFP-pMT1-parB fusion protein and expressed it in a strain
containing a pMT1-parS site. We deleted the 23 N-terminal amino acids of ParB similar to
the 30 amino acids deletion in the GFP-P1-ParB fusion protein which makes up the ParA
binding domain. The pMT1 fusion protein was able to form foci in the pMT1-parS
containing strain. Furthermore when expressed in a P1-parS containing strain no foci were

Henrik Jørck Nielsen Ph.D.-Thesis
34
formed. No foci were observed when expressing the GFP-P1-ParB protein in a pMT1-parS
strain either. Hence the GFP-ParB fusion protein of one system does not bind the parS site
of the other. The possibility that the ParB proteins could bind to each other had to be
investigated too. The binding of ParB protein to the cognate parS site consists of an initial
binding of one ParB dimer to the parS site and subsequent binding of additional ParB
proteins to the first ParB protein along the DNA creating a large linear protein-DNA
complex. If the ParB protein of one system is able to bind the ParB proteins of the other,
the presence of both in the same cell could lead to mixed binding of both proteins to the
same parS site even though the ParB proteins are specific with respect to initial parS
binding. We investigated this by expressing a CFP-P1-ParB and a yGFP1-pMT1-ParB in
the same cell containing either the P1-parS site or the pMT1-parS site or both. When only
one type of the parS site was present the foci formed were of the color corresponding to
the cognate fusion protein. When both types of the parS were present distinguishable foci
of the two different colors was observed. If the ParB proteins were able to bind each other
the foci would be of mixed color. As this was not observed we concluded that the two
labeling systems are completely compatible.
See supplementary material of Paper III for details on the construction of the pMT1-
par labeling system.
2.6 Separate replichores localize to separate cell halves
Having developed and validated an additional labeling system the next step was to look at
cells labeled at two different sites. Several different combinations are potentially
interesting, but in the light of the results of Paper II we chose to look at markers on
opposite sides of the origin. In Paper II we show that intermediate markers on both sides of
the origin are very asymmetrically positioned in the cell; either one focus off-center or in
the presence of two, one focus close to the pole and the other at the cell center. The
question of course was then if the intermediate markers on opposite sides of the origin-
terminus axis would then localize to different ends of the cell, or if their localization was
independent of each other.
It turned out that loci on one arm of the chromosome are indeed localized to one half of
the cell and loci on the other half is located in the other half of the cell. This result is
described in Paper III. When we labeled loci on the same chromosomal arm the
1 yGFP is a GFP mut2 variant with a red-shifted excitation spectrum and a normal emission
spectrum. The red.shift makes it suitable for use together with CFP. See supplementary material of
Paper III for details.

Dynamics of chromosome segregation
35
colocalized to the same cell half, and when labeling loci on opposite chromosomal arms
they localized to separate cell halves. After duplication when 2 of each locus are present in
the cell they often localized on separate sides of the quarters with a strong bias towards a
tandem configuration. That is a left-right-left-right chromosome arms configuration.
At the same time our paper was accepted Wang and coworkers published a similar
paper presenting basically the exact same results as ours (Wang et al., 2006). The
conclusion was also the same, that the chromosomal arms are separated to distinct cell
halves in the cell. Wang et al. further showed that the original configuration was very often
maintained in the tandem configuration so that a left-right orientation results in a left-right-
left-right (chromosome arms) configuration and only rarely in a right-left-right-left
configuration. This fits with our Home and away Model.
2.7 Stickiness
As described previously we have found that high levels of GFP-P1-ParB cause a reduction
in the number of observed foci. We call this phenomenon stickiness because we believe
that what we see are pairs of loci sticking together as I will argue in this section. The
phenomenon is undesirable in the chromosome labeling studies done as part of this thesis
and the experiments have therefore been carried out at levels of GFP-ParB protein where
stickiness is not present, but it is an interesting feature of the ParB/parS system that could
be important in the original function of plasmid partitioning and might also be useful in
chromosome dynamics studies. Therefore we have begun an investigation of the
phenomenon.
Two possibilities can be imagined to cause a reduction in the observed number of foci.
Either there are fewer loci present in the cell or loci stick together. In other terms, either
DNA replication or chromosome segregation is delayed or blocked. It is likely that bound
ParB protein can block the replication forks and thus cause a reduction in the number of
loci. It has recently been showed that the tet repressor/operator system is capable of such
tight binding (Possoz et al., 2006). To investigate if the replication is blocked under high
concentrations of ParB protein we analyzed non-induced and fully induced cells by flow
cytometry. The resulting cytograms showed that the DNA to mass ratio was the same for
the induced and non-induced cells. Furthermore the growth rates of induced and non-
induced cells are the same. Thus initiation and progression of replication occurs normally.
If replication is blocked the cells would expect to die when induced as reported for the tet
system. That does not happen when stickiness is induced; the cells grow fine.

Henrik Jørck Nielsen Ph.D.-Thesis
36
The other possibility that segregation is delayed must then be correct. That implies that
a specific mechanism responsible for DNA segregation and independent of replication is
present, which fits fine with our observation of sister loci cohesion. Why then is blocking
of DNA segregation not lethal? One possible explanation is that the segregation block is
released when the next round of replication reaches the block. As the bound ParB can not
block the replication fork any bound ParB must be peeled of by the replication fork. Hence
any ParB blocking segregation bound in the trail of replication will be removed in the next
round of replication. Segregation will then segregate two pairs of duplex molecules (Figure
2.5).
The delay of segregation also means that induced cells are larger than normal cells. As
mentioned the DNA/mass ratio is the same with and without induction but the absolute
DNA content is higher and the cells are bigger when stickiness is induced. As the growth
rate and the initiation mass are unaffected the only possible explanation is a prolonged D-
period in the induced cells. This has been confirmed by flow cytometry. A prolonged D-
period means that cell division is delayed which in this case is probably caused by the
delay of segregation.
The stickiness reported here was observed for the P1 par system. Surprisingly the very
recently developed pMT1 system does not show this effect when induced at high levels.
This can be seen in Figure 2.6. The P1 parS and pMT1 parS sites were inserted at the same
Replication
Segregation
Replication
Segregation block
Block release
A B
Full separation
Replication
Segregation
Replication
Segregation block
Block release
A B
Full separation
Figure 2.5 Blocking segregation.
Normal replication and segregation is
shown in (A) and a proposed model for
segregation blocking by stickiness in (B).
parS bound GFP-ParB is shown as green
balls. Under normal conditions a limited
number of proteins bind the DNA (A) and
the two sister strands can segregate
normally. When over expressed, too many
ParB proteins bind the DNA (B) and makes
the two sister strands glue together unable
to separate (B; green bars). Finally when
the next round of replication reaches the
block, the ParB proteins are peeled of and
the daughter strands can separate. These
daughter strands are now already
duplicated and segregate as double
duplexes. The red bars symbolizes sister
loci cohesion.

Dynamics of chromosome segregation
37
position in two different strains and the cognate GFP-parB protein expressed from a
plasmid. At low expression, without adding IPTG, the observed patterns of foci
localization in the cells are essentially the same (compare upper panels). At full induction
(100 µM IPTG) the sticking together of pairs of foci at the center of the larger cells is
easily observed for the strain with P1 GFP-ParB/parS. But for the strain with a pMT1 parS
site the pattern is unchanged at the high induction. Thus the pMT1 GFP-ParB does not
cause stickiness. This result supports the findings of Youngren et al. that the pMT1-ParB
does not cause silencing of nearby genes like the P1-ParB does (Youngren et al., 2000). In
the light of this result the pMT1 system becomes the best choice in future single color
studies because the possibility of expressing the GFP-ParB at higher levels gives brighter
foci without risking that they stick together. When doing time-lapse studies this system
will also be superior; not only to the P1 based labeling system but also to the tet and lac
operator/repressor based system. That is because the problem of bleaching of foci caused
by several successive exposures in time-lapse can be compensated by using the pMT1
system at high levels of GFP-ParB. This is not possible with P1-ParB as it will delay
1 2 3 4 5
Rel
ativ
e fo
ci p
osi
tio
n
1 2 3 4 5 6
Cell Length0
0.25
0.50
0.75
0.25
0.50
0.75
1P1 ParB/parS
0 µM
IPT
G
pMT1 ParB/parS
100
µM IP
TG
1 2 3 4 5
Rel
ativ
e fo
ci p
osi
tio
n
1 2 3 4 5 6
Cell Length0
0.25
0.50
0.75
0.25
0.50
0.75
1P1 ParB/parS
0 µM
IPT
G
pMT1 ParB/parS
100
µM IP
TG
Figure 2.6 The pMT1 system is not sticky.
The relative position of foci were measured for two different strains: One with a P1-parS insertion at 21.3’ and expressing
the GFP-ParB protein of P1 (left panels) and another with pMT1-parS inserted at 22.1’ expressing the GFP-ParB of pMT1
(right panels). The upper panels show the distribution of foci at low ParB concentration (no induction of the lac promoter),
and the lower panels show the distributions at high concentration of the ParB proteins (full induction, 100µM IPTG).
Stickiness is observed only for the strain with a P1-parS site expressing GFP-P1-ParB at full induction. The cells were
measured using the macro described in Paper I. 2000-2300 cells were counted for each panel.

Henrik Jørck Nielsen Ph.D.-Thesis
38
segregation or with the tet repressor/operator system as it will cause replication to get
blocked.
The fact that high levels of GFP-P1-ParB cause sister loci to stick together might very
well be functionally important for the original role of this protein in plasmid partitioning.
Many models of par mediated plasmid partitioning suggest that pairs of plasmids are held
together at the central plane of the cell before they are actively pulled apart by the ParA
proteins. The fact that the GFP-ParB of P1 is capable of holding sister parS loci together
supports such models.
So far stickiness has been an unwanted feature of the GFP-ParB/parS labeling system
and experiments have been carried out at non-sticky levels of the GFP-ParB protein, but
stickiness could potentially be very useful in chromosome dynamics studies. One could
imagine an experiment where segregation is blocked at one site by stickiness and the fate
of another locus located before or after the blocked site monitored. This other site could
then be labeled by the pMT1-par labeling system that is not sticky.

Dynamics of chromosome segregation
39
3 Discussion
Most relevant published data in the area of chromosome segregation has been presented in
the first chapter. It is evident that there are many different opinions on how the
chromosomes segregate; perhaps even more opinions than data justifies. Much of the
confusion is due to significant divergence on the interpretation of the presented data by
various scientists.
The results of my three year ph.d. project has helped clarify some of the major
questions in the field. The three major results of this work, as represented by the three
accompanying papers, are the development of a fast and reliable automatic method for
measuring cells, the finding that chromosome segregation is progressive and finally that
the chromosome of slow growing cells is organized with each chromosome arm in separate
cell halves. Minor results like the development of an additional labeling system and the
finding of sister loci cohesion will hopefully become important in future research in the
field. The implications of these results and how they affect our view on chromosome
dynamics is discussed in the following.
3.1 A model for chromosome segregation
A model for chromosome segregation should ideally apply to all growth rates. However as
the knowledge on chromosome dynamics is still limited and the cell cycle of E.coli can be
very complicated we found it a good idea to initially attempt to make a basic model valid
for slowly growing cells with a simple cell cycle. Hence we decided to do a thorough study
of chromosome dynamics using slowly growing cells with no overlapping replication
cycle. In these kinds of cells we could follow the segregation of two replicated
chromosomes without the influence of subsequent rounds of replication simplifying the
interpretation of the results. The resulting model may not be precise or detailed enough to
describe the chromosome dynamics of E.coli cells at all growth rates, but will ideally form
a basis for future studies on chromosome dynamics of fast growing cells.

Henrik Jørck Nielsen Ph.D.-Thesis
40
3.1.1 Progressive segregation
In this thesis I chose to use the process of replication as reference in my effort to determine
and describe the process of chromosome segregation. The process of replication is a
logical basis since the duplication of the chromosome by replication is an explicit
requirement for segregation. This may seem trivial but I find that quite many studies of
chromosome segregation fail to relate results to the DNA replication cycle of the cells,
which I think is a mistake.
This relationship between the process of replication and the process of segregation can
be divided into a temporal relationship and a spatial relationship. That is WHEN the
chromosomes are segregated compared to when they are replicated and from WHERE they
are segregated compared to where they are replicated. With this information a quite
detailed model on chromosome segregation can be established, and certainly the existing
models can be evaluated by it. The central factory models for example predict that
replication and segregation is coincident in time and space (at the cell center), whereas the
Sister Loci Cohesion Model predicts a considerable delay between replication and
segregation.
To address the temporal relationship between replication and segregation we analysed
14 strains labeled at 14 different sites evenly spread on the chromosome (Paper II). We
determined the timing of separation for all 14 loci by finding the cell size class where half
of the cells had one focus and the other half two foci and converting this cell size to cell
age. As presented in the accompanying paper for cells growing in glycerol and further
presented in section 2.4 for faster growing cells, loci clearly separate progressively from
origin to terminus. Furthermore the speed of the progression of chromosome segregation
seems to be linear in time and at a pace similar to that of the replication. This is true for
cells growing in glycerol as well as glucose thus covering a growth rate interval from
I=C+D to I=C. It will be interesting to see if this is true at the fastest growth rates too.
As stated in the accompanying paper (II) about progressive chromosome segregation a
progressive segregation at a rate comparable to the rate of replication but delayed with
respect to it means that segregation and replication are processes separated in time. It is
thus likely that these are entirely independent processes and not related as proposed by the
central factory models. Replication leaves the duplicated DNA duplexes linked together
somehow and they stay linked together until the segregation process separates them. The
SeqA protein is a possible candidate for linking together the newly replicated DNA. The
period of sister loci cohesion is important for the cell as known and well described repair
systems relying on homologous recombination (repairing of double strand breaks for
example) need both daughter duplexes to do the repair. We have shown that segregation of

Dynamics of chromosome segregation
41
loci is very efficient; separated loci do not cross back across the cell center (Paper II).
Hence the period of sister loci cohesion is probably the only time window where
homologous recombination between daughter strands can take place. Whether this is the
actual function of the delay period between replication and segregation is not known at
present.
3.1.2 Separate chromosome arms
The discovery of a progressive segregation and the determination of its timing with respect
to replication is a major breakthrough in the field of chromosome dynamics. With the
temporal relationship established we only need to establish the spatial relationship to have
a full description of the process of chromosome segregation. This is slightly more difficult
to do though as it requires knowledge about the position of replication as well as the
position of all chromosomal loci, preferably both before and after segregation.
We do not know the exact position of replication in the cell and it has not been studied
in this thesis. What we do know is that there is evidence that markers stay where they were
after replication. That is implied from the observations that the single foci in seen in cells
that has not replicated and the single foci seen in cells that have (but have not segregated)
are apparently positioned similarly in the cell (Paper II). This led us to conclude that
markers stay where they are replicated until segregation takes place. However since the
intermediate markers then seem to replicate at a non-central position and we would expect
replication to be symmetrical around the cell center (that is either a central factory or
separated forks on each side) we investigated if intermediate markers from opposite
chromosomal arms are positioned in separate cell halves. As reported in Paper III this is
indeed the case. Extensive analysis show that this arrangement apparently spans all the
way from origin to terminus. This striking and very surprising discovery was also made by
Wang and coworkers almost at the same time as we did (Wang et al., 2006).
This result supports, or rather explains, the observation of separating replication forks
in slow growing cells (Bates and Kleckner, 2005; Yamazoe et al., 2005). A central factory
can be proposed for this chromosomal organization, pulling the DNA in from both sides.
Wang et al. (2006) do in fact propose such a model. However we disagree as it does not fit
with our observations of sister loci cohesion. Newly replicated loci cohere for a short
period and our results suggest that this cohesion takes place off-center for the intermediate
loci. Thus it is more likely that the intermediate markers are replicated off-center which
would result in separating replication forks as observed.
It should be noted that separating forks has not been reported at higher or even
moderate growth rates. In fact one study suggests the opposite; that several forks go

Henrik Jørck Nielsen Ph.D.-Thesis
42
together in super-factories at faster growth rates (Molina and Skarstad, 2004). The
separation of the two chromosome arms to separate cell halves has also only been observed
at slow growth rate. In fact it seems that this organization is not present at higher growth
rates (personal observations, not shown). Hence it is possible that replication and
segregation follows very different schemes at different growth rates.
3.1.3 A model for chromosome segregation
In general the Capture-Extrusion model has received more support (Gordon et al., 2002;
Koppes et al., 1999; Lau et al., 2003; Niki et al., 2000; Niki and Hiraga, 1998; Onogi et
al., 1999; Roos et al., 2001; Roos et al., 2001) than the Sister Chromosome Cohesion
model (Bates and Kleckner, 2005; Hiraga et al., 2000; Sunako et al., 2001). However most
of these studies have not compared the two models directly. Often one is under the
impression that presented data might as well be interpreted in favor of the competing
model. Indeed the data from Hiragas lab used to support the Sister Chromosome Cohesion
model has been shown to support the Extrusion-Capture Model equally well if
reinterpreted (Roos et al., 2001).
Our finding that the chromosome is organized with its two chromosome arms in
separate cell halves is by itself compatible with both models. The recent discoveries that
the replication forks split up and migrate to separate cell halves however are not (Bates and
Kleckner, 2005; Yamazoe et al., 2005). Of these two models only the Sister Chromosome
Cohesion Model is compatible with separating forks.
Our result that the chromosome is progressively segregated on the other hand is clearly
not compatible with the Sister Loci Cohesion Model, and because of the observed period
of sister loci cohesion it is not compatible with the Extrusion-Capture Model either in its
present form. Therefore we have developed a new model that is in accordance with these
latest results. This model can be separated into a Sister Loci Cohesion Model and a Home
and Away Segregation model as described in section 1.3.
A figure illustrating our current view on chromosome segregation has been presented
in Paper III and is reprinted here for convenience as Figure 3.1.
It is important to emphasize that although the Extrusion-Capture Model and the Sister
Chromosome Cohesion Model are now discarded because of the results hereby presented
both models were quite close to the truth. The progressive segregation predicted by the
Extrusion-Capture Model was indeed correct, and only by having precise information
about the timing of replication and segregation is it possible to show that these processes
are not coincident. Furthermore one should be very careful to discard the idea of a central

Dynamics of chromosome segregation
43
replication factory. There is no central factory at the slow growth rates that we and others
have used (Wang et al., Bates and Kleckner, Yamazoe et al.) but there is no evidence that
there isn’t at higher growth rates.
Though the extensive cohesion stated by the Sister Chromosome Cohesion Model is
incorrect it is easy to see why it has been proposed. The sister loci cohesion period that we
found is quite long (20% of the cell cycle), and thus without a precise and detailed analysis
of the chromosome segregation it is easy to misinterpret data as extensive cohesion, as for
example it was the case when Bates and Kleckner looked at only 4 markers (Bates and
Kleckner, 2005).
Our results thus show that both models are partially correct and explain why evidence
supporting both has been available. The chromosomes are progressively segregated but
they do also cohere albeit in another way than previously suggested.
D.
A.
C.
B.
D.
A.
C.
B.
Figure 3.1 Chromosome rearrangement model.
A. At initiation, the origin region of the
chromosome (black circles) is at the cell center,
and the replication forks (yellow triangles) form
there. The two arms (light blue and pink lines) of
the chromosome are arranged either side of the cell
center. The terminus (green square) is near the new
cell pole.
B. At mid-replication, the forks have dissociated
from the cell center and are following the path of
the DNA template. The newly replicated DNA
products (dark blue and red) stay together for a
while (sister loci cohesion, grey hatching) and then
segregate to opposite sides of the cell center. This
DNA is relatively disorganized and resides in the
central half of the cell.
C. As replication progresses, the new origins attach
to the cell quarter positions and the two arms of
each nascent chromosome are sorted out so that the
arms lie on either side of the cell quarters.
D. At termination, the origins are at the quarter
positions, and the terminus and forks are at the cell
center. The arms (replichores) of the two new
chromosomes are arranged with respect to the cell
quarters. After the following post-replicational
period (D-period), cell division will restore the
starting state of the cycle.

Henrik Jørck Nielsen Ph.D.-Thesis
44
3.1.4 Capture of the origin
A central part of the Extrusion-Capture model is the directed extrusion of origins towards
the cell quarters away from the cell center. In the Sister Chromosome Cohesion model too
movement of the origins, as well as most of the chromosome, is also a central part. The
first suggests that replication itself provides the force necessary for origin migration
whereas the latter suggests a segregation mechanism involving so far unknown molecular
motors. The model we have proposed also requires the existence of an unknown active
segregation mechanism.
Hence as proposed in all models on chromosome segregation it is expected that origin
migration is controlled by the cell. There has however not been found any evidence of this
whatsoever. An alternative suggestion has been proposed. It has been observed that the
duplicated origins and possibly later replicated markers keep a constant distance to the cell
poles moving apart gradually in line with cell elongation (Roos et al., 1999; Roos et al.,
2001). This led to the idea that replicated markers segregate passively in line with the axial
cell growth. There really are not any reports disputing this idea. However, it would require
that growth takes place at the center of the cell. This has been shown not to be true; in fact
the cell grows evenly along the entire length of the cell (Cooper, 1991). Thus markers
keeping a constant distance to the pole are in fact migrating in the cell as their relative
distance from the pole is decreasing. In Caulobacter crescentus there is little doubt that
origins migrate. They do so very rapidly after duplication (Viollier et al., 2004). One stays
at the stalked pole and the other migrates to the opposite pole.
We further believe that all loci are actively segregated by an energy driven mechanism.
That is a natural consequence of the Sister Loci Cohesion model and the Home and Away
Segregation model. When sister loci cohesion is lost the two sister loci are located outside
the cell center on the same side of the middle. They can’t stay like that for very long as
cells with two foci on the same side of the cell center is a rarity. Instead one seems to jump
rapidly across the cell center line end the other stays where it was (the home locus). It is
possible that the segregation machinery is located centrally at the future division plane,
pulling in the two Away DNA strands from either side of the center and placing the DNA
just on the other side of the center. A central segregation machinery would explain why a
replication block results in the blocked locus being centrally located along with the
replication proteins. That is because the segregation machinery is pulling in the duplicated
DNA as soon as the sister loci cohesion is lost. If the replication forks stall they will
consequently be pulled to the center where they will jam the segregation machinery. A
central segregation apparatus also fits very well with the reports on sticky P1-parS loci
getting stuck in the center of the cell.

Dynamics of chromosome segregation
45
Although the Extrusion-Capture model is wrong about the central replication and
extrusion of replicated DNA it might still be right about the origin capture. Origin capture
is indeed compatible with the Home and Away Segregation model. In fact capture of the
origin could possibly be a central part of the sorting out which chromosomal arm goes to
which side. Starting at the origin at a fixed position (the quarter) the chromosome is sorted
proceeding towards the terminus putting one arm on one side and the other on the other
side.
Evidence of origin capture has been presented in Paper II. We found that addition of
rifampicin (blocking initiation) had a great impact on the general distribution of the origins
in smaller cells with new origins but very little effect on larger cells with older origins. In
the earlier the distribution of origins became very broad whereas the later had the origins
narrowly distributed around the cell quarter. This result indicates that the origins are being
held at the quarter prior to initiation.
3.1.5 General organization of the chromosome
The chromosome is without doubt organized with the origin at the cell center at cell
birth or at least shortly thereafter. The terminus too is at the middle but does not get there
until usually a little later in the cell cycle. This depends on the growth rate though; at very
slow growth the terminus stays at the new pole for a longer time than at faster growth
rates. This feature is by the way useful for identifying the new pole in newborn cells. At
cell division when the replication is done and the two chromosomes segregated the
conformation is almost the same: The two origins are at the cell quarters (the future cell
center). The termini are not at the cell quarters yet, but stays at the division plane; even
some time after cell division is complete.
The rest of the chromosome is apparently not very organized at the slow growth rate,
except for the fact that one arm or replichore is in one cell half and the other chromosome
arm is in the other. Data suggests that these arms are organized with origin proximal
markers close to the cell center and later replicated markers closer to the pole when
approaching the terminus. At some point around 10’ from the terminus this order seems to
reverse and markers are again closer to the cell center. This has led to the proposal that the
chromosome is organized in a condensed ring structure (Niki et al., 2000). As the
distribution of loci in slow growing cells is very broad we don’t think this is correct. In
stead we propose that the difference in the average positions of the markers reflects the
order they were replicated and put into the growing nucloid mass at the previous
segregation event (Nielsen et al., 2006a). In any individual cell an early marker can easily
be closer to the pole than a late marker, but on the average they tend to be closer to the cell

Henrik Jørck Nielsen Ph.D.-Thesis
46
center because the early markers were put into the growing nucloid first and the highly
viscous nature of the nucloid tend to maintain this organization.
The replication forks separate at the low growth rate. As the chromosome arms are in
separate cell halves the forks go to each side of the center and probably track along the
DNA. We do not know why the forks do not stay together at the cell center pulling the
chromosome arms in from either side. Perhaps the general idea of replication factories is
incorrect although that does not seem to be true. Separating replication forks have not been
reported at higher or even moderate growth rates. It seems intuitively wrong that forks
should separate at one growth rate and not at another. If the mechanism of replication does
not involve replication factories one would expect to find separating replication forks at
any growth rate. Hence at present there is a discrepancy between the observations in cells
growing at different growth rates. This discrepancy seems to include the separation of
chromosomal arms. Although preliminary, our present data from cells growing in glucose
does not support a similar separation of the arms. Perhaps the compactness of the DNA
forces the arms to be separated on the short axis of the cell. Replication forks too could be
separated on the short axis. It is too early to say at present though.
This is more or less what we know at present about the organization of chromosomal
markers and any further details can not come from anything else than qualified guessing.
In the literature there only exists extensive and valid data from slowly or very slowly
growing cells. The next step is therefore to do extensive analysis as the one reported here
(Papers II and III) on cells growing at faster growth rates (at I<C).
3.2 Perspectives
A lot of questions about bacterial chromosome dynamics have been answered by the
results presented here. We are however still at a very early stage and there is still a lot to be
learned. Some of the results presented and methods developed in this thesis leads to new
questions and to new ideas and approaches in the field. In the following I present these
ideas.
3.2.1 Implications of the newly developed pMT1 based labeling system
The pMT1 based labeling system was not developed until very recently and has already
proven very useful. Naturally the results presented in Paper III about the organization of
the chromosomal arms could not have been produced without it. But other experiments are
already being planned. With the possibility of labeling two loci independently we can now
follow the position of one locus with respect to another. This can be used for inspecting the

Dynamics of chromosome segregation
47
position of the two arms with respect to each other as done in Paper III or one locus could
be a labeled reference locus that other loci are compared to; for example the terminus that
is always close to the new pole. This way the orientation of different cells labeled at
different sites can be established with respect to the new pole and a truly oriented
distribution of loci in the cell established. Another reference locus could be an intermediate
marker representing one of the chromosome arms. In stead of orienting with respect to the
new pole cells can then be oriented with respect to the orientation of the chromosome. In
both cases the use of a reference locus makes it possible to compare the position of many
loci from many different strains without the problem of cell orientation.
An unexpected feature of the pMT1 system was the lack of stickiness. This might turn
out to be very useful in segregation studies as explained in the next section, but initially it
means that the pMT1 labeling system should be the first choice when doing single color
labeling. That is of course because it is not necessary to be so careful when inducing the
GFP-ParB. This system can be expressed at high levels without problems. But not only is it
an advantage that foci do not stick together but the achievable high levels of GFP minimize
problems like bleaching foci and low signal to noise ratios. This will have an even greater
impact on time-lapse studies where the bleaching is an especially big problem as the cells
are exposed over and over again. With high levels of non-sticky GFP-pMT1-ParB this
problem is reduced.
3.2.2 Stickiness
The discovery of stickiness is of great importance and the progressive process of
segregation (Paper II) could not have been recognized using the old induction strategy (Li
et al., 2002). The protocol we use now for labeling studies is superior to the old method
and produces results with no known artifacts as evident from the studies on separation of
labeled origins (Paper II). Although that is great for future studies it could force us to
reevaluate some of the older results created by using the P1 par labeling system. These
earlier results mainly involve P1 plasmid partitioning studies published before I began my
Ph.D. study. Plasmid partitioning is not a subject of this thesis and I will not begin to
discuss the validity of the result I am referring to here, but just mention that it might be
advisable to redo some of the experiments.
Two publications where the system has been used to label chromosomal loci using the
old induction strategy have been published. In one only the origin and terminus was
labeled (Li et al., 2002). Fortunately the localization of these two markers is not greatly
affected by stickiness as they tend to localize to the quarters (origin) and the cell center
(terminus and origin) anyway which is where they will get stuck by stickiness as well.

Henrik Jørck Nielsen Ph.D.-Thesis
48
Hence only the effect of delay of segregation is a problem. The authors did observe and
report this delay. Ironically there really is a delay (sister loci cohesion) although it is not as
long as the one reported and caused by stickiness. So overall the paper is still valid even
though stickiness was present in the results. The other paper only considered terminal
markers (Li et al., 2003). This paper was quite lucky too as the terminus is the locus least
affected by stickiness. The terminus localizes to the cell center under normal as well as
sticky conditions. The segregation of the terminus is affected though and a lot less cells
with two terminus foci observed under sticky conditions, but as the paper was about
terminus localization the presence of stickiness had a limited effect on the validity of the
reported results. The experiments have been redone recently under conditions without
stickiness (Stuart Austin, personal communication, data not shown) and the only difference
is that termini separate earlier than originally reported but localize the same way.
Stickiness is likely to be an important feature of the P1 plasmid partitioning process as
well as other similar partitioning systems. Indeed the present models for the P1 partitioning
mechanism state that two plasmids are held together by ParB proteins at the cell center and
then ‘ejected’ very late in the cell cycle by a ParA dependent process (Ebersbach and
Gerdes, 2005). This pairing of sister plasmids at the cell center is in line with our
observations that pairs of chromosomal parS loci are located at the cell center when
stickiness is induced. On the other hand the pairing of P1 plasmids at the cell center
proposed by the partitioning models could arguably be a result of studying the system at
higher than normal levels of ParB where stickiness affects the true partitioning process. If
this is the case, stickiness might actually be a problem for the P1 partitioning process that
is not overcome until the last minute before cell division. In fact it is not at all impossible
that the stuck plasmids delays cell division until they have been segregated properly. The
partitioning process of P1 is very efficient and cells practically never divide without a P1
plasmid in each daughter cell, so it would make sense if the plasmid possesses the ability
of delaying cell division until segregation is complete. If so that would be a so far
unknown feature of the P1 partitioning system. Studies of stickiness’ role in P1
partitioning should therefore be commenced and it should be clarified whether this
phenomenon is a part of the partitioning process or not. Existing models should be
revalidated to account for the results of such studies. A fact that might speak for the idea of
stickiness impeding plasmid partitioning and not being a part of it is that the pMT1
partitioning system does not cause stickiness but still segregates the pMT1 plasmid very
efficiently.
Regardless of why stickiness is present in the P1 system and how it works it should
prove very useful in chromosome segregation studies. A P1 parS locus can be inserted at

Dynamics of chromosome segregation
49
one position and segregation blocked at this position by inducing stickiness. The fate of
other chromosomal loci can then be followed by a pMT1 parS insertion and the following
questions answered: Are loci positioned in front of the block (upstream) segregated
normally? Are loci after the block segregated? We know that segregation is a progressive
process but is that because the segregation tracks along the DNA from origin to terminus,
in which case loci in front of the block but not loci after will be expected to segregate
normally. Or is the progressive segregation we observe a result of the progressive
replication, and the chromosomes segregated progressively simply because the substrate
for the segregation machinery is made available in a progressive manner. In the later case
both loci before and after the block would be expected to segregate regardless of the
segregation block. Finally with the new knowledge that the chromosomal arms are located
and replicated separately it would be interesting to check if a segregation block on one arm
affects the segregation of the other. Strains suitable for the experiments described here are
being made at the moment.
3.2.3 Cell counting
The development of a fully automated cell counting and measuring tool is a major
contribution to the field of bacterial chromosome dynamics. How does an hns mutation
affect the general chromosome segregation? Or what about fis, fts, or dnaA mutations to
mention a few other interesting candidates. Is the general chromosome organization
affected? To answer these questions the segregation and localization pattern of many
chromosomal markers in strains with the mentioned mutations has to be determined easily
involving the measuring of more then 10.000 cells for each mutant. That would be close to
impossible to do or at least extremely time consuming without an automated procedure.
With the program described in Paper I this is now possible. Experiments that would
normally take weeks to do or perhaps never even be commenced without the program can
now be done in fractions of the time.
The main results of this thesis are without doubt the discovery that chromosome
segregation is progressive and that the chromosomal arms are located in separate cell
halves of slow growing cells as reported in Paper II and III respectively. It had however
not been possible to get these results without the automated cell counting and measuring
program. This program is therefore also a very important result of my work and will
hopefully contribute to many future studies by our laboratory and others that would like to
use it.

Henrik Jørck Nielsen Ph.D.-Thesis
50
3.2.4 Future of still image analysis
Many people criticize the use of still image analysis for determining the dynamics of
chromosomal loci as this kind of analysis does not include the time dimension. I think it is
fair to say that this thesis has shown that still image analysis can be extremely valuable.
First of all it is not only the movement of loci that is under investigation but also the
general localization pattern (which one can argue are two sides of the same story). The
general position of a locus in the cell as well as its scatter tells a lot about the dynamics of
this locus. The time dimension we get from the cell size as this is a time dependent
variable. Furthermore we have shown that time-lapse studies are very difficult to rely on
as loci are so mobile that a record of their position every 15th, 10
th, or even 5
th minute does
not say much as there is no information on their positions in between. It becomes a series
of still images of the same cell that is difficult to connect in time, and hence does not differ
much from a normal still image analysis except that a lot fewer cells are analysed. This
being said time-lapse and still image analysis can of course be used to confirm one
another.
I believe still image analysis have a great future in chromosome dynamics. With the
development of an automated counting and measuring method many cells from many
different growth conditions and with various strain backgrounds can be analysed in no
time. Time-lapse studies which are much more time consuming can then be done on
promising strains as a verification method if desired. The statistical basis made from
analyzing 2,000 cells is very good and can possibly reveal details that time-lapse would
never have had. If 2,000 cells isn’t enough we just analyse 10,000.
With the use of several labeled loci at the same time possibly in combination with GFP
fused proteins like SeqA, DnaX, FtsZ etc. still image analysis becomes even more
promising as there is really no practical limit to the number of combinations that can
possibly be analysed by this technique.

Dynamics of chromosome segregation
51
4 Bibliography
Adachi, S., Hori, K., and Hiraga, S. (2006) Subcellular positioning of F plasmid mediated
by dynamic localization of SopA and SopB. J Mol Biol 356: 850-863.
Adachi, S., Kohiyama, M., Onogi, T., and Hiraga, S. (2005) Localization of replication
forks in wild-type and mukB mutant cells of Escherichia coli. Mol Genet Genomics 274:
264-271.
Atlung, T., and Hansen, F.G. (1993) Three distinct chromosome replication states are
induced by increasing concentrations of DnaA protein in Escherichia coli. J Bacteriol 175:
6537-6545.
Bakker, A., and Smith, D.W. (1989) Methylation of GATC sites is required for precise
timing between rounds of DNA replication in Escherichia coli. J Bacteriol 171: 5738-
5742.
Bates, D., and Kleckner, N. (2005) Chromosome and replisome dynamics in E. coli: loss
of sister cohesion triggers global chromosome movement and mediates chromosome
segregation. Cell 121: 899-911.
Begg, K.J., and Donachie, W.D. (1978) Changes in cell size and shape in thymine-
requiring Escherichia coli associated with growth in low concentrations of thymine. JBacteriol 133: 452-458.
Boye, E., and Lobner-Olesen, A. (1990) The role of dam methyltransferase in the control
of DNA replication in E. coli. Cell 62: 981-989.
Boye, E., and Lobner-Olesen, A. (1991) Bacterial growth control studied by flow
cytometry. Res Microbiol 142: 131-135.
Boye, E., Steen, H.B., and Skarstad, K. (1983) Flow cytometry of bacteria: a promising
tool in experimental and clinical microbiology. J Gen Microbiol 129: 973-980.
Boye, E., Stokke, T., Kleckner, N., and Skarstad, K. (1996) Coordinating DNA replication
initiation with cell growth: differential roles for DnaA and SeqA proteins. Proc Natl Acad Sci U S A 93: 12206-12211.
Brendler, T., and Austin, S. (1999) Binding of SeqA protein to DNA requires interaction
between two or more complexes bound to separate hemimethylated GATC sequences.
EMBO J 18: 2304-2310.

Henrik Jørck Nielsen Ph.D.-Thesis
52
Brendler, T., Sawitzke, J., Sergueev, K., and Austin, S. (2000) A case for sliding SeqA
tracts at anchored replication forks during Escherichia coli chromosome replication and
segregation. EMBO J 19: 6249-6258.
Churchward, G., Estiva, E., and Bremer, H. (1981) Growth rate-dependent control of
chromosome replication initiation in Escherichia coli. J Bacteriol 145: 1232-1238.
Cooper, S. (1991) Synthesis of the cell surface during the division cycle of rod-shaped,
gram-negative bacteria. Microbiol Rev 55: 649-674.
Cooper, S., and Helmstetter, C.E. (1968) Chromosome replication and the division cycle of
Escherichia coli B/r. J Mol Biol 31: 519-540.
Deibler, R.W., Rahmati, S., and Zechiedrich, E.L. (2001) Topoisomerase IV, alone,
unknots DNA in E. coli. Genes Dev 15: 748-761.
Dingman, C.W. (1974) Bidirectional chromosome replication: some topological
considerations. J Theor Biol 43: 187-195.
Donachie, W.D. (1968) Relationship between cell size and time of initiation of DNA
replication. Nature 219: 1077-1079.
Ebersbach, G., and Gerdes, K. (2005) Plasmid segregation mechanisms. Annu Rev Genet39: 453-479.
Fekete, R.A., and Chattoraj, D.K. (2005) A cis-acting sequence involved in chromosome
segregation in Escherichia coli. Mol Microbiol 55: 175-183.
Fujikawa, N., Kurumizaka, H., Nureki, O., Tanaka, Y., Yamazoe, M., Hiraga, S., and
Yokoyama, S. (2004) Structural and biochemical analyses of hemimethylated DNA
binding by the SeqA protein. Nucleic Acids Res 32: 82-92.
Gordon, G.S., Shivers, R.P., and Wright, A. (2002) Polar localization of the Escherichia
coli oriC region is independent of the site of replication initiation. Mol Microbiol 44: 501-
507.
Gordon, G.S., Sitnikov, D., Webb, C.D., Teleman, A., Straight, A., Losick, R. et al. (1997)
Chromosome and low copy plasmid segregation in E. coli: visual evidence for distinct
mechanisms. Cell 90: 1113-1121.
Guarne, A., Brendler, T., Zhao, Q., Ghirlando, R., Austin, S., and Yang, W. (2005) Crystal
structure of a SeqA-N filament: implications for DNA replication and chromosome
organization. EMBO J 24: 1502-1511.
Guarne, A., Zhao, Q., Ghirlando, R., and Yang, W. (2002) Insights into negative
modulation of E. coli replication initiation from the structure of SeqA-hemimethylated
DNA complex. Nat Struct Biol 9: 839-843.

Dynamics of chromosome segregation
53
Hansen, F.G., Christensen, B.B., and Atlung, T. (1991) The initiator titration model: computer simulation of chromosome and minichromosome control. Res Microbiol 142:161-167.
Helmstetter,C.E. (1996) Timing of synthetic activities in the cell cycle. In Escherichia coli and Salmonella cellular and molecular biology. Neidhardt,F.C., J.L.Ingraham, E.C.C.Lin, K.B.Low, B.Magasanik, W.S.Reznikoff, M.Riley, M.Schaechter, and H.E.Umbarger, eds. Washington D.C: ASM Press, pp. 1627-1639.
Helmstetter, C.E., and Cummings, D.J. (1963) Bacterial Synchronization by selection of cells at division. Proc Natl Acad Sci U S A 50: 767-774.
Helmstetter, C.E., Eenhuis, C., Theisen, P., Grimwade, J., and Leonard, A.C. (1992) Improved bacterial baby machine: application to Escherichia coli K-12. J Bacteriol 174:3445-3449.
Helmstetter, C.E., and Pierucci, O. (1976) DNA synthesis during the division cycle of three substrains of Escherichia coli B/r. J Mol Biol 102: 477-486.
Hiraga, S., Ichinose, C., Niki, H., and Yamazoe, M. (1998) Cell cycle-dependent duplication and bidirectional migration of SeqA-associated DNA-protein complexes in E. coli. Mol Cell 1: 381-387.
Hiraga, S., Ichinose, C., Onogi, T., Niki, H., and Yamazoe, M. (2000) Bidirectional migration of SeqA-bound hemimethylated DNA clusters and pairing of oriC copies in Escherichia coli. Genes Cells 5: 327-341.
Jensen, R.B., and Shapiro, L. (1999) The Caulobacter crescentus smc gene is required for cell cycle progression and chromosome segregation. Proc Natl Acad Sci U S A 96: 10661-10666.
Koch,A.L. (1996) Similarities and Differences of Individual Bacteria within a Clone. In Escherichia coli and Salmonella cellular and molecular biology. Neidhardt,F.C., J.L.Ingraham, E.C.C.Lin, K.B.Low, B.Magasanik, W.S.Reznikoff, M.Riley, M.Schaechter, and H.E.Umbarger, eds. Washington D.C: ASM Press, pp. 1640-1651.
Koppes, L.J., and Nanninga, N. (1980) Positive correlation between size at initiation of chromosome replication in Escherichia coli and size at initiation of cell constriction. JBacteriol 143: 89-99.
Koppes, L.J., Woldringh, C.L., and Nanninga, N. (1999) Escherichia coli contains a DNA replication compartment in the cell center. Biochimie 81: 803-810.
Lau, I.F., Filipe, S.R., Soballe, B., Okstad, O.A., Barre, F.X., and Sherratt, D.J. (2003) Spatial and temporal organization of replicating Escherichia coli chromosomes. MolMicrobiol 49: 731-743.

Henrik Jørck Nielsen Ph.D.-Thesis
54
Lemon, K.P., and Grossman, A.D. (1998) Localization of bacterial DNA polymerase: evidence for a factory model of replication. Science 282: 1516-1519.
Lemon, K.P., and Grossman, A.D. (2000) Movement of replicating DNA through a stationary replisome. Mol Cell 6: 1321-1330.
Lemon, K.P., and Grossman, A.D. (2001) The extrusion-capture model for chromosome partitioning in bacteria. Genes Dev 15: 2031-2041.
Li, Y., Sergueev, K., and Austin, S. (2002) The segregation of the Escherichia coli origin and terminus of replication. Mol Microbiol 46: 985-996.
Li, Y., Youngren, B., Sergueev, K., and Austin, S. (2003) Segregation of the Escherichia coli chromosome terminus. Mol Microbiol 50: 825-834.
Massey, T.H., Aussel, L., Barre, F.X., and Sherratt, D.J. (2004) Asymmetric activation of Xer site-specific recombination by FtsK. EMBO Rep 5: 399-404.
Messer,W.J., and Weigel,C. (1996) Initiation of Chromosome Replication. In Escherichia coli and Salmonella cellular and molecular biology. Neidhardt,F.C. , J.L.Ingraham, E.C.C.Lin, K.B.Low, B.Magasanik, W.S.Reznikoff, M.Riley, M.Schaechter, and H.E.Umbarger, eds. Washington D.C: ASM Press, pp. 1579-1601.
Michelsen, O., Teixeira de Mattos, M.J., Jensen, P.R., and Hansen, F.G. (2003) Precise determinations of C and D periods by flow cytometry in Escherichia coli K-12 and B/r. Microbiology 149: 1001-1010.
Molina, F., and Skarstad, K. (2004) Replication fork and SeqA focus distributions in Escherichia coli suggest a replication hyperstructure dependent on nucleotide metabolism. Mol Microbiol 52: 1597-1612.
Nielsen, H.J., Li, Y., Youngren, B., Hansen, F.G., and Austin, S. (2006a) Progressive segregation of the Escherichia coli chromosome. Mol Microbiol 61: 383-393.
Nielsen, H.J., Ottesen, J.R., Youngren, B., Hansen, F.G., and Austin, S. (2006b) The Escherichia coli chromosome is organized with the left and right chromosome arms in separate cell halves. Mol Microbiol 62: 331-338.
Niki, H., and Hiraga, S. (1998) Polar localization of the replication origin and terminus in Escherichia coli nucleoids during chromosome partitioning. Genes Dev 12: 1036-1045.
Niki, H., and Hiraga, S. (1999) Subcellular localization of plasmids containing the oriC region of the Escherichia coli chromosome, with or without the sopABC partitioning system. Mol Microbiol 34: 498-503.
Niki, H., Yamaichi, Y., and Hiraga, S. (2000) Dynamic organization of chromosomal DNA in Escherichia coli. Genes Dev 14: 212-223.

Dynamics of chromosome segregation
55
Okazaki, T., and Okazaki, R. (1969) Mechanism of DNA chain growth. IV. Direction of synthesis of T4 short DNA chains as revealed by exonucleolytic degradation. Proc Natl Acad Sci U S A 64: 1242-1248.
Onogi, T., Niki, H., Yamazoe, M., and Hiraga, S. (1999) The assembly and migration of SeqA-Gfp fusion in living cells of Escherichia coli. Mol Microbiol 31: 1775-1782.
Pelletier, A.J., Hill, T.M., and Kuempel, P.L. (1988) Location of sites that inhibit progression of replication forks in the terminus region of Escherichia coli. J Bacteriol 170:4293-4298.
Pierucci, O., and Helmstetter, C.E. (1976) Chromosome segregation in Escherichia coli B/r at various growth rates. J Bacteriol 128: 708-716.
Possoz, C., Filipe, S.R., Grainge, I., and Sherratt, D.J. (2006) Tracking of controlled Escherichia coli replication fork stalling and restart at repressor-bound DNA in vivo. EMBO J 25: 2596-2604.
Roos, M., Lingeman, R., Woldringh, C.L., and Nanninga, N. (2001) Experiments on movement of DNA regions in Escherichia coli evaluated by computer simulation. Biochimie 83: 67-74.
Roos, M., van Geel, A.B., Aarsman, M.E., Veuskens, J.T., Woldringh, C.L., and Nanninga, N. (1999) Cellular localization of oriC during the cell cycle of Escherichia coli as analyzed by fluorescent in situ hybridization. Biochimie 81: 797-802.
Roos, M., van Geel, A.B., Aarsman, M.E., Veuskens, J.T., Woldringh, C.L., and Nanninga, N. (2001) The replicated ftsQAZ and minB chromosomal regions of Escherichia coli segregate on average in line with nucleoid movement. Mol Microbiol 39:633-640.
Sawitzke, J., and Austin, S. (2001) An analysis of the factory model for chromosome replication and segregation in bacteria. Mol Microbiol 40: 786-794.
Sherratt, D.J., Soballe, B., Barre, F.X., Filipe, S., Lau, I., Massey, T., and Yates, J. (2004) Recombination and chromosome segregation. Philos Trans R Soc Lond B Biol Sci 359: 61-69.
Skarstad, K., Boye, E., and Steen, H.B. (1986) Timing of initiation of chromosome replication in individual Escherichia coli cells. EMBO J 5: 1711-1717.
Skarstad, K., Steen, H.B., and Boye, E. (1985) Escherichia coli DNA distributions measured by flow cytometry and compared with theoretical computer simulations. JBacteriol 163: 661-668.

Henrik Jørck Nielsen Ph.D.-Thesis
56
Slater, S., Wold, S., Lu, M., Boye, E., Skarstad, K., and Kleckner, N. (1995) E. coli SeqA protein binds oriC in two different methyl-modulated reactions appropriate to its roles in DNA replication initiation and origin sequestration. Cell 82: 927-936.
Straight, A.F., Belmont, A.S., Robinett, C.C., and Murray, A.W. (1996) GFP tagging of budding yeast chromosomes reveals that protein-protein interactions can mediate sister chromatid cohesion. Curr Biol 6: 1599-1608.
Sunako, Y., Onogi, T., and Hiraga, S. (2001) Sister chromosome cohesion of Escherichia coli. Mol Microbiol 42: 1233-1241.
Sundin, O., and Varshavsky, A. (1981) Arrest of segregation leads to accumulation of highly intertwined catenated dimers: dissection of the final stages of SV40 DNA replication. Cell 25: 659-669.
Viollier, P.H., Thanbichler, M., McGrath, P.T., West, L., Meewan, M., McAdams, H.H., and Shapiro, L. (2004) Rapid and sequential movement of individual chromosomal loci to specific subcellular locations during bacterial DNA replication. Proc Natl Acad Sci U S A101: 9257-9262.
von Freiesleben, U., Krekling, M.A., Hansen, F.G., and Lobner-Olesen, A. (2000) The eclipse period of Escherichia coli. EMBO J 19: 6240-6248.
von Freiesleben, U., Rasmussen, K.V., and Schaechter, M. (1994) SeqA limits DnaA activity in replication from oriC in Escherichia coli. Mol Microbiol 14: 763-772.
Wang, L., and Lutkenhaus, J. (1998) FtsK is an essential cell division protein that is localized to the septum and induced as part of the SOS response. Mol Microbiol 29: 731-740.
Wang, X., Liu, X., Possoz, C., and Sherratt, D.J. (2006) The two Escherichia coli chromosome arms locate to separate cell halves. Genes Dev 20: 1727-1731.
Wang, X., Possoz, C., and Sherratt, D.J. (2005) Dancing around the divisome: asymmetric chromosome segregation in Escherichia coli. Genes Dev 19: 2367-2377.
Webb, C.D., Teleman, A., Gordon, S., Straight, A., Belmont, A., Lin, D.C. et al. (1997) Bipolar localization of the replication origin regions of chromosomes in vegetative and sporulating cells of B. subtilis. Cell 88: 667-674.
Yamaichi, Y., and Niki, H. (2004) migS, a cis-acting site that affects bipolar positioning of oriC on the Escherichia coli chromosome. EMBO J 23: 221-233.
Yamazoe, M., Adachi, S., Kanaya, S., Ohsumi, K., and Hiraga, S. (2005) Sequential binding of SeqA protein to nascent DNA segments at replication forks in synchronized cultures of Escherichia coli. Mol Microbiol 55: 289-298.
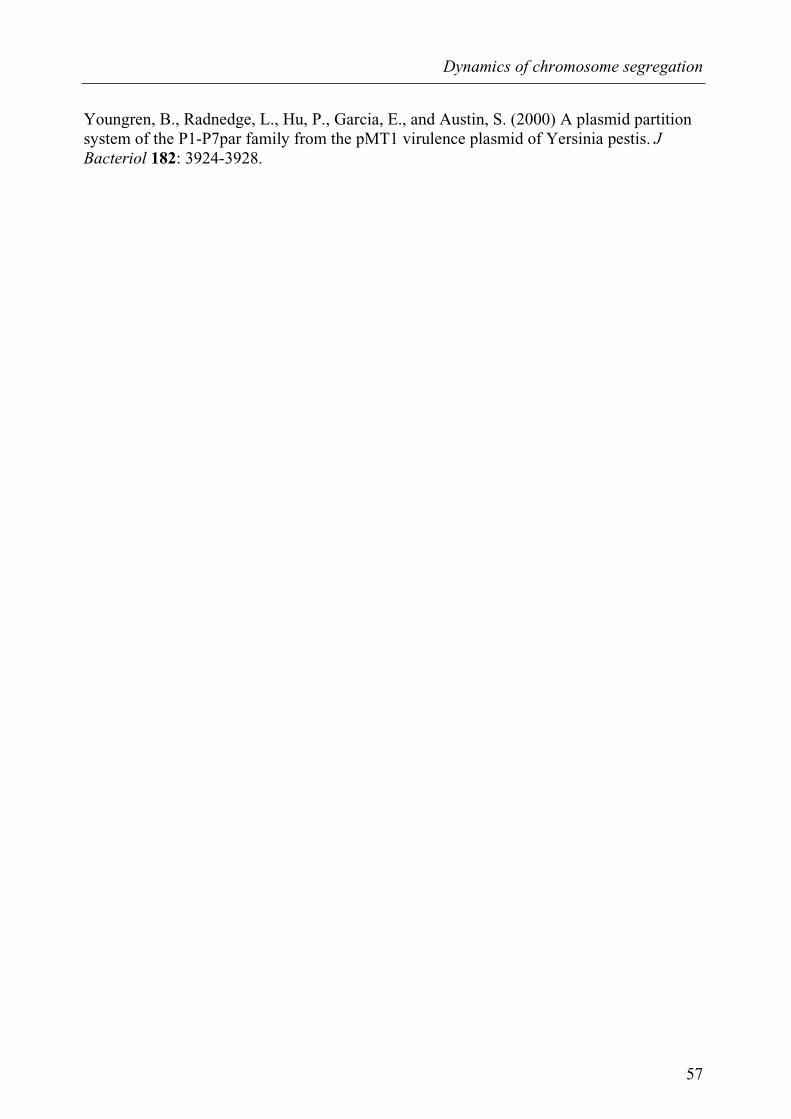
Dynamics of chromosome segregation
57
Youngren, B., Radnedge, L., Hu, P., Garcia, E., and Austin, S. (2000) A plasmid partition system of the P1-P7par family from the pMT1 virulence plasmid of Yersinia pestis. JBacteriol 182: 3924-3928.

Henrik Jørck Nielsen Ph.D.-Thesis
58


Dynamics of chromosome segregation
61
Papers and manuscripts
Paper 1 An automated and highly efficient method for counting
and measuring foci in rod shaped bacteria 6 pages
Paper II Progressive segregation of the Escherichia coli
chromosome 11pages
Supplementary material for Paper II 1 page
Paper III The Escherichia coli chromosome is organized with the
left and right chromosome arms in separate cell halves 8 pages
Supplementary material for Paper III 3 pages

Henrik Jørck Nielsen Ph.D.-Thesis
62

1
An automated and highly efficient method for counting and measuring foci in rod shaped bacteria
Henrik J. Nielsen, Flemming G. Hansen*
Center for Biological Sequence Analysis, BioCentrum-
DTU, Technical University of Denmark, DK-2800 Kgs.
Lyngby, Denmark
Summary
Measurements directly on photo micrographs of
cells are becoming increasingly more used when
investigating the position and/or distribution of
chromosomal loci in bacteria. These measurements
have in many cases been done manually, and
without clear definitions on how they are measured.
Here we present a procedure for standardizing
measurements of cell properties on phase contrast
images. Furthermore we present a program using
these standardized methods capable of measuring
the intracellular positions of fluorescent foci in
bacterial cells faster and more precise than manual
measuring.
Introduction
Unlike eukaryotes, bacteria do not have their
chromosomes contained in a nucleous. Instead the
chromosome is placed in the cytosol occupying much of
the cell volume. As for all cells, the bacterium replicates
the chromosome once per division cycle and segregates
the daughter chromosomes to two new daughter cells.
Very little is known about this process though. What
makes it complicated is that the process appears to be
continuous and coincident with replication (Nielsen et al.,
2006a;Nielsen et al., 2006b) Furthermore many fast
growing bacteria are capable of having multiple rounds
of replication taking place simultaneously on the same
chromosome. These cells have to segregate replicating
and highly branched chromosomes before cell division.
Investigating the chromosome dynamics of bacteria
has been practically impossible until the recent
development of methods for determining the physical
positions of specific proteins and DNA sequences in the
bacterial cell. Our understanding of chromosome
duplication and segregation dynamics has been greatly
enhanced by the use of these techniques. Loci can be
detected by fluorescence in fixed cells by in situ
hybridization (Niki and Hiraga, 1998). By using
fluorescent techniques such as the GFP-ParB/parS
system (Li et al., 2002) or the GFP-LacI/operator and Tet
repressor/operator systems (Gordon et al., 1997;Lau et
al., 2003;Wang et al., 2006), it has become possible to
detect the position of discrete DNA loci inside the living
cell. Using these techniques, it is possible to determine
the movement of individual parts of the chromosome as
they are replicated and segregated. Monitoring the
number of foci as function of cell length provides
information on the timing of segregation of a given locus
and measurements of the relative position of the foci
inside the cell provides information on the spatial
dynamics of segregation of that particular labeled locus. It
is of course crucial that the determination of cell size and
foci number as well as coordinates is as accurate as
possible.
Measurements are done on photomicrographs of
fluorescent foci inside the cells from a fluorescence
microscope and photomicrographs of the same cells from
phase contrast microscopy. The intracellular number and
position of foci can be determined by overlaying the
fluorescent image on the phase contrast image and
measuring the positions and dimension of cells and foci
(Figure 1). This is typically done manually using a digital
analysis program and is very time consuming and has
some observer bias problems. Furthermore it is our
experience that at least 1000 cells are needed for each
labeled chromosome locus in order to get significant
results. This is due to considerable cell to cell variation in
focus number and intracellular position. Manual analysis
Fig. 1. Phase contrast photomicrograph of Escherichia coli K-12
(MG1655) cells.
*For correspondence. E-mail [email protected]; Tel. (+45) 4525 25 05; Fax (+45) 45 93 28 09.

2
of this number of cells takes at least 4 hours depending on the software used.
We have created/programmed a macro capable of measuring cell properties and foci positions fully automatically and very efficiently. It has no observer bias, it gives less variation in measurements than humanly measured cells, and most importantly it will easily count and measure more than 1000 cells in 5 minutes. The macro was programmed in the digital image processing and analysis program Image Pro Plus.
Results
Determining the true outline of the cells on phase contrast images
It is well known that the edges of objects and especially cells observed in phase contrast are not sharp. In phase contrast microscopy the refractory difference of the object compared to the surrounding media is visualized as an intensity difference. Depending on the thickness of the object and its refractory index, a phenomenon creating a bright fringe (halo, figure 1) around the object is present to a more or less troubling degree obscuring edge details (Bennett et al., 1951). This is especially unfortunate when doing measurements on cylindrically (rod) shaped cells as the ‘true’ edge or outline of the cell is difficult to determine. This is shown in figure 2.
When outlining cells automatically using digital image analysis software it is done by creating a binary mask. This mask is white in all areas where the intensity value of the image is below a certain threshold and black where the intensity of the image is above. When the threshold value is set somewhere between the image
background intensity and the average intensity of the cells the mask contains all the cells, white on black background. The software can then identify and outline these white cells automatically. The actual outlining of the cells depends on the precise value of the threshold. A range of thresholds will usually work fine for creating nice separated outlines, but the size of the final outlined cells will vary considerably depending on the exact threshold value. Hence determining the correct threshold value is important in order to avoid big variations in measured cell size from image to image.
An intensity profile of an E. coli cell is shown in figure 3. As can be seen, because of the ‘halo’ effect, the true outline of rod shaped cells should be placed close to the intensity value of the background. That is however difficult to do in practice because a threshold value close to that of the background level will include a lot of the background. That could be overcome by using a more advanced method for creating the mask, but still it would cause problems with too many cells not being separated. Instead we chose to set the value at 2/3’s the range from the cell center intensity and that of the background. That creates outlines that are slightly smaller than the actual cell size but are considerably easier to make. That is not a problem as it is not as important to find the exact true edge of the cell as it is to be consistent from cell to cell when determining the outline.
This method does probably not get the entire cell included in the outline but it will outline the cells very consistently so that the measurement error is the same
A
B D
CAA
B D
C
Fig. 2. The ‘halo’ effect. A schematic representation of how the ‘halo’effect in phase contrast microscopy changes the true image intensity profile of the specimen (A and C) to a distorted intensity profile (B and D). A and B represent an object with sharp edges like a box and C and D represent a cylindrical object like a rod-shaped cell.
-2 -1.5 -1 -0.5 0 0.5 1 1.5 2
Distance from cell center axis (µm)-2 -1.5 -1 -0.5 0 0.5 1 1.5 2
Distance from cell center axis (µm)
Fig. 3. Example of a cell intensity profile. The short axis intensity profile of an E.coli cell growing in AB glycerol minimal media is shown in red. The best guess of the ‘true’ intensity profile is shown in black. This best guess was found by applying the distortion pattern demonstrated in figure 2 to theoretical cylindrical objects of varying radii and adding a Gaussian distribution to simulate the experimentally observed blurring of the cell. The distorted profile of the black theoretical curve is shown in blue and the blurred version in yellow. The cylindrical radius giving the best fit was then chosen. As seen the yellow curve fits very well with the experimentally determined intensity profile. The threshold value resulting in outlining of the entire cell is right at the background level.

3
for all cells. Because the error is consistent (estimated to 0.05 microns for all edges) it does not introduce variability to the later measurements on relative position of foci inside the cell. If desired the measurements can be compensated as the magnitude of this error is known. Thus the automatically outlining produces more consistent and more accurate measurements than manual measurements do.
To confirm that this method is consistent we evaluated the variation of the measured width of the cells from image to image compared to the variation from cell to cell. The width of the cells is expected to be more or less the same for all cells and is therefore very useful for determining the robustness of the method.
In figure 4 the result is shown. 507 cells were measured manually and automatically. The average cell width was slightly higher when manually measured. This is of course very dependent on the person doing the measurements. The variation was clearly higher for the manual measurements too (see legend to figure 4 for exact numbers). Hence we conclude that automatic measuring of cells is more consistent than manual measurements. Furthermore it should be noted that the manual measuring of the 500 cells took 30 minutes, and that was without measuring anything else like foci positioning etc. The automatic measuring procedure took 3 minutes, and that was for the entire dataset of 1753 cells and including measurements of cell width, length and foci coordinates.
Once the proper threshold value is found it is no problem to find, outline, and measure all the cells on
each field automatically using the digital image analysis software. Problems with cells lying close together being counted as one, and debris on the image being counted as cells, were easily solved by using measurement filters. Every digital image analysis program has the option of using these filters where all objects above or below a certain length, width, and aspect ratio, are filtered (see Methods for specific values).
Finally we would like to note that only images with cell to background contrast values above 0.55 were used. Images that are slightly out of focus will have a low contrast value. Also dried up cells appears lighter in phase contrast and results in lower contrast values. The limit of 0.55 turned out to be a proper limit for getting rid of out of focus images and images of dried up cells. The variation of cell width was much higher at contrast values below 0.55 but low and constant at contrast values above this limit (figure 5).
Scoring septated and dividing cells
For many analyses on chromosome dynamics and the bacterial cell division cycle it is of particular interest to isolate the dividing cells and analyze these separately. That is because the cell size is not a precise measure of progression of the cell cycle. The size distribution of cells about to divide is rather broad (CV at 20%; (Koch, 1996). Of course the same is true for newborn cells. Selecting for septated cells is a much better way of isolating cells close to cell division. Furthermore the degree of
40
80
120
160
200
0 0.25 0.5 0.75 1 1.25 1.5
Cell width (µm)
Fre
qu
ency
40
80
120
160
200
0 0.25 0.5 0.75 1 1.25 1.5
Cell width (µm)
Fre
qu
ency
Fig. 4. Comparison of manual and automatic measurements. The width of 508 cells were measured manually (yellow curve) and automatically (black curve). The manual measurement resulted in an average cell width of 0.83 µm, a standard deviation of 0.08 and a coefficient of variation of 9.1%. The automatic measurement resulted in an average cell width of 0.76 µm, a standard deviation of 0.05 and a coefficient of variation of 6.9%.
0
0.25
0.5
0.75
1
0 0.25 0.5 0.75 1
Contrast
Ave
rag
e ce
ll w
idth
(µm
)
0
0.25
0.5
0.75
1
0 0.25 0.5 0.75 1
Contrast
Ave
rag
e ce
ll w
idth
(µm
)
Fig. 5. Image contrast and measured cell size. The average cell width was measured using the automated method on images of different cell to background contrast. Each point represents one image from one of four separate experiments (shown by 4 different symbols). Cells were grown similarly in all experiments. At low contrast values the cells appeared wider, but above a contrast value of approximately 0.55 (hatched line) the width of the cells become constant. The trend is shown by the thick grey curve.

4
invagination shows exactly how close the cell is to division. So we decided to have the macro identify septated cells and give them a score depending on the degree of invagination. This was done by creating an intensity profile for each cell. The cell is sliced up along the long axis (as a sausage) and the integrated intensity of each slice calculated. If the cell is invaginated the central slices will be of higher intensity. The degree of invagination is found from the intensity of the brightest point (or ‘slice’) in the central 1/3 of the cell compared to the cell average intensity and the intensity of the background such that if the brightest point is the same intensity as the rest of the cell the result is zero and if the
brightest point is as bright as the background the score is 1 (see figure 6 for examples). This method was remarkably accurate. In general cells with invagination scores below 0.25 are rarely visibly invaginated, cells with a score between 0.25 and 0.45 are clearly invaginated but not divided, and cells scoring 0.45 or more almost always look like divided cells (see figure 6).
The calculation of the invagination of the cells is done automatically by the macro during the automatic counting and measuring of cells. It is fast and has no observer biased method for detecting septated and dividing cells.
Determining the position of foci automatically
The next step is to go through each and every cell ‘individually’ and count the foci within. This was done on the fluorescent images using the data on cell dimensions obtained from the phase contrast images. Basically the problem is the same as for the counting of cells, namely to find the right threshold value. As for the cells this can be done for the entire image, counting all the foci on the image and subsequently assigning them to the previously counted cells. However doing the counting of foci individually for each cell, instead of for the entire image, is much more advantageous, because the fluorescence in some cells are usually much higher than in others. Individual counting allows us to use a different threshold value for each cell. This threshold value was found as described below.
The threshold value has to be sufficiently above the background intensity level in the cell. If it isn’t, background noise can be picked up as signal. A lower limit of the threshold value was therefore set at the value where 85% of the pixels (inside the cell) are darker. This 85% limit was chosen empirically and turned out to be very useful. Likewise an upper limit at 95% was set as foci containing cells with less than 5% of their area consisting of foci are seldom seen. Finally this range of intensity values corresponding to the brightest 85%-95% of the cell area was divided into seven intervals that were evaluated individually for their usefulness as thresholds. The highest threshold value giving the highest number of foci was used. At the same time it is a requirement that foci are equal in size and intensity in order not to pick up noise together with a real signal (see Methods). This procedure was done for each and every cell.
Contrary to the cell outlining, the fidelity of manual identification of foci is generally superior to automatic identification. Foci are sometimes missed when counting them automatically. The reported method however got the number of foci right in 998 out of 1008 cells corresponding to 99% of all cells. Evaluation of the automatic counting was done by comparing the number of foci found by manual counting to the number found by
0.57
0.53
0.45
0
50
100
150
200
250
-3 -2 -1 0 1 2 3
0
50
100
150
200
250
-3 -2 -1 0 1 2 3
0.29
0
50
100
150
200
250
-3 -2 -1 0 1 2 3
0
50
100
150
200
250
-3 -2 -1 0 1 2 3
0.32
0
50
100
150
200
250
-3 -2 -1 0 1 2 3
Score Cell Intensity profile
0.57
0.53
0.45
0
50
100
150
200
250
-3 -2 -1 0 1 2 30
50
100
150
200
250
-3 -2 -1 0 1 2 3
0
50
100
150
200
250
-3 -2 -1 0 1 2 30
50
100
150
200
250
-3 -2 -1 0 1 2 3
0.29
0
50
100
150
200
250
-3 -2 -1 0 1 2 30
50
100
150
200
250
-3 -2 -1 0 1 2 3
0
50
100
150
200
250
-3 -2 -1 0 1 2 30
50
100
150
200
250
-3 -2 -1 0 1 2 3
0.32
0
50
100
150
200
250
-3 -2 -1 0 1 2 30
50
100
150
200
250
-3 -2 -1 0 1 2 3
Score Cell Intensity profile
Fig. 6. Detecting dividing cells. Examples of dividing cells with different invagination scores (left column; scored as described in the text) are shown along with their intensity profiles (right column). The hatched lines represents the background intensity (the upper line) and the cell intensity (the lower line). The blue curve is the intensity profile of the cell along its long axis. The x-axis is the distance from the septum in µm and the y-axis is the intensity (8 bit).

5
automatic counting (see table 1). The cells were first counted fully automatically and then every cell was inspected manually. The counting was done in two minutes whereas the visual inspection (without measuring anything) took 30 minutes.
Discussion
The goal of this work was to develop a fully automatic method for measuring cell dimensions, number of foci, and foci coordinates. This goal was achieved. The method produces consistent results that are without observer bias. More importantly the method is several orders of magnitudes faster than manual counting. That allows the processing of large number of experiments in very little time providing us with new possibilities in the field of bacterial chromosome dynamics. Using this program the effect of many different growth conditions or mutations on the chromosome dynamics can be investigated in no time. The method has already been used in a recently published paper where 14 different strains and a total of more than 16000 cells were analyzed (Nielsen et al., 2006a). This analysis that would have taken more than fifty hours of manual work was done in less than one hour.
Several papers on bacterial chromosome dynamics has been published in the recent years, all using fluorescent labeling systems labeling specific chromosomal loci followed by measurements of foci number and positions. The method and program reported here can help the reporting laboratories and save them a lot of time with these kind if analyses.
Changes can easily be made to the program to make it suitable for other growth conditions or other kinds of bacteria or even for eukaryotic cells. It can also be altered to other tasks like measuring the position of cytoskeletal structures as the FtsZ ring or specific
membrane proteins.
Material and methods
Strains and growth media The strains used were Escherichia coli MG1655 with P1 parS insertions at different positions and carrying plasmid pALA2705 expressing the GFP-ParB protein (Nielsen etal., 2006a). Cells were grown at 32 ºC in AB minimal media supplemented with 0.2% glycerol or 0.2 % glucose, 10 µg/ml uracil and 10 µg/ml thiamin for at least 6 generations and harvested at OD600 = 0.1
Software
Image Pro Plus 5.1 was used for all image operations and manual and automatic measurements. The automated counting and measuring procedure was programmed as a macro in Image Pro Plus 5.1.
Pre-processing In general pre-processing was not necessary. Basic procedures like subtracting background and dark-current corrections were made. Fluorescent foci could be enhanced by deconvolution, but this did not affect the performance of the macro significantly. Deconvolution and wavelet noice reduction was shown to improve performance on poor quality images however. We preferred to discard such images though, as good quality images were always obtainable with the P1 GFP-ParB/parS system.
Outlining cells on phase contrast images Outlining of cells was done using the Image Pro Plus ‘Count’ command. The threshold value was set to (B-C)*2/3+C, where B is the intensity of the background and C is the average intensity of the cells (in the center). The background intensity was defined as the image
275624343CellsFoci
100%2000024
7
0
0
0
3
0
0
0
0
4
0
5
427
2
1
99.1%55905642
87.5%1083
99.5%204291
60.0%0350
Performance20Foci
Automatic count
Man
ual
co
un
t
275624343CellsFoci
100%2000024
7
0
0
0
3
0
0
0
0
4
0
5
427
2
1
99.1%55905642
87.5%1083
99.5%204291
60.0%0350
Performance20Foci
275624343CellsFoci
100%2000024
7
0
0
0
3
0
0
0
0
4
0
5
427
2
1
99.1%55905642
87.5%1083
99.5%204291
60.0%0350
Performance20Foci
Automatic count
Man
ual
co
un
t
Table 1. Automatic counting of foci. The number of cells(grey) with the indicated number of foci (blue) as determined by manual counting is shown in the column to the left. In the upper row the result of counting the same cells automatically is shown. 1008 cells were counted. The central part of the table lists the number of cells in each class (number of foci) where two methods agreed (thediagonal) and the number of cells where they did not. This is summed up in the right column as performance; that is the percentage of cells in each class that the automatic counting counted correctly. The total weighed performance is 99 %.

6
median intensity value. The average cell intensity was found iteratively:
The cells were outlined using a threshold starting guess and the central intensity for all cells determined and averaged. This average cell intensity was then used to calculate a new threshold value and the cells were outlined again using the new threshold value. This was continued until the average cell intensity value converged and this value was used for the final calculation of the threshold value.
The threshold starting guess was set at the intensity value including 40 µm2 of the image corresponding to the area of approximately 20 cells. On images with less than 20 cells the starting guess will therefore be too high and on images with more than 20 cells it will usually be too low. The following iterations will then find the correct value. This way of determining the initial threshold worked really good and much better than using the Image Pro Plus ‘best guess’.
The following filter values were used to sort out non-separable cells and debris: cell area: 0.8 – 21 µm2, cell aspect ratio: 1.5 – 10, perimeter ratio: 0.97 – 1, cell length: 1.5 – 6.4 µm, cell width: 0.5 – 1.2 µm. These values were appropriate for E. coli cells growing in AB glycerol minimal media. For other bacteria and/or other growth media, another set of filter values is needed.
Only fields where the cell contrast, (B - C) / B, was higher than 0.55 was used, as we found that fields with a smaller contrast value gave more variable results. Often these images turned out to be slightly out of focus or containing dried up cells.
Identifying fluorescent fociThis is done individually for each cell by defining a proper threshold value of which all foci are brighter and at the same time the background intensity is lower. This threshold value is chosen as the highest one of 7 initial choices (see results) giving the highest number of foci that at the same time meets the following criteria: 1. The foci may not be too variable in size (area). The difference between the largest and smallest focus divided by the mean focus size may not be larger than 1.3.2. The foci may not be too variable in intensity. The difference between the intensity of the brightest and dimmest focus divided by the intensity of the brightest focus may not be larger than 0.3. 3. The dimmest focus may not be too close to the background intensity. The difference between the intensity of the dimmest focus and the lowest threshold value divided by the lowest threshold value may not be lower than 0.1.
These values were found by trial and error. The center of a focus was defined as the center of gravity,
thus weighing not only the area of the focus but also it’s intensity distribution. Each focus’ center coordinates, size and intensity is recorded.
Identifying septated and dividing cells During the outlining of cells an intensity profile was made for each cell. The intensity profile is a histogram of average intensity values over the length axis of the cell, and is created by slicing the cell in equally sized slices as a sausage and integrating the intensity in each slice (each slice is one pixel or 0.06 µm wide). A septated or dividing cell will have higher intensity values in the central part of the cell because of the invagination of the membrane (the background is brighter than the cell). Each cell were given a score according to the formula (I-C)/(B-C), where I is the intensity of the brightest slice in the central third of the cell, C is the cell intensity and B is the image background intensity. Septated cells generally scored between 0.25 and .045. Cells very close to division and divided cells scored above 0.45. The ‘Line profile’ tool of Image Pro Plus 5.1 was used to determine the cell intensity profile. The average of 5 line profiles parallel to the long axis and equally spaced on the cells short axis gave the cell intensity profile.
References
Bennett,A., Osterberg,H., Jupnik,H., and Richards,O. (1951) Phase Microscopy: Principles and Applications John Wiley and Sons, Inc., New York, pp. 1-320.
Gordon,G.S., Sitnikov,D., Webb,C.D., Teleman,A., Straight,A., Losick,R. et al. (1997) Chromosome and low copy plasmid segregation in E. coli: visual evidence for distinct mechanisms. Cell90: 1113-1121.
Koch,A.L. (1996) Similarities and Differences of Individual Bacteria within a Clone. In Escherichia coli and Salmonella cellular and molecular biology. Neidhardt,F.C., Ingraham,J.L., Lin,E.C.C., Low,K.B., Magasanik,B., Reznikoff,W.S. et al. (eds). Washington D.C.: ASM Press, pp. 1640-1651.
Lau,I.F., Filipe,S.R., Soballe,B., Okstad,O.A., Barre,F.X., and Sherratt,D.J. (2003) Spatial and temporal organization of replicating Escherichia coli chromosomes. Mol Microbiol 49: 731-743.
Li,Y., Sergueev,K., and Austin,S. (2002) The segregation of the Escherichia coli origin and terminus of replication. Mol Microbiol 46:985-996.
Nielsen,H.J., Li,Y., Youngren,B., Hansen,F.G., and Austin,S. (2006a) Progressive segregation of the Escherichia coli chromosome. Mol Microbiol 61: 383-393.
Nielsen,H.J., Ottesen,J.R., Youngren,B., Austin,S.J., and Hansen,F.G. (2006b) The Escherichia coli chromosome is organized with the left and right chromosome arms in separate cell halves. Mol Microbiol 62: 331-338.
Niki,H., and Hiraga,S. (1998) Polar localization of the replication origin and terminus in Escherichia coli nucleoids during chromosome partitioning. Genes Dev 12: 1036-1045.
Wang,X., Liu,X., Possoz,C., and Sherratt,D.J. (2006) The two Escherichia coli chromosome arms locate to separate cell halves. Genes Dev 20: 1727-1731.

Progressive segregation of the Escherichia colichromosome
Henrik J. Nielsen,1 Yongfang Li,2 Brenda Youngren,2
Flemming G. Hansen1* and Stuart Austin2
1BioCentrum-DTU, Technical University of Denmark,DK-2800 kgs. Lyngby, Denmark.2Gene Regulation and Chromosome Biology Laboratory,National Cancer Institute, CCR, NCI-Frederick,Frederick, MD 21702-1201, USA.
Summary
We have followed the fate of 14 different loci aroundthe Escherichia coli chromosome in living cells atslow growth rate using a highly efficient labellingsystem and automated measurements. Loci are seg-regated as they are replicated, but with a markeddelay. Most markers segregate in a smooth temporalprogression from origin to terminus. Thus, the overallpattern is one of continuous segregation during rep-lication and is not consistent with recently publishedmodels invoking extensive sister chromosome cohe-sion followed by simultaneous segregation of thebulk of the chromosome. The terminus, and a regionimmediately clockwise from the origin, are exceptionsto the overall pattern and are subjected to a moreextensive delay prior to segregation. The originregion and nearby loci are replicated and segregatedfrom the cell centre, later markers from the variouspositions where they lie in the nucleoid, and theterminus region from the cell centre. Segregationappears to leave one copy of each locus in place, andrapidly transport the other to the other side of the cellcentre.
Introduction
Replication of the circular Escherichia coli chromosomeproceeds bidirectionally from a single origin and termi-nates on the opposite side. During this process, thedaughter chromosomes must be resolved into two sepa-rate nucleoid masses despite the fact that they areseveral orders of magnitude longer than the cell itself, andthat replication initially causes them to be linked togetherby catenation (Zechiedrich and Cozzarelli, 1995).
Once in the bacterial cell cycle, the mass per chromo-somal origin reaches a threshold value (the initiationmass; Donachie, 1968) and chromosome replication isinitiated at all origins (Skarstad et al., 1986). In slowgrowing cells, where the replication and post replicationperiods (C and D) are shorter than the generation time,the bacteria also have a pre-replication period (B) andthey initiate chromosome replication from only one origin(Helmstetter, 1996). After termination of chromosome rep-lication, the cell will divide forming two new cells, eachwith one copy of the chromosome.
Our understanding of chromosome duplication andsegregation dynamics has been greatly enhanced by thedevelopment of methods for determining the physicalpositions of specific proteins or DNA sequences in thecell. Loci can be detected by fluorescence in fixed cells byin situ hybridization (FISH; Niki and Hiraga, 1998). Byusing fluorescent techniques such as the GFP-ParB/parSsystem (Li et al., 2002) or the GFP-LacI/operator system(Gordon et al., 1997; Lau et al., 2003), it has becomepossible to detect the position of discrete DNA loci insidethe living cell. Using these techniques, it is possible todetermine the movement of individual parts of the chro-mosome as they are replicated and segregated.
A Factory model for DNA replication and segregation inbacteria has been proposed (Dingman, 1974; Lemon andGrossman, 2000). In this model, the replication machineryis tethered to the cell centre, and the chromosome feedsinto it as replication proceeds. The model was recentlyrefined and renamed as the Extrusion-Capture model(Lemon and Grossman, 2001). In this model, the newlyreplicated DNA is directed away from the cell centretowards the cell poles by the replication process itself.Thus, segregation of sister markers occurs as replicationproceeds. This model has some experimental support.Several reports suggest that a replication factory islocated in the middle of the cell (Lemon and Grossman,1998; 2000; Koppes et al., 1999; Lau et al., 2003; Molinaand Skarstad, 2004). In addition, origin-proximal lociappear to divide at the cell centre and segregate towardsthe cell poles (Gordon et al., 1997; Sherratt et al., 2001;Fekete and Chattoraj, 2005).
Other observations have suggested that the Factorymodel may need major modifications. There have beenindications that the two replications forks of the replicationfactory split up and migrate to the 1/4 and 3/4 positions
Accepted 15 May, 2006. *For correspondence. E-mail [email protected]; Tel. (+45) 45 25 25 05; Fax (+45) 45 93 28 09.
Molecular Microbiology (2006) 61(2), 383–393 doi:10.1111/j.1365-2958.2006.05245.xFirst published online 12 June 2006
© 2006 The AuthorsJournal compilation © 2006 Blackwell Publishing Ltd

sometime after initiation (the Translocating ReplicationApparatuses model) (Niki et al., 2000; Yamazoe et al.,2005). In a radical departure from the Factory model,evidence has been presented that replication producessister chromosomes that are paired along much of theirlength. In this Sister Chromosome Cohesion model, mostof the chromosomal markers segregate together by anunspecified mechanism later in the cell cycle (Niki et al.,2000; Sunako et al., 2001; Bates and Kleckner, 2005;Yamazoe et al., 2005).
The main objective of our study was to determine thedynamics of chromosome segregation by recording thepositions of different chromosomal loci during the cellcycle. We use a refined version of the GFP-ParB/parSmethod to label the loci (Li et al., 2002). Alternative fluo-rescence labelling methods often give many cells withoutfoci, and the number of fluorescent foci detected appearsto be an underestimate. Previous studies using the GFP-parB/parS method were not entirely free from suchproblems. We have fine-tuned the GFP-ParB/parSsystem to a level where all cells show foci. In addition, wehave used a highly efficient, semi-automated detectionmethod that records the number and positions of foci inthe cells accurately without observer bias.
We use slow growing cells in order to keep the cell cycleas simple as possible. In the majority of cells in our experi-ments, a single origin is duplicated during the cell cycleand only one genome equivalent (one completed chromo-some) is passed on to daughter cells. To facilitate accu-rate interpretation of the data, accurate cell cycleparameters were determined for the observed cell cul-tures, and the cells were alive, in balanced growth, andphotographed immediately after the sample was taken.Our results show that segregation is a progressiveprocess, generally following the same program as repli-cation, but with a significant and fairly constant delay.Thus, our results are not consistent with hypothesesinvolving the simultaneous segregation of the bulk of thechromosome.
Results
Reduced GFP-ParB expression improves the efficiencyof detection of marked loci
The GFP-ParB/parS DNA locus detection systemdepends on the nucleation of GFP-ParB binding to anintroduced P1 parS sequence, and its spreading to adja-cent sequences (Li et al., 2002). In earlier studies, GFP-ParB synthesis was induced from a lac promoter with arelatively high concentration of IPTG (100 mM; Li et al.,2002). Under these conditions, considerably fewer originfoci were observed in the microscope than the number oforigins determined by flow cytometry. Hence some foci
were missed, or pairs of foci were observed as singlefoci. Subsequently, we found that foci were still visible inall cells without induction of the gene encoding GFP-ParB. Using this method the average number of foci percell increases significantly (data not shown). This wasfound to be due to two effects. First, the foci becomevery small and distinct, so that two foci close togetherare more readily resolved (Fig. 1). This is important,because the limited resolution of the light/fluorescencemicroscope makes it difficult to resolve daughter foci asthey begin to move apart during segregation. Second,limited protein levels prevent pairs of foci stickingtogether in a fraction of the cells (H.J. Nielsen, unpub-lished observations). Stickiness is presumably caused byaggregation of excessive levels of bound protein thatcan, in extreme cases, prevent replicated loci fromcoming apart. Therefore, the study we present here wascarried out at the basal level of expression from the lacpromoter without IPTG induction.
The cell cycle of slow-growing MG1655 cells
Strain CC4756 is an MG1655 derivative with the P1 parSsequence at attTn7, close to the origin of replication, andcontains a plasmid producing the modified GFP-ParBprotein (GFP-D30ParB; Li et al., 2002). A population ofcells was grown in a glycerol minimal medium at 32°Cwith a generation time of 115 min. The cells were har-vested and analysed by flow cytometry (Fig. 2A). Usingthe software described by Michelsen et al. (2003), the Cand D periods were estimated to be 71 and 44 minrespectively. Hence, initiation of replication occurs closeto cell division (Fig. 2A).
Fig. 1. Fluorescence and phase contrast micrograph of slowlygrowing E. coli cells. The fluorescence picture is merged with thephase contrast picture. The cells carried a P1 parS sequencelocalized at 54.2 min on the E. coli map and contained plasmidpALA2705 expressing a P1 ParB protein fused to GFP (Li et al.,2002).
384 H. J. Nielsen et al.
© 2006 The AuthorsJournal compilation © 2006 Blackwell Publishing Ltd, Molecular Microbiology, 61, 383–393

Detection of marked loci is very efficient
An aliquot of the culture was treated with rifampicin andcephalexin. Under these conditions, rounds of replicationcomplete to produce separate, non-replicatingchromosomes. However, the cells stop growing andtherefore reflect the size they had reached when sampled(Skarstad et al., 1986). These cells were analysed by flow
cytometry (Fig. 2B) and, in addition, by fluorescencemicroscopy (Fig. 2C). The number and distribution ofcompleted chromosomes, as determined by flow cytom-etry, was then compared with the number and cell popu-lation distribution of fluorescent foci marking the origin.Most of the cells contained two completed chromosomesand had two origin foci in the fluorescent images. A fewcells had one or more than two chromosomes, with acorresponding number of cells having one, three or fourfoci. The comparison of the data in Fig. 2B and C dem-onstrates a very good correlation between the two detec-tion methods, indicating that almost all origin loci inindividual rifampicin-treated cells are well separated andare detected as foci.
The close correspondence of the distributions of fociwith the distributions of origins demonstrates that theGFP-ParB/parS labelling method is capable of detectingvirtually all of the loci in all of the cells as long as the lociare sufficiently well separated. Rifampicin treatment of thecells presumably ensures good separation because allreplication is completed to give separate, non-replicating,chromosomes.
Origin segregation follows initiation after a delay
Figure 2D compares the fraction of cells with two foci as afunction of cell length from the rifampicin-treated popula-tion with that from exponentially growing, non-treatedcells. In the rifampicin-treated cells, replication and seg-regation occur at the same cell size (and thus, at the sameapparent cell age) because the cells are not growing asthe chromosomes segregate. The distribution of segrega-tion events in the exponential population shows that seg-regation occurs in slightly larger cells. This effect ispresumably due to the time taken for the origin loci toseparate after replication and to move sufficiently apart tobe detected as two foci. As can be seen from Fig. 2D, thistime is equivalent to about 0.2 mm of cell length increase,corresponding to approximately 20% of the cell cyclewhen converted to cell age.
Fig. 2. Cell cycle parameters. The cell cycle in slowly growing cellswas determined by flow cytometry (A). The experimental data(black dots) are compared with a theoretical distribution of genomeequivalents (grey line) in a culture with these growthcharacteristics. The number of origins was determined in arifampicin- and cephalexin-treated culture by flow cytometry (B) andby fluorescence microscopy (C). The fraction of cells with two (ormore) foci in the exponential (closed circles) and therifampicin-treated culture (open circles) was also determined as afunction of cell length (D). Though rifampicin inhibits cell growth,the cells do continue to increase in size for a short time afteraddition of the drug. The result is a population of slightly largercells. Thus, the rifampicin-treated cell data were corrected for thisresidual increase by multiplying the cell sizes by a factor of 0.90 tomake the rifampicin-treated cell size distribution identical to thedistribution of the non-treated cells.
Bacterial chromosome segregation 385
© 2006 The AuthorsJournal compilation © 2006 Blackwell Publishing Ltd, Molecular Microbiology, 61, 383–393

Loci are replicated and segregated according to theirdistance from the origin
The fraction of cells with two foci, as a function of cell size,was determined in exponentially growing cell populationsof 14 strains each with the parS sequence inserted at oneof 14 different positions on the chromosome. It should beemphasized that flow cytometry showed that these strainsall have almost identical cell cycles (identical C and Dperiods) to that of the origin-labelled strain CC4756 (datanot shown). Figure 3 shows that two foci appear in the 14strains after replication of the respective parS sequencesin a relatively orderly fashion. The timing of segregation isrelated to the distance of the locus to the origin ofreplication. Each locus is segregated after its predictedtime of replication with a short delay. This delay is verysimilar for most loci, so that they are separated in theorder in which they are replicated (Fig. 3C). The delaydoes not result in a large portion of the chromosomeseparating as a unit, as would be the case in the sisterchromosome cohesion model. The chromosomes sepa-rate progressively. However, there are some interestingdeviations from this general rule. The two foci formed afterreplication of the parS sequence at the 89.0 min locusappear to separate much later than expected from thebehaviour of the other loci. This is also true to a lesserextent for the origin locus at 84.2 min. Hence the 79.0 minlocus, the marker nearest to the origin in the anticlockwisedirection is actually the first to segregate (Fig. 3C). Inaddition, the terminus segregates considerably later thanits projected replication time. Segregation of the terminusis generally delayed until just before cell division (Fig. 3C),as has been shown previously (Li et al., 2002; Lau et al.,2003).
DNA loci are broadly distributed in the cells
We looked at the location of the individual fluorescent DNAfoci in the cells with respect to the progression of the cellcycle (the length of the cells). The scatter plots in Fig. 4show that the positions of the foci in individual cells arerather broadly scattered, although, as we will show, theyfollow some general trends. Some of the scatter is due tomeasurement errors. Due to the limits of the resolution, anerror in determining the centre of a focus of just one pixelwill shift its relative position by ~5% for a newborn cell.Also,some scatter results from using cell length as measure ofprogression through the cell cycle because all cells do notinitiate DNA replication at the same length. The size distri-bution of initiating cells has a coefficient of variation of 15%as judged by flow cytometry (data not shown). This iscomparable to the normally observed variability of a cellculture (Koch, 1996). However, much of the scatter doesreflect real variations in the positions of foci in individualcells. Foci can move rapidly from one position to another.
We have observed foci moving as much as 0.5 mm in amatter of seconds (Fig. 5).
Foci follow general positional patterns
Though the distributions of foci are broad, the averagefocus position in the cell does seem to follow specific
Fig. 3. Separation of foci. The fraction of cells with two (or more)foci was determined for all loci with respect to cell length and isshown in panel A (loci clockwise from the origin) and B(counterclockwise loci). The dotted lines in panels A and Brepresent the average cell size at birth and division respectively.Panel C shows the difference between the expected time ofreplication, as determined by flow cytometry (dotted lines), and thetime of separation, as determined from the separation curves. Thetime of separation is defined as the cell length, converted to cellage, at which 50% of the cells have separated foci.
386 H. J. Nielsen et al.
© 2006 The AuthorsJournal compilation © 2006 Blackwell Publishing Ltd, Molecular Microbiology, 61, 383–393

Fig. 4. Positions of chromosomal loci in the cells. The relative positions of foci are presented for cells with the P1 parS at the indicatedpositions on the chromosomal map (centre panel). Foci from cells with one focus are represented by black dots showing the distance to thenearest pole, foci from cells with two foci are represented with a blue dot (the focus which is closest to a pole) and a red dot. Foci from cellswith three or four foci are not shown. They constitute 9% of the cells for the 79.0 locus, between 3.8% and 4.6% for the 74.1, 84.3 and 92.5loci, approximately 1% for the 89.0 locus, and considerably less than 1% for the remaining loci. Note that, for intermediate loci, the lowerfocus (that is the focus that is closest to a cell pole) shows greater variation than the second focus. This asymmetry is due to a bimodaldistribution, with most foci lying within the cell quarters, but some passing beyond the mass of the origin-proximal DNA at the cell quarters.Hence, there are a number of cells with one focus in the central region and one near a pole (see examples in Fig. 1). In all 14 cases the datafrom 1000 cells have been presented.
Bacterial chromosome segregation 387
© 2006 The AuthorsJournal compilation © 2006 Blackwell Publishing Ltd, Molecular Microbiology, 61, 383–393

trends. Inspection of Fig. 4 shows that the scatter patternsof the loci change progressively from origin to terminus.Prior to segregation (black dots), the origin loci tend tocluster close to the cell centre. The further the unrepli-cated markers are from the origin, the more broadly scat-tered they become. For the replicated and segregated loci(red or blue dots), the origin-proximal markers are rela-tively narrowly distributed, and cluster around the cellquarter positions at late times in the cell cycle. The furtherthe segregated markers are from the origin, the morebroadly scattered they appear and the closer they tend tolie to the cell centre. Note that the great majority of cellswith two foci have one in each half of the cell, irrespectiveof where the marker is placed. This is true of all loci, withless than 3% of the total two-focus cells having both inone cell half. Moreover, the majority of these 3% have onefocus very close to the measured centre, where its posi-tion relative to the true cell centre is in doubt (data notshown). Thus, segregation places different loci in differentgeneral positions, according to their distance from theorigin, but always places duplicate loci in opposite cellhalves. Despite their local mobility, foci, once segregated,seldom if ever move back across the cell centre.
From where do the foci segregate?
Replication is initiated close to cell division in the averagecell and we find the average position of the origin foci atthe centre of the cell at cell birth (Fig. 4). As the cell cycleprogresses, two origin foci move apart to positions at, orclose to, the cell quarter positions. The quarter positionswill become the centres of the newborn cells afterreplication. Thus the origins are now positioned correctlyfor the next generation. Some of the loci close to oriCbehave similarly (e.g. 79.0 min, Fig. 4). Here we also findcells with a single focus close to the middle of the cell andupon replication they move to positions near the cellquarters. In some cases, these foci move further out thanthe origin foci. The terminus also appears to be replicatedat the cell centre. Following division, and coming from thenew cell pole, it is located outside the cell centre at cellbirth, but soon migrates to the centre where it remains upto and beyond termination (Fig. 4).
Although the origin and its associated markers are rep-licated from the cell centre, or close to it, the six interme-diate markers (those at 3.8, 15.2, 21.3 45.1, 54.2 and64.1 min) show no obvious tendency to go to the centrebefore replication and segregation (Fig. 4). As there isalways a marked delay between replication and segrega-tion where the two newly replicated sister loci staytogether and thus appear as one focus which is locatedaway from the centre position, we can rule out the possi-bility that these foci move to the centre and replicatethere. Thus, it appears that the markers are replicated inthis non-central position and segregate from there, withone locus staying and the other moving across the cellcentre (see below).
The path of segregation
In Fig. 6 we have combined the separation data in Fig. 3with the average positions of the foci as calculated fromthe data in Fig. 4. In these plots, the average point offocus separation is displayed as well as the positioning ofthe average foci as cell age increases (see Fig. 6 legend).Due to the method used for orienting the cells (see Fig. 6legend) these plots skew all the data points off-centre.However, they reveal trends in the timing and generalpath of segregation. The origin-proximal foci separateearly at, or near to the cell centre. After initial separationthey continue to move slowly outward until they occupythe cell quarter positions. This is probably due to thedeposition of the bulk of the newly replicated DNA on theinner faces of the developing nucleoids. This would causethe early markers to be placed, on average, nearer to thepoles than later markers. Intermediate loci are segregatedlater, in the order of their replication, and from averagepositions that are away from the centre. They moverapidly to characteristic average positions, such that thecloser the locus is to the origin, the further the foci tend tomigrate towards the pole.
It is interesting to note that, especially in the case ofthe intermediate loci, one focus tends to remain in theposition of its parent whereas its sister moves rapidly tothe other side of the cell (Fig. 6). This phase is followedby a small and slow outward movement. This may givespace to the loci that are segregated later; or perhapsmay reflect the loci being pushed outward by DNA thatis subsequently placed there by the segregationprocess. This is actually very similar to results obtainedwith time-lapse microscopy of Caulobacter crescentus(Viollier et al., 2004).
The replicated terminus foci generally separate late inthe cell cycle from the cell centre and segregate in asymmetrical fashion to positions well within the cellquarters. This segregation presumably reflects the posi-tioning of the terminus on the inner face of the dividing
Fig. 5. Foci are highly mobile. Combined phase contrast andfluorescence images of the same cell taken 1.5 s apart. The cellhad the P1 parS sequence at 54.2 min on the chromosome.
388 H. J. Nielsen et al.
© 2006 The AuthorsJournal compilation © 2006 Blackwell Publishing Ltd, Molecular Microbiology, 61, 383–393

nucleoid, and the subsequent movement of the nucleoidsaway from each other as the cell prepares to divide.
Capture of the origin
When we look at the variation of focus positions late in thecell cycle for the origin and other loci (Fig. 4), the distri-bution of the origin positions in the cells is narrower thanthe distribution of foci in the strains with the parSsequence in other positions. This indicates that the originis captured at the cell quarters which become the cellcentres in readiness for the next round of replication. Thishypothesis is supported by data from rifampicin/cephalexin-treated cells. Here, the origin foci in cells in the
later phases of the cell cycle also show a clear tendencyto cluster around the cell quarters (Fig. 7). While the fociin cells in early stages of replication show much morescatter. Presumably the cells late in the cell cycle hadalready attached the origins at the quarter position beforethe drugs were added. Thus, rifampicin blocks earlycapture of the origin at the sites of initiation possiblybecause a protein required for origin capture is missingwhen the transcription is blocked by rifampicin. In con-trast, rifampicin and cephalexin treatment of the strainhaving the parS sequence close to the terminus (33.7)results in distribution of the replicated termini to the twocell halves but they do not show any sign of going tospecific positions (Fig. 7).
Discussion
We have refined the GFP-ParB/parS system by loweringthe induction of the GFP-ParB protein. All cells still havevisible foci (more than 99%) and these foci are in generalmore discrete and better separated than previouslyreported. Moreover a previous problem of pairs of parSloci sticking together resulting in the observation of fewerfoci than expected is also solved by the lowering of theGFP-ParB protein level in the cell. Although we cannotrule out residual effects of this method of detection on the
Fig. 6. Migration of foci. The figure shows the position andmigration of the different loci before and after separation. For eachcell size class we determined which class of cells (one focus or twofoci) predominated for the loci shown. The average position ofthese foci was then plotted for that cell size. As all measurementsare taken from the cell pole nearest to a focus, the patterns areskewed off-centre towards the lower part of the graph. However,despite this apparent distortion, this is a simple and comprehensiveway to show the general behaviour of the chromosomal loci. Cellpoles and the midcell positions are indicated by solid diagonallines. Cell quarters are indicated by grey diagonal lines.
Fig. 7. Positions of chromosomal loci in cells with terminatedreplication rounds. The relative positions of foci are presented forcells with the P1 parS at the indicated positions. The cultures havebeen treated with rifampicin and cephalexin to allow run-off (RO),i.e. termination of ongoing rounds of chromosome replication and tostop cell division. Foci from cells with one focus are represented byblack dots showing the distance to the nearest pole, foci from cellswith two foci are represented with a blue dot (the focus which isclosest to a pole) and a red dot. Foci from cells with three or fourfoci are shown as grey dots.
Bacterial chromosome segregation 389
© 2006 The AuthorsJournal compilation © 2006 Blackwell Publishing Ltd, Molecular Microbiology, 61, 383–393

behaviour of the DNA, the cells grow normally under theconditions that we use, and the comparison of flow cytom-etry and fluorescence microscopy shown in Fig. 2 showsthat chromosome segregation is completed normally in amajority of the cells. Combined with our automated count-ing method that makes it possible to measure largenumbers of cells in a very short period of time, we believethat our system gives a more accurate and detailedpicture of how the E. coli chromosome is segregated thanhas previously been possible.
Our results clearly show that most of the chromosomesegregates progressively as it replicates. Only the behav-iour of the 89� region and the terminus deviates from thispattern. It is conceivable that a specific locus that affectschromosome segregation (migS, 89 min; Yamaichi andNiki, 2004; Fekete and Chattoraj, 2005) is involved in thedelayed segregation of the 89 min region. The affectedchromosome segment (extending clockwise from the84 min origin through 89 min but stopping short of the92.5 marker) might be held back at the site of replicationby local sister cohesion or affinity to some central struc-ture such as the replication complex. Later markers on thesame half of the chromosome conform to the generalpattern and are segregated in the order of replication. Allmarkers on the other chromosome arm segregatesmoothly and progressively in their order of replication.Thus, we find no evidence for extensive sister chromo-some cohesion and simultaneous segregation of the bulkof the chromosome as has recently been proposed(Sunako et al., 2001; Bates and Kleckner, 2005).
Bates and Kleckner (2005) reported a study of chromo-some segregation using FISH. They studied the segrega-tion of the origin and terminus and two intermediatemarkers on the clockwise arm of the chromosome. Thetwo markers, glnA (87.3 min) and lac (7.8 min), segre-gated at approximately the same time. From this theyconcluded that, following replication, an extensive portionof the clockwise half of the sister chromosomes are pairedby sister cohesion and segregate as a unit some timelater. They assumed that the anticlockwise half of thechromosome behaves similarly. Our work provides analternative explanation. The glnA locus is close to the89 min region that is subjected to an extended delay forsegregation while the lac marker is well beyond it. Thus,their segregation at approximately the same time appearsto be coincidental (cf. the 89 min locus versus the 3.8 minlocus in our Fig. 3B).
Although the segregation of the new chromosomestakes place continuously, there is a fairly constant delay ofabout 20% of the cell cycle between replication and visiblesegregation for most markers (Fig. 3C). This delay isunlikely to be due solely to our inability to resolve closelyspaced foci. It appears that the newly synthesized loci areheld in the vicinity of the forks before segregation. Perhaps
the homologues are held together for a while after repli-cation. This might involve SeqA molecules that bind thehemi-methylated GATC sequences on the newly repli-cated DNA (Guarne et al., 2005). This temporary cohesionof sister loci might give the replication/repair system timeto do any necessary homologous recombination beforethe DNA strands are segregated. A delay of this magnitudemakes it less likely that the activity of the polymerase at theforks provides the direct motive force for segregation.Rather it appears that other forces, which may includepassive dispersal and condensation, ultimately drive seg-regation (Norris et al., 2004). An active process to initiatesegregation involving the directional transport of the originregions cannot, however, be ruled out.
The intermediate markers of both arms of the chromo-some appear to replicate and segregate from a variety ofpositions in the cell. The markers are broadly distributedbefore replication. After replication, during the delay priorto segregation, they remain as single foci in the samepattern. Thus, replication appears to occur at the originallocation of the marker, and the two copies remain close toeach other at the site of synthesis. Segregation thenoccurs by a mechanism that leaves one copy in place,and rapidly moves the other to the opposite cell half.These results are consistent with independent travel ofthe forks around the chromosome arms, rather than witha permanent central factory for replication. This is inagreement with the studies of Bates and Kleckner (2005)on the behaviour of DnaX-GFP foci formed by the repli-cative polymerase, and the studies of Yamazoe et al.(2005) on the behaviour of SeqA foci which form on newlyreplicated DNA at the replication forks.
To summarize our findings: at initiation, the nucleoidhas the origin at or near the cell centre but does notnecessarily have any fixed position for other markersexcepting that origin-proximal markers tend to be nearerthe centre and terminus-proximal ones are broadly distrib-uted out towards the cell poles. Initiation occurs at thecentre and newly replicated DNA for the origin regionbegins to accumulate there. After a delay, lasting approxi-mately 20% of the cell cycle, the replicated origin regionsare separated and move outward. The intermediate locion both sides of the chromosome are broadly scatteredand are segregated in a delayed fashion as are the lociclose to the origin, i.e. the two replicated loci stay togetherfor some time at the position the unreplicated locusoccupied. The delay of segregation of the different loci, wedefine as a sister loci cohesion period. This is differentfrom the notion of sister chromosome cohesion where amajor part of the chromosome is segregated as a unit. Ifthis was case, the points in Fig. 3C would be positionedon a horizontal line. Thus, we suggest that as replicationproceeds beyond the origin region, the forks leave thecentre and follow the path of the DNA arms. As each
390 H. J. Nielsen et al.
© 2006 The AuthorsJournal compilation © 2006 Blackwell Publishing Ltd, Molecular Microbiology, 61, 383–393

marker is replicated, the two copies appear to stay inplace for some time, before the other rapidly movesacross the cell mid-line, adding to the bulk of the othernascent nucleoid. Most of the added DNA presumablyaccumulates inside the previously replicated DNA,pushing earlier markers progressively outward. Thiswould explain the slow progression of the early markersoutward, and why, on average, earlier markers lie closerto the cell poles than later ones (Fig. 6). When the originreaches the cell quarter position, it appears to be capturedthere. Other markers lie roughly in the positions definedby their order of replication. Presumably, the transportedmarkers are added to the DNA mass in an orderly fashion,but considerable mixing of the DNA regions occurs as thenew nucleoids are created, thus explaining the broadscatter of intermediate markers in Fig. 4 at all phases ofthe cell cycle. We note that the distributions of replicatedintermediate markers are not continuous. These loci tendto be excluded from the cell quarter positions (Fig. 4). Thismay be due to exclusion by the mass of the origin-proximal DNA that is tethered by capture at the cellquarters. As replication completes, the outward trend ofthe motion of the forks must be interrupted, because theterminus is clearly held at the cell centre at this stage,presumably by association with the FtsK protein (Liuet al., 1998; Yu et al., 1998; Corre and Louarn, 2005).Thus the forks must move to the cell centre again as theterminus is replicated and the two completed sister nucle-oids come apart.
Based on the localization of markers near the terminus,Wang et al. (2005) have suggested that the resting nucle-oid may have the origin at the centre and the two armsarranged with one on one side of the cell and one on theother. If markers on the left and right arms of the chromo-some are randomly placed within the nucleoid, the forkswould have to cross back and forth across the cell centre-line, and would often both be on the same side of the cell.Based on the distribution of SeqA foci, this is not the case(Brendler et al., 2000; Yamazoe et al., 2005). Thus, itseems probable that the left and right arms of the chromo-some are primarily located in opposite cell halves, similarlyto what has been observed for the Bacillus subtilis chro-mosome (Teleman et al., 1998). The ‘one copy moves andone stays’ mechanism would perpetuate this arrangement,and would produce sister nucleoids whose general patternof marker placement would be as shown and discussedhere and as suggested by Wang et al. (2005).
Experimental procedures
Bacterial strains and media
The strains used were derivatives of E. coli MG1655 withP1parS inserted at 14 different positions around thechromosome. The parS sequences were initially inserted into
strain DY330 as described by Li et al. (2002), using therecombineering technique (Yu et al., 2000) with the oligo-nucleotides listed in Supplementary material (Table S1). Themarked loci were then transferred to strain MG1655 by P1transduction, selecting for the kanamycin-resistance genethat is linked to each parS insert. The GFP-D30ParB proteinwas expressed from pALA2705 (Li et al., 2002). Strains weregrown exponentially for at least six generations beforesamples were taken for microscopy.
Microscopy
Cells were grown at 32°C in AB minimal media (Clark andMaaløe, 1967) with 0.2% glycerol supplemented with1 mg ml-1 thiamine, 1 mg ml-1 uracil and 100 mg ml-1 ampicillin.From the growing culture, 1 ml was harvested, concentrated50-fold, and 2 ml was placed on a polylysine-coated glassslide, covered with a coverslip, and cells immobilized bypressing the coverslip with the thumb. As the cells applied tothe microscope slide are living, the cell population isexpected to drift out of balanced growth with time on the slide.However, when comparing populations that had been on theslide for the minimum practical amount of time (90 s) withthose left on the slide for an extended period approximatingthe maximum length of time incurred in our experiments(10 min) we found no significant differences between the twopopulations. Microscopy was carried out on a Nikon EclipseE-1000 microscope equipped with a Nikon C-CU Universalcondenser, a Nikon Plan Fluor 100¥ objective and aHamamatsu Orca-ER c4742–95 CCD camera. Images wereacquired using Openlab 4.2 software.
Automatic measurement of cells and foci
The length of each cell, the number of foci, and the positionof the foci centres relative to the long cell axis were measuredautomatically using the Image Pro Plus 5.1 image analysisprogram. The relevant features of the program were linked bymacro programming to adapt them to the specific task inhand.
Flow cytometry
Cells were either harvested directly from the exponentiallygrowing culture (exponential sample) or a sample was takento a container containing the minimal media previouslydescribed supplemented with rifampicin and cephalexin to afinal concentration of 200 mg ml-1 and 36 mg ml-1, respec-tively, to terminate ongoing rounds of replication and stop celldivision and incubated for 5 h at 32°C and stop cell division.Cells were washed twice in buffer (1 mM EDTA, 10 mM TrisHCl pH 7.4), fixed in 70% ethanol and stored at 5°C. Beforethe analysis in the flow cytometer, the cells were washedonce in 1 ml of 0.01 M MgCl2, 0.01 M Tris pH 7.5. The cellswere centrifuged and the pellet suspended in 100 ml of buffer.Mithramycin A and ethidium bromide was added to final con-centrations of 100 mg ml-1 and 20 mg ml-1 respectively. Thecells were left at 4°C in the dark for 1 h. The cell size andDNA content distributions were determined in a flow cytom-
Bacterial chromosome segregation 391
© 2006 The AuthorsJournal compilation © 2006 Blackwell Publishing Ltd, Molecular Microbiology, 61, 383–393

eter (Bryte SH, Bio-Rad, Hercules, CA) equipped with a 100W Osram mercury short-arc HBO lamp.
Acknowledgements
We thank Tove Atlung for discussions and comments on themanuscript. The trans-atlantic cooperation between the twolaboratories was made possible by funding from the OttoMønsted foundation and the Oticon foundation in Denmark.
References
Bates, D., and Kleckner, N. (2005) Chromosome and repli-some dynamics in E. coli: loss of sister cohesion triggersglobal chromosome movement and mediates chromosomesegregation. Cell 121: 899–911.
Brendler, T., Sawitzke, J., Sergueev, K., and Austin, S.(2000) A case for sliding SeqA tracts at anchored replica-tion forks during Escherichia coli chromosome replicationand segregation. EMBO J 19: 6249–6258.
Clark, D.J., and Maaløe, O. (1967) DNA replication and thedivision cycle in Escherichia coli. J Mol Biol 23: 99–112.
Corre, J., and Louarn, J.M. (2005) Extent of the activitydomain and possible roles of FtsK in the Escherichia colichromosome terminus. Mol Microbiol 56: 1539–1548.
Dingman, C.W. (1974) Bidirectional chromosome replication:some topological considerations. J Theor Biol 43: 187–195.
Donachie, W.D. (1968) Relationship between cell size andtime of initiation of DNA replication. Nature 219: 1077–1079.
Fekete, R.A., and Chattoraj, D.K. (2005) A cis-actingsequence involved in chromosome segregation in Escheri-chia coli. Mol Microbiol 55: 175–183.
Gordon, G.S., Sitnikov, D., Webb, C.D., Teleman, A.,Straight, A., Losick, R., et al. (1997) Chromosome and lowcopy plasmid segregation in E. coli: visual evidence fordistinct mechanisms. Cell 90: 1113–1121.
Guarne, A., Brendler, T., Zhao, Q., Ghirlando, R., Austin, S.,and Yang, W. (2005) Crystal structure of a SeqA-N fila-ment: implications for DNA replication and chromosomeorganization. EMBO J 24: 1502–1511.
Helmstetter, C.E. (1996) Timing of synthetic activities in thecell cycle. In Escherichia coli and Salmonella Cellular,Molecular Biology. Neidhardt, F.C., Ingraham, J.L., Lin,E.C.C., Low, K.B., Magasanik, B., Reznikoff, W.S., et al.(eds). Washington, DC: American Society for MicrobiologyPress, pp. 1627–1639.
Koch, A.L. (1996) Similarities and differences of individualbacteria within a clone. In Escherichia coli and SalmonellaCellular, Molecular Biology. Neidhardt, F.C., Ingraham,J.L., Lin, E.C.C., Low, K.B., Magasanik, B., Reznikoff,W.S., et al. (eds). Washington, DC: American Society forMicrobiology Press, pp. 1640–1651.
Koppes, L.J., Woldringh, C.L., and Nanninga, N. (1999)Escherichia coli contains a DNA replication compartment inthe cell center. Biochimie 81: 803–810.
Lau, I.F., Filipe, S.R., Soballe, B., Okstad, O.A., Barre, F.X.,and Sherratt, D.J. (2003) Spatial and temporal organizationof replicating Escherichia coli chromosomes. Mol Microbiol49: 731–743.
Lemon, K.P., and Grossman, A.D. (1998) Localization ofbacterial DNA polymerase: evidence for a factory model ofreplication. Science 282: 1516–1519.
Lemon, K.P., and Grossman, A.D. (2000) Movement of rep-licating DNA through a stationary replisome. Mol Cell 6:1321–1330.
Lemon, K.P., and Grossman, A.D. (2001) The extrusion-capture model for chromosome partitioning in bacteria.Genes Dev 15: 2031–2041.
Li, Y., Sergueev, K., and Austin, S. (2002) The segregation ofthe Escherichia coli origin and terminus of replication. MolMicrobiol 46: 985–996.
Liu, G., Draper, G.C., and Donachie, W.D. (1998) FtsK is abifunctional protein involved in cell division and chromo-some localization in Escherichia coli. Mol Microbiol 29:893–903.
Michelsen, O., Teixeira de Mattos, M.J., Jensen, P.R., andHansen, F.G. (2003) Precise determinations of C and Dperiods by flow cytometry in Escherichia coli K-12 and B/r.Microbiology 149: 1001–1010.
Molina, F., and Skarstad, K. (2004) Replication fork andSeqA focus distributions in Escherichia coli suggest areplication hyperstructure dependent on nucleotidemetabolism. Mol Microbiol 52: 1597–1612.
Niki, H., and Hiraga, S. (1998) Polar localization of the repli-cation origin and terminus in Escherichia coli nucleoidsduring chromosome partitioning. Genes Dev 12: 1036–1045.
Niki, H., Yamaichi, Y., and Hiraga, S. (2000) Dynamic orga-nization of chromosomal DNA in Escherichia coli. GenesDev 14: 212–223.
Norris, V., Woldringh, C., and Mileykovskaya, E. (2004) Ahypothesis to explain division site selection in Escherichiacoli by combining nucleoid occlusion and Min. FEBS Lett561: 3–10.
Sherratt, D.J., Lau, I.F., and Barre, F.X. (2001) Chromosomesegregation. Curr Opin Microbiol 4: 653–659.
Skarstad, K., Boye, E., and Steen, H.B. (1986) Timing ofinitiation of chromosome replication in individual E. colicells. EMBO J 5: 1711–1717.
Sunako, Y., Onogi, T., and Hiraga, S. (2001) Sister chromo-some cohesion of Escherichia coli. Mol Microbiol 42:1233–1241.
Teleman, A.A., Graumann, P.L., Lin, D.C., Grossman, A.D.,and Losick, R. (1998) Chromosome arrangement within abacterium. Curr Biol 8: 1102–1109.
Viollier, P.H., Thanbichler, M., McGrath, P.T., West, L.,Meewan, M., McAdams, H.H., and Shapiro, L. (2004)Rapid and sequential movement of individual chromo-somal loci to specific subcellular locations during bacterialDNA replication. Proc Natl Acad Sci USA 101: 9257–9262.
Wang, X., Possoz, C., and Sherratt, D.J. (2005) Dancingaround the divisome: asymmetric chromosome segrega-tion in Escherichia coli. Genes Dev 19: 2367–2377.
Yamaichi, Y., and Niki, H. (2004) migS, a cis-acting site thataffects bipolar positioning of oriC on the Escherichia colichromosome. EMBO J 23: 221–233.
Yamazoe, M., Adachi, S., Kanaya, S., Ohsumi, K., andHiraga, S. (2005) Sequential binding of SeqA protein tonascent DNA segments at replication forks in synchronizedcultures of Escherichia coli. Mol Microbiol 55: 289–298.
392 H. J. Nielsen et al.
© 2006 The AuthorsJournal compilation © 2006 Blackwell Publishing Ltd, Molecular Microbiology, 61, 383–393

Yu, D., Ellis, H.M., Lee, E.C., Jenkins, N.A., Copeland, N.G.,and Court, D.L. (2000) An efficient recombination systemfor chromosome engineering in Escherichia coli. Proc NatlAcad Sci USA 97: 5978–5983.
Yu, X.C., Tran, A.H., Sun, Q., and Margolin, W. (1998) Local-ization of cell division protein FtsK to the Escherichia coli
septum and identification of a potential N-terminal targetingdomain. J Bacteriol 180: 1296–1304.
Zechiedrich, E.L., and Cozzarelli, N.R. (1995) Roles oftopoisomerase IV and DNA gyrase in DNA unlinkingduring replication in Escherichia coli. Genes Dev 9:2859–2869.
Bacterial chromosome segregation 393
© 2006 The AuthorsJournal compilation © 2006 Blackwell Publishing Ltd, Molecular Microbiology, 61, 383–393

Supplementary material
Table 1. Oligomer sequences Oligonucleotides used for chromosomal insertions of the parS site into the genome of MG1655. The underlined sequence is the sequence that is homologue with the chromosomal insertion position; the rest is the sequence homologue to the template containing the parS.
Insert position Primer 1 Primer 2
84.3 min - proximal AttTn7 5’ - GCA GGA TGT TTG ATT AAA AAC
ATA ACA GGA GAA AAA TGC CGA TAA
AAA GCC GAA GCC TTA AAC
5’ – AAT CGG TTA CGG TTG AGT AAT
AAA TGG ATG CCC TGC GTA ACA CAG
CTT TAG AGC GTT TTG CGA T.
33.7 min - 20 kb to dif. 5’ - GCA GGG TAT TGC CCA ACA GAA
CAG CTT TAA ACA TAC CTG ACG ATA
AAA AGC CGA AGC CTT AAA C
5’ - TGA GCT GCT TAG CTT TAC CTG
TCT GTA CTG ATG TAG CCA TCA CAG
CTT TAG AGC GTT TTG CGA T
15.0 min 5’ – GAT CGT CCA TTT TCT TGA ACG
CTT CAT CCC ATT CGA TCG CCG ATA
AAA AGC CGA AGC CTT AAA C
5’ – AGT TGA GCT GCG TAA GAA AGC
CCT CGA GCT GTC ACG CCT GCA CAG
CTT TAG AGC GTT TTG CGA T
21.3 min 5’ – ACG TGG TGA ATC TGA AAC TCG
CCT GAG AAA ACA GGG GTA ACG ATA
AAA AGC CGA AGC CTT AAA C
5’ – TGG CGA TCT GTA CGA GAA GAT
AAC TAA AGC ACT GGC TTG ACA CAG
CTT TAG AGC GTT TTG CGA T
3.8 min 5’ – GGC GCG AAG CAA GGC CGC ATC
AGC CAG CGA GAA TAC TTG ACG ATA
AAA AGC CGA AGC CTT AAA C
5’ – CGT CGG TAA ACT CCA GCG GCA
GTG CTA CGT CAT CAC TCA TCA CAG
CTT TAG AGC GTT TTG CGA T
45.1 min 5’ - GAC TAT TAC CGA TTT AGC GCG
TGA AAA CGT CCG CAA CCT GCG ATA
AAA AGC CGA AGC CTT AAA C
5’ - CAC GTA AGG CGT CAA TGA CGC
GCT GGC TTT CTT CAC GGG TCA CAG
CTT TAG AGC GTT TTG CGA T
54.2 min 5’ – CAA TTT CCT CGC CCG TCT CGA
TAT TGA CGA ATC AGC ATA ACG ATA
AAA AGC CGA AGC CTT AAA C
5’ - AGC GCT GGA TTT TAT TGC TGA
ACG CGA AAA TCA GCA GTA ACA CAG
CTT TAG AGC GTT TTG CGA T
64.1 min 5’ – CGA TAC CGA TCT CAC CGC CGA
AAA TCT GCT GCG TTT GCC CCG ATA
AAA AGC CGA AGC CTT AAA C
5’ – CTT CGA TGG TCT GGC GAC GGC
GAA TCA ACC GCG CCT GAC CCA CAG
CTT TAG AGC GTT TTG CGA T
74.1 min 5’ – TTA CTT CCG CCA TTT TTG CCA
GCT CAC CAA TGC GAT ACA TCG ATA
AAA AGC CGA AGC CTT AAA C
5’ – TTA TGC TGA CAA GTT GTT GGA
CAA AAT CAA CGA TAA CTA GCA CAG
CTT TAG AGC GTT TTG CGA T
79,0 min 5’ - GCA AAC CGC CCG CTA AAA GTC
GAA TTT TTG TGC CCT GCA TCG ATA
AAA AGC CGA AGC CTT AAA C
5’ – TCG TGC GCC GGA TGG CAA AAC
GCA CGA ATT ATC CTC TTA ACA CAG
CTT TAG AGC GTT TTG CGA T
89,0 min 5’ – CAG TGG CTG TGG TGT TAT GGA
TAT CGT CTG ACG TGC TCA TCG ATA
AAA AGC CGA AGC CTT AAA C
5’ – CGC GAT TTG CCA TAC GCT GGG
GGT TCG ACC TGG TTT ATA ACA CAG
CTT TAG AGC GTT TTG CGA T
92.5 min 5’ - CAA GTT GAA AAC TCG CCT GCG
CGA AGC GGC ACT GGC GTA ACG ATA
AAA AGC CGA AGC CTT AAA C
5’ – AGA ATG TCA AAA ACA ACA TCA
ATG CGA TAA TTT TTT TCA TCA CAG
CTT TAG AGC GTT TTG CGA T

The Escherichia coli chromosome is organized withthe left and right chromosome arms in separate cellhalves
Henrik J. Nielsen,1 Jesper R. Ottesen,1†
Brenda Youngren,2 Stuart J. Austin2 andFlemming G. Hansen1*1BioCentrum-DTU, Technical University of Denmark, DK2800 Kgs. Lyngby, Denmark.2Gene Regulation and Chromosome Biology Laboratory,National Cancer Institute, CCR, NCI-Frederick,Frederick, MD 21702-1201, USA.
Summary
We have developed a system for the simultaneouslabelling of two specific chromosomal sites usingtwo different fluorescent ParB/parS systems. Usingthis, we demonstrate that the two chromosome armsare spatially arranged in newborn cells such thatmarkers on the left arm of the chromosome lie inone half of the cell and markers on the right arm ofthe chromosome lie in the opposite half. This isachieved by reorganizing the chromosome arms ofthe two nucleoids in pre-division cells relative to thecell quarters. The spatial reorganization of the chro-mosome arms ensures that the two replication forksremain in opposite halves of the cell during replica-tion. The relative orientation of the two reorganizednucleoids in pre-division cells is not random.Approximately 80% of dividing cells have theirnucleoids oriented in a tandem configuration.
Introduction
Although some reports suggest otherwise (Sunako et al.,2001; Bates and Kleckner, 2005), it has long been pro-posed that the Escherichia coli chromosome is segregatedprogressively as it is replicated (Dingman, 1974). Exten-sive analysis of the positions of fluorescently labelledmarkers around the chromosome clearly shows that thisprinciple applies, at least in slow growing MG1655 cells(Nielsen et al., 2006). Under these conditions, newborncells have the origin of replication at or near the cell centre.
Replication is initiated there. However, as the replicationforks progress away from the origin, they dissociate fromthe cell centre and travel outward along the path of theunreplicated DNA (Yamazoe et al., 2005; Nielsen et al.,2006). The replicated sister duplexes remain close to eachother for a while after replication (sister loci cohesion,Nielsen et al., 2006) but are then segregated such that onecopy remains approximately in place and the other movesto the opposite half of the cell. The origins are located nearthe cell quarters in pre-division cells, in readiness for thenext round of replication in the following cell cycle. Like theorigin of replication, the terminus of the chromosome islocated at the cell centre prior to its replication. The dupli-cated termini remain at the centre until late in the cell cycle.Thus, cell division generally results in newborn cells withthe terminus near to the newest cell pole (Niki and Hiraga,1998; Nielsen et al., 2006).
In our previous study, the bulk of the chromosomeappeared to be rather haphazardly organized, withmarkers occupying a wide variety of possible positions inthe nucleoid, both before and after replication and segre-gation (Nielsen et al., 2006). However, this was shownusing a single marked sequence in each strain examined.As it is not possible to tell one end of the cell from theother in the rod-shaped E. coli cells, asymmetrically dis-tributed markers could not be assigned to a specific half ofthe cell. Here, we describe the development of a newmethod for differentially labelling two specific chromo-some sites simultaneously in living cells. The results showthat one arm (replichore) of the chromosome is present inone half of the pre-replicative cell and the other in theother half. This implies that, although DNA replicationand segregation results in considerable disorder inthe nascent nucleoids, some unknown mechanism rear-ranges the chromosome arms in dividing cells withrespect to the cell quarters, so that newborn cells have anorderly separation of the arms. We discuss the probableadvantages to the cell gained from this rearrangement.
Results
Detection of two loci simultaneously using two plasmidparS sites of different specificity
We have previously described a fluorescent labellingsystem based on the P1 plasmid partition site P1parS and
Accepted 17 July, 2006. *For correspondence. E-mail [email protected]; Tel. (+45) 45252505; Fax (+45) 45932809.†Present address: Department of Veterinary Pathobiology, RoyalVeterinary and Agricultural University, Stigbøjlen 4, DK-1870Frederiksberg C, Denmark.
Molecular Microbiology (2006) 62(2), 331–338 doi:10.1111/j.1365-2958.2006.05346.xFirst published online 21 September 2006
© 2006 The AuthorsJournal compilation © 2006 Blackwell Publishing Ltd

its cognate fluorescent binding protein GFP-D30ParB (Liet al., 2002; Nielsen et al., 2006). This is derived from thepartition system of the P1 plasmid. The P1 partitionsystem is one of a closely related family of such elementsfound in the plasmids of a variety of bacterial species(Dabrazhynetskaya et al., 2005). We have developed asimilar labelling system based on the P1-like partitionsystem of the pMT1 virulence plasmid of Yersinia pestis.Strain FH2953 was constructed with a pMT1parS site atthe 22′ position in the chromosome and a P1parS site at54′ (chromosomal minutes). This strain was the finalrecipient in the construction of a plasmid pFHC2973,which produces both CFP-P1D30ParB and yGFP-pMT1D23ParB proteins (Experimental procedures). Asthe ParB proteins of P1 and pMT1 only recognize theparS sites of their own species (Youngren et al., 2000),the cells of the strain contain two types of fluorescent foci:cyan foci marking the position of the DNA containing theP1parS site and green foci marking the position of theDNA containing the pMT1parS site (Fig. 1B). It should benoted that the fluorescent ParB proteins do not cross-react (form fluorescent foci) in strains carrying parSsequences of the opposite specificity (data not shown).The cells were grown in minimal glycerol medium at 32°C.
Under these conditions, initiation occurs at cell birth, andthe 22′ and 54′ regions are duplicated and segregatedapproximately half way through the cell cycle (Nielsenet al., 2006). Note that most of the smaller cells containone cyan and one green focus whereas most of the largercells contain two cyan and two green foci. Thus, thenumber of foci produced appears to correlate well with thenumber of marked loci present in the cells. We havepreviously shown that foci produced by the GFP-P1D30ParB/P1parS labelling technique are accurate indi-cators of the number of separate P1parS sequencespresent in each cell (Nielsen et al., 2006). The averagenumber of cyan and green foci, and the distributions ofthese foci in the population of FH2973 cells, correspondalmost exactly to those obtained using a single GFP-P1D30ParB/P1parS label at each of these two chromo-somal sites (data not shown).
Two markers on the same chromosome arm colocalizein the same cell half
Strain FH3518 has the P1parS site inserted at 15′ and thepMT1parS site inserted at 22′ on the chromosomal map(Fig. 1A). These two loci are on the same arm (replichore)
Fig. 1. Images of strains FH2973 andFH3518. Fluorescent images captured with agreen filter were pseudo-coloured green andfluorescent images captured using a cyanfilter were pseudo-coloured cyan and bothsubsequently overlaid on the phase-contrastimage. A shows cells of the FH3518 strain(P1parS at 15′ and pMT1parS at 22′) and Bshows cells of the FH2973 strain (P1parS at54′ and pMT1parS at 22′). The insertmini-maps show the chromosomal position ofthe P1parS locus (cyan) and the pMT1parSlocus (green) in the two strains. The originand terminus are shown in red and blackrespectively.
332 H. J. Nielsen et al.
© 2006 The AuthorsJournal compilation © 2006 Blackwell Publishing Ltd, Molecular Microbiology, 62, 331–338

of the chromosome and are therefore replicated in thesame direction. Using the double label system, we visu-alized these loci in cells growing in glycerol minimal mediaat 32°C. The results are analysed in Fig. 2A and B. Wesee that foci corresponding to both of these loci are regu-larly found outside the cell centre (outside the centralcross in the figure). This is in agreement with previousfindings (Nielsen et al., 2006). But we also see that thereis a high degree of correlation between the position of thegreen and cyan foci. In cells with one cyan and one greenfocus (1c1g), the distance between the two foci variesconsiderably, but they are generally quite close to eachother or are coincident. Moreover, both foci are within thesame cell half in the majority (93%) of the cells (the upperright and lower left quadrants in Fig. 2A, see also Fig. 4).Hence the two loci are almost always in the same half ofthe cell prior to duplication and segregation. After dupli-
cation, the cells end up with one cyan and one greenfocus in each cell half and, again, these pairs of foci tendto be close together or coincident (Fig. 2B). As shownpreviously for single markers (Nielsen et al., 2006), themarker pairs in individual cells tend to be asymmetricallydistributed, with the pair in one cell half near to the cellcentre and the pair in the other half nearer to the outsidepole (see Fig. 1A for examples).
Markers on opposite chromosome arms are in oppositecell halves
As described above, strain FH2973 has its P1parSmarker at 54′ and pMT1parS at 22′ on the chromosomalmap (Fig. 1B). These two loci are on opposite arms (rep-lichores) of the chromosome and are therefore replicatedin opposite directions. This strain was analysed in the
Fig. 2. Relative position of foci. The relative distance from the cell pole of cyan and green foci was measured for strain FH3518 (P1parS at15′ and pMT1parS at 22′; A and B) and strain FH 2973 (P1parS at 54′ and pMT1parS at 22′; C and D, see drawings above A and C). Therelative position of the cyan focus is plotted against the relative position of the green focus for each cell. Cells with one pair of foci are shownin A and C, cells with two pairs of foci are shown in B and D. In B and D the blue circles represents the first pair of foci in the cell and the redsquares the second. Cells are measured from a random end. Dots inside the grey square in D correspond to foci pairs that have not beenrearranged.
E. coli chromosome segregation 333
© 2006 The AuthorsJournal compilation © 2006 Blackwell Publishing Ltd, Molecular Microbiology, 62, 331–338

same way as FH3518 and the results are shown inFig. 2C and D. Here, we see a radically different pattern.In cells with one cyan and one green focus (1c1g cells),the loci hardly ever colocalize (Fig. 2C). Moreover, in alarge majority of the 1c1g cells (90%) the cyan and greenfoci are on opposite sides of the cell centre (the upper leftand lower right quadrant in the figure, see also Fig. 4).The few cells with both foci on the same side always haveat least one of them close to the cell centre. We concludethat, prior to replication, the two markers that are on thesame chromosome arm are in the same cell half, whereastwo markers on opposite arms of the chromosome are inopposite cell halves.
Duplicated loci from opposite arms colocalizetemporarily on the inside of the cell quarters
Figure 2D shows the measurements on cells with twocyan and two green foci (2c2g cells) of FH2973; the strainmarked at 22′ and 54′ on opposite chromosome arms.Note that these cells generally have a cyan and green pairof foci in each cell half, and that cyan and green foci areplaced such that they are on opposite sides of the cellquarter positions (dots outside the grey square, Fig. 2D).When these cells divide, they will produce two daughterswith a green and cyan focus in each cell half, as isobserved for the 1c1g cells.
However, there is also a portion of the 2c2g populationthat does not show this pattern. These cells have both locion the inside of the quarter position in one or both cellhalves (dot inside the grey square, Fig. 2D). If these cellsdivided with this configuration they would producenewborn cells with both loci in the same cell half. This wevirtually never see (Fig. 2C). Hence, the 2c2g subpopula-tion appears to represent a stage in which the chromo-some is disorganized, and will later be reorganized so thatthe chromosome arm will be in opposite cell halves in thenext generation. To investigate this, we compared asubset of the smaller (youngest) cells in the 2c2g popu-lation with a subset of the septated ones that were aboutto divide (Fig. 3A). The population of smaller 2c2g cellscontained a large fraction of cells that have both foci onthe inside of the cell quarters. However, the septated cellsthat are nearer to cell division had far fewer cells of thistype. This was observed in several experiments, and wasalso seen when the smaller 2c2g cells were comparedwith large ones, irrespective of the state of division. Thus,colocalization of the 22′ and 54′ loci within the cell quarterpositions appears to be an intermediate step. Eventually,the nucleoid will reorganize so that the loci will span thecell quarters and will be on opposite sides of the cellcentre after cell division.
As some of the 1c1g cells did have the foci on the sameside of the cell centre, we speculated that, occasionally,
the arranging of the chromosome arms is not completeduntil after cell division. If that is the case we would expectthe proportion of 1c1g cells with both loci on the sameside of the cell centre to be maximal in the newborn cellsand that the fraction of such cells would decrease as thecells grow. This trend was observed (Fig. 3B).
The ordering of the chromosome arms extends to othermarkers
Figure 4 shows the result of the analysis of four newstrains that have the P1parS and pMT1parS sites at dif-
Fig. 3. Progressive rearrangement of loci.A. The fraction of ‘unsorted’ FH2973 cells (both the two 22′ and thetwo 54′ foci inside the cell quarters), the fraction of cells with onehalf ‘sorted’ (one 22′ and one 54′ focus on each side of the quarterin one half and the 22′ and 54′ foci inside the quarter in the otherhalf) and the fully ‘sorted’ cells (one 22′ and one 54′ focus on eachside of the quarter in both cell halves) is shown. This wasdetermined for 83 dividing cells (166 cell halves; black bars) and 83of the smallest 2c2g non-dividing cells (white bars).B. The fraction of ‘sorted’ 1c1g cells with the 22′ focus and 54′focus in separate cell halves is shown for different cell size classes(filled circles). The fraction of ‘sorted’ 2c2g half-cells (having the 22′and 54′ focus on opposite sides of the cell quarter) is shown fordifferent cell size classes (open circles).
334 H. J. Nielsen et al.
© 2006 The AuthorsJournal compilation © 2006 Blackwell Publishing Ltd, Molecular Microbiology, 62, 331–338
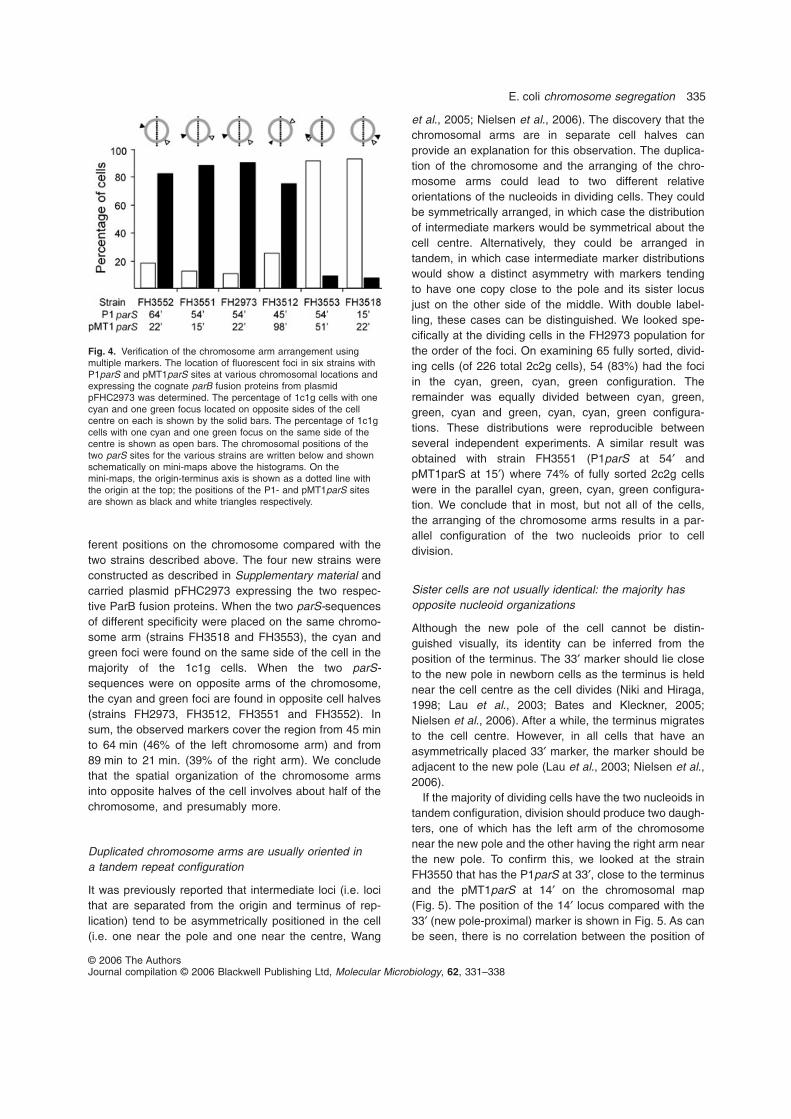
ferent positions on the chromosome compared with thetwo strains described above. The four new strains wereconstructed as described in Supplementary material andcarried plasmid pFHC2973 expressing the two respec-tive ParB fusion proteins. When the two parS-sequencesof different specificity were placed on the same chromo-some arm (strains FH3518 and FH3553), the cyan andgreen foci were found on the same side of the cell in themajority of the 1c1g cells. When the two parS-sequences were on opposite arms of the chromosome,the cyan and green foci are found in opposite cell halves(strains FH2973, FH3512, FH3551 and FH3552). Insum, the observed markers cover the region from 45 minto 64 min (46% of the left chromosome arm) and from89 min to 21 min. (39% of the right arm). We concludethat the spatial organization of the chromosome armsinto opposite halves of the cell involves about half of thechromosome, and presumably more.
Duplicated chromosome arms are usually oriented ina tandem repeat configuration
It was previously reported that intermediate loci (i.e. locithat are separated from the origin and terminus of rep-lication) tend to be asymmetrically positioned in the cell(i.e. one near the pole and one near the centre, Wang
et al., 2005; Nielsen et al., 2006). The discovery that thechromosomal arms are in separate cell halves canprovide an explanation for this observation. The duplica-tion of the chromosome and the arranging of the chro-mosome arms could lead to two different relativeorientations of the nucleoids in dividing cells. They couldbe symmetrically arranged, in which case the distributionof intermediate markers would be symmetrical about thecell centre. Alternatively, they could be arranged intandem, in which case intermediate marker distributionswould show a distinct asymmetry with markers tendingto have one copy close to the pole and its sister locusjust on the other side of the middle. With double label-ling, these cases can be distinguished. We looked spe-cifically at the dividing cells in the FH2973 population forthe order of the foci. On examining 65 fully sorted, divid-ing cells (of 226 total 2c2g cells), 54 (83%) had the fociin the cyan, green, cyan, green configuration. Theremainder was equally divided between cyan, green,green, cyan and green, cyan, cyan, green configura-tions. These distributions were reproducible betweenseveral independent experiments. A similar result wasobtained with strain FH3551 (P1parS at 54′ andpMT1parS at 15′) where 74% of fully sorted 2c2g cellswere in the parallel cyan, green, cyan, green configura-tion. We conclude that in most, but not all of the cells,the arranging of the chromosome arms results in a par-allel configuration of the two nucleoids prior to celldivision.
Sister cells are not usually identical: the majority hasopposite nucleoid organizations
Although the new pole of the cell cannot be distin-guished visually, its identity can be inferred from theposition of the terminus. The 33′ marker should lie closeto the new pole in newborn cells as the terminus is heldnear the cell centre as the cell divides (Niki and Hiraga,1998; Lau et al., 2003; Bates and Kleckner, 2005;Nielsen et al., 2006). After a while, the terminus migratesto the cell centre. However, in all cells that have anasymmetrically placed 33′ marker, the marker should beadjacent to the new pole (Lau et al., 2003; Nielsen et al.,2006).
If the majority of dividing cells have the two nucleoids intandem configuration, division should produce two daugh-ters, one of which has the left arm of the chromosomenear the new pole and the other having the right arm nearthe new pole. To confirm this, we looked at the strainFH3550 that has the P1parS at 33′, close to the terminusand the pMT1parS at 14′ on the chromosomal map(Fig. 5). The position of the 14′ locus compared with the33′ (new pole-proximal) marker is shown in Fig. 5. As canbe seen, there is no correlation between the position of
Fig. 4. Verification of the chromosome arm arrangement usingmultiple markers. The location of fluorescent foci in six strains withP1parS and pMT1parS sites at various chromosomal locations andexpressing the cognate parB fusion proteins from plasmidpFHC2973 was determined. The percentage of 1c1g cells with onecyan and one green focus located on opposite sides of the cellcentre on each is shown by the solid bars. The percentage of 1c1gcells with one cyan and one green focus on the same side of thecentre is shown as open bars. The chromosomal positions of thetwo parS sites for the various strains are written below and shownschematically on mini-maps above the histograms. On themini-maps, the origin-terminus axis is shown as a dotted line withthe origin at the top; the positions of the P1- and pMT1parS sitesare shown as black and white triangles respectively.
E. coli chromosome segregation 335
© 2006 The AuthorsJournal compilation © 2006 Blackwell Publishing Ltd, Molecular Microbiology, 62, 331–338

the chromosome arm carrying the 14′ parS-sequence andthe new pole in this plot. This is in agreement with atandem configuration of the chromosomes in most divid-ing cells, as the arm carrying the 14′ marker would beadjacent to the new pole in one cell of a newborn pair, andadjacent to the old pole in the other.
It has generally been assumed that both daughter cellsproduced by binary fission in bacteria are more or lessidentical. In the context of our present finding, this wouldimply that the two nucleoids are oriented symmetricallyand that newborn sisters both have a particular arm of thechromosome adjacent to the new pole. This is clearly notthe case in most cells. The two daughters are usuallyradically different in this respect.
Discussion
The E. coli chromosome replicates bidirectionally, witheach half of the chromosome replicated by a differentreplication fork. How are these two replicating regionsarranged in the cell? The possibility that the forks remaintogether throughout replication as a central factory nowappears to be eliminated. The forks follow separate pathsas they progress in opposite directions away from theorigin (Bates and Kleckner, 2005; Yamazoe et al., 2005;Nielsen et al., 2006).
One could imagine two extreme cases. In one, the forksfollow the path of a randomly arranged chromosomewithin the nucleoid. Thus replication would take place
throughout the nucleoid with the forks frequently passingeach other as replication takes place. In the otherextreme, the two arms of the chromosome (replichores)would be arranged in opposite halves of the cell and eachreplication fork would be constrained to its own cell half.This arrangement would greatly simplify the topologicalproblems encountered while replicating and segregatingthe chromosome. As the replication forks follow the pathof the DNA, they would remain in opposite cell halves andnot cross-over the centre line or pass across the path ofthe opposing fork. Thus the potential for knotting andentanglement of the replication products would be muchreduced.
In this study, we show definitive evidence that the leftand right chromosome arms are indeed organized onopposite sides of the cell centre. This is in agreement withthe recent observation that the terminus region of thechromosome is organized such that markers to the left ofthe terminus generally lie in the opposite cell half to thoseto the immediate right of the terminus (Wang et al., 2005).The fact that the chromosome of slow growing cells isorganized with one arm in each cell half has been previ-ously hinted by the fact that the replication forks appear tomigrate to opposite cell halves in slow growing cellsduring replication and seldom localize in the same halfonce they are separated (Brendler et al., 2000; Bates andKleckner, 2005; Yamazoe et al., 2005).
We show here that the left arm/right arm organiza-tional plan extends to much of the chromosome, andthat this is achieved by a previously unsuspected DNArearrangement mechanism. It appears to take relativelydisorganized products of nucleoid replication and segre-gation and arranges the nucleoid arms with respect tothe cell quarter positions. After duplication, the loci of theopposite arms often localize together in the spacebetween the quarter and the centre of the cell. The chro-mosome arms are then actively sorted out with respectto the cell quarters (Fig. 6). This reorganization usuallytakes place before cell division, but some cells dividebefore the rearrangement is completed. We never findpre-division cells with both loci from opposite armstogether on the outside of the quarter. Hence the twoarms are initially put on the same side of the quarter (theinside) and the rearrangement mechanism subsequentlyputs one and only one arm on the outside. We find thatthe orientation of the arm arrangement in one cell half isdependent on the orientation of the other. Usually, butnot always, the two arranged chromosomes arearranged in a tandem configuration so that the left armof the chromosome is on the outside of the quarter inone cell half and on the inside in the other half; and viceversa for the right arm (Fig. 6). This discovery explainsthe high number of cells with asymmetric distributions ofintermediately replicated loci in single colour studies
Fig. 5. Location of the 14 min marker with respect to the new pole.The 1c1g cells of strain FH3550 with P1parS at 33′ and pMT1parSat 14′ were oriented with respect to the terminus focus, which isadjacent to the new pole of the cell. The relative distance from thisnew pole to the 14′ focus was then measured and the distributionfor all cells plotted as a histogram (1003 cells measured). It isevident that it is equally probable to find the 14′ locus close toeither the new or the old pole. The insert mini-map shows thechromosomal position of the 14′ marker (white) and the terminusmarker (black); the origin is shown in grey.
336 H. J. Nielsen et al.
© 2006 The AuthorsJournal compilation © 2006 Blackwell Publishing Ltd, Molecular Microbiology, 62, 331–338

(Nielsen et al., 2006). The rearrangement mechanismitself may bias the relative nucleoid configurations to thetandem arrangement. Alternatively, the rearrangementmechanism might be indifferent to which arm is to bemoved, but the DNA segregation mechanism biases theplacement of newly replicated DNA in the central cellquarters in such a way that a tandem configurationbecomes likely.
In any case, it is clear that a previously unsuspectedmechanism exists for DNA arrangement at the cellquarters. The nature of this mechanism, the informationpresent on the chromosome arms to direct it, and the
proteins present at the quarters that we presume to carryit out, remain to be identified.
Experimental procedures
Bacterial strains and plasmids
The strains used in this study are all derivatives of strainFH2926, a DlacI-lacA derivative of MG1655, carrying thedifferent P1parS sequence and the pMT1parS sequence atvarious chromosome positions. The strains were constructedas described in Supplementary material. The construction ofplasmid pFHC2973, which carries both the P1-parB gene andthe pMT1-parB gene fused to the genes for the fluorescentproteins CFP and yGFP, respectively, is also described inSupplementary material.
Growth conditions, microscopy and measurements
The general methods employed were as previouslydescribed (Nielsen et al., 2006).
References
Bates, D., and Kleckner, N. (2005) Chromosome and repli-some dynamics in E. coli: loss of sister cohesion triggersglobal chromosome movement and mediates chromosomesegregation. Cell 121: 899–911.
Brendler, T., Sawitzke, J., Sergueev, K., and Austin, S.(2000) A case for sliding SeqA tracts at anchored replica-tion forks during Escherichia coli chromosome replicationand segregation. EMBO J 19: 6249–6258.
Dabrazhynetskaya, A., Sergueev, K., and Austin, S. (2005)Species and incompatibility determination within the P1parfamily of plasmid partition elements. J Bacteriol 187: 5977–5983.
Dingman, C.W. (1974) Bidirectional chromosome replication:some topological considerations. J Theor Biol 43: 187–195.
Lau, I.F., Filipe, S.R., Soballe, B., Okstad, O.A., Barre, F.X.,and Sherratt, D.J. (2003) Spatial and temporal organizationof replicating Escherichia coli chromosomes. Mol Microbiol49: 731–743.
Li, Y., Sergueev, K., and Austin, S. (2002) The segregation ofthe Escherichia coli origin and terminus of replication. MolMicrobiol 46: 985–996.
Nielsen, H.J., Li, Y., Youngren, B., Hansen, F.G., and Austin,S. (2006) Progressive segregation of the Escherichia colichromosome. Mol Microbiol 61: 383–393.
Niki, H., and Hiraga, S. (1998) Polar localization of the repli-cation origin and terminus in Escherichia coli nucleoidsduring chromosome partitioning. Genes Dev 12: 1036–1045.
Sunako, Y., Onogi, T., and Hiraga, S. (2001) Sister chromo-some cohesion of Escherichia coli. Mol Microbiol 42:1233–1241.
Wang, X., Possoz, C., and Sherratt, D.J. (2005) Dancingaround the divisome: asymmetric chromosome segrega-tion in Escherichia coli. Genes Dev 19: 2367–2377.
Yamazoe, M., Adachi, S., Kanaya, S., Ohsumi, K., andHiraga, S. (2005) Sequential binding of SeqA protein to
Fig. 6. Chromosome rearrangement model.A. At initiation, the origin region of the chromosome (black circles)is at the cell centre, and the replication forks (yellow triangles) formthere. The two arms (light blue and pink lines) of the chromosomeare arranged either side of the cell centre. The terminus (greensquare) is near the new cell pole.B. At mid-replication, the forks have dissociated from the cell centreand are following the path of the DNA template. The newlyreplicated DNA products (dark blue and red) stay together for awhile (sister loci cohesion, grey hatching) and then segregate toopposite sides of the cell centre. This DNA is relativelydisorganized and resides in the central half of the cell.C. As replication progresses, the new origins attach to the cellquarter positions and the two arms of each nascent chromosomeare sorted out so that the arms lie on either side of the cellquarters.D. At termination, the origins are at the quarter positions, and theterminus and forks are at the cell centre. The arms (replichores) ofthe two new chromosomes are arranged with respect to the cellquarters. After the following post-replicational period (D-period), celldivision will restore the starting state of the cycle.
E. coli chromosome segregation 337
© 2006 The AuthorsJournal compilation © 2006 Blackwell Publishing Ltd, Molecular Microbiology, 62, 331–338

nascent DNA segments at replication forks in synchronizedcultures of Escherichia coli. Mol Microbiol 55: 289–298.
Youngren, B., Radnedge, L., Hu, P., Garcia, E., and Austin,S. (2000) A plasmid partition system of the P1-P7par familyfrom the pMT1 virulence plasmid of Yersinia pestis.J Bacteriol 182: 3924–3928.
Supplementary material
The following supplementary material is available for thisarticle online:
Appendix S1. Strain construction and construction of plas-mids carrying two different ParB fluorescent proteins of dif-ferent colours.Figure S1. Structure of plasmids for generating PCR prod-ucts for recombineering.Figure S2. Construction of plasmids carrying genes for fluo-rescent ParB proteins of different specificities.Table S1. Oligonucleotide sequences.
This material is available as part of the online article fromhttp://www.blackwell-synergy.com.
338 H. J. Nielsen et al.
© 2006 The AuthorsJournal compilation © 2006 Blackwell Publishing Ltd, Molecular Microbiology, 62, 331–338

Figure S1. Structure of plasmids for generating PCR-products for recombineering. The plasmids were used to generate the PCR fragments shown by the arcs outside the plasmids. The inner arc was used as the template to generate DNA which could be used for recombineering due to 40-50 bp homology (hom and lac-hom ends) to the E. coli chromosome. Plasmid pFHC3228 is a derivative of pHJN2 carrying the pMT1 parS sequence. termA and termR are the positions of an artificial and an rpoC terminator sequence, respectively. Only restriction enzyme sites used in the construction of pFHC3228 from pHJN2 are shown.
Supplementary material
Strain construction
Strain FH2926 has the lac operon deleted, and was constructed as follows. First a PCR fragment carrying the cat gene bracketed by two loxP sites was synthesized, using the oligonucleotide pair 15.08-15.09 (Table S1) with plasmid pHJN2 (Figure S1) as template. This PCR fragment was used as template for a new PCR reaction using the oligonucleotide pair 22.02-22.03 (Table S1). The PCR fragment was transformed into an MG1655 strain carrying plasmid pKD46 (Datsenko and Wanner, 2000) by electroporation, selecting for chloramphenicol resistance and screening for loss of a functional lac gene. PCR was used to check the size of the cat insert by using oligonucleotide primers flanking the lac operon. The cat gene was removed by P1 Cre-mediated recombination between the two loxP sites by using plasmid pFHC2938. This plasmid is a derivative of pKD46. First the bla gene was inactivated by inserting a AatII-PflMI restriction fragment carrying the tet gene of pBR322 into pKD46 restricted with AclI (plasmid pFHC2819). Second, a PCR generated cre gene (oligonucleotide pair 13.07-13-08, Table S1) was isolated via an intermediate vector and was recovered as a SacI-BspEI fragment. This was used to replace the SacI-XmaI fragment of pFHC2819 (and of pKD46) which
carried the gam, bet, and exo genes, resulting in plasmids pFHC2839 and pFHC3220, respectively. The plasmid construction was carried out in the progenitor of FH2926, which had lost the cat gene in the process, and was then cured for pFHC2938.
Strain FH2926 carrying pKD46 (=FH2927) was used as recipient for recombineering the pMT1 parS site into several different positions on the chromosome. A plasmid with the pMT1 parS site was constructed as follows. First an oligonucleotide linker consisting of the two oligonucleotides 15.10 and 15.11 (Table S1) was ligated into the BglII-NdeI sites of pHJN2. Second a PCR fragment carrying the pMT1 parS sequence was synthesized with the primers 18.12 and 18.13 (Table S1) and plasmid pALA1840 (Youngren et al., 2000) as template. After restriction with BamHI and BlpI, the fragment was inserted in the modified pHJN2 plasmid that had been cut with the same enzymes, resulting in plasmid pFHC3228 (Figure S1). The PCR fragment used was synthesized in two steps as described above. First the oligonucleotide pair 15.08-15.09 was used to synthesize a PCR fragment which could be used as template for synthesizing the various PCR fragments using oligonucleotides which would direct the PCR fragment to be recombineered into the chromosome at the desired positions. In this way a number of strains with the pMT1 parS sequence inserted at different positions were constructed. A number of strains which, in addition to the pMT1 parS sequence, carried the P1
parS sequence (Table S2) were constructed by P1 transduction using lysates of strains described earlier (Nielsen et al., 2006). In most cases the cat gene was removed by Cre-mediated recombination between loxPsites.
It should be noted that the two plasmids pKD46 ( gam,bet, and exo) and pFHC2938 (P1 cre) carry the same pSC101 temperature sensitive replicon and thus are incompatible. Therefore, transforming pFHC2938 into a strain carrying pKD46 selecting for tetracycline resistance leads to loss of pKD46 and loss of the catgene. Retransformation of such a strain with pKD46 leads to loss of pFHC2938 and

H. J. Nielsen et al.
Figure S2. Construction of plasmids carrying genes for fluorescent ParB proteins of different specificities. Only relevant restriction enzyme sites are shown. See text for details.
makes the strain ready for a new recombineering event, again using the cat gene and selecting chloramphenicol resistance. Final constructs were cured of the resident plasmid by incubation of plates at temperatures of 37°C to 42°C.
Construction of plasmids carrying two different ParB fluorescent proteins of different colors.
pFHC2973 was derived from pALA2705 (Li et al., 2002). It has two modified parB genes transcribed from the same promoter. A P1parB gene, fused to an E. colicodon-optimized cfp gene is followed by a pMT1 parBgene fused to a novel E. coli codon-optimized variant of a gfp gene where the protein (which we call yGFP to distinguish it from YFP) does not emit light at the wavelength normally used to record the fluorescence of CFP (480 nm). This plasmid and similar derivatives was constructed as follows. Plas-mid pFHC2191 (GenBank Acc. No. AF325903) was restricted with BstAPI and AatII and a linker fragment (oligonucleo-tides 22.06 and 22.07, Table S1) was inserted between the sites to provide an EcoRI site necessary for fusing the codon optimized gfp gene to the P1 parB gene. The gfp gene from the resulting plasmid was excised as a AatII-NdeIfragment and was inserted into pFHC2102 (Atlung and
Hansen, 2002) restricted with the same enzymes. This plasmid was provided with a P1 parB gene from plasmid pALA2705 using the restriction enzymes EcoRI and SspI. Strains with P1 parS sequences at different positions on the chromosome and carrying this plasmid (pFHC2892) form fluorescent foci. However, the strains are not healthy, presumably due to the production of the GFP-ParB protein, despite the fact that the lac promoter is not induced. Derivatives of pFHC2892 which carry codon-optimized genes for CFP (pFHC2896, Figure S2) and yGFP (pFHC2906) were constructed by exchanging the chromophore region of the gfp gene. The three different genes for fluorescent proteins fused to the P1 ParB were reintroduced in pALA2705 using the restriction enzymes NcoI and XbaI to produce plasmids pFHC2966 (GFP), pFHC2967 (CFP, Figure S2), and pFHC2968 (yGFP). These plasmids are similar to pALA2705 except that the codons of the fluorescent proteins are optimized for E. coli (Figure S2).
Vector pACYC184-derived plasmids, compatible with the pBR322 replicon and carrying the genes for the fluorescent proteins fused to the pMT1 parB gene with a deletion of the codons for 23 N-terminal amino acids were also constructed. Plasmid pFHC3224, which carries an arabinose-controlled codon-optimized gfpgene fused to the gene for the pMT1- 23-ParB protein

Molecular Microbiology (2006) H. J. Nielsen et al.
was restricted with NdeI and HindIII and inserted in the pACYC184 derived plasmid pFHC2304 (Figure S2) to produce plasmid pFHC2907. Plasmids pFHC2908 (CFP, Figure S2) and pFHC2909 (yGFP) were constructed by exchanging the chromophore region. Finally, plasmids carrying two genes for the different fluorescent proteins fused to different ParB proteins were constructed using restriction enzymes HindIII and XbaI. Plasmid pFHC2973 (Figure S2) carries the genes for CFP-P1-ParB and yGFP-pMT1-ParB. Plasmid pFHC2972 carries the genes for CFP-P1-ParB and GFP-pMT1-ParB. And plasmid pFHC2974 carries the genes for yGFP-P1-ParB and CFP-pMT1-ParB.
References
Atlung, T., Hansen, F.G. (2002) Effect of different concentrations of H-NS protein on chromosome replication and the cell cycle in Escherichia coli. J Bacteriol 184: 1843-1850.
Datsenko, K.A., Wanner, B.L. (2000) One-step inactivation of chromosomal genes in Escherichia coli K-12 using PCR products. Proc Natl Acad Sci U S A 97: 6640-6645.
Li, Y., Sergueev, K., and Austin, S. (2002) The segregation of the Escherichia coli origin and terminus of replication. Mol Microbiol 46: 985-996.
Nielsen, H.J., Li, Y., Youngren, B., Hansen, F.G., and Austin, S. (2006) Progressive segregation of the Escherichia coli chromosome. Mol Microbiol In press: doi:10.1111/j.1365-2958.2006.05245.x.
Youngren, B., Radnedge, L., Hu, P., Garcia, E., and Austin, S. (2000) A plasmid partition system of the P1-P7par family from the pMT1 virulence plasmid of Yersinia pestis. J Bacteriol182: 3924-3928.
Table S1. Oligonucleotide sequences1
Name Primer 1 Primer 2
15.08-15.09 AGGAAGCGGAATTCCGGACC CTCGAGATGCAGAAGACGCA
Used to make a primary template PCR-fragment from pHJN2 and similar plasmids
22.02-22.03 gtagatcgctgaacttgtaggcctgataa
gcgcagcgtatcaggcaattAGGAAGCGG
AATTCCGGACC3
cgcaaaacctttcgcggtatggcatgat
agcgcccggaagagagtcaattGAAGCTT
ACGCGTGGTACCG3
Oligomers to delete the lac operon using PCR fragment of made with 15.08-15.09 on pHJN2 as template yielding strain FH2926.
13.07-13.08 CAGGTAAAGGCt(1)AGCCGATCCTG2 ATTATAGCAAT(g)CATTTACGCGTTAA
TGGC2
Used to amplify the cre gene of bacteriophage P1
15.10-15.11 GATCTGCGGCCGCGTGCACTCTAGAGCA TATGCTCTAGAGTGCACGCGGCCGCA Adapter to modify pHJN2
22.06-22.07 CGAATTCTTTATACAGCTCATGCATGCCATGCATGAGCTGTATAAAGAATTCGACG
T
Adapter for introducing an EcoRI site in pFHC2191
22.26-22.27 cccatttttgcatggatctccgcggtacc
gggataggcttctataccaatAGGAAGCG
GAATTCCGGACC3
Acattaggccctggttgcaatgttcctg
gttatgccggaaccacgataggCTCGAGA
TGCAGAAGACGCA3
Oligomers to insert pMT1 parS site at 98.1 min in strain FH2978 (FH3512).
22.28-22.29 accgatcgctataacgagcgaccgtgggg
tggcggttttggcctgtcgcgAGGAAGCG
GAATTCCGGACC3
cgccagcggtcgccaggtactttcccat
ccgtatccggcaatcggttcccCTCGAGA
TGCAGAAGACGCA3
Oligomers to insert pMT1 parS site at 14.1 min in strain FH2952. (FH3551).
22.30-23.01 gatgcaggatgtcaccccagacgcatggc
caacctggccggtaaaactggAGGAAGCG
GAATTCCGGACC3
cgataaacagcactgaagtgggtaatgt
cacaccatacgcctgtttttgcCTCGAGA
TGCAGAAGACGCA3
Oligomers to insert pMT1 parS site at 22 min in strain FH2973, 2981, 3505. (FH2973, 3552, 3518).
24.10-24.11 caatacataacagaaacctgaaacacaaa
acggcagcccttgagctgccgAGGAAGCG
GAATTCCGGACC3
tgatgagatcgatagcgactaaatcgct
tcagtttcacaactgacagaatCTCGAGA
TGCAGAAGACGCA3
Oligomers to insert pMT1 parS site at 14.1 min in strain FH3506. (FH3553).
1 All sequences are presented in the 5’ to 3’ direction. 2 Small letters represent bases which do not fit the template sequence. A number in parentheses represents a one-base deletion
compared to the template sequence; a small letter in parentheses represents a one-base insertion. 3 Small letters represent bases which do not fit the template sequence but fits the chromosome for facilitating the recombineering
process. The capital letters fits the template sequence of plasmid pHJN2 and pHJN2-dervived plasmids.
![KRJBOLP MOFJLP FS - Universidad Nacional De Colombia · L]n`mq`hjn o\h]d`i lp` nd kj_`hjn _`hjnom\m lp` R0 n` kp`_` `n^jb`m o\g lp` R0 9 0Rg) `ioji^`n kj_m`hjn q`m lp` k\ga\ x ]\n+](https://img.dokumen.tips/doc/110x75/5e222cc03241da61df77a62f/krjbolp-mofjlp-fs-universidad-nacional-de-lnmqhjn-ohdi-lp-nd-kjhjn-hjnomm.jpg)