Embed Size (px)
Citation preview
DYNAMICS AND VIABILITY OF A COUGAR POPULATION
IN THE PACIFIC NORTHWEST
By
CATHERINE MARIE SARAH LAMBERT
A thesis submitted in partial fulfillment ofthe requirements for the degree of
MASTER OF SCIENCES IN NATURAL RESOURCE SCIENCES
WASHINGTON STATE UNIVERSITYDepartment of Natural Resource Sciences
DECEMBER 2003

ii
To the Faculty of Washington State University:
The members of the Committee appointed to examine the thesis of
CATHERINE MARIE SARAH LAMBERT find it satisfactory and recommend that
it be accepted.
_______________________________________ Chair
_______________________________________
_______________________________________

iii
ACKNOWLEDGMENTS
This thesis is the result of a generous contribution from many agencies and
people. Research and fieldwork were funded by Bombardier Inc, Bonneville Power
Administration Fish and Wildlife Program, British Columbia Ministry of
Environment, Columbia Basin Fish and Wildlife Compensation Program, Idaho
Department of Fish and Game, U.S. Fish and Wildlife Service, U.S. Forest Service,
Washington Department of Fish and Wildlife, and Washington State University. Le
Fonds de recherche sur la nature et les technologies (Gouvernement du Québec,
Canada) provided me financial and in-kind support to attend Washington State
University.
I would like to express a heartfelt thanks to Dr. Robert Wielgus, my thesis
advisor as well as a mentor in many aspects of my life. I also greatly benefited from
the contact with Dr. Brian Dennis and Dr. Lisa Shipley, who both helped me to
become a better scientist and communicator. I would like to thank Hugh Robinson,
Donald Katnik, Ross Clarke, and Jon Almack for sharing their data and knowledge
with me, Hilary Cruickshank for her assistance in the field, and Tim Layser for his
generous hospitality. I also truly appreciated Dave Parker for making aerial
telemetry so enjoyable. Par-dessus tout, je remercie ma famille, pour l’inspiration, le
courage et l’amour qu’ils m’ont insufflé malgré les distances.
iv
DYNAMICS AND VIABILITY OF A COUGAR POPULATION
IN THE PACIFIC NORTHWEST
Abstract
By Catherine Marie Sarah Lambert, M.S.Washington State University
December 2003
Chair: Robert W. Wielgus
Cougar (Puma concolor) populations are believed to be at high density and
increasing throughout western North America, especially in the Pacific Northwest, as
evidenced by increasing cougars/humans encounters. Harvest rates have increased
as a result. To test this hypothesis, I determined the density, fecundity, survival, and
growth rate of a cougar population in northeastern Washington, northwestern Idaho,
and southern British Columbia. From 1998 to 2003, 52 cougars were captured,
radio-collared, and monitored. I recorded fecundity through den site investigation
and snow tracking, and mortality by weekly telemetry. Survival rates were estimated
for kittens (0-1 yr), yearlings (1-2 yr), and adult (2-12 yr) males and females.
Average overall density was 1.09 cougars/100km2 or 0.46 adults/100km2. I
estimated the litter size at 2.53 kittens, the birth interval at 18 months, the proportion

v
of reproductively successful females at 0.75, and the age of first reproduction at 30
months, for a maternity rate of 0.63 male or female kitten/year/adult female.
Average survival rate for all radio-collared cougars was 0.59, 0.77 for adult females,
0.44 for adult males, 0.37 for yearlings, and 0.57 for kittens. Hunting accounted for
92% of the mortalities of radio-collared cougars. Age- and sex-specific survival and
fecundity were entered into a stochastic two-sex matrix model. I used computer
simulations to determine the stochastic growth rate of the population and to assess its
viability over 25 years. The annual stochastic growth rate of this population was l =
0.80 (95%CI = 0.11). Starting with a total initial abundance of 357, the median
times to fall below a demographic collapse (N = 30 adults) and extirpation (N = 0)
were 8.5 and 25.9 years. My findings suggest that, contrary to popular belief,
cougars in the Pacific Northwest are currently at low to moderate densities and are
declining. Alternative hypotheses may account for the increased conflicts between
cougars and humans in this area.

vi
TABLE OF CONTENT
ACKNOWLEDGEMENTS…………………………………………………………iii
ABSTRACT………………………………………………………………………....iv
TABLE OF CONTENTS..………………………………………………………..…vi
LIST OF TABLES………………………………………………………………....viii
LIST OF FIGURES……………………………………………………………..…..ix
INTRODUCTION………………………………………………………………...….1
STUDY AREA………………………………………………………………...……..4
METHODS…………………………………………………………………...………6
Capture and monitoring………………………………………………………6
Density and abundance……………………………………………………….7
Fecundity……………………………………………………………………..8
Survival……………………………………………………………………….9
Population growth rate and short-term viability……………………….……10
RESULTS……………………………………………………………………….…..14
Density and abundance………………………………………………….…..14
Fecundity……………………………………………………………………14
Survival……………………………………………………………………...16
Population growth rate and short-term viability………...…………………..17

vii
DISCUSSION……………………………………………………………………….18
Density………………………………..……………………………………..18
Demographic rates…………………………………………………………..19
Population growth rate and viability…………………………………….…..21
Management implications…………..…………………………………..…...22
LITERATURE CITED.……………………………………………………………..33
viii
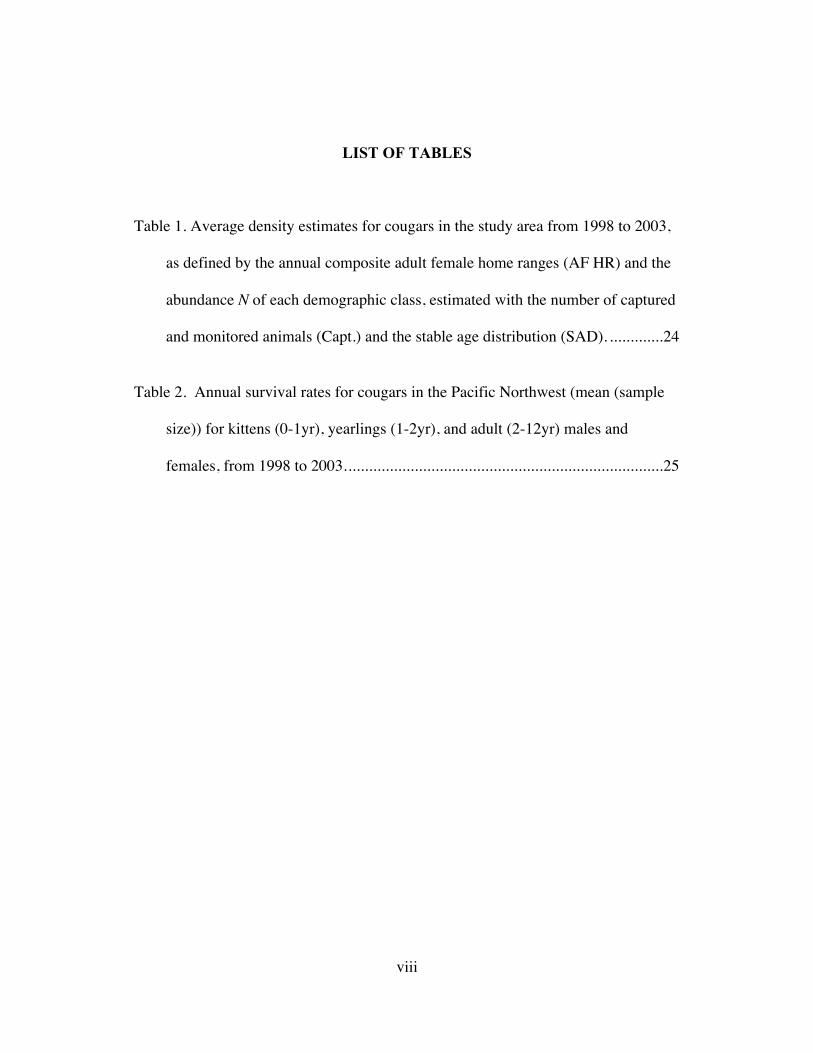
LIST OF TABLES
Table 1. Average density estimates for cougars in the study area from 1998 to 2003,
as defined by the annual composite adult female home ranges (AF HR) and the
abundance N of each demographic class, estimated with the number of captured
and monitored animals (Capt.) and the stable age distribution (SAD). .............24
Table 2. Annual survival rates for cougars in the Pacific Northwest (mean (sample
size)) for kittens (0-1yr), yearlings (1-2yr), and adult (2-12yr) males and
females, from 1998 to 2003.............................................................................25
ix
LIST OF FIGURES
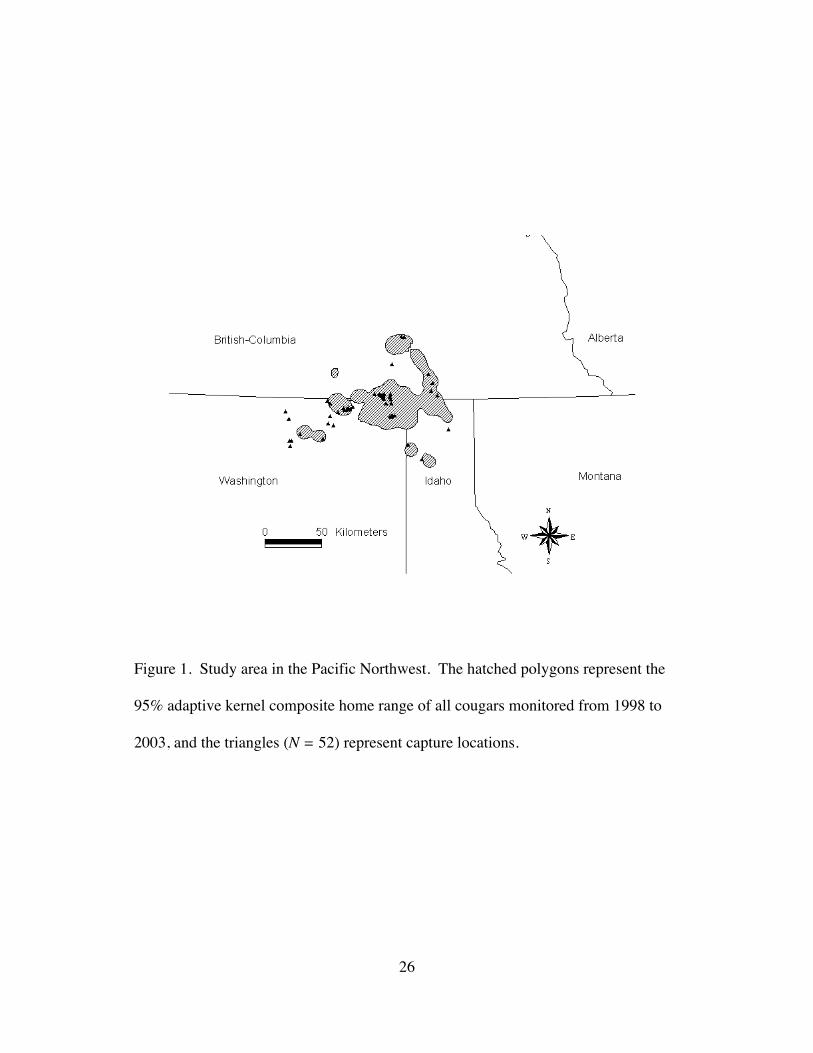
Figure 1. Study area in the Pacific Northwest. The hatched polygons represent the
95% adaptive kernel composite home range of all cougars monitored from 1998
to 2003, and the triangles (N = 52) represent capture locations........................26
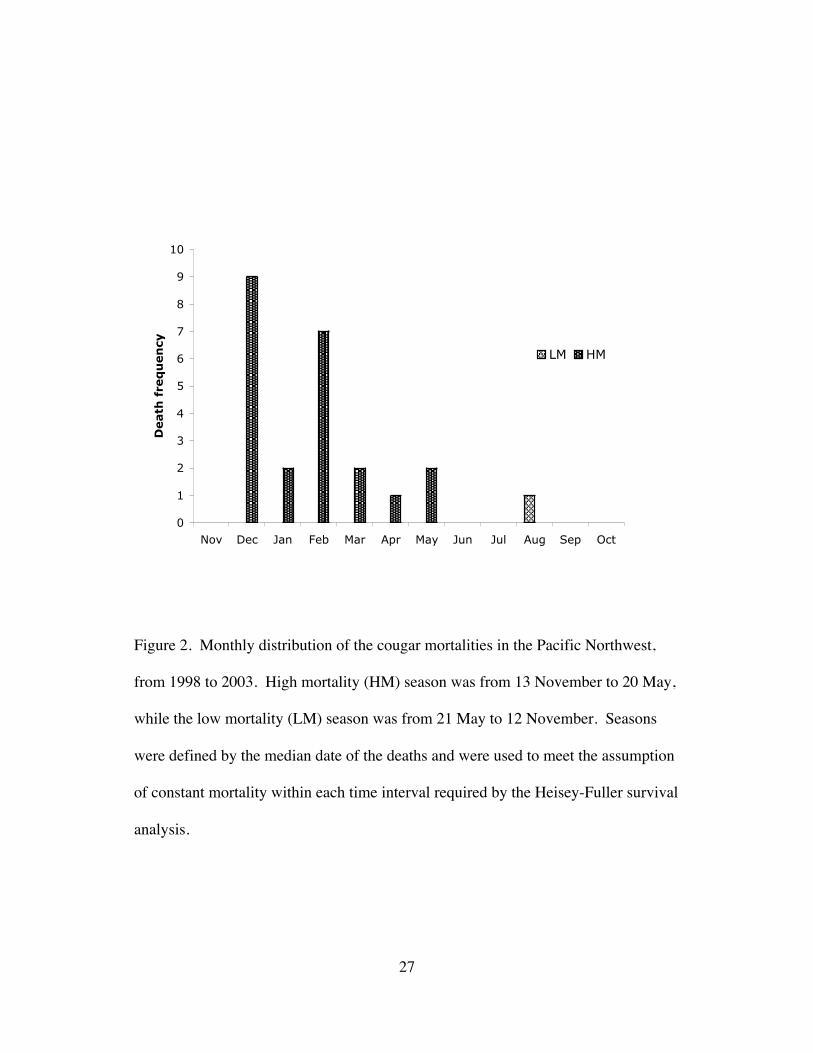
Figure 2. Monthly distribution of the cougar mortalities in the Pacific Northwest,
from 1998 to 2003. High mortality (HM) season was from 13 November to 20
May, while the low mortality (LM) season was from 21 May to 12 November.
Seasons were defined by the median date of the deaths and were used to meet
the assumption of constant mortality within each time interval required by the
Heisey-Fuller survival analysis. ......................................................................27
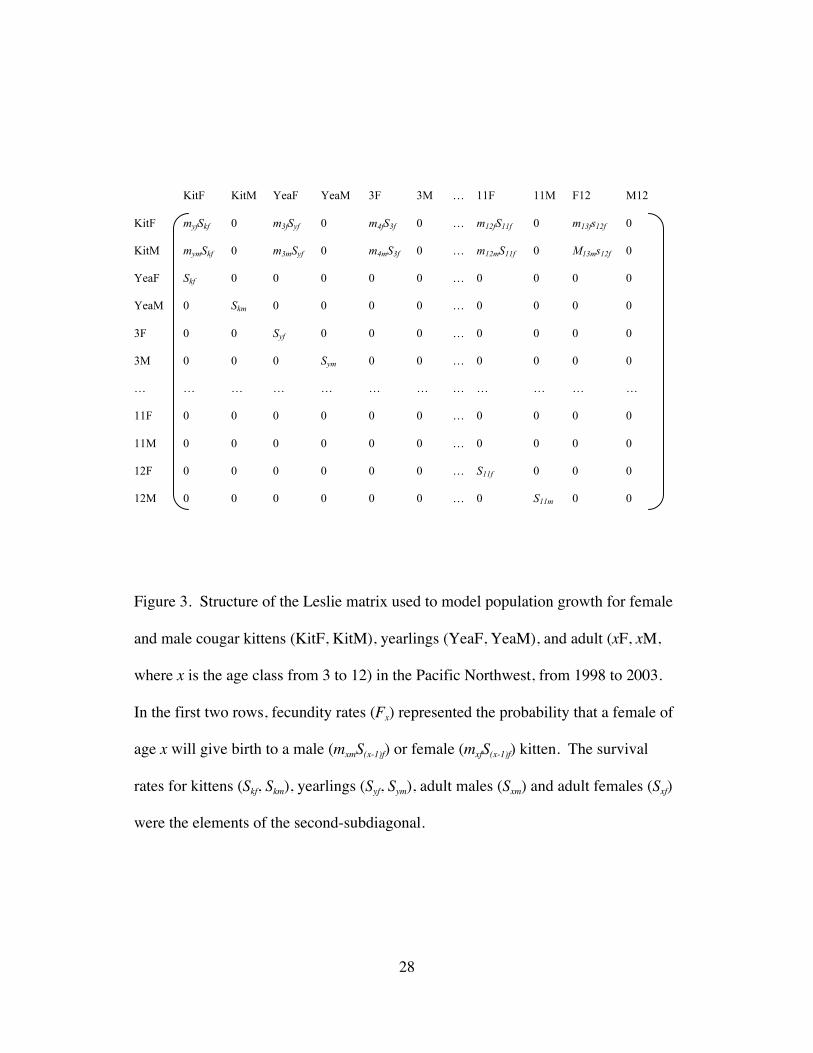
Figure 3. Structure of the Leslie matrix used to model population growth for female
and male cougar kittens (KitF, KitM), yearlings (YeaF, YeaM), and adult (xF,
xM, where x is the age class from 3 to 12) in the Pacific Northwest, from 1998
to 2003. In the first two rows, fecundity rates (Fx) represented the probability
that a female of age x will give birth to a male (mxmS(x-1)f) or female (mxfS(x-1)f)

x
kitten. The survival rates for kittens (Skf, Skm), yearlings (Syf, Sym), adult males
(Sxm) and adult females (Sxf) were the elements of the second-subdiagonal. ......28
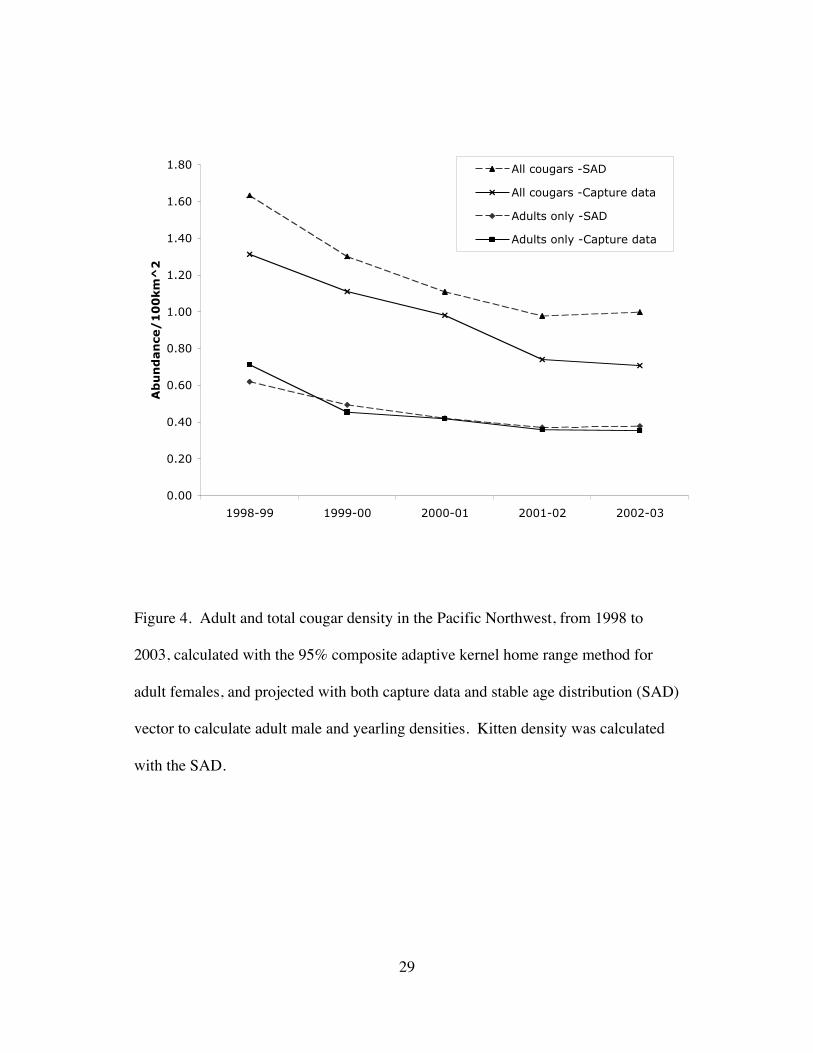
Figure 4. Adult and total cougar density in the Pacific Northwest, from 1998 to
2003, calculated with the 95% composite adaptive kernel home range method
for adult females, and projected with both capture data and stable age
distribution (SAD) vector to calculate adult male and yearling densities. Kitten
density was calculated with the SAD...............................................................29
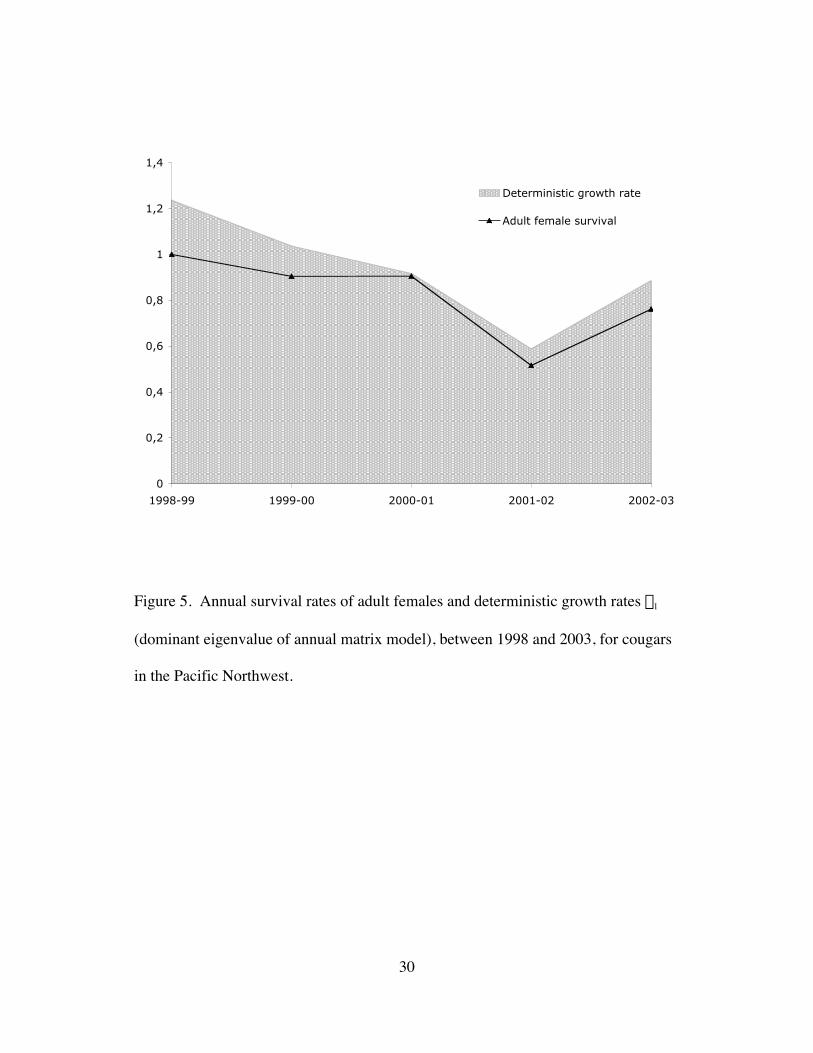
Figure 5. Annual survival rates of adult females and deterministic growth rates l1
(dominant eigenvalue of annual matrix model), between 1998 and 2003, for
cougars in the Pacific Northwest. ....................................................................30
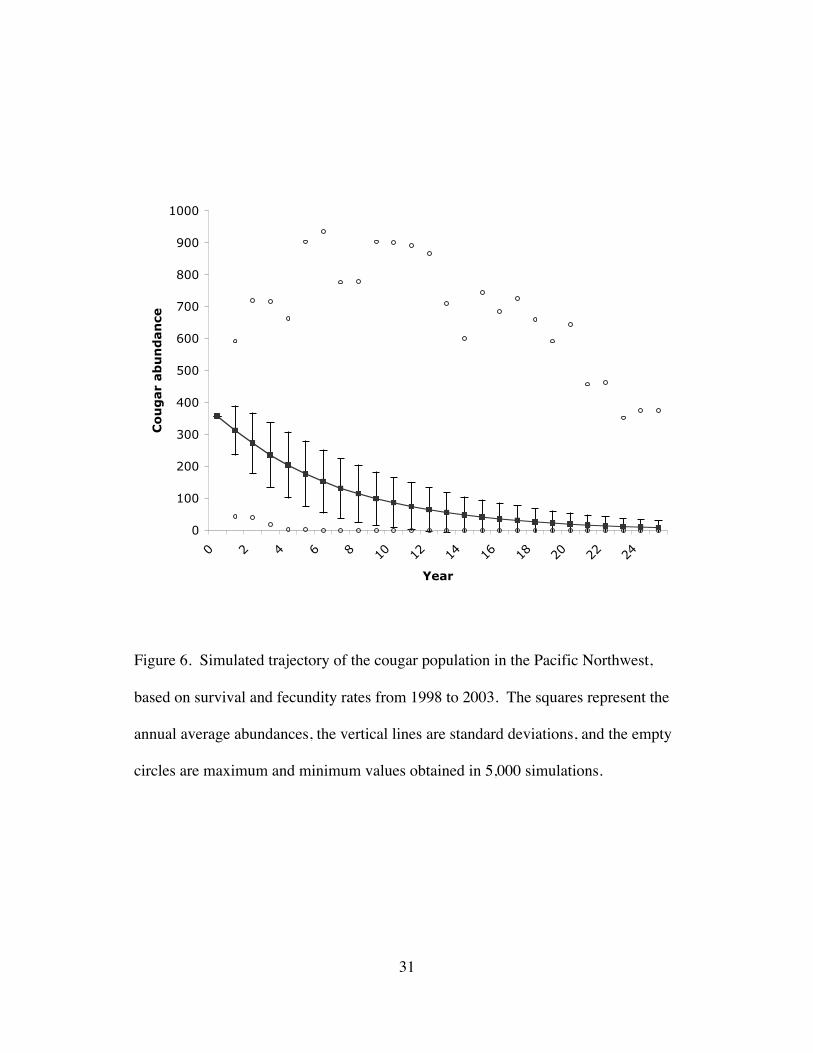
Figure 6. Simulated trajectory of the cougar population in the Pacific Northwest,
based on survival and fecundity rates from 1998 to 2003. The squares represent
the annual average abundances, the vertical lines are standard deviations, and
the empty circles are maximum and minimum values obtained in 5,000
simulations......................................................................................................31

xi
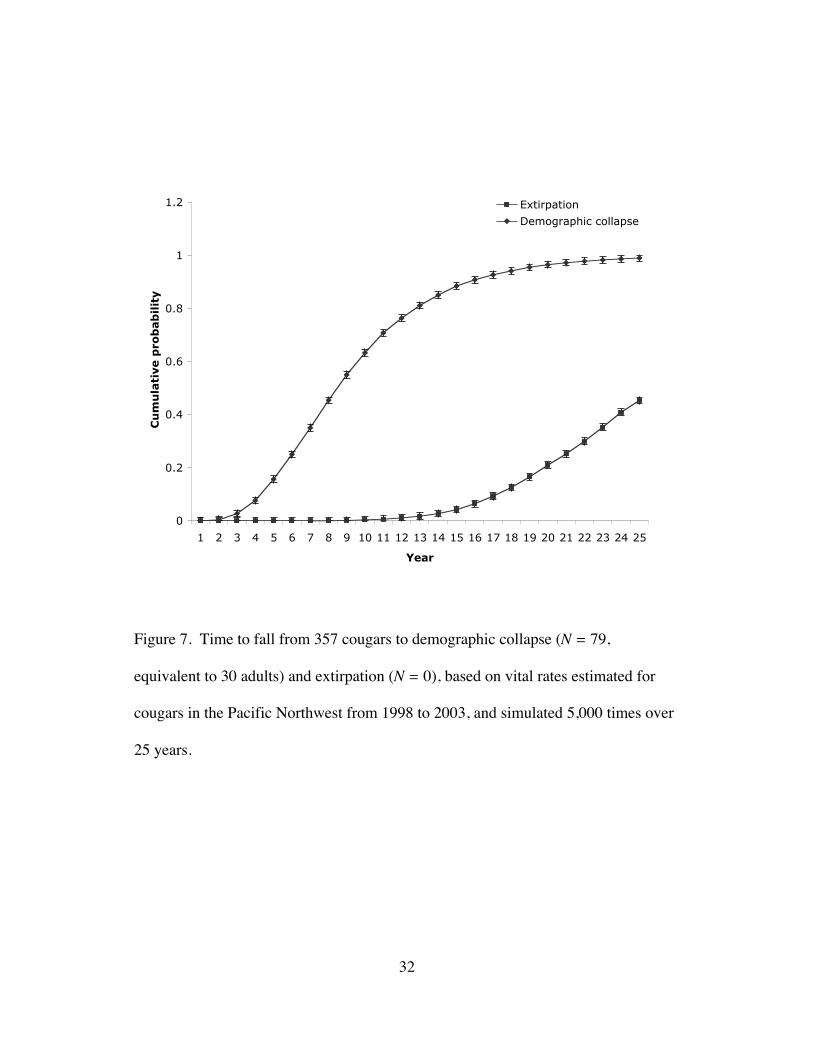
Figure 7. Time to fall from 357 cougars to demographic collapse (N = 79,
equivalent to 30 adults) and extirpation (N = 0), based on vital rates estimated
for cougars in the Pacific Northwest from 1998 to 2003, and simulated 5,000
times over 25 years. ........................................................................................32

xii
Dedication
I dedicate this thesis to the Cougars themselves
–fascinating, powerful, vulnerable animals–
May they be inhabit our forests and mountains for the centuries to come…
Go confidently in the direction of your dreams. Live the life you have imagined.
-Henry David Thoreau (1817 - 1862)
1
INTRODUCTION
Cougar (Puma concolor) populations are believed to be increasing
throughout western North America (Riley and Malecki 2001), as evidenced by the
increased frequency of reported encounters with humans (Beier 1991, Chester 2003)
and number of cougar harvested (Dawn et al. 2003). This is especially true in
Washington state (WA), where there is a current controversy about harvest
regulations (Martorello 2003). Although bounties for predators were abolished in
1960, the number of cougars hunted in the state during the past century has increased
steadily (Spencer et al. 2001). In 1996, hunting with hounds became illegal after
voter initiative 655 was passed, but the hunting season’s length and bag limit were
both increased to compensate. The years following initiative 655 were marked by a
constant increase in the number of complaints related to interactions between
humans and cougars –annual registered complaints rose from 247 in 1995 (the year
before the ban) to 495 in 1996, and 927 in 1998 (Washington Department of Fish
and Wildlife 1999). Since then, complaints have averaged about one thousand a
year. Because of increased complaints, the Engrossed Substitute Senate Bill (ESSB)
5001 was passed in 2001, allowing the use of hounds for safety removals. The 2001
Washington game status report (Martorello 2001) suggested that cougars were stable
to increasing statewide and were moderately exploited, so hunting regulations have
2
continued to become more permissive. To further satisfy local concerns, emergency
cougar hunts were adopted in March 2003 in Stevens, Ferry and Okanagan Counties,
in northeastern WA. Recent reports from neighboring Idaho (ID) (Nadeau 2003) and
British Columbia (BC) (Austin 2003) showed that hunting effort has also been
constantly increasing from 1998 to 2002, with harvest rates as much as 700% higher
than 20 years ago.
Many hypotheses were proposed to account for the increase number of
cougar complaints in WA. The most popular belief is that this indicates a very high
cougar density and increasing cougar population. Alternatively, more frequent
encounters and complaints may be caused by encroachment of expanding suburbs
into cougar habitat (Dickson and Beier 2002, Spencer et al. 2001). Hunting itself
could also be indirectly responsible for the increased frequency in cougar/human
conflicts. Carnivore populations under heavy hunting pressure may have a very
young age structure, as seen in African lions (Panthera leo) (Smuts 1978) and
wolves (Canis lupus) (Jedrezejewska et al. 1996). Removing older animals can
increase the density of immigrating/settling juveniles or sub-adults from adjacent
areas (Wielgus et al. 2001), which are often responsible for most of the attacks on
humans and livestock (Beier 1991). Finally, low levels of stakeholder acceptance of
cougars can amplify the perception that cougars are increasing (Riley and Decker

3
2000, Riley and Malecki 2001), and the large number of complaints could be a local
backlash to initiative 655.
My primary objective was to test the hypothesis that cougars are at very high
density and increasing, by determining the density and growth rate of the population
in northeastern WA, northwestern ID and southern BC from 1998 to 2003. I
examined the vital rates of cougars in two overlapping areas. Between 1998 and
2001, 32 individuals were radio-collared and monitored in the Selkirk Mountains in
northern ID (Panhandle area), southeastern BC (Kootenay region), and northeastern
WA (PendOreille county) (Katnik 2002). Seven of these 32 cougars were monitored
throughout the length of the study. Twenty-one other cougars were radio-collared
and monitored in the Colville National Forest in northeastern WA (Ferry and Stevens
counties) between 2002 and 2003.

4
STUDY AREA
The study area is located in the Northern Rocky Mountain US ecosystem
province (Bailey 1995) and the Southern Interior Mountains ecoprovince of British
Columbia (Demarchi 1996) (Fig.1). The minimum convex polygon of all cougar
locations in this study encompassed approximately 32,800 km2 (48°21¢N-49°35¢N,
115°57¢W-119°04¢W), but the composite 95% contour kernel estimate for all
animals was only 5,600 km2. The area is characterized by rugged terrain with
numerous ridges (1,500-2,000 m) interspersed by valleys (500 m). Average winter
temperature is 0°C and the average summer temperature is 22°C. Precipitation falls
mostly in the winter and averages 510 to 1,020 mm per year.
A mixed evergreen-deciduous forest dominates the landscape. In lower
elevations, western red-cedar (Thuja plicata) and western hemlock (Tsuga
heterophylla) are the dominant tree species in mature forests, with black cottonwood
(Populus balsamifera trichocarpa) the climax in moister areas. Open mixed stands
of douglas-fir (Pseudotsuga menziesii) and ponderosa pine (Pinus ponderosa) are
common on more xeric south-facing slopes (Ketcheson et al. 1991). In higher
elevations, white spruce (Picea glauca) dominates the climax forest, with subalpine
5
fir (Abies lasiocarpa) composing the understory and lodgepole pine (Pinus contorta)
common following fire (Coupe et al. 1991).
White-tailed deer (Odocoileus virginianus) were the most abundant ungulate,
but mule deer (Odocoileus hemionus, see Robinson et al. 2002), elk (Cervus
elaphus), moose (Alces alces) and mountain caribou (Rangifer tanrandus caribou,
see Katnik 2002) were also present. Common predator species, beside cougars,
included coyotes (Canis latrans), black bears (Ursus americanus), bobcats (Lynx
rufus), and, to a lesser extent, grizzly bears (Ursus arctos), lynx (Lynx canadensis),
and wolves (Canis lupus).
Cougar harvest was permitted throughout the study area but regulations
varied amongst jurisdictions. In WA, the hunting season lasted from 1 August to 15
March from 1998 to 2003. Hounds were prohibited in 1998, but their use was
reintroduced in 2000 to meet public safety needs. In ID, the hunting season lasted
from 15 September to 31 March for the 1998-99 and 1999-2000 seasons, and from
30 August to 31 March for the seasons 2000-2001 to 2002-2003. Hounds were
allowed during most of the season, but starting in 1999 they were prohibited between
September and December. In BC, cougar hunting in the southeastern Kootenay
region lasted from 10 September to 28 February, and lasted until 31 March for the
southwestern Kootenays. Hounds were allowed during the entire season.

6
METHODS
Capture and monitoring
The study area was intensively searched for cougar tracks during the snow-
covered period (November to April) each year from 1998 to 2003. Hounds were
released on fresh tracks and used to tree cougars (Hornocker 1970). Efforts were
made to capture and collar all cougars larger than about 30kg (yearlings and adults).
Treed cougars that were not too high for safe capture (those £5 m from the ground)
were immobilized by injecting 0.4 ml/10 kg of body mass of ketamine hydrochloride
(200 mg/ml) and xylazine hydrochloride (20 mg/ml), with a projectile dart in the
hindquarter (Ross and Jalkotzy 1992, Spreadbury et al. 1996). Cougars were fitted
with mortality-sensing VHF radio-collars, and administrated 0.2 mg/kg of body mass
of yohimbine hydrochloride, a chemical antagonist of the immobilizing drugs (Seal
et al. 1987). Cougars were classified either as kitten (0-1 yr), yearling (1-2 yr) or
adult (2+ yrs), based on their general appearance and tooth wear (Ashman and Greer
1976). Released cougars were located about once a week by aerial or ground
telemetry, from 14 December 1998 to 20 May 2003.

7
Density and abundance
I estimated minimum mean annual density (adults/100km2 and
cougars/100km2) by counting all captured animals in the annual 95% adaptive kernel
composite home range of the adult females (Wielgus et al. 1994), using the animal
movement extension for ArcView‚ (ESRI, Redlands, California, U.S.A.) developed
by Hooge and Eichenlaub (1997). Densities of adult females were derived from how
many were monitored annually, divided by the area of their annual 95% adaptive
kernel composite home range. I believe that most adult females were captured in
these relatively small (1,800-5,600 km2, see Table 1) annual composite home ranges.
Densities of adult males and yearlings were estimated using two different techniques.
The first method counted how many animals were captured or monitored each year,
divided by the adult female composite home range area. The second method, based
on survival and fecundity rates, used the stable age distribution (dominant right
eigenvector, Morris and Doak 2002:222) to determine the proportion of adult males
and yearlings present each year, according to adult female density. These
proportions were then multiplied by the number of adult females in the annual
composite home range. In both cases, kitten density was assessed using the stable
age distribution method. Average cougar abundance for the entire study area was
obtained by extrapolating the average density estimate over the 32,800km2 minimum
convex polygon of all studied animals.

8
Fecundity
The maternity rates (mx) were the average number of kittens of each sex (mxm,
mxf) produced during 1 year by any mother of age x (Case 2000). Because cougars
can reproduce all year long (birth-flow population), frequent checks of potentially
reproductive females were conducted. The reproductive status at capture was
determined by presence of milk in nipples, color and size of the nipples (to detect
previous maternities), and sightings of kittens or yearlings. Subsequent changes in
the reproductive status were detected by weekly telemetry locations. A decrease in a
female’s movements was investigated as a possible birth event (Beier et al. 1995,
Hemker et al. 1986). I determined litter size by investigating the dens or by track
counts (Banhurst and Lindzey 1989, Kerley et al. 2002, Ross and Jalkotzy 1992) for
kittens from 0-3 months. I calculated annual maternity rates by dividing the average
litter size by the average successful interbirth interval, and multiplying by the
proportion of kitten of each sex and the proportion of reproductively successful adult
females (i.e., pregnant or involved in raising a litter). The latter parameter is
sometimes ignored in calculating maternity rates, but failing to consider the
proportion of unsuccessfully reproducing females would bias kitten production
upwards by including only successful females during short study periods (Wielgus et
al. 2001). Fecundity rates (Fx) of my post-breeding model were defined as Fx =
mx+1sxf (Case 2000), where sxf are the annual survival rates of females of age x. I
9
assumed Fx had the same standard deviations as sxf (see below), because sample sizes
were too small to estimate the standard deviations for fecundity.
Survival
I determined the survival of kittens by comparing direct observations or track
counts on snow (Kerley et al. 2002, Ross and Jalkotzy 1992) at different time
intervals. Because I could not monitor kittens daily, I evaluated their survival rate as
the proportion of survivors after the first year of life (365 days).
To estimate survival of radio-collared animals, I used the Mayfield method
(1961) modified by Heisey and Fuller (1985), because of its high precision when
vital rates are constant within time intervals (Samuel and Fuller 1996). I estimated
average annual survival rates by using the geometric mean of all years,
†
Stt=1
Y
’Ê
Ë Á
ˆ
¯ ˜
1/Y
,
where t represents each year of the study, Y the total number of years, and St the
annual survival rates. I computed the 95% confidence interval (CI) with Akçakaya’s
unbiased weighed variance (2002),
†
St (1- Stt=1
Y
 )
Ntt=1
Y
Â
, where Nt is the annual number of
cougars monitored in each class. This variance estimate minimizes sampling error
and accounts for demographic stochasticity (Akçakaya 2002).

10
To meet the required assumption of constant mortality of the Mayfield
method, I analyzed the statistical distribution of the deaths over a year (365 days) to
determine the time intervals when survival probabilities were constant. This yielded
two seasons: the high mortality (HM) season (13 November to 20 May) and the low
mortality (LM) season (21 May to 12 November) (Fig. 2). Most of the deaths (22 of
23) during the HM season were hunting-related, whereas the only death that occurred
during the LM season was caused by starvation. Intervals for each period were
chosen based on the median date of the deaths for each period. I tested for
differences in survival between the sex and age classes using a two-tailed t-test.
Population growth rate and short-term viability
I constructed a post-breeding, two-sex, age-classified, stochastic matrix
model to estimate annual stochastic population growth (l) and its 95%CI. I assumed
that (1) environmental conditions in successive years were uncorrelated; (2)
fecundity and survival rates were uncorrelated, but annual survival rates of each sex-
and age-class were correlated; (3) all cougars were equally at risk within the study
area (no spatial structure); (4) no catastrophes or bonanzas occurred; (5) cougars
were senescent at 12 years old (Beier 1996); and (6) male density did not affect
female fecundity, with the exception that a male density of 0 would cause a 0
fecundity rate. Different survival rates of adult males and females during this study

11
justified the use of a two-sex model (Caswell 2001). My two-sex structured model
was a Leslie matrix composed of 24 classes (Fig. 3), where males and females of the
same age succeeded each other from row to row and column to column (Caswell
2001), and was filled with the average vital rates for the period 1998-2003. The
dominant eigenvalue of this matrix corresponds to the finite rate of increase
†
l1 of the
population and the dominant right eigenvector to the stable age distribution (Caswell
2001). I assessed the relative influence of each parameter r on the population growth
rate by determining and comparing their elasticity,
†
Er , defined as
†
Er =rl1
∂l1
∂r
(Morris and Doak 2002), where
†
∂l1 is the change in the growth rate caused by a 10%
increase,
†
∂r , in each parameter. As part of a descriptive analysis of population
growth from 1998 to 2003, I examined annual survival rates in 5 distinct matrices
and calculated annual dominant eigenvalues, despite having few animals represented
in each sex and age category during some years. As I didn’t have sufficient data for
kitten survival during some years, I used the average kitten survival rate for all
annual matrices.
My model took the form n(t) = L* n(t-1), where n is the vector of population
abundance, t is the time in years, and L is a Leslie matrix (Fig. 3). At time 0, n was
the vector of initial abundance, defined by the average density and stable age
distribution extrapolated to the entire 32,800 km2 study area.
12
Environmental stochasticity was incorporated into my model by randomly
generating the Fx and Sx elements of L at every time step from normal distributions
with standard deviations given in a matrix V. Because there was no biological
reason why the variances of the average survival rates of each sex- and age-class
should be different within a year, and because annual sample sizes were low for
some classes, the standard deviation of annual survival rates for all radio-collared
animals was used to define environmental stochasticity in V (Caswell 2001).
Demographic stochasticity was included by drawing the number of survivors
in each sex-age class from a binomial distribution (based on the abundance Ni(t) of
each ith class and on the survival rates si from L), and the number of kittens born each
year from a Poisson distribution, using the random number generator of RAMAS 4.0
(Applied Biomathematics, Setauket, New York, USA). Age at first reproduction was
set at 1.5 years (see results).
To obtain the stochastic growth rate l, I projected the population 30 times
over 1,000 years, or until it fell to N = 0 animals. For every simulation, I computed
the geometric mean of [N(t+1)/N(t)] over all pairs of adjacent years to obtain a first
estimate of l (Morris and Doak 2002). I selected the arithmetic mean and 95% CI
of all simulations as the best estimate of the population growth rate.
13
I assessed population viability by examining the population trajectories of
5,000 simulations of my model projected over 25 years to determine the median time
to reach the demographic collapse (N = 79) and extirpation (N = 0). I set
demographic collapse at a total abundance of 79 cougars over the 32,800 km2 area,
which corresponds to an abundance of 30 adults, because populations below 30
adults are more vulnerable to Allee effects and extreme demographic stochasticity
effects (Wielgus 2002). All simulations were performed with the software RAMAS
4.0.

14
RESULTS
Density and abundance
Fifty-two cougars were captured and monitored from 14 December 1998 to
20 May 2003, for a total of 19,337 cougar-radio-days and 2,737 radio-locations.
Twenty were males (8 adults and 12 yearlings), and 32 were females (27 adults and 5
yearlings). Annual density estimates and trends for both methods (the annual count
of monitored cougars in each class and the stable age distribution multiplied by the
adult female density) were very similar (Fig. 4). Average annual density appeared to
decline from a high of 1.46 cougars/100km2 in 1998-99 to 0.85 cougars/100km2 in
2002-03, with an average annual decline of 12±16% (mean±95% CI) (Table 1). The
average density for all years was 0.46±0.24 adults/100km2, and 1.09±0.54
cougars/100km2. Total abundance in the 32,800km2 study area was estimated at 357
cougars, based on 1.09 cougars/100km2. To be conservative, I used 357 as the
starting point of every simulation, despite the apparent declining trend in density
observed during the latter years of the study.
Fecundity
Based on observations of 15 litters, I estimated mean litter size at 2.53±1.01.
I sexed 17 kittens and found a M:F ratio of 1:1.13, not different from equality (z =
15
0.25, P = 0.81), so I assumed each sex represented 50% of the litter. I obtained only
one successful interbirth interval (18 months), but used this value in my model
because it was consistent with results from studies with larger sample sizes (17.4
months, Logan and Sweanor 2001; 17.3 months, Lopez-Gonzalez 1999; 19.7
months, Ross and Jalkotzy 1992). I estimated the age of production of the first
successful litter to be 30 months, based on 29.1 months for Logan and Sweanor
(2001), 30 months for Ross and Jalkotzy (1992), and 29-30 months for Spencer et al.
(2001). Furthermore, I estimated that 75% of all adult females were reproductively
successful (pregnant or with offspring) in any year, which could be an
overestimation, considering the 41%-64% range reported by Toweill et al. (1984),
Ross and Jalkotzy (1992), Robinette et al. (1961), and Toweill et al. (1988). I
suspected that some births occurred without being noticed, so I remained more
conservative at 75%. Based on these parameters, I estimated the maternity rate to be
0.63 kittens of each sex per year (
†
2.53 ⋅ 0.5 ⋅ 0.751.5
) for females older than 2, and 0.32 for
females between 1 and 2 (half the adult rate because females start to reproduce at 1.5
years old).

16
Survival
Hunting accounted for 22 of the 24 deaths of radio-collared animals, and
indirectly caused the death of 5 of 21 dependent kittens by death of the mother. Nine
of the 52 monitored cougars were censored after losing their collars or after they
moved out of the study area. Four additional individuals were excluded from all
survival analyses because 1 died as a result of capture procedures and 3 others lost
their radio-collar or could not be found in the study area after only one day. Overall,
only 21 of the 52 radio-collared cougars lived or were monitored for longer than one
year after capture. The average annual survival rate for all radio-collared cougars
from 1998 to 2003 was 0.59±0.20, but major variations occurred between age and
sex classes, and from one year to another (Table 2). Average survival rate was
higher for adult females (0.77) than for adult males (0.33) (t =7.80, df = 34, P <
0.01) or yearlings (0.34) (t = 10.33, df = 43, P < 0.01). Survival did not differ
between yearling males (0.37) and females (0.32) (t = 0.35, df = 15, P = 0.73), so I
pooled them. Yearling survival (0.34) was lower than kitten survival (0.57) (t =
4.92, df = 36, P < 0.01), so I kept the two estimates distinct in my model. In total, I
recorded only 2 natural mortalities for radio-collared cougars: 1 adult female was
found with a broken neck and 1 adult male starved. The standard deviation of the
annual rates of all radio-collared cougars was 0.17, which was used in the matrix V
to incorporate environmental stochasticity in my model.

17
Population growth rate and short-term viability
The deterministic finite rate of increase l1 of the average projection matrix
was 0.87. The stable age distribution was 30% adult females, 8% adult males, 25%
yearlings (1:1 sex ratio), and 37% kittens (1:1 sex ratio). Overall, individuals 4 years
and older represented only 22% of the population. Annual deterministic growth rates
followed the pattern of adult female survival rates (Fig. 5), starting with l1 = 1.24 in
1998 and then progressively declining to 1.04, 0.92, 0.59, and 0.87 in 2002-03.
Elasticity analysis confirmed that adult female survival affects growth rate the most,
with
†
E f = 0.69 , whereas the elasticity value was 0 for adult males, 0.17 for yearling
survival, 0.17 for kitten survival, and 0.19 for maternity rate (elasticities do not sum
to 1 because both maternity and female survival rates were involved in fecundity
rates).
The matrix projections yielded a stochastic population growth rate l of
0.80±0.11 (Fig. 6). Median time to demographic collapse (N = 79) was 8.5 years
and median time to extirpation (N = 0) was 25.9 years (Fig. 7).
18
DISCUSSION
Density
Average density estimates (0.46 adults and 1.09 cougars/100km2) were in the
lower range of densities reported by other cougar researchers (from 0.44 to 13.03
cougars/100km2, Smallwood 1997). My estimates were comparable to densities
observed in 2 other populations in Utah (0.37 adults/100km2, Lindzey et al. 1994;
0.96 cougars/100km2, Lopez-Gonzalez 1999), but considerably lower than those
observed in 5 other populations, including Alberta (2.7 to 4.2 cougars/100km2, Ross
and Jakoltzy 1992), British Columbia (3.5 to 3.7 cougars/100km2, Spreadbury et al.
1996), Idaho (2.9 adults/100km2, Hornocker 1970), and New Mexico (1.72 to 3.91
cougars/100km2, Logan and Sweanor 2001). Even the starting density, at 1.47
cougars/100km2 in 1998-99, was considerably lower than most other populations,
suggesting that the common perception that cougars were at very high density was
incorrect.
Although intense trapping efforts were repeated each winter in an attempt to
capture and radio-collar all cougars in the study area, my estimates should be
considered minimum because some uncaptured individuals undoubtedly existed in
the annual 95% contour kernel home range of the adult females. The progressive
increase in the composite home range area may also have contributed to the observed

19
decline in density (Smallwood 1997). However, uncaptured animals in the 95 %
composite female home range would likely be balanced by captured animals
venturing outside the composite range. For example, most males spent considerable
periods of time outside the adult female composite home range. Furthermore, my
estimates included all animals captured every year, even cougars that were
monitored for only few days. Other studies of cougar populations probably suffered
the same problem of uncaptured animals and lack of population closure, so my
density estimates should be directly comparable to others in the literature.
Demographic rates
Litter size (2.53) was consistent with those reported elsewhere (2.4, Hemker
et al. 1986; 2.4, Lindzey et al. 1994; 3, Logan and Sweanor 2001; 2.2, Ross and
Jalkotzy 1992). As discussed above (see results), insufficient data made it necessary
to estimate other parameters involved in maternity rates (interbirth interval, age at
first litter, proportion of successful reproducing females) from literature. Because
the elasticity value of maternity rate was relatively low (0.19), uncertainties in
fecundity values had a negligible influence on population projection results.
Survival rates indicated this cougar population was very heavily hunted (92%
deaths of radio-collared cougars) compared to other populations (5%, Logan and
Sweanor 2001; 15%, Logan et al. 1986; 35%, Spencer et al. 2001). The overall

20
survival (0.58) was similar to that encountered in Arizona (0.62, Cunningham et al.
2001). Survival rate of adult females (0.77) was similar to those of other cougar
populations (0.82, Logan and Sweanor 2001; 0.77, Lopez-Gonzalez 1999; 0.77 for
all adults, Spencer et al. 2001), and higher than the 0.67 reported by Cunningham et
al. (2001). Adult male survival (0.33) was much lower than in other areas (0.58,
Cunningham et al. 2001; 0.91, Logan and Sweanor 2001; 0.62, Lopez-Gonzalez
1999). Similarly, kitten and yearling survival rates were lower than most rates
reported in literature. Kitten survival (0.57) was below 0.72 (Hemker et al. 1986)
and 0.76 (Robinette 1961) previously reported, but similar to rates encountered New
Mexico (0.59 to 0.63, Logan and Sweanor 2001) and Utah (0.42 for cubs until
dispersal, Lopez-Gonzalez 1999). Yearling survival rate (0.34) was lower than
previously reported (0.56 and 0.88 for subadult males and females, Logan and
Sweanor 2001; 0.60 and 0.80 for juvenile males and females, Spencer et al. 2001).
The elasticity of adult female survival outweighed that of any other
parameter, highlighting the large influence of adult female survival on population
growth, and minimizing the effect of uncertainties for other parameters that had
smaller sample sizes and larger standard deviations.
21
Population growth rate and viability
The observed declining trend in annual density (12±16%) corresponded to
the decline indicated by the stochastic (20±11%) and deterministic (13%) growth
rates. Because the stochastic growth rate incorporates environmental and
demographic variability, it is believed to be more realistic than the deterministic
growth rate (Caswell 2001, Morris and Doak 2002). The difference between the 2
values in my model (∆l= 0.07) is probably related to the large magnitude of
environmental variation in vital rates (SD = 0.17). Regardless of which method was
used, both indicated a steeply declining population.
My results are limited by the uncertainties in some of the model parameters
and density estimates. However, the very high elasticity value for adult female
survival (0.69) and large sample size (N = 28) for this parameter indicated that the
population would still be declining even if the other parameters were doubled to
unrealistic values. Additionally, if my density estimates had been higher, the
simulated population trajectories would have reached extirpation after a longer time
delay, but the growth rate would not have been affected. A limitation for population
projections is the underlying model assumption that all means and standard
deviations will remain constant in the future. Emigration from neighboring
populations could significantly increase the viability of this population (Beier 1993,
22
Sweanor et al. 2000), or a very sparse cougar density could trigger a lower hunting
effort.
Management implications
My results reject the hypothesis that cougars are at very high densities and
are increasing in northeastern WA, southern BC, and northwestern ID. Cougar
densities were not higher than reported in most other areas, and the population
appears to be declining. The increased level of cougar complaints following 1996
doesn’t seem to be due to excessively high densities and growth rates, but could be
related to (1) very young age structure of the population caused by heavy hunting;
(2) increased human intrusion into cougar habitat; or (3) low level of social
acceptance of cougars by local stakeholders.
The conflicts surrounding cougar management in my study area are not
uncommon in other regions of North America. Other populations that are believed
to be increasing, as suggested by more frequent cougar encounters, could be
declining as well. Conducting similar demographic analyses in different geographic
areas where complaints are increasing could shed light on this situation. Educational
programs, such as the one undertaken in western WA (CAT project, Koehler and

23
Nelson 2003), might help alleviate the tension presently surrounding cougar
management throughout western North America.
24
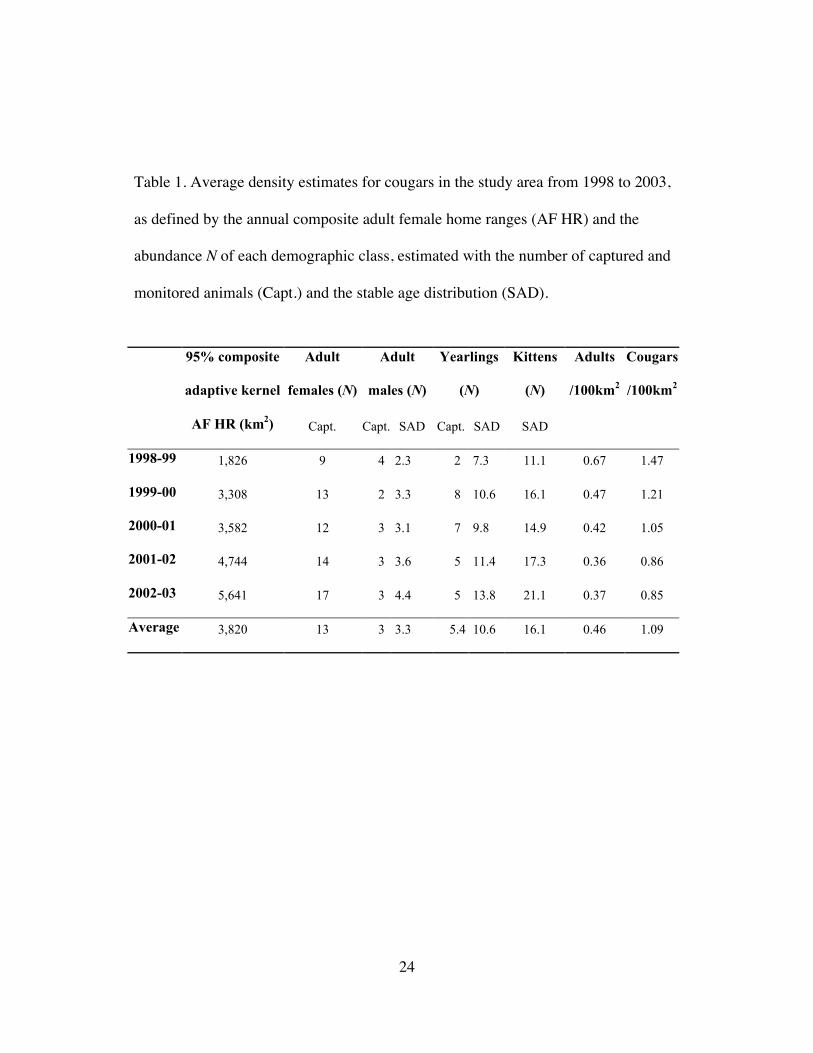
Table 1. Average density estimates for cougars in the study area from 1998 to 2003,
as defined by the annual composite adult female home ranges (AF HR) and the
abundance N of each demographic class, estimated with the number of captured and
monitored animals (Capt.) and the stable age distribution (SAD).
Adult
females (N)
Adult
males (N)
Yearlings
(N)
Kittens
(N)
95% composite
adaptive kernel
AF HR (km2) Capt. Capt. SAD Capt. SAD SAD
Adults
/100km2
Cougars
/100km2
1998-99 1,826 9 4 2.3 2 7.3 11.1 0.67 1.47
1999-00 3,308 13 2 3.3 8 10.6 16.1 0.47 1.21
2000-01 3,582 12 3 3.1 7 9.8 14.9 0.42 1.05
2001-02 4,744 14 3 3.6 5 11.4 17.3 0.36 0.86
2002-03 5,641 17 3 4.4 5 13.8 21.1 0.37 0.85
Average 3,820 13 3 3.3 5.4 10.6 16.1 0.46 1.09

25
Table 2. Annual survival rates for cougars in the Pacific Northwest (mean (sample
size)) for kittens (0-1yr), yearlings (1-2yr), and adult (2-12yr) males and females,
from 1998 to 2003.
1998-99 1999-00 2000-01 2001-02 2002-03 Mean±95%CI
Kittens NA 0.25 (4) 1 (3) 0.75 (8) 0.43 (7) 0.57±0.21 (21)
Yearlings 1 (2) 0.53 (7) 0.24 (7) 0.17 (5) 0.41 (5) 0.34±0.35 (17)
Adult males 0.21 (3) 0.50 (2) 0.27 (3) 0.26 (3) 1.00 (3) 0.33±0.47 (8)
Adult females 1 (9) 0.90 (12) 0.91 (11) 0.52 (13) 0.76 (16) 0.77±0.20 (28)
Total radio-collared 0.69 (14) 0.76 (21) 0.65 (20) 0.35 (22) 0.77 (23) 0.59±0.20 (52)
26
Figure 1. Study area in the Pacific Northwest. The hatched polygons represent the
95% adaptive kernel composite home range of all cougars monitored from 1998 to
2003, and the triangles (N = 52) represent capture locations.
27
0
1
2
3
4
5
6
7
8
9
10
Nov Dec Jan Feb Mar Apr May Jun Jul Aug Sep Oct
Death
fre
qu
en
cy
LM HM
Figure 2. Monthly distribution of the cougar mortalities in the Pacific Northwest,
from 1998 to 2003. High mortality (HM) season was from 13 November to 20 May,
while the low mortality (LM) season was from 21 May to 12 November. Seasons
were defined by the median date of the deaths and were used to meet the assumption
of constant mortality within each time interval required by the Heisey-Fuller survival
analysis.
28
KitF KitM YeaF YeaM 3F 3M … 11F 11M F12 M12
KitF myfSkf 0 m3fSyf 0 m4fS3f 0 … m12fS11f 0 m13fs12f 0
KitM mymSkf 0 m3mSyf 0 m4mS3f 0 … m12mS11f 0 M13ms12f 0
YeaF Skf 0 0 0 0 0 … 0 0 0 0
YeaM 0 Skm 0 0 0 0 … 0 0 0 0
3F 0 0 Syf 0 0 0 … 0 0 0 0
3M 0 0 0 Sym 0 0 … 0 0 0 0
… … … … … … … … … … … …
11F 0 0 0 0 0 0 … 0 0 0 0
11M 0 0 0 0 0 0 … 0 0 0 0
12F 0 0 0 0 0 0 … S11f 0 0 0
12M 0 0 0 0 0 0 … 0 S11m 0 0
Figure 3. Structure of the Leslie matrix used to model population growth for female
and male cougar kittens (KitF, KitM), yearlings (YeaF, YeaM), and adult (xF, xM,
where x is the age class from 3 to 12) in the Pacific Northwest, from 1998 to 2003.
In the first two rows, fecundity rates (Fx) represented the probability that a female of
age x will give birth to a male (mxmS(x-1)f) or female (mxfS(x-1)f) kitten. The survival
rates for kittens (Skf, Skm), yearlings (Syf, Sym), adult males (Sxm) and adult females (Sxf)
were the elements of the second-subdiagonal.
29
0.00
0.20
0.40
0.60
0.80
1.00
1.20
1.40
1.60
1.80
1998-99 1999-00 2000-01 2001-02 2002-03
Ab
un
dan
ce/
10
0km
^2
All cougars -SAD
All cougars -Capture data
Adults only -SAD
Adults only -Capture data
Figure 4. Adult and total cougar density in the Pacific Northwest, from 1998 to
2003, calculated with the 95% composite adaptive kernel home range method for
adult females, and projected with both capture data and stable age distribution (SAD)
vector to calculate adult male and yearling densities. Kitten density was calculated
with the SAD.
30
0
0,2
0,4
0,6
0,8
1
1,2
1,4
1998-99 1999-00 2000-01 2001-02 2002-03
Deterministic growth rate
Adult female survival
Figure 5. Annual survival rates of adult females and deterministic growth rates l1
(dominant eigenvalue of annual matrix model), between 1998 and 2003, for cougars
in the Pacific Northwest.
31
0
100
200
300
400
500
600
700
800
900
1000
0 2 4 6 8 10 12 14 16 18 20 22 24
Year
Co
ug
ar
ab
un
dan
ce
Figure 6. Simulated trajectory of the cougar population in the Pacific Northwest,
based on survival and fecundity rates from 1998 to 2003. The squares represent the
annual average abundances, the vertical lines are standard deviations, and the empty
circles are maximum and minimum values obtained in 5,000 simulations.
32
0
0.2
0.4
0.6
0.8
1
1.2
1 2 3 4 5 6 7 8 9 10 11 12 13 14 15 16 17 18 19 20 21 22 23 24 25
Year
Cu
mu
lati
ve p
rob
ab
ilit
y
Extirpation
Demographic collapse
Figure 7. Time to fall from 357 cougars to demographic collapse (N = 79,
equivalent to 30 adults) and extirpation (N = 0), based on vital rates estimated for
cougars in the Pacific Northwest from 1998 to 2003, and simulated 5,000 times over
25 years.
33
LITERATURE CITED
AKÇAKAYA, H.R. 2002. Estimating the variance of survival rates and fecundities.Animal Conservation 5:333-336.
ASHMAN, D.L., AND K. GREER. 1976. Age techniques. Pages 199-204 in: G.C.Christensen and R.J. Fisher, editors. Transactions of the Mountain LionWorkshop, U.S. Fish and Wildlife Service, Portland, Oregon, USA.
AUSTIN, M. 2003. British Columbia mountain lion status report [abstract]. In press.Proceedings of the Seventh Mountain Lion Workshop; 2003 May 15-17,Jackson, Wyoming, USA.
BANHURST, D., AND F.G. LINDZEY. 1989. Detecting female mountain lions withkittens. Northwest Science 63:35-37.
BAILEY, R.G. 1995. Descriptions of the Ecoregions of the United States. 2nd ed.(rev. and expanded). Miscellaneous publication 1391 (rev.). U.S. Departmentof Agriculture, Forest Service, Washington DC, USA.
BEIER, P. 1991. Cougar attacks on humans in the United States and Canada.Wildlife Society Bulletin 19:403-412.
_____. 1993. Determining minimum habitat areas and habitat corridors for cougars.Conservation Biology 7:94-108.
_____, D. CHOATE, AND R.H. BARRETT. 1995. Movement patterns of mountainlions during different behaviors. Journal of Mammalogy 76:1056-1070.
_____. 1996. Metapopulation models, tenacious tracking, and cougar conservation.Pages 293-323 in: D.R. McCullough, editor. Metapopulation and wildlifeconservation, Island Press, Washington, D.C., USA.
BROOK, B.W., J.J. O’GRADY, A.P. CHAPMAN, M.A. BURGMAN, H.R. AKÇAKAYA,AND R. FRANKHAM. 2000. Predictive accuracy of population viability analysisin conservation biology. Nature 404:385-387.
34
CASE, T.J., editor. 2000. An illustrated guide to theoretical ecology. OxfordUniversity Press, New York, New York, USA.
CASWELL, H. 1997. Matrix methods for population analysis. Pages 19-58 in: S.Tuljapurkar and H.Caswell, editors. Structured-population models in marine,terrestrial, and freshwater systems. Population and community biology series18, Chapman & Hall, New York, New York, USA.
_____. 2001. Matrix population models: Construction, analysis, and interpretation.Second edition. Sinauer Associates, Sunderland, Massachusetts, USA.
CHESTER, T. 2003. Mountain lion attacks on people in the U.S. and Canada[online]. Available from: http://tchester.org/sgm/lists/lion_attacks.html.Accessed 6 October 2003.
COUPE, R., A.C. STEWART, AND B.M. WIKEEM. 1991. Englemann spruce-subalpinefir zone. Pages 223-236 in D. Meidinger and J. Poplar, editors. Ecosystems ofBritish Columbia. Special report series 6, B.C. Ministry of Forests, ResearchBranch, Victoria, British Columbia, Canada.
CUNNINGHAM, S.C., W.B. BALLARD, AND H.A. HEATHER. 2001. Age structure,survival, and mortality of mountain lions in southeastern Arizona.Southwestern Naturalist 46:76-80.
DAWN, D., M. KUTILEK, R. HOPKINS, S. ANAND, AND S. TORRES. 2003.Management of cougars (Puma concolor) in the western United States. Inpress. Proceedings of the Seventh Mountain Lion Workshop; 2003 May 15-17,Jackson, Wyoming, USA.
DEMARCHI, D.A. 1996. An introduction to the ecoregions of British Columbia.Ministry of Environment, Lands and Parks, Wildlife Branch, Victoria, BritishColumbia, Canada.
DICKSON, B. AND P. BEIER. 2002. Home-range and habitat selection by adultcougars in Southern California. Journal of Wildlife Management 66:1235-1245.
JEDRZEJEWSKA, B., W. JEDRZEJEWSKI, A.N. BUNEVICH, L. MILKOWSKI, AND H.OKARMA. 1996. Population dynamics of Wolves Canis lupus in Bialowieza
35
Primeval Forest (Poland and Belarus) in relation to hunting by humans, 1847-1993. Mammal Review 26:103-126.
HEISEY, D.M. AND T.K. FULLER. 1985. Evaluation of survival and cause-specificmortality rates using telemetry data. Journal of Wildlife Management 49:668-674.
HEMKER, T.P., F.G. LINDZEY, B.B. ACKERMAN, AND A.J. BUTTON. 1986. Survivalof cougar cubs in a non-hunted population. Pages 327-332 in: S.D. Miller andD.D. Everett, editors. Cats of the world. National Wildlife Federation,Washington, D.C., USA.
HOOGE, P.N., AND B. EICHENLAUB. 1997. Animal movement extension to Arcview,version 1.1. Alaska Biological Science Center, U.S. Geological Survey,Anchorage, Alaska, USA.
HORNOCKER M.G. 1970. An analysis of mountain lion predation upon mule deer andelk in the Idaho primitive area. Wildlife Monograph 21.
KATNIK, D.D. 2002. Predation and habitat ecology of mountain lions (Pumaconcolor) in the southern Selkirk mountains. Dissertation, Washington StateUniversity, Pullman, Washington, USA.
KETCHESON, M.V., T.F. BRAUMANDLE, D. MEIDINGER, G. UTZIG, D.A. DEMARCHI,AND B.M WIKEEM. 1991. Interior cedar-hemlock zone. Pages 167-181 in D.Meidinger and J. Poplar, editors. Ecosystems of British Columbia. Specialreport series 6, B.C. Ministry of Forests, Research Branch, Victoria, B.C.
KERLEY, L.L., J.M GOODRICH, D.G. MIQUELLE, E.N. SMIRNOV, H.B. QUIGLEY,AND M.G. HORNOCKER. 2002. Reproductive parameters of wild femaleAmur (Siberian) tigers (Panthera tigris altaica). Journal of Mammalogy84:288-298.
KOEHLER, G. AND E. NELSON. 2003. Project CAT (cougars and teaching):integrating science and community in development planning [abstract]. Inpress. Proceedings of the Seventh Mountain Lion Workshop; 2003 May 15-17,Jackson, Wyoming, USA.

36
LINDZEY, F.G., W.D. VAN SICKLE, B.B. ACKERMAN, D. BARNHURST, T.P. HEMKER,AND S.P. LAING. 1994. Cougar population dynamics in Southern Utah.Journal of Wildlife Management 58:619-624.
LOGAN, K.A. AND L.L. SWEANOR. 2001. Desert puma: Evolutionary ecology andconservation of an enduring carnivore. Island Press, Washington, D.C., USA.
_____, L.L. Irwin, and R. Skinner. 1986. Characteristic of a hunted mountain lionpopulation in Wyoming. Journal of Wildlife Management 50:648-654.
LOPEZ-GONZALEZ, C.A. 1999. Implicaciones para la conservacion y el manajo depumas (Puma concolor) utilizando como modelo una poblacion sujeta acaceria deportiva. Dissertation, Universidad Nacional Autonoma de Mexico,Mexico.
MARTORELLO, D.A. 2001. Cougar status and trend report. Game status and trendreport, Wildlife Program, Washington Department of Fish and Wildlife,Olympia, Washington, U.S.A.: 159-161.
_____. 2003. Cougar harvest statistics pre- and post-initiative banning use ofhounds for hunts. 2003 annual meeting and workshops, The WashingtonChapter of the Wildlife Society; 2003 April 15-17, Port Townsend,Washington, USA.
MAYFIELD, H. 1961. Nesting success calculated from exposure. Wilson Bulletin,73:255-261.
MORRIS, W.F. AND D.D. DOAK. 2002. Quantitative conservation biology; Theoryand practice of population viability analysis. Sinauer Associates, Sunderland,Massachusetts, USA.
NADEAU, S. 2003. Idaho mountain lion status report. In press. Proceedings of theSeventh Mountain Lion Workshop; 2003 May 15-17, Jackson, Wyoming,USA.
RILEY, S.J. AND D.J. BECKER. 2000. Wildlife stakeholder acceptance capacity forcougars in Montana. Wildlife Society Bulletin 28:931-939.
37
____ AND R.A. MALECKI. 2001. A landscape analysis of cougar distribution andabundance in Montana, USA. Environmental Management 28:317-323.
ROBINETTE, W.L., J.S. GASHWILER, AND O.W. MORRIS. 1961. Notes on cougarproductivity and life history. Journal of Mammalogy 42:204-217.
ROBINSON, H, S., R.B. WIELGUS, AND J.C. GWILLIAM. 2002. Cougar predation andpopulation growth of sympatric mule deer and white-tailed deer. CanadianJournal of Zoology 80:556-568.
ROSS, P.I., AND M.G. JALKOTZY. 1992. Characteristics of a hunted population ofcougars in Southwestern Alberta. Journal of Wildlife Management 56:417-426.
SAMUEL, M.D. AND M.R. FULLER. 1996. Wildlife radiotelemetry. Pages 370-418in: T.A. Bookhout, editor. Research and management techniques for wildlifeand habitats. Fifth edition revised, Wildlife Society, Bethesda, Maryland,U.S.A.
SEAL, U.S., D.L. ARMSTRONG, AND L.G. SIMMONS. 1987. Yohimbinehydrochloride reversal of ketamine hydrochloride and xylazine hydrochlorideimmobilization of Bengal tigers and effects on hematology and serumchemistry. Journal of Wildlife Diseases 23:296-300.
SMALLWOOD, K.S. 1997. Interpreting puma (Puma concolor) population estimatesfor theory and management. Environmental Conservation 24:283-289.
SMUTS, G.L. 1978. Effects of population reduction on the travels and reproductionof lions in Kruger National Park. Carnivore 1:61-72.
SPENCER, R.D., PIERCE, D.J., SCHIRATO, G.A., DIXON, K.R., AND C.B. RICHARDS.2001. Mountain lion home range, dispersal, mortality, and survival in theWestern Cascade Mountains of Washington. Final report. WashingtonDepartment of Fish and Wildlife, Olympia, Washington, USA.
SPREADBURY, B.R., K. MUSIL, J. MUSIL, C. KAISNER, AND J. KOVAK. 1996. Cougarpopulation characteristics in southeastern British Columbia. Journal ofWildlife Management 64:962-969.

38
SWEANOR, L.L., K.A. LOGAN, AND M.G. HORNOCKER. 2000. Cougar dispersalpatterns, metapopulation dynamics and conservation. Conservation Biology14:798-808.
TOWEILL, D.E., C. MASER, L.D. BRYANT, AND M.L. JOHNSON. 1984. Size andreproductive characteristics of western Oregon cougars. Pages 176-184 in: J.Roberson and F. Lindzey, editors. Proceedings of the Second Mountain LionWorkshop, Zion National Park, Utah, USA.
_____, _____, _____, AND _____. 1988. Reproductive characteristics of easternOregon cougars. Northwest Science 62:147-150.
WASHINGTON DEPARTMENT OF FISH AND WILDLIFE. 1999. Fact sheets: cougars[online]. Available from: http://www.wa.gov/wdfw/factshts/cougar.htm.Accessed 30 September 2003.
WIELGUS, R.B. 2002. Minimum viable population and reserve sizes for naturallyregulated grizzly bears in British Columbia. Biological Conservation 106:381-388.
_____, F.L. BUNNELL, W.L. WAKKINEN, AND P.E. ZAGER. 1994. Populationdynamics of Selkirk mountain grizzly bears. Journal of Wildlife Management58:266-272.
_____, F. SARRAZIN, R. FERRIERE, AND J.CLOBERT. 2001. Estimating effects ofadult male mortality on grizzly bear population growth and persistence usingmatrix models. Biological conservation 98:293-303.