Embed Size (px)
Citation preview

HAL Id: hal-01269183https://hal.archives-ouvertes.fr/hal-01269183
Submitted on 14 Jan 2021
HAL is a multi-disciplinary open accessarchive for the deposit and dissemination of sci-entific research documents, whether they are pub-lished or not. The documents may come fromteaching and research institutions in France orabroad, or from public or private research centers.
L’archive ouverte pluridisciplinaire HAL, estdestinée au dépôt et à la diffusion de documentsscientifiques de niveau recherche, publiés ou non,émanant des établissements d’enseignement et derecherche français ou étrangers, des laboratoirespublics ou privés.
Dynamics and mass transfer of rising bubbles in ahomogenous swarm at large gas volume fraction
Damien Colombet, Dominique Legendre, Frederic Risso, Arnaud Cockx,Pascal Guiraud
To cite this version:Damien Colombet, Dominique Legendre, Frederic Risso, Arnaud Cockx, Pascal Guiraud. Dynamicsand mass transfer of rising bubbles in a homogenous swarm at large gas volume fraction. Journal ofFluid Mechanics, Cambridge University Press (CUP), 2015, 763, pp.254 - 285. �10.1017/jfm.2014.672�.�hal-01269183�

Under consideration for publication in J. Fluid Mech. 1
Dynamics and mass transfer of risingbubbles in an homogenous swarm
at large gas volume fraction
Damien Colombet1,2,3†, Dominique Legendre1‡,Frederic Risso1, Arnaud Cockx2, Pascal Guiraud2
1Institut de Mecanique des Fluides de Toulouse, CNRS & Universite de Toulouse,Allee Camille Soula, 31400 Toulouse, France
2Laboratoire d’Ingenierie des Systemes Biologiques et des Procedes, CNRS,INRA & Universite de Toulouse, 135 Avenue de Rangueil, 31077 Toulouse, France
3Rhodia - SOLVAY R&I, 85 Avenue des Freres Perret, BP 62, 69192 Saint Fons, France
(Received 4 November 2014)
The present work focuses on collective effect on both bubble dynamics and mass trans-fer in a dense homogeneous bubble swarm for gas volume fractions α up to 30%. Theexperimental investigation is carried out with air bubbles rising in a square column filledwith water. Bubble size and shape are determined by means of a high speed cameraequipped with a telecentric lens. Gas volume fraction and bubble velocity are measuredby using a dual-tip optical probe. The combination of these two techniques allows us todetermine the interfacial area between the gas and the liquid. The transfer of oxygenfrom the bubbles to the water is measured from the time evolution of the concentrationof oxygen dissolved in water, which is obtained by means of the gassing-out method.Concerning the bubble dynamics, the average vertical velocity is observed to decreasewith α in agreement with previous experimental and numerical investigations, while thebubble agitation turns out to be weakly dependent on α. Concerning mass transfer, theSherwood number is found to be very close to that of a single bubble rising at sameReynolds number, provided this latter is based on the average vertical bubble velocity,which accounts for the effect of the gas volume fraction on the bubble rise velocity. Thisconclusion is valid for situations where the diffusion coefficient of the gas in the liquidis very low (high Peclet number) and the dissolved gas is well mixed at the scale of thebubble. It is understood by considering that the transfer occurs at the front part of thebubbles through a diffusion layer which is very thin compared to all flow length scalesand where the flow remains similar to that of a single rising bubble.
Key words: Bubbly flow, Agitation, Mass transfer.
1. Introduction
Bubbly flows are usually employed in industry when the rate of mass transfer betweena gas and a liquid is limited by the diffusion of the solute in the liquid. They combinethe advantages of a large interfacial area by unit of volume and of an intense liquidagitation, which enhances the mixing of solute and accelerate chemical reactions. In
† Present address: LEGI, Energetic Team, Joseph Fourier University, Grenoble, France‡ Email address for correspondence: [email protected]

2 D. Colombet, D. Legendre, F. Risso, A. Cockx and P. Guiraud
many applications, the gas volume fraction α is larger than 20% and locally reachesmuch larger values. Bubbles can thus not be considered as isolated and collective effectshave to be accounted for.
A first major collective effect is the decrease of the average bubble rise velocity 〈Vz〉when increasing the gas volume fraction. The prediction of the increase of the bubbledrag is an important issue for industrial applications. In the literature, several exper-imental works have investigated this phenomenon. Among them, the experiments ofWallis (1961), who investigated a homogenous bubble swarm of air bubbles in a soapywater solution, suggest that the rise velocity scales as 〈Vz〉 ∝ (1 − α) up to a gas vol-ume fraction of 30%. This scaling law was established by considering the global con-servation of the mass of gas, where the gas flow rate was measured directly and thegas volume fraction was deduced from the variation of the hydrostatic pressure. Usingthe same procedure and making an analogy with a fluidized bed, Bridge et al. (1964)found a rather similar scaling, 〈Vz〉 ∝ (1 − α)1.39, for the case of a countercurrent liq-uid flow, with air sparged into water, glycerine/water or water/isoamyl-alcohol mixtures,for α 6 20%. Wijngaarden & Kapteijn (1990) determined the mean relative velocity ofair bubbles in water by means of a technique based on electric conductance measure-ments and found that it scaled as (1 − 1.78α) up to a gas volume fraction of 14%. Inthe presence of a liquid flow Garnier et al. (2002) observed that 〈Vz〉 scaled as α1/3 forα 6 40% by means of a dual-tip optical probe. For different various two-phase flowconfigurations, Ishii & Chawla (1979) and Rusche & Issa (2000) found more complex ex-pressions. In order to estimate relative velocity in bubbly, droplet or particulate flows,Ishii & Chawla (1979) proposed a model based on an effective viscosity of the two-phasemixture. Rusche & Issa (2000) introduced a drag correction as a combination of a powerlaw and an exponential function with coefficients that depend on the nature of the consid-ered dispersed flow. Direct numerical simulations of a swarm of bubble rising in a periodicdomain have also been performed. For moderate Reynolds number (Re = O(10− 100)),using a front tracking method and avoiding bubble coalescences, the decrease of 〈Vz〉with α has been confirmed for both spherical (Bunner & Tryggvason 2002a,b) and ellip-soidal bubbles (Bunner & Tryggvason 2003). Deformed bubbles at large Reynolds num-ber (Re = O(100 − 1000)) for α 6 45% have been simulated by Roghair et al. (2011)who used 20 Eulerian mesh points on the surface of each bubble. They observed thatthe decrease of the bubble velocity was affected by the bubble Eotvos number as well asby the value of the gas volume fraction. Despite the great number of experimental andnumerical attempts, no general model for the rise velocity of bubbles exists yet, owing tothe complexity of bubbly flows. Experimental investigations at large gas volume fractions(α > 15%) with accurate determination of both the bubble geometry and velocity arethus still desirable.
A second collective effect of great significance is the modification of the interfacial rateof mass transfer when the gas volume fraction is increased. Despite the significant gasvolume fractions that are present in most industrial applications, many studies make useof mass transfer models developed for isolated bubbles. These models are usually based onHigbie’s penetration theory (Higbie 1935), but consider various definitions for the contacttime: (i) ratio of bubble diameter to bubble rise velocity, (ii) ratio of bubble surface torate of surface formation (Nedeltchev et al. 2006), or (iii) based on the eddy velocityfor developped turbulent flows (Lamont & Scott 1970; Kawase et al. 1987; Linek et al.
2004). With a contact time defined as the ratio of bubble diameter to bubble rise velocity(i), the Higbie’s penetration theory, is also known as the Boussinesq solution (Boussinesq1905). Numerical simulations (Takemura & Yabe 1998; Figueroa & Legendre 2010) haveshown that this analytical solution appears to be very accurate to describe interfacial

Dynamics and mass transfer of rising bubbles in an homogenous swarm 3
mass transfer for a single clean spherical bubble rising in a still liquid, at large bubbleReynolds and Peclet numbers. Moreover, the experiments by Alves et al. (2006) showedthat this solution was still valid for the interfacial mass transfer of a single bubble fixedin a turbulent downward liquid flow, up to a certain dissipation rate of the turbulence.The Boussinesq solution has also been used as a closure law in Eulerian-Eulerian two-fluid simulations of industrial ozonation towers (Cockx et al. 1999) and aeration tanksfor urban wastewater treatment (Fayolle et al. 2007) at low to moderate volume fractions(α 6 10%). Higbie’s penetration theory with a contact time based on the rate of surfaceformation (ii) has been found to provide a good estimate of the mass transfer rate in apressurized bubble column for either water or organic liquids (Nedeltchev et al. 2007). Inthe same time, Higbie’s penetration theory with a contact time defined with eddy velocity(iii) has been preferred by Buffo et al. (2012) and Petitti et al. (2013) to simulate gas-liquid mass transfer in stirred tank reactors.
As indicated above, Boussinesq solution is a priori limited to large bubble Reynoldsand Peclet numbers and isolated spherical bubbles. Some corrections based on resultsfor a single bubble have been introduced to account for the effect of finite Reynoldsnumber (Darmana et al. 2005; Shimada et al. 2007; Ayed et al. 2007) and that of bubbledeformation (Nedeltchev et al. 2007) in simulations of bubble columns. Such correctionsare discussed in Takemura & Yabe (1998) and Figueroa & Legendre (2010). Reviews formass transfer can be found in Clift et al. (1978) and in Michaelides (2006) for bubbles, butalso for drops and particles. Most of these studies have focused on mass or heat transferfrom a single inclusion. Their applicability in dense dispersed flow is an important issue.
In the last decades, a few works have focused on collective effect upon mass transferin a bubble swarm (Koynov & Khinast 2005; Kishore et al. 2008; Colombet et al. 2011;Roghair 2012). Most of them are numerical works. Two-dimensional numerical simu-lations of mass transfer for different arrangements of bubbles have been performed byKoynov & Khinast (2005) for small Reynolds numbers. For the case of 3 bubbles initiallyaligned horizontally, the authors observed a decrease of the Sherwood number. For thisparticular case, they noticed that, taking into account the reduced Reynolds number, theSherwood number stays close to that of a single bubble. They also found a decrease ofthe Sherwood number for the case of bubbles which were initially aligned in the verticaldirection. According to Koynov & Khinast (2005), this is due to the fact that bubblesare rising in the wake of each others so that both the gradient of concentration and theinterfacial mass flux are reduced. One of their conclusions is that ”Mass transfer in abubble swarm depends both on the motion of the swarm as a whole and on the motionof the individual bubbles and, in general, does not follow trends observed in the singlebubble cases.” For both Newtonian and non-Newtonian fluids, Kishore et al. (2008) useda ”cell model” of two concentric spheres to study numerically the collective effect ofmass transfer for a clean spherical bubble. In that simplified approach, the increase ofgas volume fraction is modeled by a decrease of the bounding sphere. The results seem tosuggest an increase of the Sherwood number with the increase of the gas volume fraction.The effect of increasing the gas volume fraction on the gas-liquid mass transfer coef-
ficient has been experimentally investigated by Colombet et al. (2011) for air bubble inwater. Thanks to a high speed camera with a fixed focal lens, a Particle Traking Ve-locimetry (PTV) method was able to measure bubble volumes, shapes and velocities forgas volume fractions from 0.45 to 16.5%. In this range, the mass transfer coefficient isfound very close to that of a single bubble provided the Reynolds number is based on themean equivalent diameter and the average rising velocity of a bubble in the swarm, whichsuggests a weak influence of the collective effect on the mass transfer at hight Peclet num-ber. In a recent study using direct numerical simulation, Roghair (2012) found a marginal

4 D. Colombet, D. Legendre, F. Risso, A. Cockx and P. Guiraud
increase of the mass transfer coefficient kL with the increase of the gas volume fractionfor 4 mm air bubbles rising in water at Re 6 1070, Sc = 1 and 4 6 α 6 40%.
The objective of the present study is to investigate collective effect on the bubbledynamics and mass transfer in very dense homogeneous bubbly flows with controlledhydrodynamic conditions. For this purpose, accurate measurements of interfacial area,bubble diameter, deformation and rising velocity are first performed for 12.1 6 α 6
33.9%. Then, oxygen mass transfer experiments are conducted for 0.7 6 α 6 29.6%. Thepaper is organized as follows. Sections 2 describes the experimental methods. Section 3presents the dynamics of the bubbles while section 4 shows the results concerning masstransfer. Section 5 is devoted to the analysis and the discussion of the results. Section 6summarizes the main conclusions.
2. Experimental setup and instrumentation
2.1. General description
The experimental setup is described in figure 1a. It has been previously used by Riboux et al.
(2010) and Colombet et al. (2011). Bubbles are injected through stainless steel capillar-ies [1] in a square glass column of 15 × 15 cm cross-section and 100 cm high. The gasline is equipped with three different rotameters [2] and one manometer [3] to deal with alarge range of gas flow rates and volume fractions. A three-way valve enables to switchfrom nitrogen to air [4]. The use of 841 capillaries of 15 cm long and dc = 0.2 mm innerdiameter ensures an homogeneous injection of bubbles of almost equal sizes.Experiments are performed at ambient temperature and pressure (T = 20 ◦C and P =
Patm). The liquid used for all experiments is tap water filtered to remove particles largerthan 15 µm [5]. As a consequence, in the regime considered, gas-liquid interfaces can beconsidered to be clean (Ellingsen & Risso 2001). This point has been carefully validatedby measuring the terminal velocity for single bubbles. The main physical properties ofthe system are summarized in table 1.
2.2. Measurements of gas volume fraction and bubble velocity
The gas volume fraction α and the average vertical bubble velocity 〈Vz〉 are measuredby means of a dual-tip optical fiber probe (RBI Instrumentation) which is introduced atthe center of the column [7]. A threshold just higher than the noise level is first appliedon the raw signal to define the binarized signal. An example of raw and binarized signalsobtained for each fiber is presented in Fig. 3. Then, the volume fraction is determinedfrom
α =
∑
∆tyitaqc
, (2.1)
where tacq is the acquisition duration, ∆tyi the residence time of bubble i on the probefirst fiber (see Fig. 3) and Σ∆tyi the total time during which the gas phase is detected. Thesignal acquisition is performed with a sampling frequency of 10 kHz. A good statisticalconvergence and an overall accuracy better than 2% is obtained for a recording timelarger than 800 s.
The vertical velocity Vzi of bubble i is obtained by
Vzi =ds
∆t12i, (2.2)
where ∆t12i is the time elapsed between the detection of the bubble interface by thefirst and the second fiber (as reported in Fig. 3.) and ds is the distance between the
Dynamics and mass transfer of rising bubbles in an homogenous swarm 5
two fiber tips. The main difficulty of this technique is to match two successive risingfronts corresponding to the piercing of the same bubble. Spurious unrealistic low or largevelocity measurements are detected in some cases, especially when two bubbles interactclose to the probe. According to the sensitivity study of Riboux (2007), values smallerthan Vmin = 0.03 ms−1 or larger than Vmax = 0.7 ms−1 have been removed.
2.3. Measurement of bubble geometrical characteristics
The most reliable technique to determine the bubble shape is probably to process imagesobtained by means of a high-speed camera. A classic way to image the bubbles is to usea fixed focal lens with a thin depth of field, as done by Colombet et al. (2011). However,the larger the gas volume fraction, the more numerous are blurred out-of-focus bubblesin the field of view. The use of a fixed focal lens is thus limited to moderate gas volumefractions (α 6 15%).
The study of collective effects in a dense bubble swarm therefore requires the develop-ment and the use of another optical technique. In the present work, we use a telecentriclens, which has the particularity to have a depth of field larger than the column width(15 cm) and a constant magnification factor all along the direction of view. The mainadvantage is to image bubbles with sharp contours, even in a very dense bubbly flow. Themain drawback is that the increase of the field of view results in a significant reductionof the spatial resolution. In addition, it has been possible to follow individual bubblesonly on a short distance. For those two reasons, the measurement of the bubble velocityis less accurate and image processing has been specifically used to measure the bubblegeometrical characteristics.
The imaging set-up consists of a high speed CMOS camera (Photron APX, Fig. 1b)equipped with a telecentric lens (TC-4M-172 Opto Engineering) to visualize a windowof 94 × 94 mm located at the center of the column at a distance of 150 mm above theinjectors tips. The spacial resolution is 5.8 pixel mm−1. The camera is operated at 500images per second with an exposure time varying from 1/20000 to 1/500 s depending onthe lighting intensity. Lighting is supplied by an halogen spot of 1000 W.The recorded images are processed by using Matlabr. The bubble edges are detected
by applying a threshold to the raw images in gray levels. The interior of the bubbles is thenfilled and small aberrant objects detected in the picture are removed. A test of convexityis done to identify cases for which the detected object corresponds to two superimposedbubbles. It consists in comparing the surface area Sobj of the detected object to the areaSconv of the smallest convex polygon that can contain the object. Only the objects withSobj/Sconv > 0.95 are retained, the others being discard. Examples of detected contoursare drawn on typical raw images in figure 2 for different gas volume fractions.The geometrical properties of the bubbles are determined by assuming that the bubbles
are oblate spheroids with a minor semi-axis a and a major semi-axis b, which are measuredfrom the two-dimensional measured contours. The bubble aspect ratio is defined as χ =b/a. The bubble volume is estimated from Vb = 4πb2a/3 and its equivalent diameter from
d = (8b2a)1/3. (2.3)
The bubble area Sb is estimated by (Beyer 1987)
Sb = πd2
4
(
2χ2/3 +χ−4/3
√
1− χ−2ln
(
1 +√
1− χ−2
1−√
1− χ−2
))
. (2.4)
In addition, an indirect determination of the bubble equivalent diameter can be ob-tained from the dual-tip optical probe by assuming that all the bubbles have the same

6 D. Colombet, D. Legendre, F. Risso, A. Cockx and P. Guiraud
size. As recalled in Colombet (2012), for a mono-dispersed population of bubbles thatimpact the probe with null angle of attack, d can be expressed as a function of the averagechord length 〈y〉,
d =3
2〈y〉χ2/3 , (2.5)
where 〈y〉 is obtained from optical probe measurements as
〈y〉 =∑n
1(Vzi∆tyi)
n, (2.6)
and χ from image processing. (Note that the size distribution of the bubbles will bediscussed in section 3.1 from the results of image processing.)
2.4. Measurement of interfacial area
For a bubble column of total volume Vtot, the volumetric interfacial area, aI =∑
Sb/Vtot,is related to the gas volume fraction, α =
∑
Vb/Vtot, by the relation
aI = α
∑
Sb∑
Vb. (2.7)
As indicated above, for each bubble detected, a and b are obtained from the images usedto determine the bubble volume Vb and surface Sb. The volume fraction α is given bythe optical probe. Then, the interfacial area aI is determined by using Eq. (2.7).
2.5. Measurement of mass transfer
The concentration C(z, t) of oxygen dissolved in water at time t and elevation z is mea-sured by means of fast response probes: Clark type micro-sensor (Unisense Ox50). Thetechnique is based on the measurement of the intensity of the electric current betweenan anode and an oxygen reducing cathode, which is proportional to the oxygen concen-tration. Calibration of oxygen probes is performed for each experiment. Since the proberesponse is linear on the whole range of concentration considered, a calibration is per-formed in situ by using the signal measured at the beginning (anoxic water) and the end(saturated water) of each experiment. The relative uncertainty on oxygen concentrationmeasurements is ± 2%. In the present configuration, as shown in figure 1 [6], two oxygenprobes have been placed at two different elevations z, which are reported in table 2.As shown in Colombet et al. (2011), due to the moderate height of the bubble column
(6 70 cm), the oxygen saturation concentration in the water is almost not affected by thevariation of hydrostatic pressure (6.4%) or by the depletion of the oxygen concentrationwithin the bubbles during the mass transfer (6%). Moreover, the dilution of oxygen in thebubbles induced by liquid-to-gas transfer of nitrogen at the beginning of the experimentscan also be neglected (1.3%). Consequently, the oxygen mass saturation concentrationC∗ can be considered as constant along the z axis and equals to its value at the uppersurface where the pressure is equal to that of the atmosphere (P = Patm), so that
C∗ = xG0
O2ρH2O
MO2
MH2O
(P − P sat)
He≈ 9.08 mgL−1 , (2.8)
with xG0
O2the molar fraction of oxygen in the gas phase (dry air), ρH2O = ρL the density
of water (kgm−3), M the molar masses (kgmol−1), P sat the vapour pressure of water inthe bubbles (Pa), He the Henry constant for oxygen in water (Pa). Equation 2.8 resultsfrom the Henry’s law for oxygen in water and the Raoult’s law for water in air withactivity and fugacity coefficients equal to unity for both equilibria, assuming that theliquid is essentially composed of water.

Dynamics and mass transfer of rising bubbles in an homogenous swarm 7
The classical ”gassing-out” method is used to determine the time scale of the transfer ofoxygen from the bubbles to the water. This method consists in first bubbling nitrogen gasin the column in order to remove the oxygen that is initially naturally present in water.Next, without changing the inlet gas flow-rate in order to not disturb the dynamics of thebubble swarm, air is suddenly injected instead of nitrogen. The concentration of dissolvedoxygen C then increases until it reaches the saturation concentration C∗.The moderate size of the column and the bubble-induced turbulence both contribute
to an efficient liquid mixing so that the liquid phase can be assumed to be perfectlymixed for each horizontal slice of the bubble column. Moreover, owing to the large gasvolume fractions and interfacial areas considered in this work, the vertical mass flux ofdissolved oxygen generated by the axial mixing can be neglected compared to the oxygenflux coming from the bubbles. In such conditions, the variation of the concentration ofdissolved oxygen along the bubble column is given by
∂C(z, t)
∂t=
kL aI(1− α)
(C∗ − C(z, t)) , (2.9)
where kL is the liquid-side mass transfer coefficient and aI the interfacial area. In thepresent configuration, the only reason for which C depends on z comes from the delaycorresponding for the time taken by the bubble to reach a given elevation z. In thefollowing the time origin is shifted by z/〈Vz〉 so that the concentration no more dependson z and the signals provided by the two oxygen probes are synchronized.
The analysis of the measured concentrations requires to account for the response timeτp of the probes (Letzel et al. 1999; Martin et al. 2007). For this purpose, the oxygenprobe is assumed to behave as first order system,
∂Cp
∂t= (1/τp)(C − Cp), (2.10)
where C is the real concentration and Cp is the value provided by the probe. The responsetime of each probe has been measured and found close to τp = 0.8 s. Solving eqs. (2.10)and (2.9) for a sudden increase of the mass saturation concentration saturation from 0to C∗ at t = 0, it yields
Cp
C∗= 1− 1
(τ − τp)(τe−t/τ − τpe
−t/τp) , (2.11)
where the time scale τ is related to the mass transfer coefficent kL by
τ =(1− α)
kLaI. (2.12)
2.6. Homogeneity of the bubble swarm
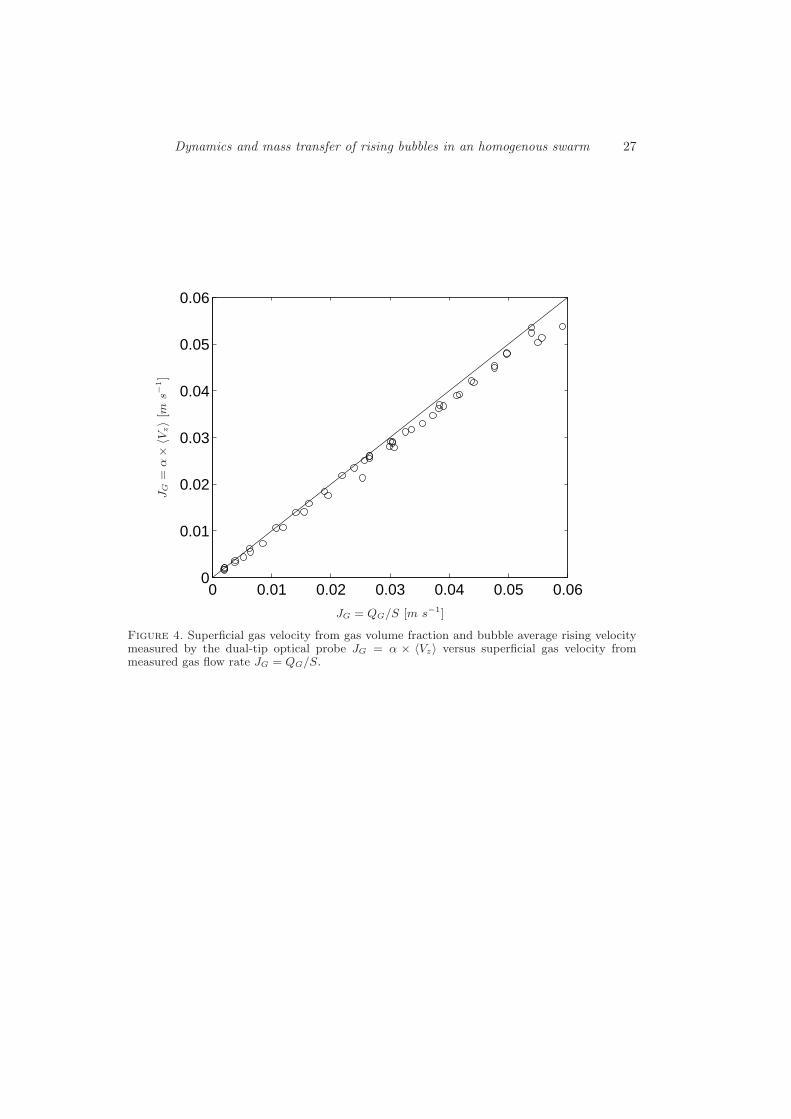
Our purpose is to study a stable bubble column in which there is no gradient of volumefraction and no large-scale liquid motions induced by buoyancy. The use of an array ofcapillary tubes guarantees that the bubbles are uniformly injected at the bottom of thecolumn. However, increasing the gas volume fraction may lead to the development of aninstability and to the transition to a churn flow. The onset of the instability depends onboth the liquid heigh H in the column and the gas volume fraction. For H = 70 cm,the flow is stable up to approximately α = 10%. For larger values of α, the liquid heighthas been reduced in order to keep a stable flow. The chosen values of H are reportedin table 2. With this choice, the free surface at the top of the column remains still andthe gas volume fraction turns out to be uniform all over the column. Figure 4 comparesthe superficial gas velocity JG = α × 〈Vz〉 obtained from 〈Vz〉 and α measured by the
8 D. Colombet, D. Legendre, F. Risso, A. Cockx and P. Guiraud
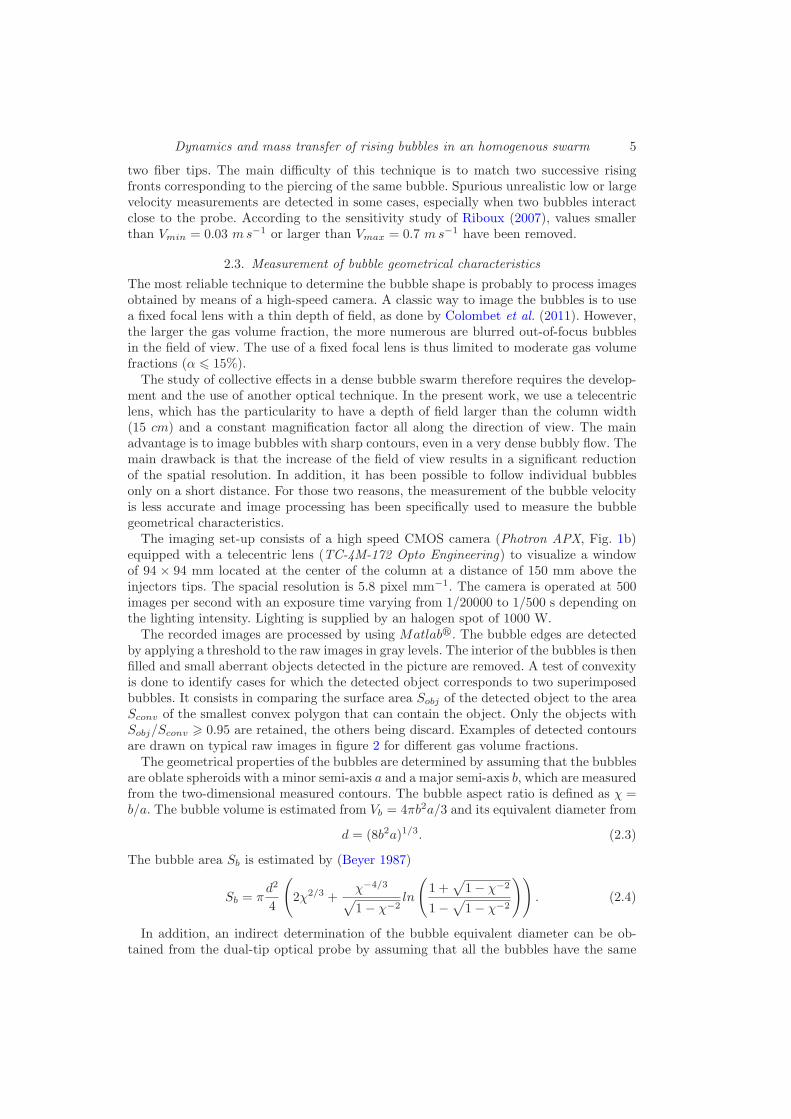
optical probe and the superficial gas velocity JG = QG/S obtained from a gas flow rateQG measured from the flowmeters. The good agreement obtained between these twoestimations for all gas volume fractions investigated (0.45 6 α 6 33.9%) confirms thehomogeneity of the gas distribution over the column.
Another departure to the flow homogeneity may come from the fact that the bubblesneed a certain distance to reach their terminal velocity and that mass transfer needsa certain time to attain a steady state. Considering a clean spherical bubble startingfrom rest, the relaxation time scale of the bubble velocity can be estimated by τV ≈d2/(72νL) ≈ 0.06 s, which corresponds to a distance 3τV Vz ≈ 5.4 cm. Concerning themass transfer, Figueroa & Legendre (2010) found a transient time τC ≈ 10(d3χ/8)1/3/Vz
for Re = 300, Sc = 10 and χ = 1.2. In our case, this leads to τC ≈ 0.04 s and τCVz ≈1.3 cm. It is therefore reasonable to consider that the flow and the mass transfer are fullydeveloped at the location of the first oxygen probes, which is at least 5.8 cm above thecapillaries.
3. Characterisation of the bubbles dynamics
In this section, the bubble dynamics is characterized in terms of bubble size, veloc-ity, deformation, interfacial area and relevant dimensionless numbers. The results ob-tained by means of a telecentric lens are systematically presented together with those ofColombet et al. (2011), who used a fixed focal lens in the same experimental set-up for0.45 6 α 6 16.5%. In figures 5, 6, 7 and 9b, the errorbars indicate the uncertainty relatedto the image resolution on the measurement of bubble size and to the measurement of α.In figures 9a, 10 and 11, errorbars indicate the uncertainty related to the measurementof 〈d〉 by considering an uncertainty of ±0.02 m s−1 on the determination of the averagebubble velocity 〈Vz〉.
3.1. Equivalent diameter and interfacial area
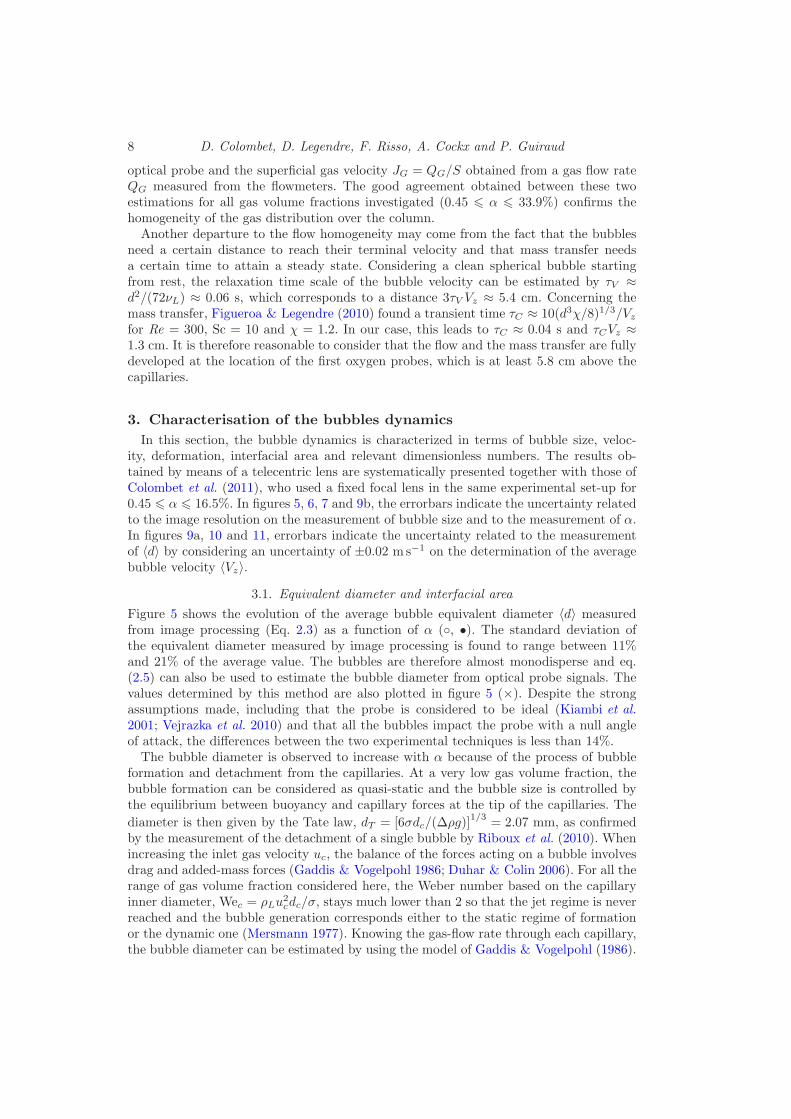
Figure 5 shows the evolution of the average bubble equivalent diameter 〈d〉 measuredfrom image processing (Eq. 2.3) as a function of α (◦, •). The standard deviation ofthe equivalent diameter measured by image processing is found to range between 11%and 21% of the average value. The bubbles are therefore almost monodisperse and eq.(2.5) can also be used to estimate the bubble diameter from optical probe signals. Thevalues determined by this method are also plotted in figure 5 (×). Despite the strongassumptions made, including that the probe is considered to be ideal (Kiambi et al.2001; Vejrazka et al. 2010) and that all the bubbles impact the probe with a null angleof attack, the differences between the two experimental techniques is less than 14%.The bubble diameter is observed to increase with α because of the process of bubble
formation and detachment from the capillaries. At a very low gas volume fraction, thebubble formation can be considered as quasi-static and the bubble size is controlled bythe equilibrium between buoyancy and capillary forces at the tip of the capillaries. The
diameter is then given by the Tate law, dT = [6σdc/(∆ρg)]1/3
= 2.07 mm, as confirmedby the measurement of the detachment of a single bubble by Riboux et al. (2010). Whenincreasing the inlet gas velocity uc, the balance of the forces acting on a bubble involvesdrag and added-mass forces (Gaddis & Vogelpohl 1986; Duhar & Colin 2006). For all therange of gas volume fraction considered here, the Weber number based on the capillaryinner diameter, Wec = ρLu
2
cdc/σ, stays much lower than 2 so that the jet regime is neverreached and the bubble generation corresponds either to the static regime of formationor the dynamic one (Mersmann 1977). Knowing the gas-flow rate through each capillary,the bubble diameter can be estimated by using the model of Gaddis & Vogelpohl (1986).

Dynamics and mass transfer of rising bubbles in an homogenous swarm 9
The predictions of this model, which are reported in figure 5, shows the same trendas the experimental results but with an underestimation of approximately 20%. Thisdiscrepancy can be due to a collective effect of the bubbles on the formation process andto bubble coalescences that may take place just above the capillary tip as observed byManasseh et al. (2008).
A log-log representation (see insert in figure 5) reveals that the evolution of 〈d〉 is welldescribed by the succession of two power-laws:
〈d〉 − d0d0
≈ 15α for α 6 2.3% (3.1)
〈d〉 − d0d0
≈ 2.3α0.5 for α > 2.3% (3.2)
where d0 =2.1 mm is the value for a single bubble detaching in the static regime fromone capillary (α = 0).
Figure 6 shows the evolution of the interfacial area as a function of the gas volumefraction. It is found to regularly increase with α according to the following empiricalpower-law power-laws
aIaI0
≈ 0.402α0.85 for α 6 2.3% (3.3)
aIaI0
≈ 0.336α0.8 for α > 2.3% (3.4)
where aI0 = Sb0/Vb0 = 3011m−1 is the surface-to-volume ratio of a single bubbledetaching in the static regime.
3.2. Bubbles velocity
3.2.1. Average velocity
During the last decade, many works have investigated the velocity of bubbles rising ina swarm (Rusche & Issa 2000; Garnier et al. 2002; Zenit et al. 2001; Riboux et al. 2010).All these studies report a significant decrease of the average bubble vertical velocity asthe gas volume fraction increases.
Figure 7 shows the average vertical bubble velocity 〈Vz〉 as a function of α. The presentresults obtained with a dual optical probe (•) are compared to those of Riboux et al.
(2010) (∗) and Colombet et al. (2011) (◦) that were obtained with the same technique,and to those of Colombet et al. (2011) (�) that were determined by image processing witha fixed focal lens. The velocity obtained from image processing is slightly lower, probablybecause the detected bubbles are not far enough from the column wall. However, all theresults obtained with an optical probe collapse onto a master curve of equation
〈Vz〉 = Vz0 [0.28 + 0.72 exp(−15α)]0.5
, (3.5)
where Vz0 = 0.32 ms−1 is the rise velocity of an isolated bubble formed on a singlecapillary in the quasi-static bubbling regime, measured by Riboux et al. (2010). It isremarkable that a single simple correlation is able to describe the evolution of the averagebubble velocity on a such large range of gas volume fraction (0.45 6 α 6 29.6%) alongwhich 〈Vz〉 is reduced by almost a factor of two (from 0.32 ms−1 to 0.17 ms−1).
It is important to stress that all empirical relations relating the properties of the gasphase to the gas volume fraction that have been introduced above (eq. 3.1, 3.2, 3.3, 3.4,3.5, 4.1, 4.3, 4.5) may depend on the particular system of gas injection used here and aretherefore not universal. However, they will be of great interest to analyse and discuss theresults of the present work in the following of this paper.

10 D. Colombet, D. Legendre, F. Risso, A. Cockx and P. Guiraud
3.2.2. Velocity fluctuations
Figure 8 shows the variances of the bubble velocity fluctuations. Let us first discuss thevariance of the velocity signal provided by the dual optical probe from this work (◦) for αup to 30% and from Riboux et al. (2010) (∗) for α up to 12%. As noted by Riboux et al.
(2010), if the dual optical probe is an accurate technique to measure the average verticalbubble velocity, it does not provide a reliable value of the variance of the bubble verticalvelocity. The reason comes from the fact that the considered bubbles are oblate spheroidwhich move with oscillating velocity and orientation. The fluctuations that are recordedby the dual probe are thus a complex combination of the fluctuations of the verticalvelocity, orientation and shape. For that reason, the measured variance is observed todepend on the exact probe geometry. The values obtained by Riboux et al. (2010) witha distance between the two fiber tips of 0.5 mm is indeed significantly larger than thatobtained in the present work with a fiber tip separation of 1 mm. However, the varianceprovided by the dual optical probe can be used to characterize the evolution with the gasvolume fraction of the overall energy of agitation of the bubbles in the vertical direction.It was already noticed that the bubble vertical agitation keep a constant value up togas volume fraction around 10% by Martınez-Mercado et al. (2007) and Riboux et al.
(2010), which suggested that the energy of bubble agitation remains controlled by wakeinstabilities. The present results seem to show that this result holds up to α = 30%.In order to have a more complete description of the bubble agitation, we have also
determined the velocity variance of the horizontal and the vertical bubble velocity fluc-tuations by particle tracking velocimetry based on images taken with a fixed focal lens.As stated before, this imaging technique already used by Colombet et al. (2011) is lim-ited to moderate volume fractions. The corresponding results are also plotted in figure 8for α up to 16%. Both the horizontal and the vertical variances are found to be almostconstant, 〈v′z
2〉 ≈ 0.003m2 s−2 and 〈v′x2〉 ≈ 0.0075m2 s−2, for α up to 10%. As shown
by Ellingsen & Risso (2001), the horizontal component of the fluctuant velocity of anisolated bubble evolves as v′x = ωAxcos(ωt). For the present bubble size, Riboux (2007)measured an angular frequency of ω =29 rad s−1 and a path amplitude Ax varying from3.5 to 4.9 mm, which gives a variance 〈v′x
2〉 = (Axω)2/2 from 0.005 to 0.01 m2s−2, in
agreement with the values found here at moderate volume fraction. When α is increasedbeyond 10%, the vertical variance remains constant, while the horizontal one decreasesdown to match the vertical value around α=12%. Such a decrease of the horizontal fluc-tuation of the dispersed phase has already been reported in solid/liquid fluidized bed byAguilar Corona (2008) and Aguilar Corona et al. (2011). It may result from hindranceeffects on bubble paths when increasing α.
3.3. Bubble Reynolds, Eotvos and Weber numbers
In order to fully characterize the present flow regime, it is useful to consider the valuestaken by the relevant dimensionless numbers in the range of volume fractions investigated.These values can be either computed from the raw values of the measured dimensionalquantities or from the empirical fits proposed in the previous sections. In the follow-ing figures, plots systematically represent raw data whereas lines corresponds to valuesobtained from fitted data.
Figure 9a shows the Reynolds number, Re = 〈Vz〉〈d〉/νL. It first increases from 670to 780 as α increases from 0 to 2.5% and then keeps a constant value as α is furtherincreased. The constance of the Reynolds number for α > 2.5% results from the factthat the increase in the bubble diameter (fig. 5) is compensated by the decrease of therise velocity (fig. 7). A similar result was observed for a volume fraction up to 10% byMartınez-Mercado et al. (2007), who also used a bank of capillaries to inject the bubbles.

Dynamics and mass transfer of rising bubbles in an homogenous swarm 11
This is an interesting property of this type of experimental setup, which allows to varythe volume fraction while keeping constant the Reynolds number.
Figure 9b shows the Eotvos number: Eo = ∆ρg〈d〉2/σ. As expected from the evolutionof 〈d〉, it regularly increases from 0.5 to 3.2 as α varies from 0 to 30%.Figure 10a presents the mean bubble aspect ratio, 〈χ〉, which is found to slightly de-
crease from 1.7 to 1.4. In the present regime, the bubble deformation is known to be con-trolled by both the Weber number (Moore 1965) and the Morton number (Legendre et al.
2012). Here, since we are considering a single system of fluids with constant physical prop-erties, the Morton number is constant: Mo = gν4Lρ
2
L∆ρ/σ3 = 2.5× 10⁻¹¹. The measuredWeber number, We = ρL〈Vz〉2〈d〉/σ, is plotted in figure 10b. It is found to decreasefrom about 3.25 down to 1.8. Since the Reynolds number is almost constant, the Webernumber turns out to be proportional to 〈Vz〉. The decrease of the average aspect ratio,by approximately 30%, is of the same order as that of We, and both 〈χ〉 and We keepan almost constant value for α > 15%. These results are in good agreement, within 14%,with the relation proposed by Legendre et al. (2012) for a single bubble at low Mortonnumber:
χ =1
1− 9
64We
. (3.6)
3.4. Collective effect on bubble drag coefficient
We consider now the evolution of the bubble drag coefficient Cd with the gas volumefraction in order to analyze the collective effect of the bubbles on their rise velocity. Cd
is determined from the balance between drag and buoyancy forces as
Cd =4
3
∆ρ
ρL
g〈d〉〈Vz〉2
, (3.7)
where g is the acceleration of gravity, the average equivalent diameter 〈d〉 is measuredfrom image processing and the average rise velocity 〈Vz〉 from the dual-tip optical probe.The experimental results are shown in figure 11 (◦, •) as a function of the gas volumefraction. Cd is observed to increase from 0.26 for α =0.45% and 〈d〉 ≈ 2.5 mm to 2.4 atα =34% and 〈d〉 ≈ 5 mm.
In order to disentangle the effect of the bubble size to that of the gas volume fraction, itis interesting to compare the present results with those obtained for single rising bubblesof the same diameter. The drag coefficient Cd0
of a deformed single bubble at terminalvelocity is commonly estimated by (Tomiyama et al. 1998)
Cd0=
8
3
Eo
c1 + c2 Eo, (3.8)
with c1 = 4 and c2 = 1 according to Mendelson (1967), c1 = 4.28 and c2 = 1.02 accordingto Comolet (1979), and c1 = 19/3 and c2 = 2/3 for Re > 600 with air/water systemsaccording to Dijkhuizen et al. (2010).The corresponding values are represented by empty squares and triangles in figure 11.
Starting from similar values at low gas volume fractions, Cd and Cd0quickly diverge as α
increases. In the present experiments, the increase of Cd turns out to mainly results fromhydrodynamic bubble interactions. The collective effect of bubbles is really important andleads to a drag coefficient 2.4 times larger than that of an isolated bubble at α = 34%.
In the literature devoted to bubbly flows, numerous relations have been proposed todescribe the evolution of the drag coefficient with the gas volume fraction. Consideringair bubbles injected through a porous sparger in a column of 9.5-cm diameter filled witha soapy water solution, Wallis (1961) estimated the average bubble rise velocity from the
12 D. Colombet, D. Legendre, F. Risso, A. Cockx and P. Guiraud
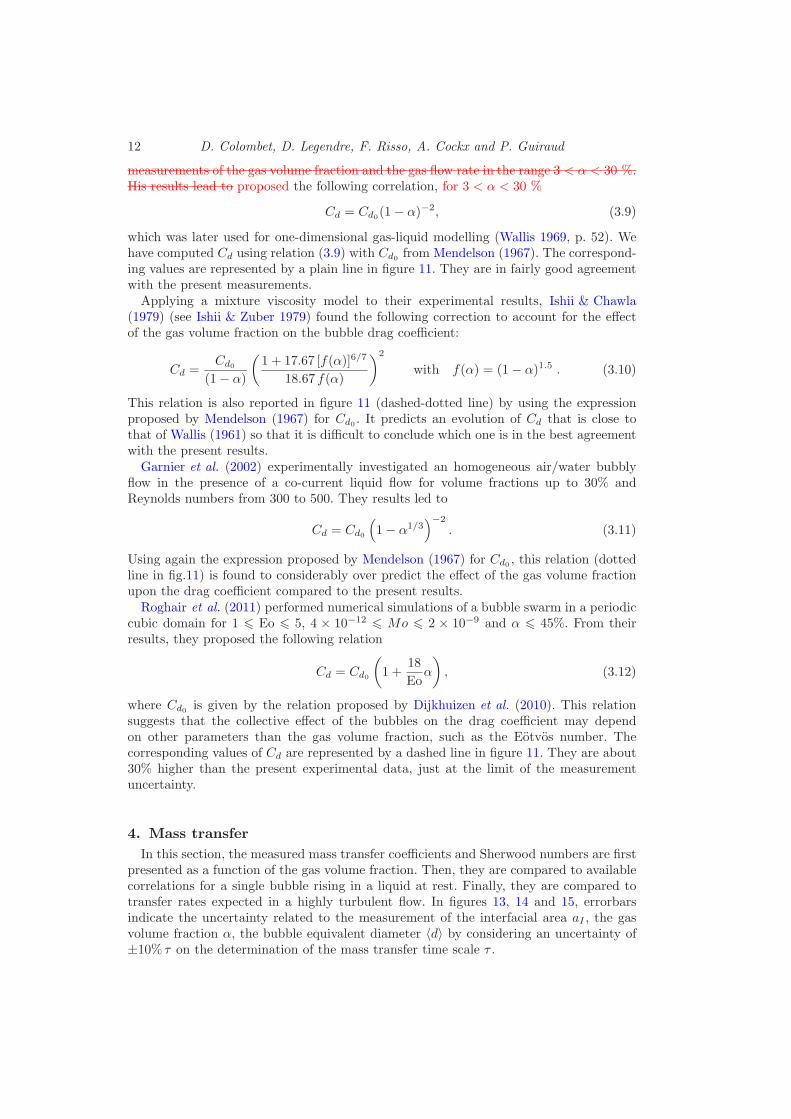
measurements of the gas volume fraction and the gas flow rate in the range 3 < α < 30 %.His results lead to proposed the following correlation, for 3 < α < 30 %
Cd = Cd0(1− α)−2, (3.9)
which was later used for one-dimensional gas-liquid modelling (Wallis 1969, p. 52). Wehave computed Cd using relation (3.9) with Cd0
from Mendelson (1967). The correspond-ing values are represented by a plain line in figure 11. They are in fairly good agreementwith the present measurements.
Applying a mixture viscosity model to their experimental results, Ishii & Chawla(1979) (see Ishii & Zuber 1979) found the following correction to account for the effectof the gas volume fraction on the bubble drag coefficient:
Cd =Cd0
(1− α)
(
1 + 17.67 [f(α)]6/7
18.67 f(α)
)2
with f(α) = (1− α)1.5 . (3.10)
This relation is also reported in figure 11 (dashed-dotted line) by using the expressionproposed by Mendelson (1967) for Cd0
. It predicts an evolution of Cd that is close tothat of Wallis (1961) so that it is difficult to conclude which one is in the best agreementwith the present results.
Garnier et al. (2002) experimentally investigated an homogeneous air/water bubblyflow in the presence of a co-current liquid flow for volume fractions up to 30% andReynolds numbers from 300 to 500. They results led to
Cd = Cd0
(
1− α1/3)−2
. (3.11)
Using again the expression proposed by Mendelson (1967) for Cd0, this relation (dotted
line in fig.11) is found to considerably over predict the effect of the gas volume fractionupon the drag coefficient compared to the present results.
Roghair et al. (2011) performed numerical simulations of a bubble swarm in a periodiccubic domain for 1 6 Eo 6 5, 4 × 10⁻¹² 6 Mo 6 2 × 10⁻⁹ and α 6 45%. From theirresults, they proposed the following relation
Cd = Cd0
(
1 +18
Eoα
)
, (3.12)
where Cd0is given by the relation proposed by Dijkhuizen et al. (2010). This relation
suggests that the collective effect of the bubbles on the drag coefficient may dependon other parameters than the gas volume fraction, such as the Eotvos number. Thecorresponding values of Cd are represented by a dashed line in figure 11. They are about30% higher than the present experimental data, just at the limit of the measurementuncertainty.
4. Mass transfer
In this section, the measured mass transfer coefficients and Sherwood numbers are firstpresented as a function of the gas volume fraction. Then, they are compared to availablecorrelations for a single bubble rising in a liquid at rest. Finally, they are compared totransfer rates expected in a highly turbulent flow. In figures 13, 14 and 15, errorbarsindicate the uncertainty related to the measurement of the interfacial area aI , the gasvolume fraction α, the bubble equivalent diameter 〈d〉 by considering an uncertainty of±10% τ on the determination of the mass transfer time scale τ .
Dynamics and mass transfer of rising bubbles in an homogenous swarm 13
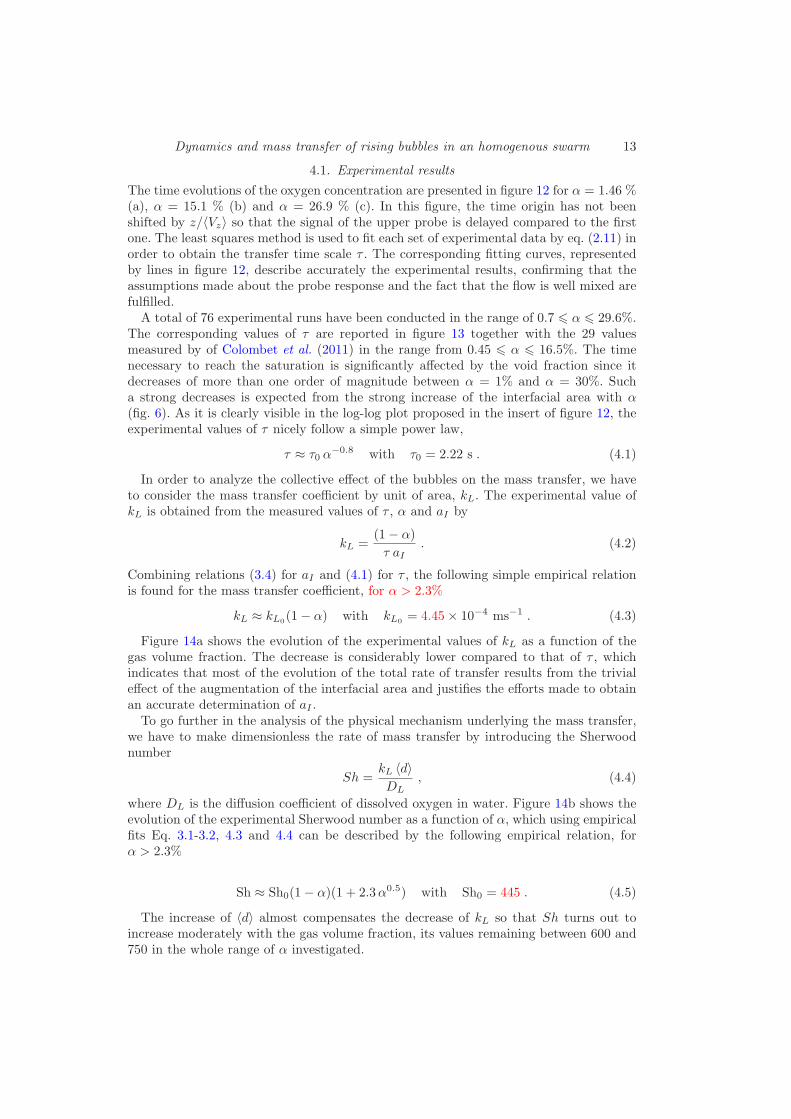
4.1. Experimental results
The time evolutions of the oxygen concentration are presented in figure 12 for α = 1.46 %(a), α = 15.1 % (b) and α = 26.9 % (c). In this figure, the time origin has not beenshifted by z/〈Vz〉 so that the signal of the upper probe is delayed compared to the firstone. The least squares method is used to fit each set of experimental data by eq. (2.11) inorder to obtain the transfer time scale τ . The corresponding fitting curves, representedby lines in figure 12, describe accurately the experimental results, confirming that theassumptions made about the probe response and the fact that the flow is well mixed arefulfilled.
A total of 76 experimental runs have been conducted in the range of 0.7 6 α 6 29.6%.The corresponding values of τ are reported in figure 13 together with the 29 valuesmeasured by of Colombet et al. (2011) in the range from 0.45 6 α 6 16.5%. The timenecessary to reach the saturation is significantly affected by the void fraction since itdecreases of more than one order of magnitude between α = 1% and α = 30%. Sucha strong decreases is expected from the strong increase of the interfacial area with α(fig. 6). As it is clearly visible in the log-log plot proposed in the insert of figure 12, theexperimental values of τ nicely follow a simple power law,
τ ≈ τ0 α−0.8 with τ0 = 2.22 s . (4.1)
In order to analyze the collective effect of the bubbles on the mass transfer, we haveto consider the mass transfer coefficient by unit of area, kL. The experimental value ofkL is obtained from the measured values of τ , α and aI by
kL =(1− α)
τ aI. (4.2)
Combining relations (3.4) for aI and (4.1) for τ , the following simple empirical relationis found for the mass transfer coefficient, for α > 2.3%
kL ≈ kL0(1− α) with kL0
= 4.45× 10⁻⁴ ms−1 . (4.3)
Figure 14a shows the evolution of the experimental values of kL as a function of thegas volume fraction. The decrease is considerably lower compared to that of τ , whichindicates that most of the evolution of the total rate of transfer results from the trivialeffect of the augmentation of the interfacial area and justifies the efforts made to obtainan accurate determination of aI .To go further in the analysis of the physical mechanism underlying the mass transfer,
we have to make dimensionless the rate of mass transfer by introducing the Sherwoodnumber
Sh =kL 〈d〉DL
, (4.4)
where DL is the diffusion coefficient of dissolved oxygen in water. Figure 14b shows theevolution of the experimental Sherwood number as a function of α, which using empiricalfits Eq. 3.1-3.2, 4.3 and 4.4 can be described by the following empirical relation, forα > 2.3%
Sh ≈ Sh0(1− α)(1 + 2.3α0.5) with Sh0 = 445 . (4.5)
The increase of 〈d〉 almost compensates the decrease of kL so that Sh turns out toincrease moderately with the gas volume fraction, its values remaining between 600 and750 in the whole range of α investigated.

14 D. Colombet, D. Legendre, F. Risso, A. Cockx and P. Guiraud
The present results therefore suggest that the collective effect of the bubbles has arelatively weak influence on the interfacial mass transfer considering the huge effectobserved on the transfer time scale τ . However, it is difficult to conclude from the soleevolution of the Sherwood number since variations of bubble size, velocity and shapeare associated to variation of gas volume fractions. In next section, we will compare thepresent results to those corresponding to a single bubble in the same flow regime andwith the same geometrical properties.
4.2. Comparison with a single bubble rising in a liquid at rest
In most studies of mass transfer in bubble columns, the rate of transfer is estimated byusing the Higbie’s penetration theory (Higbie 1935),
kL =2√π
√
DL
tc, (4.6)
where tc is taken equal to 〈d〉 / 〈Vz〉. In fact this is equivalent to the analytical solutionobtained by (Boussinesq 1905) by considering that the flow around the bubble can beapproximated by the potential flow and a very thin concentration layer on the bubble
Sh =2√πPe1/2 , (4.7)
where Pe = 〈d〉 〈Vz〉 /DL is the Peclet number. This solution is thus valid in the limit oflarge Re and Pe.
Various improvements have been proposed to account for the effect of bubble deforma-tion or finite Reynolds number upon the mass transfer from a single bubble. Consideringthe flow approximation of Moore (1963), Winnikow (1967) derived the following expres-sion that includes the effect of the Reynolds number:
Sh =2√π
[
1− 2.89√Re
]1/2
Pe1/2. (4.8)
Measuring the mass transfer of almost spherical millimeter-sized bubbles from volumevariations, Takemura & Yabe (1998) proposed the following relation,
Sh =2√π
[
1− 2
3
1
(1 + 0.09Re2/3)3/4
]1/2
(2.5 + Pe1/2) (4.9)
which was found to be in good agreement with both experiments and numerical simula-tions at moderate Re numbers and large Pe.Recently, considering numerical results from various previous works, Colombet et al.
(2013) proposed the following relation that is valid for a spherical bubble whatever thevalue of Re and Pe,
Sh = 1 +
[
1 +
(
4
3π
)2/3
(2Pemax)2/3
]3/4
, (4.10)
where Pemax is the Peclet number based on the maximal velocity Umax of the liquid atthe interface instead of the bubble velocity Vz, which is obtained from the correlationproposed by Legendre (2007),
Umax
Vz=
1
2
16 + 3.315Re1/2 + 3Re
16 + 3.315Re1/2 +Re. (4.11)
When Pe tends to zero, relation (4.10) tends to the diffusive solution in the absence of

Dynamics and mass transfer of rising bubbles in an homogenous swarm 15
flow (Sh = 2) while it tends towards the Boussinesq solution when Re and Pe becomevery large.
The effect of the bubble deformation has been studied by Lochiel & Calderbank (1964),who considered the potential flow around a spheroidal bubble. They proposed to correctthe Bousinesq expression by the introduction of a function f of the aspect ratio χ,
Sh(χ) =2√πPe1/2f(χ) . (4.12)
The validity of this solution has been recently discussed by Figueroa & Legendre (2010),who proposed the following expression
f(χ) = 0.524 + 0.88χ− 0.49χ2 + 0.086χ3 , (4.13)
which is based on the results of direct numerical simulations, and proved to be valid for500 < (χ/8)1/3Re < 1000, νL/DL > 100 and 1 6 χ 6 3.
The values of kL predicted by all these expressions derived for an isolated bubble arereported in figure 14a while the corresponding values of Sh are reported in figure 14b.Because the Reynolds number remains almost constant and the bubble shape does notevolves so much in the present experiments, the predictions of all these correlations areclose to each others. Moreover, these predictions are all in agreement with the experi-ments, considering the measurement uncertainty.
We can therefore conclude that the mass transfer in an homogeneous bubble swarm athigh Peclet number is almost independent of the gas volume fraction. It has been provedto remain similar to that of a single bubble rising in a fluid at rest up to a volume fractionof 30%. This conclusion is in agreement with the trends of the numerical simulations ofRoghair (2012).
4.3. Comparison with the interfacial transfer in highly turbulent flows
The bubbles generate strong velocity fluctuations in the liquid phase. It is thus inter-esting to compare the rate of transfer measured here to that induced at a plane inter-face by a turbulence of similar intensity. It has been shown that turbulent eddies canenhance the mass transfer by causing the renewal of the liquid close to the interface(Magnaudet & Calmet 2006). Considering that the timescale tc of renewal of the liquid
at the interface is proportional to (νL/〈ǫL〉)1/2, where ǫL is the rate of dissipation of theturbulence, equation (4.6) gives
Sh = c1
(
d 〈ǫL〉1/4
ν3/4L
)
Sc1/2 , (4.14)
where Sc = νL/DL is the Schmidt number. Several values have been proposed for theprefactor c1: 0.4 (Lamont & Scott 1970), 0.523 (Linek et al. 2004) or 2/
√π (Kawase et al.
1987).In an homogeneous bubbly flow, Riboux et al. (2010) showed that the rate of dissipa-
tion of the energy is given by
〈ǫL〉 ≈∆ρ
ρLα 〈Vz〉 g . (4.15)
According to (4.15), 〈ǫL〉 ranges from 0.02 to 0.5 m2s−3 for the range of gas volumefraction considered here. The Sherwood numbers given by relation (4.14) are plotted infigure 15. They are clearly not in agreement with the present measurements. Combining

16 D. Colombet, D. Legendre, F. Risso, A. Cockx and P. Guiraud
eqs. (4.15) and (4.14), it yields
Sh = c1(
Eo3/Mo)1/8
α1/4Re1/4Sc1/2 . (4.16)
The evolution of Sherwood number with the gas volume fraction predicted by this relation(α1/4) is not compatible with the experimental result. Moreover, the predicted evolution
with the Reynolds number (Re1/4) is contradictory to the scaling of expected considering
the evolution for an isolated bubble (Re1/2).
This analysis confirms that the mass transfer in the bubble column is controlled by themass transfer around a single bubble in fluid at rest. The fact that the liquid agitation mayplay a negligible role in the mass transfer at a bubble interface has already been noticed byAlves et al. (2006), who investigated the case of a single bubble in a turbulent flow witha dissipation rate of one order of magnitude smaller than in the present configuration.
5. Discussion
Hydrodynamic interactions between bubbles have a strong effect on the average bubblerise velocity, which is found to decreases strongly when increasing the gas volume fraction.The analysis of the interactions between two rising bubbles in a liquid at rest reveals op-posite effects depending on the relative position of the bubbles. For two bubbles rising inline, the drag force on the trailing bubble is diminished (Yuan & Prosperetti 1994; Harper1997; Ruzicka 2000; Hallez & Legendre 2011), so that vertical interactions between bub-bles should increase the average bubbles velocity in a bubble swarm. On the other hand,the drag coefficient of two bubbles rising side by side is increased (Legendre et al. 2003;Hallez & Legendre 2011), so that transversal interactions between bubbles should de-crease the average bubble velocity. In a two-dimensional high-Reynolds-number swarmof bubbles confined between two vertical plates (Bouche et al. 2012), vertical interactionsare predominant and both the average and the variance of the vertical bubble velocityis observed to increase with the gas volume fraction. The main difference between thisconfiguration and the present one is that turbulence cannot develop because of the wallfriction. In a three-dimensional unconfined bubble swarm, hydrodynamic interactions be-tween bubble wakes cause a strong attenuation of individual wakes (Risso et al. 2008).The combination of the wake attenuation with the existence of an intense agitation ofboth the bubbles and the liquid phase reduces considerably the vertical entrainment bybubbles and explains why the hindering effect is predominant when the gas volume frac-tion increases. More surprising is the weak influence of hydrodynamic interactions on thevariance of the vertical bubble agitation, which is observed to remain close to that of anisolated bubble. Even if bubble path oscillations become erratic, the fluctuant energy oftheir motion seems still controlled by wake instabilities.
The major finding of the present work is the absence of any significant collectiveeffect of the bubbles on the mass transfer up to volume fraction of 30%. This resultis not valid for any dispersed two-phase flow. Collective effect on the mass transferare known to exist for a long time (Ranz & Marshall 1952). In the 60’s and the 70’s,many experimental works on mass (or heat) transfer in fixed or fluidized bed measuredan increase of the Sherwood (or Nusselt) number with the particle volume fraction αS
(Ranz & Marshall 1952; Rowe & Claxton 1965; Littman & Silva 1970; Turner & Otten1973; Gunn & Souza 1974; Miyauchi et al. 1976; Gunn 1978). More recently, numericalsimulations have confirmed this trend: Massol (2004) for 0 6 Re 6 300, 0.72 6 ν/D 6 2,and αS 6 60%, and Deen et al. (2012) for 36 6 Re 6 144, ν/D = 0.8 and αS = 30%,

Dynamics and mass transfer of rising bubbles in an homogenous swarm 17
who found results in agreement with Gunn (1978). The point is therefore to understandthe absence of collective effect in homogenous bubbly flows.
First, let us discuss the mechanism of mass transfer for a single rising bubble. Forlarge Reynolds and Peclet numbers, Figueroa & Legendre (2010) showed that the masstransfer mainly takes place across a thin diffusive layer located at the front part of thebubble, where the flow is potential. The thickness δD of the concentration boundary layercan be estimated from (Boussinesq 1905)
δDd
≈√π
2Pe−1/2 . (5.1)
In the present experiments, the Peclet number is around 3.5×10⁵ and δD is of the order of10−3 d (≈ 5µm). In order that the solution for a single bubble can apply, two conditionsmust be fulfilled. First, the average flow in the close surrounding of each bubble haveto be similar to that of a isolated bubble. Second, liquid velocity fluctuations must notpenetrate within the concentration boundary layer. Experimental investigations of theflow around a bubble immersed within an homogeneous bubble swarm (Risso & Ellingsen2002; Roig & Larue de Tounemine 2007; Risso et al. 2008) have shown that the first con-dition is satisfied; in particular, at high bubble Reynolds number, the flow in front ofthe bubble is well described by the potential solution for a single bubble. The secondcondition requires that both the distance δx between the interfaces of neighbour bubblesand the size of the smallest turbulent eddies ηK are large compare to the thickness δDof the concentration boundary layer.
If bubbles were arranged on a periodic face-centred cubic network, the minimum dis-tance between two bubble interfaces is given by
δxd
=
(
1√2
(
2π
3α
)1/3
− 1
)
, (5.2)
which gives δx ≈ 0.35 d ≈ 1.6 mm for α = 30%.As suggested by Riboux et al. (2010), the Kolmogorov microscale of the bubble-induced
turbulence, which corresponds to the size of the smallest turbulent eddies, can be roughlyestimated by
ηK =
(
ν3L〈ǫL〉
)1/4
, (5.3)
where the average dissipation rate 〈ǫL〉 is determined from (4.15) and gives ηK ≈ 10−2 d ≈50µm for α = 30%. Both δx and ηK are therefore much larger than δD and the secondcondition is satisfied.
With a Peclet number of 1070, the results of Roghair (2012) did not show any collectiveeffect. However, in the cases considered by Massol (2004) (Pe = 600) and Deen et al.
(2012) (Pe = 115), the mass transfer was observed to depend on the volume fraction ofthe dispersed phase. This confirms that a large enough Peclet number is necessary sothat the mass transfer is not influenced by hydrodynamic interactions.
6. Concluding remarks
Thanks to an original method of imaging using a telecentric lens and a dual opticalprobe, the properties of the gas phase have been measured in an homogenous swarm ofbubble up to a volume fraction of 30%. In particular, the bubble deformation is found ingood agreement with the correlation proposed by Legendre et al. (2012) for a single bub-

18 D. Colombet, D. Legendre, F. Risso, A. Cockx and P. Guiraud
ble. Also, the average bubble velocity is observed to strongly decreases with α and foundin agreement with the correlations of Wallis (1961) and Ishii & Chawla (1979). Even ifsome open questions remain concerning the physical mechanism responsible for the in-crease of the drag coefficient, available correlations are reliable to predict the deformationand the average bubble rise velocity in an homogenous bubble swarm at large Reynoldsnumber. The bubble fluctuating velocity has also been characterized. Surprisingly, nosignificant influence of the gas volume fraction on the variance measured by means ofthe dual optical probe was observed. Hydrodynamic interactions between bubbles makethe bubble path oscillations to become irregular, but they do not seem to modify theoverall amount of fluctuating energy, which remains controlled by the instability of thewake behind each bubble.
The total mass transfer of oxygen from the bubbles to the liquid has been measuredby means of the gassing-out method. Thanks to the determination of the total interfacialarea by imaging, the mass transfer rate by unit of area and the Sherwood number havebeen obtained. Remarkably, the Sherwood number is found very close to that of a singlebubble rising at same velocity. The reason lies in the fact that the mass flux occurs ina very thin layer located in front of the bubble. Owing to the large value of the Pecletnumber (> 105), the distance between the interfaces of the bubbles and the smallestturbulent eddies are much larger than the thickness of the concentration boundary layer.Consequently, the flow within this layer is not affected by the presence of the otherbubbles. Moreover, the mixing generated by the bubble-induced agitation of the liquidensures that the dissolved oxygen is homogeneous everywhere out of this layer. For themass transfer the conditions are therefore equivalent to those of a single bubble risingin a fluid at rest and at uniform concentration. Correlations for the Sherwood numberestablished for single rising bubbles are therefore relevant to predict the mass transferin an homogenous bubble column up to a volume fraction of 30%, provided the bubbleReynolds and Peclet numbers are large enough. This conclusion is consistent with theresults obtained experimentally for a similar system by Colombet et al. (2011) for gasvolume fractions lower than 17% and with the numerical simulations of Roghair (2012)for a Peclet number around one thousand. Results obtained at lower Peclet number influidized beds however showed an increase of the Sherwood number compared to thatof a single particle. There is probably a lower limit below which mass transfer in adispersed two-phase flow depends on the volume fraction. The determination of thislimit, which probably depends on parameters such as the nature of the dispersed phaseor the Reynolds number, requires further investigations.
The authors would like to thank Rhodia, member of the SOLVAYGroup, for supportingthis work and especially Dr. C. Daniel and Dr. S. Galinat. We also thank Sebastien Cazinfor its invaluable help on image processing and Gregory Ehses for his help in adapting theexperimental set-up for this study. This research was carried out within the frameworkof a CIFREANRT contract in collaboration with the FERMaT federation.

Dynamics and mass transfer of rising bubbles in an homogenous swarm 19
REFERENCES
Aguilar Corona, A. 2008 Agitation des particules dans un lit fluidise liquide : Etudeexperimentale. PhD thesis, Toulouse University, France.
Aguilar Corona, A., Zenit, R. & Masbernat, O. 2011 Collisions in a liquid fluidized bed.Int. J. Multiphase Flow 37 (7), 695–705.
Alves, S., Vasconcelos, J. & Orvalho, S. P. 2006 Mass transfer to clean bubbles at lowturbulent energy dissipation. Chem. Eng. Sci. 61, 1334 – 1337.
Ayed, H., Chahed, J. & Roig, V. 2007 Hydrodynamics and mass transfer in a turbulentbuoyant bubbly shear layer. AIChE J. 53, 2742–2753.
Beyer, W. H. 1987 Standard Mathematical Tables, 28th edn. Boca Raton, CRC Press.
Bouche, E., Roig, V., Risso, F. & Billet, A. M. 2012 Homogeneous swarm of high-reynolds-number bubbles rising within a thin gap. part 1: Bubble dynamics. J. Fluid Mech. 794,211–231.
Boussinesq, J. 1905 Calcul du pouvoir refroidissant des courants fluides. J. Math. Pures Appl.6, 285–332.
Bridge, A., Lapidus, L. & Elgin, J. 1964 The mechanics of vertical gas-liquid fluidized systemi : countercurrent flow. AIChE J. 10 (6), 819–826.
Buffo, A., Vanni, M. & Marchisio, D. L. 2012 Multidimensional population balance modelfor the simulation of turbulent gas-liquid systems in stirred tank reactors. Chem. Eng. Sci.70, 31–44.
Bunner, B. & Tryggvason, G. 2002a Dynamics of homogeneous bubbly flows, part 1. risevelocity and microstructure of the bubbles. J. Fluid Mech. 466, 17–52.
Bunner, B. & Tryggvason, G. 2002b Dynamics of homogeneous bubbly flows, part 2. velocityfluctuations. J. Fluid Mech. 466, 53–84.
Bunner, B. & Tryggvason, G. 2003 Effect of bubble deformation on the properties of bubblyflows. J. Fluid Mech. 495, 77–118.
Clift, R., Grace, J. R. & Weber, M. E. 1978 Bubles, drops and particules. San Diego,Academic Press.
Cockx, A., Do-Quang, Z., Line, A. & Roustan, M. 1999 Use of computational fluid dynam-ics for simulating hydrodynamics and mass transfer in industrial ozonation towers. Chem.Eng. Sci. 54, 5085–5090.
Colombet, D. 2012 Modelisation de reacteurs gaz-liquide de type colonne a bulles en conditionsindustrielles. PhD thesis, Toulouse University.
Colombet, D., Legendre, D., Cockx, A. & Guiraud, P. 2013 Mass or heat transfer insidea spherical gas bubble at low to moderate reynolds number. Int. J. Heat Mass Transfer67, 1096–1105.
Colombet, D., Legendre, D., Cockx, A., Guiraud, P., Risso, F., Daniel, C. & Galinat,S. 2011 Experimental study of mass transfer in a dense bubble swarm. Chem. Eng. Sci.66, 3432–3440.
Comolet, R. 1979 Sur le mouvement d’une bulle de gaz dans un liquide. Houille Blanche 1,31–42.
Darmana, D., Deen, N. G. & Kuipers, J. A. M. 2005 Detailed modeling of hydrodynamics,mass transfer and chemical reactions in a bubble column using a discrete bubble model.Chem. Eng. Sci. 60, 3383 – 3404.
Deen, N. G., Kriebitzsch, S. H. L., van der Hoef, M. A. & Kuipers, J. A. M. 2012 Directnumerical simulation of flow and heat transfer in dense fluid-particle systems. Chem. Eng.Sci. 81, 329–344.
Dijkhuizen, W., Roghair, I., Van Sint Annaland, M. & Kuipers, J. A. M. 2010 Dns ofgas bubbles behaviour using an improved 3d front tracking model-drag force on isolatedbubbles and comparison with experiments. Chem. Eng. Sci. 65 (4), 1415–1426.
Duhar, G. & Colin, C. 2006 Dynamics of bubble growth and detachment in a viscous shearflow. Phys. Fluids 18 (077101).
Ellingsen, K. & Risso, F. 2001 On the rise of an ellipsoidal bubble in water: oscillatory pathsand liquid-induced velocity. J. Fluid Mech. 440, 235–268.
Fayolle, Y., Cockx, A., Gillot, S., Roustan, M. & Heduit, A. 2007 Oxygen transferprediction in aeration tanks using cfd. Chem. Eng. Sci. 62, 7163–7171.

20 D. Colombet, D. Legendre, F. Risso, A. Cockx and P. Guiraud
Figueroa, B. & Legendre, D. 2010 Mass or heat transfer from spheroidal gas bubbles risingthrough a stationary liquid. Chem. Eng. Sci. 65, 6296 – 6309.
Gaddis, E. S. & Vogelpohl, A. 1986 Bubble formation in quiescent liquids under constantflow conditions. Chem. Eng. Sci. 41, 97–105.
Garnier, C., Lance, M. & Marie, J. L. 2002 Measurement of local flow characteristics inbuoyancy-driven bubbly flow at high void fraction. Exp. Therm. Fluid Sci. 26, 811–815.
Gunn, D. J. 1978 Transfer of heat or mass to particles in fixed and fluidized beds. Int. J. HeatMass Transfer 21, 467.
Gunn, D. J. & Souza, J. F. C. 1974 Heat transfer and axial dispersion in packed beds. Chem.Eng. Sci. 29, 1363.
Hallez, Y. & Legendre, D. 2011 Interaction between two spherical bubbles rising in a viscousliquid. J. Fluid Mech. 673, 406–431.
Harper, J. F. 1997 Bubbles rising in line: why is the first approximation so bad? J. Fluid Mech.351, 289–300.
Higbie, R. 1935 The rate of absorption of a pure gas into a still liquid during short periods ofexposure. Trans. Am. Inst. Chem. Eng. 31, 365 – 389.
Ishii, M. & Chawla, T. C. 1979 Local drag laws in dispersed two-phase flow. Technical Report,Argonne National Lab., IL (USA) .
Ishii, M. & Zuber, N. 1979 Drag coefficient and relative velocity in bubbly, droplet or partic-ulate flow. AIChE J. 25-5, 843–855.
Kawase, Y., Halard, B. & Moo-Young, M. 1987 Theoretical prediction of volumetric masstransfert coefficients in bubble columns for newtonian and non-newtonian fluids. Chem.Eng. Sci. 42, 1609–1617.
Kiambi, S. L., Duquenne, A. M., Bascoul, A. & Delmas, H. 2001 Measurements of localinterfacial area : application of bi-optical fibre technique. Chem. Eng. Sci. 56, 6447–6453.
Kishore, N., Chhabra, R. P. & Eswaran, V. 2008 Bubble swarms in power-law liquids atmoderate reynolds numbers: Drag and mass transfer. Chem. Eng. Res. Des. 86 (1), 39–53.
Koynov, A. & Khinast, J. G. 2005 Mass transfer and chemical reactions in bubble swarmswith dynamic interfaces. AIChE J. 51 (10), 2786–2800.
Lamont, J. C. & Scott, D. S. 1970 An eddy cell model of mass transfer into the surface of aturbulent liquid. AIChE J. 16, 513–519.
Legendre, D. 2007 On the relation between the drag and the vorticity produced on a cleanbubble. Phys. Fluids 19, 018102.
Legendre, D., Magnaudet, J. & Mougin, G. 2003 Hydrodynamic interactions between twospherical bubbles rising side by side in a viscous liquid. J. Fluid Mech. 497, 133–166.
Legendre, D., Zenit, R. & Velez-Cordero, J. R. 2012 On the deformation of gas bubblesin liquids. Phys. Fluids 24, 043303.
Letzel, H. M., Schouten, J. C., Krishna, R. & van den Bleek C. M. 1999 Gas holdupand mass transfer in bubble column reactors operated at elevated pressure. Chem. Eng.Sci. 54, 2237–2246.
Linek, V., Kordac, M., Fujasova, M. & Moucha, T. 2004 Gas liquid mass transfer coeffi-cient in stirred tanks interpreted through models of idealized eddy structure of turbulencein the bubble vicinity. Chem. Eng. Process. 43, 1511–1517.
Littman, H. & Silva, D. E. 1970 Gas-particle heat-transfer coefficients in packed beds at lowreynolds numbers. Fourth International Heat Transfer Conference, Paris-Versailles, France.
Lochiel, A. C. & Calderbank, P. H. 1964 Mass transfer in the continuous phase aroundaxisymmetric bodies of revolution. Chem. Eng. Sci. 19, 471–484.
Magnaudet, J. & Calmet, I. 2006 Turbulent mass transfer through a flat shear-free surface.J. Fluid Mech. 553, 115–185.
Manasseh, R., Riboux, G. & Risso, F. 2008 Sound generation on bubble coalescence followingdetachment. Int. J. Multiphase Flow 34, 938 – 949.
Martin, M., Montes, F. J. & Galan, M. A. 2007 Bubble coalescence at sieve plates: Ii. effectof coalescence on mass transfer. superficial area versus bubble oscillations. Chem. Eng. Sci.62, 1741–1752.
Martınez-Mercado, J., Palacios-Morales, C. A. & Zenit, R. 2007 Measurement of pseu-doturbulence intensity in monodispersed bubbly liquids for 10¡re¡500. Phys. Fluids 19,103302.1–103302.13.

Dynamics and mass transfer of rising bubbles in an homogenous swarm 21
Massol, A. 2004 Simulations numeriques d’ecoulements au travers des reseaux fixes de spheresmonodisperses et bidisperses, pour des nombres de reynolds moderes. PhD thesis, INPToulouse, France.
Mendelson, H. D. 1967 The prediction of bubble terminal velocities from wave theory. AIChEJ. I3, 250–253.
Mersmann, A. 1977 Auselegung und massstrabsvergrosserung von blasen und tropfensaulen.Chemie Ingenieur Technik 49, 679–691.
Michaelides, E. E. 2006 Particles, bubbles and drops: their motion, heat and mass transfer .Miyauchi, T., Kataoka, H. & Kikuchi, T. 1976 Gas film coefficient of mass transfer in low
peclet number region for sphere packed beds. Chem. Eng. Sci. 31, 9.Moore, D. W. 1963 The boundary layer on a spherical gas bubble. J. Fluid Mech. 16, 161–176.Moore, D. W. 1965 The velocity rise of distorted gas bubbles in a liquid of small viscosity. J.
Fluid Mech. 23, 749–766.Nedeltchev, S., Jordan, U. & Schumpe, A. 2006 Correction of the penetration theory
applied to the prediction of kla in a bubble column with organic liquids. Chem. Eng.Technol. 29, 1113–1117.
Nedeltchev, S., Jordan, U. & Schumpe, A. 2007 Correction of the penetration theory basedon mass-transfer data from bubble columns operated in the homogeneous regime under highpressure. Chem. Eng. Sci. 62, 6263 – 6273.
Petitti, M., Vanni, M., Marchisio, D. L., Buffo, A. & Podenzani, F. 2013 Simulationof coalescence, break-up and mass transfer in a gas-liquid stirred tank with cqmom. Chem.Eng. J. 228, 1182–1194.
Ranz, W. E. & Marshall, W. R. 1952 Evaporation from drops. Chem. Eng. Prog. 48 (4),173.
Riboux, G. 2007 Hydrodynamique d’un essaim de bulles en ascension. PhD thesis, INPToulouse, France.
Riboux, G., Risso, F. & Legendre, D. 2010 Experimental characterization of the agitationgenerated by bubbles rising at high reynolds number. J. Fluid Mech. 643, 509–539.
Risso, F. & Ellingsen, K. 2002 Velocity fluctuations in a homogeneous dilute dispersion ofhigh-reynolds-number rising bubbles. J. Fluid Mech. 453, 395–410.
Risso, F., Roig, V., Amoura, Z., Riboux, G. & Billet, A. M. 2008 Wake attenuation inlarge reynolds number dispersed two-phase flows. Phil. Trans. R. Soc. A 366, 2177–2190.
Roghair, I. 2012 Direct numerical simulations of hydrodynamics and mass transfer in densebubbly flows. PhD thesis, Eindhoven University of Technology.
Roghair, I., Lau, Y. M., Deen, N. G., Slagter, H. M., Baltussen, M. W., Van Sint An-naland, M. & Kuipers, J. A. M. 2011 On the drag force of bubbles in bubble swarmsat intermediate and high reynolds numbers. Chem. Eng. Sci. 66 (14), 3204–3211.
Roig, V. & Larue de Tounemine, A. 2007 Measurement of interstitial velocity of homoge-neous bubbly flows at low to moderate void fraction. J. Fluid Mech. 572, 87–110.
Rowe, P. N. & Claxton, K. T. 1965 Heat and mass transfer from a single sphere to fluidflowing through an array. T. I. Chem. Eng.-Lond. 43, 321–331.
Rusche, H. & Issa, R. I. 2000 The effect of voidage on the drag force on particules, dropletsand bubbles in dispersed two-phase flow. Tech. Rep.. BRITE-EURAM III program.
Ruzicka, M. C. 2000 On bubbles rising in line. Int. J. Multiphase Flow 26, 1141–1181.Shimada, N., Tomiyama, A. & Ozaki, T. 2007 Numerical prediction of bubbly flow in a
bubble column with chemisorption. ICMF, Leipzig, Germany .Takemura, F. & Yabe, A. 1998 Gas dissolution process of spherical rising bubbles. Chem.
Eng. Sci. 53, 2691–2699.Tomiyama, A., Kataoka, I., Zun, I. & Sakaguchi, T. 1998 Drag coefficients of single bubbles
under normal and micro gravity conditions. JSME Int J., Ser. B 41 (2), 472–479.Turner, G. A. & Otten, L. 1973 Values of thermal (and other) parameters in packed beds.
Ind. Eng. Chem. Proc. D. D. 12 (4), 417–424.Vejrazka, J., Sechet, P., Vecer, M., Orvalho, S., Ruzicka, M. & Cartellier, A. 2010
Measurement accuracy of a mono-fiber optical probe in a bubbly flow. Int. J. MultiphaseFlow 36 (7), 533–548.
Wallis, G. B. 1961 Some hydrodynamic aspects of two-phase flow and boiling. Int. Heat Trans-fer Conference, Boulder, Colorado USA 2, 319–325.

22 D. Colombet, D. Legendre, F. Risso, A. Cockx and P. Guiraud
Wallis, G. B. 1969 One dimensional two-phase flow . Mcgraw Hill.Wijngaarden, L. van & Kapteijn, C. 1990 Concentration waves in dilute bubble/liquid
mixtures. J. Fluid Mech. 212, 111–137.Winnikow, S. 1967 Letters to the editor. Chem. Eng. Sci. 22, 22–477.Yuan, H. & Prosperetti, A. 1994 On the in-line motion of two spherical bubbles in a viscous
fluid. J. Fluid Mech. 278, 325–349.Zenit, R., Koch, D. L. & Sangani, A. S. 2001 Measurements of the average properties of a
suspension of bubbles rising in a vertical channel. J. Fluid Mech. 429, 307–342.

Dynamics and mass transfer of rising bubbles in an homogenous swarm 23
ρL 998.2 kgm−3
µL 1.0038 10−3 Pa sρG 1.2 kgm−3
µG 18 10−6 Pa sσ 73 10−3 N m−1
DL 2.1 10−9 m2 s−1
He 4.05 109 PaP sat 2337 PaMH2O 18.015 10−3 kgmol−1
MO232 10−3 kgmol−1
xG0
O220.9% –
Table 1. System properties at T = 20 ◦C and P = 101 325 Pa.
α H lower probe upper probe(%) (cm) (cm) (cm)
α < 11 76 14.0 69.511 6 α < 21 64.2 14.0 55.021 6 α < 31 35.2 5.8 34.831 6 α < 32 29.5 – –
α > 32 19.4 – –
Table 2. Liquid height H at α = 0 and elevation of the oxygen probes above capillaries tips.

24 D. Colombet, D. Legendre, F. Risso, A. Cockx and P. Guiraud
����
��������
����
����
���
���
���
���
���
���
��������
��������
i
(a)
[1] Injectors
[1] [2]
[3] [4]
[5]
[6]
[7]
15 cm
x
yz
Air
N2
100 cm
(b)
x
94 mm
150 mm
yz
Halogenlighting
high speedcamera
telecentric lens
Figure 1. (a) Experimental installation and (b) imaging set-up.

Dynamics and mass transfer of rising bubbles in an homogenous swarm 25
(a) 10 mm
(a)
(b) 10 mm
(b)
(c) 10 mm
(c)
(d) 10 mm
(d)
Figure 2. (Colour online) Typical images of the bubble swarm with detected bubble contourmarked by a red line:(a) α = 12.2%, (b) α = 23.9%, (c) α = 30.6%, (d) α = 33.9%.

26 D. Colombet, D. Legendre, F. Risso, A. Cockx and P. Guiraud
56 58 60 62 64 660
0.05
0.1
0.15
0.2
0.25
0.3
0.35
U[V
]
t [ms]
∆tyi
∆t12i
Figure 3. Signals from the optical probes. Symbols: raw signal from first (+) and second (×)probe. Line: binarized signals ( ).
Dynamics and mass transfer of rising bubbles in an homogenous swarm 27
0 0.01 0.02 0.03 0.04 0.05 0.060
0.01
0.02
0.03
0.04
0.05
0.06
JG=
α×
〈Vz〉[
ms−
1]
JG = QG/S [m s−1]
Figure 4. Superficial gas velocity from gas volume fraction and bubble average rising velocitymeasured by the dual-tip optical probe JG = α × 〈Vz〉 versus superficial gas velocity frommeasured gas flow rate JG = QG/S.

28 D. Colombet, D. Legendre, F. Risso, A. Cockx and P. Guiraud
0 5 10 15 20 25 30 352
3
4
5
6
7
〈d〉[mm]
α [%]
10−2
10−1
10−1
100
Figure 5. Average bubble equivalent diameter as a function of the gas volume fraction. • imageprocessing with a telecentric lens; ◦ image processing with a fixed focal lens by Colombet et al.(2011); × dual-tip optical probe measurements from average bubble chords (Eq. 2.5); − −equation 3.1; — equation 3.2; −.− dynamic bubble formation model of Gaddis & Vogelpohl(1986). Insert: log-log representation of (〈d〉 − d0)/d0 versus α.

Dynamics and mass transfer of rising bubbles in an homogenous swarm 29
100
101
10−2
10−1
α [%]
aI/aI0
Figure 6. Interfacial area (Eq. 2.7) versus gas volume fraction: • this work; ◦ fromColombet et al. (2011); −− equation 3.3; — equation 3.4.

30 D. Colombet, D. Legendre, F. Risso, A. Cockx and P. Guiraud
0 5 10 15 20 25 30 350
0.05
0.1
0.15
0.2
0.25
0.3
0.35
α [%]
〈Vz〉[
ms−
1]
Figure 7. Average bubble velocity against the gas volume fraction. Dual-tip optical probemeasurements from this work (•), Colombet et al. (2011) (◦), Riboux et al. (2010) (∗). ParticuleTracking Velocimetry by image processing from Colombet et al. (2011) (�). — equation (3.5).

Dynamics and mass transfer of rising bubbles in an homogenous swarm 31
0 5 10 15 20 25 30 350
0.005
0.01
0.015
α [%]
〈v′ z2〉,
〈v′ x2〉[
m2s−
2]
Figure 8. Variances of bubble velocity against gas volume fraction. Variance obtained from thedual optical probe in this work (◦) and by Riboux et al. (2010) (∗). Variances of the verticalvelocity (�) and the horizontal velocity (�) measured in this work from particle trackingon images taken with a fixed focal lens.

32 D. Colombet, D. Legendre, F. Risso, A. Cockx and P. Guiraud
0 5 10 15 20 25 30 350
200
400
600
800
1000
α [%]
Re
(a)
0 5 10 15 20 25 30 350
0.5
1
1.5
2
2.5
3
3.5
α [%]
Eo
(b)
Figure 9. (a) Bubble Reynolds number (Re = 〈Vz〉〈d〉/νL) and (b) Eotvos number(Eo = ∆ρ g 〈d〉2/σ) versus gas volume fraction: ◦ method using a fixed focal lens; • methodusing a telecentric lens; N result for a single bubble from Riboux et al. (2010); — Reynoldsnumber determined form fitted data (eqs. 3.1, 3.2 and 3.5); −− Eotvos number determinedform fitted data (eqs. 3.1 and 3.2).

Dynamics and mass transfer of rising bubbles in an homogenous swarm 33
0 5 10 15 20 25 30 350
0.5
1
1.5
2
α [%]
〈χ〉
(a)
0 5 10 15 20 25 30 350
0.5
1
1.5
2
2.5
3
3.5
4
α [%]
We
(b)
Figure 10. (a) Bubble average aspect ratio and (b) Weber number (We = ρL〈Vz〉2〈d〉/σ)versus gas volume fraction: ◦ method using a fixed focal lens; • method using a telecentric lens;N result for a single bubble from Riboux et al. (2010); — aspect ratio estimated from Eq. 3.6(Legendre et al. 2012); −− Weber number determined form fitted data (eqs. 3.1, 3.2 and 3.5).

34 D. Colombet, D. Legendre, F. Risso, A. Cockx and P. Guiraud
0 5 10 15 20 25 30 350
0.5
1
1.5
2
2.5
3
α [%]
Cd
Figure 11. Experimental drag coefficient (Eq. 3.7) against gas volume fraction: • method usinga fixed focal lens; • method using a telecentric lens. Drag coefficient for a single bubble of sameequivalent diameter rising at its terminal velocity (Eq. 3.8): � Mendelson (1967); ▽ Comolet(1979); △ Dijkhuizen et al. (2010). Drag coefficient accounting for the collective effectof the bubbles: — Wallis (1961) (Eq. 3.9); −.− Ishii & Chawla (1979) (Eq. 3.10); ...Garnier et al. (2002) (Eq. 3.11); −− Roghair et al. (2011) (Eq. 3.12).

Dynamics and mass transfer of rising bubbles in an homogenous swarm 35
0 100 200 300 400
0
0.2
0.4
0.6
0.8
1
Cp/C
∗
t [s]
(a)
0 10 20 30 40 50 60 70
0
0.2
0.4
0.6
0.8
1
Cp/C
∗
t [s]
(b)
0 10 20 30 40 50
0
0.2
0.4
0.6
0.8
1
Cp/C
∗
t [s]
(c)
Figure 12. Typical measured time evolutions of the concentration of dissolved oxygen. (a)α = 1.46%, (b) α = 15.1% and (c) α = 26.9%: • lower probe and ◦ upper probe. −− and —equation (2.11) (Color online).

36 D. Colombet, D. Legendre, F. Risso, A. Cockx and P. Guiraud
0 5 10 15 20 25 300
20
40
60
80
100
120
τ[s]
α [%]
100
101
101
102
Figure 13. Time scale of the mass transfer versus the gas volume fraction: � lower probe and△ upper probe; ◦ Colombet et al. (2011) (using a single oxygen probe); — experimentalfit (eq. 4.1). Insert: log-log representation.

Dynamics and mass transfer of rising bubbles in an homogenous swarm 37
0 5 10 15 20 25 300
1
2
3
4
5
6
7x 10
−4
kL[m
s−1]
α [%]
(a)
0 5 10 15 20 25 300
200
400
600
800
1000
Sh
α [%]
(b)
Figure 14. Mass transfer coefficient (a) and Sherwood number (b) versus gas volume fraction.Experiments: � this work (average values) and ◦ Colombet et al. (2011), empirical fits (eq.4.3 and 4.5). Predictions for an isolated bubble: N single bubble (eqs. 4.12-4.13 with theparameters measured for an isolated bubble detached from a single capillary); –.– eq.(4.7) (Boussinesq 1905); ... eq. (4.8) (Winnikow 1967); −− eq. (4.9) (Takemura & Yabe1998); — eq. (4.10) (Colombet et al. 2013); eqs. (4.12-4.13) (Figueroa & Legendre2010).

38 D. Colombet, D. Legendre, F. Risso, A. Cockx and P. Guiraud
0 5 10 15 20 25 300
500
1000
1500
Sh
α [%]
Figure 15. Comparison of the measured Sherwood number with mass transfer models forturbulent flows. Present experiments: same legend than in Fig. 14; Eqs. (4.14) and (4.15)with — c1 = 2/
√π (Kawase et al. 1987), −− c1 = 0.523 (Linek et al. 2004), −.− c1 = 0.4
(Lamont & Scott 1970).


![FlowFixer:Using BFECC for Fluid Simulationjarek/papers/FlowFixer.pdfin graphics applications by [HK03], where the authors sim-ulated air bubbles rising and merging and by [TFK∗03,](https://img.dokumen.tips/doc/110x75/60b2b11ee5af9563be569623/flowfixerusing-bfecc-for-fluid-jarekpapersflowfixerpdf-in-graphics-applications.jpg)