Embed Size (px)
Citation preview

B.V.R. TataLight Scattering Studies Section
Condensed Matter Physics Division
Indira Gandhi Centre for Atomic Research,
Kalpakkam – 603 102
Dynamics and Disorder in Colloidal Crystals of
Osmotically Compressed vs
Uncompressed Thermo-responsive Microgel
Particles
Optics-11: 23-25/5/2011
Collaborators:
Ms. J. Brijitta, RA
Mr. R.G. Joshi, Scientific Officer
Mr. Deepak Kumar Gupta, Scientific Officer

Nanoparticle
dispersions
Polymer
hydrogel
Photonic
Crystals
Portable photonic
crystals
Research Theme
Synthesis & Characterization
Structure, Dynamics and Phase transitions
in colloids, gels and composites
(colloids as super atoms, mimic atomic systems)
Photonic crystals through colloidal route
Rheology

Menu
Introduction: Nanoparticle dispersions
Effect of Temperature
•Crystal to Liquid Transition
•Dynamics across melting
[Violation of Dynamical criterion]
SLS/ DLS
Effect of Osmotic Pressure
Tunability of Bragg Diffraction
[ Particle size and SPD reduces]
Second type Disorder
Stacking Disorder
UV visible & Confocal

Hard Sphere Charged Stimuli-responsive
> 0. 5PMMA
SPD 11%
~ 0. 005PS or Si, CPD < 26%
PNIPAM > 0. 74
Nanoparticle Dispersions
Can not vary Size and SPD
Temperature is not a convenient parameter
Fluid-solid Transition
Gas-liquid
Gas-Solid,
Liquid to Solid,
BCC to FCC
Size and SPD
are tunable by
varying T, P

Effect of Size (Charge) Polydispersity
CPD: 26% = ESPD: 17%
“Ordering Phase Transitions in Charged Colloids”(VCH Publishers. NY. 1996)
Eds. Arora & Tata.
Tata & AroraJ. Phys: Condens. Matter, 3, 7983 (1991)
J. Phys. Condens . Matter, 4, 7699, (1991)
J. Phys. Condens. Matter, 7, 3817 (1995)
Spin-glass like?
Size Polydispersity in
PNIPAM nano/microgel
system is tunable by T, P ?

Synthesis of PNIPAM nanogel particles
Reagents: N-isopropylacrylamide (NIPAM) 139mMMethylene bisacrylamide (BIS) 1.96mMSodium dodecylsulphate (SDS) 1.05mMPotassium persulphate (KPS) 2.22mM
Synthesis at 70C
520 nm273 nm
20 25 30 35 40 45 50 55 60100
120
140
160
180
200
220
240
260
280
300
Dia
mete
r (n
m)
T oC
T Decreasing
T Increasing
VPT occur at T ~ 34 C
Brijitta, Tata & Kaliyappan, J. Nanosci. Nanotechnol. 9, 5323 (2009)
Mean Dia
(dh nm)
25oC
SPD (%) Effective
Charge
density
(C/cm2)
238 5.5 0.39
273 4 0.25
353 6 0.22
520 5 0.19
Purification:Dialysis
Concentrate
Ion-exchange
(Mixed bed)
Dilute(non-interacting samples)

7.1 x 1013 cm-3
Crystalline
1.06 x 1014 cm-3
Glass-like
4.36 x 1012 cm-3
Liquid-like
Phase Behavior of 273nm PNIPAM Nanogel dispersions
Brijitta, Tata & Kaliyappan, J. Nanosci. Nanotechnol. 9, 5323 (2009)
I s(q
)
1.0 1.5 2.0 2.5 3.0-1
0
1
2
3
4
5
6
7
q(105cm
-1)
I(q)(
10
3 a
rb.u
nit
s)
1 2 30
20
40
60
I s(q
) (a
rb
. u
nit
s)
q (105 cm-1)
Fluid – Fluid Transition
at 31.5oC
Melting (Crystal to
Liquid) at 26oC
Fluid – Fluid Transition
at 30.5oC

3
111p
2
q
33
4n
Melting transition: 26.2 oC
= 0.76 (at 25 oC)
= 0.71 (at melting)
p
3
h n6
πd
Meting of PNIPAM Nanogel Crystals
23 24 2550
100
150
200
250
300
I ma
x(q
) (a
rb.
un
its
)
T( oC)
C
L
22 24 26 28100
200
300
400
1000
2000
3000
L
C
I ma
x(a
rb.
un
its)
T( oC)
238 nm273 nm
Melting transition: 24 .2oC
= 0.47 (at 25 oC)
= 0.48 (at melting)
Compressed Uncompressed

Dynamics Across Melting

Dynamical Criterion for freezing of colloidal liquids
DL/ Ds ~ 0.1
DL: Long-time Self Diffusion coeff.
Ds= Short time Self Diffusion coeff.
D0= Free Diffusion coeff.
DsD0 ( at low )

24 26 280.00
0.02
0.04
0.06
0.08
0.10
0.02
DL/D
S
T (0C)
L
C
23 24 25 260.00
0.02
0.04
0.06
0.08
0.10
0.07
DL /
DS
T(oC)
L
C
273 nm, = 0.76 238 nm, = 0.47
DL/Ds = 0.02 < 0.1 DL/Ds = 0.07 < 0.1

15 30 45 60 750.00
0.04
0.08
0.12
DL/D
S
t (min)
L
C
0.09
Shear melted Colloidal crystal of charged polystyrene spheres
= 0.003, d =0.100 nm
Methodology is RIGHT
NO experimental Artifacts

Why DL/Ds is low ?
Interpenetration of polymer chains of PNIPAM at
the surface: DL to be low
Self-Healing Colloidal Crystals
Ashlee St. John Iyer and L. Andrew Lyon,
Angew, Chem. Int. Ed., 48, 4562 (2009)

Tunabilty of Bragg wavelength
by Osmotic pressure
Uncompressed state: B n p
Compressed state: B n p & d

Lietor-Santos et al,
Macromolecules, 42, 6225, (2009)
Hydrostatic
pressure
Effect of Pressure
The dopant particle (d ~ 1850 nm) is experiencing
compression because of the osmotic pressure of the highly
concentrated microgel environment ( d ~ 715nm)
Self-Healing Colloidal Crystals
Ashlee St. John Iyer and L. Andrew Lyon, Angew, Chem. Int. Ed., 48, 4562 (2009)
•External osmotic pressure Pext ~104 Pa.
•Elastic modulus of swollen microgels ~ 102–104 Pa
•Osmotically induced deswelling is expected

Effect of osmotic pressure
Schematics of stirred cell ultrafiltration setup
P ~ kPa
S3 S4S1
P1P2
P3 P4
S2
N N N N
Arg
on
Ga
s
Stirred Cell
Suspension
Membrane

nsindseff 2
UV-Visible spectra of PNIPAM microgel crystals with increase in P
700 800 9000.0
0.1
0.2
0.3
0.4
Ex
tin
cti
on
(%
)
(nm)
0.58
0.63
0.65
0.73
0.77
0.81
0.89
1.01
P
32
22
3
2
33
4
nn
p
eff
Bnn
B
eff
p
dn
d
n
Equation of state
(HS Colloidal crystals)
cz
bza
z1
3TknP Bp
For fcc structure
a = 0.62, b = 0.71, c = 0.59 26z
2 3 40.9
1.0
1.1
1.2
0.50
0.75
1.00
1.25d
nn/d
h
dn
n/d
h
np ( 10
13cm
-3)
(dnn
)
(dh)

Blue shift of B
Osmotic compression leads to deswelling of particles for 0.74
P = 0.74 (constant)
dnn
P(Pa)0.58 1.3
0.63 2.0
0.65 2.7
0.73 25.4
0.74 2702.9
0.74 2862.2
0.74 3127.8
0.74 3528.37
dnn/dh > 1
dnn/dh < 1
np
np
d = dh
d < dh

Disorder in PNIPAM Microgel Crystals:
CLSM Study
Type of disorder
( arising due to T, SPD, and stacking)

Types of Crystal Imperfections (Disorder)
Finite Size effects
Abrupt loss of positional
order at the boundary
Peak width is
independent of
diffraction wavevector
First type
Thermal motion of
particles
Preserves long-range
Correlations in particle
positions
Reduces intensities of
the higher-order peaks in
the diffraction pattern via
the Debye-Waller factor
No change in peak width
Second type
Strain –induced
lattice deformations
Positional correlation
length reduces
Peak width increases
with increase in length
of the diffraction wave
vector
Dullens & Petukhov, EPL, 77, 58003 (2007)
0
4
8
0.0 0.5 1.0 1.5 2.00
4
8
g(r
)
Experimental, c dnn= 0.372 m
r (m)
Ideal hexagonal Lattice
0
2
4
6
0.0 0.5 1.0 1.5 2.00
2
4
6
g(r
)
r (m)
Experimental , ddnn= 0.292 m
Ideal hexagonal Lattice
For S1, dnn=372 nm Observation
For S2, dnn=292 nm dnn < d
Particles shrunk from 501 nm to 372 nm and 292 nm respectively upon
osmotic compression
Ordering Reduction in SPD
Sample S1 ( np = 2.75×1013cm-3, = 1.81 )
Sample S2 ( np = 4.75×1013cm-3, = 3.13 )
dh=501 nm SPD = 37%
N = Total number of particlesrn = position vector of particles
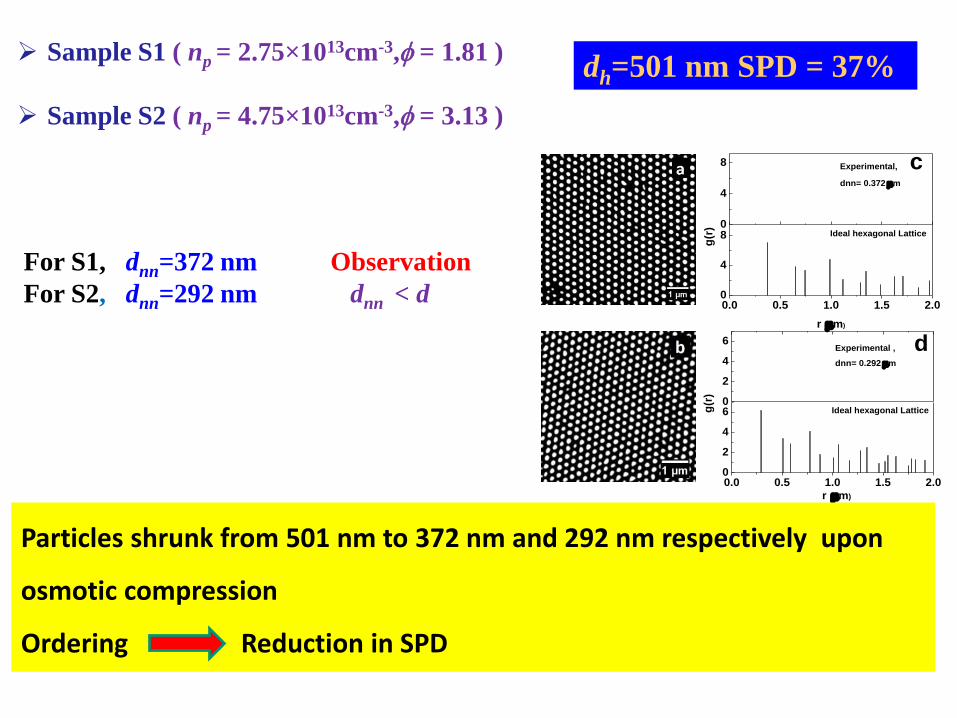
Characterize type of disorder : By determining structure factor S(q):
2
1
).exp(1
)(
N
n
nrqiN
qS
0 1 2 3 4 5 6 70.1
1
10
100
S(q
)
q/q10
Sample S2, (d)
0 1 2 3 4 5 6 70.1
1
10
100
S(q
)
q/q10
Sample S1, (c)
Calculated radial profiles of S(q) in [10] direction: By averaging S(q) over
short arcs with an opening angle of 2Oand radius q.
Width of peaks (FWHM) analyzed as a funct. of diffraction order
Higher order diffraction peaks are more broadened and lesser in
intensity

1 2 3 4 5 60.0
0.1
0.2
0.3
0.4, S1
, S2
Ideal hexagonal lattice
Re
lati
ve
Pe
ak
wid
th
q
/q1
0
Area
un
der t
he P
ea
ks
Diffraction Order, q/q10
0
3
6
9
12
15
Peak width increases
monotonically with increase in
diffraction order:
Increase is more for S1 (SPD ~
11%) than S2( SPD ~7).
For ideal HCP lattice
(simulated): Peak width
independent of diffraction order
Presence of second type
disorder in S1, S2 and
arises due to SPD
Area under diffraction peaks decrease as a function of
diffraction order indicating the presence of first type disorder

CLSM Results on large size particles:DLS on Dilute sample at 23oC dh= 834nm, SPD =17%
0.2 0.4 0.6 0.8 1.0 1.2
0.00
0.25
0.50
0.75
1.00
SPD=5%
Uncompressed
Compressed
P(d
)
d (m)
825nm
488nm
SPD=13%
T= 23oC
CLSM measurements provide clear evidence: Osmotic compression of
PNIPAM particles to a volume fraction ≥ 0.74 not only influences particle
size but also SPD

20 22 24 26 28 30 32 34 36 38 40
600
700
800
900
1000
1100
1200
T (oC)
Dia
mete
r (n
m)
0.0
0.2
0.4
0.6
0.8
1.0
SP
D
SPD also decreases with increase in T
Why the distribution changes upon variation of P or T ?
DLS measurements
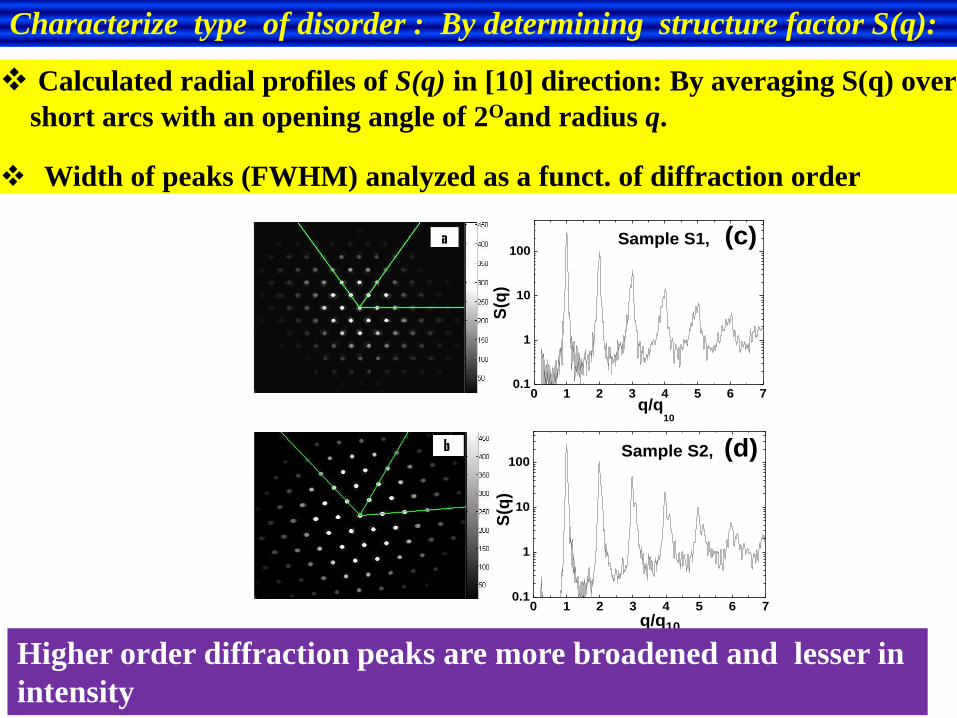
Shear melt
Cover glass
Suspension25 mm
8 mm
I. As-prepared
CLSM study• RHCP
II . Re- crystallizedHeat up to 40C
(Isotropic liquid)
Slow cooling
(0.15C/min)
• FCC
Diameter d = 520nm, volume fraction =0.44

stacking prob. = 0.42 0.15 (RHCP) ; 0.95 0.17 (FCC)

Lattice constants a = 620 nm ~1.2d
c =1012nm ~1.95d
c/a=1.63
Volume fraction =0.43, np =5.841012 cm-3
Origin of split-second peak :
Second neighbours or from B-planes
More than 50 % B-planes moved (shear) in y-direction by 0.68d
r/d=1.54
r/d=1.68y
x
A
B
A
0 1 2 3 40.0
0.8
1.6
2.4
3.2
r/d
0.0
0.8
1.6
2.4
3.2
g(r
)
1.4 1.6 1.80.4
0.8
1.2
r/d
g(r
)
Ex
pt.
hcp

The sudden withdrawal of shear on the shear melted liquid
leads to solidification into RHCP structure in the case of the as-
prepared sample
B-plan shift: Arise due to local shear stress locked up during
the freezing of the shear melted liquid.
Slow cooling rate of 0.15oC/min might be responsible for the
occurrence of fcc structure in the recrystallized sample.
Why RHCP & FCC?
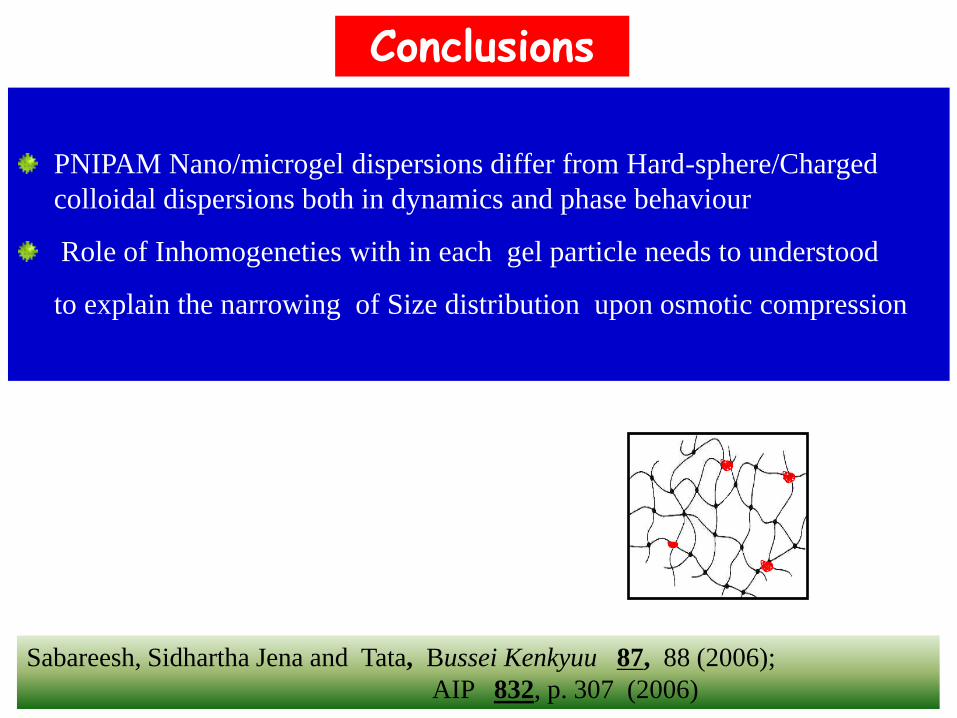
Conclusions
PNIPAM Nano/microgel dispersions differ from Hard-sphere/Charged
colloidal dispersions both in dynamics and phase behaviour
Role of Inhomogeneties with in each gel particle needs to understood
to explain the narrowing of Size distribution upon osmotic compression
Sabareesh, Sidhartha Jena and Tata, Bussei Kenkyuu 87, 88 (2006);
AIP 832, p. 307 (2006)


![Formulation, Evaluation and Optimization of Osmotically ... · colon delivery capsule, CODESTM, osmotically controlled drug delivery system, pulsincap system, time clock system etc.[9]](https://img.dokumen.tips/doc/110x75/60124578e7baad691103f81b/formulation-evaluation-and-optimization-of-osmotically-colon-delivery-capsule.jpg)