Embed Size (px)
Citation preview

Boreal environment research 20: 305–323 © 2015issn 1239-6095 (print) issn 1797-2469 (online) helsinki 26 June 2015
Editor in charge of this article: Jukka Pumpanen
Dynamics and composition of litterfall in an unmanaged norway spruce (Picea abies) forest after bark-beetle outbreak
Jiří Kopáček1)2)*, Pavel Cudlín3), Hana Fluksová2), Jiří Kaňa1), Tomáš Picek2), Hana Šantrůčková2), miroslav svoboda4) and Daniel Vaněk2)
1) Biology Centre AS CR, Institute of Hydrobiology, Na Sádkách 7, CZ-37005 České Budějovice, Czech Republic (*corresponding author’s e-mail: [email protected])
2) Faculty of Science, University of South Bohemia, Branišovská 31, CZ-37005 České Budějovice, Czech Republic
3) Institute of Systems Biology and Ecology, AS CR, Na Sádkách 7, CZ-37005 České Budějovice, Czech Republic
4) Faculty of Forestry and Wood Sciences, Czech University of Life Sciences, Kamýcká 129, CZ-16521 Prague, Czech Republic
Received 15 Sep. 2014, final version received 28 Jan. 2015, accepted 30 Jan. 2015
Kopáček J., Cudlín P., Fluksová H., Kaňa J., Picek T., Šantrůčková H., Svoboda M. & Vaněk D. 2015: Dynamics and composition of litterfall in an unmanaged norway spruce (Picea abies) forest after bark-beetle outbreak. Boreal Env. Res. 20: 305–323.
We investigated litterfall chemistry and fluxes, and cellulose decomposition in litter floor in mature, unmanaged Norway spruce stands in the catchments of Plešné and Čertovo lakes (Czech Republic) during 2003–2013. The Plešné forest was infested by the bark beetle (Ips typographus) in 2004, and 88%–99% of trees had died by 2011. Total litterfall and its composition were similar in both catchments in 2003. The litterfall increased from 5.4 to 42 t ha–1 yr–1 after the infestation and remained relatively high (5.0 t ha–1 yr–1) until the end of the study even though > 52% of trees were already broken. The chemical composition of most spruce litter categories changed after infestation, with the most pronounced trends in C (decrease) and Ca (increase) concentrations. Moreover, Mg, K, and P concentrations increased in the total Plešné litter due to an increasing proportion of rowan litter. Cellulose decomposition increased in the litter floor after infestation.
Introduction
Factors associated with climate change including increasing temperature, drought, and windthrow frequency have increased the susceptibility of forests to insect attacks, and already contrib-ute to large-scale tree mortalities in numerous regions in Europe, North America, and Asia (Huber et al. 2004a, Tokuchi et al. 2004, Raffa et al. 2008, Mikkelson et al. 2013a, 2013b).
Microclimate, hydrology, and biogeochemical cycles of many elements are significantly altered in the insect-infested and damaged forests. The amounts of bioavailable fresh organic matter (litter, dead roots and aboveground tree parts) abruptly increase on the forest floor and in upper soil horizons. Moreover, reduced canopy shad-ing and lower transpiration result in elevated soil temperature and moisture (Hais and Kučera 2008, Mikkelson et al. 2013a). These changes,

306 Kopáček et al. • Boreal enV. reS. Vol. 20
following forest dieback after insect attacks, pro-mote a series of sequential and parallel changes in soil microbial processes similar to other types of forest disturbances (e.g., windthrows and clearcuts). In addition to elevated mineralization and nitrification in soils (e.g., Huber et al. 2004a, 2004b), the reduction or cessation of supplies of energy-rich plant assimilates from dead trees to mycorrhizal fungal symbionts reduces the bio-mass of mycorrhizal fungi and causes changes in soil microbial communities (Högberg et al. 2007), and alters carbon (C) and nitrogen (N) cycling in soils (Kopáček et al. 2013a). These changes govern or affect the pre-disturbance cycles of other elements, resulting in the fol-lowing changes in soil and water composition compared to undisturbed ecosystems: (1) The elevated availability of inorganic N in soils is manifested by increased NH4
+ and NO3– con-
centrations in soil solutions and increased NO3–
leaching (Huber et al. 2004a, 2004b, Tahovská et al. 2010). (2) The elevated concentrations of NO3
– in soil solutions mobilize H+, base cations [potassium (K), magnesium (Mg), and calcium (Ca)] liberated from decaying tissue, and alu-minium (Al) liberated from the soil sorption complex (Berdén et al. 1997, Swank et al. 2001, Finér et al. 2003, Houlton et al. 2003, Burns and Murdoch 2005, McHale et al. 2007, Kaňa et al. 2013). (3) Decomposition of the fresh litter and fine roots in soils, the lack of nutrient uptake by dead trees, and altered microbial function-ing contribute to elevated leaching of inorganic and organic phosphorus (P) forms and dissolved organic C and N (Adamson and Hornung 1990, Ahtiainen and Huttunen 1999, Piirainen et al. 2002, 2004, Mikkelson et al. 2013a, 2013b). (4) Continuous liberation of base cations from dead biomass left in unmanaged stands contributes to an increase in soil base saturation (Kaňa et al. 2013) and mitigates pH declines in surface waters after the forest dieback (Kopáček et al. 2013b).
Studies on ecosystem changes associated with forest dieback caused by insect attacks usually begin after a bark-beetle outbreak, and data on the dynamics of forest decay prior to and during bark-beetle infestations are still lack-ing. Such a dynamic may represent an important ecosystem factor, controlling nutrient inputs to
the forest floor and, consequently, the rapid-ity and duration of biogeochemical changes in soils and the chemistry of receiving waters. As part of long-term ecological research of boreal forest catchment-lake ecosystems of Plešné and Čertovo lakes in the Bohemian Forest (south-western Czech Republic), forest status (Svoboda et al. 2006a, 2006b, 2006c), litterfall fluxes and chemistry (Kopáček et al. 2010), and cellulose decomposition (H. Šantrůčková unpubl. data) have been studied since the early 2000s. Even though the stands differ in bedrock, soil base saturation, and N saturation, chemical composi-tion of their litter and foliage differ significantly only in Ca and N concentrations (Kopáček et al. 2010). Catchment of Plešné Lake has been affected by bark-beetle infestation and forest die-back since 2004. The relatively small between catchment differences in litter chemistry and pre-disturbance records in the affected catch-ment provided us a unique opportunity to com-pare changes in litterfall dynamics and chemical composition in disturbed vs. undisturbed stands in the same area. The aim of our study was to evaluate (i) litterfall dynamic and chemistry prior to, during, and after bark-beetle infestation and forest dieback and (ii) the effect of forest disturbance on decomposition rate of cellulose in the litter floor.
Material and methods
Study site description
The Bohemian Forest catchments of Plešné (PL) and Čertovo (CT) lakes are situated at elevations between 1030 and 1378 m a.s.l., and are north-east- and east-oriented, respectively (Fig. 1). Bedrock is formed by granite (relatively rich in P and Ca) and mica-schist in the PL and CT catchments, respectively. Soils in both catch-ments are mostly leptosol, podsol and dystric cambisol, and are shallower (33 vs. 65 cm), but with higher base saturation (15% vs. 9%), in the PL than CT catchment (Kopáček et al. 2002a, 2002b). According to the updated climate classification (Peel et al. 2007), the study area belongs to the Dfc category, i.e. cold climate, with monthly average air temperature exceeding

Boreal enV. reS. Vol. 20 • Dynamics and composition of litterfall after bark-beetle outbreak 307
10 °C only in three summer months (Turek et al. 2014). Present annual average air temperatures and precipitation at the elevation of ~1100 m are ~4.7 °C and ~1200 mm, respectively (Kopáček et al. 2011, Turek et al. 2014). At the beginning of the study, both catchments were covered with mature (mostly > 150 years old) forests, domi-nated by Norway spruce (Picea abies), with a minor contribution of European beech (Fagus sylvatica), silver fir (Abies alba), birch (Betula pubescens and B. pendula), and rowan (Sorbus aucuparia). For more details on understory veg-etation, soil and precipitation see Svoboda et al. (2006a) and Kopáček et al. (2010, 2011). Recent studies show that severe natural disturbances were a common part of natural dynamics of Norway spruce stands in the Bohemian Forests during the last three centuries (Svoboda et al. 2012, Čada et al. 2013).
This study was conducted at four research plots in the PL catchment and two plots in the CT catchment (Table 1). One PL plot (PL-LS) was located at low (L) elevation (1122 m), and two others (PL-HS and PL-HN) at high (H) eleva-tions (1313 and 1334 m); abbreviations S (south) and N (north) denote the plot position in the PL catchment (Fig. 1). Plots CT-L and CT-H were located at low (1057 m) and high (1330 m) eleva-
tions, respectively, in the CT catchment (Fig. 1). All these plots have been in existence since June 2003. After the forest dieback in the PL catch-ment (see below) in June 2008, we established an additional plot, PL-LN, in the only part of the PL catchment that was not seriously affected by bark-beetle infestation at a similar elevation as the affected PL-LS plot (Table 1). All plots were located in flat areas in mature Norway spruce forests, with a small proportion of beech at CT-L and an increasing proportion of rowan at PL-HN (since 2010). The forest at the additional PL-LN plot was formed by a mixture of mature and young trees with a dominance of Norway spruce and a small proportion of rowan and birch. During the study, the annual average air temperature and throughfall precipitation at the individual plots ranged from 3.8–5.5 °C and 1188–1595 mm, respectively (Table 1), and snow cover usually lasted 5–6 months during November–April.
The areal densities of healthy, dead (bark-bee-tle attacked), and broken trees were calculated at each plot using colour aerial photographs (scales 1:5000–7000), prepared by Argus Geo System Ltd. (Hradec Králové, Czech Republic) and Georeal (Plzeň, Czech Republic) in 2000, 2003, 2005, 2007–2011, and 2013. Calculations were done for 1 ha circular areas (except for PL-LN;
Czech Republic
AustriaGermany 49°N
15°E
CT
PL
0 100 200
km
N
0 250 500 m 125
Čertovo Lake
1300
1250
1200
11501100
1050
13001250
1200
1150
1100
1050
CT-H
CT-L
1343
PL-HN
PL-LS
1100
1150
1200
1250
1300
1350
1350
13001250
12001150
1100
Plešné
Lake
1378
PL-LN
PL-HS
Fig. 1. location of Plešné (Pl) and Čertovo (CT) lakes in the czech repub-lic and locations of sam-pling sites in their catch-ments. For site abbrevia-tions see Table 1.

308 Kopáček et al. • Boreal enV. reS. Vol. 20
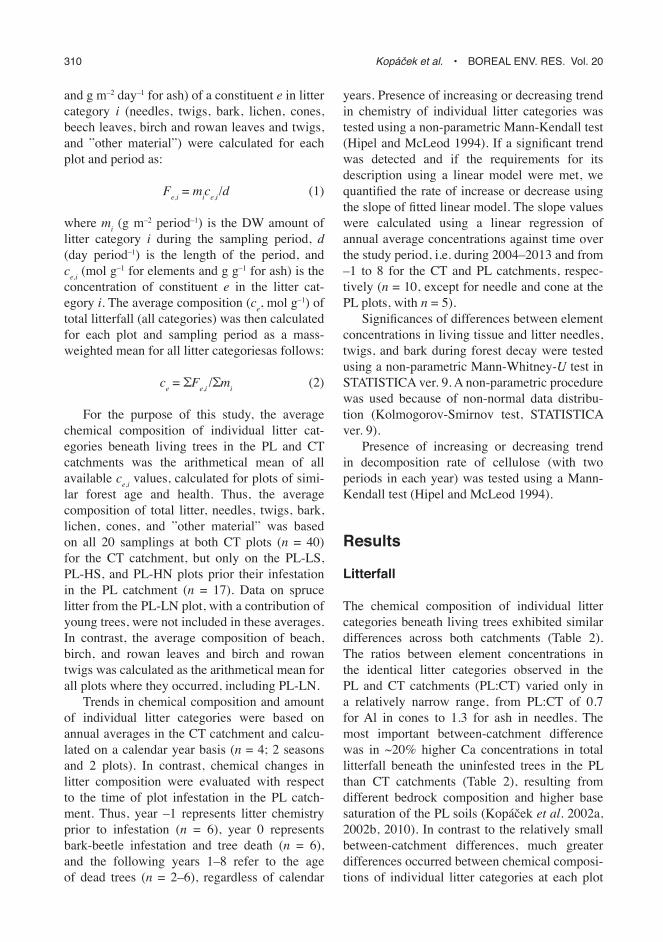
only 0.13 ha due to only a small area of surviving forest), with centres in the middle of the plots. The data were verified by a field survey in the CT catchment (M. Svoboda unpubl. data). At the individual PL and CT plots, the number of living Norway spruce trees in 2003 varied between 374 and 776 ha–1 (Table 1). Trees at all plots were partly damaged by a windstorm (broken canopies, branches, a high amount of twigs in litterfall) in the winters of 2005, 2007, and 2008 (Kopáček et al. 2010). The plots PL-HN, PL-LS, and PL-HS were affected by the bark beetle (Ips typographus) in 2004, 2006, and 2008, respec-tively, and 88%–99% of Norway spruce trees were already dead at these plots in 2011 (Fig. 2). The dead trees were continuously broken by winds, and 97%, 75% and 52% of the trees present when the study had begun were already broken in 2013 at the PL-LS, PL-HN, and PL-HS plots, respectively. The CT-L and CT-H plots
were less affected than the PL plots, with ~6% and 23% of vigorous trees broken by windstorms between 2003 and 2013 (Table 1), but with a neg-ligible contribution of bark-beetle outbreak. No tree located above the samplers died at the CT-L, CT-H, and PL-LN plots during the study.
Litter sampling and analyses
Litter was sampled using 5 square frame traps [80 ¥ 80 cm, height of 15 cm, bottom made of plastic net (mesh size < 0.2 mm)] situated at each plot beneath five representative trees (typical age, height, diameter, and crown status at the plot and surrounding area) from June 2003 to May 2013. Litter was collected three times per year, in spring after snowmelt at the upper plots (mostly at the end of May), in August, and between late October and early November. Litter from each
Table 1. locations of plots with litter traps in the catchments of Plešné (Pl) and Čertovo (CT) lakes in the Bohe-mian Forest. abbreviations: l, low elevation; H, high elevation; S, south; n, north; nD, not determined.
Pl-ls Pl-ln Pl-hs Pl-hn ct-l ct-h
latitude (°n, WGS-84) 48.7752 48.7776 48.7700 48.7767 49.1627 49.1696longitude (°e, WGS-84) 13.8680 13.8642 13.8630 13.8547 13.1993 13.1858elevation (m a.s.l.) 1122 1115 1313 1334 1057 1330living trees in 2003 (number per ha) 646 479 408 776 472 374Dead trees in 2003/2013 (%) 2/99 0/17 4/88 5/95 3/10 7/30operated from (month/year) vi/2003 v/2008 vi/2003 vi/2003 vi/2003 vi/2003annual precipitation1 (mm) 1188 nD nD 1383 1242 1595air temperature1 (°C) 5.5 nD nD 4.1 5.3 3.8
1) annual averages of precipitation amount (throughfall) and air temperature (based on hourly records) during June 2003 to June 2013 (turek et al. 2014).
PL-LS PL-LN PL-HS PL-HN
0
20
40
60
80
100
2000 2002 2004 2006 2008 2010 2012 2014
Dea
d tre
es (%
)
Year
0
20
40
60
80
100
2000 2002 2004 2006 2008 2010 2012 2014
Bro
ken
trees
(%)
Year
Fig. 2. Time series of the proportions of dead and broken trees at the plots in the Plešné (Pl) catchment. For site abbreviations see Table 1.

Boreal enV. reS. Vol. 20 • Dynamics and composition of litterfall after bark-beetle outbreak 309
trap was collected individually and separated into the following six categories: needles, twigs, bark, lichen, cones, and “other material”, i.e., remain-ing material, consisting mostly of poorly identi-fiable fragments. Beech leaves formed another category at CT-L, the only study plot where beech trees occurred. Another four categories, birch and rowan leaves and twigs were collected at PL-LN during 2008–2013. Rowan leaves and twigs were also collected at the PL-HN plot since rowan began to occur at this plot in 2010. Each fraction was dried at 50 °C for 12 hours. Samples from the August and autumn samplings were combined to obtain one sample representing the summer–autumn period.
For chemical analyses, the dry samples of each category from all five traps were combined into one integrated sample for each plot, homog-enised, and 2–5 g subsamples were finely ground for chemical analyses. Dry weight (DW) and ash content were obtained by drying at 105 °C for 2 hours and combustion at 550 °C for 2 hours in an oven, respectively. Total P was determined by HNO3 and HClO4 digestion according to Kopáček et al. (2001). Total carbon (C) and N were determined by a CN analyzer (NC 2100, ThermoQuest, Italy) according to Nelson and Sommers (1996). Total concentration of metals (Ca, Mg, Na, K, Al, Fe, and Mn) was deter-mined by flame atomic absorption spectrometry after mineralization (HNO3, H2SO4, and HF; at 200 °C for 2 hours) in the accredited laboratory of the Czech Geological Survey, Prague. The original method (Emteryd 1989) was modified as follows: 1.0 g of sample was used instead of 0.4 g and HClO4 was replaced by H2SO4. The reliability of the analytical results was controlled by means of a standard sample (finely ground spruce needles) that was assayed with each series of samples. The average (± SD) element concen-trations in this control sample (number of analy-ses, n = 22) were (µmol g–1): 43 560 (± 712) for C, 921 (± 36) for N, 26 (± 0.9) for P, 97 (± 7.3) for Ca, 18 (± 1.2) for Mg, 1.4 (± 0.6) for Na, 32 (± 1.8) for K, 4.4 (± 0.3) for Al, 1.3 (± 0.2) for Fe, and 4.8 (± 0.2) for Mn. No element in the control sample exhibited a significant concentra-tion trend during the study.
All analyses were performed with samples dried at 50 °C, but chemical results further
reported in this study were recalculated per the DW. The annual average composition of samples is based on samples collected during summer (June–October) and winter (November–May), i.e. between the consecutive spring samplings.
The chemical composition of foliage (sam-pled in 2001; Kopáček et al. 2010) and fine branches (diameter < 5 mm) and bark (sampled in 2003; Svoboda et al. 2006b), representing the situation prior to bark-beetle infestation, was determined by the same methods and laborato-ries as litter. Data on element pools in the PL and CT litter horizons are from Kopáček et al. (2002a, 2002b) and were also determined by identical methods.
Decomposition of cellulose
Cumulative decomposition activity of the forest floor was measured according to Kurka (2001) at plots PL-LS, PL-HN, CT-L, and CT-H from June 2003 to May 2013. Cellulose strips (filter paper, 16 ¥ 9 cm, weight of ~1.0 g, 10 replicates at each plot) were inserted into the litter horizon (3–5 cm below its surface) in string bags (poly-ethylene, mesh opening of 1.5 mm) and exposed for periods lasting 1–3 months in summer and ~6 months in winter. After the exposure, bags were removed and replaced by new ones in the same places. In the laboratory, the remaining cellulose was air dried and, after removal of soil particles, roots and debris, loss on ignition was determined by combustion at 550 °C for 4 hours. The differ-ences between the losses on ignition of the origi-nal cellulose strips (average for 5 replicates) and the remaining cellulose in the individual bags after the field exposure were used to determine the cumulative cellulose decomposition. In this study, we used average values calculated for all 10 replicates at each plot during sampling peri-ods identical to those of the litter sampling, i.e. November–May for winter and June–October for summer. Results are expressed in mol of min-eralized C (0.037 mol g–1 cellulose) m–2 day–1.
Data evaluation and statistics
Average fluxes (Fe,i; mol m–2 day–1 for elements
310 Kopáček et al. • Boreal enV. reS. Vol. 20
and g m–2 day–1 for ash) of a constituent e in litter category i (needles, twigs, bark, lichen, cones, beech leaves, birch and rowan leaves and twigs, and ”other material”) were calculated for each plot and period as:
Fe,i = mice,i /d (1)
where mi (g m–2 period–1) is the DW amount of litter category i during the sampling period, d (day period–1) is the length of the period, and ce,i (mol g–1 for elements and g g–1 for ash) is the concentration of constituent e in the litter cat-egory i. The average composition (ce, mol g–1) of total litterfall (all categories) was then calculated for each plot and sampling period as a mass-weighted mean for all litter categoriesas follows:
ce = ΣFe,i /Σmi (2)
For the purpose of this study, the average chemical composition of individual litter cat-egories beneath living trees in the PL and CT catchments was the arithmetical mean of all available ce,i values, calculated for plots of simi-lar forest age and health. Thus, the average composition of total litter, needles, twigs, bark, lichen, cones, and ”other material” was based on all 20 samplings at both CT plots (n = 40) for the CT catchment, but only on the PL-LS, PL-HS, and PL-HN plots prior their infestation in the PL catchment (n = 17). Data on spruce litter from the PL-LN plot, with a contribution of young trees, were not included in these averages. In contrast, the average composition of beach, birch, and rowan leaves and birch and rowan twigs was calculated as the arithmetical mean for all plots where they occurred, including PL-LN.
Trends in chemical composition and amount of individual litter categories were based on annual averages in the CT catchment and calcu-lated on a calendar year basis (n = 4; 2 seasons and 2 plots). In contrast, chemical changes in litter composition were evaluated with respect to the time of plot infestation in the PL catch-ment. Thus, year –1 represents litter chemistry prior to infestation (n = 6), year 0 represents bark-beetle infestation and tree death (n = 6), and the following years 1–8 refer to the age of dead trees (n = 2–6), regardless of calendar
years. Presence of increasing or decreasing trend in chemistry of individual litter categories was tested using a non-parametric Mann-Kendall test (Hipel and McLeod 1994). If a significant trend was detected and if the requirements for its description using a linear model were met, we quantified the rate of increase or decrease using the slope of fitted linear model. The slope values were calculated using a linear regression of annual average concentrations against time over the study period, i.e. during 2004–2013 and from –1 to 8 for the CT and PL catchments, respec-tively (n = 10, except for needle and cone at the PL plots, with n = 5).
Significances of differences between element concentrations in living tissue and litter needles, twigs, and bark during forest decay were tested using a non-parametric Mann-Whitney-U test in STATISTICA ver. 9. A non-parametric procedure was used because of non-normal data distribu-tion (Kolmogorov-Smirnov test, STATISTICA ver. 9).
Presence of increasing or decreasing trend in decomposition rate of cellulose (with two periods in each year) was tested using a Mann-Kendall test (Hipel and McLeod 1994).
Results
Litterfall
The chemical composition of individual litter categories beneath living trees exhibited similar differences across both catchments (Table 2). The ratios between element concentrations in the identical litter categories observed in the PL and CT catchments (PL:CT) varied only in a relatively narrow range, from PL:CT of 0.7 for Al in cones to 1.3 for ash in needles. The most important between-catchment difference was in ~20% higher Ca concentrations in total litterfall beneath the uninfested trees in the PL than CT catchments (Table 2), resulting from different bedrock composition and higher base saturation of the PL soils (Kopáček et al. 2002a, 2002b, 2010). In contrast to the relatively small between-catchment differences, much greater differences occurred between chemical composi-tions of individual litter categories at each plot

Boreal enV. reS. Vol. 20 • Dynamics and composition of litterfall after bark-beetle outbreak 311
Tabl
e 2.
ave
rage
(± S
D; n
= n
umbe
r of o
bser
vatio
ns) c
hem
ical
com
posi
tion
of li
tter b
enea
th li
ving
tree
s in
the
catc
hmen
ts o
f Ple
šné
(Pl)
and
Čer
tovo
(CT)
lake
s.
n as
h C
n
P
Ca
Mg
na
K al
Fe
M
n
(mg
g–1)
(mm
ol g
–1)
(mm
ol g
–1)
(µm
ol g
–1)
(µm
ol g
–1)
(µm
ol g
–1)
(µm
ol g
–1)
(µm
ol g
–1)
(µm
ol g
–1)
(µm
ol g
–1)
(µm
ol g
–1)
tota
l spr
uce
litte
r1 Pl
2 17
27
± 4
44
± 0
.5
0.83
± 0
.09
22 ±
3
085
± 9
16 ±
3
03 ±
0.7
31
± 6
19
± 7
07
± 3
04
± 1
.1
ct2
40
22 ±
3
44 ±
0.7
0.
84 ±
0.1
2 23
± 4
07
1 ±
11
16 ±
2
03 ±
0.8
32
± 6
15
± 7
05
± 2
03
± 0
.6n
eedl
es
Pl2
17
33 ±
4
44 ±
0.5
0.
79 ±
0.0
9 22
± 3
09
0 ±
10
16 ±
2
01 ±
0.4
31
± 8
04
± 1
01
± 0
.3
06 ±
1.7
c
t2 40
25
± 3
44
± 0
.8
0.86
± 0
.09
24 ±
5
077
± 11
15
± 3
01
± 0
.5
30 ±
9
05 ±
1
01 ±
0.4
05
± 0
.4tw
igs
Pl2
17
15 ±
2
45 ±
0.9
0.
68 ±
0.0
9 16
± 2
07
3 ±
10
11 ±
3
02 ±
0.4
17
± 3
20
± 4
07
± 1
02
± 0
.4
ct2
40
14 ±
2
45 ±
0.8
0.
72 ±
0.1
0 17
± 3
06
9 ±
9 11
± 2
02
± 0
.8
17 ±
3
18 ±
4
06 ±
2
02 ±
0.3
Bark
Pl
2 17
33
± 4
43
± 0
.5
0.77
± 0
.13
16 ±
3
185
± 32
16
± 5
04
± 1
.1
20 ±
3
31 ±
7
11 ±
3
04 ±
0.6
c
t2 40
28
± 4
44
± 0
.9
0.83
± 0
.19
18 ±
3
164
± 34
16
± 2
03
± 0
.9
19 ±
4
28 ±
7
09 ±
3
04 ±
0.4
lich
en
Pl2
17
26 ±
5
41 ±
0.5
1.
53 ±
0.1
0 22
± 2
08
2 ±
25
23 ±
3
05 ±
1.0
66
± 5
38
± 9
14
± 3
02
± 0
.6
ct2
40
28 ±
4
41 ±
0.7
1.
45 ±
0.1
1 25
± 4
10
7 ±
41
24 ±
3
05 ±
1.5
65
± 6
38
± 9
13
± 3
03
± 0
.5c
one
Pl2
10
07 ±
3
44 ±
1.0
0.
63 ±
0.6
1 18
± 1
7 00
9 ±
8 20
± 1
2 02
± 1
.5
53 ±
22
02 ±
1
01 ±
0.6
01
± 0
.6
ct2
34
09 ±
5
44 ±
1.1
0.
54 ±
0.3
1 18
± 1
1 00
8 ±
5 20
± 7
02
± 1
.3
59 ±
26
03 ±
1
01 ±
0.5
01
± 0
.3o
ther
mat
eria
l Pl
2 17
40
± 6
43
± 0
.7
1.48
± 0
.13
41 ±
5
082
± 14
26
± 6
13
± 4
47
± 7
79
± 1
9 28
± 8
03
± 0
.8
ct2
40
36 ±
11
43 ±
1.2
1.
47 ±
0.2
2 43
± 9
07
0 ±
13
25 ±
5
11 ±
6
45 ±
9
74 ±
32
26 ±
9
03 ±
0.5
Beec
h le
aves
c
t3 17
39
± 8
44
± 0
.9
1.21
± 0
.24
27 ±
9
054
± 9
22 ±
4
03 ±
0.9
49
± 2
1 08
± 4
04
± 1
03
± 0
.6Bi
rch
leav
es
Pl4
7 26
± 2
45
± 0
.9
1.55
± 0
.30
45 ±
10
126
± 38
29
± 4
03
± 1
.2
73 ±
23
13 ±
9
05 ±
3
09 ±
4Bi
rch
twig
s Pl
4 6
15 ±
2
46 ±
0.6
0.
81 ±
0.1
6 23
± 5
10
0 ±
22
25 ±
9
02 ±
1
34 ±
14
04 ±
4
02 ±
2
04 ±
2r
owan
leav
es
Pl5
14
39 ±
4
45 ±
0.7
1.
49 ±
0.2
7 45
± 8
23
6 ±
52
60 ±
20
03 ±
1.7
55
± 1
6 13
± 9
05
± 3
16
± 7
row
an tw
igs
Pl5
9 44
± 9
41
± 1
.1
0.60
± 0
.10
19 ±
3
308
± 57
60
± 2
4 02
± 0
.8
53 ±
25
05 ±
1
02 ±
2
11 ±
5
1) T
otal
spr
uce
litte
r: th
e av
erag
e co
mpo
sitio
n of
litte
rfall c
alcu
late
d fo
r all s
pruc
e lit
ter c
ateg
orie
s (n
eedl
es, t
wig
s, b
ark,
liche
n, c
one,
and
oth
er m
ater
ial)
from
eqs
. 1 a
nd 2
.2) a
vera
ges
for p
lots
CT-
l an
d C
T-H
in th
e C
T ca
tchm
ent,
and
Pl-l
S, P
l-H
S, a
nd P
l-H
n p
rior t
o th
eir i
nfes
tatio
n in
the
Pl c
atch
men
t.3) a
vera
ge c
ompo
sitio
n at
the
CT-
l pl
ot.
4) a
vera
ge c
ompo
sitio
n at
the
Pl-l
n p
lot.
5) a
vera
ge fo
r plo
ts P
l-ln
and
Pl-
Hn
.

312 Kopáček et al. • Boreal enV. reS. Vol. 20
(Table 2). The lowest concentrations of (i) ash, N, Ca, Al, Fe, and Mn were in cones, (ii) Mg and K in twigs, (iii) P in twigs and bark, and (iv) C in lichen. The highest concentrations of ash were in rowan litter and in “other material”. “Other material” also exhibited high concentrations of N and P, and the maximum concentrations of Na, Al, and Fe. Birch leaves and rowan leaves and twigs were rich in N, P, and Mn. The rowan litter had the highest concentrations of Ca and Mg, which were even higher than in bark (Table 2). The ratios between maximum and minimum concentrations of elements in the litter categories varied within one to two orders of magnitude, with the minimum ratio for C (1.1) and the maxi-mum ratios of 18–41 for Ca, Al, Fe, and Mn. “Other material” had ~40 times higher Al and Fe concentrations than lichen, and rowan leaves and twigs had 28 and 37 times higher Ca concentra-tions than cones, respectively. Consequently, the chemical composition of total litterfall at the PL and CT plots reflected mainly the relative contri-bution of individual litter categories to the total litterfall, while the between-catchment differ-ences in litter composition were less important.
Total litterfall was only slightly higher at the PL plots prior to bark-beetle infestation than the 2004–2013 average for the CT catchment (5.4 vs. 3.6 ± 0.4 t ha–1 yr–1; Fig. 3), and the relative contribution of individual spruce litter categories was similar in both catchments (i.e., 49% needles, 24% twigs, 10% cones, 9% “other material”, 6% bark, and 2% lichen on average;
Fig. 4). The litterfall flux as well as the rela-tive contribution of individual litter categories remained relatively stable in the CT catchment during 2004–2013, with coefficients of variation varying from 12% for the total litter to 54% for cones. In contrast, the litterfall flux and relative contribution of individual litter categories dra-matically changed in the PL catchment (Figs. 3 and 4). Bark-beetle infestation of the PL forest resulted in one order of magnitude higher lit-terfall (42 t ha–1 yr–1) in the year of forest dieback (year 0) than prior to infestation (year –1). This litterfall flux was dominated by needles (62%, 23 t ha–1 yr–1), with a large proportion of green, non-senescent needles, and bark (20%, 7.6 t ha–1 yr–1). In the following 8 years, the total litterfall was dominated by twigs (and small branches) and bark (on average 62% and 27%, respectively), while the contribution of needles and cones rap-idly declined and became negligible from the 3rd year after infestation. The respective fluxes of twigs and lichen continuously increased from 1.4 to 7.7 t ha–1 yr–1 and from 0.13 to 0.57 t ha–1 yr–1 between years –1 and 3, and then decreased to ~3 t ha–1 yr–1 and 0.11 t ha–1 yr–1 in year 8 after infestation. The relative contribution of litter cat-egories to the total litterfall was relatively stable during 4–8 years after infestation, but its total flux further decreased to 5–10 t ha–1 yr–1, because some of the dead trees were already broken by winds and canopies of the remaining trees became thinner. But, even at the end of this study in 2013 the total litterfall from the remaining
All Needle Twig Bark Lichen Cone Other material
0
1
2
3
4
2004 2006 2008 2010 2012Calendar year
0
0.4
0.8
1.2
1.6
2.0CT
Lichen, cone, other (t ha–1 yr –1)
All,
need
le, t
wig,
bar
k (t
ha–1
yr–1
)
0
10
20
30
40
–1 0 1 2 3 4 5 6 7 8Year after bark beetle infestation
0
0.4
0.8
1.2
1.6
2.0PL
All,
need
le, t
wig,
bar
k (t
ha–1
yr–1
) Lichen, cone, other (t ha–1 yr –1)
Fig. 3. annual fluxes of spruce litter in the Plešné (Pl) catchment (averages for plots Pl-lS, Pl-HS, and Pl-Hn) prior to bark-beetle infestation (year –1), during the infestation (year 0), and after the infestation (dead trees; years 1–8), and in the Čertovo (CT) catchment (averages for plots CT-l and CT-H). “all” represents the sum of all litter categories including rowan. The category “other material” refers to remaining material, consisting mostly of poorly identifiable fragments.

Boreal enV. reS. Vol. 20 • Dynamics and composition of litterfall after bark-beetle outbreak 313
dead trees was higher in the PL catchment than in the uninfested CT plots (5.0 vs. 3.2 t ha–1 yr–1; Fig. 3).
Changes in the litterfall flux following bark-beetle infestation affected nutrient inputs to the forest floor. The nutrient fluxes associated with annual average litterfall prior to bark-beetle infestation represented 5%–17% of their pools in the PL litter horizon, with the minimum value for K and maximum for Mn (Table 3). This flux abruptly increased to 15%–36% for N, K, P, C
and Mg, and even to 61% for Mn and 70% for Ca (Table 3) during the first year of forest infes-tation, and resulted in a pronounced enrichment of nutrients pools in the PL litter horizon. Even though nutrient inputs from litterfall decreased during the following 8 years, it still represented 3%–18% of the nutrient pools in the PL forest floor prior to forest infestation, and was thus similar to annual average nutrients inputs to the forest floor in the uninfested CT catchment (Table 3).
0
20
40
60
80
100
CT(Avg)
PL (–1) PL (0) PL (1) PL (2) PL (3) PL (4) PL (5) PL (6) PL (7) PL (8)
Rel
ativ
e lit
ter c
ompo
sitio
n (%
)
Catchment and year
Other material Cone Lichen Bark Twig Needle
Fig. 4. relative contributions of the major litter categories in the total spruce litterfall in the Čertovo (CT) catchment (average for plots CT-l and CT-H during June 2003–May 2013) and in the Plešné (Pl) catchment (averages for plots Pl-ls, Pl-hs, and Pl-hn) prior to bark-beetle infestation (year –1), during the infestation (year 0), and after the infestation (dead trees; years 1–8). The category “other material“ refers to remaining material, consisting mostly of poorly identifiable fragments.
Table 3. Comparison of element pools in the litter horizon of the Plešné (Pl) and Čertovo (CT) soils to their annual average fluxes in total litterfall including rowan.
Unit C n P Ca Mg K Mn
ct1
litter horizon2 mmol m–2 176731 6894 146 215 119 261 14 litterfall (2004–2013) mmol m–2 yr–1 15042 283 8 24 5 11 1 %4 8.5 4.1 5.2 11 4.5 4.2 8.3Pl1
litter horizon3 mmol m–2 225131 7755 165 332 98 315 12 litterfall (year –1) mmol m–2 yr–1 23530 444 12 45 9 17 2 %4 11 5.7 7.1 14 8.8 5.3 17 litterfall (year 0) mmol m–2 yr–1 69853 1182 37 232 36 53 8 %4 31 15 23 70 36 17 61 litterfall (years 1–8) mmol m–2 yr–1 18863 334 9 60 9 9 2 %4 8.4 4.3 5.3 18.1 8.7 2.9 17.2
1) averages for plots CT-l and CT-H in the CT catchment, and Pl-lS, Pl-HS, and Pl-Hn in the Pl catchment.2) average element pools in the catchment of Čertovo lake in 1997–2001 (Kopáček et al. 2002b).3) average element pools in the catchment of Plešné lake in 1997–2001 (Kopáček et al. 2002a).4) Contribution (%) of annual average element input in litterfall to its pool in the litter (o) horizon.

314 Kopáček et al. • Boreal enV. reS. Vol. 20
Trends in litterfall chemistry
Concentrations of all elements (except for Ca) remained stable in all litter categories in the reference CT catchment throughout the study, and exhibited only small year-to-year variability (see averages and the respective standard devia-tions; Table 2). The Ca concentrations, however, increased in the CT litter at both plots (with significant trends for all litter categories except for twigs and bark), with an average rate of 2.5 µmol Ca g–1 yr–1 (τ = 0.64, p = 0.012) for the total litterfall.
In contrast, chemical composition of the PL litter categories changed during the study as follows: (1) Concentrations of C significantly decreased (τ = –0.60, p = 0.020) in the total PL litterfall after bark-beetle infestation due mostly to their decreases in twigs (τ = –0.56, p = 0.032) and “other material” (τ = –0.64, p = 0.012), but also in needles and bark (Fig. 5A). (2) Concen-trations of N were stable in the total litterfall, as
well as in most of litter categories, except for the PL needles, where they significantly increased (τ = 1.00, p = 0.028) from 0.79 to 1.17 mmol g–1 between years –1 and 3, and the PL lichen, where they significantly decreased (τ = –0.56, p = 0.032) from 1.53 to ~1.1–1.3 mmol g–1 during the study (Fig. 5B). (3) Concentrations of P increased in the total litterfall in the PL catchment between years –1 and 1, mainly due to increasing P con-centrations in needles and their high proportion in the litterfall. Then, the contribution of needles to the total litterfall sharply decreased (Fig. 3) and P concentration in the total litterfall continu-ously decreased in parallel with its decrease in twigs (Fig. 5C), which formed the dominant litter category at that time (Fig. 4). Finally, P concentrations in the total PL litterfall started to increase in the last two years of the study, due to the occurrence of rowan litter, which is rich in P (Table 2). (4) Concentrations of Ca in the total litterfall increased significantly (τ = 0.69, p = 0.007) in the PL catchment, similarly to the CT
All Needle Twig Bark Lichen Cone Other material
3940414243444546
C (m
mol
g–1
)
A
0.4
0.6
0.8
1.0
1.2
1.4
1.6B
N (m
mol
g–1
)
10
20
30
40
50
Year after bark beetle infestation
C
P (µ
mol
g–1
)
0
100
200
300 D
Ca
(µm
ol g
–1)
0
10
20
30
40
50
60 E
Mg
(µm
ol g
–1)
0
20
40
60
80
Year after bark beetle infestation
F
K (µ
mol
g–1
)
0
20
40
60
80G
Al (
µmol
g–1
)
0
10
20
30H
Fe (µ
mol
g–1
)
0
5
10
15
Year after bark beetle infestation
I
Mn
(µm
ol g
–1)
–1 0 1 2 3 4 5 6 7 8 –1 0 1 2 3 4 5 6 7 8 –1 0 1 2 3 4 5 6 7 8
Fig. 5. average concentrations of elements in the total litterfall (all) and major categories of spruce litter in the Plešné catchment (averages for plots Pl-lS, Pl-HS, and Pl-Hn) prior to bark-beetle infestation (year –1), during the infestation (year 0), and after the infestation (dead trees; years 1–8). Composition of total litterfall was calcu-lated with eqs. 1 and 2 for all litter categories including rowan. The category “other material“ refers to remaining material, consisting mostly of poorly identifiable fragments.

Boreal enV. reS. Vol. 20 • Dynamics and composition of litterfall after bark-beetle outbreak 315
catchment, but with a fourfold steeper slope (11 µmol g–1 yr–1) than in the CT catchment. These trends resulted from significant increases (τ = 0.60 to 0.73, p = 0.004 to 0.020) in Ca concentra-tions in all litter categories except in twigs and bark (Fig. 5D). (5) In contrast to Ca, Mg con-centrations did not exhibit any significant trend except for an increase (τ = 0.64, p = 0.012) in the PL bark (Fig. 5E). Mg concentrations were rela-tively stable in the total PL litterfall 6 years after the forest dieback, but then started to increase during the last 2 years due to (i) steeply increas-ing concentrations in bark and twigs, and (ii) the contribution of rowan twigs and leaves to the total litterfall at the PL–HN plot. (6) Concentra-tions of K were decreasing 6 years after the forest dieback and then, similarly to Mg, increasing during the last 2 years in twigs and bark, and con-sequently, also in the total litterfall (Fig. 5F). (7) Concentrations of Al and Fe behaved similarly and were stable in most litter categories in the PL catchment throughout the study (Fig. 5G and H). One exception was significantly decreasing Al and Fe concentrations (4.7 and 1.7 µmol g–1 yr–1, respectively; τ = –0.78, p = 0.002 for both) in the PL “other material”. In contrast to mainly stable Al and Fe, Mn concentrations increased sig-nificantly in the PL bark (τ = 0.91, p = 0.0004), lichen (τ = 0.51, p = 0.049), and ”other material” (τ = 0.69, p = 0.007) (Fig. 5I). The increase in Mn concentrations in the total PL litterfall was especially steep in the last two years when rowan leaves and twigs rich in Mn (Table 2) contributed to the Mn flux in the PL catchment.
Needles shed in year 0 contained higher amounts of N and P than senescent needles in year –1, but lower than foliage (Table 4). The litter needles in year 0 had also higher concen-trations of Al and Fe, but 19%–61% lower con-centrations of K, Na, Mg, and Mn than foliage. Similar differences between the composition of living tissue and litter of infested trees in year 0 occurred also in the chemistry of twigs and bark, i.e. categories that (besides needles) were the highest contributors to the total litterfall (Fig. 3). The litter twigs and bark had lower con-centrations of P, K, Na, Mg, and Mn, but higher concentrations of Al and Fe (and also Ca in litter twigs of age 0 and 1–8), than in living tissue (Table 4).
Changes in the chemistry and proportion of individual litter components after bark-beetle infestation affected some element ratios in the total litterfall in the infested vs. uninfested for-ests, while other ratios remained surprisingly stable despite significant concentration changes in individual components (Fig. 5). Most impor-tant trends in element ratios are summarized in Fig. 6. (1) C:N ratio: Concentrations of N in litter needles continuously increased at the infested plots (Fig. 5B), and even exceeded those in foli-age in years 1 to 3 after the infestation (Table 4). N concentrations were steadily higher in litter bark, while ~35% lower in the litter twigs than in living tissue. Despite changes in the chem-istry of individual litter components, the C:N ratios and N concentration of total litterfall thus remained relatively stable in the infested PL forest (Fig. 6) because of the changing propor-tions of litter species. (2) N:P ratio: The stable N concentrations but changing P concentrations in the total PL litterfall affected N:P ratios after the forest infestations as follows: The N:P ratios continuously increased five years after infesta-tion due to decreasing P concentrations in twigs (Fig. 5C), which dominated the litterfall at that time (Fig. 4). Then, N:P ratios started to decrease due to the increasing proportion of rowan litter, which is rich in P (Table 2). (3) N:Mg ratio: The N:Mg ratios were stable at the infested PL plots (similarly to the uninfested CT plots) 6 years after the forest dieback, but then started to decrease (Fig. 6) as a result of increasing Mg concentrations in bark and twigs (Fig. 5E) and the increasing contribution of rowan twigs and leaves with high Mg concentrations (Table 2) to the total litterfall. (4) Ca:Al ratio: The Ca:Al ratios of total litterfall increased in both study catchments due to increasing Ca concentrations in most litter categories (Fig. 5D), while Al concentrations were stable in the total litterfall (Fig. 5G).
Cellulose decomposition
Decomposition rates of cellulose (a proxy for C mineralization rate) varied between 2.1 and 20 mmol m–2 day–1 and were expectedly higher in summer than in winter (Fig. 7). Besides the sea-

316 Kopáček et al. • Boreal env. res. vol. 20
Tabl
e 4.
Com
paris
on o
f the
com
posi
tion
of li
tterfa
ll (l
F) p
rior t
o, d
urin
g, a
nd a
fter i
nfes
tatio
n, w
ith th
e co
mpo
sitio
n of
nor
way
spr
uce
folia
ge, t
wig
s, a
nd b
ark
in th
e Pl
ešné
ca
tchm
ent (
aver
age
for t
he P
L-LS
, PL-
HS,
and
PL-
HN
plo
ts).
Diff
eren
t let
ters
in s
uper
scrip
ts in
dica
te s
igni
fican
t (p
< 0.
05) d
iffer
ence
s am
ong
the
tissu
e an
d lit
terfa
ll ca
t-eg
orie
s.
n
age1
C
n
P C
a M
g n
a K
al
Fe
Mn
Mol
ar ra
tio
(mm
ol g
–1)
(mm
ol g
–1)
(µm
ol g
–1)
(µm
ol g
–1)
(µm
ol g
–1)
(µm
ol g
–1)
(µm
ol g
–1)
(µm
ol g
–1)
(µm
ol g
–1)
(µm
ol g
–1)
C
:n
C:P
Folia
ge2
45
43
.1a
0.96
b 37
c 81
31
b 1.
7b 97
c 2.
8b 1.
1a 8.
9b 45
ab
1160
a
lF-n
eedl
es
6 –1
44
.0b
0.79
a 22
a 90
16
a 0.
8a 31
ab
4.1b
1.2a
5.8a
56c
1960
c
lF-n
eedl
es
6 0
44.2
b 0.
92b
30b
98
20a
1.1ab
38
b 4.
2bc
1.3a
5.7a
48b
1470
b
lF-n
eedl
es
16
1–3
43.8
b 1.
14c
33bc
90
16
a 1.
7b 25
a 5.
6c 1.
9b 4.
9a 38
a 13
40ab
Twig
s2 9
44
.2a
1.01
b 45
b 77
33
c 5.
0b 97
c 15
a 4.
8a 5.
7b 44
a 98
0a
lF-tw
igs
6 –1
44
.8ab
0.
68a
16a
73
11a
2.2a
17a
20b
7.1b
2.2a
66b
2710
b
lF-tw
igs
6 0
45.0
b 0.
67a
21a
79
16b
2.6a
27b
18ab
6.
1ab
2.7a
67b
2150
b
lF-tw
igs
35
1–8
44.5
ab
0.69
a 18
a 82
14
b 2.
5a 16
a 17
ab
5.9ab
2.
9a 65
b 25
40b
Bark
2 24
41.3
a 0.
49a
22c
203a
37c
4.0b
68c
4.9a
1.5a
8.8c
84b
1910
a
lF-b
ark
6 –1
43
.4b
0.77
b 16
ab
185a
16a
3.6b
20b
31c
11c
3.5a
56a
2690
bc
lF-b
ark
6 0
43.7
b 0.
51a
15a
231b
21ab
2.
3a 23
b 20
b 6.
5b 5.
0b 85
b 29
60c
lF-b
ark
35
1–8
43.0
b 0.
72b
18b
243b
24b
2.6a
17a
17b
5.9b
7.1b
c 59
a 24
30b
1) l
itter
age
: –1
= on
e ye
ar p
rior t
o in
fest
atio
n; 0
= th
e ye
ar o
f inf
esta
tion;
1–3
and
1–8
= a
vera
ges
for 3
and
8 y
ears
afte
r inf
esta
tion,
resp
ectiv
ely.
The
1–8
age
cate
gory
al
so in
clud
es ro
wan
litte
r.2) D
ata
are
from
Kop
áček
et a
l. (2
010)
and
svo
boda
et a
l. (2
006b
) and
refe
r to
the
com
posi
tion
of fr
esh
nor
way
spr
uce
tissu
e pr
ior t
o ba
rk-b
eetle
infe
stat
ion.

Boreal enV. reS. Vol. 20 • Dynamics and composition of litterfall after bark-beetle outbreak 317
Litter Mineralization
0
5
10
15
20
25
0
100
200
300
400
500
C m
ineralization(m
mol m
–2 day–1)
C in
litte
r fal
l(m
mol
m–2
day
–1)
PL-LS
0
5
10
15
20
25
0 10 20 30 40 50 60 70
C m
ineralization(m
mol m
–2 day–1)
C in
litte
r fal
l(m
mol
m–2
day
–1)
CT-L
0
5
10
15
20
25
0 10 20 30 40 50 60 70
C m
ineralization(m
mol m
–2 day–1)
C in
litte
r fal
l(m
mol
m–2
day
–1)
CT-H
0
5
10
15
20
25
0
100
200
300
C m
ineralization(m
mol m
–2 day–1)
C in
litte
r fal
l(m
mol
m–2
day
–1)
PL-HN
0
0.5
1.0
1.5
2.0
2.5
0 2 4 6 8
10 12 14
2003 2005 2007 2009 2011 2013
C m
ineralization (ratio)C in
litte
r fal
l (ra
tio)
Year
PL-LS:CT-L ratio
0
0.5
1.0
1.5
2.0
2.5
1234567
2003 2005 2007 2009 2011 2013
C m
ineralization (ratio)C in
litte
r fal
l (ra
tio)
Year
PL-HN:CT-H ratio
C:N N:Mg N:P Ca:Al
0
10
20
30
40
50
60
–1 0 1 2 3 4 5 6 7 8Year after bark beetle infestation
Mol
ar ra
tio
Fig. 6. Time series of molar ratios between element fluxes in the total litterfall (sum of all litter categories including rowan) in the Plešné catchment (averages for plots Pl-ls, Pl-hs, and Pl-hn) prior to bark-beetle infestation (year –1), during the infestation (year 0), and after the infestation (dead trees; years 1–8).
Fig. 7. Carbon (C) in total litterfall and cellulose decomposition (expressed as C mineralization) at the studied plots in the catchments of Plešné and Čertovo lakes. The lower panels show ratios between C litterfall and cellulose decomposition at the Pl and CT sites of similar elevation (l, low; H, high). For site abbreviations see Table 1.
sonal variability, the rates significantly increased at all plots during the study: PL-LS (τ = 0.57, p = 0.001), PL-HN (τ = 0.50, p = 0.004), CT-L (τ = 0.36, p = 0.043), and CT-H (τ = 0.61, p = 0.001). The trends in cellulose decomposition rates, however, differed between the catchments. The increasing trends at the CT plots were caused by generally higher rates of decomposition during 2008–2013 than during 2003–2007, despite the relatively stable C input in litterfall. In contrast, cellulose decomposition rates increased continu-ously with the increasing litterfall at the PL plots, and then remained high till the end of study (Fig. 7). Ratios between cellulose decomposition rates at the PL and CT plots of similar elevations (i.e., PL-LS vs. CT-L and PL-HN vs. CT-H) were below 1 at the beginning of the study, because decomposition rate was higher at the CT than PL plots. However, the ratios increased after the bark-beetle outbreak and elevated litterfall to values ~2, and then stabilized around 1 during
2008–2013 (Fig. 7, lower panel), indicating sim-ilar cellulose decomposition rates in both catch-ments during this period.

318 Kopáček et al. • Boreal enV. reS. Vol. 20
Discussion
Effects of bark-beetle infestation on litterfall composition and flux
Forest infestation by bark beetle and the follow-ing dieback of mature Norway spruce stands caused pronounced changes in both litterfall flux and composition. The dead trees lost most nee-dles and cones within a year after the outbreak. Then, they continuously lost twigs, bark, and branches until the end of this study. Surpris-ingly, litterfall flux was relatively high (similar to that at uninfested plots) as late as 8 years after the bark-beetle outbreak (Fig. 3). Even though the composition of litterfall changed during the years following forest infestation due to the absence of needles and cones in the progressed stage of forest decay, it still represented an important input of elements to the forest floor almost one decade after the bark-beetle outbreak.
Retranslocation (nutrient recovery from senescent tissues) is an important mechanism for the conservation of nutrients within a tree (Miller 1995). Spruce trees clearly remobilize nutrients from old foliage to new needles (Bauer et al. 1997). The fast dieback of infected trees resulted in low nutrient remobilization, and nee-dles shed in the year of spruce dieback (year 0) had different composition from the foliage of the healthy canopies, but also from senescent nee-dles fallen from healthy trees (year –1), which relocated part of the nutrients to living tissue (Table 4). Needles shed in year 0 contained higher amounts of N and P than senescent nee-dles in year –1, but still lower N and P than foliage, confirming the low remobilization of nutrients in infected trees (Table 4). In the nee-dles shed later after forest dieback (years 1–3), N concentrations increased and C:N (and also C:P) ratios decreased, probably indicating decay by endophytes already on the trees. Endophytic fungi have been shown to play an important role in decomposition (Korkama-Rajala et al. 2008). The litter depletion in K, Mg, and Mn as com-pared with their concentrations in living tissue (Table 4) probably occurred mostly in canopies, due to a partial washing off of these elements by precipitation (Kopáček et al. 2009). This process is responsible for high concentrations
of these elements in throughfall as compared with deposition in treeless areas (e.g., Pedersen and Bille-Hansen 1999, Kopáček et al. 2009). The long sampling intervals (on average six months in winter and three months in summer) during this study could, however, also partly underestimate litterfall fluxes of easily soluble elements, as observed elsewhere (Ukonmaanaho and Starr 2001). Many studies have shown that more mobile elements are easily leached from litter (e.g., Palviainen et al. 2004a, Berg and McClaugherty 2008), which is subjected to par-tial leaching during the residence time in the traps (Pedersen and Bille-Hansen 1999).
Calcium was the only element in this study exhibiting increasing trends in almost all litter categories in both catchments regardless of the forest health. This Ca increase could reflect an increasing base saturation of soils in both catch-ments between 2000 and 2010 (J. Kaňa unpubl. data) due to continuously decreasing terrestrial losses of base cations. This decline in leaching of base cations (mostly Ca) clearly accompanies the decreasing leaching of strong acid anions during the recovery of the CT and PL catchments from acidification (Majer et al. 2003, Oulehle et al. 2013). The lower Ca leaching from soils thus probably caused its increasing availability for plants and increasing concentrations in tree tissues. The long-term continuously increasing Ca concentrations in the PL litter after the forest infestation (Fig. 5D) was, however, surprising. We expected stable or slightly decreasing Ca concentrations in the litterfall from the dead trees. Such a trend would correspond with gen-eral changes in the chemical composition of spruce litter during the early phase of its decay, with decreasing concentrations of K, Mn, and Mg, increasing Al and Fe concentrations, and minor changes in Ca and N concentrations (Pal-viainen et al. 2004a, Berg and McClaugherty 2008). While concentrations of other elements mostly behaved in concordance with these gen-eral patterns, concentrations of Ca significantly increased. The question why these changes in Ca concentrations in the litterfall from dead canopies differed from that generally occurring in decaying litter on the forest floor (Berg and McClaugherty 2008) remains, however, unex-plained.

Boreal enV. reS. Vol. 20 • Dynamics and composition of litterfall after bark-beetle outbreak 319
Effects of bark-beetle infestation on cellulose decomposition and soil element pools and leaching
The elevated nutrient input to forest floor of infested plots (Table 3) and changing microcli-matic conditions [soil temperature (Hais and Kučera 2008) and moisture (Mikkelson et al. 2013a)] probably contributed to the elevated cellulose decomposition rate at the PL plots (Fig. 7). But, the change in cellulose decomposi-tion following the higher input in litterfall was not straightforward. Even though the forest die-back was followed by an abrupt increase in litter inputs and increasing soil temperature (Hais and Kučera 2008), the increase in decomposition of cellulose inserted in the litter layer was relatively slow (Fig. 7). The probable explanation for this pattern is slow decomposition of and nutrient release from the litter above cellulose strips, supporting development of cellulose decaying microflora. The composition of the total litterfall was dominated by needles, twigs, and branches, i.e., the material high in lignin and relatively low in nutrient concentrations. The mineralization rate of litter is influenced by its initial com-position, with low decomposition rates usually connected with high concentrations of lignin and phenolic compounds, and with low P and N availability (Aber and Mellilo 1982, Wardle et al. 2003, Šantrůčková et al. 2006). Slightly higher nutrient concentrations in needles, bark, and twigs just after tree dieback (Table 4) thus probably supported cellulose decomposition, but likely only until easily available nutrients were depleted again, i.e. during the following sev-eral years. The elevated cellulose decomposition rates, persisting at the PL plots until the end of our study, can be then probably attributed to (i) the development of understory vegetation, including grasses (K. Matějka pers. comm.), which are more rich in nutrients and have lower concentrations of lignin and phenolics than spruce litter (Wardle et al. 2003, Šantrůčková et al. 2006, Bárta et al. 2010), and (ii) the higher soil temperature and moisture (Hais and Kučera 2008, Mikkelson et al. 2013a).
Our method based on cellulose decomposi-tion can be used only to track relative changes between the plots, but does not enable a quan-
tification of C mineralization rates in the whole litter horizon. Data presented in Fig. 7 thus refer only to mineralization rates in a thin layer 3–5 cm below the forest floor, where the cellu-lose was inserted. The changes in C mineraliza-tion rates in the uppermost layers of litter hori-zon could probably be greater than that reflected by our results, due to higher enrichment of the forest floor with nutrients (Table 3). The release of available nutrients from decaying litter is slow (Šantrůčková et al. 2006) and their transport to deeper horizons is probably minor. In addition, elevated temperature on the soil surface com-pared to deeper soil layers could also enhance the C mineralization rate in the upper layer of the litter horizon.
Forest dieback temporally alters surface water composition in affected areas (Likens and Bormann 1995, Oulehle et al. 2013, Vrba et al. 2013). The elevated nutrient input in litterfall and mineralization (Fig. 7), nutrient release from the litter at the early stages of decay as observed elsewhere (Palviainen et al. 2004a, 2004b), and decreased nutrient uptake by the attacked forest resulted in sharply elevated terrestrial exports of nitrate and base cations in the PL catchment since 2004 (Kopáček et al. 2013b), analogous to the situation observed elsewhere after forest dieback or clearcuts (e.g., Huber et al. 2004b, McHale et al. 2007). The almost one order of magnitude higher litterfall after forest dieback than in unin-fested Norway spruce stands (Fig. 3) represented an important increase in nutrient inputs into soils below the infested trees (Table 3). The litter decomposition increased soil concentrations of Ca, Mg, and K, which replaced Al and protons from the soil sorption complex and almost dou-bled the concentrations of exchangeable base cations in the uppermost soil horizons, as well as their base saturation (Kaňa et al. 2013). The elevated litterfall, reduced nutrient uptake by dead trees, and enhanced microbial minerali-zation (Tahovská et al. 2010) thus resulted in elevated leaching of nutrients to tributaries, but also importantly contributed to a recovery of the strongly acidified Bohemian Forest soils from long lasting atmospheric acidification (Kaňa et al. 2013, Kopáček et al. 2013b).
Our results on forest decay in unmanaged plots differ in several important aspects from

320 Kopáček et al. • Boreal enV. reS. Vol. 20
those observed in clear-cut areas. Even though the general patterns of ecosystem responses to forest disturbance are similar regardless the disturbance type, the intensity and duration of the responses differ between dieback by bark-beetle infestation in natural forests, windthrows in unmanaged forests and clear-cut plantations (Huber 2004a, 2004b, McHale et al. 2007). The major reasons for these differences include more biomass remaining on the unmanaged plots after natural dieback, longer-lasting nutrient inputs to soils from continuously decaying trees (Fig. 3), and the shading effect of standing dead trees, which mitigates changes in air and soil tempera-ture (Hais and Kučera 2008, Turek et al. 2014). Moreover, as compared with windthrows, when most of the litter enters the forest floor abruptly and into relatively small patches where the trees lie, litterfall from infested trees distributes ele-ments below tree canopies more evenly in both time and space (due to dispersion by wind). The longer-lasting litter inputs spread miner-alization and nitrification over a longer time. Consequently, the amplitude of NO3
– losses from soils is lower but has longer duration (7–8 years) after natural forest diebacks than after clear-cuts, when higher NO3
– losses usually occur for a shorter period (3–5 years) (Cummins and Farrell 2003, Huber 2004a, Kopáček et al. 2013b). The characteristics of NO3
– leaching are mimicked by the terrestrial export of Al, which to a large extent accompanies NO3
– leaching (McHale et al. 2007, Kopáček et al. 2013b). Consequently, the effect of Al on water biota is longer lasting but milder after natural forest diebacks than after clear-cuts.
Another important difference between unmanaged plots and clear-cut areas results from compositions of re-foresting stands. Natural re-forestation in unmanaged plots will have a higher proportion of deciduous trees, as was observed elsewhere in the Bohemian Forest. Jonášová and Prach (2004) and T. Zeppenfeld and R. Bače (pers. comm.) observed that there has been (besides spruce) a significant regen-eration of rowan and, sporadically, beech in the naturally re-foresting stands, while the numbers of rowan were significantly lower in clear-cut areas. The rowan litter is richer in base cations and P (Table 2) and poorer in phenolic com-
pounds than any category of spruce litter (H. Šantrůčková unpubl. data). Consequently, rowan exhibits higher nutrient improvement capacities and higher nutrient return to the forest floor than other pioneer species (e.g. willow, birch) and effectively increases soil pH and base satura-tion compared to spruce forests (Emmer et al. 1998, Carnol and Bazgir 2013). The high Ca, Mg and K concentrations in rowan litter may be explained by the physiological characteristics of this plant leading to the better exploitation of soil resources from the total pool of available nutrients (Larcher 2003). The roots of rowan, as well as those of many other pioneer spe-cies, reach deeper soil horizons than spruce of similar age and export nutrients via litter from deeper soil horizons to the forest floor (Mauer and Palátová 2002, Puhe 2003). The presence of rowan in the naturally re-foresting plots will thus result in higher enrichment of the uppermost soil horizons with nutrients. High input of base cati-ons in rowan litter will result in less acidic soils (as well as surface waters) during forest growth in naturally re-foresting unmanaged plots than in clear-cut areas artificially re-forested with spruce and beech (Hruška et al. 2002, Carnol and Bazgir 2013).
Conclusion
The unmanaged PL forest was infested by the bark beetle in 2004–2008, and 88%–99% of spruce trees had died at the PL research plots by 2011. All dead trees were left in the PL catch-ment and there were no forest management. Total litterfall was only slightly higher in the PL plots prior to bark-beetle infestation than the 10-yr average for the uninfested CT catchment (5.4 vs. 3.6 ± 0.4 t ha–1 yr–1), and the relative con-tributions of needles, twigs, cones, bark, lichen, and “other material” were similar in both catch-ments (i.e., 49%, 24%, 10%, 6%, 2%, and 9%, respectively). The flux of litterfall increased to 42 t ha–1 yr–1 in the PL catchment after the bark-beetle infestation and remained higher than in the uninfested CT plots until the end of study (5.0 vs. 3.2 t ha–1 yr–1) despite the fact that > 52% of dead trees were already broken at the PL plots in 2013. The relative contribution of individual cat-

Boreal enV. reS. Vol. 20 • Dynamics and composition of litterfall after bark-beetle outbreak 321
egories to the total litterfall changed after forest dieback from a dominance of needles (62%) and bark (20%) in the first year to a dominance of twigs (62%) and bark (27%) in the following 8 years. Litter from rowan trees occurred in the naturally-recovering PL-HN plot 6 years after the spruce forest dieback. The chemical compo-sition of many PL litter categories changed, with the most pronounced trends in the total litter-fall composition observed for C concentrations (decrease) and Ca concentrations (increase). In addition, concentrations of Mg, K, and P steeply increased in the total PL litterfall during the last two years of the study due to an increasing pro-portion of rowan litter, which is rich in nutrients. Compared with the original spruce stands, the natural regeneration of the affected PL plots with this pioneer tree thus contributes to a valuable enrichment of the uppermost soil horizons with nutrients. The elevated nutrient input in litterfall and possibly also changed microclimatic condi-tions (increased soil temperature and moisture) contributed to the elevated cellulose decomposi-tion (a proxy for C mineralization rate) in the PL compared to the CT litter floor.
Acknowledgements: We thank F. Havlíček for field sampling, M. Kohoutová and E. Chmelíková for separation and quan-tification of litter categories, D.W. Hardekopf for proofread-ing, and P. Šmilauer for help with statistical evaluation of our data. We also thank editor and two anonymous reviewers for their constructive criticism of an earlier version of the paper. This study was supported by the Grant Agency of the Czech Republic (project no. P504/12/1218).
References
Aber J.D. & Melillo J.M. 1982. Nitrogen immobilization in decaying hardwood leaf litter as a function of initial nitrogen and lignin content. Can. J. Bot. 60: 2263–2269.
Adamson J.K. & Hornung M. 1990. The effect of clear-felling a Sitka spruce (Picea sitchensis) plantation on solute concentrations in drainage water. J. Hydrol. 116: 287–297.
Ahtiainen M. & Huttunen P. 1999. Long-term effects of forestry managements on water quality and loading in brooks. Boreal Env. Res. 4: 101–114.
Bárta J., Applová M., Vaněk D., Krištůfková M. & Šantrů-čková H. 2010. Effect of available P and phenolics on mineral N release in acidified spruce forest: connection with lignin-degrading enzymes and bacterial and fungal communities. Biogeochemistry 97: 71–87.
Bauer G., Schulze E.-D. & Mund M. 1997. Nutrinet con-
tents and concentrations in relation to growth of Picea abies and Fagus sylvatica along European transect. Tree Physiol. 17: 777–786.
Berdén M., Nilsson S.I. & Nyman P. 1997. Ion leaching before and after clear-cutting in a Norway spruce stand — effects of long-term application of ammonium nitrate and superphosphate. Water Air Soil Pollut. 93: 1–26.
Berg B. & McClaugherty C. 2008. Plant litter, decomposi-tion, humus formation, carbon sequestration, 2nd ed. Springer, Berlin, New York.
Burns D.A. & Murdoch P.S. 2005. Effects of a clearcut on the net rates of nitrification and N mineralization in a northern hardwood forest, Catskill Mountains, New York, USA. Biogeochemistry 72: 123–146.
Čada V., Svoboda M. & Janda P. 2013. Dendrochronological reconstruction of the disturbance history and past devel-opment of the mountain Norway spruce in the Bohemian Forest, central Europe. For. Ecol. Manage. 295: 59–68.
Carnol M. & Bazgir M. 2013. Nutrient return to the forest floor through litter and throughfall under 7 forest spe-cies after conversion from Norway spruce. Forest Ecol. Manage. 309: 66–75.
Cummins T. & Farrell E.P. 2003. Biogeochemical impacts of clearfelling and reforestation on blanket-peatland streams. II. Major ions and dissolved organic carbon. Forest Ecol. Manage. 180: 557–570.
Emmer I.M., Fanta J., Kobus A.T., Kooijman A. & Sevink J. 1998. Reversing borealization as a means to restore biodiversity in Central-European mountain forests — an example from the Krkonoše Mountains, Czech Repub-lic. Biodivers. Conserv. 7: 229–247.
Emteryd O. 1989. Chemical and physical analysis of inor-ganic nutrients in plant, soil, water and air. Swedish University of Agricultural Sciences, Umea.
Finér L., Mannerkoski H., Piirainen S. & Starr M. 2003. Carbon and nitrogen pools in an old-growth, Norway spruce mixed forest in eastern Finland and changes associated with cleat-cutting. Forest Ecol. Manage. 174: 51–63.
Hais M. & Kučera T. 2008. Surface temperature change of spruce forest as a result of bark beetle attack: remote sens-ing and GIS approach. Eur. J. Forest Res. 127: 327–336.
Hipel K.W. & McLeod A.I. 1994. Time series modelling of water resources and environmental systems. Elsevier Science, Amsterdam.
Houlton B.Z., Driscoll C.T., Fahey T.J., Likens G.E., Groff-man P.M., Bernhardt E.S. & Buso D.C. 2003. Nitro-gen dynamics in ice storm-damaged forest ecosystems: Implications for nitrogen limitation theory. Ecosystems 6: 431–443.
Hruška J., Moldan F. & Krám P. 2002. Recovery from acidification in central Europe — observed and pre-dicted changes of soil and streamwater chemistry in the Lysina catchment, Czech Republic. Environ. Pollut. 120: 261–274.
Huber C., Baumgarten M., Göttlein A. & Rotter V. 2004a. Nitrogen turnover and nitrate leaching after bark beetle attack in mountainous spruce stands of the Bavarian Forest National Park. Water Air Soil Pollut. Focus 4: 391–414.

322 Kopáček et al. • Boreal enV. reS. Vol. 20
Huber C., Weis W., Baumgarten M. & Göttlein A. 2004b. Spatial and temporal variation of seepage water chemis-try after femel and small scale clear-cutting in a N-satu-rated Norway spruce stand. Plant and Soil 267: 23–40.
Högberg M.N., Högberg P. & Myrold D.D. 2007. Is micro-bial community composition in boreal forest soils deter-mined by pH, C-to-N ratio, the trees, or all three? Oeco-logia 150: 590–601.
Jonášová M. & Prach K. 2004. Central-European mountain spruce (Picea abies (L.) Karst.) forests: regeneration of tree species after a bark beetle outbreak. Ecol. Eng. 23: 15–27.
Kaňa J., Tahovská K. & Kopáček J. 2013. Response of soil chemistry to forest dieback after bark beetle infestation. Biogeochemistry 113: 369–383.
Kopáček J., Borovec J., Hejzlar J. & Porcal P. 2001. Parallel spectrophotometric determinations of iron, aluminium, and phosphorus in soil and sediment extracts. Commun. Soil Sci. Plant Anal. 32: 1431–1443.
Kopáček J., Cosby B.J., Evans C.D., Hruška J., Moldan F., Oulehle F., Šantrůčková H., Tahovská K. & Wright R.F. 2013a. Nitrogen, organic carbon and sulphur cycling in terrestrial ecosystems: linking nitrogen saturation to carbon limitation of soil microbial processes. Biogeo-chemistry 115: 33–51.
Kopáček J., Cudlín P., Svoboda M., Chmelíková E., Kaňa J. & Picek T. 2010. Composition of Norway spruce litter and foliage in atmospherically acidified and nitrogen-saturated Bohemian Forest stands, Czech Republic. Boreal Env. Res. 15: 413–426.
Kopáček J., Fluksová H., Hejzlar J., Kaňa J., Porcal P., Turek J. & Žaloudík J. 2013b. Chemistry of tributaries to Plešné and Čertovo lakes during 1998–2012. Silva Gabreta 19: 105–137.
Kopáček J., Kaňa J., Šantrůčková H., Porcal P., Hejzlar J., Picek T. & Veselý J. 2002a. Physical, chemical, and biochemical characteristics of soils in watersheds of the Bohemian Forest lakes: I. Plešné Lake. Silva Gabreta 8: 43–66.
Kopáček J., Kaňa J., Šantrůčková H., Porcal P., Hejzlar J., Picek T. & Veselý J. 2002b. Physical, chemical, and biochemical characteristics of soils in watersheds of the Bohemian Forest lakes: II. Čertovo and Černé Lake. Silva Gabreta 8: 67–94.
Kopáček J., Turek J., Hejzlar J. & Porcal P. 2011. Bulk depo-sition and throughfall fluxes of elements in the Bohe-mian Forest (central Europe) from 1998 to 2009. Boreal Env. Res. 16: 495–508.
Korkama-Rajala T., Mueller M.M. & Pennanen T. 2008. Decomposition and fungi of needle litter from slow- and fast-growing Norway spruce (Picea abies) clones. Microb. Ecol. 56: 76–89.
Kurka A.M. 2001. The use of cellulose strips to study organic matter decomposition in boreal forested soils. Boreal Env. Res. 6: 9–17.
Larcher W. 2003. Physiological plant ecology: ecophysiol-ogy and stress physiology of functional groups, 3rd ed. Springer, Berlin.
Likens G.E. & Bormann F.H. 1995. Biogeochemistry of a forested ecosystem, 2nd ed. Springer-Verlag, New York.
Majer V., Cosby B.J., Kopáček J. & Veselý J. 2003. Mod-elling reversibility of central European mountain lakes from acidification: Part I — The Bohemian Forest. Hydrol. Earth Syst. Sci. 7: 494–509.
Mauer O. & Palátová E. 2002. Mountain ash (Sorbus aucu-paria L.) root system morphogenesis. J. For. Sci. 48: 342–350.
McHale M.R., Burns D.A., Lawrence G.B. & Murdoch P.S. 2007. Factors controlling soil water and stream water aluminum concentrations after a clearcut in a forested watershed with calcium-poor soils. Biogeochemistry 84: 311–331.
Mikkelson K.M., Bearup L.A., Maxwell R.M., Stednick J.D., McCray J.E. & Sharp J.O. 2013a. Bark beetle infestation impacts on nutrient cycling, water quality and inter-dependent hydrological effects. Biogeochemistry 115: 1–21.
Mikkelson K.M., Dickerson E.R.V., Maxwell R.M., McCray J.E. & Sharp J.O. 2013b. Waterquality impacts from climate-induced forest die-off. Nat. Clim. Change 3: 218–222.
Miller H.G. 1995. The influence of stand development on nutrient demand, growth and allocation. Plant Soil. 168–169: 225–232.
Nelson D.W. & Sommers L.E. 1996. Total carbon, organic carbon, and organic matter. In: Sparks D.L. (ed.), Meth-ods of soil analysis, Part 3: Chemical methods, SSSA Book Series No. 5, SSSA, Madison, WI, pp. 961–1010.
Oulehle F., Chuman T., Majer V. & Hruška J. 2013. Chemical recovery of acidified Bohemian lakes between 1984 and 2012: the role of acid deposition and bark beetle induced forest disturbance. Biogeochemistry 116: 83–101.
Palviainen M., Finér L., Kurka A.-M., Mannerkoski H., Piirainen S. & Starr M. 2004a. Release of potassium, calcium, iron and aluminium from Norway spruce, Scots pine and silver birch logging residues. Plant and Soil 259: 123–136.
Palviainen M., Finér L., Kurka A.-M., Mannerkoski H., Piirainen S. & Starr M. 2004b. Decomposition and nutri-ent release from logging residues after clear-cutting of mixed boreal forest. Plant and Soil 263: 53–67.
Pedersen L.B. & Bille-Hansen J. 1999. A comparison of lit-terfall and element fluxes in even aged Norway spruce, sitka spruce and beech stands in Denmark. Forest Ecol. Manage. 114: 55–70.
Peel M.C., Finlayson B.L. & McMahon T.A. 2007. Updated world map of the Köppen-Geiger climate classification. Hydrol. Earth Syst. Sci. 11: 1633–1644.
Piirainen S., Finér L., Mannerkoski H. & Starr M. 2002. Effects of forest clear-cutting on the carbon and nitrogen fluxes through podzolic soil horizons. Plant Soil 239: 301–311.
Piirainen S., Finér L., Mannerkoski H. & Starr M. 2004. Effects of forest clear-cutting on the sulphur, phosphorus and base cations fluxes through podzolic soil horizons. Biogeochemistry 69: 405–424.
Puhe J. 2003. Growth and development of the root system of Norway spruce (Picea abies) in forest stands — a review. Forest Ecol. Manage. 175: 253–273.
Raffa K.F., Aukema B.H., Bentz B., Carroll A.L., Hicke J.A.,

Boreal enV. reS. Vol. 20 • Dynamics and composition of litterfall after bark-beetle outbreak 323
Turner M.G. & Romme W.H. 2008. Cross-scale drivers of natural disturbances prone to anthropogenic ampli-fication: the dynamics of bark beetle eruptions. BioSci-ence 58: 501–517.
Šantrůčková H., Krištůfková M. & Vaněk D. 2006. Decom-position rate and nutrient release from plant litter of Norway spruce forest in the Bohemian Forest. Biologia 61, Suppl. 20: S499–S508.
Svoboda M., Janda P., Nagel T.A., Fraver S., Rejzek J. & Bače R. 2012. Disturbance history of an old-growth sub-alpine Picea abies stand in the Bohemian Forest, Czech Republic. J. Veg. Sci. 23: 86–97.
Svoboda M., Matějka K. & Kopáček J. 2006a. Biomass and element pools of understory vegetation in the catch-ments of Čertovo Lake and Plešné Lake in the Bohemian Forest. Biologia 61, Suppl. 20: S509–S521.
Svoboda M., Matějka K. & Kopáček J. 2006b. Biomass and elements pools of the selected spruce trees in the catch-ments of Plešné and Čertovo Lakes in the Bohemian Forest. J. Forest Sci. 52: 482–495.
Svoboda M., Matějka K., Kopáček J. & Žaloudík J. 2006c. Estimation of tree biomass of Norway spruce forest in the Plešné Lake catchment, the Bohemian Forest. Bio-logia 61, Suppl. 20: S523–S532.
Swank W.T., Vose J.M. & Elliott K.J. 2001. Long-term hydrologic and water quality responses following com-mercial clearcutting of mixed hardwoods on a south-
ern Appalachian catchment. Forest Ecol. Manage. 143: 163–178.
Tahovská K., Kopáček J. & Šanrtrůčková H. 2010. Nitrogen availability in Norway spruce forest floor — the effect of forest defoliation induced by bark beetle infestation. Boreal Env. Res. 15: 553–564.
Tokuchi N., Ohte N., Hobara S., Kim S.J. & Masanori K. 2004. Changes in biogeochemical cycling follow-ing forest defoliation by pine wilt disease in Kiryu experimental catchment in Japan. Hydrol Process 18: 2727–2736.
Turek J., Fluksová H., Hejzlar J., Kopáček J. & Porcal P. 2014. Modelling air temperature in catchments of Čer-tovo and Plešné lakes in the Bohemian Forest back to 1781. Siva Gabreta 20: 1–24.
Ukonmaanaho L. & Starr M. 2001. The importance of leach-ing from litter collected in litterfall traps. Env. Monit. Asses. 66: 129–146
Vrba J., Kopáček J., Fott J. & Nedbalová L. 2013. Forest die-back modified plankton recovery from acidic stress. Ambio 43: 207–217.
Wardle D.A., Nilsson M.-C., Zackrisson O. & Gallet C. 2003. Determinants of litter mixing effects in a Swedish boreal forest. Soil Biol. Biochem. 35: 827–835.
Wermelinger B. 2004. Ecology and management of the spruce bark beetle Ips typographus — a review of recent research. Forest Ecol. Manage. 202: 67–82.