Embed Size (px)
Citation preview
PHYSICAL REVIEW E 89, 012601 (2014)
Dynamical heterogeneity in periodically deformed polymer glasses
Nikolai V. PriezjevDepartment of Mechanical and Materials Engineering, Wright State University, Dayton, Ohio 45435, USA
(Received 14 October 2013; published 9 January 2014)
The dynamics of structural relaxation in a model polymer glass subject to spatially homogeneous, time-periodicshear deformation is investigated using molecular dynamics simulations. We study a coarse-grained bead-springmodel of short polymer chains below the glass transition temperature. It is found that at small strain amplitudes,the segmental dynamics is nearly reversible over about 104 cycles, while at strain amplitudes above a few percent,polymer chains become fully relaxed after a hundred cycles. At the critical strain amplitude, the transition fromslow to fast relaxation dynamics is associated with the largest number of dynamically correlated monomers asindicated by the peak value of the dynamical susceptibility. The analysis of individual monomer trajectoriesshowed that mobile monomers tend to assist their neighbors to become mobile and aggregate into relativelycompact transient clusters.
DOI: 10.1103/PhysRevE.89.012601 PACS number(s): 61.41.+e, 61.43.Fs, 64.70.pj, 83.10.Rs
I. INTRODUCTION
The analysis and optimization of the mechanical per-formance of amorphous polymers are critical for variousindustrial and biomedical applications [1]. In the absenceof external deformation, the molecular motion slows downand a polymer glass gradually evolves towards an equilibriumstate in a process called physical aging, which affects themechanical properties of the material [2]. In turn, the effectsof physical aging can be removed by the application ofmechanical stresses or by heating above the glass transitiontemperature and then cooling back down [2]. According tothe well-known Eyring model, an applied stress lowers theeffective energy barriers for molecular motion and thus inducesyield and plastic flow in polymer glasses [3]. This simpledescription, however, does not include the effects of dynamicalheterogeneity, strain localization, and strain hardening [4,5].
It was previously demonstrated that the relaxation dynamicsin quiescent polymer glasses near the glass transition temper-ature becomes spatially heterogeneous [6–8]. In particular, itwas shown that the most mobile monomers form transientclusters whose mean size increases upon cooling towards theglass transition temperature [7]. In some cases, neighboringmonomers undergo large displacements and follow each otherin a string-like fashion [8]. Near Tg , the average string lengthwas found to be about two monomer diameters, althoughstrings of about ten monomers were observed [8]. As expected,polymer chain ends are more mobile; however, the mobilitydoes not necessarily propagate along the backbone of thechains [8]. More recently, the spatiotemporal distribution ofmonomer hopping events was investigated in an aging polymerglass quenched below the glass transition temperature [9]. Itwas shown that before merging into a single dominating clus-ter, the volume distribution of clusters of hopping monomersfollows a power-law decay with an exponent of two, and theclusters have slightly noncompact shapes [9].
The segmental mobility during constant stress or strainrate deformation of polymer glasses was recently studiedexperimentally [10–12] and using molecular dynamics (MD)simulations [13–18]. In general, it was shown that afterflow onset, the segmental mobility is strongly acceleratedand the distribution of relaxation times is narrowed underactive deformation. It was also found that before the onset of
flow, the deformation-induced molecular mobility is spatiallyheterogeneous, involving the formation of clusters of mobilemolecules [16]. By decomposing monomer trajectories intoa series of rapid hopping events, it was observed that thedistribution of the first hop and persistence times is narrowed,which indicates that the monomer relaxation dynamics isaccelerated during constant strain rate deformation [17,18].As a complimentary approach to probe glassy dynamics,the analysis of individual particle trajectories was also per-formed in amorphous materials under cyclic shear deformation[19–25]. By employing a novel cage decomposition algorithm,it was demonstrated that intermittent bursts of cage jumpsare directly correlated with the major structural relaxationevents in a two-dimensional dense granular media [19]. Itwas further pointed out that the relaxation process involvesspatially clustered cage jumps, which on long time scalesaggregate into avalanches [19].
In a recent study [21], the relaxation dynamics in a period-ically deformed binary Lennard-Jones mixture was examinedat a finite temperature well below the glass transition. Itwas found that the mean-square displacement developed anextended subdiffusive plateau associated with cage trapping,and the particle dynamics becomes spatially and temporallyheterogeneous. Furthermore, the dynamic correlation length,which was estimated from the peak of the dynamical sus-ceptibility, grows with increasing strain amplitude up to avalue that corresponds to the largest size of dynamicallycorrelated regions. One of the aims of the current study is totest whether these conclusions hold for nonentangled polymerglasses under cyclic loading.
In this paper, we investigate structural relaxation anddynamical heterogeneity in a bead-spring model of low-molecular-weight polymer glass that is subject to spatiallyhomogeneous, time-periodic shear deformation. We find thatat sufficiently small strain amplitudes, the system dynamics isnearly reversible, while at amplitudes above a few percent,monomers undergo irreversible cage jumps that becomespatially aggregated into relatively compact clusters. It willbe shown that at the critical strain amplitude, the dynamiccorrelation length exhibits a distinct maximum indicating thelargest size of regions over which the motion of monomers isspatially correlated.
1539-3755/2014/89(1)/012601(7) 012601-1 ©2014 American Physical Society
NIKOLAI V. PRIEZJEV PHYSICAL REVIEW E 89, 012601 (2014)
The rest of the paper is structured as follows. The de-scription of molecular dynamics simulations is presented inSec. II. In Sec. III, we examine the mean-square displacementof monomers, the autocorrelation function of normal modes,as well as the self-correlation function and dynamical sus-ceptibility, followed by the analysis of the monomer hoppingdynamics and the discussion of dynamic facilitation. Briefconclusions are provided in the final section.
II. DETAILS OF MOLECULAR DYNAMICS SIMULATIONS
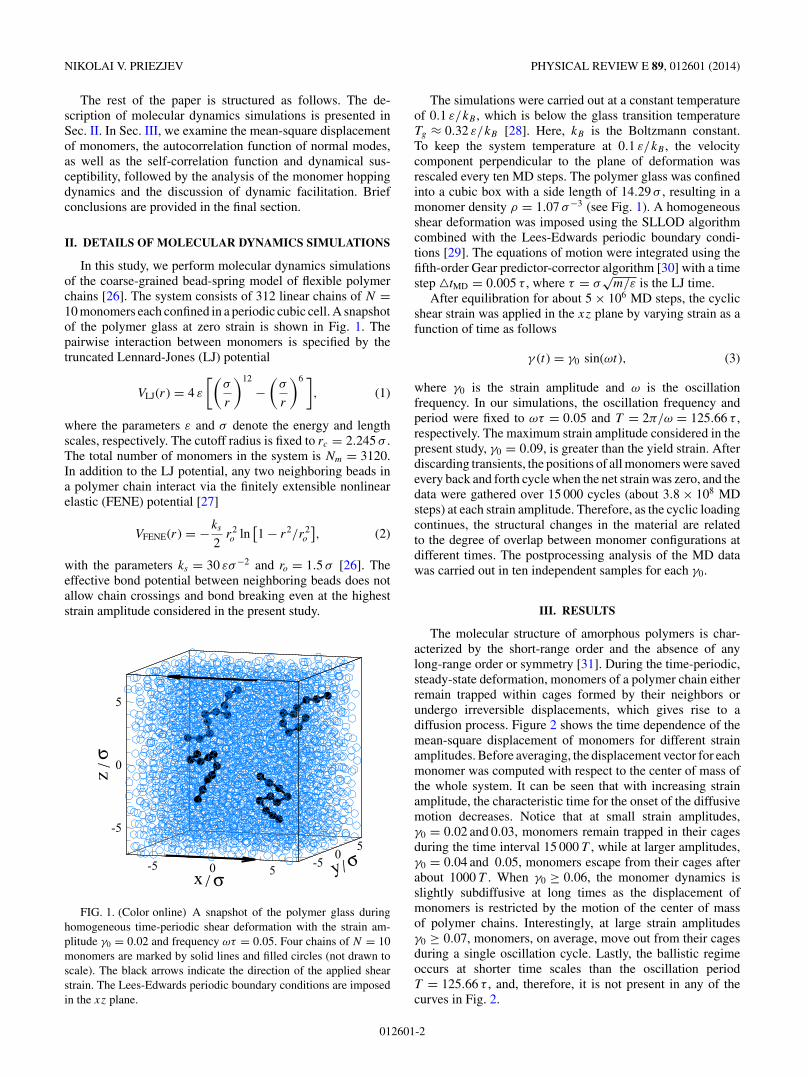
In this study, we perform molecular dynamics simulationsof the coarse-grained bead-spring model of flexible polymerchains [26]. The system consists of 312 linear chains of N =10 monomers each confined in a periodic cubic cell. A snapshotof the polymer glass at zero strain is shown in Fig. 1. Thepairwise interaction between monomers is specified by thetruncated Lennard-Jones (LJ) potential
VLJ(r) = 4 ε
[(σ
r
)12
−(
σ
r
)6 ], (1)
where the parameters ε and σ denote the energy and lengthscales, respectively. The cutoff radius is fixed to rc = 2.245 σ .The total number of monomers in the system is Nm = 3120.In addition to the LJ potential, any two neighboring beads ina polymer chain interact via the finitely extensible nonlinearelastic (FENE) potential [27]
VFENE(r) = −ks
2r2o ln
[1 − r2/r2
o
], (2)
with the parameters ks = 30 εσ−2 and ro = 1.5 σ [26]. Theeffective bond potential between neighboring beads does notallow chain crossings and bond breaking even at the higheststrain amplitude considered in the present study.
-5
0
5
-5 0 5x-5
05
y σ/
/
/
σ
σz
FIG. 1. (Color online) A snapshot of the polymer glass duringhomogeneous time-periodic shear deformation with the strain am-plitude γ0 = 0.02 and frequency ωτ = 0.05. Four chains of N = 10monomers are marked by solid lines and filled circles (not drawn toscale). The black arrows indicate the direction of the applied shearstrain. The Lees-Edwards periodic boundary conditions are imposedin the xz plane.
The simulations were carried out at a constant temperatureof 0.1 ε/kB , which is below the glass transition temperatureTg ≈ 0.32 ε/kB [28]. Here, kB is the Boltzmann constant.To keep the system temperature at 0.1 ε/kB , the velocitycomponent perpendicular to the plane of deformation wasrescaled every ten MD steps. The polymer glass was confinedinto a cubic box with a side length of 14.29 σ , resulting in amonomer density ρ = 1.07 σ−3 (see Fig. 1). A homogeneousshear deformation was imposed using the SLLOD algorithmcombined with the Lees-Edwards periodic boundary condi-tions [29]. The equations of motion were integrated using thefifth-order Gear predictor-corrector algorithm [30] with a timestep �tMD = 0.005 τ , where τ = σ
√m/ε is the LJ time.
After equilibration for about 5 × 10⁶ MD steps, the cyclicshear strain was applied in the xz plane by varying strain as afunction of time as follows
γ (t) = γ0 sin(ωt), (3)
where γ0 is the strain amplitude and ω is the oscillationfrequency. In our simulations, the oscillation frequency andperiod were fixed to ωτ = 0.05 and T = 2π/ω = 125.66 τ ,respectively. The maximum strain amplitude considered in thepresent study, γ0 = 0.09, is greater than the yield strain. Afterdiscarding transients, the positions of all monomers were savedevery back and forth cycle when the net strain was zero, and thedata were gathered over 15 000 cycles (about 3.8 × 10⁸ MDsteps) at each strain amplitude. Therefore, as the cyclic loadingcontinues, the structural changes in the material are relatedto the degree of overlap between monomer configurations atdifferent times. The postprocessing analysis of the MD datawas carried out in ten independent samples for each γ0.
III. RESULTS
The molecular structure of amorphous polymers is char-acterized by the short-range order and the absence of anylong-range order or symmetry [31]. During the time-periodic,steady-state deformation, monomers of a polymer chain eitherremain trapped within cages formed by their neighbors orundergo irreversible displacements, which gives rise to adiffusion process. Figure 2 shows the time dependence of themean-square displacement of monomers for different strainamplitudes. Before averaging, the displacement vector for eachmonomer was computed with respect to the center of mass ofthe whole system. It can be seen that with increasing strainamplitude, the characteristic time for the onset of the diffusivemotion decreases. Notice that at small strain amplitudes,γ0 = 0.02 and 0.03, monomers remain trapped in their cagesduring the time interval 15 000 T , while at larger amplitudes,γ0 = 0.04 and 0.05, monomers escape from their cages afterabout 1000 T . When γ0 ≥ 0.06, the monomer dynamics isslightly subdiffusive at long times as the displacement ofmonomers is restricted by the motion of the center of massof polymer chains. Interestingly, at large strain amplitudesγ0 ≥ 0.07, monomers, on average, move out from their cagesduring a single oscillation cycle. Lastly, the ballistic regimeoccurs at shorter time scales than the oscillation periodT = 125.66 τ , and, therefore, it is not present in any of thecurves in Fig. 2.
012601-2

DYNAMICAL HETEROGENEITY IN PERIODICALLY . . . PHYSICAL REVIEW E 89, 012601 (2014)
1 10 100 1000 10000t /T
0.01
0.1
1
10
100
r2/σ
2
Slope = 0.87ωτ = 0.05
γ0 = 0.06
FIG. 2. (Color online) The averaged mean-square displace-ment of monomers as a function of time for the oscilla-tion frequency ωτ = 0.05 and period T = 2π/ω = 125.66 τ . Thestrain amplitudes from bottom to top are γ0 = 0.02,0.03,0.04,
0.05,0.06,0.07,0.08, and 0.09. The straight black line with the slope0.87 is shown for reference.
The relaxation dynamics of polymer chains can be probedby analyzing the decay of the time autocorrelation function ofnormal modes [32,33]. For a polymer chain that consists of N
monomers, the normal coordinates are defined by
Xp(t) = 1
N
N∑i=1
ri(t) cospπ (i − 1/2)
N, (4)
where ri is the position vector of the ith monomer and p =0,1, . . . ,N − 1 is the mode number. The shortest and longestrelaxation times correspond to the last p = N − 1 and thefirst p = 1 modes. Correspondingly, the time autocorrelationfunction for the pth normal mode is computed as follows:
Cp(t) = 〈Xp(t) · Xp(0)〉/〈Xp(0) · Xp(0)〉, (5)
where the angle brackets denote averaging over initial timesand independent samples. The time dependence of the cor-relation functions C1(t) and C9(t) is presented in Fig. 3for the oscillation frequency ωτ = 0.05 and different strainamplitudes. The orientational dynamics of the whole chain isdescribed by the function C1(t). It is evident from Fig. 3(a),that the orientation of polymer chains is unaffected by theperiodic deformation for strain amplitudes γ0 ≤ 0.05, whilethey become fully relaxed for γ0 ≥ 0.07 during the reportedtime interval. As expected, the segmental dynamics is faster;e.g., the function C9(t) decays to nearly zero after 1.5 × 10⁴
cycles for the strain amplitude γ0 = 0.06, as shown in Fig. 3(b).These results indicate that with increasing amplitude of theshear strain deformation, the relaxation dynamics of polymerchains undergoes a transition at the strain amplitude of aboutγ0 ≈ 0.06.
The structural relaxation process in glassy materials of-ten involves spatial fluctuations of particle mobilities [34].During periodic deformation, the degree of overlap betweentwo spatial configurations of monomers is described by the
1 10 100 1000 10000t /T
00.20.40.60.8
1
C9(
t)
00.20.40.60.8
1
C1(
t)
(a)
(b)
γ0 = 0.06
γ0 = 0.06
FIG. 3. (Color online) The autocorrelation function of (a) p = 1and (b) p = 9 normal modes defined by Eq. (5) for the oscilla-tion frequency ωτ = 0.05 and period T = 2π/ω = 125.66 τ . Thestrain amplitudes from top to bottom are γ0 = 0.02,0.03,0.04,0.05,
0.06,0.07,0.08, and 0.09.
self-correlation function, which is defined as follows:
Qs(a,t) = 1
Nm
Nm∑i=1
exp
(−ri(t)2
2 a2
), (6)
where ri(t) = ri(t0 + t) − ri(t0) is the displacement vectorof the ith monomer during the time interval t , Nm is thetotal number of monomers, and a is the probed lengthscale [35]. Furthermore, it was previously shown that thedynamical heterogeneity can be quantified via the variance ofthe self-correlation function, or the dynamical susceptibility,which is given by
χ4(a,t) = Nm [〈Qs(a,t)2〉 − 〈Qs(a,t)〉2], (7)
where the averaging is performed over all initial times [36].An example of the correlation functions Qs(a,t) and χ4(a,t)is presented in Fig. 4 for the strain amplitude γ0 = 0.06.The contour plots clearly show that during the reported timeinterval the structural relaxation occurs on the length scale ofabout the cage size, and the dynamical susceptibility χ4(a,t)reaches a maximum at intermediate length and time scales, thusproviding an estimate for a number of monomers involved ina correlated motion.
To gain further insight into the relaxation process, we fix theprobed length scale to a value slightly larger than the cage size,i.e., a = 0.12 σ , and plot the self-correlation function Qs(a,t)versus time in Fig. 5 for different strain amplitudes. It is clearlyobserved that the structural relaxation occurs faster at largerstrain amplitudes. In particular, at small strain amplitudes,γ0 ≤ 0.02, the monomers remain trapped inside their cages,indicating that the system dynamics is nearly reversible duringthe reported time interval; while for γ0 ≥ 0.07, the systembecomes fully relaxed after about 100 cycles. Similar to thebehavior of the autocorrelation function of normal modesshown in Fig. 3, the transition from slow to fast dynamicsoccurs at the same strain amplitude γ0 ≈ 0.06. Also, the
012601-3

NIKOLAI V. PRIEZJEV PHYSICAL REVIEW E 89, 012601 (2014)
1
0.8 Qs(a,t)
χ4(a,t)
0.6
0.4
0.2
0 0 2 4 6 8
0.1
1029486887107126145
0.20.30.40.60.70.80.9
0 2 4 6ln(t/T)
a/σ
a/σ
8
1
0.8
0.6
0.4
0.2
0
FIG. 4. (Color online) The contour plots of the correlation func-tions Qs(a,t) (top) and χ4(a,t) (bottom) for the strain amplitudeγ0 = 0.06 and oscillation frequency ωτ = 0.05. The oscillationperiod is T = 125.66 τ .
results in Fig. 5 are consistent with the time dependence ofthe mean-square displacement curves reported in Fig. 2.
While analyzing the dynamical susceptibility at differentstrain amplitudes, we found that for each γ0 the locationof the maximum of χ4(a,t) depends both on a and t . InFig. 6, the dynamical susceptibility is shown as function oftime for the values of the parameter a at which χ4(a,t) hasa global maximum at a given strain amplitude. It is apparentthat with increasing strain amplitude, the position of the peakin χ4(a,t) is shifted to smaller times. The amplitude of thepeak, which reflects the typical number of monomers involvedin a correlated motion, has a pronounced maximum at the
1 10 100 1000 10000t /T
0
0.2
0.4
0.6
0.8
1
Qs(a,t)
ωτ = 0.05
γ0 = 0.07
γ0 = 0.02
γ0 = 0.06
γ0 = 0.05
FIG. 5. (Color online) The time dependence of the self-correlation function Qs(a,t) computed at a = 0.12 σ forthe oscillation frequency ωτ = 0.05 and period T = 2π/ω =125.66 τ . The strain amplitudes from top to bottom are γ0 =0.02,0.03,0.04,0.05,0.06,0.07,0.08, and 0.09.
1 10 100 1000 10000t /T
0.01
1
100
χ 4(a,t)
0.02 0.05 0.1
γ01
7
ξ4
ωτ = 0.05
γ0 = 0.09
γ0 = 0.07
γ0 = 0.06
FIG. 6. (Color online) The dynamic susceptibility χ4(a,t) de-fined by Eq. (7) for the oscillation frequency ωτ = 0.05 and periodT = 2π/ω = 125.66 τ . The strain amplitudes from bottom to top areγ0 = 0.02 at a = 0.06 σ , γ0 = 0.03 at a = 0.06 σ , γ0 = 0.04 at a =0.07 σ , γ0 = 0.05 at a = 0.08 σ , γ0 = 0.06 at a = 0.21 σ . The othercurves correspond to γ0 = 0.07 at a = 0.20 σ (dashed curve), γ0 =0.08 at a = 0.17 σ (dash-dotted curve), and γ0 = 0.09 at a = 0.19 σ
(dash-double-dotted curve). The inset shows the dynamic correlationlength ξ4 = [χmax
4 (a,t)]1/3 as a function of the strain amplitude γ0.
strain amplitude γ0 = 0.06. Notice also that at larger strainamplitudes, γ0 = 0.08 and 0.09, the maximum of χ4(a,t)occurs after the first cycle.
Assuming that correlated regions are relatively compact,the dynamic correlation length ξ4 can be simply estimatedfrom the peak value of the dynamical susceptibility, i.e., ξ4 =[χmax
4 (a,t)]1/3. Taking the maximum of the curves in Fig. 6, thevariation of the correlation length ξ4 as a function of the strainamplitude is presented in the inset of Fig. 6. Interestingly,the correlation length exhibits a distinct maximum at thecritical strain amplitude γ0 = 0.06. These results reveal thatthe transition from slow to fast relaxation dynamics reportedin Figs. 2, 3, and 5 is accompanied by the largest number ofdynamically correlated monomers.
We emphasize that a qualitatively similar behavior of thedynamic correlation length was observed in the previous studyon cyclic deformation of a binary Lennard-Jones glass [21].In that study, however, the maximum of the dynamicalsusceptibility χ4(a,t) was computed at the same value ofthe parameter a = 0.12 σ for all strain amplitudes, and theestimate of the dynamic correlation length was reported up toa strain amplitude at which the number of particles involvedin a correlated motion is maximum [21]. In general, the initialgrowth of the dynamic correlation length with increasing strainamplitude during oscillatory deformation is in marked contrastto the situation in glassy materials under steady shear, wherethe relaxation dynamics becomes more homogeneous withincreasing shear rate [37,38]. On the other hand, our resultsare consistent with the conclusions of the previous study byRiggleman et al. [16], who found that at a constant strainrate deformation of polymer glasses, the relaxation dynamicsis strongly heterogeneous below the yield strain, and after
012601-4

DYNAMICAL HETEROGENEITY IN PERIODICALLY . . . PHYSICAL REVIEW E 89, 012601 (2014)
the onset of flow, the dynamics becomes significantly morehomogeneous.
We now turn to a discussion of the monomer hoppingdynamics and the formation of transient clusters of mobilemonomers. Under cyclic loading, the motion of a monomerinvolves thermal vibration within the cage formed by itsneighbors and rapid hopping from one cage to another. Thecage jumps can be identified by a numerical algorithm thatwas originally introduced by Candelier et al. [19]. Thismethod, called the iterative barycenters separation, computesthe effective distance between two consecutive segments of amonomer trajectory. If this distance is larger than the typicalcage size then the trajectory is divided into two subsets. Usingthe iterative procedure, the trajectory of each monomer canbe decomposed into consecutive segments where the displace-ment of a monomer is localized within cages formed by itsneighbors [19]. This algorithm was used to locate cage jumpsin two-dimensional granular systems [19,39] and supercooledliquids [40]. More recently, the cage decomposition algorithmwas implemented to identify cage jumps “on-the-fly” duringthe simulation run, thus eliminating the need to store multipleparticle configurations [9].
In this work, the monomer trajectories were stored andanalyzed following the cage decomposition method proposedby Candelier et al. [19]. Similar to the implementation ofthe algorithm used in our previous study [21], we first takea part of the monomer trajectory, cut it in two adjacentsegments, and then compute the effective distance betweenthem. If this distance is less than the cage size rc = 0.1 σ forany two adjacent segments within the subtrajectory, then weconclude that the monomer remained within the cage. Usingthis brute-force procedure, we examined all time intervals10 T ≤ �ta ≤ 100 T for all monomer trajectories. We foundthat cage jumps typically occur during several cycles, and theycan be either reversible, when a monomer jumps back to itsprevious cage, or irreversible otherwise.
The total number of mobile monomers is plotted asa function of time in Fig. 7 for the strain amplitudesγ0 = 0.02,0.04, and 0.06. As is evident, in each case the
0 2000 4000 6000 8000 10000t /T
0
800
1600
Nc
0
40
80
Nc
0
40
80
Nc
(a)
(b)
(c)
γ0 = 0.02
γ0 = 0.04
γ0 = 0.06
FIG. 7. The total number of mobile monomers during cyclic de-formation with frequency ωτ = 0.05, period T = 2π/ω = 125.66 τ ,and strain amplitudes (a) γ0 = 0.02, (b) γ0 = 0.04, and (c) γ0 = 0.06.
-5
0
5
z
-505 x
-5 0 5y
(a)
/ σ
/σ
σ/
-5
0
5
z
-505 x
-5 0 5y
(c)
σσ
σ
/ /
/
-5
0
5
z
-505 x
-5 0 5y
(d)
σσ
σ
/ /
/
-5
0
5
z
-505 x
-5 0 5y
(b)
σσ
σ
//
/
FIG. 8. (Color online) Snapshots of mobile monomer configura-tions at strain amplitudes (a) γ0 = 0.03, (b) γ0 = 0.04, (c) γ0 = 0.05,and (d) γ0 = 0.06.
relaxation dynamics is characterized by sudden bursts inmobility separated by periods of quiescence. Note that at thestrain amplitude γ0 = 0.02, mobile monomers mostly undergoreversible jumps without any net displacement (see Fig. 2),while at γ0 = 0.06, the amplitude of bursts is about half ofthe total number of monomers in the system. Moreover, avisual inspection of snapshots indicates that mobile monomerstend to form clusters. Examples of instantaneous monomerpositions during intermittent bursts are shown in Fig. 8 fordifferent strain amplitudes. It can be seen that the clusters havea relatively compact structure, although several monomersappear to be isolated. Notice the formation of a large clusterat γ0 = 0.06 that spans the whole system. As the cyclicdeformation continues, the number of mobile monomers ina large cluster decreases typically to a few monomers thatundergo reversible jumps until the emergence of the nextcluster. Thus, the spatiotemporal clusterization algorithm [19]would identify only several large-size clusters, rendering theirstatistics unreliable.
A number of previous studies have explored the effect ofdynamic facilitation in glassy materials and concluded that aparticle has a higher probability to become mobile if it has aneighboring particle that was previously mobile [21,39,41,42].Here, we analyzed a trajectory of each monomer, using thecage decomposition algorithm described above, and identifiedcage jumps and time intervals when a monomer remainedwithin the cage. If a monomer escaped its cage and had at leastone nearest neighbor that was mobile sometime during thetime interval t preceding the cage jump, then this hop eventwas considered to be facilitated by the neighbors. The ratio ofdynamically facilitated mobile monomers and the total numberof mobile monomers is plotted in Fig. 9 as a function of the timeinterval preceding cage jumps. It can be observed that the ratioNf /Ntot increases rapidly and appears to saturate after about2000 cycles. With increasing strain amplitude, the fraction
012601-5

NIKOLAI V. PRIEZJEV PHYSICAL REVIEW E 89, 012601 (2014)
0 1000 2000 3000 4000 5000Δt /T
0.3
0.4
0.5
0.6
0.7
0.8
0.9
1
Nf/Ntot
ωτ = 0.05
FIG. 9. (Color online) The ratio of dynamically facilitated mo-bile monomers and the total number of mobile monomers asa function of the time interval preceding cage jumps. The os-cillation frequency is ωτ = 0.05 and strain amplitudes are γ0 =0.02,0.03,0.04,0.05, and 0.06 (from bottom to top).
of dynamically facilitated mobile monomers increases. It isperhaps not surprising that the ratio is nearly one for γ0 = 0.06because most of the monomers undergo cage jumps during thetime interval 104 T and thus influence the hopping of theirneighbors. The fact that the ratio is about 0.6 for the strainamplitude γ0 = 0.02, at which the self-correlation functionremains nearly constant (see Fig. 5), suggests that reversiblecage jumps are either spatially isolated or clustered in smallgroups at the same locations during the reported time interval.
IV. CONCLUSION
In summary, molecular dynamics simulations were car-ried out to investigate structural relaxation and dynamicalheterogeneity in a model polymer glass under oscillatory
shear strain. We used a standard bead-spring representationof linear polymer chains below the entanglement regime. Toprobe the microscopic relaxation dynamics, we examined themean-square displacement of monomers, the autocorrelationfunction of normal modes, as well as the self-overlap orderparameter and dynamical susceptibility.
It was found that the segmental mobility is unaffected by thetime-periodic deformation at small strain amplitudes, whereasthe relaxation time of polymer chains becomes less than abouta hundred oscillation periods at strain amplitudes above afew percent. By computing the peak value of the dynamicalsusceptibility, we estimated the dynamical correlation lengththat was found to exhibit a distinct maximum at the criticalstrain amplitude. Therefore, it was concluded that the transitionfrom slow to fast relaxation dynamics is associated with thelargest number of monomers involved in the correlated motion.
The postprocessing analysis of all monomer trajectories,based on the cage decomposition algorithm [19], indicated thatmobile monomers tend to aggregate into transient clusters. Itwas observed that the typical cluster size during intermittentbursts increases at larger strain amplitudes, which is inagreement with findings of the previous study on cyclic loadingof a binary Lennard-Jones glass [21]. The effect of dynamicfacilitation of mobile monomers by their neighbors becomesmore pronounced with increasing strain amplitude.
In the future, it would be instructive to perform a finite-sizescaling analysis of the dynamic correlation length in thevicinity of the critical strain amplitude and to explore theinfluence of oscillation frequency on the structural relaxationdynamics in polymer glasses.
ACKNOWLEDGMENTS
Financial support from the National Science Foundation(Grant No. CBET-1033662) is gratefully acknowledged. Com-putational work in support of this research was performedat Michigan State University’s High Performance ComputingFacility and the Ohio Supercomputer Center.
[1] H. E. H. Meijer and L. E. Govaert, Prog. Polym. Sci. 30, 915(2005).
[2] L. C. E. Struik, Physical Aging in Amorphous Polymers andOther Materials (Elsevier, Amsterdam, 1978).
[3] H. Eyring, J. Chem. Phys. 4, 283 (1936).[4] J.-L. Barrat and A. Lemaitre, in Dynamical Heterogeneities
in Glasses, Colloids, and Granular Media (Oxford UniversityPress, New York, 2011), Chap. 8.
[5] R. S. Hoy and M. O. Robbins, J. Polymer Science Part B:Polymer Physics 44, 3487 (2006).
[6] C. Bennemann, C. Donati, J. Baschnagel, and S. C. Glotzer,Nature (London) 399, 246 (1999).
[7] Y. Gebremichael, T. B. Schroder, F. W. Starr, and S. C. Glotzer,Phys. Rev. E 64, 051503 (2001).
[8] M. Aichele, Y. Gebremichael, F. W. Starr, J. Baschnagel, andS. C. Glotzer, J. Chem. Phys. 119, 5290 (2003).
[9] A. Smessaert and J. Rottler, Phys. Rev. E 88, 022314(2013).
[10] L. S. Loo, R. E. Cohen, and K. K. Gleason, Science 288, 116(2000).
[11] H.-N. Lee, K. Paeng, S. F. Swallen, and M. D. Ediger, J. Chem.Phys. 128, 134902 (2008).
[12] H.-N. Lee, K. Paeng, S. F. Swallen, and M. D. Ediger, Science323, 231 (2009).
[13] F. M. Capaldi, M. C. Boyce, and G. C. Rutledge, Phys. Rev.Lett. 89, 175505 (2002).
[14] A. V. Lyulin, B. Vorselaars, M. A. Mazo, N. K. Balabaev, andM. A. J. Michels, Europhys. Lett. 71, 618 (2005).
[15] G. J. Papakonstantopoulos, R. A. Riggleman, J.-L. Barrat, andJ. J. de Pablo, Phys. Rev. E 77, 041502 (2008).
[16] R. A. Riggleman, H.-N. Lee, M. D. Ediger, and J. J. de Pablo,Soft Matter 6, 287 (2010).
[17] M. Warren and J. Rottler, Phys. Rev. Lett. 104, 205501 (2010).[18] M. Warren and J. Rottler, J. Chem. Phys. 133, 164513 (2010).[19] R. Candelier, O. Dauchot, and G. Biroli, Phys. Rev. Lett. 102,
088001 (2009).
012601-6

DYNAMICAL HETEROGENEITY IN PERIODICALLY . . . PHYSICAL REVIEW E 89, 012601 (2014)
[20] D. Fiocco, G. Foffi, and S. Sastry, Phys. Rev. E 88, 020301(R)(2013).
[21] N. V. Priezjev, Phys. Rev. E 87, 052302 (2013).[22] C. F. Schreck, R. S. Hoy, M. D. Shattuck, and C. S. O’Hern,
Phys. Rev. E 88, 052205 (2013).[23] D. Hudzinskyy, M. A. J. Michels, and A. V. Lyulin, Macromol.
Theory Simul. 22, 71 (2013).[24] I. Regev, T. Lookman, and C. Reichhardt, Phys. Rev. E 88,
062401 (2013).[25] N. C. Keim and P. E. Arratia, arXiv:1308.6806.[26] K. Kremer and G. S. Grest, J. Chem. Phys. 92, 5057
(1990).[27] R. B. Bird, C. F. Curtiss, R. C. Armstrong, and O. Hassager,
Dynamics of Polymeric Liquids, 2nd ed. (Wiley, New York,1987).
[28] C. Bennemann, W. Paul, K. Binder, and B. Dunweg, Phys. Rev.E 57, 843 (1998).
[29] D. J. Evans and G. P. Morriss, Statistical Mechanics ofNonequilibrium Liquids (Academic, London, 1990).
[30] M. P. Allen and D. J. Tildesley, Computer Simulation of Liquids(Clarendon, Oxford, 1987).
[31] W. Paul and G. D. Smith, Rep. Prog. Phys. 67, 1117 (2004).[32] P. H. Verdier, J. Chem. Phys. 45, 2118 (1966).[33] J. Baschnagel and F. Varnik, J. Phys.: Condens. Matter 17, R851
(2005).[34] L. Berthier and G. Biroli, Rev. Mod. Phys. 83, 587 (2011).[35] O. Dauchot, G. Marty, and G. Biroli, Phys. Rev. Lett. 95, 265701
(2005).[36] S. C. Glotzer, V. N. Novikov, and T. B. Schroder, J. Chem. Phys.
112, 509 (2000).[37] M. Tsamados, Eur. Phys. J. E 32, 165 (2010).[38] H. Mizuno and R. Yamamoto, J. Chem. Phys. 136, 084505
(2012).[39] R. Candelier, O. Dauchot, and G. Biroli, Europhys. Lett. 92,
24003 (2010).[40] R. Candelier, A. Widmer-Cooper, J. K. Kummerfeld, O. Dau-
chot, G. Biroli, P. Harrowell, and D. R. Reichman, Phys. Rev.Lett. 105, 135702 (2010).
[41] J. P. Garrahan and D. Chandler, Proc. Natl. Acad. Sci. USA 100,9710 (2003).
[42] M. N. J. Bergroth, M. Vogel, and S. C. Glotzer, J. Phys. Chem.B 109, 6748 (2005).
012601-7