Embed Size (px)
Citation preview

Calhoun: The NPS Institutional Archive
Theses and Dissertations Thesis Collection
1959
Dynamic pressures and plating response in a
medium speed planing hull
Brooks, Richard B.
Massachusetts Institute of Technology
http://hdl.handle.net/10945/14084


ARY
m NAVAL POSTGRADUATE SCHOOl
MOKTER£Y tCALIFORKIA
K^^schoouMONTEReV.CA»394M101

U^fY KNOX LIBRARY


DYNAMIC PRESSURES AND PLATING RESPONSE
IN A MEDIUM SPEED PLANING HULL
by
RICHARD B. BROOKS, LIEUTENANT, U.S. COAST GUARD
B.S., U.S. Coast Guard Academy
(1952)
ROBERT T. CLARK, LIEUTENANT, U.S. NAVY
B.S., University of Illinois
(1952)
and
CARLOS QUINONES LOPEZ, LIEUTENANT COMMANDER, CHILEAN NAVY
Escuela Naval de Chile
(1947)
SUBMITTED IN PARTIAL FULFILLMENT OF THE REQUIREMENTS
FOR THE DEGREES OF NAVAL ENGINEER AND MASTER OF SCIENCE
IN NAVAL ARCHITECTURE AND MARINE ENGINEERED
at the
MASSACHUSETTS INSTITUTE OF TECHNOLOGY
June, 1959
m

pP3 &Ch£v£
<tz

ABSTRACT
DYNAMIC PRESSURES AND PLATING RESPONSE IN AMEDIUM SPEED PLANING HULL
*?
Richard B. Brooks, Robert T. Clark and Carlos Quinones-Lopez
Submitted to the Department of Naval Architecture and Marine Engineeringon 26 May 1959 in partial fulfillment of the requirements for the degreeof Naval Engineer and the degree of Master of Science in Naval Architectureand Marine Engineering.
The object of this investigation was to determine the response
of the bottom plating of a forty foot, Mark one, Coast Guard Utility
Boat to the dynamic pressures found in service. Two phenomena were
considered, the pressures due to slamming in ahead seas and the
response of the plating near the propellers to the dynamic effects
of the propeller field.
An attempt was made to correlate the maximum pressures observed
with the heave accelerations of the center of gravity of the boat.
Since the boat operates in a "semi-planing" condition, 5656 supported
by dynamic force and US by buoyancy effects at full power, the prob-
lem is extremely complex and no useful correlation was found. However,
the stagnation planing pressure was never exceeded during the tests.
As far as can be determined from other test results available, this
pressure forms an upper limit on the pressures which may be expected
in service.
From the pressures recorded, it was determined that the longitud-
inal pressure distribution peaked sharply. However, as has been
experienced by other experimenters, the exact location of the point of
stagnation pressure was not found exactly.
ii


The stress values in the panel having maximum slamming
pressures show that for this boat, the proper edge condition for
calculation of panel stress is that of simple support. There is
also evidence that a small amount of membrane effect is present*
For the maximum pressure recorded, the stress at the center of
the forward panel was calculated to be greater than the yield
strength of the material. This panel showed evidence of permanent
set at the center.
The pressures in the area of the propeller field were found
to be less than 2.5 psi and of a frequency equal to the propeller
blade frequency.,
The strains in the center of the after panel were recorded for
3 and 4-bladed propellers. The strain in both cases was found to
be no greater than 75 micro inches per inch, and the frequency of
vibration was equal to the propeller blade frequency. No signif-
icant increase of magnification factor was experienced in changing
from 3 to 4-bladed propellers.
The failures in the after panels can be attributed to attach-
ments to the panels which produce hard spots and introduce larger
stresses than those caused by water pressure vibrations.
Thesis Supervisor: J. Harvey EvansTitle: Associate Professor of Naval Architecture
iii


ACKNOWLEDGEMENTS
The authors wish to express their gratitude to the following
who gave generously of their assistance:
Professor J, Harvey Evans of the Department of Naval Architecture
and Marine Engineering, their thesis supervisor <>
CDR C. G„ Houtsma and the Officers of the Naval Engineering Section
at Coast Guard Headquarters, Washington, Do Co for their help in obtaining
the boat and test equipment and for their unfailing help and encouragement 6
The Officers of the Naval Engineering Section and of the Captain of
the Port Unit, First Coast Guard District, Boston, Massachusetts, for
making available their facilities for the test program.,
Professor Wo M Q Murray of the Department of Mechanical Engineering for
his help in solving the groups problems in strain gage techniques
*
IV


TABLE OF CONTENTS
Page
Title i
Abstract ii
Acknowledgements iv
Table of Contents v
List of Figures vii
List of Tables viii
I. 1. Introduction 4
2. Failures of 40 Foot Utility Boat in Service 6
3. Operating Conditions 7
II o Procedure
1. Original Plan of Attach 13
2, Actual Procedure Used 16
3» Instrumentation 21
IIIo 1. Results of Investigation of Planing Pressure 33
2# Discussion of Results 33
IV, 1, Results of Investigation of Plating Stressin Slamming 46
Discussion of Results 4.6
V» Results and Discussion of Dynamic Pressuresand Plating Response Near the Propellers
51
VI • Conclusions 53
VII. Recommendations 55


Page
VIII, Appendix 57
A. Summary of Test Runs 58
B. Data 60
!• Pressure Data Forward 60
2, Theoretical Stress Calculated FromPressure, Clamped Edges
3, Strain and Stress Data, Center ofForward Panel
4, Strain and Stress Data at Mid-Pointof Long Edge, Forward Panel
5» Peak to Peak Amplitude of Strainand Frequency of Vibration ofAfter Panel
6» Theoretical Stress from Pressure,Simple Support
7. Frequency Ratio for 3 and 4-BladedPropellers
62
65
74
79
80
7. Theoretical Stress from Pressure, g.Membrane
C. Calculations 82
1. Smooth Water Planing Pressure g~Distribution
2« Static Displacement 84
3. Buoyancy Data at 1950 RPM 86
4o Stresses from Pressures, Forward Plate 88
5. Stresses for Strain, Forward Plate 91
6. Natural Frequency of After Panel 92
93
D. Bibliography 94-
vi


LIST OF FIGURES
Figure Page
lo Views of Forty Foot, Mark 1, Utility Boat 1
2. Construction Plan (CG Plan 40-UT-0103-10) 2
3o Full Load Speed vs<> RPM Curves 3
4„ Trim Angle vs<> Power Setting 7
5« Theoretical Longitudinal Pressure Distribution 10
by Methods of NACA TN 2583
6o Sectional Area Curves at Rest and at Maximum Speed 11
7o Approximate Longitudinal Pressure Distribution at 20 Kts. 12
8o Strain Gage Locations on Panels 25
9» Calibration Curves of Pressure Transducers 26
10 o Typical Strain Gage Installation 27
11 o Data Recording Station 28
12o Bottom Sheet Expansion Showing Instrument Locations 29
13* Pressures and Accelerations for Typical Slams 30
13-A Pressures and Accelerations for Typical Slams 31
13-B Typical Time Variation of Impact Load 32
13-C Dynamic Load Factors 32
14.« Magnification Factor vs Frequency Ratio 40
15o Transverse Stress at Panel Center Calculated 40from Pressure, Simple Support
l6o Transverse Stress at Edge and Center of the Panel 41Calculated from Pressure, Fixed Edges
17o Transverse Membrane Stress at Edge and Center of 42Panel Calculated from Pressure
18 o Transverse Stress at Center of Panel 43
19o Maximum Princile Stress at Center of Panel 44-
20o Transverse Stress at Mid Point of Long Panel Edge 45
vii


LIST OF TABLES
Table Page
I Dynisco P3C50 Characteristics 21
II Sanborn Model 150 Characteristics 22
III Accelerometer Characteristics 23
IV Wave Velocities vs. Wind Strength 36
V Maximum Calculated Stresses for 49Different Edge Conditions
viii


1
I 1
FIG. 1
-1-


UNITED STATES COAST GUARD
ADOBEM REW.V TO:
CO M M AN DANTU. S. COAST GUARDHEADQUARTERSWASHINGTON 25. D. C.
ENE-21)82
Art VJ959
Fromi CommandantTo: LT Richard Brooks, USCG.,
c/o Prof. J. H. bVansDept. of Naval ArchitectureM.I.T,, Cambridge, Mass.
Subj: Thesis on UO-ft Utility Boat
Ref : (a) LT Brooks to ENE speedletter of 1 April 19!?9
1. Permission is granted to include a copy of Coast Guard DrawingNo. UO UT-0103-10 in your thesis, ar. requested by reference (a).
2. This drawing is forwarded in reproducible form as enclosure (l).
0. 0. HOXITSIIA
r0i niaiiJOTioH
End J (1) Reproducible of CG Dwg. No.
UO-UT-0103-10, (MK I)


UNITED STATES COAST GUARD
tDDREII REPLY -TO:
COMM AN DANTU. S. COA9T GUARDHEADQUARTERSWASHINGTON 25. D. C.
EIIE-2
s82 m ... iftj-rt
' From: CommandantTo: LT Richard Brooks, U3CG.,
c/o Prof. J. H. EvansDent, of Naval ArchitectureM.I.T., Cambridge, Mass.
Subj: Thesis on liO-ft Utility Boat
Ref : (a) LT Brooks to ENE speedletter of 1 April 1959
1, Permission is granted to include a copy of Coast Guard DrawingNo. UO UT-0103-10 in your thesis, as requested by reference (a).
2. This drawing is forwarded in reproducible form as enclosure (l).
Encl: (1) Reproducible of CG Dwg. No.
UO-UT-0103-10, (MK I)

FOUNDATION FOR AM/URC-7 CONVERTERFON DETAILS, »tl REP. NO. It ._
-MOULDED LINf OF DICK AT SIDE FOB DETAIL.* - ANCMI
lit REP. NO. I.
ItSA OOUBLER UNOE R .CHOCK t CLEAT
-*"MIN, AT BUTTS
INBOARD EDBE STRAISHT
BETKEEH BUTTS
\JDOAT HOOK BRACKETS FOR][DETAIL! SEE REF NO. I S [
L »'- 0"
EMERBENCY TILLER BR'KT. - P t f_FOR DETAIL5.SEE REF. NO. 15 _f
IB CO'BOTTLE FORBR KT. OETAIL.SEIREF NO. 4 .
2"X '/•
I '/Z ' STEMDECK SCUTTLE -SEE FLAN25-10' M.B.I. - S232 C.O.Y.
j.t*" x. B'l?l4"*\r«* LV ,TI
3"X>»"F.B 'I I
UNDER
|12 BA.IH-S S.K I
!UTlx^lB'F.B,ALUMi _.
/flJK"xV»V.i.»Lu|M.g
V*"X'/B-F
'-*!-. dHf -i
1 VB'ALUM f L. ft.
lV^" x'/S"FB ALU'
ill
\ \.V--.P«.B
SEE DETAILS, TANA ENDS
PORTABLE DECK PLAT ES,»LUMINUkFOR BOATS 40391 TO 4J4I5
INCl.
FOR HATCH DETAILS'SEC PLAN NO)4C'UT-IS02-IMK-I
Li ^£ iMAn-
i, lt«A. (U.S.S1 Fri'/I-X'/B-ALUH.F.*.STEEL I
*"X2"xW£^
\FOR DETAILS OF ENOINE FOUNOA
/"5EE 40' UT- 4302- I NX I-
: H-
CUTlL Cabin TOP
I
tf COMFASS
ENC. FON MORSECONTROLS,SEEREF. HO J!
! jyriVfS. M..s_TiFf. .ALUM. 3
| FIFE SUPPORT .,
IFOR OET SEEREF.KP*
i l'/2-X /*"F.i.
nfl |0"XiB" CLEAN OUT OPENINB,
F- tl
^rxi'/2_"xyiBXALJM. I
p Al JM. AMBLE,OFFSET>| x TOCO UNDER ALUM £.
*_ -/i!/*"X •/.*"_£,•. SJJFt, _ALUAL .
'? fJP
'&S*'* (TeEFASTENINS DETAij »t»-~- ICABIN FL. PLATE. j ^
FUEL OIL TANK t CLEAI40UT FORJOATS 40391 T0404I9 IHCLtOHLTl
(FuTToiL TANK t, CLEAHOUT FOR BOATS 404l<!
llO 40490 INCL.I0NLY1FOR OETAILS.SEEREF. HOT tB.
--FIXIO OEOK PLATES 4* PORTABLE OX. ft.
STOKES STRECHER BRACKETFOR DETAILS SEE RET NO. IS
HALF, I'/2" PIPE- SHEER LINE *
*-
!
I (Vc^f£_•«**<>_<_ L 1 — —l V2'STEM. '»
i
NOTCH FB. II
,/bottom 81
FRAMES 9,10 £.11.
I6T OAL. FUEL TANK FOR BOATS
40414 TO 404B0 INCL,
119 BAL.FUELTANKFOR BOATS 403*1 TO 40415 INCL
! t-X *££jiAJA, I I Vt" S T E H
DETAILS OF LIMBER HOLESSCALE J " . I*. 0"
TT~

\</z_rtrt_*o*RO_i_ i_
ziiiw^crrl 1;
CHINE LIN'
167 OAL. FUEL TANK FOR BOATS
40416 TO 40490 INC L
II* OAL.FUELTANKFOR BOATS »'
;hl/I-STIM.
-7, 65 BOTTOM HULL PLATINC- — -
FRAMES 9,10 CM
»/4»J^r I
CHINE LINE-
lfx'/»" FLB-.FJ,. I IW STEM
tefc^T S^f- i,W * --- 1»—- y r
DETAILS OF LIMBER
SCALE S" • I'- 1
1
14 1
A
4- »
y
^.J*V
I U^cJarFLej.BjI
I'/t STj -1 NH* *r
KEEL I 1 1
SHELL EXPANSION
SCALE y«"« I'-0"
rrr. OUTSIDE STEERJN6 CONTROL BOX, l
/li — ii~S.
JUFTINB SLINS, FOR DETAIL SL- FOR detail -see ref. no.b. 1 —-/ I -"^"~
"ISEE REF. NO. * I . /hi \^.
IB"
FROM STA. 10
CO* BOTTLE FOR BR'K'T.L-DETAILS, SEE REF. NO- 4_.
|
Lip"'.:jr'i i
BOX ENDS FLC'O. I"
II «A. IB 8, SI.091 ALUM.
. *yt'~^—'/•" * CAR
^^/^-^^"PIPE-IO'LG.fc^^ ENDS PLU08ED.
ENS.BOXOETAIL- SEE U.S.C.B.PLAN MO.
40UT-4I06-I-MK-I.
-J |.-^1_—/ /1 FOR DETAILS
.... ^BOX "FOR DETAIL'S,..^* „!,-< 401IUrJ»0J2^* JiK-
\P «, S - |'/4"PIPE BRACES
DETAILS SEE 40UT 2200" 2-MK 1
EMER. TILLER BRACKET.FOR DETAIL .SEE REF
NO. I S __l
I^""1'XF>/|
-TOWINS BITT 3"STdJPIPE -.25" WALL.
L Xcl%"_-%"_ !_N» lOt
[boat hook bracket, fotl[detail. see ref.no. isJ-
\'\ -*—
#
^". ..
! s'-o"
J|
I
|s'-IO"TO BASE LINE-^p.
flFT STRUT £, SHAFT TUBEi DETAIL SEE PLANUT 4S02- I M«-l
|I/S."X2"X^UV ALUM. L'
'""Nl CA(B.£S ) .0*1 ALUM.L.
FOUNDATION FOR AM/UfC -T CONVERTFOR DETAILS, SEE REF. NO. IK.
• plateIi=-rz^=-^
1
**
"Npipe SUPPORT_ _____^^ SEE RBf.# lO .
__ .^"7^m~~r;T "
—' %r
—
FRAME ISPACIN* 2'-
Vt"LIMBERHOLE
DRILL 1/2" DIA. LIMBER HOLE S-^r--
1c0mpass well.f0« detail see ref. no. 2
¥ -^[foundation -motorola^Ijbahs-for oejail-see
6UN LOCKERENC.MORSE CONTROL
j
TRANSOM SEAT, FOR OETAI
1
SEE REF. NO.S^i
LL^-OIA LIMBER HOLES
2" ENTRY
2'-0"FRAME SPACIN8 TO BHO. I 2 .
PROFILEiCALE S/4"»('-0"

MOULOEO LIRE OP DtCK »TSlO£ FOR DETAILS - ANCHOR 8T0WA8Etee »f. ho. s.
OUTSIOE LIMt OF nPE 8UAR0
I*" J- '• + "f * y»"FL« Ft- i|f*" •tkm 4
OUTSIDE STEER IN8 CONTROL BOX/FOR DETAILS SEE REF. HO.*.
CAMBER */4"PER FT.
(CUT||| CABIN TOP J
.,»/' COMPASSl
I
1 WELL SE«REF«I..
-da*-- >
i't/f r.tvi'f.ALUM.
| FIFE SUPFORT ..
FOR DET SEE REF O"
,•. STjFF, J.UI*,
t"» '/•"/Li F.S.- I '/E" STEM I
FOR HATCH DE TAILS, SEE f
PLAN 40UT'«O2-2MK I . !
CUN LOCKER,,
StE REF. HO 2
ING FOR MORSE -J
_ COHTROLS.SEE •
_ R E F. HO X .
FOUNO MOTOROLA R]I FOUNO MOTOROLA P>i]| . 1 itV
T 1RAN1SCEIEF <l'\ . .,., .»^
™NO.II I | ..*>*>
"« FsEE FASTEHIH* OETAB-i »*- |CA»IH FL. PLATE. ^^-
STOKES STRECHER (RACKETFOR DETAILS SEE REF. NO.IS.
It BA.OOUBLERUNDER CHOCK
1 S'X l,H'T. AT DECK
TUMBLEHOKE '
N
FOUNOATIOH FOR AH/URC-TCONVERTER, FOR OETAIL*^SEE REF. HO. IE. . S lr_
3/16" OIA.AL. RIVETS,
EXTRUDED SHAPE
DIE US. 4477
ALUMINUMJOINER DOORFOR DETAILS SEE
REF. HO. 14.
Ill *A. I.E. S. ALUM.!
riS" LAP JOINT 7l«"
_L - I
\s#£B
^1 '
V
SEE RIVETIHO DETAILS
BULKHEAD NQ-6
[BULKHEAO TORE WATERTIGHT
IUP TO 4' ABOVE BASE LINE
iJ^tTEJ«^_J»_l»y s-
KNUCKLE OR WELD .LINE
tf<>.-j"-t,".J
NOTCH FR.IN WAT Of
''bottom STIFFENER
LIMBER HOLES
DETAILS OF LIMBER HOLES
J.IMBER HOLES
* <T
iSTOKES STRETCHER BRACKET.1 FOR DETAILS SEE REF. HOIS.
CAMBER 3/4"PER FT- :l„_ i
r CAMBER 5/8"PER FT
7 i [*-5"STD PIPE
2" X |I/E" X 5/l6"ALUM L j
?—
J //«• 0»l"ALUM. BRKT. FLAN8E0 l"ON
.jf OUTBOARD ED8E. RIVETED WITHS/I«"STAINLESS STEEL RIVETS.
l/B"r N l"-E"-5/4" STO. PIPE
j t
i> mr-
ALUM. DECK HO
["RIVETS -3/l«" STAIRLESS STEEL
—\ B.HD « POIHT - SPACED 3/4"C'T'RS
^rcHROMELOCK TAPE BETWEEN
1STEEL t ALUMINUM.
IE GA. (U.S.S.)!£
STEEL i*
, TRANSOM SEAT
^ciz-3 -I" X r X 1/8" L.
-2/4"PIPE (FR.l E.3)
'j>i\A ^ SEE FASTEHINB DETAIL-? '
FRAME N2-3 ^'V<;
f}* ^O BULKHEAD N«
DETAIL -FLOOR «.. FASTEN
JSTIFFENERS OH Sf BO., FWO.SIDE
_ ll^XiyrxB/nVALUM.
«"X '/»•• FL«. F.I
i DE TAI L- DECKHOUSE FASTENING
SCALU FULL SIZE
rt«"J / LOOOR OHT, PORTSIOE
2 - "\ f° H{-? 4j»Kr
IELECTRIC PAHEL OPEHINB""tON ST'iO. SIDE ONLY
'SEE DETAILS DECK HOUSEI iFASTENINB.
_ .- TOE RAIL

-»/" STD. PIPEJ'
DETAIL- OK.
. -|
KNUCKLE OR
;> i/»"k
WIt O*. 10 S.S.I 1^
STEEL i«
TRANSOM SE»T
-i"« r X l/G" L.
v\ V^kiiNOTCH FR. IN WAT Of
^/BOTTOM STIFFENED
LIMBER HOLES _LI MBE R HOLES
^^i^LONG. STIFF. JU
DETAILS OF LIMBER HOLES
I I ALUM DECK HO.
JRIVF.TS. 3/l6" STAINLESS STEELV /V\-Vy~ "L»-
M 0-t POINT - SPACED S/4"C'TRS.
.TiH BOM E LOCK TAPE BETWEEN1_(TEEL t ALUMINUM.
SEE FASTENINB DETAIL-7i-j-\\ v
FRAME N*3 "^ [7* - ,. I
BULKHEAD N^O
11 H1
S/B"B HO MACH.SCRIC.B.S. - SPACED 2'/2
nFTAlL- FLOOR «.. FASTENING ON
CHROME LOCK TAISTEEL L ALUM. ft
33:==^fx '/B"FL«. F.i. I
1/!" STEM
: i
—==F
\DETAIL- DECKHOUSE FASTEN I
N
|COMP*SSWELL-rOR oeTAiL-[SEE REF. NO. 2.
JSTIFFENERS ON ST'BO., FWO.SIDE
r .i-xiVe'xS/ib'alum.
DOOR ONT port sideoily jLihr"
HINSEO HATCH
-•fc-J / r- os?;0N:
-
T« MJVJ
2"X l/B'FL».f.». I '/f STEM _1 / /
i1 5 v **x
'nK-. Wk,
Closing.PLATES 'it
DETAIL- CLOSING PLATES
'URC-7 CONVERTS
n
JC5MPAS5 WELL. \J
,£?R DETAIL SEE REF. NO. 2 . \<—? ^FOUNDATION-MOTOROLA.— IBAHR-FOR DETAIL-SEE
'
SUN LOCKERENC, MORSE CONTROL
l/B" ft. GAP.
^Va'pipc K)" LS. ENDS PLUGGED.
SEE DETAIL'
/
TRANSOM BEAT, FOR DETAILS, SEE RfF.NO.1. \)tx l<[_l**/»"
1
-, FILL SPACE BET. I" l_ .
f E SHELL WITH 12 GA. ft.
STATIC DRAFT IN FULLLOAD TEST CONDITION
X I'/» fLB.
v< X
si
3/4"PIPE AT
I
i:
4 DIA. EXTRUDE!rfAPe-WtllO.447 7. II
yjr 1
1
jg TJJj 17-t"';}l
L4"piPf ![T
r
i
II8A. B t»ALUM.
\ iTlectric panel openinbiTtOM ST'BD. SIOE ONLY
\ 'iff DETAILS deck house\WlttSTlNIN8.|L '?- TOE rail
I/ SEE RIVETING DETAIL
"
; SEE DETAIL SPRAY SHIEL0
o \.''f»- >C^<^ \l BULKHEAD TO BE WATERTIGHTH w.."M» ',--->
''^ ,/«•• |UP TO 4' ABOVE BASE LI ME
J
FRAME N5- 10 '/••', '"- 2 " \
LOOKINB aft.
-CAMBER >2" PER FT.
'/s-Nf-r r.
——>8"R . FLANGED i yt,"
l_>—EMER. TILLER BRV"T.
SEE REF?* 13.
Ill BA.IU J.S 1
STEEL
*,-««»]« W£l
FRAME NO 15.
PIPE SUPPORTSEE RET.* 10 .
'/B"ALU>4. FL50R f
-DRILL'/2"DIA LIMBER HOLES
. BTIFFENERS CUT FROi B" J.I. BEAMS.
. PLUG WELDS- 1/4" HOLES
f AT 2" CTRS.
ARR GT. C.
6 OUTSIDE ST
FUEL OIL Ti
«" ENTRY19 SO RPM
t'-0"FRAME SPACING TO BHO 12.
^°/t? ~^J*t.AT /?sro~k~PM
1 BASE LINE
V^ROD -*
TYPICAL SKEG DETAIL
;HINE DETAIL- AFT OF FR. 10
,. ARR GT. «10 AT FR.S.
MATERIAL SPECIFICATIONS
OUTSIDE STEM INS CONTROL BOX/FOR DETAILS SEE REF. NO.l.
CAMBER */4"PER FT.
HALF OF l'/t" STO.PIPE
FOUNDATION FOR AN/URC-7CONVERTER, FOR DETAI1-*
SEE REF. NO. 12.
,ALUMINUH
: JOINER DOORFOR DETAILS SEE
REF NO. 14.
^8TR. ND. MACH SCREWS (NAT. Fl HE THOB.
)
C.R.S. SPACE t '/f \
47«"X7lB"F.B
MATERIAL HAV T SPECIFlC AT IONS
STEEL PLATE 4TS"f» TYPE A CLASS b
CHROME LOCK TAPE BETWEEN! \
STEEL tALUM.NUM PLATES \
i%6' LAP JBINT718" !
ALUM RIVeT5-V4 CT»«.
K,,e-
—Li_»,
"t"X l'/2-« 5/i6"ALUm|lo'I'. »" IS"
.. „ N RIVETS-3/l«"STAINLE«S1 STEEL-B H. t POINT
SPACEO l'/2" CT'RS.
.DETAIL- DECK HOUSE STIFFENERS.
[C&&23
SEE RIVETINO DETAILS
BULKHEAD N^6JBULKHEAD TO BE WATERTICHlj
| UP TO 4 ABOVE BASE LINE J
fSTOKES 5TRETCHER BRACKET,
"IjJOR DETAILS SEE REF. NO I S.
CAMBER 3/4"PER FT— CAMBER 3/8"PER FT.
:09I"ALUM. BRKT. FLAN8E0 l"ONOUTBOARO EDGE RIVETEO WITHS/JS'STAINLESS STEEL RIVETS.
L. 1/rVl"-*" -3/4" STO. PIPE
^VlS'RIVETSSPACEO 3/4"
RIVETING DETAIL- BHDS. 4 E, 6
fry
rf £1V.
HOUSEjfOi.---
.081" ALUM PLATE8 e, S., II 8A .
DETAIL- DK. HOUSE EDGE
«HE LL IIOA.IUSS )
FRAMES t, BARS
FLOOR PLATES I8 6A(US.S.) ROLLED STEEL 4T S- 88 TYPE A CLASS b
'/S" ALUMINUM 47 A-ll CONDITION T
TUSINe STEEL-SEAMLESS 44 T-l TYPE I
ALUMINUM 61-S 44 T-SO
BULKHEADS 12 OAIU.S.S.) SHEET STEEL 4? S-29 TYPE A CLASS k
MCA 18*. » I ALUMINUM 81-S 4T A-12 CONDITION T
DECKHOUSE IIGAIB.aS.) ALUMINUM «I"S 47 A-12 CONDITION T
ENGINE BOX ALUMINUM Sl-S 47 A" 12 COHOITIONT
RETAIL - FLO C
TS -AFT. BK 6
,^A'X^ST'F.B. T(
O.EC* -—3
HALF OF I'/fSTD. PIPE
MOLOED LINE
DETAIL OF DECK EDGE
. 3/4"x)b"F.B TOE RA
HALF OF l'/2''> 3TD PIPE
DETAIL OF DECK EDGE
DETAIL OF STIFFENER
SHAFT TUBE EXTENOS FOR D OF BHD.DETAILS ON PLAN NO. 40 UT - 4302" I -MK. I .
BHD N2 12
>/l6" STAINLESS STEEL•OINT - SPACEO 3/4"c'T'RS
)CK TAPE BETWEENALUMINUM.
CK HOUSE FASTENING
12 GA.(U.S.S.)£
-I" X r X l/B" L.
/*•—J/4"PIPE (FR.2E.3)
\^v< SEE FASTENIN8 DETAIL-r
wy-t*
1/8',.w
i ^j~cFRAME N2-3 ^>rj" ]*.' BULKHEAD N«
JL. p-rr-^X »/•"«. HO. MACH. SCREWS (NAT. FINE THDS-)pS BS \ C.R.S. "SPACED 2'/2" STAS6ERED
DFTAIL- FLOOR It. FASTEN I NG ON t. AFT OF FR.I5
FLOOR R. . CUT OUT IN WAY OF FRAME
[COMPASS WELL- FOR OETAILS-[SEE REF. NO. 2
. ,
4"X|'/2"X fyt'K *.12*/_FROM FR. I TO BHO 4
DOOR OtlV PORT Slot""1
ONLY ttjj.S'-i" -i
NOTCH OVER FRAMES
'\ IELECTRIC PANEL 0PENIN8
TlftM ST'BD. SIDE ONLT
i\ tec details deck house'A/Ieastehin*.
. *8" R. NO. MACH. SCREWS (NAT. Fl N E TH08I C.R.S., SPACED t'/2'
ALUM. FLOOR t-
CHROME LOCK TAPE BETWEENSTEEL « ALUM PLATES.
p* »"X2"X 5/ie"X t.44~~i_.

OUTBOARD EDGl. linn" "S/I«"STAINLESS STEEL RIVETS
.081 ALUM PLATE8 « S-, II 04
-5/4" STO. PIPE DETAI L - DK. HOUSE EDGE DETAIL OF STIFFENER.
Vl6" STAINLESS STEELPOINT - SPACEO '/4"CTRS
OCK TAPE BETWEENALUMINUM.
V;
a/4"PIPE [FI.IESI
SEE FASTENIN8 OETAIL"
12 GA.IUS.S.)!"
STEEL ,x
OETA Itt
I \
FRAME N2-3i/e'^r-r i
-rx r x i/»" l.
3* '' W.L
!«K_
BULKHEAD N«
J/B"R.HO HACK. SCREWS (NAT. FINE THOS)C.R.S.- SPACED2'/2" STAGGERED
CHROME LOCK TAPE BETWEENSTEEL C 6. ALUM . PLATE .
DETAIL -FLOOR ft. FASTENING ON t AFT OF FR.I5
CHROME LOCK TAPE BETWEENSTEEL G ALUM. ft
FLOOR I . CUT OUT IN WAT OF FRAME'/•" R.H.MAC H. SCR EWSINAT FINE THOSJC.R.S.
"-r^v» SPACEO • ".
»"Xl!«'X ^l*"K M2*/_FROM FR. I TO BHO 4.
JsTIFFENERS ON ST>D., FWD.SIDE-~^_ [f^X lV2"X 3/1*" ALUM.
CK HOUSE FASTENING
'/* tvj'-t"
FRAME N^ 10
OOOR ON r PORT SIDE
IIONLY _ _ ,,,,..
I ''-'"
1 s/*" xs"x J/i*'t;-
i/i" i
M-«" Y
NOTCH OVER FRAMES
S/a'dia. BOPAIOEBI \l SHAPE -Dtt NO 4477.
—>6"R FLANGED I l/f
II—EMER.l ILLER BR'KT.
lltA. It*ALUM.
\ SEE DETAILS OECX HOUSE,\£lFASTEMIM«.|V— -"^- TOE RAIL
SEE RIVETIN* OETAIL
BEE OETAIL SPRAT SHIELD
BULKHEAD TO BE WATERTIGHTIUP TO 4 ABOVE BABE LIME
FASTENING DETAIL- CABIN FLOOR ft.
KNUCKLE =l I
OR WELJ1 -«HPT"
-CAMBER >2"P£R FT.
NORMAL TO HULL
DETAIL- SPRAY SHIEL
3/*"R HO. MACH SCREWS (NAT. FINE THDSt
1
- lA"
CHROME LOCK TAPEBETWEEN STEEL L-« ALUM. R. .
DETAIL-FLOOR fL FASTENINC
,I'/t", ryt f. bet. n t it
SUPERSEDES PLAN NO. 40UT-0I03-5 "M K
II *A.(US.S >
STEEL
II H lr-.L
">
~—=^<FRAME N» 15.
''«-/
1TIFFENERS CUT FROM«" J.I. BEAMS.
\ , ••PLUG WELDS -V* HOLES12 GA. • r AT 2" CTRS.
if I***4 ^ROO
TYPICAL SKEG DETAIL
J^jFO&lx wl.
/r
,.,
CHINE DETAIL- AFT OF FR. 10
HAL F S IZE
REFERE-NCE
ARR'GT. E. DETAILS OF TRANSOM SEATIN FWD. COMP.
ARRGT 10E TAIL5 Of ANCHOR STOWAGEA* 2
LOCATION OF IS CO BOT TLEOET. OF INSPECTION PLATESIN PILOTH
,SE C LITTER COMP'T.ARR'GT. e DETAIL CONTROL BOX FORniiTSinf STEERING.
FR. HO 12.
DETAILS- CLEANOUT IN TOP OF FUELOIL TANKS-
LI FTI NG SLING
ARR'GT. •. DETAILS OF PIPE SUPPORTAT FR. 3. .
FOUNDATION FOR MOTOROLA TRANSMITTER
FOUNDATION FOR^N/URC-7 CONVERTERARR'GT t DETAILS OT MIS'CLSTOWAGE BRACKETS^ARR'GT t, OETaTL* OF CABIN DOOTlIN BHO 6
,e plans1
C.G. HQS DR. NO. C.G YARD DR NO.
40 UT - 3S0* - 1 . | 40 UT -3S08-C0Y- 1.
40 UT -1 107 - t
40 UT - 1603 - 2
40 UT - 9300 - 1
40 UT 1107 -C.GY.- 1
40 UT - 2 60S- CAY- I.
40 UT -8300-Cfl.Y.- 1
40 UT • 1 1 0* - 2. 40 UT • 1106 "COY- 2.
40 UT - 1200 • T. 40 UT 2 200-C.8Y- 8.
40 UT - SSOI " T. 40 UT 3 601 -C.8Y- t.
40 UT - 3601 • «.
40UT- 8201 - 1 MX. I-C
40 UT- 4823 - 8.
40 UT - 6T0I " 3
40 UT • 8T0I " 4.
40 UT - 3601 - CG.Y - 1.
40 UT II06-C8.Y" 4.
40 UT 6701 -CGY- 3
40 UT 6701 -CGY- 4
40 UT " 3000 - 1.
40 UT - 1802 - 4.
40 UT 3000- CAT- 1.
40 UT -1603 -c -S.T- 1.
A **,, -> c* s CH'HGCC BOTTOM £ TWK TC "7.6 5 BET'AJEFK 3 F\NO.OF ,,,._." ''
' ' P-R./J AMD S7EKN. " -
.
A ADDED LIST OF REFERENCE PLANS AND MODIFIEO DRAWINGH-l-91 f(iK TO A6REE WITH SAME JM.».
t .. ., 'i .—.., 'i ' r-
U a COAST GUARD HEADQUART D.C.
NAVAL ENGINEERIf1 1
40' STEEL UTILITY BOAT
CONSTRUCTION PLAN
. G. DRAWINC NO.
4CUT-0I03-I0 moqi'.


FIGURE 3-3-


I„- INTRODUCTION
1. The medium "semi-planing" hull is coming into wide use in both
commercial and government service., The particular design used in the
tests reported here is the Forty Foot Steel Utility Boat, Mark 1,
designed and manufactured by the United States Coast Guard. In addi-
tion to the over two hundred boats in Coast Guard service throughout
the world, many have been built for use by other governmental agencies
and by foreign governments.
Though each individual unit of a design of this type is relatively
inexpensive, the large number constructed seems to justify a field test
program to alleviate the paucity of reliable data concerning the behavior
of such craft in rough water.
Some experimental work has been accomplished in the. United States
and abroad, (/,), (3), ( lof" concerning the response of high speed
planing hulls to rough water.. In general these boats have been full
planing hulls of the MPTW or high speed aircraft rescue launch typeo
The Forty Foot Utility Boat operates in a "shadow zone" between fully
planing and displacement type hulls o Buoyant effects are still
significant even at full power and the boat behaves in a different
fashion than the pure planing hullo
The test program to be proposed attempts to determine the dynamic
"slamming" pressures in critical areas of the bottom plating of the
hull, the vertical accelerations present in slamming and the stresses
induced in selected bottom panels. In addition, an attempt is made
to ascertain the response of plating near the propellers to the
dynamic pressures developed during smooth water operation of the boat.
-( ) indicates literature citations as noted in the bibliography
-4-


It is hoped that a careful analysis of the observed phenomena
will provide additional information to the maritime industry concern-
ing the behavior of a type of boat which is becoming increasingly
important in both naval and commercial applications©
-5-


2. Failures of the 40 Foot Utility Boat in Service'
In 1957 Coast Guard Headquarters requested a listing of hull
failures in the forty foot boat from each Coast Guard Districto
The thesis group obtained these reports and attempted to pinpoint
structural trouble spots in the boat. In general two areas of
trouble have been notedo The bottom aft, near the propellers, has
been plagued with small cracks and the bottom area forward near
station 3 has failed occasionally under severe service. Several
detail locations have caused trouble in the pasto These include
struts and fuel tank bulkheads <> These failures were due to
design details and have been corrected by alterations,.
It was impossible to pinpoint the exact location of cracks
in most of the failure reports submitted. However, trends indicate
that the plating over the propellers has been the critical area in
the boat. Measured plating strains in this area, however, are
quite low*
-6-


3* Operating Conditions
The forty foot utility boat is of semi-planing type. At
maximum speed only a portion of the boat's displacement is support-
ed by dynamic pressures. In order to obtain a more realistic picture
of the actual operating condition of the boat, it was necessary to
separate the dynamic and buoyant effects.
During the test series a record of planing angles was kept for
various speeds*
TRIM ANGLE
REFERRED TO
AT REST TRIM(DEGREES)
7
6
5
f\
4sp
s^j^~ R t
4.A
5
€/
/
2
1 ts/t
.-^s s
6 7 8 9 1 11 12 13 U 15 16 17 18 19 2000
POWER SETTING (RPM)
FIG. J,
The planing angle never levels off as speed increases to the
maximum available power point.
At maximum power (1950 RPM, 19.5 knots) the planing angle is
approximately 6 degrees.
The boat' s entry point at speed was determined from photographs
taken from another boat. Knowing the entry point and the trim angle
it was possible to establish a mean planing waterline*-7-


During the tests the wave pattern at the side of the boat was observed
as was the planing draft at several points. From this information a
modification to the mean planing waterline was made (figo 2 ). After
establishing the immersed portion of the boat the integrated volume
was found as was the center of buoyancy at maximum speed
„
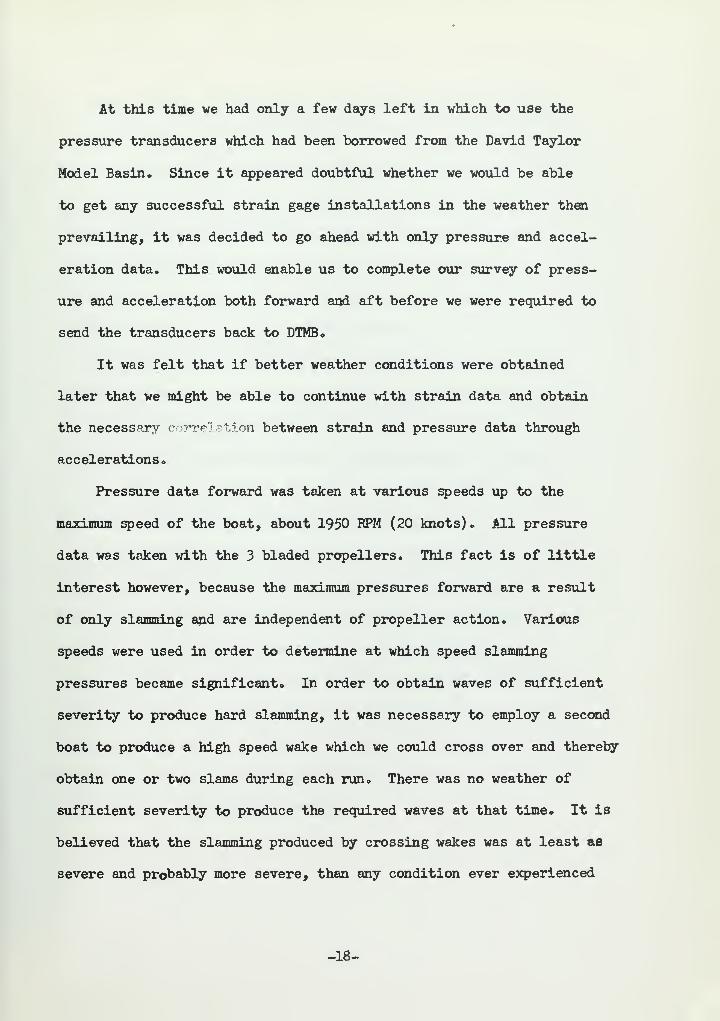
The calculated displaced volume was 9502 lbs„ with the center of
buoyancy 12ol3 ft„ forward of the transom. The calculated dynamic
force was determined from this and from the measured displacement of
the boat (21,518 lbs ) as 12,016 lbs* with the center of planing pres-
sure 22o37 fto forward of the transom* The boat in its service full
load condition at maximum speed is thus supported by approximately 56%
planing pressure and 1+1$ by buoyant effects
•
The theoretical pressure distribution for an equivalent flat plate
was calculated (29) • This gave a center of pressure 22«53 ft. forward
of the transom and a theoretical planing force of 17,032 lbs* The
center of pressure agrees rather closely with the observed conditions.
By superimposing the plot of buoyant forces at maximum speed with
the theoretical pure planing pressure distribution, corrected to give
the required total dynamic force, an approximate pressure distribution
over the bottom at maximum speed was obtained ( fig* 5 ) „ Though the
quantitative information on which this plot is based is subject to
many assumptions, it is felt that the general picture obtained is
entirely reasonable
o
At a nominal planing angle of six degrees from the at rest posi-
tion the bottom area in the vicinity of station 3 (the area in which
the dynamic pressure is by far the highest) has approximately this angle.
-8-


Because of the pronounced "tuck 911 of the bottom aft this angle is
almost zero in the area from amidships afto Thus the lift gener-
ated here is less in proportion than if it also had a steeper
planing angle o This has th& effect of moving the, center of pres-
sure slightly forwardo No account of this was taken in obtaining
this rough pressure pictureo Ear our purposes the keel line has
been assumed as essentially parallel to the baselineo
The boat was designed for utility- service o_ Considering the
Skene powering coefficient (28) as an adequate index of perfor-
mance, this boat scores 182 compared to 205 for the 40 fto MK 1
Navy rescue boat (3 ) and 214- for the_ proposed Offshore 44 ft.
Boat discussed by Profo Alan Murray (IS )o
This is not surprising considering that the 40 fto Utility
Boat was originally designed for a gross weight of 17,760 lbs.
The higher service gross weighty of course, has a detrimental
effect on planing performance*
N XM STALLED Pos*/ER(v\.p.)
-9-


FIGURE 5
-10-


5ECT/0NAL AREA -FT.FIGURE 6 =11=


FIGURE 7


II, -PROCEDURE
1. Original Plan of Attack
In order to make full scale structural tests on a boat of
this size, it was considered to be mandatory to do the installa-
tion of instruments and to take the necessary data during the
summer months in good weather. It would have been impossible to
have done further testing in this type of boat after the final
date on which we took strain data, November 22, primarily because
of the limitations on personnel operating the boat under adverse
weather conditions.
It was originally intended to install pressure transducers,
strain gages, and accelerometers at the same time so that simul-
taneous data could be taken in each bottom panel tested. Acceler-
ometers were to be installed near the bow and at the center of
gravity of the boat. This would allow the determination of both
heave and pitch.
In the forward part of this type of boat, in the vicinity of
station 3, there had occurred fractures in the bottom plating which
indicated that slamming had probably resulted in pressures high
enough to produce stresses in the bottom plating exceeding the
fatigue limit of the material or even the ultimate strength of
the material.
-13-


In order to determine whether these fractures were actually
caused by fatigue or by exceeding the ultimate strength of the
material, it was proposed to install strain gages in the panel in
which maximum slamming pressure occurs. Gages were to be installed
at the mid-length of panel edges, and a rectangular strain rosette
was to be installed at the panel center to determine the direction
and magnitude of principal stresses at this pointo
The point of maximum pressure for the maximum impact condition
was estimated to be U0% of the length from the bow, from the work
of N. H. Jasper as given in DTMB Report C-175. (declassified). This
enabled us to estimate the transverse and longitudinal position of
the point of maximum pressure for the slamming condition. Pressure
transducers were to be installed at the center of the panel closest
to the estimated point of maximum pressure, and at the centers of
the adjacent panels forward, aft, inboard, and outboard. This would
give a coverage of 4# inches longitudinally, and 32 inches trans-
versely in order to determine the location of the point of maximum
pressure experimentally
o
After it was determined which panel actually contained the
point of maximum pressure, and therefore which panel had the highest
loading as a whole, it wa& planned to install the strain gages in
this panel and take simultaneous readings of pressure, strain, and
acceleration. This would allow us to determine the relation between
acceleration and pressure, and between pressure and stress. In this
way we expected to verify or disprove the relation between accelera-
tion and pressure as given by No H. Jasper in DTMB Report C-175
-14-


(declassified). This report gives this relation for the motor
torpedo boat YP-110, which is a 75 foot boat of 109,000 pounds
displacement. It was expected that we might be able to deter-
mine the proportionality factor between maximum pressure and
maximum acceleration for our type of boat so that in the future
the bottom pressures could be predicted for boats of similar
size and form, simply by knowing the speed of the boat and the
acceptable acceleration which operating personnel could endure.
By measuring the dynamic pressures and the resulting
strains during slamming it was expected that dynamic load
factors could be established for boats of this size, form and
type of construction which would be valid for the type of press-
ure variation curve recorded. These dynamic load factors were
to be determined by comparison of measured stresses and stresses
calculated from the measured pressure applied as if it were a
static load. Dynamic load factors determined can be compared
to those given by J. M. Frankland in DTMB Report 481.
In the area of the propeller field there have been a large
number of bottom plating failures, both at the connection of the
shaft struts to the bottom and at the edges of the panels. It
was planned to investigate the pressures and stresses in these
panels in order to determine whether these failures were pro-
duced by exceeding the fatigue limit as .a result of pressure
variations produced by the propellers, or whether they were
produced by localized high stresses due to hard spots at the
strut connections to the panels and the vibration transmitted
-15-


from the propeller shaft. Both 3 and U bladed propellers were to
be used to determine the effects of each on the magnitude of stress
developed in the bottom panels at various engine RPM. Calculations
of the expected natural frequency of the bottom panels in the area
of the propellers showed a natural frequency of about 138 cycles per
second for simply supported edges and 25U cycles per second for fixed
edges. It was therefore expected that there might be a large increase
in the magnitude of stress in these panels near the maximum speed of
the boat with 3 bladed and U bladed propellers. In service, these
boats had been operated with only 3 bladed propellers and it was not
previously determined whether any noticeable reduction of vibration
would result from the use of U bladed propellers
„
2. Actual Procedure
The point of maximum pressure at maximum slamming condition
was estimated to be 26 feet forward of the transom. The center of
the pressure transducer array was therefore located at the center
of the panel at station 3, and the second panel outboard from the
centerline. The other four transducers were located in the four
adjacent panels. Test runs were made then to determine whether our
calculated location of maximum planing pressure was in the panel
showing the greatest recorded pressure. The center transducer of
the array gave consistently higher pressure readings than the other
four during slamming. It was therefore decided that the strain gages
would be installed in this panel since the maximum stresses could be
expected here.
-16-


In the area of the propeller field three panels were chosen
in which to install pressure transducers. These were the panels
closest to the propeller which had no structure attached such as
struts or patches. These panels are shown in fig.12. No signif-
icant pressure differences were found between the three panels
checked. This data was taken with 3 bladed propellers because
these were the only ones available at that time.
Because of the prevailing good weather at that time, it was
decided that it would be better to complete the data in the after
panels first because they were in the open area exposed to the
weather. The forward data could be done with poor weather because
those panels are located in the cabin. There was no necessity for
taking any forward and after data at the same time because they
are produced by entirely separate causes, slamming and propeller
field pressure variations, respectively^
Several attempts were made to install SR-4- paper strain gages
in the after panel. However, each of these installations was
either wet down by rain before the Duco cement had cured, or was
rendered unreliable by the humid and salty atmosphere before the
gages could be waterproofed. The result of every attempt at
installation of strain gages was unreliable gages which varied
seriously in their resistance readings©
-17-

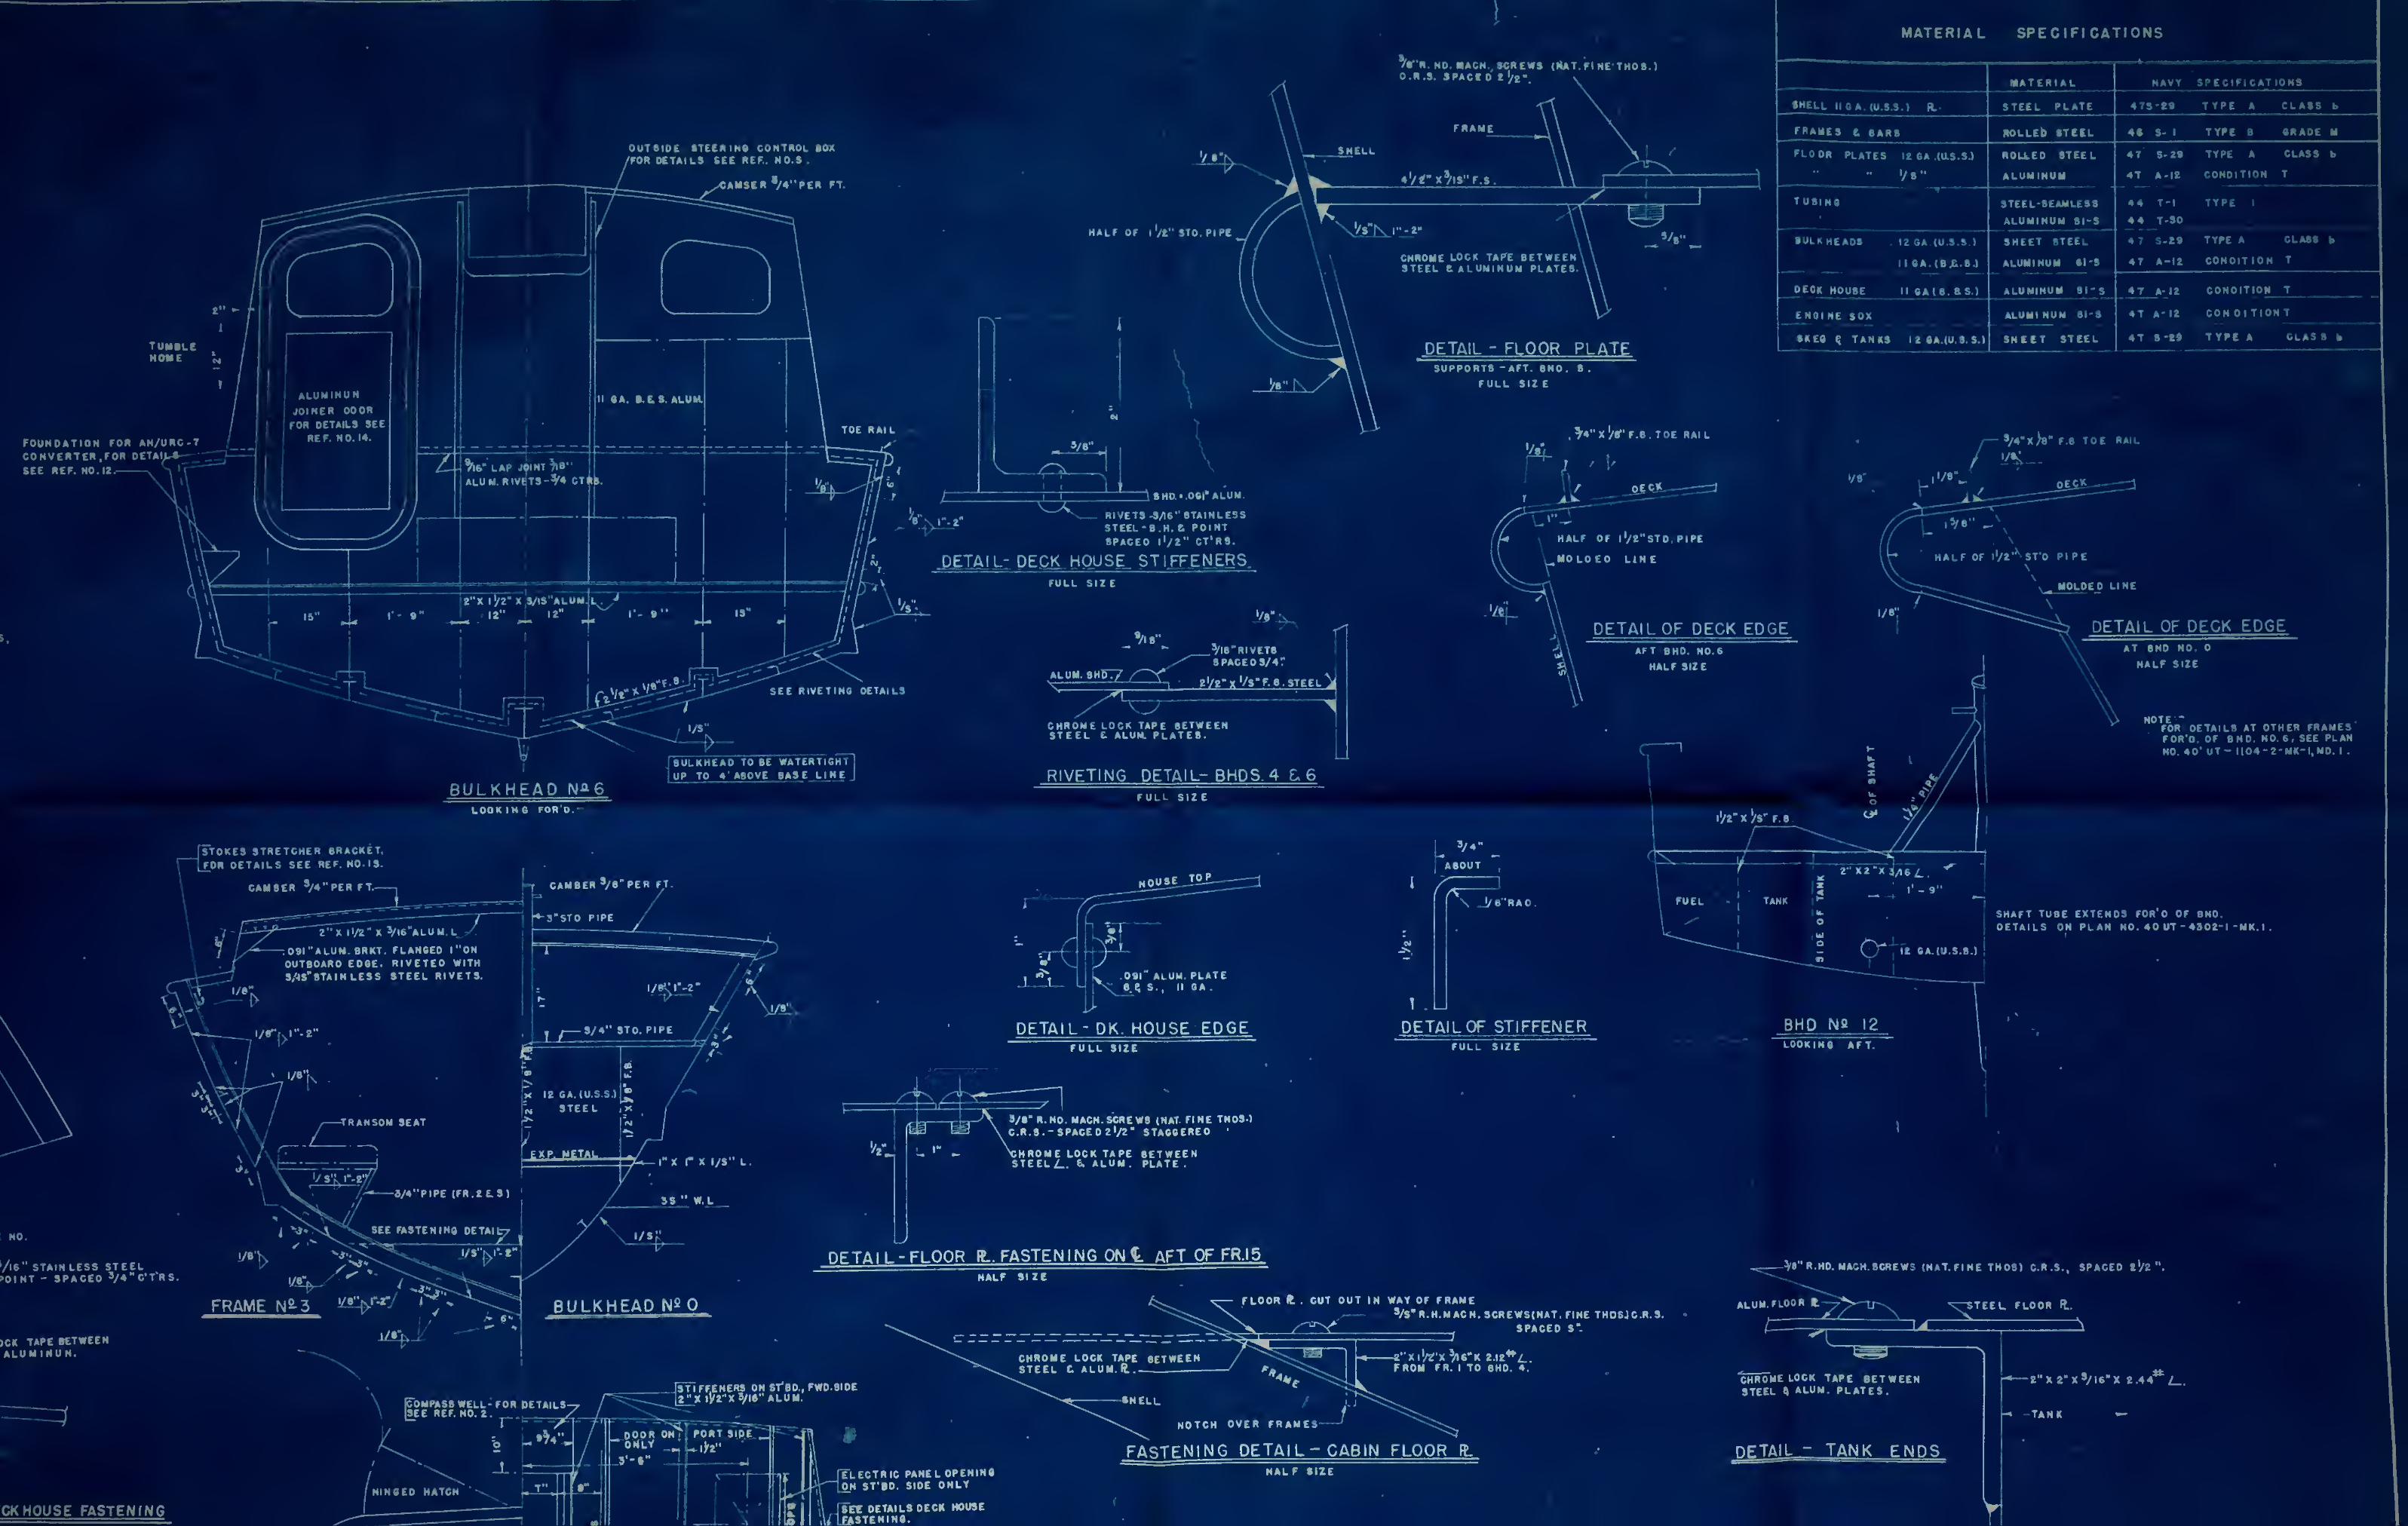
At this time we had only a few days left in which to use the
pressure transducers which had been borrowed from the David Taylor
Model Basin. Since it appeared doubtful whether we would be able
to get any successful strain gage installations in the weather then
prevailing, it was decided to go ahead with only pressure and accel-
eration data. This would enable us to complete our survey of press-
ure and acceleration both forward and aft before we were required to
send the transducers back to DTMB.
It was felt that if better weather conditions were obtained
later that we might be able to continue with strain data and obtain
the necessary correlation between strain and pressure data through
accelerations.
Pressure data forward was taken at various speeds up to the
maximum speed of the boat, about 1950 RPM (20 knots). All pressure
data was taken with the 3 bladed propellers. This fact is of little
interest however, because the maximum pressures forward are a result
of only slamming and are independent of propeller action. Various
speeds were used in order to determine at which speed slamming
pressures became significant. In order to obtain waves of sufficient
severity to produce hard slamming, it was necessary to employ a second
boat to produce a high speed wake which we could cross over and thereby
obtain one or two slams during each run. There was no weather of
sufficient severity to produce the required waves at that time. It is
believed that the slamming produced by crossing wakes was at least as
severe and probably more severe, than any condition ever experienced
-18-


in actual service* Accelerations were measured near the bow and
at the longitudinal position of the forward panel being testedo
The acceleration at the center of gravity could not be measured
because this would have required installation of the acceler-
ometer in the engine compartment.. The vibration in this area
would preclude any accurate determination of accelerations.
The acceleration of the center of gravity of the boat can be
determined from the two accelerations measured.
The pressure data aft was taken in calm waters because the
effects of slamming were found to have no appreciable effect on
the pressures found in the after panels. In order to determine
at exactly what speed the greatest vibration occurred in these
panels, data was recorded at speeds from 1,000 to 1,950 RPM of
the engines with both 3 and 4- bladed propellers.
After completion of the pressure data both forward and aft,
further investigation was begun on means of installing strain
gages in the bottom panels so that they would give reliable
readings. It was at this time that the pressure sensitive
cement, Eastman 910 was being introduced (see page 23). With the
aid of this cement, which enabled the installation and use of the
SR-4. paper gages within a matter of minutes, we were able to install
the gages, make all necessary connections, and take data in one day
with reliable and consistent results.
-19-


The pressure transducers had already been returned to DTMB
by this time so that we were unable to make simultaneous readings
of pressure and strain* The strain readings were therefore taken
simultaneously with accelerations. The accelerations were taken
at the same points as they had been taken during the pressure data
runs. It was expected that the relation between strain and press-
ure would be established through common accelerations.
The strain data was taken on November 22, 1958. At that time
the temperature was about 45°F. and there was 20 knots of wind,
causing severe spray conditions at any speed over about 5 knots.
In this temperature it would have been practically impossible to
have installed strain gages with slow setting cement on the cold
bottom panels. However, with the Eastman 910, it was possible to
install, waterproof, and take data with the strain gages within a
matter of minutes
•
-20-


3« Instrumentation
The choice of instruments for this project was dictated almost
entirely by availability. The instruments obtained were among the
finest of their type but their inherent limitations, especially the
limited number of recording channels, made data correlation
difficulto
Pressure Pickups
Eight pressure pickups were obtained. These were DYNISCO P3C50
transducers manufactured by the Dynamic Instrument Company of
Cambridge, Massachusetts.
TABLE I
DYNISCO P3C50 CHARACTERISTICS
Range: 0-50 lbs. (absolute)
Natural Frequencyg 6000 cps.
Standard Resistance* 600 ohms.
The range of the available pickups was larger than that required.
This resulted in a lower than optimum electrical output to the strain
gage amplifiers
o
Amplifying and Recording Equipment
The amplifying and recording equipment was the integrated
Model 150 system developed by the Sanborn Company of Waltham,
Massachusetts
o
-21-


TABLE II
SANBORN MODEL 150 CHARACTERISTICS
The following apply to the complete system including:
Preamplifier, Power Amplifier and Galvanometer when usedas an integrated system
Frequency: - 100 cps<> (90% response for 10 mm deflectionat 100 cpso)
Rise Time: 5 milliseconds to full scale
Linearity: Essentially linear over the middle fourcentimeters of chart width
Sensitivity: lo0 millivolt per centimeter as used
Drift: Less than f 01 mm, per hour
A six channel Model I56-IOO-BWP recorder was available for use*
Two different types of preamplifier were used during the course
of the tests o Stabilized DC Amplifiers, Model 150-1800, were
used for pressure and acceleration measurements while Model 150-1100
Carrier Preamplifiers were used for strain gage measurements.
The fact that the total number of channels available at any one
time was only six was a distinct disadvantage during the tests. It
would be advantageous to consider multichannel aircraft flight test
gear for future work of this type because of its lighter weight for
a greater number of recording channels
»
Strain Gages and Associated Equipment
The strain gages used were standard Baldwin-Lima-Hamilton
types A3 and ARlo No difficulty was found in using these gages
once they were installed. However, it was found to be impossible
-22-


to install these gages under the damp conditions prevailing in
the bilges of the boat* By the time the adhesive had dried, the
gages picked up enough moisture to be useless. This difficulty
persisted during the first portions of the test series. Since it
was impractical to remove the boat from the water for strain gage
installation an alternate method was used for mounting the gages
o
Professor W„ Mo Murray of Massachusetts Institute of Technology,
suggested the use of Eastman 910 cement, then just coming on the
market* This pressure sensitive cement dries in a matter of
seconds and allows immediate waterproofing of the strain gage,,
The group experienced marked success in the use of this adhesive.
It is superior for marine test work of this sort* The gages were
waterproofed with several thin layers of melted paraffin. As a
precautionary measure the completed installations were covered
with petroleum jelly. The gages remained waterproof after two
weeks under stagnant salt water<>
Accelerometers
Heave accelerations were measured at frame and frame 4-1/2
by the use of Statham AccelerometerSo The characteristics of the
accelerometers follow:
TABLE III
Location: Frame Frame 4-1/2
Model: Statham StathamA6a-l*5-350 A5a-l«>5-35
Serial: 3024 6429
ExcitationVoltage:
6 volts 6 volts
Ranges £ 1°5 g
-23-
+ 1.5 g


Power Supply
Since the forty foot utility boat has a direct current
electrical system, an auxiliary generator was procured to
furnish 115 volt, 60 cycles, AC power. The generator used was
an ONAN 2»5 KW portable. Trouble was experienced in shielding
the cable run from the transducers to the amplifiers against
stray AC from the generator. Careful attention must be paid
to grounding the equipment^ especially in a case such as this
where the generator is, of necessity, close to cable runs.
-24-


J16
/l
I
TOT TO SCAIP
[GORE S
STRAIN GAGE LOCATIONS ON PANELS
INSTRUMENTED FOV: STBAIN MEASUREMENTS
Gages marked "S6M are mounted on thestructural member adjacent to the plate.


FIGURE 9


FIGURE 10TYPICAL STRAIN GAGE INSTALLATION


25OM
CO
3oW MCD go oeg
«u


—oj
-ro
•^
o
-ts
-t-OO
IMI
CO
eCM
BW Sp oM en
fe BOM
CO
PQa;o
co
J3Sh
PCO
uo
-pa02
-P
<v
co
m
U o
PM P<
CO CO
CD CD
-P -Po o
CD CD
T3 t3
P4 CO
-29-


RUN #14 1950 RPM
"ZERO" PRESSURE REFER3 TOSMOOTH WATER PLANINGPRESSURE
0-1 (J.2. 0^> OA 0-5 O.(o
SECONDSRUN #23 1800 RPM
PRESSURES AND ACCELERATIONSFOR TYPICAL SLAMS
-30-


"ZERO" PRESSURE REFERS TOSMOOTH WATER PLANING- PRESSURE
RUN #21 1950 RPM
PRESSURES AND ACCELERATIONSFOR A TYPICAL SLAM
FIG- 13-*
-31-


FIGURE 13~B
IMPACTLOAD
-X j;
/ \ P/ \ °
\ V
t- *b - \* >
1
TT!ETYPICAL TIM VARIATION OF IMPACT LOAD
FROM REF. ( 10)
2
\ \
\ \^i~-°DYNAMIC
LOAD' FACTOS
\
\\\\\\
0.09
*-- = 1.0
DYNAMIC LOAD FACTORS FOR IMPACTSOF TYPE SHOWN IN FIGURE 13-B
FROM REF. (10) -32-


Ill • Results of Investigation of Planing Pressures
1* Typical results of the Slamming Pressure Investigation are
presented in figures 13 and 13a, The zero pressure in these
figures refers to steady planing pressure.
Additional information is included in the appendices.
2. Discussion of Results
The pressure signature during slamming was obtained for the
area in which maximum slamming pressures were expected. This
location was determined by N. H. Jasper (10) and GDR Peter Ducane
(4.) , as somewhat aft of the stagnation point in steady planing.
The entry point at maximum speed was observed at approximately
station 2 during pre-instrumentation runs. Three pressure trans-
ducers were arranged fore and aft in the centers of the panels
bounded by frames 3 and U f U and 5> 5 and 6, and by stringers 1 and
2 on the port side of the boat (fig. 1 2 ). The pressure transducer
at the center of this longitudinal array read consistently higher
pressures during slamming than those forward and aft of it. A
transverse array was then installed with the center longitudinal
gage as the center of the transverse array. Again the center gage
read the highest pressures during slamming. These results determine
the area of maximum slamming pressures under the service full load
condition at frame 4-1/2 midway between keel and chine.
-33-


Steady planing pressures were very low in the area of max-
imum slamming pressures. The maximum steady planing pressures
at gage P5 (fig. 12, ) was 0.3 psi« This tends to confirm the theory
that the stagnation pressure on the planing hull exists in only a
very narrow area and falls off very quickly as one goes aft along
the hullo CDR DuCane experienced essentially the same phenomena
in his tests on a high speed rescue launch (4.) •
Two recording accelerometers were installed* These were
arranged to read vertical accelerations at frames and 5-l/2»
Both of these accelerometers were attached to the most rigid
member available in the area, pipe supports near the center line
of the boat. Since the number of recording channels was limited,
two distinct types of run were made; the first recording the two
accelerations and the longitudinal pressure array, the second
recording the accelerations and the transverse pressure array.
Three typical slams are shown in figures 13 and 13-A. These
runs were all made at or near the maximum power setting. Under
1800 EPM there was no rapid pressure build-up to a sharp peak and
no sensation of shock was felt by the operator. At 1800 and 1950
EPM, however, there was unmistakable evidence of the slamming
phenomena
«
The duration of the main pressure peak of the slams was
surprisingly short, of the order of 0.3 seconds. This pressure
peak builds up and decays quickly as it moves aft along the hull.
-34-


Though the separation between gages P5 and P6 is only two feet, the
maximum pressure observed at P6 rarely exceeded fifty percent of that
observed at P5° Likewise the transverse pressure during slamming
tended to drop off rapidly as one progressed toward either keel or
chine from the midpointo
After the maximum pressure peak developed, the boat experienced
an upward acceleration o This contained a marked pitch component
since the area of high pressure was well forwardo The accelerometer
near the point of maximum pressure never exceeded a value of O„35go
The data showed no direct correlation between the measured
accelerations or the acceleration of the boat' s center of gravity
and the maximum pressures obtainedo Slamming is a local phenomena,,
The local effects of pressure upon the plate are not transmitted
directly to the main structure of the boato The inherent resiliency
of the boat' s structure may prevent these local effects from being
transmitted throughout the boato
The stagnation pressure at 20 knots is 7o88 psio The maximum
pressure obtained during our runs was 6<>5 psi above atmospheric As
far as can be determined from the reports available (^ ) (10), neither
Jasper or DuCane exceeded stagnation pressure in their experiments a
Since the most severe slamming conditions are observed when run-
ning into ahead seas, where the wave crests themselves have consider-
able velocity, the stagnation pressure should be calculated consider-
ing the relative velocity between wave crest and the boato
-35=


TABLE IV
WAVE VELOCITIES IN KNOTS IN OPEN SEAS
IN RELATION TO WIND STRENGTH1
Wind Duration of wind in hours
Velocity 10 20 30 IP
10 kts 9d llo5 13o6 Ho
5
20 kts 13o3 17o6 20o3 22o4
30 kts 17o0 22ol 25o8 28o8
40 kts 20o3 26o7 30*9 34° 5
i- from Wind, Waves & Breakers
HO 602, Table 15, p° 32o
Table IV shows the wave velocities assuming open sea conditions
and adequate fetch for full wave development Conditions as severe
as these are rarely encountered in the sheltered waters in which
the Utility Boat is usually operated An example of the severity
of open sea conditions for planing hulls has occurred on the
southern New England Coast where a forty foot boat has experienced
severe failure of the bottom plating in the vicinity of station 3 o
Boats operating in similar service in areas of less well
developed waves have experienced no failures
Since slamming is a very localized phenomena, it is extremely
difficult to obtain direct correlation with the gross movements of
the boato The limited number of runs made during this test series
makes a statistical approach a practical impossibility Q
*- Discussion with Mr Q Carl Alberg, Naval Architect, First Coast
Guard District, Boston, Massachusetts
-36-


In his tests on a high speed pure planing hull, No Ho Jasper
suggests a mathematical approach for obtaining a relationship
between maximum pressure developed in slamming and the gross heave
acceleration of the boato His solution is based on knowledge of
the approximate pressure distribution on the bottom of the hull
during slamming.. Knowing this, it is possible to solve the
equation:
dx + tydx
P force per unit length at any point
W weight per unit length at any point
y heave acceleration at any pointo
Though this leads to an adequate solution for a pure planing
hull, it is an oversimplification of the problem when applied to
semi-planing hulls o A more rigorous look at the basic equation
shows?
P(x,t)dx =\ g (x,t)dx-|-\ W»(x,t)dx+\ f(x,t,t»)dx
r
i
P(x,t) = force per unit length at any point on the bottomFor a semi-planing hull this includes significantamounts of buoyancy, pure planing pressure, andimpact pressure due to slamming
W = the effective weight of the boat per unit length at anypoint and includes added mass due to hydrodynamic effectSo
f = a damping force which acts to shift the phase between theforce on the hull and the resultant acceleration o Thedamping force appeared highly important in our tests sincethe maximum of the pressure pulse was observed very near thepoint of zero acceleration (maximum velocity)
o
-37-


This slow planing hull where buoyant effects are appreciable
presents a highly complex problem which does not lend itself to
the type of solution proposed by N. H. Jasper for fully planing
hulls. It depends for its success upon a knowledge of the force
pattern upon the bottom of the boat in slamming. Since this is
a very complex phenomena in semi-planing hulls it is our feeling
that it cannot be extended to hulls of different characteristics
unless extensive research is done concerning the pressure distri-
bution found in service.
LKP = W(l '+
f-)
. w<ii£>9
KL
where KP L = area under the curve of pressure (i.e. the total
force applied to the bottom)
.
-38-


X-f'
III
A- 3BLADE PROP. - 5/MPLE SUPPORTB-3BLADEPROE- CLAMPED EDGE E
C-4ELADEPR0R -SIMPLE SUPPORT\
D- 4 BL ADE PROR-CLAMRED ED6E |=
FIGUBE H


o a os" a/o o,/f 0,20 0.2s o,3o o,3& o,jo oa^ o<fo sbc,
+o,tf
E
-0,55
SLAM D- I ISO RPM- 20KT
O.OS' 0,/0 Ol^ 0,20 0,26 0,30 0,3S~ 0.40 0,4^ O.SO SEC,
+4 3
\-o,$lTRANSVERSE STRESS at the CENTER of the panel having maximumpressure, calculated from pressure assuming SIMPLE SUPPORT,and the Heave Acceleration of the boat at this panel vs Time
m i-rTttm
FIGURE 15-40-


TRANSVERSE STRESS at the EDGE and at the CENTER of the panel
having maximum pressure^ calculated from pressure assuming FIXED EDGES &I the Heave Acceleration of the b ani ] vs Time
1RE 16


EDGE,
CENTER-
SLAM A-/300RPM-/8KT,
O 0,05 0,/0 OJS 0.2O 0,25 0,3o 0.35 0,40 0.45 O.So SEC.
+0,6<]
-A5J
/0,00cl-DQE,
{CENTERS
SLAM D- I^SORPM- 2.0KT
O COS" OjO 0,/S 0,20 0,25 0,30 OSS' 0,4o 0.4S O.SO SEC.
-o,s3
TRflfSVERSB ffEMBRANE STRESS at the EDGE and at the CENTER of thepanel having: maximum pressure, calculated from pressure, andthe Heave Acceleration of the boat at this panel vs. Time c
EIGURE 17


o 0,05- a/o OJS 0.20 0.2S 0,30 0,35 0.40 045 0.S0 SEC
+o.s3
-0,53
3ooo
2000
looo
looo
Q05 O./O 0./5 0.20 0.2S 0,30 G\35 OAO 0,45 0.50 S£C*m
TRANSVERSE STRESS at the CENTER of the panel having maximumpressure end the Heave Acceleration of the boat at thispanel vs. Time
FIGURE 18-43-


FIGURE 19


as3
O O.OS 0,/0 0.15 0.2O O-ZS 0,30 0,35 Q.4o 0.45 0.50 S£C,
/OOO
H o
0;
-/ooo
-2000
:!!!!!:
C#:i =
SZ./4/W 7-/8QQfiPM-/7>fKn
Q 0,05 O./0 O./S 0.20 025 0.30 035 O.40 0A5 0.50 5£C
+ 0.; '3
oiiiiill:
ill ;::!i::=5
n^f
:TRANSVERSE STRESS on the inside surface at the midpoint of thelong EDGE of the panel having maximum pressure, and the HeaveAcceleration of the boat at this panel vs Time
FIGURE 20-45-


IV Results of Investigation of Plating Stress in Slamming
lo The final results are presented here in graphical form
Data and Calculations appear in the appendices
o
2o Discussion of Results
Theoretical Stress Calculated from Pressure Forward
The maximum pressure recorded in every slam was at P5<> Its
location is shown in figure \% o Since this was the location of
maximum recorded pressure, it was decided that strain readings
taken in this panel would be the largesto
The following assumptions were made in the calculation of
stress in this panel from pressure data?
lo The pressure recorded at P5 during each slam was assumed
to be uniformly distributed over the panel o
2o The edges of the panel were taken to be simply supportedo
3o The dynamic load factor was taken to be unity
o
From the transverse pressure distribution recorded at the
longitudinal position of P5, it appears that a more reasonable
value for uniformly distributed pressure on the panel containing
P5 would be 90% of the maximum pressure recordedo Because only
three pressure points were recorded for transverse distribution,
we can not be certain that P5 was located exactly at the peak
pressureo For this reason we did not reduce the recorded values
of P5 in calculating the stresses in the panela It is felt that
the stress values so obtained are as close to those actually exist-
ing in the panel as values calculated from a reduced value of P5<>
-4.6-


The second assumption is not exactly correct because some fixa-
tion does occur at the edgeSo This assumption is discussed in more
detail under measured values of strain c
Because of the uncertainty of the degree of fixity of the panel
edges, it was assumed that the edges were simply supportedo This
gives the largest possible value of stress that can occur under
actual conditions
o
The value of dynamic load factor was taken as unity based on the
work of Jasper (10) o From the pressure-time variation recorded in
slamming, we obtained a similarly shaped load curve as that analyzed
by Jasper and shown here in figure (/3)° The results of this
analysis are summarized in the curve of dynamic load factor shown in
figure (/3a) o The calculation of dynamic load factor for this
panel is shown in Appendix C° Since the dynamic load factor was
found to be unity, the dynamic pressures recorded at P5 were taken
as static pressures in calculation of the panel stresseSo
Sample calculations of the stresses in the panel are given in
Appendix D, and the results are shown in figures /5T/£ $7 7 ° The
greatest calculated stresses are at the center of the panel, assdm*-
ing simple support, and are in the transverse directiono The larg-
est recorded pressure was 5°l6 psio The largest calculated value
of stress based upon a pressure loading of 5»l6 psi, was found to
be 42,245 psio This value exceeds the average yield strength of
mild steel of 35,000 psio Before tests were conducted it was noted
that this panel showed evidence of permanent set in that the panel
was stretched
o
-47-


The above calculated value of stress at the center of the panel
existed over only a small area near the center and exceeded the
yield stress for a very short time, not exceeding o07 seconds©
Measured Stress Forward
In making the tests for strain data we were able to completely
record only relatively mild slams because of the sensitivity setting
of the amplifiers o The weather was very poor on the day that this
data was recorded, and for this reason we, were required to obtain as
much data as possible in the shortest possible time c Strain data
aft was taken first, and it was found that to obtain a reasonably
large indication on the recorder, a sensitivity of 50 micro-inches
per centimeter was required., After shifting the amplifiers to the
forward gages the same sensitivity was used, and this was found to
be adequate up to 1600 RPMo No slams were recorded through this
speed which caused maximum allowable deflection of the recorder©
However, at 1800 RPM a number of slams occurred which produced the
limiting deflection of the recorder<> Because of the severe weather
it was considered impossible to reset the amplifier sensitivity
without returning to the pier Q The zero position of the recorder
could not be found while adjusting the instruments in the rough
water existing.. Therefore, the sensitivity was left as it had
originally been set, and it was thought that it might be possible
to estimate the value of the maximum strain by comparison with
less severe slams which did not produce limiting deflections of
the recorder.. Subsequent weather conditions prohibited further
testingo
-48-


The recorded strains showed that the forward panel was in
tension both at the center and at the edges. For this reason it
appears that the edge condition is more nearly that of simple
support plus some membrane stress • The following table shows the
calculated stresses on the inside surface for fixed edge, simply
supported edge, and for a membrane, assuming a uniform pressure of
5d6 psi over the entire panel* This pressure is the largest
recorded during any slam and is considered to be as great as any
ever encountered in service. With the boat at rest, the amplifiers
were adjusted to give zero pressure readingo
TABLE V
MAXIMUM CALCULATED STRESSES FORDIFFERENT EDGE CONDITIONS
Edge Condition Center Edge
Fixed Edges +19510 P5I -40144 Psi
Simple Support +42245
Membrane + 8260 +11550
From the above values and the fact that positive, or tension,
strains were recorded at both the center and the edges, it can be
concluded that the clamped condition is not correct and that the
simply supported condition is more nearly correct* There must
also be some membrane stress in order to produce the positive
edge stresso
-49-


For design purposes we will be safe to assume that simply
supported edges exist because this produces the greatest value
of stress as long as the material is working below the yield
value.
Figures 18, 19 and 20 show the measured stresses vs. time
for several slams. These figures show the results of rather
mild slams, but are typical of those recorded. The more severe
slams exceeded the limits of the recorder as adjusted, and are
not shown in the figures. The recorded data for the most severe
slams are given in Appendix D.
-50-


RESULTS AND DISCUSSION OF DYNAMIC PRESSURES AND PLATING
RESPONSE NEAR THE PROPELLERS
Measured Strains and Frequencies of Vibration Aft
The strains were measured in one of the bottom panels aft in
order to determine whether the magnitude of stress in these panels
exceeded the fatigue limit of the material » In all of the test
runs made with 3-bladed propellers, there was never a large increase
in magnitude of strain with increased propeller RPM. The highest
frequency of vibration measured with 3-bladed propellers was 96
cycles per second, and the highest peak to peak amplitude of vibra-
tion was 75 micro inches per inch. This strain corresponds to a
peak to peak stress variation of less than 2250 psi, only a fraction
of the fatigue limit of the material.
In the test runs made with 4-bladed propellers no large increase
in the magnitude of strain was experienced as the RPM of the propellers
was increased. The highest measured amplitude of strain with 4.-bladed
propellers was 75 micro inches per inch at a maximum frequency of 120
cycles per second. The calculated natural frequency of the panel
assuming simply supported edges is 138 cycles per second. With fixed
edges the calculated natural frequency is 254- cycles per second.
Appendix B5 gives a summary of the frequencies of vibration and
peak to peak amplitudes of strain for various propeller RPM for 3 and
4—bladed propellers.
-51-


Figure /<4 shows the expected magnification factor for a
plate acted on by a dynamic pressure P sin (277 ft ) , Two
regions are shown on this curve which correspond to the limits
for 3 and 4-bladed propellers. The upper limit of each region
corresponds to simply supported edges, and the lower limit
corresponds to fixed edges. The forcing frequencies used are
96 cps and 120 cps for 3 and 4-bladed propellers respectively.
These are the maximum frequencies measured during the tests.
The damping value for this curve is 0»09 of critical. This
value was found by Jasper (/0) to be appropriate. The upper
limit of the 4-bladed region shows a magnification factor of 3,2s"*
The calculated magnification factor for the clamped edge
condition is nearly the same, 1.15 and 1.25 respectively for the
frequencies comparable to 3 and 4-bladed propellers at maximum
operating RPM.
The experimental strains found were nearly the same in both
cases. This leads to the Conclusion that clamped edge conditions
may be assumed for the after panels. These panels measure approx-
imately 12 x 15 inches, as compared with approximately 2U x 16
inches in the forward part of the boat*.
An alteration was made by the Coast Guard which placed inter-
costa stiffeners in the after panels to reduce their size to the
above value in an attempt to alleviate the high incidence of plating
failures aft*
-52-


VI. CONCLUSIONS
1. This boat is semi-planing and is supported 56% by dynamic forces
and UU% by buoyancy effects at full power.
2. No correlation between observed maximum slamming pressures and
gross heave acceleration was noted. However, these test results,
in common with those of previous researchers show that stagnation
pressure at any speed forms a sensible upper limit to the pressures
which may be expected on the bottom plating during slamming.
3« In steady planing the longitudinal pressure distribution peaks
sharply at a point near the entry and falls off very quickly as
one progresses afto The stagnation pressure exists over a very
small area.
4.. The durations of the slams are short, of the order of 0.5 second
and the heave accelerations in slamming rarely exceeded 0.35g» The
high pressures noted in slamming which approach the stagnation
pressure are attributed to flow disturbances rather than to heave
acceleration.
5o The stresses at the center and edges of the bottom panels in the
area of max. slamming pressure show that the edge support condi-
tions are that of simple support with a small additional membrane
effect.
6. The fractures in the bottom panel in the area of maximum slamming
pressure were caused by exceeding the ultimate strength at hard
spots during very severe slamming and not by fatigue.
-53-


7. During normal operation the stresses in the area of maximum
expected pressure are well below the fatigue limit of the
material*
8. No significant slamming was noted below a power setting of
1700 RPM. Slamming became severe at power settings in excess
of 1700 RPM.
9. The bottom panels near the propellers showed a vibration
frequency equal to the propeller blade frequency*
10. No significant difference in the magnitude of plating strains
was found between 3-bladed and 4-bladed propellers at common
engine speeds.
11. There was no significant variation in the magnification factor
with either 3-bladed or 4-bladed propellers as engine speed was
varied from 1000 RPM to 1950 RPM. This is attributed to the
support conditions of the panel edges which approach that of
fixed support. These panels are smaller than those forward.
12. The peak to peak pressure variation in the propeller field was
found to be less than 2.5 psi and its frequency was found to be
equal to propeller blade frequency.
-54-


VII o RECOMMENDATIONS
It is recommended that the test program started by this group
be continued. The results obtained thus far show that it is necessary
to take simultaneous readings of pressure, strain, and accelerations
in the area of maximum slamming pressures in order to obtain a relation-
ship between dynamic pressures and plating strains. The following
specific recommendations are made to solve the problem originally
proposed:
1. At least 12 data channels capable of simultaneous recording
against a common time base should be used. This will allow
simultaneous recording of accelerations at three points in the
boat, strain measurements at midpoints of two edges of the
panel and one supporting member, and a three gage rosette at
the panel center,, The remaining force channels would be avail-
able for pressure readings at the center of the panel and
selected surrounding locations. Pressure transducers should
have a maximum range of 0-10 psi gageo
2« Equipment weight is critical o An investigation such as this
can best be carried out using light aircraft type test equipment.
The problems of weight and moment compensation, even with many
more recording channels would not be as severe as those encountered
by this group
o
3o Further investigation should be made of the effect of damping upon
the phase relationship between slamming pressure and the bodily
response of the boato
-55-


U° A comparison between the magnitudes of pressures and strains
obtained by passing through "standard" waves such as those
produced by wakes and those produced under severe sea condi-
tions, should be made..
It is felt that a thorough follow up program to the investiga-
tion made thus far will yield information on the response of the semi-
planing hull to rough water service which will be of great value to
those engaged in the design of such crafto Instrumentation and time
limitations have led this group to produce an interim report which,
it is hoped, will supply the basic techniques required for the final
investigation
p
-56-


VIII - APPENDIX
-57-


APPENDIX "A"
SUMMARY OF TEST RUNS
Pressure Data Date: 10/4/58
Speed Channel Channel Channel Channel Channel Channel Remarks
Run Noo rpm 1 2 3 4 5 6
1 1400 PI P2 P3 P5 Al A2 Calm water2 1400 n 9» 91 91 ii ti 99
3 1600 n It 11 19 ti 91 99
4 1800 81 91 91 99 99 II 81
5 1950 ti 91 II It II 81 II
6 1950 J! 99 91 81 99 81 81 91
7 1950 n H 99 98 99 n 99
8 1400 P4 P3 P6 P5 Al A2 CG4D 8 BoatWake
9 1400 91 91 91 88 ii 18 n
10 1600 n n It 81 91 88 ii
11 1600 n 91 39 n 99 n it
12 1800 n ?! M n 91 n 18
13 1800 H 11 99 91 91 ti 91
14 1950 it n 99 n 11 it tl
15 1950 n ei 91 91 99 81 Tanker wake16 Stopped n n 99 n n tl «»
17 1950 91 91 n 91 91 tl CG40»BoatWake18 1950 91 n 99 99 91 91 it
19 1950 P7 P3 P8 P5 Al A2 Tanker wake20 1950 91 ti 81 99 n it 88
21 1950 P7 Al P8 P5 blank A2 Cq40»BoatWake22 1950 it « 91 98 99 91 98
23 1800 ti it 19 M 91 91 81
24 1800 it n It 99 ti it 99
25 1600 91 it 81 99 ii 99 81
26 1600 91 n 99 19 91 It W
27 1400 II ti 11 89 91 It 99
28 14-1950 91 91 91 tl II II Acceleration29 Stopped 91 91 91 91 91 V9 Calm water
Strain Data Aft With 3^-Bladed Screws Date: 11/8/58
1 1950 Al A2 SI S3 S5 S4 Normal waves2 1600 ii 99 19 91 91 99 91
3 1400 ti It 99 91 91 II 91
4 1200 91 n 11 11 11 91 99
5 06-1950 It it 91 81 91 19 Acceleration6 1950 Al A2 SI S6 S5 S2 Normal waves7 1800 R H 91 81 99 99 99
-58-


APPENDIX "A"
SUMMARY OF TEST RUNS (cont'd.)
Strain Data Aft With 4-Bladed Screws Date: 11/22/58
Speed Channel Channel Channel Channel Channel Channel „ ,
Run No. rpm 1 2 3 4 5 6Carles
S6»
n
n
n
n
S3n
n
n
n
it
S4II
It
It
It
tt
S2II
II
1 600 Al2 U00 it
3 1000 n
4 1800 n
5 1950 n
6 06-1950 it
7 600 Al8 1000 n
9 1400 n
10 1800 ti
11 1600 it
12 1950 it
13 UOO Al
H 1800 ii
15 1600 it
16 1200 it
17 1000 n
18 600 n
19 1800 Al20 1400 it
21 1000 n
A2 SIn n
R it
tt n
it ti
ti ti
A2 SIn II
it II
it It
n It
n It
A2 S5ti it
ti it
it it
it n
it it
A2 SIit II
it It
S5it
S2tt
Normal wavesn
n n n
w ti w
ti n tt
ti it tt
S5ti
S4n
tt
tt
tt it tt
n tt tt
n n n
ti n n
S3ft
blankn
n
ti
n n tt
n tt tt
n it tt
n n tt
S6tt
blank n
tt
it it tt
-59-


APPENDIX "B"
1. PRESSURE DATA FORWARD ^^
SLAM A, Run 12, 10/4/58, 1800 RPM
Time Al A2 P4 P5 P6
sec. -0.250 -0.333 -0.476 -1.192 -0.2380.05 -0.250 -0.333 -0.357 -0.952 -1.3100.10 -0.200 -0.217 -0.^800.15 -0.067 0.715 0.4760.20 0.150 0.233 0.715 1.200 0.2380.25 0.250 0.366 0.8400.30 0.350 0.6000.35 0.400 0.600 0.238 -0.480 0.1180.40 0.400 0.600 -0.456 -0.840 0.1180.45 0.300 0.466 -0.456 -1.100 0.1180.50 0.250 0.333 -0.572 -1.320 0.118
SLAM B, Run 14, 10/4/58, 1950 RPM
Time Al A2 P4 P5 P6
sec.
0.05 0.150 0.200 0.25 1.080 0.150.10 0.100 0.130 -0.50 0.8400.15 -0.067 -1.00 -1.440 -0.250.20 -0.050 -0.130 -1.00 -1.682 -0.380.25 -0.050 -0.067 -0.50 -0.600 -0.250.30 +0.050 -0.067 0.960 0.250.35 0.250 0.230 2.18 3.120 0.750.375 0.350 0.430 2.18 4.800 1.200.40 0.350 0.430 1.45 3.360 0.750.45 0.300 0.3300.50 0.25 0.720
SLAM C, Run 15, 10/4/58, 1950 RPM
Time Al A2 P4 P5 P6
sec. -0.250 -0.333 -0.72 -1.662 -0.240.05 -0.300 -0.400 -0.48 -1.560 -0.240.10 -0.30 -0.400 -0.48 -1.182 -0.240.15 -0.250 -0.400 -0.24 -0.482 -0.240.20 -0.133 0.24 0.6000.25 0.150 0.267 0.96 1.198 0.240.30 0.100 0.267 1,080 0.240.35 0,100 0.267 -0.24 0.360 0,240.40 0,050 0.067 -0.48 -0.2420.45 -0.48 -0.722 -0.240.50 0.100 0.133 -0.48 -0.962 -0.24
* - Zero reference for pressure data taken with boat at rest.-60-


lo PRESSURE DATA FORWARD '^ ( cont ' d.
)
SLAM E, Run 21, 10/4/58, 1950 RPM
Time Al A2 P5 P7 P8
sec -0.360 -0.358 0.5960.05 -0.100 -0.133 -0.600 -0.358 0.5960.10 -0.167 -0.333 -0.720 -0.358 0.5960.15 -0.233 -0.333 -0.600 -0.358 0.5960.20 -0.233 -0.267 -0.240 -0.358 0.5960.25 -0.200 -0.100 1.440 -0.715 0.8340.30 -0.200 3.12 -0.834- 1.5480.35 -0.200 2.160 -0.596 2.2580.40 -0.250 -0.133 -1.440 -0.358 1.1350.215 -0.267 -0.4-00 -I.440 -0.358 0.5960.50 -0.100 -0.067 3.120 -1.072 0.5960.55 0.133 0.333 5.160 -1.072 2.7380.60 0.300 0.600 2.880 -0.834 1.9800.65 0.300 0.534 1.200 -0.358 lol350.70 0.250 0.466 -0.240 -0.358 0.5960.75 0.200 0.4.00 -0.600 -0.358 0.5960.80 0.200 0.333 -0.720 -0.358 0.358
SLAM F, Run 23, 10/4/58, 1800 RPM
Time Al A2 P5 P7 P8
sec -0.400 -O.466 -1.44 0.118 -0.1180.05 -0.367 -0.433 -0.36 0.118 -0.1180.10 -0.333 -0.333 -0.120 -0.1200.15 -0.150 0.267 -0.358 -0.1180.20 0.053 0.666 4o56 -1.014 -0.1180.25 0.333 0.666 4.08 -0.715 2.7380.30 0.400 0.666 1.44 -0.120 1.5480.35 0.266 0.467 -0.240 0.047 0.6680.4-00 0.200 0.368 -0.60 -0.120 0.2390.^5 0.167 0.333 -0.84 -0.120 0.1200.500 0.167 0.267 -0.96 -0.239 0.120
* - Zero reference for pressure data taken with boat at rest,
-61-


2. THEORETICAL STRESS CALCULATED FROM PRESSURE DATA
ASSUMING STATIC PRESSURESCLAMPED EDGES
(1)
SLAM A, Run 12, 10/4/58, 1800 RPM
Time P5 ( *l ( 7), ( x)a/
s
( 7)V;
sec -1.19 -4498 -2437 +9258 +69970.05 -0.95 -3591 -1946 +7393 +55860,10 -0.48 -1815 - 983 +3735 +2822
0.15 +0.48 +1815 + 983 -3735 -28220.20 +1.20 +4536 +2458 -9336 -70560.25 +0.84- +3175 +1720 -6535 -49390.300.35 -0.48 -1815 - 983 +3735 +28220.40 -0.84 -3175 -1720 +6535 +49390.45 -1.10 -4158 -2252 +8558 +64680.50 -1.32 -4990 -2703 +10270 +7761
SLAM B, Run 14, 10/4/58, 1950 RPM
sec
0.05 +1.08 +4083 +2219 -8402 -63500.1C +0.84 +3175 +1720 -6535 -49390.15 -1.44 -5773 -2949 +11203 +84670.20 -1.68 -6350 -3440 +13071 +9878Oc25 -0,60 -2268 -1229 +22401 +35280.30 +0.96 +3629 +1966 -7470 -56450.35 +3»12 +11800 +6389 -24896 -183450.375 +4o80 +18150 +9830 -37350 -282240.40 +3.36 +12700 +6881 -26140 -197570.450.50 +0.72 + 2722 +1475 -5601 t-4234
SLAM C, Run 15, 10/4/58, 1950 RPM
sec -1.66 -6275 -3399 +12920 +97610.05 -1.56 -5897 -3195 +12142 +91730.10 -1.18 -4460 -2416 +9180 +69380.15 -O.48 -1815 - 983 +3735 +28220.20 +0*60 +2268 +1229 -4668 -35280.25 +1.20 +4536 +2458 -9336 -70560.30 +1.08 +4082 +2219 -8402 -63500.35 +0.36 +1361 + 737 -2800 -21170.40 -0.24 - 907 - 491 +1867 +14110.45 -0.72 -2722 -1475 +5601 +42340.50 -0,96 -3629 -1966 +7470 +5645
( x) = Stress at center in direction of short dimension.
( y) = Stress at center in direction of long dimension.
( x)a/2 = Stress at midpoint of the long edge,
( yOb/2 = Stress at midpoint of the short edge,
(1) - Zero reference for pressure data taken with boat at rest. ~62-


THEORETICAL STRESS CALCULATED FROM PRESSURE DATA
ASSUMING STATIC PRESSURES(cont'd)CLAMPED EDGES
(1)
SLAM D, Run 19, 10/4/58, 1950 RPM
Time P5 <*). (y), ( x)a/a
( 7)b/
s
sec -0.84 -3175 -1720 +6535 +49390.05 -0.96 -3629 -1966 +7470 +56450.10 -0.60 -2268 -1221 +4668 +35280.15 +0.47 +1777 + 963 -3658 -27630.20 +2.88 +10880 +5898 -22406 -169340.25 +4..00 +15120 +8192 -31120 -235200.30 +2.15 -8127 +4403 -16726 -126420.35 +0.84 +3175 +1720 -6535 -49390.40 -0.12 - 454 - 245 + 934 + 7060.45 -0.48 -1815 - 983 +3735 +28220.50 -0.48 -1815 - 983 +3735 +2822
SLAM E, Run 21, 10/4/58, 1950 RPM
sec -0.36 -1361 - 737 +2800 +21170.05 -0.60 -2268 -1229 +4668 +35280.10 -0.72 -2722 -1475 +5601 +42340.15 -0.60 -2268 -1229 +4668 +35280.20 -0.24 - 907 - 491 +1867 +14110.25 +1.44 +5443 +2949 -11203 -84670.30 +3ol2 +11800 +6389 -24896 -183450.35 +2.16 +8165 +4424 -16804 -127000.40 -1.44 -5443 -2949 +11203 +84670.45 -1.44 -5443 -2949 +11203 -84670.50 +3.12 +11800 +6389 -24896 -183450.55 +5ol6 +19510 +10568 -40144 -303400.60 +2.88 +10880 +5898 -22406 -169340.65 +1.20 +4536 +2458 -9336 -70560.70 -0.24 - 907 - 491 +1867 +14H0.75 -0.60 -2268 -1229 +4668 +35280.80 -0.72 -2722 -1475 +5601 +4234
( x) = Stress at center in direction of short dimension.
( y) = Stress at center in direction of long dimension.
( x)a/2 = Stress at midpoint of the long edge.
( j)Wz ~ Stress at midpoint of the short edge.
(1) - Zero reference for pressure data taken with boat at rest.
-63-


£ THEORETICAL STRESS CALCULATED FROM PRESSURE DATA
ASSUMING STATIC PRESSURES (cont'd)CLAMPED EDGES
(1)
SLAM F, Run 23, 10/4/58, 1800 RPM
Time P5 ( x), ( y), ( X)a/
s (7)b/
s
sec -1.44 +5443 -2949 +11203 +8467Oo05 -0o36 +1361 - 737 +2800 -2117OolO -0ol2 - 453 - 24-5 + 934 - 7060.150o20 +4»56 +17237 +9339 -35482 -268130.25 +4»08 +15420 +8356 -31742 -23990Oo30 +1.44 +5443 +2949 -11203 -84670.35 -0.24 - 907 - 491 +1867 +14110.40 -O06O -2268 -1221 +4668 +35280.45 -0.84 -3175 -1720 +6535 +4939Oo50 -0.96 -3629 -1966 +7470 +5645
( x) = Stress at center in direction of short dimensionoo
( y) = Stress at center in direction of long dimensiono
( x)a/2 = Stress at midpoint of the long edge.
( j)Wz ~ Stress at midpoint of the short edge.
(1) - Zero reference for pressure data taken with boat at rest.
-64-


3. STRAIN AND STRESS DATA FOR THE CENTER OF
FORWARD PANEL
Slam 1, Run 14, 11/22/58, 1800 RPM
Timesec.
-0OoOl0»020.030.040e05-00o060.070o080o090*10-00.110„120.13OoU0.15-0,O0I60.170.180.190.20-0.
0.210.220.230.240.25+O e
0.260.270.280.290.30+0c
0.310.320.330.340„35+0«0.360.370.380.390.^0+0
Al (2)C5 6 X 0(max oprim.) <f
(3)
25g
20g
»30g +2
+2+2
-30g
-2
-6-7-3-5
05g -5-6-8-5-5
15g -7-5-8-6-5
25g -2
-4
+4+4
30g +10+8+8+6+13
15g +7
+5+3+3+6+5+5+5+3+5+7
-12-15-12- 5-18- 7- 5- 5- 7+ 4
+10 + 3+7 - 3+12 +20+20 +25+18 +18+32 +48+28 +48+13 +19+18 +48+18 +37+15 -33+15 +40+20 +57+14 +37+15 +35+18 +54+8 +35+2+7+5-2+6+2-2
-4-7-5-7-5-8+1
+35+42+43+26+36+25+19+20+ 7+17+12+10-20
-375-494-330-145-592-231-165-165-231+112+ 99- 99+658+823+592+1520fl510
+595+1530+1220-1135+1260+1800+1117+1111+1710+1090+1075+1325+1370+836+1150+823+665+698+330+639+474+388-860+ 69
+67-23+31+126- 1+62+75+32+62+197+263+134+663+872+679+1572+1536+621+1538+1219+34+1261+1807+1172+1104+1722+153+ 16+162+173+ 57+16#+158+136+101+ U+118+ 33+ 39-544+ 50
+27°+27+24+32+28+33+35+32+33+58+50+39+84+74+67+78+82+77-86-89+33-87-86-87
-84-80-75-77-74-67-76-69-59-58'
-42-52-48-49- 7-17
(1)
(2)
(3)
- All strains are in micro-inches per inch.
- All stresses are in pounds per square inch.
- Angle of maxoprincipal stress measured from fore & aft direction,
-65-


3. STRAIN AND STRESS DATA FOR THE CENTER OF
9&8MBB PANEL (cont'd*)
Slam 1, Run H, 13/22/58, 1800 RPM
Time (l;
sec Al ^4 ^3 £5 0* £> (max.prime) 4(:
Oo^l +0.15g +7 -5 -21 -622 -626 + 40oA2 - 3 - 99 -113 +22
0,43 +2 -2 - 7 -214. -211 + 3
0»44 +4 - 92 +450<>45 +O«05g +2 -7 -10 -310 -326 -130„46 +2 -5 + 20 - 97 -400.47 +5 -17 -510 -546 +140o48 +3 -1 -14 -431 -457 +130.49 +2 -2 - 2 -46 - 65 - -220o50 +2 -1 -12 -375 -400 +14
- All strains are in micro-inches per inch.
(2) - All stresses are in pounds per square inch.
(3)N - Angle of max. principal stress measured from fore & aft direction.
-66-


3. STRAIN AND STRESS DATA FOR THE CENTER OF THE FORWARD PANEL
Slam 2j 1Run 14, 11/22/58, 1800 RPM
Time Al cr (1)^3 £5 <rx
(2)
6 (Max.Prim)<t>
sec -0„40g -2 +8 -4 -150 +126 +42°OoOl +2 +5 -7 -211 +94 +29Oo02 +2 +8 -9 -277 +144 +32Oo03 +7 -7 -12 -326 +135 -120o04 +7 -23 -12 -326 +414 -33Oo05 -Oo30g +12 -48 -H -342 +1082 -370.06 +30 -15 -5 +132 +1287 -280o07 -50 +130 +150 +4450 +5098 +70O0O8 -100 -80 -50 -2640 -2625 -84Oo09 -90 -120 -130 -5170 -4198 -13OolO +0o20g +13 +10 +75 +2600 +2947 -66Ooll +135 +135 +4450 +5095 +670,12 -50 -40 -50 -2140 -1912 +450,13 -135 -120 -128 -5530 -5358 +530.14 -50 -15 -125 -4-610 -1866 +310.15 +0.45g +110 +140 +4.610 +4860 +75O0I6 +20 -10 +198 +944 -310«17 -20 +20 +50 +1450 +1458 +85O0I8 +25 +20 +45 +1730 +1916 -61Ool9 +5 +20 +10 +379 +615 +500o20 +0.40g -15 +5 -5 -313 -63 +54Oo21 -10 +10 -99 +150 +540o22 -15 +10 +75 +2320 +2422 -78Oo23 -25 -824 -127 +220<,24 -5 +20 +25 +775 +844 +73Oo25 +Oo25g +30 -20 +25 +1120 +2276 -430o26 +5 +5 -7 -181 +152 +220o27 -5 -25 -824 -199 +150o28 -5 -10 +20 +610 +817 -62Oo29 +5 +15 +10 +378 +503 +54Oo30 +0ol5g +5 -18 -47 -1500 -296 + 3Oo31 -10 +15 +38 -1155 +1154 +88Oo32 +10 +230 +45Oo33 +6 -15 -15 -455 +149 -220„34 +13 +12 -15 -366 +398 +21Oo35 +0o05g +2 +15 +30 +1010 +1009 -87Oo36 -5 +5 -17 -610 -77 +340.37 -10 -330 -51 +220«380«39 -13 -428 -66 +220«40 +10 +10 -45 -1385 +147 +22
-67-


STRAIN AND STRESS DATA FOR THE CENTER OF THE FORWARD PANEL(cont'do)
Slam 2, Run H, 11/22/58, 1800 RPM
Time Al P (1)C4 £ 3
£5
iC (2) /-Ox 6 (MaxcPrim)<P
0.41 SEC. +16 +21 +692 +723 +76Oc-42 +5 +3 -10 -280 +107 +180o43 -6 +5 -20 -718 -111 +3A0.44 -3 +69 -IS0.4-5 -0.05g +5 -5 -165 +75 +350.46 -4 +5 -8 -304 +390«47 +7 +2 -20 -590 +89 +16OoAB +5 +18 +10 +379 +570 +510o^9 +2 +5 -20 -6^0 +25 +250.50 -O.lOg -5 +5 -10 -379 -27 +39
* - All strains are in micro-inches per inch.(2)
- All stresses are in pounds per square inch.
-68-


3. STRAIN AND STRESS DATA FOR THE CENTER OF THE FORWARD PANEL
Slam 3, ,Run 14, 11/22/58, 1800 RPM
Time Al P (1)b.4. £3 £5 Ox (Max .Prim) 9
sec. -0,>25g + 3 + 3 -21 - 663 + 5 +22°
OoOl + 3 + 2 - 3 - 69 + 83 +160.02 + 3 + 5 - 3 - 69 + 134 +290.03 + 2 + 3 -20 - 640 - 10 +230.04 + 2 + 3 - 1 - 13 + 88 +290.05 -0,>30g + 2 + 5 + 3 + 119 + 165 +500.06 + 3 + 5 -15 - 465 + 70 +250.07 + 3 + 3 - 3 - 69 + 97 +220.08 + 2 + 6 + 9 + 316 + 317 +850.09 + 2 + 6 -10 - 310 + 97 +290.10 -0,-35g + 1 + 5 - 2 - 56 + 110 +370.11 + 2 + 5 +12 + 415 + 424 -790.12 + 3 + 7 - 2 - 36 + 182 +340.13 + 2 + 5 + 20 + 138 +37o.u + 2 + 8 +22 + 745 + 762 -790.15 -0,-25g + 3 +12 + 8 + 294 + 396 +550.16 + 2 +10 + 7 + 251 + 332 +570.17 - 1 +12 +37 +1210 +1231 -810.18 + 2 +14 +35 +1173 +1187 -820.19 + 2 +10 +20 + 680 + 680 -860.20 -0.-15g - 5 +25 +67 +2160 +2170 -850.21 - 7 +27 +65 +2075 +2074 -880.22 +10 +35 +1155 +1189 -780.23 -10 +33 +85 +2705 +2708 -870.24 -10 +35 +75 +2375 +2375 +880.25 c> + 4 + 5 +20 + 700 + 759 -690.26 - 8 +20 +75 +2395 +2442 -800.27 +18 +50 +1650 +1670 -820.28 + 4 + 5 +25 + 865 + 948 -680.29 - 5 +13 +68 +2195 +2294 -760.30 +0, 25g + 6 - 2 +25 + 885 +1123 -590.31 + 5 +30 +1040 +1246 -620.32 + 4 - 5 +30 +1030 +1318 -600.33 + 3 - 4 +18 + 624 + 826 -580.34 - 5 +27 + 890 +1107 -630.35 +0, 50g + 4 -15 +15 + 535 + 986 -510.36 - 3 +41 +1323 +1485 -600.37 + 7 -11 -13 - 360 + 166 -190.38 + 5 - 8 +20 + 700 +1039 -550.39 +15 - 7 - 3 + 50 + 622 -270.40 +Oo 50g +16 - 5 -32 - 897 + 215 + 3
-60-


3#STRAIN AND STRESS DATA FOR THE CENTER OF THE FORWARD PANEL (cont'd*)
Slam 3, Run U, 11/22/58, 1800 RPM
Time Al € (i)
0.£LS£C.+0.50g +120.42 + 70.43 - 1
O.M - 4Oo45 +0.40g -110.46 - 70.47 - 80.48 - 7
0.49 - 5
0.50 +0.20g - 2
£3
- 2-10- 1- 3
+ 3- 3+ 8+ 2
- 4
<£
-12
- 5
+22-18+ 8+ 8- 8+ 2
6.(2)
<Tt
-277+ 69-175- 40+617-663+185+195-314+ 46
(MaxoPrim) 4>
+280+471- 63- 34+620-282+261+197-124+103
-4-37+22-76-85+29+67+84+38-58
(1)
(2)
- All strains are in micro-inches per incho
- All stresses are in pounds per square inch.
-70-


3 STRAIN AND STRESS DATA FOR THE CENTER OF THE FORWARD PANEL
Slam 4, Run H, 11/22/58, 1800 RPM
Time Al 8 (i) (2)£5 6"x (5"(Max Prim) J
sec. -0 •45g - 1 + 7 - 3 - 198 + 123 +41°
OoOl + 2 + 9 - 5 - 185 + 191 +350o02 + 3 + 12 - 10 - 271 + 237 +330.03 + 3 + 10 - 3 - 40 + 240 +360.04. + 1 + 18 + 12 + 406 + 572 +57Oo05 -0 .50g + 2 + 19 + 20 + 458 +43O0O6 + 15 + 17 + 561 + 611 +71Oo07 + 2 + 10 + 8 + 284 + 348 +60O0O8 - 2 + 12 + 10 + 310 + 402 +630.09 - 9 — 6 + 8 + 175 + 212 -73OolO -0 .50g -15 - 10 + 17 + 412 + 490 -72Ooll -10 — 8 - 4 - 112 - 227 -80
0ol2 — 7 - 12 - 392 - 116 - 40ol3 + 7 — 6 - 10 - 261 + 157 -13
O.H +17 - 3 - 25 - 657 + 313 + 10ol5 -0,»40g +12 + 5 - 33 - 970 + 180 +170.16 + 4 — 32 - 27 - 851 + 100 -260.17 - 4. — 62 - 20 - 700 + 654 -400.18 - 6 — 85 + 13 + 370 +2204 -480.19 -35 — 25 +110 +3283 +3816 -690.20 -45 +110 +110 + 322 +3922 +670.21 -125 -115 -125 - 536 -5126 +450.22 -25 — 80 -135 - 470 -21590.2£ +0,,60g * * *0.30 +1,,00g
0.35 +1,»00g
0.40 +0,»60g
0.45 +0,>30g
0.50 +0,.20g * * *0.55 +0,.15g -122 -120 -135 - 566 -5260 +260.56 - 10 + 10 - 99 + 150 +540.57 + 18 +140 +145 + 496 +5485 +680.58 - 10 +150 +145 + 469 +5504 +660.59 — 15 + 346 -450.60 +0,>10g - 20 + 35 + 25 + 627 +1019 +620.61 - 10 + 35 + 50 +1551 +1631 +760.62 - 10 + 35 - 99 + 715 +480.63 + 35 + 50 +1650 +1692 +79O.64. + 5 + 10 + 330 + 329O.65 - 15 + 45 +105 +3316 +3313
-71-


3. STRAIN AND STRESS DATA FOR THE CENTER OF THE FORWARD PANEL (cont'd.)
Slam 4, Han 14, 11/22/58, 1800 RPM
Tine il EAW £ 3
£5 f™ <r{Max „Prin) Cf>
O066SEC. +20 +25 + 825 + 872 +740.67 -10 +20 +50 +1551 +15490*68 +25 -25 - 577 + 5760,69 +30 +30 + 990 +1132 +670o70 -OolOg +30 -10 -25 - 528 + 804. -12
0.71 +10 +47 +30 +1089 +1521 +550o72 +15 +10 -50 -1502 + 232 +200.73 +10 +25 + 825 + 829 -840.74 - 5 -12 -10 - 380 - 202 -300.75 -0.15g +10 +25 + 825 + 829 -84
(1)
(2)
- Strain exceeded the limit of the instruments (greater
- All strains are in micro-inches per inch
- All stresses are in pounds per square inche
Strain exceeded the limit of ththan 125 micro-inches per inch)
-72-


3 STRAIN AND STRESS DATA FOR THE CENTER OF THE FORWARD PANEL
Slam 5 , Run 15, 11/22/58, 1600 RPM
Time Al C4 e 3 ^5
, (2)o x (Max.Prim)
sec. -0.15g - 7 -13 -429 -128 - 2°
0,01 - 7 -12 -396 -116 - 40.02 - 1 - 8 -15 -505 -181
Oo03 - 8 -12 -396 -111 - 90.04 -11 -14 -462 -113 -140.05 -12 -12 -396 - 61 -220.06 - 1 -13 -16 -540 -162 -150.07 - 2 -12 -11 -333 -114 -250.08 - 4 -H -16 -568 -262 -160.09 - 5 -14 -13 -479 -237 -250.10 +0.15g - 5 -15 -17 -611 -305 -160.11 - 5 -14 -11 -413 -188 -310.12 - 4 -17 -22 -766 -329 -110.13 - 7 -15 -20 -729 -424 - 60.14 - 8 -15 -23 -838 -490 + 10.15 +0.15g -10 -14- -17 -660 -496 - 40.16 - 9 -18 -19 -716 -452 -190.17 -10 -15 -10 -429 -313 -450.18 - 9 -11 - 5 -254 -196 -580.19 - 6 -12 - 8 -323 -182 -390.20 +0.15g - 6 -11 -13 -488 -319 -110.21 - 5 -11 -14 -512 -297 - 90.22 - 3 - 9 -12 -426 -211 - 90.23 - 4 -10 - 7 - 63 -126 -350.24 - 5 -11 - 8 -314 -169 -350.25 +0.05g - 7 -10 - 6 -267 -196 -490.26 - 7 - 7 + 5 + 96 +152 -670.27 - 5 -10 -10 -380 -239 -220.28 - 2 - 6 -10 -350 -1640.29 - 2 - 5 -11 -383 -169 + 90.30 - 2 - 2 - 5 -185 -101 +22
(1)- All strains are in micro-inches per inchc
(2) - All stresses are in pounds per square inchc
-73-


4. STRAIN AND STRESS DATA FOR THE MIDPOINT OF THE
LONG EDGE OF THE FORWARD PANEL
Slam 6, Run 19, 11/22/58, 1800 RPM
Time
OS£C.0.010,020.030.04.
0.050.060.070.080.090.100.150.200.250.270.280.290.300.310.320.330.340.350.360.370.380.390.400.410.420.430.440.45O.460.470.480.490.50
Al
-0«40g
-0.40g
-0.20g+0.80g+1.25g+0.70g
+0.35g
+0.20g
+0.05g
(1)
-O.lOg
-12-25-30
-12-10+30+25+43+80+100*
*+115-12-90+10+32
+45
-5-15-10
+35+15-10+25-20-33-25+43-5-25+20
-396-825-990
-396-330+990+825+14L0+2640+3300
-396-2970+330+1055
+1485
-166-495-330
+1155+495-330+825-660-1090-495+1420-166-825+660
(2),
All strains are in micro-inches per inch.
All stresses are in pounds per square inch.
Strain exceeded the limit of the instruments(greater than 125 micro-inches per inch).
-74-


STRAIN AND STRESS DATA FOR THE MIDPOINT OF THE
LONG EDGE OF THE FORWARD PANEL
Slam 7, Run 19, 11/22/58, 1800 RPM
Time <M2
<T(2)2
OSEC -0 »20g -35 -1155OoOl - 5 - 1650o02 -35 -11550o03 -35 -11550o04 -11 - 3630,05 -0 .20g -20 - 660O0O6 -30 - 9900o07 -20 - 6600«08 -20 - 6600.09 -25 - 825OclO -0,»20g -22 - 726Ooll -12 - 3960.3,2 -21 - 6?30»13 - 8 - 264OoU -13 - 4280,15 -0,»10g -17 - 560O0I60ol70«18 -16 - 5270„19 +20 + 6600»20 +0,»10g +20 + 6600o21 -40 -13200„22 -30 - 9900o23 +25 + 825
o 24 -25 - 825Oo25 +0,>40g -25 - 8250o26 -15 - 4950o27 -55 -18100o28 -55 -18100o29 -22 - 715Oo30 +0,>25g -20 - 6600o31 -31 -12000o32 -10 - 330Oo33 -17 - 5610<>34 -28 - 925Oo35 +0,»05g -28 - 9250o36 -20 - 6600o37 -27 - 8920o38 -12 - 3960o39 - 5 - 1660„4Q - 7 - 231
-75-


4-. STRAIN AND STRESS DATA FOR THE CENTER OF LONG EDGE
OF THE FORWARD PANEL (cont'd,,)
Slam 7, Run 19, 11/22/58, 1800 RPM
Time Al
Oo/ilSec. o0»42Oo£3OoU0*U50o46Oo4.7
0o^8
0»A9Oo50 -Oo05g
p (1)c2
tf-w
-10 - 330-22 - 727-32 -1055- 7 - 231-18 - 595-18 - 595- 5 - 166- 2 - 66-22 - 727-20 - 660
(1)
(2)
- All strains are in micro-inches per inch.
- All stresses are in pounds per square inchc
-76-


STRAIN AND STRESS DATA FOR THE MIDPOINT OF THE
LONG EDGE OF THE FORWARD PANEL
Slam 8, Run 19, 11/22/58, 1800 RPM
Time Al
vS£"C. -Oo30gOoOl0.02Oo030.040.05 -Oo30g0.060o07Oo08Oo09OolO -0.30g0.110.12Ool3OoUOol5 -Oo05gOol60.170.180.190.20 +0.25g0.210.220.230.240.25 +0.30g0.260.270.280.290.30 +0.25g0,310.320.330.340.35 +0.20g0.360.370.380.390.40 +0„05g
p (1)£ 2 ^a
(2)
-25 - 825-37 -1220-34 -1120-32 -1055-36 -1190-30 - 990-29 - 957-20 - 660-17 - 561-24 - 792- 5 - 165
+25 + 825+40 +1320+30 + 990+35 +1155+62 +2045+73 +2410+65 +2145+40 +1320+15 + 495+15 + 495
- 7 - 231
-32 -1055+ 8 + 264-17 - 561-27 - 890-25 - 825-15 - 495-20 - 660-20 - 660
+ 5 + 165-15 - 495-30 - 990-13 - 429-10 - 330-20 - 660
-77-


STRAIN AND STRESS DATA FOR THE MIDPOINT OF THE
LONG EDGE OF THE FORWARD PANEL (cont'd.)
Slam 8, Run 19, 11/22/58, 1800 RPM
Time Al
0.41S£C +0.05g0.420.430.440.450.4-6
0.470.480.490.50
c 2 <T2(2)
-20 -660+ 3 + 99-10 -330-15 -495-10 -330-20 -660-15 -495-18 -594-19 -627-10 -330
(1)
(2)
- All strains are in micro-inches per inch.
- All stresses are in pounds per square inch.
-78-


5. PEAK TO PEAK AMPLITUDE^ OF STRAIN AND FREQUENCY^
OF VIBRATION OF AFTER PANEL
3-Bladed Propellers
RunGage 1 Gage 2 Gage 5 Gage 6
No. RPM Ampo Freq<> Amp» Freq Amp« Freq Amp Freq
67
19501800
30 9620 88
20 9650 88
75 9675 88
25 9620 88
Gage 1 Gage 3 Gage 4- Gage 5
1
2
3
19501600UOO
30 9615 8815 68
65 9655 8840 68
50 9640 88
25 68
30 9620 8815 68
4-Bladed Propellers
Gage 1 Gage 2 Gage 5 Gage 6
5 1950 75 115 35 120 65 120 17o5 120
4 1800 65 115 21o5 115 50 115 15 1153 1600 25 103 22»5 103 45 103 20 1032 1400 15 96 12o5 96 17o5 96 9 961 600 - - 2.5 5
Gage 1 Gage 3 Gage 4 Gage 5Recorder Recorder
12 1950 40 124 50 124 Failed (3) Failed (3)
10 1800 40 116 60 116 70 116 50 11611 1600 25 104. 55 104 65 104 35 1049 UOO 20 96 35 96 45 96 20 96
(1)
(2)
(3)
- All strain amplitudes in micro-inches per inch.
- All frequencies of vibration in cycles per secondo
- Recorder stylus failed because of excessive amplitude ofstrain, value exceeded 125 micro-inches per inch in bothtension and compression, or 250 micro-inches per inchpeak to peako
-79-


L THEORETICAL STRESS CALCULATED FROM PRESSURE DATA
SIMPLE SUPPORTED CONDITION
SLAM A
Time P5 {6 )M
v x'o
-1.19 -9743
0,05 -0.95 -7778
0,10 -0.48 -3930
0.15 +0.48 +3930
0.20 +1.20 +9824
0.25 +0.84 +6877
0.30
0.35 -0.48 -3930
0.40 -0.84 -6877
0.45 -1.10 -9005
0.50 -1.32 -10807
SLAM D
P5 (Ox x'o
-0.84 -6877
-0.96 -7860
-0.60 -4912
+0.47 +3848
+2.38 +20303
+4..00 +32748
+2.15 +17602
+0.84 +6877
-0.12 - 982
-0.48 -3930
-0.48 -3930
(1)- {6 ) is the transverse stress at the center
of the panel
o
-80-


-1 THEORETICAL STRESS CALCULATED FROM PRESSURE DATA
MEMBRANE ANALYSIS
SLAM A SLAM D
Time P5 p2/3 (O (1)
v x'o ((Oa/2(2)
p5 p2/3
x x'o «-A/2(2)
-1.19 1.0117 2812 3925 -0.84 0.890 2474 3453
0.05 -0.95 O.9664 2687 3750 -O.96 0.973 2705 3775
0.10 -0,48 B.612 1701 2374 -0.60 0.711 1977 2759
0,15 +0.48 0.612 1701 2374 +0.47 0.604 1679 2343
0.20 +1.20 1.1128 3093 4318 +2.38 2.020 5615 7838
0.25 +0.84 0.890 2474 3453 +4»00 2.520 7056 9778
0.30 +2.15 lo637 4531 6324
0.35 -0.48 0.612 1701 2374 +0.84 0.890 2474 3453
0.40 -0.84 0.89 2474 3453 -0.12 0.243 676 943
0.45 -1.10 1.0656 2962 4135 -0.48 0.612 1701 2374
0.50 -1.32 1.204 3347 4672 -0.48 0.612 1701 2374
- (0) is the transverse stress at the center of the panel.x x o c
(2) - {,€ ) /« is the stress at the middle of the long edge.
-81-


APPENDIX "C"
CALCULATIONS
1. Smooth Planing Pressure Distribution (NACA TN 2583)
Theoretical
Data:
At 1950 RPM
y = planing velocity = 33.78 ft.
|" = trim angle = 6°
Ap = wetted length = 29.0 lb.
O = beam at this location =8.50 ft.
Calculations:
(1) From figure 9, page 25
For^rff% = 3.U beams Chip =0.052
r= *p ^
(2) =- = 0.95 / "-v TransversePc ^ Distribution
,<Therefore
(r \'{- °HP 0.052
v NP'c 0.95 0.95
(C„p)c
= 0.0546
->
(3) Longitudinal Pressure Distribution 1 from figure 4., page 21
_ « / 1
\
P = longitudinal pressure distribution
1/2 f2 /LP' r P = 0.95 P.xbo " c
-82-


% %V %r0.6 0.040
0.1 0.01 0.7 0.050
0,2 0.015 0.6 0.068
0.3 0.020 0.9 0.100
0.4 0.025 0.95 0.1^0
0.5 0.031 1.00 1.000
Stagnation pressure = !?*•_ 1q99
(33.78) 2
= 1135 psf
\ A %? t*.b oSsh fo S.M. F(A) ARM F(M)
0.0 1 10
0.1 2.9 0.01 11.35 9o50 9«03 102 4 408 9 3672
0.2 5.8 0.015 17.00 9o50 9o03 154 2 308 8 2464
0.3 8.7 0.020 22.70 9o66 9ol8 208 4 832 7 5824
0.4 11.6 0.025 28.37 10.20 9o69 275 2 550 6 3300
0.5 U<>5 0.031 35.19 10.34 9o82 346 4 1384 5 6#20
0.6 17.4 0.040 45<>40 10.25 9o74 442 2 884 4 3536
0.7 20.3 0.050 56.75 10.20 9o69 550 4 2200 3 6600
0.8 23.2 0.068 77.18 10,00 9o50 733 1 1099 2 2198
0.85 24o65 0.080 90.80 9»75 9»26 841 2 1682 1 2523
0.90 26.1 0.100 113.50 9.50 9o03 1025 1 1025 1 1025
0.95 27.55 0.U0 158.90 8.82 8.38 1332 2 2669 1332
1.00 29.00 1.00 1135oOO 8.50 8.08 9170 4583
^ 17619 <£ 39324
-83-


3Force = =** x 17619
Force = 17032 lbs,
S F(m)F(A)
2o90 x 3932417619
6 o 4.73 fto fromentry
22 o 527 ft. forward fromtransom °F
Recorded Pressure In Slamming
For slamming condition we recorded P at three different longitudinal
locations..P.
P= 0,50 P
o"
2 c
Pc
psi
Ps
pst
b/2
ft
Po
lb/ftwt
from
Transom
*A 2o98 429 4«50 1930 27o3 ft.
P5 5«57 802 ^75 3810 25o5 fto
P6 lo45 209 5o00 10215 23 o 3 fto
These points were plotted
on page /0 in order to
compare the values with
normal planing condition©
2 Static Displacement
Data:
The drafts were known by taking the distance from the sheerline to
VJL at resto
Drafts referred to the base line (*) were:
At Station 3: 3'6n
At Station 5: 3'A"
At Station 8: 3'0 W
(*) - USCG Plan No<> 40-UT-0103-10-84-


From the (*) we got the sectional areas, and from here we got the
total A of the boat and the position of the center of gravity,,
A CALCULATIONS
ORD VAL Fs F(v) Arm F(M)
4o85 1 4o85
1 6ol0 U 24..40 1 2U°U0
2 80OO 2 I60OO 2 32»00
3 10*50 U 42o00 3 I260OO
U 12,50 2 25oOO A lOOoOO
5 13o05 U 52.20 5 I6I0OO
6 12,90 2 25»80 6 154,80
7 11,50 U 4-6,00 7 322o00
8 7c60 2 15o20 8 121o60
9 3o50 4 HoOO 9 126o00
10 1 10
A = f ^, = ^ x 265,4-5 = Dist. of CG from transom x :
3 -L ^
A - ?»A a* - -S^
2 - -3o8 x 1267.80A " 336°23 x "^ " 265^5
A = Vx P = 336o23 x 64.
A = 21518.78 lbs,X = 18oU6 fto
Boat A = 21518 lbs
Dist.CG from Transom = 18,146 ft.
(*) - USCG Plan No. 40-UT-0103-10
-85-


3« Buoyancy Data at 1900 RPM
The boat is down by the bow at rest by
UJ = tangent"1
||^ = tangent"1
0o0281
U)= 1°37»
This data was taken from draft readings
o
The approximate trim angle at 1900 RPM is 6°t
The mean planing waterline was developed from photographs of the
boat at 1950 RPM and also from observations as to the entry point and
draft aft at speed,
-1 27" -1The mean trim angle = tangent TpQxT^Y"
= "tanSen'
t 0„07759
«
Mean trim angle = 4.°26 !e To this we add the trim by bow at rest
since our zero point is that angleo
Indicated trim angle 6°"J-
Actual trim angle 6°03'
Developing buoyancy from the sectional areas (immersed) by
placing a wave train as near to that observed as possible over the
mean trim planing waterline: (!' peak to trough) « See Fig„ $
Sta Disto from Transom Secto Area
BHA 26o 5' 0o92 ft2
BH6 22«5' 5.H ft2
FrlO Ho 5' 6019 ft2
Frl5 6000' 4»48 ft2
Transom llo39 ft2
-86-

Buoyancy at 1900 RPM with Observed Wave Train
ORD VALUE SM FV AEM FM
11.4 1 11„4
1 7o0 4 28.0 2 56
2 5.-4 2 10o8 4 43.2
3 4o4 A 17o6 6 105.6
A 4.8 2 9«6 8 76o8
5 5o5 A 22c0 10 220
6 6o0 2 12o0 11 132
7 6.4 4 25.6 H 358.4
8 6o5 2 13 .0 16 208
9 6.4 4 25o6 18 460.8
10 6o0 2 12o0 20 240
11 5o2 4 21o6 22 475.2
12 3o6 2 7o2 24 172,8
13 lo5 4 6o0 26 156
H Oo3 1 0»3 28 8.4
-ZL 222o7 2713.2
V = 222o7 x | = 148.47 ft3 x 64 = 9502ol lb,
CB = FM/FV = 12ol8 ft. Fwd of Transom
Moments About Transom
Clockwise: 21,518 lb* x 18.15 ft. = 390,552 Weight
Counterclock: 9,502 lbo x 12,18 ft, = 115.734- Buoyancy
274-,818 Dynamic
Dynamic Force = 21,518 - 9,502 = 12,016.
-87-


07/ 818Center of Pressure = no*016
= 22 °87 ft ° Fwdo Transom
Buoyancy = Jj
p' -g = 44.<,l6$
Dynamic = ||*~| = 55.8#
4» Calculation of Stresses From Pressures on Forward Plate
(a) Dynamic load factor at P5 by method of (10), pages 4-7©
From the data of slam F, run #23, 10/V58, at a speed of
1800 RPM;
t = 0o06 secondo
*i= 0ol8 second
a = 24", b = 16", t = 0ol225'
f " MK = Ho 28
f = 9730 fj = 9730(Uo28)(oa22g) = 66o5na2
(16)2
cps
T =f~
= 66~"? = Oo015 secondn
*i- P*,015T
By using figure 3 of (10) , page 7,
For =- = ^"q-.^ = 4.0O, the magnification factor for our boat
equals l«0 o
-88-


(b) Stress Evaluation, Fixed Edges
From the pressure values we can estimate the stresses for
fixed edges by (22), page 286,
Q, and U- are coefficients given as a function of 7- in figure 7
page 286 of (22)*
f = ^8 1
= °»076
£ 2= 00037
6*fe
6xt2
(^ x) . 6(-Q.076)(l6)
2p = -778Qpx-0, y-r2
( 0o i225)2
o,
(<rx)x=fey =% =_ 6(0o037) (16) p3780p
(0.1225)
For the highest pressure recorded, 5<>l6 psi,
&K -o v-a-s = - 7780(5d6) = - 4.0,100 psi.x - 0, y- /2
( *)x =j^
^ = 3780(5ol6)= 19,500 psi.
The tabulation of values calculated are found in Appendix B2o
-89-


(c) Stress Evaluation, Simply Supported Edges
From the pressure values we can estimate the stresses by (22),
page 285
o
^ is given as a function of |~* in figure 7o2, page 285»
A s 24 s 15b 16
lo5
P> = 0o08
6Mx , /rt ArtW,/\2x̂)
o x-^v-^ =2
= 6(0.08) (16) ^p = 8,187pZ Z %
(0ol225)
For the highest pressure recorded, 5<>l6 psi,
(£*)_ _ l v = 8,187(5.16) = 42,245 psio
The tabulation of values calculated are given in Appendix B2o
(d) Stress Evaluation, Membrane Analysis
From the pressure values we can estimate the stresses by (22)
,
pages 288-290
o
^ x = 0,y =%=^6V p E 7
W*.-fc. r-f»«V* **
/XL _ and/ft, are given as a function of 7- in figure 7«5, page 290
<
§ = 1»5, /7l 6= 0*370, /TLj = 0.265
-90-


For the highest pressure recorded, 5<,l6 psi,
3^ = 0, 7 =% =0 - 370
•tox-k.r**" *65
30(106)(2A)
2(5,16)
(0.1225)2
30(106)(2A)
2(5ol6)
(0,1225)2
= 11,550 psi,
8,260 psi,
5» Calculation of Stresses From Strain Data
(a) Center of panel, 6 x
£ x = <^5
l -/(/
> /*- = 0o3*
The tabulation of values calculated are given in Appendix B3,
(b) Center of panel, maximum principal stress
ft - ft
The tabulation of values calculated are given in Appendix B3,
-91-


(c) Edge of panel, x
<5 X =f2
r, =
1 -/L2
/6 = 0.3
h
—
it."—
H
The tabulation of values calculated are given in Appendix B4-«
4 Determination of the Natural Frequency of After Panel
F = 9730Kh
K = frequency number for plate. This is a function of
— and end support condition
o
a = 12"h = plate thickness in inches. .
1_B
b 15a = short side in inches. — = r-*- = 1.25
a x<c
For simple edge support:
- 9730(16.7) (0.1225)
1U
For fixed edge condition:
tt - 9730(30.7) (0.1225)
1U
= 138
= 254
-92-


"^ Calculation of Frequency Ratio for 3 and ^-Bladed Propellers
No.of Blades Simple Support Fixed Edges
3 138= Oo695 Hi
= Oo378
ii °- 370 It °^72
-93-


APPENDIX "D"
BIBLIOGRAPHY
lo Bledsoe, Margaret Do, Series Investigation of Slamming Pressures,DTMB Report 1043, December, 1956„
2. Diehl, Walter So, The Application of Basic Data on PlaningSurfaces to the Design of Flying Boat Hulls, National AdvisoryCommittee for Aeronautics, Report No. 694, 1940
o
3. DuCane, Peter, High Speed Small Craft, Temple Press Limited,London, 1951
o
4» DuCane, Peter, Commander, R N», The Planing Performance, Pressures,and Stresses in a High-Speed Launch, The Institution of NavalArchitects, Paper No<> 1, June 7, 1956-
5. Edge, Phillip Mo, Investigation of Chine Immersed Models HavingConcave-Convex Transverse Shape and Straight or Curved Keel Lines,NACA Technical Note 3940, February, 1957o
6. Fedenko, G« I», The Dynamic Analysis of Ships' Plate Supported byFraming, Shipbuilding, Ministry of the Shipbuilding Industry andthe Scientific-Technical Society of Shipbuilding, Leningrad, No» 10,1956o Translated by A. Ho Skinner, January, 1957o
7» Greenspon, J« E» , Stresses and Deflections in Flat Rectangular Platesi
Under Dynamic Lateral Loads Based on Linear Theory, DTMB Report 774>April, 1955.
80 Greenspon, J* E, end Wigle, Bo Mo, Strength Evaluation of PT Boats forRough Water Service, DTMB Report C-749, June, 1956*
9o Hudson, Go Eo, A Method of Estimating Equivalent Static Loads inSimple Elastic Structures, DTMB Report 507, June, 1943
o
10o Jasper, N. Ho, Dynamic Loading of a Motor Torpedo Boat During HighSpeed Operations in Rough Water, DTMB Report C-175, September, 1949-
11. Jasper, N. Ho, Study of the Strains and Motions of USCGC CASC0 atSea, DTMB Report 781, May, 1953o
12 • Kazvo, Ochi, Model Experiments on Ship Strength and Slamming inRegular Waves, The Society of Naval Architects and Marine Engineers,November, 1958
o
-94-


BIBLIOGRAPHY (cort «d)
13* Levenson, M« and Sussholz, Bo, The Response of a System with a
Single Degree of Freedom to a Blast Load, DTMB Report 572,
December, 1947o
Ho Lewis, Fo Mo, Propeller Forces Exciting Hull Vibration, SNAME,
195Ao
15c Lord, Lindsay, Naval Architecture of Planing Hulls, Cornell
Maritime Press, New York, 194.6°
I60 Milivitsky, Benjamin, Generalized Theory for Seaplane Impact,
NACA Report 1103, 1952o
17o Mottard, Elmo Jo, Preliminary Investigation of Self-ExcitedVibration of Single Planing Surfaces, NACA Technical Note 3698,June, 1956o
18 Murray, Allan Bo, The Hydrodynamics of Planing Hulls, Societyof Naval Architects and Marine Engineers, February, 1950 o
19 o Sanborn Company, Sanborn 150 System Instruction Books,Waltham, MassachusettSo
20o Saunders, Harold Eo, Hydrodynamics in Ship Design, Volumes 1 and
2, The Society of Naval Architects and Marine Engineers, New York,
1957p
21o Schnitzer, Emanual, Theory and Procedure for Determining Loadsand Motions in Chine Immersed Hydrodynamic Impacts of PrismaticBodies, NACA Report 1152, 1953
»
22o Sechler, E» Eo and Dunn, Lo G , Airplane Structural Analysis andDesign, Wiley and Sons, New York, 1942
o
23o Shimanskiy, Yu Ao, Dynamic Analysis of Ship Structures, StatePublishing House of Shipbuilding Literature, Moscow, 1948
o
24o Shoemaker, James Mo, Tank Tests of Flat and V Bottom PlaningSurfaces, National Advisory Committee for Aeronautics, TechnicalNote Noo 509, November, 1934-o
25o Shoemaker, James Mo and Parkinson, John Bo , Tank Tests of aFamily of Flying Boat Hulls, NACA Technical Note Noo 491,February, 1934-
»
26o Shufford, Charles Lo, Jr«, A Review of Planing Theory and ExperimentWith a Theoretical Study of Pure Planing Lift of Rectangular FlatPlates, NACA Technical Note Noo 3233, August, 1954-<>
-95-


BIBLIOGRAPHY (cont'd)
27o Shufford, Charles L Q , Jr D , A Theoretical and Experimental Study,
of Planing Surfaces Including Effects of Cross Section and PlanFontto, NACA Technical Note No 3939, March, 1957 o
28o Skene, Normal Lo, Elements of Yacht Design, Dodd, Mead andCompany, New York, 1944°
29» Smiley, Robert Fo, A Semi-Emperical Procedure for Computing theWater Pressure Distribution on Flat and V Bottom PrismaticSurfaces During Impact or Planing, NACA Technical Note Noo 2583,December, 1951o
30o Sotlorf, Wo, Analysis of Experimental Investigations of thePlaning Process on the Surface of the Water, NACA TechnicalMemorandum 1061, March, 1944°
31o Steiner, Margaret Fo, Analysis of Planing Data for Use inPredicting Impact Loads, NACA Technical Note No<> 1694, August,1948o
32o Szebehely, Vo Go, Hydrodynamics of Slamming of Ships, DTMBReport 823, July, 1952o
33o Szebehely, Vo Go and Brooks, So Ho, Preliminary ExperimentalInvestigation of Slamming, DTMB Report 812, July, 1952«
34o Szebehely, Vo Go and Todd, Mo Ao, Ships Slamming in Head Seas,DTMB Report 913, February, 1955°
35° Szebehely, V Q Go, Todd, M» Ao and Lum, So Mo, On Slamming, DTMBReport 995, January, 1956o
36o Todd, Mo Ao, Slamming Due to Pure Pitching Motion, DTMB Report883, January, 1955o
37» Uo So Air Force, Methods of Analysis for Structures Subjectedto Dynamic Loading, Dolo Report, USAF, 1949<>
38o Wadman, Rex W Q (Editor), The Diesel Engine Catalog, Volumes 20,21 and 22, Diesel Progress, Los Angeles, California, 1955, 1956and 1957
o
39o Wagner, Herbert, Planing of Watercraft, NACA Technical Memorandum1139, February, 1948 «
40o Warner, Edward P«, Airplane Design, Performance, McGraw-Hill BookCompany, Inco, New York, 1936o
-96-


lhesB8094
D2f"]'
C pressures and plating responsei
3 2768 002 07966 7_DUDLEY KNOX LIBRARY
'
[•;
;
-
:
milrlrittii
lllttlsiifil'tiUlUmmmmm
ititumiwunyii
m « tffifl