Embed Size (px)
Citation preview
Dynamic measurements of drainage capillary pressurecurves in carbonate rocks
Sayed Alireza Hosseinzadeh Hejazia,∗, Saurabh Shaha,b, Ronny Pinia,b
aDepartment of Chemical Engineering, Imperial College London, London, UKbQatar Carbonates and Carbon Storage Research Centre, Imperial College London, London,
UK
Abstract
The heterogeneity of rocks represents a challenge for interpreting and usingoutcomes from multiphase-flow experiments carried out on laboratory samples.While the capillary pressure−saturation function, pc(S), is known to vary spa-tially and cause local saturation development during immiscible displacements,its variation remains difficult to measure. This is particularly challenging forrocks with complex fabrics, such as carbonates. Here, we present a workflowfor the dynamic measurement of core- and subcore-scale drainage pc(S) curvesin heterogeneous porous media. Multi-rate, two-phase core-flooding tests areconducted on three carbonate rocks with direct observations of local saturationdata. The interpretation of the experiments is done by fitting the parametersof the pc(S) curve, while describing both steady-state saturation and pressureprofiles with a detailed one-dimensional model that accounts for the variation ofsubcore-scale properties in the direction of displacement. Workflow validation isachieved by means of synthetic data, thereby demonstrating the uniqueness ofthe solution of the resulting multi-objective optimisation problem. The modelreproduces accurately experimental data on the three rocks and enables com-puting the effective core-scale pc(S) curve in the limit of zero velocity, as itwould be expected during a porous-plate experiment. The output of the pro-posed technique is however much richer and includes the relative pc(S) curvethat is universal and independent of the specific pattern of heterogeneity, inaddition to a set of scaling factors. The latter describe the distribution of thepc(S) curves at the subcore-scale due to heterogeneity and form the statisticalbasis needed for upscaling studies.
Keywords: capillarity, core analysis, porous media, multiphase flow2010 MSC: 00-01, 99-00
∗Corresponding authorEmail address: [email protected] (Sayed Alireza Hosseinzadeh Hejazi)
Preprint submitted to Chemical Engineering Science February 3, 2019
1. Introduction
The capillary pressure (or retention) function is a key constitutive relationin the continuum description of multiphase flow in porous media, because itencodes information on the pore-space, the fluids and their interaction withthe medium. With relevance to petroleum systems, the capillary pressure de-5
termines the original distribution of fluids within the reservoir and it controlstheir relative movement during injection and production [1]. Measurements ofcapillary pressure curves in rocks are very common in core-analysis workflows.Because of its speed of measurement, most of the data on rocks reported inthe literature have been acquired by Mercury Intrusion Porosimetry (MIP) and10
have used the Young−Laplace equation to convert the curve for the mercury/airsystem to a more representative fluid pair, e.g., oil/water or gas/water [2]. How-ever, the inherent difficulty in approaching the actual wetting conditions is stilla major limitation of MIP, as compared to methods that allow for the use ofreservoir fluids and the application of representative pressure and temperature15
levels. Some of these experimental approaches include (i) the porous-plate (or-diaphragm) method [3, 4, 5] (and a modified version thereof that uses a mem-brane [6]), and the (ii) semi-dynamic method [7] (and its extension using in-situimaging by Nuclear Magnetic Resonance (NMR) [8] or X-ray Computed To-mography (CT) [9]). This approach is referred to as dynamic, because fluids20
are flowing during the measurement, irrespective of the presence of so-calleddynamic capillary pressure effects [10]. Capillary pressure curves have also beenestimated by relating them to pore-scale liquid-liquid curvature measurementsfrom micro-CT [11, 12, 13]. All these methods require more complex apparatuses(e.g., a full-fledged core-flooding system with a fluid circulation loop [3, 14, 13])25
and entail elaborated experimental procedures. Moreover, for the porous-platemethod, one drainage point can take several days to reach equilibrium [15] andmore than a month may be required to measure one complete curve [6]. A prac-tical alternative to these conventional methods is the coupling of a two-phaseflow experiment with the numerical simulation of the displacement, where the30
capillary pressure curve (and/or any other petrophysical property) can be de-termined through history matching of the available measured data [16].
Irrespective of the experimental technique, the heterogeneity of rocks poses amajor challenge for designing and interpreting measurements of their multiphaseflow properties. The definition of a so-called Representative Elementary Volume35
(REV) is complicated by the presence of characteristic small-scale (mm−cm)features, such as laminations, layering and vugs [17, 18, 19], and may dependon the nature of the measured property (single- vs. two-phase flow) [20]. Infact, the interaction of capillary forces with these heterogeneities results in lo-cal saturation development during immiscible displacements in laboratory rock40
cores [21]. This phenomenon is referred to as ‘capillary heterogeneity’ and canbe described through the spatial variability of the capillary pressure−saturationfunction, pc(S) [22, 23]. The practical consequence for the core-analysis prac-titioner is that macroscopic observations of multiphase flows (e.g., saturations)are not only dependent on the scale of measurement, but also on the rate and45
2
direction of flow, as well as on the correlation length of the heterogeneitiesthemselves [24, 25, 26]. As a result, the corresponding petrophysical quantitymeasured on a rock core (e.g., the capillary pressure or the relative permeabil-ity curve) is inherently an effective property [27]. The latter is of limited usefor upscaling, if the presence of subcore-scale heterogeneities is not accounted50
for in data processing and interpretation [17, 23]. Because rock samples arenot homogeneous (and very rarely are they uniformly heterogeneous), labora-tory protocols are needed for effectively measuring multiphase flow propertieson heterogeneous rocks.
The ability to directly observe fluid saturation distribution using non-invasive55
techniques, such as nuclear imaging [28], acoustics [22] or X-ray CT [23], hasbeen a key enabling factor in the study of capillary heterogeneity in rocks.These early studies have highlighted the importance of this phenomenon incontrolling immiscible liquid-liquid displacements in porous media with simpleheterogeneities, such as layered sand- or bead-packs [22, 28] or two-dimensional60
slabs of laminated sandstone [23]. Most significantly, they have unequivocallydemonstrated that (i) capillary pressure must always be parameterized whensimulating immiscible displacements and that (ii) the observed heterogeneoussaturation profiles can be described using localized pc(S) curves. Experimentalobservations on consolidated rock cores are more recent and have focused on65
gas-water systems, for which the impact of capillary pressure heterogeneity isgreatest [29, 30, 31, 32, 25]. These studies have been instrumental towards de-vising experimental protocols that use the sensitivity of fluid saturation to vari-ations in the rock properties to map capillary heterogeneity spatially [9, 33, 34],instead of using empirical correlations. When coupled with a numerical sim-70
ulator [26, 35, 36, 37] and an optimisation routine [38, 39, 40, 41, 42], theseexperimental protocols become very practical, as they enable simultaneous pa-rameterisation of subcore-scale heterogeneities and of the corresponding effectivepetrophysical parameters through history-matching. Notably, the vast majorityof studies so far have focused on sandstones, while there have been limited ob-75
servations on carbonate rocks [38, 39]. Also, in all these studies efforts have beenintentionally directed towards estimating the relative permeability curve, whileimposing a capillary pressure function obtained from an independent measure-ment, typically from MIP. As anticipated above, the use of MIP data becomesan issue for systems where the wetting properties are uncertain [43], as it is often80
the case for mixed-wet reservoir rocks [44]. Moreover, MIP measurements haveto be carried out on a different (and smaller) sample; because heterogeneity inthe capillary pressure curve is at the basis of the characterisation effort, thisapproach is inherently flawed. This is particularly true for rocks characterisedby complex rock fabrics, such as carbonates [16, 45].85
In this study, we present a methodology to determine drainage capillarypressure curves at the core- and subcore-scale on heterogeneous porous media.In contrast to the previous work that has largely focused on sandstones, thisstudy considers three carbonate samples spanning a wide range of porosity andpermeability values (19−51 % and 80−1900 mD, respectively). In doing so, we90
also extend our previous developments of the method [9, 33] by introducing a
3
workflow that integrates flow experiments, modelling and multi-objective opti-misation, and where the spatial heterogeneity in the capillary properties of themedium is accounted for in all three elements of the analysis. Because the oc-currence of uniformity in rocks should be considered the exception, rather than95
the rule, this approach increases the operating envelope of common reservoircore-analysis practices, where heterogeneities are systematically neglected (oravoided) in measurement and interpretation.
The remainder of the paper is structured as follows. In Section 2 are de-scribed the routine characterisation work on mm-scale plugs and the experimen-100
tal procedure for the multi-rate two-phase drainage tests on the large cylindricalcores. A complete derivation of the mathematical models (homogeneous andheterogeneous) used for interpreting the experiments is described next (Sec-tion 3), along with the procedure for their numerical solution and the multi-objective optimisation routine used for history matching. We then present a105
validation of the proposed workflow by means of synthetic experiments (Sec-tion 4) and its application to the experiments on the rock cores (Section 5).Section 6 includes a discussion on the characterisation of capillary heterogene-ity for the three carbonate samples and the estimation of the correspondingeffective capillary pressure curves.110
2. Experimental
2.1. Materials
Three carbonate rocks cores were used representing a range of reservoir prop-erties; these include Ketton Limestone (KL, Ketton Quarry, Rutland, UK), Ed-wards Brown Carbonate (EB) and Indiana Limestone (IL, both sourced from115
Kocurek Industries INC., Caldwell, TX, USA). To facilitate comparisons againstthe more heterogeneous carbonates, previously published data [46] on a BereaSandstone (BS) core are also considered in our analysis. Table 1 summarisesvarious properties of the samples, including dimensions, average porosity (mea-sured by X-ray CT) and permeability (measured upon application of Darcy’s120
law to multi-rate injection tests conducted at experimental conditions with wa-ter). The core-averaged porosity, φm, differs significantly among the samplesand takes the following values: 26% (KL), 19% (BS), 51% (EB) and 19% (IL).The measured core permeability decreases in the order KL (1900 mD) > BS(330 mD) > EB (190 mD) > IL (80 mD) and shows no correlation with the125
porosity. Figure 1 shows the variation in porosity along the length of each corethat has been measured every 2 mm by X-ray CT (see Section 2.3). In thefigure, the dashed horizontal lines represent one standard deviation from themean, std(φ). The degree of porosity variation differs among the samples withstd(φ) increasing in the order BS (0.6%abs.) < KL (1%abs.) < EB (1.4%abs.)130
< IL (2.7%abs.).
2.2. Routine core analysis on mm-plugs
To further characterise the heterogeneity of the samples, up to six smallcylindrical plugs (diameter 8 mm, length 10 mm) were drilled from a section
4
adjacent to the inlet face of each core. The skeletal density of each plug wasmeasured by Helium pycnometry at 25◦C and 135 kPa using a MicromeriticsAccuPyc II 1340, followed by the acquisition of capillary pressure curve byMIP in the pressure range from vacuum to 22.8 MPa using a MicromeriticsAutopore IV 9500. As described in a previous publication [46], the former isneeded to correct the MIP curve for unresolved pore space, so as to obtaina reliable estimate of the total sample porosity. The obtained skeletal (ρsk)and envelope densities (ρenv) of each plug are summarised in Tables S1−S4 ofthe Supplementary Information (SI) file. In the same tables, the parametervalues are also reported that have estimated upon matching the van Genuchten(vG) capillary pressure-saturation curve to the (corrected) MIP data. The vGequation reads as follows [47]:
pc(S) =1
α
(S−1/m − 1
)1/n(1)
where S = (S − Sir)/(1 − Sir) is the effective saturation of the wetting phase,while Sir, α and n are the fitted parameters and m = (n − 1)/n. Becausenitrogen (N2) and water were used as the nonwetting and wetting fluid phasesin the core-flooding experiments, the capillary pressure data were scaled priorto fitting on the basis of the interfacial tension, γ [2]:
pc,exp = pc,mipγexp/γmip (2)
where γmip = 485 mN/m (MIP) and γexp = 65 or 70 mN/m depending on thep, T conditions used in the core-flooding experiments (see Table 1).
The converted capillary pressure-saturation curves are shown in Figure 2,135
together with the corresponding vG fits (grey solid lines). The vG model pro-vides a very good description of the experimental MIP data on all rocks andsamples by capturing also the characteristic concave section of the curves at lowpc values. Again, the degree of variation differs among the four samples, withBS showing the most limited spread. We note that the variations observed for140
BS can be attributed almost entirely to differences in the parameter α, which isinversely proportional the so-called capillary entry pressure. On the contrary,the three carbonate rocks are characterised by variations in all three parame-ters (α, n, Sir), with IL having the largest degree of heterogeneity. Notably,the degree of slice-to-slice variations in porosity values of the larger cores (Fig-145
ure 1) is also observed among the mm-plugs, for which φ = 1 − ρenv/ρsk, i.e.,BS (φ ≈ 21%), KL (φ = 27− 28%), EB (φ = 41− 52%) and IL (φ = 19− 21%),although estimates from combined MIP/pycnometry are shifted systematicallyto slightly larger values. In Figure 2, the black solid lines represent compositecurves built upon combining the curves measured on the mm-plugs for each rock150
sample. These are representative of a sample with volume of 2−3 cm3, which isthus similar to the volume of each 2 mm-thick slice of the large cylindrical coresused in the core-flooding experiments. The parameters obtained upon fittingthe vG equation to each composite curve are reported in the caption of Fig-ure 2. As described in Section 3, our hypothesis is that at this scale variations155
5

in the capillary entry pressure can still be observed, but not in the values of n,Sir; accordingly, the parameter α is used to capture the development of localsaturations in the one-dimensional description of the two-phase displacement.
2.3. Core-flooding experiments
A multi-rate core-flooding technique is used to measure core- and subcore-160
scale scale drainage capillary pressure curves. The experiments were conductedusing the closed-loop, two-phase core-flooding system described in earlier pub-lications and installed in the Qatar CCS Multiscale Imaging laboratory at Im-perial College London [14, 25]. The experiments were carried out at a temper-ature of 20◦C and at an average pressure of 3 MPa using nitrogen (99.9992%165
purity, BOC, UK) and water as the nonwetting and wetting phases, respectively.For each experiment, the following procedure was adopted: the dry sample iswrapped in a heat-shrinkable polyolefin tube and mounted in the core-holder,which is subsequently placed horizontally on the bed of the scanning instru-ment (Universal Systems HD-350 X-ray CT scanner by Picker International,170
Inc.). The annular space of the core-holder is filled with water and is pres-surised to 5 MPa. A “dry-scan” is taken and the system (pressure lines androck sample) is purged with N2. The system is then brought to the experi-mental pressure by circulating N2 at constant volumetric flow rate. The secondbackground scan (“gas-scan”) is acquired and the system is then drained to175
atmospheric pressure. CO2 is used to purge the lines and the rock, followed bythe injection of water to dissolve CO2 and to saturate the rock. This step is car-ried out at the experimental pressure and is continued until at least 5−10 porevolumes (PV) have circulated through the rock core. The final background scanis taken (“water-scan”) and the permeability of the sample is measured (values180
reported in Table 1). The measurement of the capillary pressure curve startsby injecting N2 at constant volumetric flow rate to displace water until steady-state conditions are reached. At this point, the pressure drop across the rockcore is recorded and a CT scan is acquired. The flow rate is then increasedand the procedure is repeated. In this study, the injection flow rates varied,185
so as to cover a sufficiently wide range of capillary pressures (see Table 1 andSection 2.4). The steady-state porosity and wetting phase saturation profiles ofthe rock core are obtained upon combination of the given sets of scans for eachslice j:
φj =CTw,j − CT air,j
CTw − CTair(3)
Sj = 1− CTw,j − CT exp,j
CTw,j − CT g,j
(4)
where CT air, CT g and CTw refer to slice-averaged measurements from the190
three background scans, namely the dry-, gas- and water-scan. The denom-inator in Eq. 3 represent a normalisation with the CT numbers of the pure
6
fluids, which have been obtained from a calibration of the scanning instru-ment (CTw − CTair = 899 HU [48]). All images were acquired by applying atube voltage of 120 keV, a current of 200 mA, a 120 × 120 mm2 field of view195
(512 × 512 pixels) and a slice-thickness of 2 mm. Scanning of the entire bed(ca. 20 cm) required ca. 10 min. Slice-averaged porosity and saturation val-ues are obtained with a precision of φj ± 0.05% and Sj ± 0.5%, respectively.These values have been obtained by considering the random error affecting CTmeasurements that amounts to ±0.35 HU, when slice-averaged values are con-200
sidered. The corresponding uncertainties in the porosity and saturation valueshave been estimated using classic rules of error propagation [9]. Image analysisand data processing were carried out using in-house MATLAB codes.
2.4. Experiment design and interpretation
In its original version, the multi-rate core-flooding technique described above205
enables constructing a local pc(S) curve upon combining steady-state pressuredrop values measured across the sample at increasing flow rates with wettingphase saturations computed analytically [7] or observed in-situ at the inlet face(slice) of the sample [9]. For rock samples that are fairly uniform, such as BereaSandstone, one can expect that this local pc(S) curve applies at any position210
(slice) within the rock sample, i.e., it is truly a core-scale property [33, 34].In this study, we have relaxed this assumption by combining the experimentalobservations with a suitable mathematical model of the core-flood, where slice-to-slice variations in the capillary properties of the medium in the direction ofdisplacement have been taken into account [38]. This extension is needed in view215
of the heterogeneities observed in Figures 1 and 2, which are characteristic tocarbonate rocks. As explained in Section 3, this approach enables the estimationof the universal (or relative) capillary pressure curve for the given rock, inaddition to the sample-specific, core-scale pc(S) curve.
Irrespective of the spatial uniformity of the given sample, two conditions220
need to be met for the method to be applicable, namely that (i) flow is in thelaminar regime and that (ii) fluids are in local capillary equilibrium throughoutthe sample. Condition (i) ensures that Darcy’s law is valid and is described bythe value of the modified Reynolds number for packed-beds:
Re =ρud
µ(1− φm)(5)
where d is the particle (grain) diameter (O(d) ∼ 100 µm for the rocks consid-225
ered here), ρ and µ are the density (ρ ≈ 30 kg/m3) and viscosity (µ ≈ 20 µPa.s)of the (nonwetting) gas phase, u is the superficial velocity (u = q/A) and φm isthe sample porosity (values given in Table 1). For the experiments conducted inthis study, O(Re) ∼ 0.1, which is well below the threshold value of 10 for lam-inar flow [49]. Condition (ii) relies on the experimental observation that pc(S)230
curves measured when fluids are static or in motion are identical [1] and impliesthat static capillary pressure data apply to flowing systems. Such condition is
7
met when the relative strength of viscous to capillary forces, ∆p/∆pc, is small.At the pore scale, the latter can be defined as follows [50],
∆p
∆pc∼ uµd/k
γ/d= Knc (6)
where nc is the well-known capillary number, while K = d2/k is a con-235
stant that depends on the permeability, k. For the rock samples considered inthis study, O(d) ∼ 100 µm and O(k) ∼ 10−13 − 10−12 m2; accordingly, whenO(nc) ∼ 10−4 − 10−5, capillary and viscous forces are about the same. Forthe experiments conducted in this study, O(nc) ∼ 10−7 and below, suggestingthat local capillary equilibrium is attained at the scale of individual pores. This240
observation is in agreement with the current perception that any pore-scaledynamic effect on the capillary pressure becomes negligible at the viscosity ra-tio considered in this study, µg/µw = 0.02 [10]. Most significantly, we expectcapillarity to dominate the displacement also at the scale at which saturationmeasurements will be taken, as given by the so-called macroscopic capillary245
number, Nc [51, 52]:
Nc =l
L
∆p
∆pc(7)
where viscous and capillary pressure drop are now evaluated over the lengthof the sample, O(L) ∼ 100 mm, and of a CT slice, O(l) ∼ 1 mm. Maximumvalues of the viscous pressure drop are given in Figure 2, while ∆pc is estimatedfrom the (maximum) difference between the capillary entry pressure values (∼250
1/α) measured on the mm-plugs (values reported in the SI file, Tables S1-S4). We obtain that O(Nc) ∼ 0.1 and below, confirming that fluid saturationdistribution will be controlled by capillary pressure heterogeneity [25]. Thisfurther implies that the measured local saturation values can be used to mapand quantify the heterogeneities themselves, as it will be explained in Section 3.255
3. Modelling
In this section, the modelling approach is presented that will be used forinterpreting the two-phase displacement experiments in the rock cores. We willlargely follow the mathematical treatment presented in the early work by Daleand coworkers [27], which we combine here with (i) the description of the spatial260
variation in the capillary pressure curve using a scaling approach [33, 34] and(ii) a multi-objective optimisation routine for history matching.
3.1. Homogeneous porous medium
We consider steady-state and immiscible flow of a nonwetting (nw) and awetting fluid (w) in a horizontal, one-dimensional porous medium, as depicted in265
Figure 3. The fluids can be assumed to be incompressible, given that volumetricgas flow rates vary by less than 1% at the conditions of the experiments (∆p <
8
50 kPa). The capillary pressure relation and the Darcy’s equation for each fluidphase read as follows:
pc(S(x)) = pnw(x)− pw(x) (8)
ui = −kmkri(S(x))
µi
dpi(x)
dx(9)
where ui, pi and µi are the Darcy (superficial) velocity, the pressure and the270
viscosity of fluid phase i = w,nw; x ∈ [0, L] is the spatial coordinate and S isthe saturation of the wetting phase, which can vary in the interval [Sir, 1]; km isthe (absolute) permeability of the rock, while kri(S) is the relative permeabilitycurve. Conservation of mass further implies that the velocities of the nonwetting(unw) and wetting phase (uw) are constant, and so is the total velocity, u =275
unw + uw. For the situation where only the nonwetting phase is injected todisplace the wetting phase that initially saturates the porous medium, Eq. 9reduces to
q = −Akmkr,nw(S)
µnw
dpc(S)
dx(10)
where q is the volumetric flow rate and A is the cross sectional area of theporous medium. Eq. 10 thus describes the situation where at steady-state the280
wetting phase becomes immobile (uw = 0) and its pressure, pw, is constantacross the sample. Upon application of the chain rule to the term dpc(S)/dx,Eq. 10 is recasted as:
dS
dxD=
(qµnwL
Akm
)(1
kr,nw(S)
)(1
dpc(S)/dS
)(11)
where xD = 1 − x/L. A solution S(xD) of Eq. 11 is readily obtained upondefinition of an outlet boundary condition, Sout = S(0), and provision of closed-285
form expressions for the capillary pressure and relative permeability curves. Inthis study, the van Genuchten (vG) model (Eq. 1) has been chosen to describethe former, while the so-called van Genuchten-Burdine formulation (vGB) isused to describe the nonwetting-phase relative permeability curve. We notethat no additional parameters are introduced in the formulation of the kr,nw−S290
relationship, which is therefore uniquely defined by the capillary pressure curve.These equations, together with the differential form of the capillary pressurecurve, dpc(S)/ dS, are provided in Appendix A1.
The solution of Eq. 11 also determines the capillary pressure profile, pc(xD).In an experiment, upstream and downstream pressures are measured in the295
tubings just outside of the inlet and outlet faces of the porous sample; it canbe shown [7, 9] that the pressure drop across the sample, ∆p, at steady-statecorresponds to the value of the capillary pressure at the inlet face of the core,pc(S(1)), i.e.
∆p = pnw(xD = 1)− pw(xD = 0) = pc(S(1)) (12)
9
This relationship is important, because it provides a method to determine300
experimentally the capillary pressure curve in a fairly homogeneous porousmedium, such as Berea Sandstone [9, 14, 46, 53, 54]. We show here that the solu-tion of Eq. 11 does also reproduce the local saturation profiles observed in-situ.The data shown in Figure 4 have been published previously [46] and represent N2
saturation profiles that have been obtained at steady-state from X-ray CT mea-305
surements, while injecting the gas at a range of flow rates (q = 4− 60 mL/min)to displace water. The profiles are fairly smooth and are well described by thehomogeneous 1D model presented above. We note that Eq. 11 has been solvedin a fully predictive manner, as the pc(S) obtained from MIP measurements hasbeen used as input to the model (parameters provided in the figure caption).310
The ability of the model to reproduce the saturation profiles in BS confirms thesmall degree of (capillary) heterogeneity of this rock type, as inferred from thelimited scatter among the mm-scale pc(S) curves shown in Figure 2; these havebeen measured on plugs with a volume of about 0.5 cm3, which is significantlylarger than the single-phase porosity-based REV for fairly uniform rocks [55].315
3.2. Heterogeneous porous medium
To account for the variability in the capillary properties of system, the one-dimensional porous medium depicted in Figure 3 is divided into N elements oflength l. In this study, the latter is chosen so as to match the spatial resolu-tion at which saturation measurements are taken and represents therefore the320
minimum spatial scale of heterogeneity (REV∼ 2 − 4 cm3). Accordingly, eachelement j in the medium is characterised by a distinct capillary pressure func-tion, pjc(S), in addition to local values of porosity (φj) and permeability (kj).For capillary flow in porous media, capillary heterogeneity is manifested throughsmall-scale variations in the fluid saturation and can be quantified through the325
spatial variability of the capillary entry pressure parameter [33, 34]. While inthe Brooks-Corey pc(S) model, this parameter is defined explicitly through theso-called bubble point pressure [56], in the vG formalism the capillary entrypressure is inversely proportional to the parameter α. Accordingly, a scalingfactor fj can be defined that relates the distinct (local) capillary pressure func-330
tions to the corresponding function of a reference (homogeneous) system:
pjc(S) =1
fjpc(S) =
α
αjpc(S) for j = 1, ..., N (13)
This situation is depicted in Figure 3, where capillary pressure curves areplotted for elements that are characterised by a higher (pic(S), αi < α, fi < 1)and lower (pjc(S), αj > α, fj > 1) capillary entry pressure, as compared tothe reference curve, pc(S). To account for spatial variations in other properties335
of the medium (e.g., φ, k), the well-known J-Leverett function can be usedadditionally, J(S) =
√k/φpc(S)/γ [21, 22, 23]. With analogy to Eq. 13, a
relationship is thus obtained between the (capillary) scaling factor, the porosity
10
and the permeability:
fj =αj
α=
√kj/φjkm/φm
(14)
where, except kj , all the parameters on the right hand side are obtained ex-340
perimentally. Since the applicability of the J-Leverett function to non-sandstonerocks has been questioned [38], we will compare the results obtained with Eq. 14to those where local variations in permeability along the sample have beenneglected. With reference to Figure 3, the steady-state saturation profile inthe heterogeneous porous medium can be obtained in a manner analogous to345
the approach described for the homogeneous model, i.e. by solving Eq. 11 forxD ∈ [xj , xi] over the (homogeneous) jth element:
dS
dxD=
(qµnwl
Akj
)(1
kr,nw(S)
)(fj
dpc(S)/dS
)(15)
where l = xj − xi. Because at steady state capillary continuity at eachboundary between the elements needs to be satisfied, the boundary conditionto the jth element, S(x+j ), is obtained upon solving the following relationship,350
pj+1c (S(x+j )) = pjc(S(x−j )) (16)
where the superscript + and − refer to limiting values, as xj is approachedfrom upstream and downstream of the boundary, respectively. Hence, a bound-ary condition at the outlet of element i = j − 1 is established upon solvingEq. 15 and the complete solution for xD ∈ [0, L] is obtained recursively.
We note that the condition imposed by Eq. 16 leads to discontinuous sat-355
uration at the boundaries between the elements when capillary equilibrium isachieved, as seen in Figure 3. Accordingly, in the limit of zero velocity, thesaturation profile will be piecewise constant with each saturation step beingdetermined from
Sj =(pjc)−1
(pc) for j = 1, ..., N (17)
where pc is the core-scale, constant capillary pressure value. The correspond-360
ing core-averaged saturation, Save, is:
Save =1
Nφm
N∑j=1
φjSj (18)
The effective capillary pressure curve, pc(Save), can thus be constructed bychoosing capillary pressure values pc ∈ [0, pmax
c ] and solving Eqs. 17 and 18,where pmax
c is an arbitrarily chosen upper limit. This procedure represents thenumerical counterpart of the classic porous-plate experiment for measuring a365
core-scale drainage capillary pressure curve.
11
3.3. Numerical solution procedure
For homogeneous porous media, the ordinary differential equation (ODE),Eq. 11, is solved using the ode45 solver in MATLAB for xD ∈ [0, L]. Thesolver uses an implicit method for the numerical integration of the ODE based370
on backward differences with a variable step. The relative and absolute errortolerances have been set to 0.0001% and 1×10⁻⁶ saturation units, respectively;the maximum allowed step was limited to L/Ng, where Ng = 500 is the numberof internal nodes. The input parameters used for the model are the sampleproperties listed in Table 1. The saturation boundary condition at xD = 0375
(corresponding to x = L) is set equal to the saturation measured near theoutlet face of the sample by X-ray CT, i.e. S(0) = Sexp(x ≈ L). The saturationof the nonwetting phase is obtained from a fluid phase balance (Snw = 1− S),while the capillary pressure profile is computed from Eq. 1.
For heterogeneous porous media, a similar procedure is followed, although380
the ODE Eq. 15 is now solved only within a single element (xD ∈ [0, l]) withmaximum allowed step set to l/10; the boundary condition for the Nth elementis again set by the value measured at the outlet of the sample, while the conditionset by Eq. 16 is used to define local boundary conditions for the elements j =1, ..., N − 1. For the samples considered in this study L = 100 − 150 mm and385
l = 2 mm, resulting in N = 50 − 75 elements for which the ODE is solvedrecursively. The values of the scaling factors fj that are needed in Eq. 15 arefound by minimizing the following objective function:
E(xj) =
Nq∑k=1
(pc(S
exp(xj), qk)− fjpjc(Sexp(xj), qk)
pc(Sexp(xj), qk)
)2
, j = 1, .., N (19)
where Sexp are the measured slice-averaged saturation values, while the pa-rameterisation of pc(S) is produced by the optimisation routine (see the next390
section); the solution of the homogeneous model is used to define the referencecapillary pressure for the scaling, i.e. pjc(S
exp(xj), qk) = pc(SH(xj), qk), with
SH being the value of the saturation at xj obtained from solving Eq. 11 for theflow rate qk. This approach is justified, because, as opposed to fluid saturation,the capillary pressure profile is almost unaffected by the presence of small-scale395
heterogeneities, such as those encountered in rocks [38]. The denominator inEq. 19 ensures that a similar weight is given to each flow rate, while minimizingthe objective function for each slice. With analogy to early works on the scalingof hydraulic properties of soils [57], the minimization exercise is subject to thefollowing condition:400 ∣∣f − 1
∣∣ ≤ 0.01. (20)
where f represents the arithmetic mean of the scaling factors. If the condi-tion set by Eq. 20 is not met, the parameter α used in the homogeneous modelis normalised using the current value of f and the procedure is repeated until
12
Eq. 20 is satisfied. We also note that the availability of experimental observa-tions over a range of flow rates is important to constrain the value of the scaling405
factor, fj , which is unique for a given slice and independent of the flow rate.
3.4. Optimisation Routine and Workflow
The three components presented above, namely the determination of thelocal capillary scaling factors, and the solutions of the homogeneous and hetero-geneous models, are integrated into an optimisation routine to determine the410
capillary pressure curve of the rock, as described by the three parameters inEq. 1, namely α, n and Sir. We refer to this curve as the reference, because itprovides the basis for obtaining the local capillary scaling factors and we regardit as rock- rather than sample-specific. As such, it may differ from the effectivepc(S) curve, which is constructed from the average saturation in the given sam-415
ple and thus reflects a specific pattern of heterogeneity. When combined withthe scaling factors, fj , the obtained reference pc(S) function should provide thebest history match to the experimental saturation profiles and pressure dropvalues at steady-state at all flow rates. To this aim, the non-dominated sortinggenetic algorithm II (GA) in MATLAB global optimisation toolbox [58, 59] was420
used to minimise simultaneously the following two objective functions:
J1 =1
NqN
Nq∑k=1
N∑j=1
(Ssim(xj , qk)− Sexp(xj , qk)
Sexp(xj , qk)
)2
(21)
J2 =1
Nq
Nq∑k=1
(pc(S
sim(1), qk)−∆p(qk)
∆p(qk)
)2
(22)
where J1 quantifies the error between the simulated (‘sim’) and the exper-imental (‘exp’) saturation profiles, while J2 quantifies the error between themeasured pressure drop, ∆p, and the predicted capillary pressure value at theinlet of the sample, pc(S(1)), calculated from the reference pc(S) curve found by425
the optimiser. It is worth noting that, because of the nature of two-phase flow,the problem is truly bi-objective, whereby a trade-off exists between match-ing pressure and saturations points. Lower and upper bounds for the decisionvariables were set as follows:
αmip/3 ≤ α ≤ 3αmip
nmip/3 ≤ n ≤ 3nmip
min[Sexp(x)] ≤ Sir ≤ 3Smipir
(23)
where the subscript ‘mip’ refer to parameter values obtained upon fitting the430
vG pc(S) model to the composite curve obtained from the MIP measurementspresented in Figure 2 (parameter values given in the caption of the figure). Toensure physical consistency, the lower bound for the irreducible wetting phasesaturation was set to be equal to the lowest water saturation observed in theexperiment.435
13
Figure 5 provides an overview of the workflow of the parameter optimisationroutine used in this study. Briefly, the optimiser chooses a random set of deci-sion variables (the vG pc(S) model parameters) within the bounds defined byEq. 23 and the homogeneous model (‘Model Hom’, Eq. 11) is solved to producesaturation, SH(x), and capillary pressure, pc(S
H(x)), profiles. The latter are440
used to find the local scaling factors in the porous medium from the internalminimization routine, Eqs. 19 and 20. The scaling factors are used by theheterogeneous model (‘Model Het’, Eq. 15) to produce a new set of saturation,S(x), and capillary pressure profiles, pc(S(x)). The optimiser then calculatesthe objective functions, J1(S) and J2(∆p) and penalizes them if the following445
constraint is not met:
|khm − km|km
≤ 0.1 (24)
where khm is the harmonic mean of the local permeability values, kj , foundusing Eq. 14. This constraint guarantees that the mean permeability obtainedfrom the simulation is within ±10% of the experimental core-scale permeability.This constraint is automatically satisfied for situations where only variations in450
the capillary properties of the porous medium are considered. The values ofthe two objective functions are sent back to the optimiser, which introduces thenext generation of decision variables from a selection of the optimal sets andtheir combinations (elitism and crossover), in addition to randomly selectedmutations (stochasticity). In this study, the population size was fixed at 100455
times the number of decision variables (100 × 3 = 300) and the number ofgenerations was limited to 50. The complete set of solutions defines a Paretofront on the J1 vs. J2 plot from which the optimal outcome is identified. Thechoice of optimal set of vG pc(S) model parameters is case-specific and relieson the shape of the Pareto front for each set of optimisation. The optimisation460
routine was parallelized on multiple cores on a desktop workstation with one8-core Intel Xeon E5-2630V3 2.4 GHz processor and 256GB RAM. For a typicalexperiment considered in this study, the multi-objective optimisation problemwas solved in about two hours.
4. Workflow validation with synthetic experiments465
Two synthetic experiments have been carried out to validate the workflowpresented above. These tests were designed so as to closely reproduce the condi-tions of the N2/water multi-rate drainage core-flooding experiments carried outon the rock samples. To this aim, a set of vG parameters was used to define thepc(S) curve of the synthetic porous medium, in addition to a set of randomly470
distributed scaling factors, fi ∈ [0.7 − 1.3], to represent spatial heterogeneity.For each synthetic experiment, the output of the heterogeneous model is usedto represent “experimental” observations on which the full optimisation routinewas applied with the aim of recovering the original capillary pressure curve andscaling factors. For each test, the synthetic data set included saturation and475
14
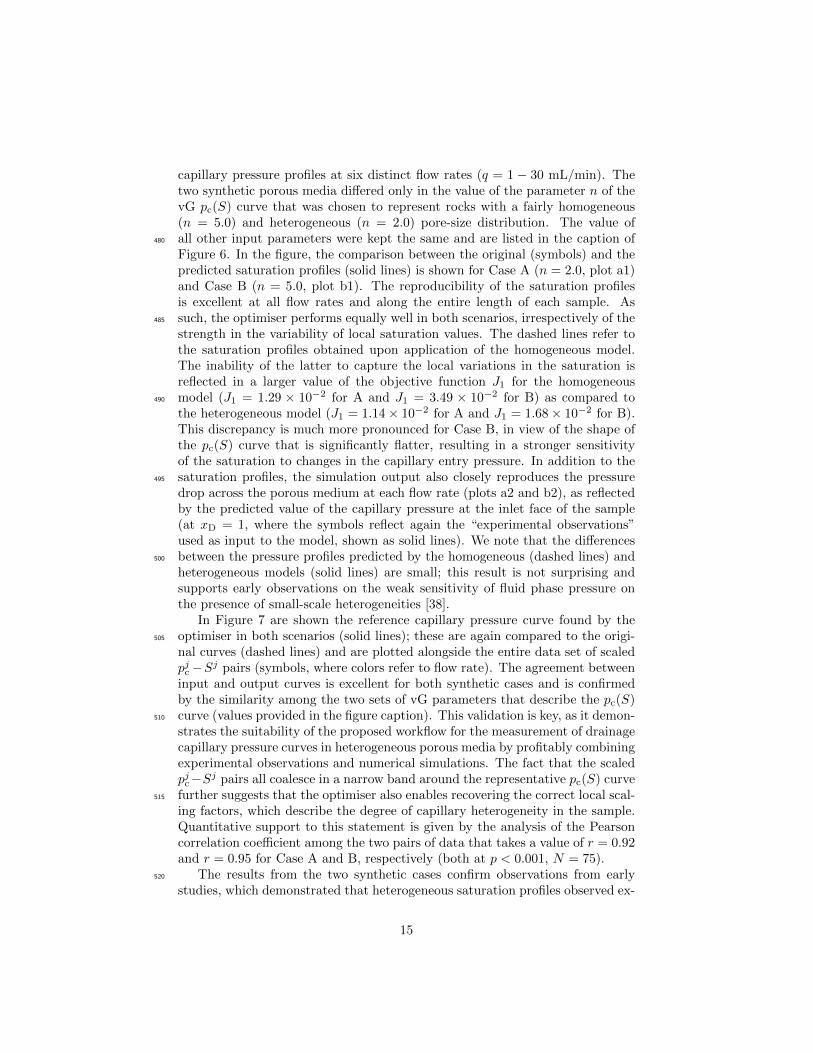
capillary pressure profiles at six distinct flow rates (q = 1 − 30 mL/min). Thetwo synthetic porous media differed only in the value of the parameter n of thevG pc(S) curve that was chosen to represent rocks with a fairly homogeneous(n = 5.0) and heterogeneous (n = 2.0) pore-size distribution. The value ofall other input parameters were kept the same and are listed in the caption of480
Figure 6. In the figure, the comparison between the original (symbols) and thepredicted saturation profiles (solid lines) is shown for Case A (n = 2.0, plot a1)and Case B (n = 5.0, plot b1). The reproducibility of the saturation profilesis excellent at all flow rates and along the entire length of each sample. Assuch, the optimiser performs equally well in both scenarios, irrespectively of the485
strength in the variability of local saturation values. The dashed lines refer tothe saturation profiles obtained upon application of the homogeneous model.The inability of the latter to capture the local variations in the saturation isreflected in a larger value of the objective function J1 for the homogeneousmodel (J1 = 1.29 × 10⁻² for A and J1 = 3.49 × 10⁻² for B) as compared to490
the heterogeneous model (J1 = 1.14× 10⁻² for A and J1 = 1.68× 10⁻² for B).This discrepancy is much more pronounced for Case B, in view of the shape ofthe pc(S) curve that is significantly flatter, resulting in a stronger sensitivityof the saturation to changes in the capillary entry pressure. In addition to thesaturation profiles, the simulation output also closely reproduces the pressure495
drop across the porous medium at each flow rate (plots a2 and b2), as reflectedby the predicted value of the capillary pressure at the inlet face of the sample(at xD = 1, where the symbols reflect again the “experimental observations”used as input to the model, shown as solid lines). We note that the differencesbetween the pressure profiles predicted by the homogeneous (dashed lines) and500
heterogeneous models (solid lines) are small; this result is not surprising andsupports early observations on the weak sensitivity of fluid phase pressure onthe presence of small-scale heterogeneities [38].
In Figure 7 are shown the reference capillary pressure curve found by theoptimiser in both scenarios (solid lines); these are again compared to the origi-505
nal curves (dashed lines) and are plotted alongside the entire data set of scaledpjc−Sj pairs (symbols, where colors refer to flow rate). The agreement betweeninput and output curves is excellent for both synthetic cases and is confirmedby the similarity among the two sets of vG parameters that describe the pc(S)curve (values provided in the figure caption). This validation is key, as it demon-510
strates the suitability of the proposed workflow for the measurement of drainagecapillary pressure curves in heterogeneous porous media by profitably combiningexperimental observations and numerical simulations. The fact that the scaledpjc−Sj pairs all coalesce in a narrow band around the representative pc(S) curvefurther suggests that the optimiser also enables recovering the correct local scal-515
ing factors, which describe the degree of capillary heterogeneity in the sample.Quantitative support to this statement is given by the analysis of the Pearsoncorrelation coefficient among the two pairs of data that takes a value of r = 0.92and r = 0.95 for Case A and B, respectively (both at p < 0.001, N = 75).
The results from the two synthetic cases confirm observations from early520
studies, which demonstrated that heterogeneous saturation profiles observed ex-
15
perimentally can be described using localized pc(S) curves [22, 28, 23]. We haveshown here that the same information can be used to determine the capillarypressure curve and to parameterise local heterogeneities, simultaneously. Withthese two examples, we have also demonstrated that the uncertainty around525
the uniqueness of the history matching approach can be avoided, when a multi-objective optimisation (saturation profiles and pressure drop) is considered.
5. Results
In the following, results from multi-rate drainage experiments using N2 andwater on three carbonate rock cores are presented, along with the application530
of the optimisation workflow to estimate the reference pc(S) curve for eachsample. Each experimental data set includes steady-state saturation profiles(measured by X-ray CT) and pressure drop measurements across the sample ateach flow rate. The properties or the rock samples are listed in Table 1. For eachexperiment, the output of the optimiser includes internal profiles in terms of (i)535
saturation, (ii) capillary pressure and (iii) capillary scaling factors, in additionto the set of vG parameters [α, n, Sir] that describes the pc(S) curve of the rockcore.
5.1. Steady-state drainage profiles
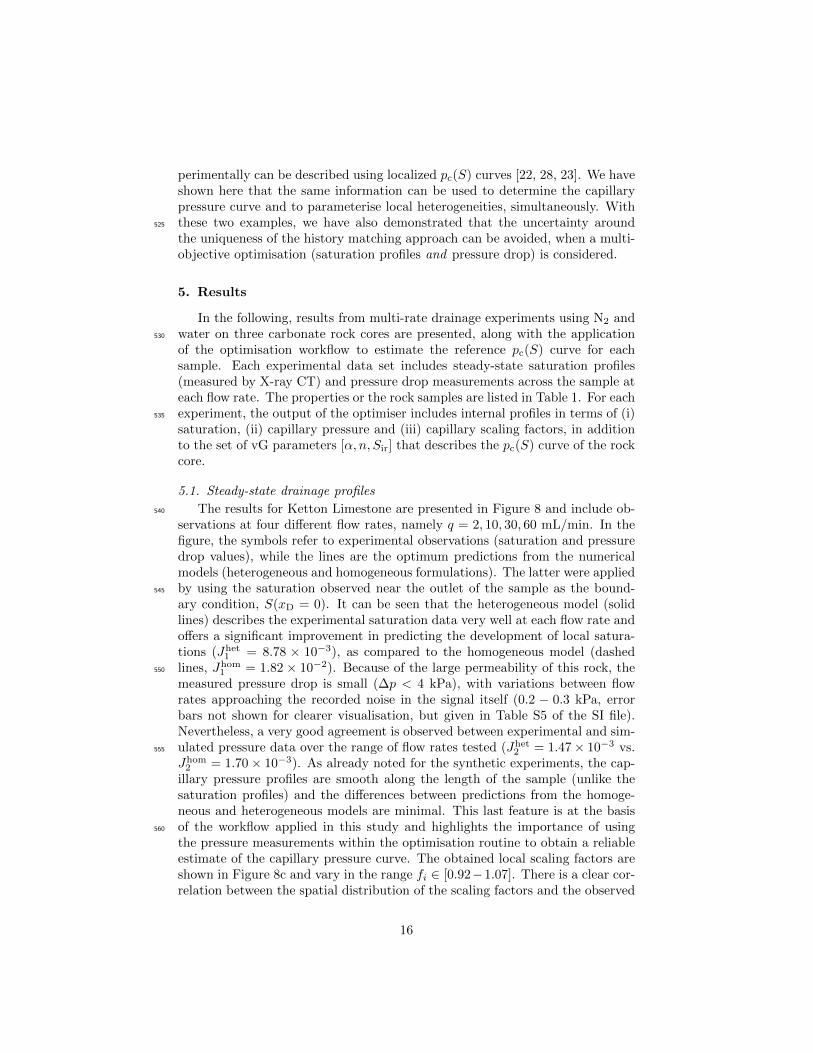
The results for Ketton Limestone are presented in Figure 8 and include ob-540
servations at four different flow rates, namely q = 2, 10, 30, 60 mL/min. In thefigure, the symbols refer to experimental observations (saturation and pressuredrop values), while the lines are the optimum predictions from the numericalmodels (heterogeneous and homogeneous formulations). The latter were appliedby using the saturation observed near the outlet of the sample as the bound-545
ary condition, S(xD = 0). It can be seen that the heterogeneous model (solidlines) describes the experimental saturation data very well at each flow rate andoffers a significant improvement in predicting the development of local satura-tions (Jhet
1 = 8.78 × 10⁻³), as compared to the homogeneous model (dashedlines, Jhom
1 = 1.82 × 10⁻²). Because of the large permeability of this rock, the550
measured pressure drop is small (∆p < 4 kPa), with variations between flowrates approaching the recorded noise in the signal itself (0.2 − 0.3 kPa, errorbars not shown for clearer visualisation, but given in Table S5 of the SI file).Nevertheless, a very good agreement is observed between experimental and sim-ulated pressure data over the range of flow rates tested (Jhet
2 = 1.47× 10⁻³ vs.555
Jhom2 = 1.70× 10⁻³). As already noted for the synthetic experiments, the cap-
illary pressure profiles are smooth along the length of the sample (unlike thesaturation profiles) and the differences between predictions from the homoge-neous and heterogeneous models are minimal. This last feature is at the basisof the workflow applied in this study and highlights the importance of using560
the pressure measurements within the optimisation routine to obtain a reliableestimate of the capillary pressure curve. The obtained local scaling factors areshown in Figure 8c and vary in the range fi ∈ [0.92−1.07]. There is a clear cor-relation between the spatial distribution of the scaling factors and the observed
16
saturation profiles. Features are visible in both experimental and simulated565
saturation profiles that are the direct manifestation of capillary heterogeneity;these include (i) the characteristic increase of the gas saturation along the direc-tion of flow for 1− xD ∈ [0.25− 0.65], which is opposite to the trend predictedby the homogeneous model, and (ii) the accumulation of gas saturation behindregions characterised by a steep decrease in the capillary scaling factor (e.g., at570
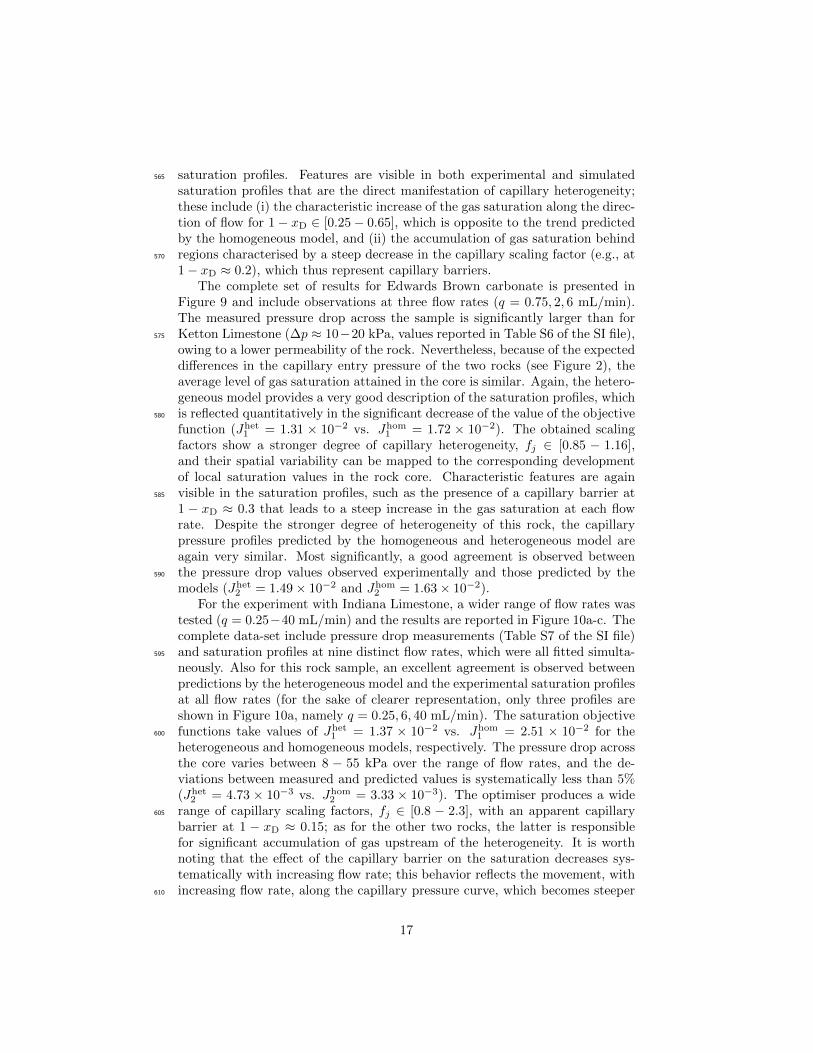
1− xD ≈ 0.2), which thus represent capillary barriers.The complete set of results for Edwards Brown carbonate is presented in
Figure 9 and include observations at three flow rates (q = 0.75, 2, 6 mL/min).The measured pressure drop across the sample is significantly larger than forKetton Limestone (∆p ≈ 10−20 kPa, values reported in Table S6 of the SI file),575
owing to a lower permeability of the rock. Nevertheless, because of the expecteddifferences in the capillary entry pressure of the two rocks (see Figure 2), theaverage level of gas saturation attained in the core is similar. Again, the hetero-geneous model provides a very good description of the saturation profiles, whichis reflected quantitatively in the significant decrease of the value of the objective580
function (Jhet1 = 1.31 × 10⁻² vs. Jhom
1 = 1.72 × 10⁻²). The obtained scalingfactors show a stronger degree of capillary heterogeneity, fj ∈ [0.85 − 1.16],and their spatial variability can be mapped to the corresponding developmentof local saturation values in the rock core. Characteristic features are againvisible in the saturation profiles, such as the presence of a capillary barrier at585
1 − xD ≈ 0.3 that leads to a steep increase in the gas saturation at each flowrate. Despite the stronger degree of heterogeneity of this rock, the capillarypressure profiles predicted by the homogeneous and heterogeneous model areagain very similar. Most significantly, a good agreement is observed betweenthe pressure drop values observed experimentally and those predicted by the590
models (Jhet2 = 1.49× 10⁻² and Jhom
2 = 1.63× 10⁻²).For the experiment with Indiana Limestone, a wider range of flow rates was
tested (q = 0.25−40 mL/min) and the results are reported in Figure 10a-c. Thecomplete data-set include pressure drop measurements (Table S7 of the SI file)and saturation profiles at nine distinct flow rates, which were all fitted simulta-595
neously. Also for this rock sample, an excellent agreement is observed betweenpredictions by the heterogeneous model and the experimental saturation profilesat all flow rates (for the sake of clearer representation, only three profiles areshown in Figure 10a, namely q = 0.25, 6, 40 mL/min). The saturation objectivefunctions take values of Jhet
1 = 1.37 × 10⁻² vs. Jhom1 = 2.51 × 10⁻² for the600
heterogeneous and homogeneous models, respectively. The pressure drop acrossthe core varies between 8 − 55 kPa over the range of flow rates, and the de-viations between measured and predicted values is systematically less than 5%(Jhet
2 = 4.73 × 10⁻³ vs. Jhom2 = 3.33 × 10⁻³). The optimiser produces a wide
range of capillary scaling factors, fj ∈ [0.8 − 2.3], with an apparent capillary605
barrier at 1 − xD ≈ 0.15; as for the other two rocks, the latter is responsiblefor significant accumulation of gas upstream of the heterogeneity. It is worthnoting that the effect of the capillary barrier on the saturation decreases sys-tematically with increasing flow rate; this behavior reflects the movement, withincreasing flow rate, along the capillary pressure curve, which becomes steeper610
17
as the irreducible water saturation is approached. The ability of the model tocapture this behaviour is remarkable. Most significantly, the subtle dependencyof local saturation values inside the rock sample on the flow rate implies thateffective (core-scale) two-phase properties, such as the capillary pressure andthe relative permeability curves, are rate-dependent, too [27].615
5.2. Unscaled and scaled capillary pressure curves
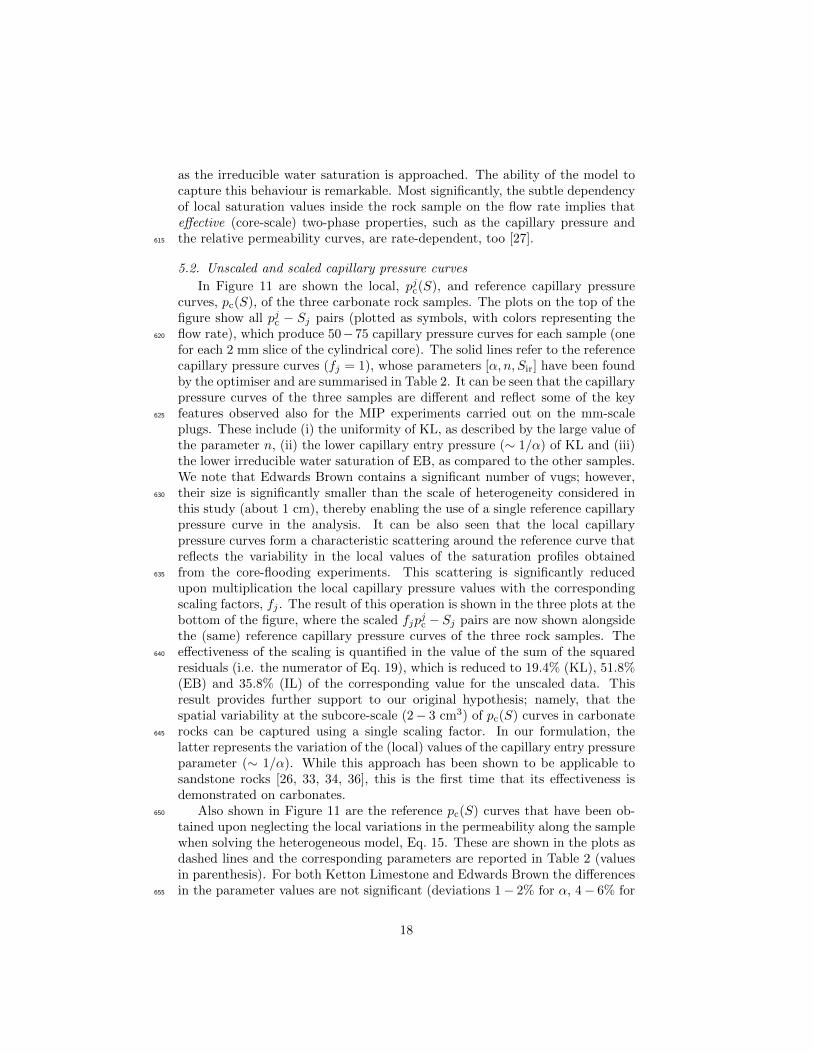
In Figure 11 are shown the local, pjc(S), and reference capillary pressurecurves, pc(S), of the three carbonate rock samples. The plots on the top of thefigure show all pjc − Sj pairs (plotted as symbols, with colors representing theflow rate), which produce 50−75 capillary pressure curves for each sample (one620
for each 2 mm slice of the cylindrical core). The solid lines refer to the referencecapillary pressure curves (fj = 1), whose parameters [α, n, Sir] have been foundby the optimiser and are summarised in Table 2. It can be seen that the capillarypressure curves of the three samples are different and reflect some of the keyfeatures observed also for the MIP experiments carried out on the mm-scale625
plugs. These include (i) the uniformity of KL, as described by the large value ofthe parameter n, (ii) the lower capillary entry pressure (∼ 1/α) of KL and (iii)the lower irreducible water saturation of EB, as compared to the other samples.We note that Edwards Brown contains a significant number of vugs; however,their size is significantly smaller than the scale of heterogeneity considered in630
this study (about 1 cm), thereby enabling the use of a single reference capillarypressure curve in the analysis. It can be also seen that the local capillarypressure curves form a characteristic scattering around the reference curve thatreflects the variability in the local values of the saturation profiles obtainedfrom the core-flooding experiments. This scattering is significantly reduced635
upon multiplication the local capillary pressure values with the correspondingscaling factors, fj . The result of this operation is shown in the three plots at thebottom of the figure, where the scaled fjp
jc − Sj pairs are now shown alongside
the (same) reference capillary pressure curves of the three rock samples. Theeffectiveness of the scaling is quantified in the value of the sum of the squared640
residuals (i.e. the numerator of Eq. 19), which is reduced to 19.4% (KL), 51.8%(EB) and 35.8% (IL) of the corresponding value for the unscaled data. Thisresult provides further support to our original hypothesis; namely, that thespatial variability at the subcore-scale (2− 3 cm3) of pc(S) curves in carbonaterocks can be captured using a single scaling factor. In our formulation, the645
latter represents the variation of the (local) values of the capillary entry pressureparameter (∼ 1/α). While this approach has been shown to be applicable tosandstone rocks [26, 33, 34, 36], this is the first time that its effectiveness isdemonstrated on carbonates.
Also shown in Figure 11 are the reference pc(S) curves that have been ob-650
tained upon neglecting the local variations in the permeability along the samplewhen solving the heterogeneous model, Eq. 15. These are shown in the plots asdashed lines and the corresponding parameters are reported in Table 2 (valuesin parenthesis). For both Ketton Limestone and Edwards Brown the differencesin the parameter values are not significant (deviations 1− 2% for α, 4− 6% for655
18
n and < 13% for Sir) and so is the difference among the plotted curves (for KLthe two curves are overlapping). For Indiana Limestone, the variation is morenoticeable (particularly in the value of the parameter α), although it introducesa change in the reference pc(S) curve that is within experimental uncertainty(and less than the scatter produced by the fjp
jc − Sj pairs). This result con-660
firms early indications on the failure of numerical models that consider solelysubcore-scale porosity/permeability variations to match the corresponding sat-uration distributions observed during core-flooding experiments on rocks [35].The main control on the spatial distribution of fluid saturations is in fact thevariation in the capillary pressure properties of the porous medium. Eliminat-665
ing the need to predict local permeability values may be particularly useful forthose rocks, where common correlations, such as the J-Leverett scaling, maylead to erroneous results [38].
We note that an important aspect to be considered in the design of the core-flooding experiment is the selection of a range of flow rates that is sufficiently670
large. This is key towards ensuring the reliability of the solution found by theoptimiser in terms of the vG parameters [α, n, Sir] of the reference pc(S) curve.In fact, a wide range of flow rates enables covering a wide range of capillarypressure values and, therefore, it provides sufficient information to constrain theshape of the pc(S) curve. As it can be seen in Figure 11, this has been certainly675
the case for the experiments on Ketton Limestone and Indiana Limestone, wherethe experimental observations span the full range up the irreducible saturation,Sir. For Edwards Brown, only the initial part of the curve could be covered,which may explain why the value of the predicted irreducible saturation (Sir =0.29) is sensibly lower than the one obtained from independent MIP experiments680
(Sir = 0.38, as shown in Figure 2).
6. Discussion
The presence of mm-scale heterogeneities in rocks represents a challenge forinterpreting and using outcomes from multiphase-flow experiments carried outon laboratory samples. At the continuum scale, measured petrophysical proper-685
ties show a dependency on the rate of flow, on its direction, and on the correla-tion length of the heterogeneities themselves, as a results of the spatial variabilityin the capillary properties of the porous medium [17, 23, 27]. These propertiesare thus inherently effective and difficult to use within scale-up workflows. Newapproaches are needed, where the presence of these mm−scale heterogeneities690
is incorporated in measurement interpretation and analysis. In this study, thistask was accomplished with the aid of a one-dimensional numerical simulatorthat was used (i) to predict the capillary pressure and saturation profiles inthe porous medium during drainage displacements at various flow rates and (ii)to parameterise the observed local fluctuations in the steady-state saturation695
profiles in the form of capillary scaling factors, which are flow-rate indepen-dent. This workflow was applied successfully to interpret multi-rate drainageexperiments carried out on three distinct heterogeneous carbonate rocks usingN2 and water as the operating fluids. Because of the large viscosity contrast
19
between the injected gas and the water, capillary-equilibrium conditions are700
readily attainable, even if the experiment is not static; moreover, because theexperiments are dynamic, they are also significantly faster than conventionalporous plate methods applied on rock cores. Although we applied the workflowto four different rock types from a fairly homogeneous one (Berea Sandstone) tothe more heterogeneous carbonates (Indiana and Edwards Brown), we did not705
observe a noticeable difference in the optimisation time (about 2 hours). Webelieve that this is the result of accounting for elitism in the genetic algorithmthat is at the basis of the optimisation routine.
6.1. Relative and effective capillary pressure curves
For capillary flow in porous media, capillary heterogeneity can be quanti-710
fied through the spatial variability of the capillary entry pressure parameter[34, 60, 61]. This description of heterogeneity is convenient, as this parameterappears as a pre-factor in the two most commonly used formulations of the pc(S)curve, namely the Brooks-Corey [56] and the van Genuchten model [47]. Thisfurther implies that each element j in the one-dimensional heterogeneous porous715
medium is characterised by the same relative capillary pressure curve, Πc(S);in the vG formalism (used in this study), this is expressed mathematically as:
Πc(S) = αjpjc(S) = αpc(S) =
(S−1/m − 1
)1/n(25)
where n, m and Sir are constants and independent of the location. Thisnormalisation of the capillary pressure curve by 1/α bears some analogy with theconcept of relative permeability, where instead the (absolute) permeability of the720
sample is used as reference. In this context, the relative capillary pressure curvebecomes therefore a characteristic property of the porous medium, in additionto the distribution of the α parameter values that define its heterogeneity. Therelative Πc(S) curves of the three carbonates samples investigated in this studyare shown in Figure 12a; in the figure, the solid lines refer to the solution of725
the optimiser (parameter values given in Table 2), while the symbols are directmeasurements from the multi-rate drainage experiments. The latter have beenobtained upon combining the (scaled) pressure drop measurements (α1∆p) ateach flow rate with the corresponding saturation values observed near the inletface of the sample by X-ray CT. For all three carbonate rocks, the agreement730
between model predictions and the experimental observations is very good, thusproviding an additional confirmation for the validity of the proposed workflow.Most significantly, differences are observed when the same data are comparedto the results from the independent MIP experiments, which are represented inthe figure by the dashed lines. The latter are the vG fits to the composite curves735
measured on the mm−scale plugs in Figure 2. While the general character ofthe curves obtained from the two techniques on a given rock is similar, thedifferences in the obtained vG parameter values [α, n, Sir] are substantial andrange between 23 − 45% (α), 35 − 82% (n) and 11 − 20% (Sir). This resultis not entirely surprising, given the variations observed among the mm−scale740
plugs used in the MIP measurements (see the SI file). Most significantly, it
20
highlights the inherent limitations of the MIP method, such as (i) the limitedsample size, (ii) the difficulty of selecting a sufficient number of representativesamples (particularly when vugs and other small-scale heterogeneous featuresare present), and (iii) the uncertainties introduced in converting the Hg/air data745
by assuming a value for the contact angle and the interfacial tension of a givenfluid pair. The workflow presented in this study to measure drainage pc(S)curves directly on core-samples with representative fluids represents a practicalalternative to avoid these problems.
In Figure 12b are shown the effective capillary pressure curves computed for750
the three rock cores (symbols) together with the corresponding reference curvesobtained by the optimiser (solid lines). As explained in Section 3.2, the for-mer are constructed using the average saturations computed from the piecewiseconstant saturation profiles obtained at various capillary pressure levels in thelimit of zero velocity (Eq. 18). Interestingly, for each rock sample effective and755
reference curves are almost identical. This result is somewhat unexpected, giventhat the the latter refers to the scale of heterogeneity considered in this study(O(l) ∼ 1 cm), while the former is a core-scale property. In fact, variations inthe average saturation values at the core-scale are expected, as a result of the(sample-specific) distribution of scaling factors and the nonlinearity of the pc(S)760
function. However, it can be shown that this nonlinearity effect is effectivelyremoved for systems where the arithmetic mean of the scaling factors is (about)1. We have imposed this requirement in our numerical workflow (Eq. 20), so asto be consistent with common procedures applied to the scaling of soil hydraulicproperties [57, 62]. This implies that the solution (capillary pressure) of the ho-765
mogeneous model represents a suitable mean value for the scaling of the localPc − S curves in the heterogeneous model. The suitability of this assumptionwas confirmed in the validation exercise on the synthetic experiments, whereremoval of this constraint resulted in the optimiser finding a capillary pressurecurve that was different from the original one. It follows therefore that when770
this condition is fulfilled, effective and reference pc(S) curves are equivalent.
6.2. Capillary heterogeneity in carbonates
In Figure 13 is shown the normal probability plot of the scaling factorsfollowing a logarithmic transformation (ln(fj/fM, where fM is the median ofthe distribution) for the three carbonate samples (colored symbols). Alongside775
the experimental data, five theoretical distributions are shown with variancesσ2ln(f) = 1/256, 1/64, 1/16, 1/4 and 1. It can be seen that the experimental data
sets form three distinct straight lines and are therefore log-normally distributed.The obtained values for the variance of the distributions are σ2
ln(f) = 0.045 (IL),
0.005 (EB) and 0.002 (KL). Interestingly, the strength heterogeneity follows780
the same order as the porosity variation observed by X-ray CT (Section 2.1),i.e. IL > EB > KL. The dimensionless heterogeneity number, η = std(θj),can be used to measure the degree of capillary heterogeneity in the rock. Notethat we will use here θj = ln(fj), as opposed to previous formulations whereθj = fj [61]. For the three carbonate samples considered in this study, η = 0.05785
21
(KL), 0.07 (EB) and 0.21 (IL). For comparison purposes, η ≈ 0.1 has been re-ported for Berea Sandstone [34], while η ≈ 0.16 − 0.17 was obtained for coresof Bentheimer and Bunter Sandstones [26]. We note that these literature val-ues represent heterogeneity at a much smaller scale (l ∼ 0.02 − 0.03 cm3), ascompared to the one considered in this study (l ∼ 2 − 4 cm3). Most signifi-790
cantly, capillary heterogeneity factors in the range η = 0.1− 0.4 (l ∼ 0.01 cm3)were shown to strongly affect immiscible displacements at the meter-scale instatistically uniform porous media [61]. While it is known that capillarity actsover macroscopic scales [21], these observations further suggest that the effectof small-scale heterogeneities can propagate well beyond the length-scale of a795
laboratory sample. The combined experimental and numerical characterisationapproach presented in this study is an effective method for the parameterisa-tion of such small-scale heterogeneities in rock cores, including carbonate rocks.As shown in a recent study [26], once heterogeneity has been parameterised,this information can be used to extend conventional core-analysis practices to800
situations that are impractical to study experimentally, such as flow rates thatare prevalent in the subsurface. A very useful approach would be to run thecalibrated numerical model with spatial permutations of the scaling factors inan effort of producing macroscopic observations of multiphase flows (e.g., sat-urations and the corresponding petrophysical parameters) that are statistically805
significant and more useful for upscaling.
7. Concluding Remarks
We have presented results from a combined experimental and numerical char-acterisation of the capillary pressure properties in heterogeneous porous media.We have focused our analysis on carbonate rocks, because these have been less810
studied as compared to sandstones. Together with the early works by [38, 39],we provide what are, to our knowledge, the first experimental observations ofcapillary heterogeneity in carbonate rocks. However, in contrast to these previ-ous studies, we present here the complete derivation of the mathematical modelused for interpreting the experiments (homogeneous and heterogeneous models),815
together with the procedure for their numerical solution and the multi-objectiveoptimisation. The workflow is readily applicable to a wide range of systems andexplained to a level of detail that will hopefully facilitate future developmentsof the method.
The approach presented here is also strictly data-driven. Meaning, we in-820
terpret experimental saturation profiles and pressure drops to obtain a param-eterisation of capillary heterogeneity rather than an approach solely dependenton history matching. In carbonate rocks, capillary heterogeneity is significantin controlling two-phase displacements in conditions of drainage. In this study,the characterisation effort was carried out at a larger scale (O(l) ∼ 1 cm),825
as compared to earlier studies on sandstones (O(l) ∼ 2 − 3 mm), because ofthe more complex rock fabric and larger REV size of carbonates. In this con-text, we anticipate that the proposed (capillary) scaling approach may need tobe modified, in order to increase the spatial resolution of the characterisation.
22
Such modification may be in the form of a “rock-typing” method, where the830
optimiser uses a number of reference capillary pressure curves for the scaling,as opposed to using only one. Efforts in this direction are underway and arejustified by the goal of exploiting fully the wealth of information available from3D imagery of the displacements. Another possible extension of this work is toparameterise the relative permeability function and to include its parameters835
in the decision variables to be fitted. This modification may be necessary forrock systems where the Burdine’s formulation is not applicable. Similarly, theextension the proposed workflow to construct full-cycle (drainage-imbibition)pc(S) scanning curves would be very useful. In fact, the appropriate descriptionof the hysteretic behaviour of this function is directly relevant to a number of840
subsurface industrial operations, including enhanced oil recovery processes andthe long-term trapping of CO2 in geologic carbon sequestration sites.
Acknowledgements
This work was carried out as part of the Qatar Carbonates and CarbonStorage Centre (QCCSRC). We gratefully acknowledge the funding of QCC-845
SRC provided jointly by Qatar Petroleum, Shell, and the Qatar Science andTechnology Park. SAHH and RP also acknowledge funding by the Natural En-vironment Research Council (grant NE/N016173/1). We also thank Dr. BenNiu for the technical support during the core-floodong experiments and JoshuaMomodu for carrying out routine characterisation of the rock plugs.850
A1. Capillary pressure and relative permeability formulation
In this study, the van Genuchten (vG) model was used to describe the cap-illary pressure-saturation relationship, which takes the following form [47]:
S =
[1
1 + (αpc)n
]m(A-1)
where α, n and m = (n − 1)/n are constant parameters, while S is dimen-
sionsless (effective) saturation of the wetting phase, S = (S − Sir)/(1 − Sir).855
Note that n > 1 and, accordingly, 0 < m < 1. It is convenient to recast Eq. A-1to give the capillary pressure as a function of the saturation, i.e.
pc =1
α
(S−1/m − 1
)1/n(A-2)
which thus corresponds to Eq. 1 in the main manuscript. Differentiation ofthis equation gives
dpcdS
=m− 1
αm(1− Sir)S−1/m
(1− S1/m
)−m
(A-3)
which can be combined with Eqs. 11 (homogeneous case) or 15 (heteroge-860
neous case) to obtain saturation profiles in the porous medium. The vG capillary
23

pressure model is combined with the permeability model proposed by Burdineto obtain an expression for the relative nonwetting-phase permeability, kr,nw, asa function of the saturation [63], i.e.
kr,nw = (1− S)2(1− S1/m)m (A-4)
This formulation is typically referred to as the van Genuchten-Burdine (vGB)865
model.
24

Nomenclature
A cross sectional area [m2]CT CT number [HU]d grain diameter [m]D core-sample diameter [m]E objective function (internal fitting) [-]fj scaling factor of element j (optimiser) [-]J objective function (global optimisation) [-]kj permeability of element j (optimiser) [m2]khm harmonic mean of local permeabilities (optimiser) [m2]km core-sample permeability [m2]kr relative permeability [-]l slice thickness [m]L core-sample length [m]n van Genuchten parameter (optimiser) [-]nc microscopic capillary number [-]N number of elements (slices) in the core-sample [-]Ng number of internal nodes (model) [-]Nc macroscopic capillary number [-]p pressure [Pa]∆p pressure drop [Pa]pc capillary pressure [Pa]∆pc capillary pressure drop [Pa]q volumetric flow rate [m3 s−1]Re Reynolds number [-]S wetting phase saturation [-]
S effective wetting phase saturation [-]Sir irreducible wetting phase saturation (optimiser) [-]T temperature [K]u superficial velocity [m s−1]x spatial coordinate [m]xD normalized length [-]
Greek symbols
α van Genuchten parameter (optimiser) [Pa−1]µ viscosity [Pa.s]φ porosity [-]φj porosity of element j (CT scans) [-]φm core-sample porosity [-]ρ density [kg m−3]γ interfacial tension [-]Πc relative capillary pressure [-]
25
References
[1] H. W. Brown, Capillary pressure investigations, Petrol. Trans. AIME 192870
(1951) 67–74.
[2] W. R. Purcell, Capillary pressures−Their measurement using mercury andthe calculation of permeability therefrom, J. Pet. Technol. 1 (2) (1949)39–48.
[3] R. M. El-Maghraby, M. J. Blunt, Residual CO2 trapping in Indiana lime-875
stone, Environ. Sci. Technol. 47 (1) (2012) 227–233.
[4] T. K. Tokunaga, J. Wang, J. W. Jung, T. W. Kim, Y. Kim, W. Dong, Cap-illary pressure and saturation relations for supercritical CO2 and brine insand: High?pressure Pc(Sw) controller/meter measurements and capillaryscaling predictions, Water. Resour. Res. 49 (8) (2013) 4566–4579.880
[5] B. Raeesi, N. R. Morrow, G. Mason, Capillary Pressure Hysteresis Behaviorof Three Sandstones Measured with a Multistep OutflowInflow Apparatus,Vadose Zone J. 12 (3) (2014).
[6] K. Christoffersen, C. Whitson, Gas/oil capillary pressure of chalk at ele-vated pressures, SPE Form. Eval. 10 (3) (1995) 153–159.885
[7] T. Ramakrishnan, A. Cappiello, A new technique to measure static anddynamic properties of a partially saturated porous medium, Chem. Eng.Sci. 46 (4) (1991) 1157–1163.
[8] E. Fordham, L. Hall, T. Ramakrishnan, M. Sharpe, C. Hall, Saturation gra-dients in drainage of porous media: NMR imaging measurements, AIChE890
J. 39 (9) (1993) 1431–1443.
[9] R. Pini, S. Krevor, S. M. Benson, Capillary pressure and heterogeneityfor the CO2/water system in sandstone rocks at reservoir conditions, Adv.Water Res. 38 (2012) 48–59.
[10] V. Joekar-Niasar, S. M. Hassanizadeh, H. K. Dahle, Non-equilibrium effects895
in capillarity and interfacial area in two-phase flow: dynamic pore-networkmodelling, J. Fluid Mech. 655 (2010) 38–71.
[11] R. T. Armstrong, M. L. Porter, D. Wildenschild, Linking pore-scale in-terfacial curvature to column-scale capillary pressure, Adv. Water Res. 46(2012) 55–62.900
[12] A. L. Herring, J. Middleton, R. Walsh, A. Kingston, A. Sheppard, Flowrate impacts on capillary pressure and interface curvature of connected anddisconnected fluid phases during multiphase flow in sandstone, Adv. WaterRes. 107 (2017) 460–469.
26
[13] Q. Lin, B. Bijeljic, R. Pini, Ronny,Blunt,M. J. Blunt, S. Krevor, Imaging905
and Measurement of Pore-Scale Interfacial Curvature to Determine Cap-illary Pressure Simultaneously With Relative Permeability, Water Resour.Res. 54 (2018) 7046–7060.
[14] A. Al-Menhali, B. Niu, S. Krevor, Capillarity and wetting of carbon dioxideand brine during drainage in Berea Sandstone at reservoir conditions, Water910
Resour. Res. 51 (10) (2015) 7895–7914.
[15] C. H. Pentland, R. El-Maghraby, S. Iglauer, M. J. Blunt, Measurements ofthe capillary trapping of supercritical carbon dioxide in Berea Sandstone,Geophys. Res. Lett. 38 (2011) L06401.
[16] C. Chardaire-Riviere, G. Chavent, J. Jaffre, J. Liu, B. J. Bourbiaux, Simul-915
taneous estimation of relative permeabilities and capillary pressure, SPEForm. Eval. 7 (04) (1992) 283–289.
[17] P. Ringrose, K. Sorbie, P. Corbett, J. Jensen, Immiscible flow behaviourin laminated and cross-bedded sandstones, J. Petrol. Sci. Eng. 9 (2) (1993)103–124.920
[18] D. Zhang, R. Zhang, S. Chen, W. E. Soll, Pore scale study of flow in porousmedia: Scale dependency, REV, and statistical REV, Geophys. Res. Lett.27 (8) (2000) 1195–1198.
[19] S. Ehrenberg, Whole core versus plugs: Scale dependence of porosity andpermeability measurements in platform carbonates, AAPG Bulletin 91 (6)925
(2007) 835–846.
[20] R. T. Armstrong, A. Georgiadis, H. Ott, D. Klemin, S. Berg, Critical capil-lary number: Desaturation studied with fast X-ray computed microtomog-raphy, Geophys. Res. Lett. 41 (1) (2014) 55–60.
[21] J. Chang, Y. C. Yortsos, Effect of capillary heterogeneity on buckley-930
leverett displacement, SPE Res. Eng. 7 (2) (1992) 285–293.
[22] M. Chaouche, N. Rakotomalala, D. Salin, B. Xu, Y. Yortsos, Capillaryeffects in drainage in heterogeneous porous media: continuum modelling,experiments and pore network simulations, Chem. Eng. Sci. 49 (15) (1994)2447–2466.935
[23] Y. Huang, P. Ringrose, K. Sorbie, Capillary trapping mechanisms in water-wet laminated rocks, SPE Res. Eng. 10 (4) (1995) 287–292.
[24] C.-W. Kuo, S. M. Benson, Numerical and analytical study of effects ofsmall scale heterogeneity on CO2/brine multiphase flow system in horizon-tal corefloods, Adv. Water Res. 79 (2015) 1–17.940
[25] C. Reynolds, S. Krevor, Characterizing flow behavior for gas injection:Relative permeability of CO2−brine and N2−water in heterogeneous rocks,Water Resour. Res. 51 (12) (2015) 9464–9489.
27
[26] S. J. Jackson, S. Agada, C. A. Reynolds, S. Krevor, Characterizing drainagemultiphase flow in heterogeneous sandstones, Water Resour. Res. 54 (4)945
(2018) 3139–3161.
[27] M. Dale, S. Ekrann, J. Mykkeltveit, G. Virnovsky, Effective relative perme-abilities and capillary pressure for one-dimensional heterogeneous media,Transport Porous Med. 26 (3) (1997) 229–260.
[28] A. Graue, Imaging the effects of capillary heterogeneities on local saturation950
development in long corefloods, SPE Drill. Completion 9 (01) (1994) 57–64.
[29] J.-C. Perrin, S. M. Benson, An experimental study on the influence of sub-core scale heterogeneities on CO2 distribution in reservoir rocks, TransportPorous Med. 82 (1) (2010) 93–109.
[30] S. Krevor, R. Pini, B. Li, S. M. Benson, Capillary heterogeneity trapping955
of CO2 in a sandstone rock at reservoir conditions, Geophys. Res. Lett.38 (15).
[31] B. L. Alemu, E. Aker, M. Soldal, Ø. Johnsen, Effect of sub-core scaleheterogeneities on acoustic and electrical properties of a reservoir rock:a CO2 flooding experiment of brine saturated sandstone in a computed960
tomography scanner, Geophys. Prospect. 61 (1) (2013) 235–250.
[32] Y. Zhang, O. Nishizawa, T. Kiyama, S. Chiyonobu, Z. Xue, Flow behaviourof supercritical co2 and brine in berea sandstone during drainage and im-bibition revealed by medical X-ray CT images, Geophys. J. Int. 197 (3)(2014) 1789–1807.965
[33] R. Pini, S. M. Benson, Characterization and scaling of mesoscale hetero-geneities in sandstones, Geophys. Res. Lett. 40 (15) (2013) 3903–3908.
[34] R. Pini, S. M. Benson, Capillary pressure heterogeneity and hysteresis forthe supercritical CO2/water system in a sandstone, Adv. Water Res. 108(2017) 277–292.970
[35] M. H. Krause, J.-C. Perrin, S. M. Benson, Modeling permeability distribu-tions in a sandstone core for history matching coreflood experiments, SPEJ. 16 (04) (2011) 768–777.
[36] M. Krause, S. Krevor, S. M. Benson, A procedure for the accurate determi-nation of sub-core scale permeability distributions with error quantification,975
Transport Porous Med. 98 (3) (2013) 565–588.
[37] N. Wei, M. Gill, D. Crandall, D. McIntyre, Y. Wang, K. Bruner, X. Li,G. Bromhal, CO2 flooding properties of liujiagou sandstone: influence ofsubcore scale structure heterogeneity, Greenh. Gases 4 (3) (2014) 400–418.
[38] P. Egermann, R. Lenormand, A new methodology to evaluate the impact980
of localized heterogeneity on petrophysical parameters (kr, Pc) applied tocarbonate rocks, Petrophysics 46 (5) (2005) 335–345.
28
[39] P. Olivier, L. Cantegrel-Gassiot, J. Laveissiere, N. Guillonneau, Analysis ofmultiphase flow behavior in vugular carbonates using X-ray CT scanning,Petrophysics 46 (6) (2005) 424–433.985
[40] J.-Q. Shi, Z. Xue, S. Durucan, Supercritical CO2 core flooding and imbi-bition in tako sandstone—influence of sub-core scale heterogeneity, Int. J.Greenhouse Gas Control 5 (1) (2011) 75–87.
[41] M. H. Krause, S. M. Benson, Accurate determination of characteristic rel-ative permeability curves, Adv. Water Res. 83 (2015) 376–388.990
[42] S. Berg, S. Oedai, H. Ott, Displacement and mass transfer between satu-rated and unsaturated CO2brine systems in sandstone, Int. J. GreenhouseGas Control 12 (2013) 478–492.
[43] W. Anderson, Wettability literature survey - Part 4: Effects of wettabilityon capillary pressure, J. Petrol. Technol. 39 (10) (1987) 1283–1300.995
[44] Y. Huang, P. Ringrose, K. Sorbie, The effects of heterogeneity and wetta-bility on oil recovery from laminated sedimentary structures, SPE J. 1 (4)(1996) 451–462.
[45] J. Jennings, D. McGregor, R. Morse, Simultaneous determination of cap-illary pressure and relative permeability by automatic history matching,1000
SPE Form. Eval. 3 (2) (1988) 322–328.
[46] R. Pini, S. M. Benson, Simultaneous determination of capillary pressureand relative permeability curves from coreflooding experiments with variousfluid pairs, Water Resour. Res. 49 (6) (2013) 3516–3530.
[47] M. T. Van Genuchten, A closed-form equation for predicting the hydraulic1005
conductivity of unsaturated soils, Soil Sci. Soc. Am. J. 44 (5) (1980) 892–898.
[48] L. Joss, R. Pini, Digital adsorption: 3D imaging of gas adsorption isothermsby X-ray Computed Tomography, J. Phys. Chem. C 121 (48) (2017) 26903–26915.1010
[49] S. M. Hassanizadeh, W. G. Gray, High velocity flow in porous media, Trans-port Porous Med. 2 (6) (1987) 521–531.
[50] D. Wilkinson, Percolation effects in immiscible displacement, Phys. Rev. A34 (2) (1986) 1380–1391.
[51] G. Virnovsky, H. Friis, A. Lohne, A steady-state upscaling approach for1015
immiscible two-phase flow, Transport Porous Med. 54 (2) (2004) 167–192.
[52] R. Hilfer, P. E. Øren, Dimensional analysis of pore scale and field scaleimmiscible displacement, Transport Porous Med. 22 (1) (1996) 53–72.
29
[53] J. Oh, K.-Y. Kim, W. S. Han, T. Kim, J.-C. Kim, E. Park, Experimentaland numerical study on supercritical CO2/brine transport in a fractured1020
rock: Implications of mass transfer, capillary pressure and storage capacity,Adv. Water Res. 62 (2013) 442–453.
[54] D. D. Huang, M. M. Honarpour, Capillary end effects in coreflood calcula-tions, Adv. Water Res. 19 (1) (1998) 103–117.
[55] A. Georgiadis, S. Berg, A. Makurat, G. Maitland, H. Ott, Pore-scale micro-1025
computed-tomography imaging: nonwetting-phase cluster-size distributionduring drainage and imbibition, Phys. Rev. E 88 (3) (2013) 10274–10292.
[56] R. H. Brooks, A. T. Corey, Hydraulic properties of porous media, Hydrol-ogy Paper No. 3, Colorado State University (1964) 1–27.
[57] A. Warrick, G. Mullen, D. Nielsen, Scaling fieldmeasured soil hydraulic1030
properties using a similar media concept, Water Resour. Res. 13 (2) (1977)355–362.
[58] R. Haghpanah, A. Majumder, R. Nilam, A. Rajendran, S. Farooq, I.A. Karimi, M. Amanullah, Multiobjective Optimization of a Four-StepAdsorption Process for Postcombustion CO2 Capture Via Finite Volume1035
Simulation, Ind. Eng. Chem. Res. 52 (11) (2013) 4249–4265.
[59] S.A. Hosseinzadeh Hejazi, L. Estupian Perez, A. Rajendran, S. Kuznicki,Cycle Development and Process Optimization of High-Purity Oxygen Pro-duction Using Silver-Exchanged Titanosilicates, Ind. Eng. Chem. Res.56 (19) (2017) 5679–5691.1040
[60] E. Saadatpoor, S. L. Bryant, K. Sepehrnoori, New trapping mechanism incarbon sequestration, Transport Porous Med. 82 (1) (2010) 3–17.
[61] B. Li, S. M. Benson, Influence of small-scale heterogeneity on upward CO2
plume migration in storage aquifers, Adv. Water Res. 83 (2015) 389–404.
[62] J. Hopmans, A comparison of various methods to scale soil hydraulic prop-1045
erties, J. Hydrol. 93 (3-4) (1987) 241–256.
[63] O. Dury, U. Fischer, R. Schulin, A comparison of relative nonwettingphasepermeability models, Water Resour. Res. 35 (5) (1999) 1481–1493.
30

Tables
31
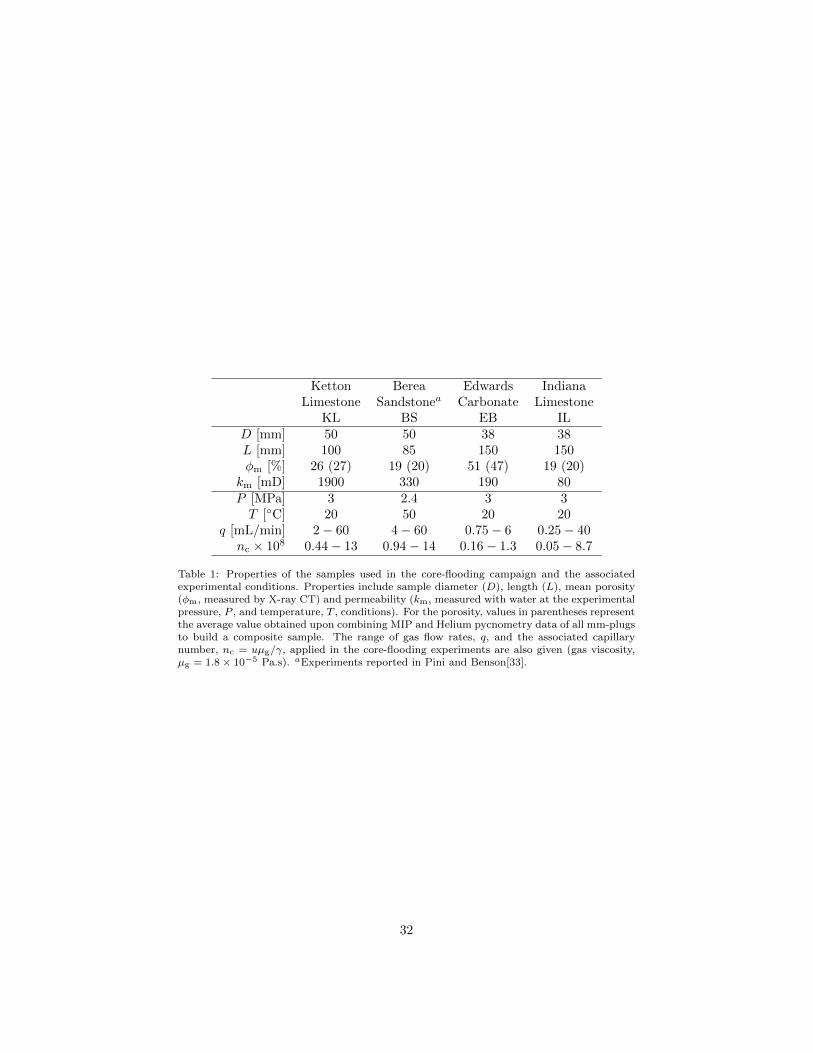
Ketton Berea Edwards IndianaLimestone Sandstonea Carbonate Limestone
KL BS EB ILD [mm] 50 50 38 38L [mm] 100 85 150 150φm [%] 26 (27) 19 (20) 51 (47) 19 (20)
km [mD] 1900 330 190 80P [MPa] 3 2.4 3 3T [◦C] 20 50 20 20
q [mL/min] 2− 60 4− 60 0.75− 6 0.25− 40nc × 108 0.44− 13 0.94− 14 0.16− 1.3 0.05− 8.7
Table 1: Properties of the samples used in the core-flooding campaign and the associatedexperimental conditions. Properties include sample diameter (D), length (L), mean porosity(φm, measured by X-ray CT) and permeability (km, measured with water at the experimentalpressure, P , and temperature, T , conditions). For the porosity, values in parentheses representthe average value obtained upon combining MIP and Helium pycnometry data of all mm-plugsto build a composite sample. The range of gas flow rates, q, and the associated capillarynumber, nc = uµg/γ, applied in the core-flooding experiments are also given (gas viscosity,µg = 1.8 × 10⁻⁵ Pa.s). aExperiments reported in Pini and Benson[33].
32
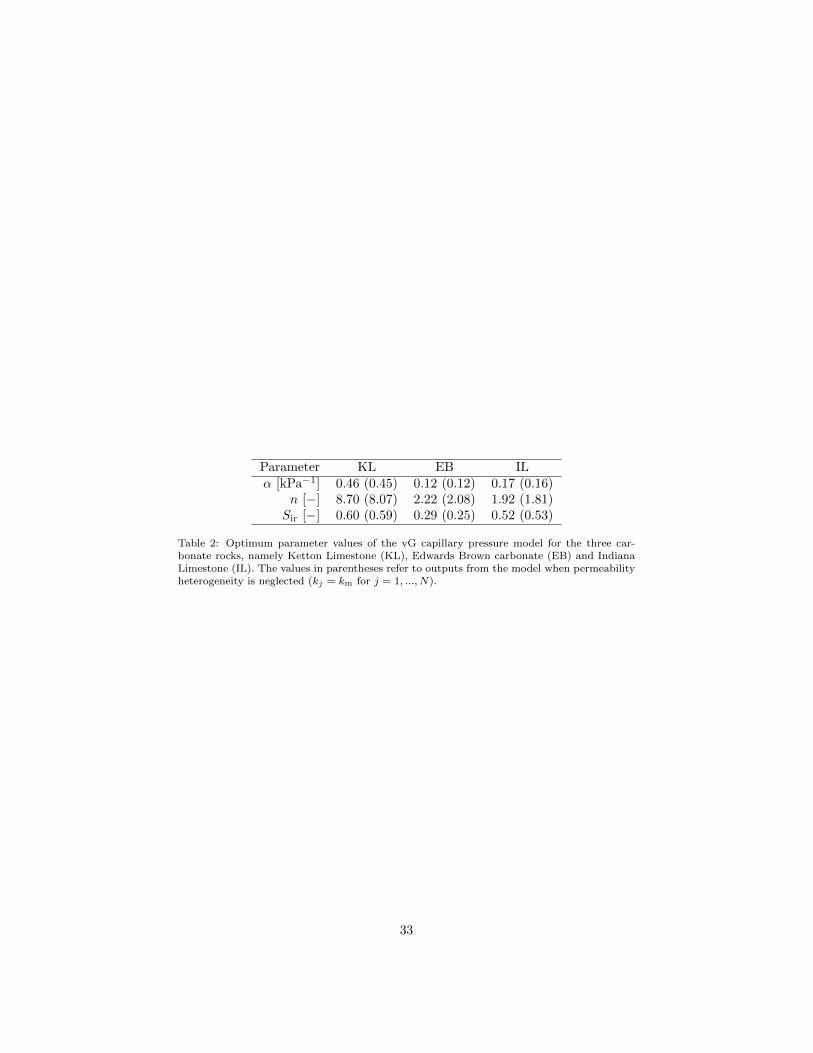
Parameter KL EB ILα [kPa−1] 0.46 (0.45) 0.12 (0.12) 0.17 (0.16)
n [−] 8.70 (8.07) 2.22 (2.08) 1.92 (1.81)Sir [−] 0.60 (0.59) 0.29 (0.25) 0.52 (0.53)
Table 2: Optimum parameter values of the vG capillary pressure model for the three car-bonate rocks, namely Ketton Limestone (KL), Edwards Brown carbonate (EB) and IndianaLimestone (IL). The values in parentheses refer to outputs from the model when permeabilityheterogeneity is neglected (kj = km for j = 1, ..., N).
33

Figures1050
34
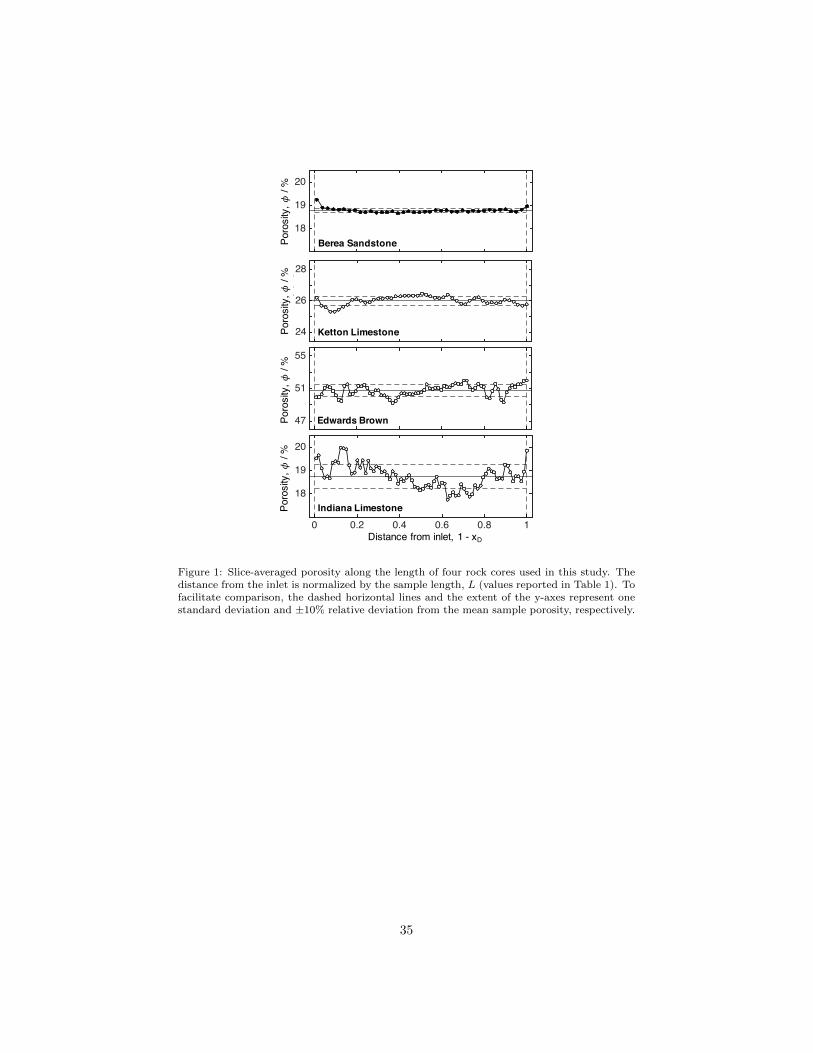
Poro
sity
[%]
17
18
19
20
Distance [-]0 0.2 0.4 0.6 0.8 1
Poro
sity
[%]
17
18
19
20
Poro
sity
[%]
2425262728
Poro
sity
[%]
4749515355
Ketton Limestone
Edwards Brown
Indiana Limestone
Berea Sandstone
Distance from inlet, 1 - xD
Poro
sity
, 𝜙/ %
Poro
sity
, 𝜙/ %
Poro
sity
, 𝜙/ %
Poro
sity
, 𝜙/ %
Figure 1: Slice-averaged porosity along the length of four rock cores used in this study. Thedistance from the inlet is normalized by the sample length, L (values reported in Table 1). Tofacilitate comparison, the dashed horizontal lines and the extent of the y-axes represent onestandard deviation and ±10% relative deviation from the mean sample porosity, respectively.
35
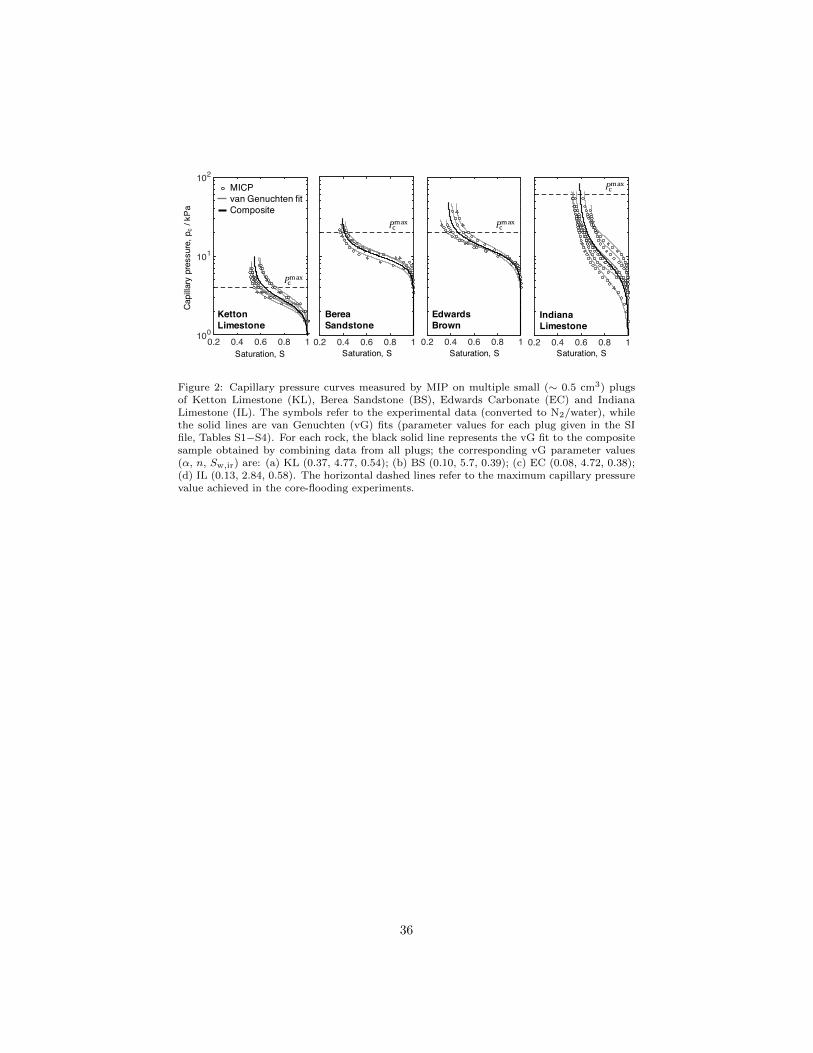
WP saturation0.2 0.4 0.6 0.8 1
WP saturation0.2 0.4 0.6 0.8 1
WP saturation0.2 0.4 0.6 0.8 1
Cap
illary
pre
ssur
e [k
Pa]
100
101
102
WP saturation0.2 0.4 0.6 0.8 1
Ketton Limestone
Edwards Brown
Indiana Limestone
𝑃"#$%
𝑃"#$%
𝑃"#$%
Berea Sandstone
𝑃"#$%
MICPvan Genuchten fitComposite
Saturation, S
Capi
llary
pre
ssur
e, p
c/ k
Pa
Saturation, S Saturation, SSaturation, S
Figure 2: Capillary pressure curves measured by MIP on multiple small (∼ 0.5 cm3) plugsof Ketton Limestone (KL), Berea Sandstone (BS), Edwards Carbonate (EC) and IndianaLimestone (IL). The symbols refer to the experimental data (converted to N2/water), whilethe solid lines are van Genuchten (vG) fits (parameter values for each plug given in the SIfile, Tables S1−S4). For each rock, the black solid line represents the vG fit to the compositesample obtained by combining data from all plugs; the corresponding vG parameter values(α, n, Sw,ir) are: (a) KL (0.37, 4.77, 0.54); (b) BS (0.10, 5.7, 0.39); (c) EC (0.08, 4.72, 0.38);(d) IL (0.13, 2.84, 0.58). The horizontal dashed lines refer to the maximum capillary pressurevalue achieved in the core-flooding experiments.
36
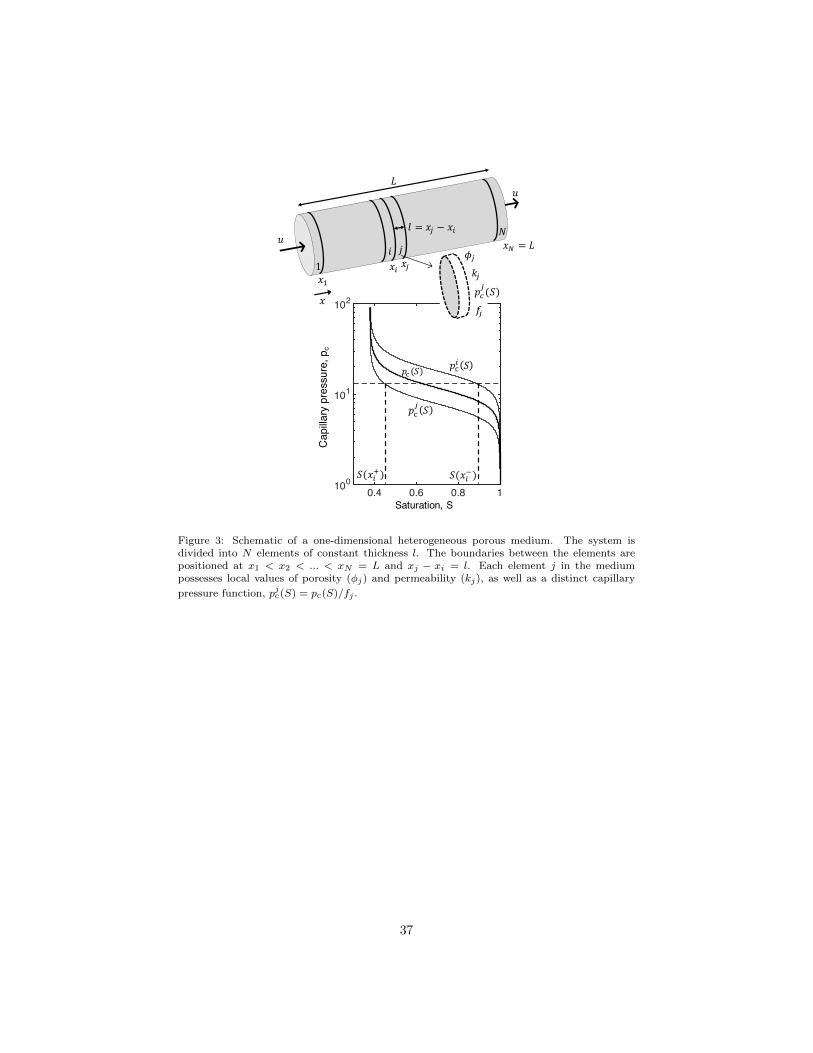
Water saturation0.4 0.6 0.8 1
Cap
illary
pre
ssur
e [k
Pa]
100
101
102𝑥
1𝑖
𝑁
𝐿
𝑥&𝑥'
𝑥( = 𝐿𝑢
𝑢
𝑝,' 𝑆
𝑥.𝑗
𝑆(𝑥'1)
𝑝,. 𝑆
𝑙 = 𝑥. − 𝑥'
𝜙.𝑘.𝑝7.(𝑆)
𝑓.
𝑝,(𝑆)
𝑆(𝑥'9)
Cap
illary
pre
ssur
e, p
c
Saturation, S
Figure 3: Schematic of a one-dimensional heterogeneous porous medium. The system isdivided into N elements of constant thickness l. The boundaries between the elements arepositioned at x1 < x2 < ... < xN = L and xj − xi = l. Each element j in the mediumpossesses local values of porosity (φj) and permeability (kj), as well as a distinct capillary
pressure function, pjc(S) = pc(S)/fj .
37
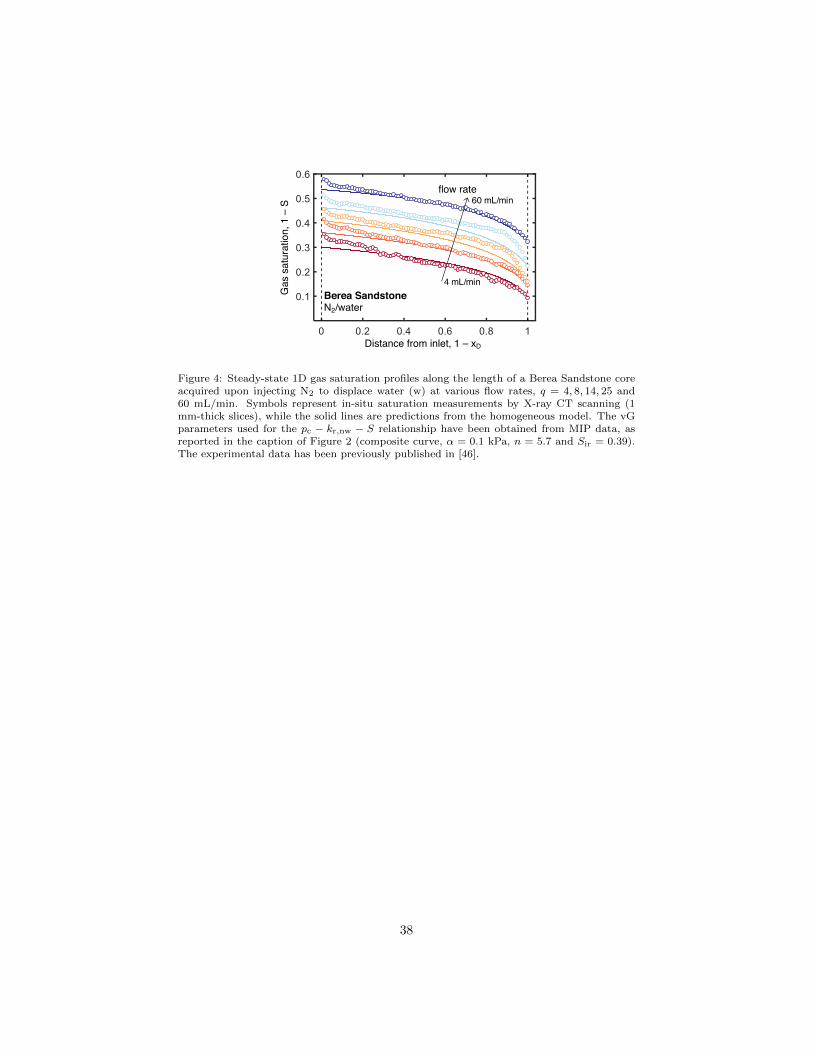
Distance from inlet, 1 – xD
Gas
sat
urat
ion,
1 –
SBerea SandstoneN2/water
flow rate
4 mL/min
60 mL/min
Figure 4: Steady-state 1D gas saturation profiles along the length of a Berea Sandstone coreacquired upon injecting N2 to displace water (w) at various flow rates, q = 4, 8, 14, 25 and60 mL/min. Symbols represent in-situ saturation measurements by X-ray CT scanning (1mm-thick slices), while the solid lines are predictions from the homogeneous model. The vGparameters used for the pc − kr,nw − S relationship have been obtained from MIP data, asreported in the caption of Figure 2 (composite curve, α = 0.1 kPa, n = 5.7 and Sir = 0.39).The experimental data has been previously published in [46].
38
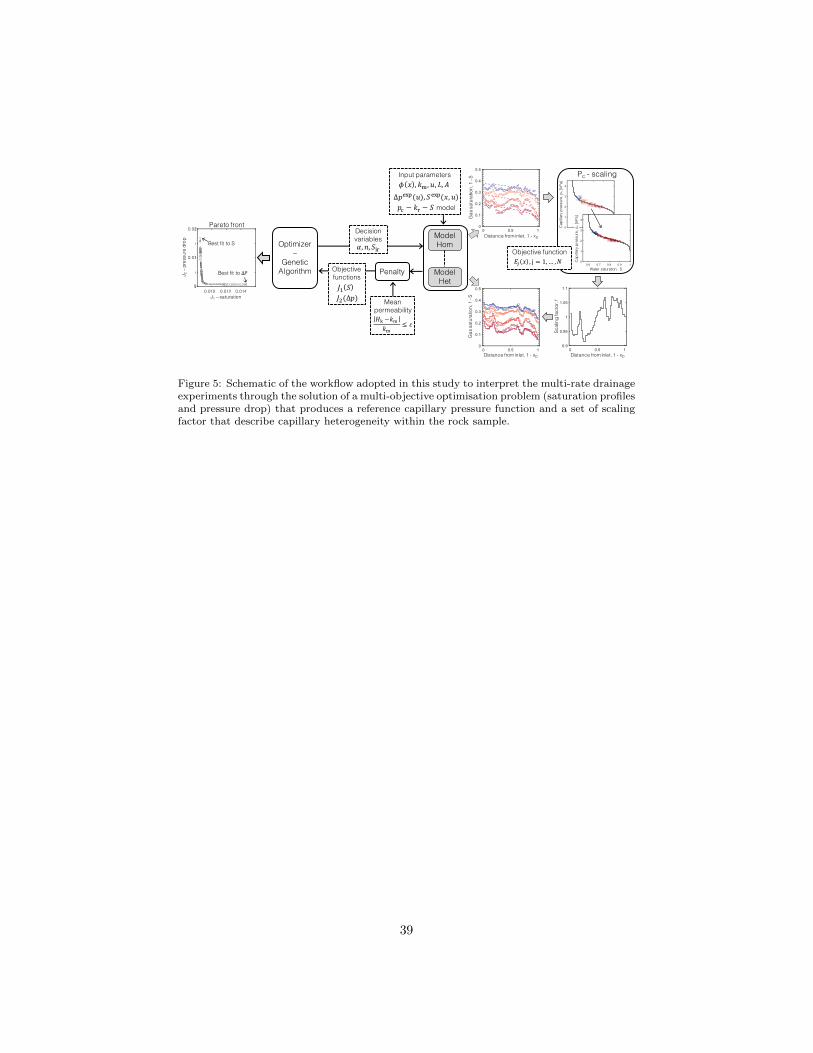
Optimizer–
Genetic Algorithm
Model Hom
ModelHet
Penalty
Decision variables𝛼, 𝑛, 𝑆%&
Objective functions𝐽( 𝑆
Mean permeability
Input parameters𝜙 𝑥 , 𝑘,, 𝑢, 𝐿, 𝐴
∆𝑝234(𝑢), 𝑆234(𝑥, 𝑢)𝑝7 − 𝑘& − 𝑆 model
Objective function
Pc - scaling
𝐸: 𝑥 , j = 1,… ,𝑁
𝐽@(∆𝑝)
|𝐻C −𝑘,|𝑘,
≤ 𝜀
Distance from inlet, 1 - xD
Gas
satu
ratio
n, 1
-S
Distance from inlet, 1 - xD
Gas
satu
ratio
n, 1
-S
Distance from inlet, 1 - xD
Scal
ing
fact
or, f
Water saturation, S
Cap
illar
y pr
essu
re, p
c[k
Pa]
Cap
illar
y pr
essu
re, p
c[k
Pa]
0.02
0.01
00.010 0.012 0.014
J 2–p
ress
ure
drop
J1 – saturation
Pareto front
Best fit to S
Best fit to ∆𝑃
Figure 5: Schematic of the workflow adopted in this study to interpret the multi-rate drainageexperiments through the solution of a multi-objective optimisation problem (saturation profilesand pressure drop) that produces a reference capillary pressure function and a set of scalingfactor that describe capillary heterogeneity within the rock sample.
39
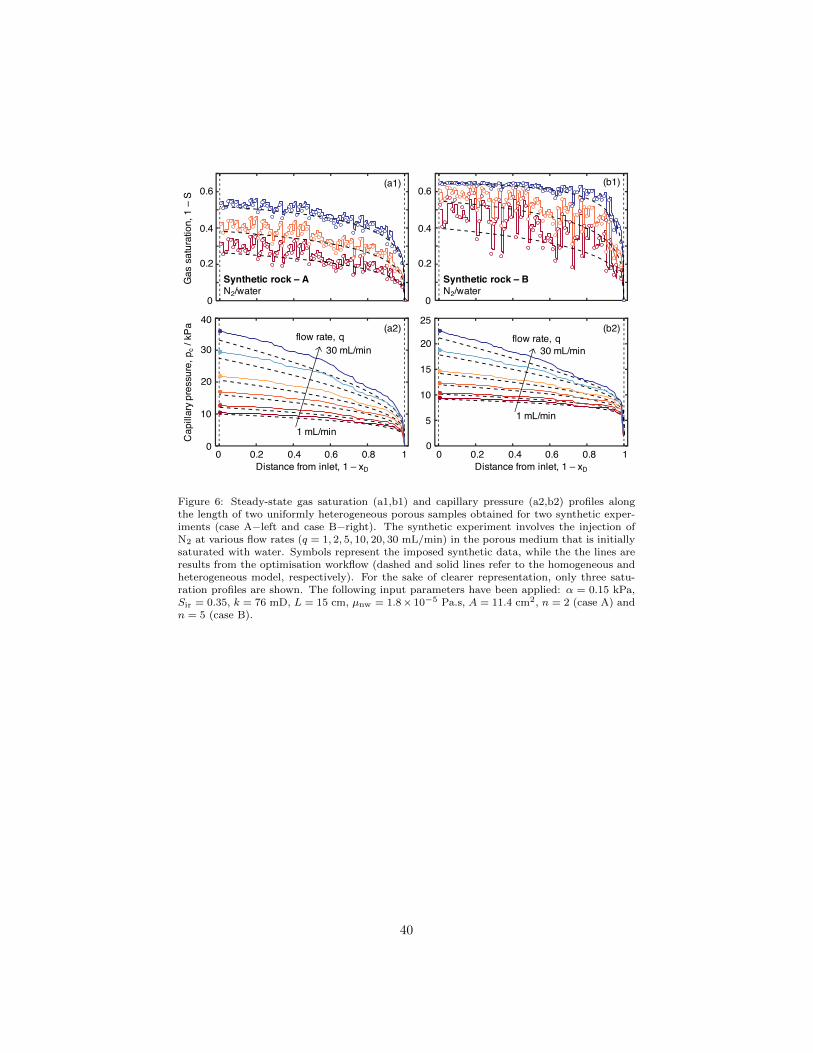
Distance from inlet, 1 – xD
Gas
sat
urat
ion,
1 –
SC
apill
ary p
ress
ure,
pc
/ kPa
0.6
0.4
0.2
0
40
30
20
10
0
0.6
0.4
0.2
0
25
20
15
10
5
0 0.2 0.4 0.6 0.8 1 0 0.2 0.4 0.6 0.8 1Distance from inlet, 1 – xD
Synthetic rock – AN2/water
Synthetic rock – BN2/water
flow rate, q
1 mL/min
30 mL/minflow rate, q
1 mL/min
30 mL/min
(a1)
(a2) (b2)
(b1)
0
Figure 6: Steady-state gas saturation (a1,b1) and capillary pressure (a2,b2) profiles alongthe length of two uniformly heterogeneous porous samples obtained for two synthetic exper-iments (case A−left and case B−right). The synthetic experiment involves the injection ofN2 at various flow rates (q = 1, 2, 5, 10, 20, 30 mL/min) in the porous medium that is initiallysaturated with water. Symbols represent the imposed synthetic data, while the the lines areresults from the optimisation workflow (dashed and solid lines refer to the homogeneous andheterogeneous model, respectively). For the sake of clearer representation, only three satu-ration profiles are shown. The following input parameters have been applied: α = 0.15 kPa,Sir = 0.35, k = 76 mD, L = 15 cm, µnw = 1.8× 10⁻⁵ Pa.s, A = 11.4 cm2, n = 2 (case A) andn = 5 (case B).
40
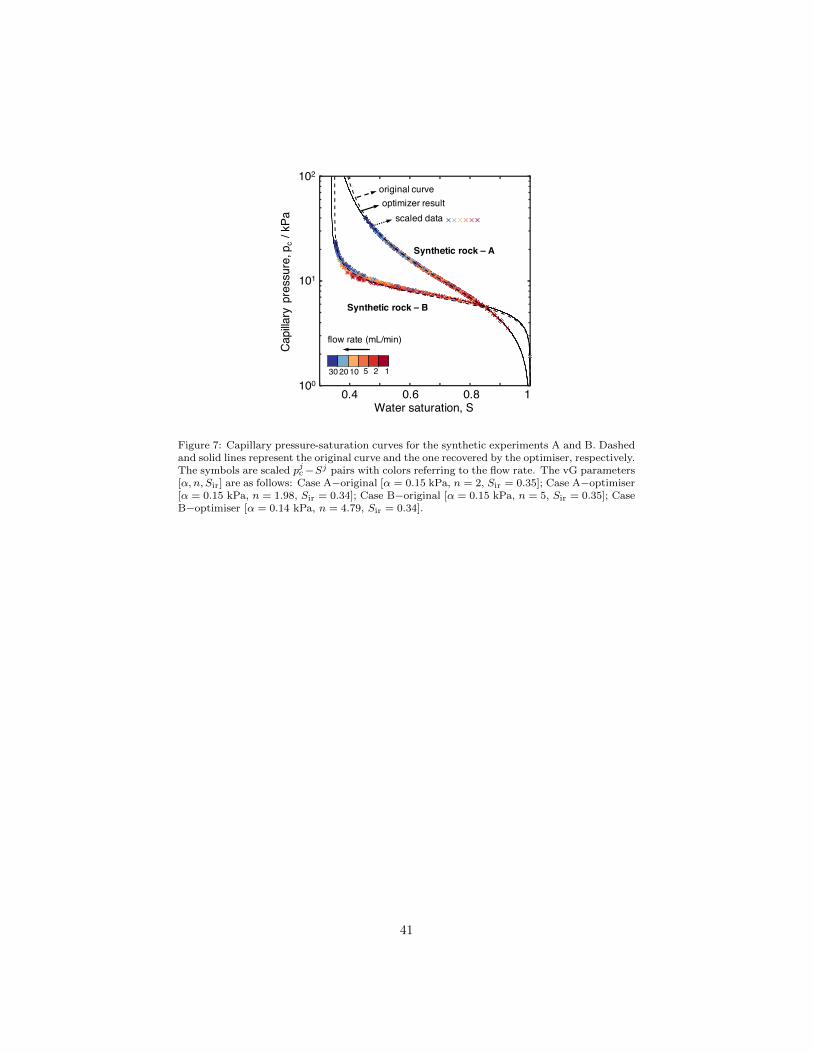
Water saturation, S
Capi
llary
pre
ssur
e, p
c/ k
Pa
Synthetic rock – A
Synthetic rock – B
optimizer resultoriginal curve
102
101
1000.4 0.6 0.8 1
flow rate (mL/min)
scaled data ××××××
30 20 10 5 2 1
Figure 7: Capillary pressure-saturation curves for the synthetic experiments A and B. Dashedand solid lines represent the original curve and the one recovered by the optimiser, respectively.The symbols are scaled pjc−Sj pairs with colors referring to the flow rate. The vG parameters[α, n, Sir] are as follows: Case A−original [α = 0.15 kPa, n = 2, Sir = 0.35]; Case A−optimiser[α = 0.15 kPa, n = 1.98, Sir = 0.34]; Case B−original [α = 0.15 kPa, n = 5, Sir = 0.35]; CaseB−optimiser [α = 0.14 kPa, n = 4.79, Sir = 0.34].
41
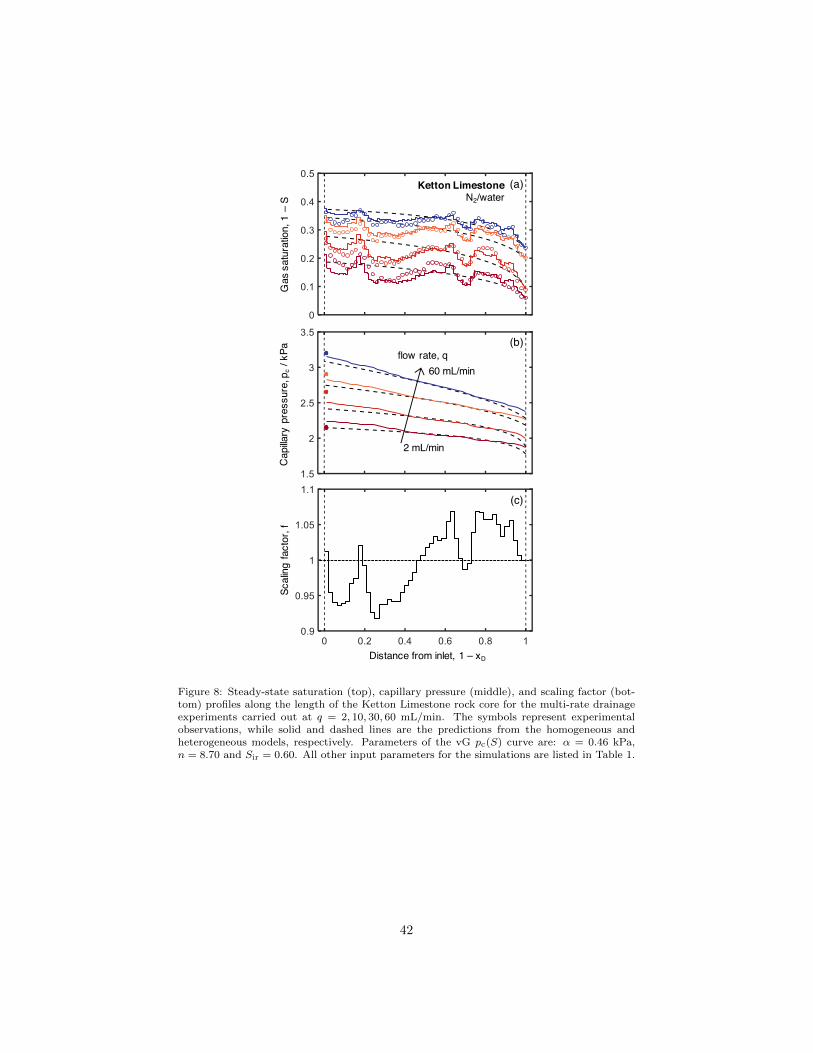
(a)
(b)
(c)
flow rate, q
2 mL/min
60 mL/min
Distance from inlet, 1 – xD
Gas
sat
urat
ion,
1 –
SC
apilla
ry p
ress
ure,
pc
/ kPa
Scal
ing
fact
or, f
Ketton LimestoneN2/water
Figure 8: Steady-state saturation (top), capillary pressure (middle), and scaling factor (bot-tom) profiles along the length of the Ketton Limestone rock core for the multi-rate drainageexperiments carried out at q = 2, 10, 30, 60 mL/min. The symbols represent experimentalobservations, while solid and dashed lines are the predictions from the homogeneous andheterogeneous models, respectively. Parameters of the vG pc(S) curve are: α = 0.46 kPa,n = 8.70 and Sir = 0.60. All other input parameters for the simulations are listed in Table 1.
42
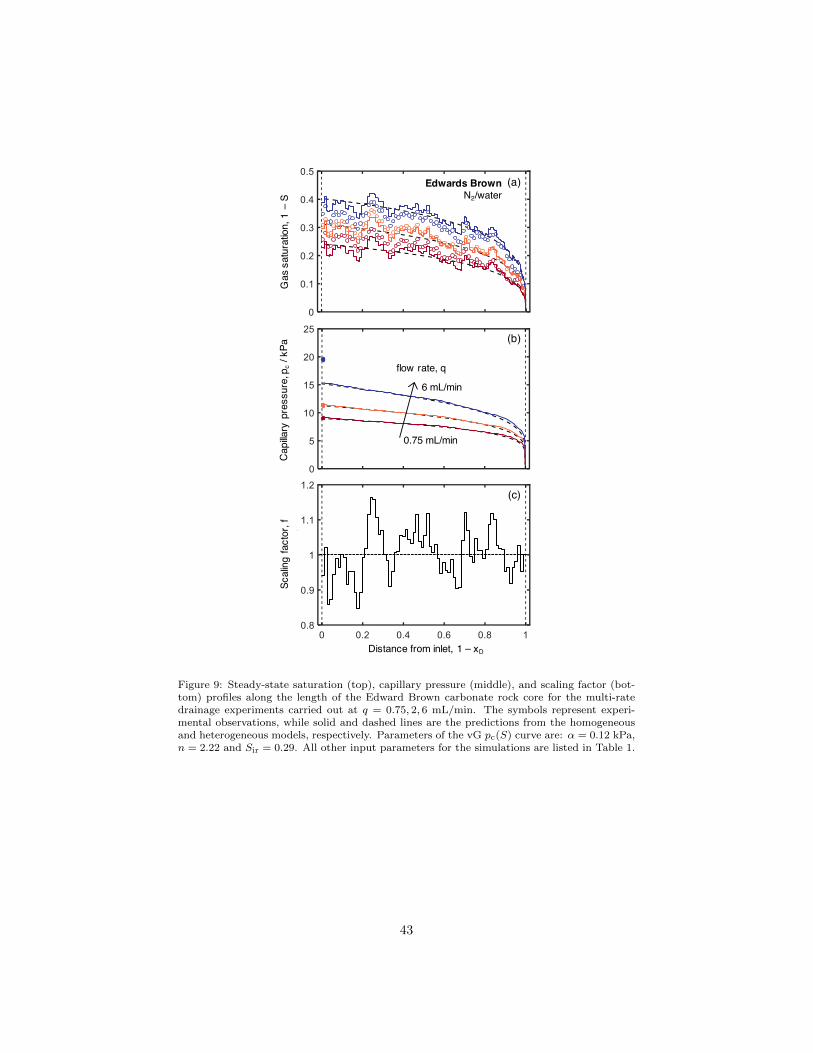
0.75 mL/min
6 mL/min
(a)
(b)
(c)
Edwards BrownN2/water
flow rate, q
Distance from inlet, 1 – xD
Gas
sat
urat
ion,
1 –
SC
apilla
ry p
ress
ure,
pc
/ kPa
Scal
ing
fact
or, f
Figure 9: Steady-state saturation (top), capillary pressure (middle), and scaling factor (bot-tom) profiles along the length of the Edward Brown carbonate rock core for the multi-ratedrainage experiments carried out at q = 0.75, 2, 6 mL/min. The symbols represent experi-mental observations, while solid and dashed lines are the predictions from the homogeneousand heterogeneous models, respectively. Parameters of the vG pc(S) curve are: α = 0.12 kPa,n = 2.22 and Sir = 0.29. All other input parameters for the simulations are listed in Table 1.
43
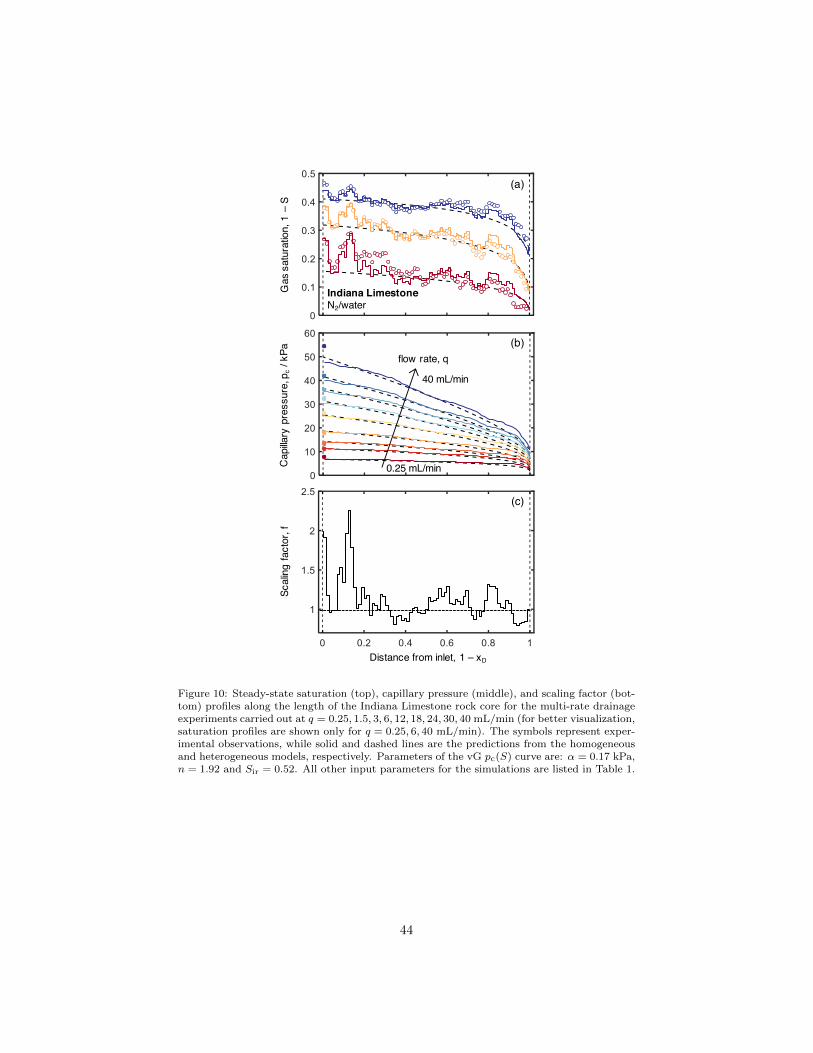
0.25 mL/min
40 mL/min
(a)
(b)
(c)
Indiana LimestoneN2/water
flow rate, q
Distance from inlet, 1 – xD
Gas
sat
urat
ion,
1 –
SC
apilla
ry p
ress
ure,
pc
/ kPa
Scal
ing
fact
or, f
Figure 10: Steady-state saturation (top), capillary pressure (middle), and scaling factor (bot-tom) profiles along the length of the Indiana Limestone rock core for the multi-rate drainageexperiments carried out at q = 0.25, 1.5, 3, 6, 12, 18, 24, 30, 40 mL/min (for better visualization,saturation profiles are shown only for q = 0.25, 6, 40 mL/min). The symbols represent exper-imental observations, while solid and dashed lines are the predictions from the homogeneousand heterogeneous models, respectively. Parameters of the vG pc(S) curve are: α = 0.17 kPa,n = 1.92 and Sir = 0.52. All other input parameters for the simulations are listed in Table 1.
44
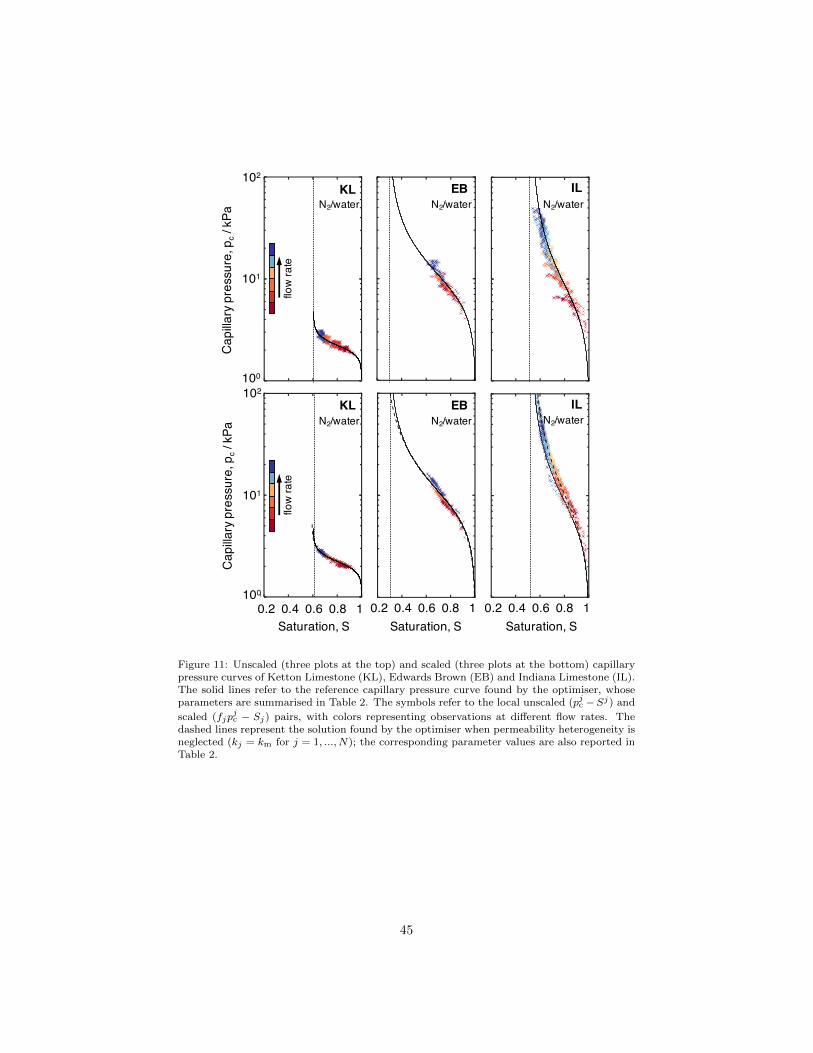
Capi
llary
pre
ssur
e, p
c/ k
Pa
102
101
100
Capi
llary
pre
ssur
e, p
c/ k
Pa
102
101
100
0.2 0.4 0.6 0.8 1 0.2 0.4 0.6 0.8 1 0.2 0.4 0.6 0.8 1Saturation, S Saturation, S Saturation, S
flow
rate
KLN2/water
EB ILN2/water N2/water
KLN2/water
EB ILN2/water N2/water
flow
rate
Figure 11: Unscaled (three plots at the top) and scaled (three plots at the bottom) capillarypressure curves of Ketton Limestone (KL), Edwards Brown (EB) and Indiana Limestone (IL).The solid lines refer to the reference capillary pressure curve found by the optimiser, whoseparameters are summarised in Table 2. The symbols refer to the local unscaled (pjc −Sj) and
scaled (fjpjc − Sj) pairs, with colors representing observations at different flow rates. The
dashed lines represent the solution found by the optimiser when permeability heterogeneity isneglected (kj = km for j = 1, ..., N); the corresponding parameter values are also reported inTable 2.
45
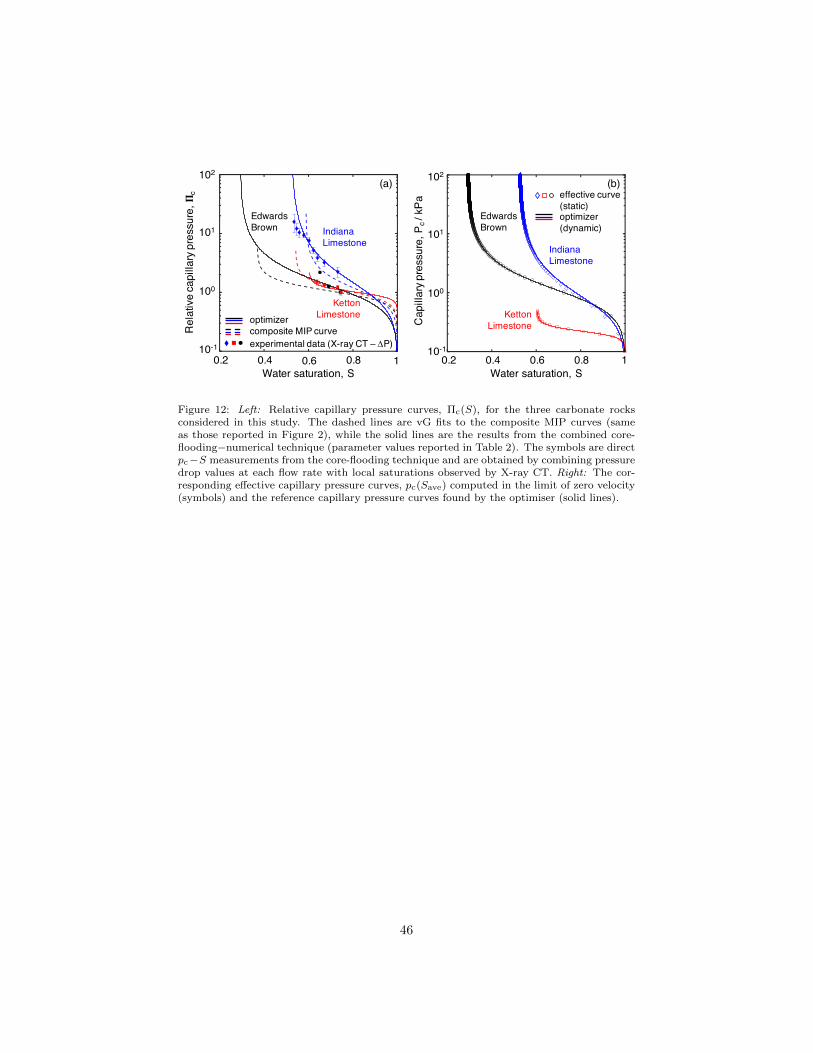
(a) (b)
Ketton Limestone
Edwards Brown Indiana
Limestone
experimental data (X-ray CT – DP)composite MIP curveoptimizer
Water saturation, S
Rel
ativ
e ca
pilla
ry p
ress
ure,
𝚷c
102
0.2 0.4 0.6 0.8 1
101
100
10-1
Ketton Limestone
Edwards Brown
Indiana Limestone
Cap
illar
y pre
ssur
e, P
c / k
Pa
102
101
100
10-1
Water saturation, S0.2 0.4 0.6 0.8 1
effective curve (static)optimizer (dynamic)
Figure 12: Left: Relative capillary pressure curves, Πc(S), for the three carbonate rocksconsidered in this study. The dashed lines are vG fits to the composite MIP curves (sameas those reported in Figure 2), while the solid lines are the results from the combined core-flooding−numerical technique (parameter values reported in Table 2). The symbols are directpc−S measurements from the core-flooding technique and are obtained by combining pressuredrop values at each flow rate with local saturations observed by X-ray CT. Right: The cor-responding effective capillary pressure curves, pc(Save) computed in the limit of zero velocity(symbols) and the reference capillary pressure curves found by the optimiser (solid lines).
46
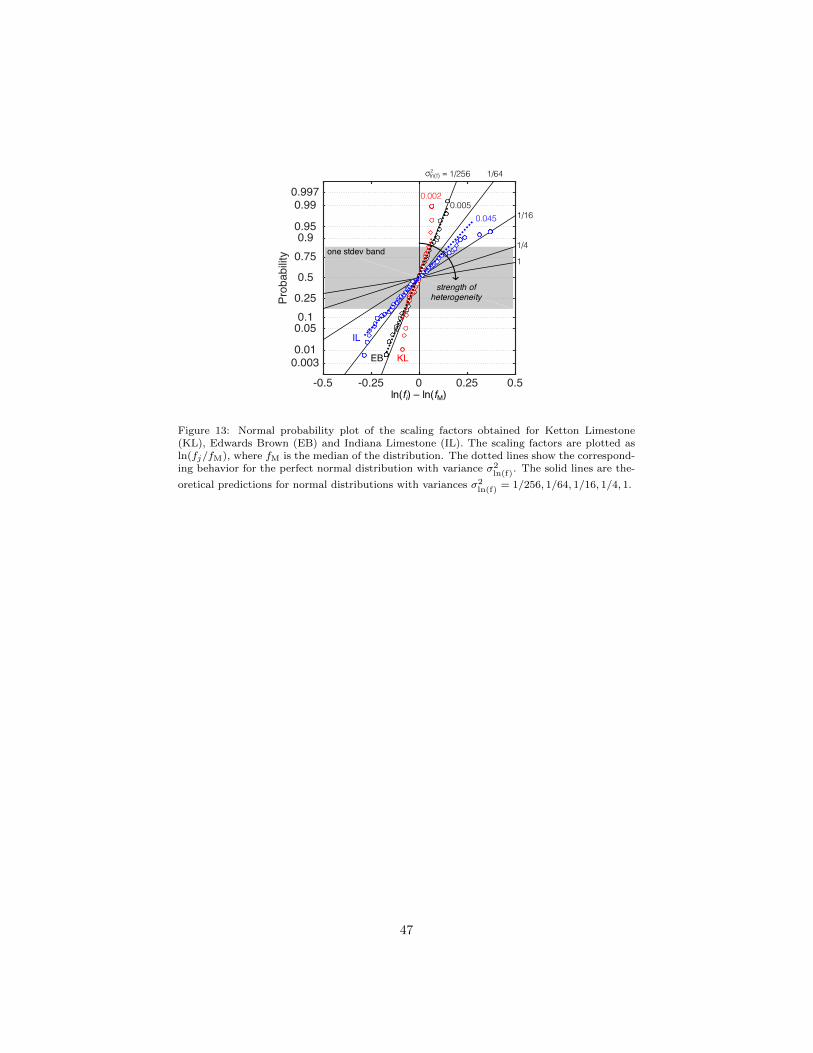
log(f)-log(fM)-0.5 -0.25 0 0.25 0.5
Prob
abilit
y
0.0030.01
0.05 0.1
0.25
0.5
0.75 0.9
0.95
0.99 0.997
1/16
1/4
1one stdev band
strength of heterogeneity
σln(f) =2
KLEB
IL
ln(fi) – ln(fM)
1/641/256
0.0020.005
0.045
Figure 13: Normal probability plot of the scaling factors obtained for Ketton Limestone(KL), Edwards Brown (EB) and Indiana Limestone (IL). The scaling factors are plotted asln(fj/fM), where fM is the median of the distribution. The dotted lines show the correspond-ing behavior for the perfect normal distribution with variance σ2
ln(f). The solid lines are the-
oretical predictions for normal distributions with variances σ2ln(f)
= 1/256, 1/64, 1/16, 1/4, 1.
47


![Capillary thermostatting in capillary electrophoresis · Capillary thermostatting in capillary electrophoresis ... 75 µm BF 3 Injection: ... 25-µm id BF 5 capillary. Voltage [kV]](https://img.dokumen.tips/doc/110x75/5c176ff509d3f27a578bf33a/capillary-thermostatting-in-capillary-electrophoresis-capillary-thermostatting.jpg)