Embed Size (px)
Citation preview

Dynamic Load Balancing of VirtualizedDatabase Services Using Hints and Load
Forecasting
Daniel Gmach Stefan Krompass Stefan SeltzsamMartin Wimmer Alfons Kemper
Technische Universitat MunchenD-85748 Garching/Munchen, Germany
〈firstname.lastname〉@in.tum.de
Abstract. Future database application systems will be designed as Ser-vice Oriented Architectures (SOAs), in contrast to today’s monolithicarchitectures. The decomposition in many small services allows the us-age of hardware clusters and a flexible service-to-server allocation butalso increases the complexity of administration. Thus, new adminis-tration techniques like our self-organizing infrastructure are necessary.It monitors the system, reacts automatically on exceptional situations,e.g., overload of a server, and features self-optimizing capabilities. Inthe context of distributed services it takes some time until the reac-tion on an exceptional situation becomes effective. During this time theserver stays overloaded which leads to a poor performance of servicesrunning on this server. In this paper, we present a novel concept toimprove self-organizing infrastructures to react proactively. For this pur-pose we present two techniques: Short-term load forecasting for serviceswith periodic behavior and exploitation of hints from administrators,e.g., resource consumptions, for irregular events. With these techniquesour system reacts proactively on imminent overload situations beforethey actually appear, thus avoiding overload situations. The quality ofhigher-level services, like enterprise resource planning (ERP) systems,can be improved by running on this proactive platform. We used ourprototype implementation to perform comprehensive simulation studies,which demonstrate the effectiveness of our approaches.
1 Introduction
Concerning the administration of Service Oriented Architectures (SOA) for data-base application systems, three objectives can be identified: Low administrationeffort, low total cost of ownership (TCO), and a high degree of service availabilityand performance, i.e., ensuring that a predefined number of clients (customersand employees) can be handled by the infrastructure. To guarantee high per-formance, an oversized hardware environment could be used. Obviously, thiscounteracts the second objective of low TCO. To balance these objectives, ser-vices have to be assigned to the available servers intelligently and monitoredcontinuously. Thus, we developed our self-organizing infrastructure AutoGlobe

11:00 15:00 19:00 Time
CPU-
Load
80%
100%
t2t1
scale-out
07:00
Server A
Fig. 1. Standard Controller
11:00 15:00 19:00 Time
CPU-
Load
80%
100%
t1
scale-
out
07:00
t2Server A
Fig. 2. Proactive Controller
[1] that is based on a feedback control loop. AutoGlobe monitors the currentstate of the system and reacts on an exceptional situation by, e.g., moving an in-stance of a service to another less loaded server during runtime. Figure 1 showsthe load curve of a typical interactive service. In the morning at 7 AM whenusers start to work the load increases rapidly. The self-organizing infrastructuredetects the exceptional situation at time t1 and reacts after a verification phasein which the service is monitored for a certain time to filter out short load peaks.Furthermore, until the reaction – indicated by the start of an additional instanceon another server (scale-out) in Figure 1 – takes effect, some time goes by (t2).During the period [t1, t2] the server is overloaded – we assume a server with loadabove 80% as overloaded – and the services running on the server exhibit poorperformance. With the proactive control concept proposed in this paper, we im-prove our self-organizing infrastructure to administrate the system proactively,i.e., executing actions before load actually increases (see Figure 2). This conceptis based on two techniques, which we integrated into our self-organizing infra-structure AutoGlobe [1]. Short-term load forecasting for services with periodicbehavior and exploitation of hints for irregular events. Empirical studies showthat most ERP-systems exhibit periodic load patterns. We use this knowledge inour first technique, that is based on short-term load forecasting. The controllerforecasts the load of a service in the near future using extracted load patternsand the current system state. With short-term load forecasting we achieve a wellbalanced system by avoiding most exceptional situations without administratorinteractions. The second technique is based on hints specified by administra-tors. For example, an administrator may specify the necessary number of serviceinstances running during the course of a working day. Based on these hints,the controller starts additional instances before the load actually increases, thusavoiding exceptional system states.
The remainder of the paper is organized as follows: In Section 2 the archi-tecture of our self-organizing infrastructure AutoGlobe is presented. Section 3describes the exploitation of hints. Then, methods for pattern extraction fromhistorical data and short term load forecasting follow in Section 4. Simulationstudy results follow in Section 5. Finally, in Section 6 we present related workprior to a conclusion and discussion of future research in Section 7.

Load Archive
(1) Initial Static
Allocation
Static Allocation Management
(4) Pattern
Extraction
(5) Static
Allocation
Calculation
Improved
Allocation?
Yes(6) Adoption of the
Static Allocation
Dynamic Allocation Management
(2) Monitoring
(3) Dynamic
Optimization of
the Allocation readwrite
Fig. 3. The AutoGlobe Framework
2 Self-Managing IT-Infrastructure
AutoGlobe [1] is based on our distributed and open Web service platform Ser-viceGlobe [2, 3]. ServiceGlobe is fully implemented in Java Version 2 and is basedon standards like XML, SOAP, UDDI, and WSDL. The key innovation of Ser-viceGlobe is the support of mobile code, i.e., services can be distributed andinstantiated during runtime on demand at arbitrary servers participating in theServiceGlobe federation. Those servers are called service hosts. Of course, Ser-viceGlobe offers the entire standard functionality of a service platform like atransaction system and a security system [4]. The goal of the AutoGlobe projectis to add an active control component for automated service and server manage-ment to ServiceGlobe.
Services managed by the AutoGlobe platform are virtualized by the use ofservice IP addresses, i.e., every service has its own IP address assigned. This IPaddress is bound to the physical network interface card (NIC) of the host runningthe service. Thus, if a service is moved from one host to another, the virtual IPaddress is unbound from the NIC of the old host running the service and after-wards bound to the NIC of the target host. Consequently, services are decoupledfrom servers. This service virtualization is a vital requirement for AutoGlobe.
Though not being restricted to this kind of hardware infrastructure, the ben-efits of AutoGlobe can be experienced best on a flexible infrastructure like ablade server environment. The advantages of blade servers compared to tradi-tional mainframe oriented hardware are that they are relatively cheap and theprocessing power can easily be scaled to the respective demand by varying thenumber of blades on the fly. Blade servers normally store their data using a stor-age area network (SAN) or a network attached storage (NAS). Thus, CPU powerand storage capacity can be scaled independently and services can be executedon any blade because services can access their persistent data regardless of theblade on which they are running.
2.1 Dynamic and Static Service Deployment
Figure 3 shows the basic AutoGlobe concepts, i.e., the interplay of dynamic andstatic service-to-server allocation management. The dynamic allocation manage-ment monitors services and servers (2). Exceptional situations, like failures andoverload situations are detected and remedied by a fuzzy logic based controller (3).
Static Dynamic
Scale
-Ou
t
Cap
ab
le
No
t S
cale
-Ou
t
Cap
ab
le
increase-priority
decrease-priority
scale-out
scale-in
increase-priority
decrease-priority
scale-out
scale-in
increase-priority
decrease-priority
increase-priority
decrease-priority
move
scale-up
scale-down
move
scale-up
scale-down
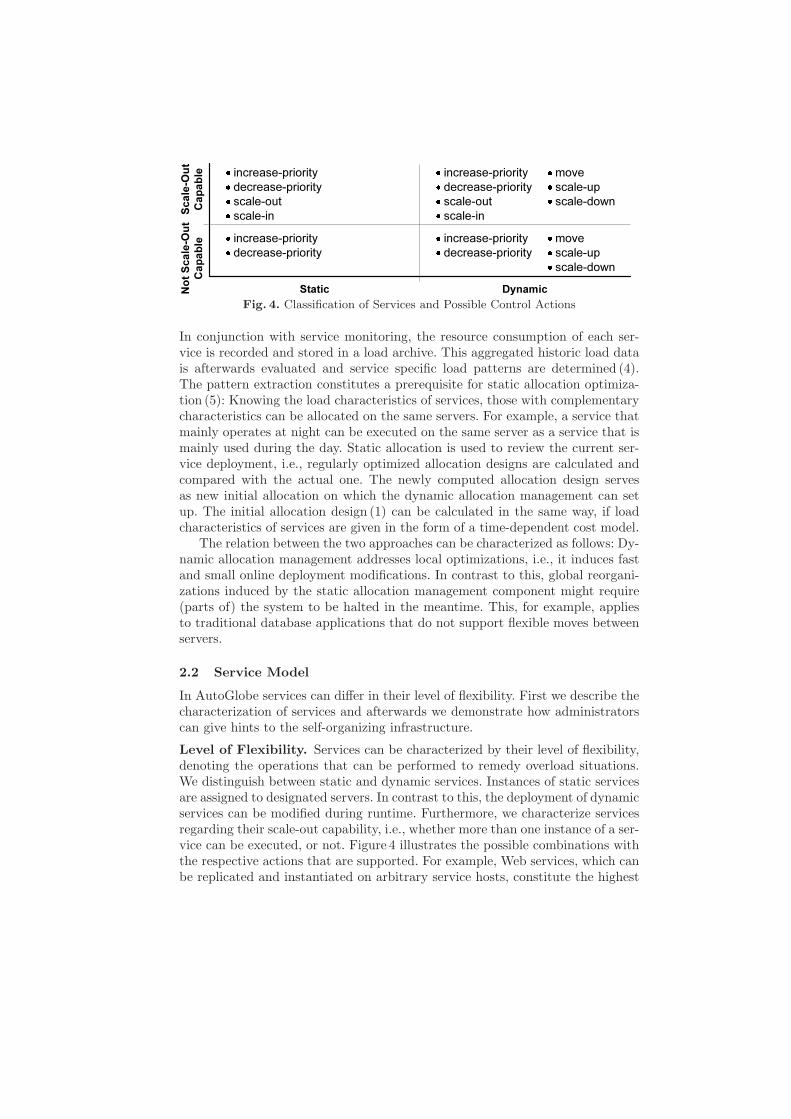
Fig. 4. Classification of Services and Possible Control Actions
In conjunction with service monitoring, the resource consumption of each ser-vice is recorded and stored in a load archive. This aggregated historic load datais afterwards evaluated and service specific load patterns are determined (4).The pattern extraction constitutes a prerequisite for static allocation optimiza-tion (5): Knowing the load characteristics of services, those with complementarycharacteristics can be allocated on the same servers. For example, a service thatmainly operates at night can be executed on the same server as a service that ismainly used during the day. Static allocation is used to review the current ser-vice deployment, i.e., regularly optimized allocation designs are calculated andcompared with the actual one. The newly computed allocation design servesas new initial allocation on which the dynamic allocation management can setup. The initial allocation design (1) can be calculated in the same way, if loadcharacteristics of services are given in the form of a time-dependent cost model.
The relation between the two approaches can be characterized as follows: Dy-namic allocation management addresses local optimizations, i.e., it induces fastand small online deployment modifications. In contrast to this, global reorgani-zations induced by the static allocation management component might require(parts of) the system to be halted in the meantime. This, for example, appliesto traditional database applications that do not support flexible moves betweenservers.
2.2 Service Model
In AutoGlobe services can differ in their level of flexibility. First we describe thecharacterization of services and afterwards we demonstrate how administratorscan give hints to the self-organizing infrastructure.
Level of Flexibility. Services can be characterized by their level of flexibility,denoting the operations that can be performed to remedy overload situations.We distinguish between static and dynamic services. Instances of static servicesare assigned to designated servers. In contrast to this, the deployment of dynamicservices can be modified during runtime. Furthermore, we characterize servicesregarding their scale-out capability, i.e., whether more than one instance of a ser-vice can be executed, or not. Figure 4 illustrates the possible combinations withthe respective actions that are supported. For example, Web services, which canbe replicated and instantiated on arbitrary service hosts, constitute the highest

Action Description
start starting a servicestop stopping a servicescale-in stopping a service instancescale-out starting an additional service instancescale-up moving a service instance to a more powerful serverscale-down moving a service instance to a less powerful servermove moving a service instance to an equivalently powerful serverincrease-priority increasing a service’s priorityreduce-priority reducing a service’s priority
Table 1. Supported operations (depending on the level of flexibility)
level of flexibility. In contrast to this, traditional central database instances areoftentimes static and not scale-out capable. An overview of the actions is givenin Table 1. These operations are initiated by the controller that manages thedynamic allocation.
Moving an instance requires that its context, i.e., the state information of allusers currently utilizing the service instance, has to be materialized and a newinstance has to be restarted that restores this context. Thus, the necessary timefor a movement depends on the service. Obviously, such reorganization must betransparent to clients. Thus, a sophisticated dispatcher that supports a smoothtransition onto a new instance is needed. Some of the operations depicted inTable 1, like moves, are not supported by all available services yet. Currently,the trend away from monolithic applications towards ERP systems that consistof aggregated, distributed, and autonomous services can be observed. Thus, ap-plications are supposed to achieve a higher level of flexibility in the near future.
Hints. The features of services, e.g., their level of flexibility, are described usingan XML description language. We extended this language such that administra-tors can give hints about services to the infrastructure, e.g., resource require-ments. Table 2 gives an overview of the possible hints. For example, the hintinstances denotes the minimum and maximum number of instances that shouldbe executed for a service. With the hints pinned and exclude the administratorspecifies on which servers the service may or must not be executed. AutoGlobesupports two kinds of hints: instances and overallPIES are service-orientedhints, all other hints describe the properties of every instance of the service.
Furthermore, the administrator can specify hints that are valid in periodicintervals. The following example shows a temporary resource hint for a financialaccounting (FI)-service.
<service id="FI">
<temporaryHints>
<series name="example" startDate="20050201" endDate="20050301">
<time startTime="07:00:00" endTime="18:00:00"/>
<hint>
<instances hintName="between two and four">
<min>2</min>
<max>4</max>

Hint Description
instances minimum and maximum number of instancesmemory minimum and maximum of main memory of the servertempSpace minimum and maximum of temporary space of the serverperformanceIndex minimum and maximum performance index of the serverexclusive exclusive allocation of the servicepinned list of possible server for the serviceexclude list of excluded server for the serviceoverallPIES minimum and maximum for the sum of the performance indices
Table 2. Supported Hints
</instances>
<overallPIES hintName="at least 10 PIES">
<min>10</min>
</overallPIES>
</hint>
</series>
</temporaryHints>
</service>
The hint is valid between February 1st, 2005 and March 1st, 2005. During thistime the hint should be adhered every day from 7 AM to 6 PM and states thatthe service should be executed on at least 2 and at most 4 servers. Furthermore,the sum of the performance indices (the performance index of a server describesits overall capacity) should be at least 10 PIES, whereas one PIES correspondsto the capacity of a server with performance index one.
3 Hints about the resource consumption
In many cases the administrators know situations that claim for plenty resourcesin advance and can help the system by giving hints (see Section 2.2).
Figure 5 shows the architecture of the hint controller. The hint controllerbecomes active at the start of a service and every time a temporary hint becomeseffective. First, it checks for inconsistencies and consolidates all hints that areeffective at the moment. Afterwards, the hint controller enforces the consolidatedhints by activating the fuzzy controller. Figure 6 shows the embedding of the hintcontroller in the dynamic controller. The hint controller chooses an appropriateaction and triggers the fuzzy controller that chooses an appropriate target serverfor the action. Finally, the dynamic controller executes the action on the targetserver and, thus, achieves adherence of the hints.
3.1 Detection of InconsistenciesIn a first step the hint controller checks if several hints valid at the momentcontradict each other, e.g., one hint claims at least 4 instances and another atmost 2 instances. In case of inconsistencies, the hint controller sends a warningto the administrator and ignores inconsistent hints. Afterwards, it consolidatesthe remaining hints. For Example, if we have two hints, the first one claims atleast 2 and at most 6 instances and the second one at least 4 instances, theconsolidated hint claims at least 4 and at most 6 instances for the service.

Hint Controller
Enforcement of
Service-oriented
Hints
Detection of
Inconsistencies
Enforcement of
Instance-oriented
Hints
Warning to
Administrator
Action
Action
Service Description with Hints
Fig. 5. Hint Controller
Dynamic Controller
Fuzzy ControllerHint
Controller
Service
Description with
Hints
Rulebase
Execution of the
Action
Action Action
Host
Failure
Fig. 6. Dynamic Controller
3.2 Exploiting Hints
The exploitation of the consolidated hints proceeds in two steps. In the firststep the hint controller checks the service-oriented hints (see Section 2.2), i.e.,number of instances and the total sum of performance indices (overallPIES). Ifthe considered service has less instances than required, the hint controller willtrigger the fuzzy controller with scale-out actions and specify the performanceindices of the target servers regarding the total sum of performance indices.Thus, we increase the chance that the hint for the total sum of performanceindices is adhered. Of course, the fuzzy controller only selects target servers forthe action that fulfill all conditions. The case that too many instances of a serviceare running is treated analogously. Additionally, the hint controller checks thesum of performance indices and potentially corrects the situation by triggeringscale-ups or scale-downs, respectively.
In the second step the hint controller checks for every instance of the ser-vice if all instance-oriented hints are satisfied. The different hints are checkedsequentially for every instance, starting with resource hints like performance in-dex, main memory, and temporary space, followed by the exclusive flag and thelist of pinned and excluded servers. If one of these hints is violated, the hintcontroller triggers actions like move, scale-up, or scale-down – depending on thecurrent situation and on the operations supported by the service.
4 Dynamic Load Balancing Based on Short-term LoadForecasting
We use short-term load forecasting to improve the dynamic load balancing of oursystem. Therefore, we extract patterns from services revealing periodic behaviorto gain information about their future load consumption.
4.1 Pattern Extraction
The load induced by ERP applications often shows a periodic characteristic.Considering an LES service for example, typical load peaks can be recognizedcaused by the work day of the employees. In our experiments we analyzed theCPU and memory requirements of services. As the algorithms are not restricted

Determining Pattern Length Determining Start Points Extracting Pattern
Frequency
Intensity
Time
Load
Time
Load
/T N
Preprocessing Load Curve
Time
Load
Fig. 7. Pattern Extraction
to CPU and memory, we use a generic notion of load in the following. Figure 7gives an overview of the pattern extraction.
First, historic load information of the distinct service instances is aggregatedto one equidistantly sampled time series representing the overall load inducedby the respective service. Thereby, the performance of the host machines theinstance is executed on is considered through a normalization factor.
According to the classic additive component model [5], a time series (xt)1≤t≤N
is composed of trend component, cyclical component, and remainder. The trendmodels the long-term monotonic change of the average level of the time serieswhile the remainder represents noise effects. Service specific load patterns arecharacterized by the cyclical component. Time series can be represented as anoverlay of harmonics that can efficiently be computed via Fourier Transforma-tion. The function I (λ), with
I (λ) =N ·[C (λ)2 + S (λ)2
], with λ ∈ R and
C (λ) =1N
∑1≤t≤N
(xt − x) · cos 2πλt, S (λ) =1N
∑1≤t≤N
(xt − x) · sin 2πλt
defines the intensity, with which the harmonic of frequency λ is present in thetime series that is normalized by the mean value x. The correlation between thepattern length T and I is that I is maximized at T/N . Thus, finding the dom-inant frequency provides hints about the length of a pattern. Subsequently, wedetermine distinctive start points for the particular pattern occurrences of lengthT within the time series. Finally, the representative load pattern ps for service sis computed as the mean of these reoccurrences. For further details see [1] wherepattern extraction is used in the context of static allocation management.
The extraction process is done under the assumption, that the series actuallyreveals a periodic characteristic. Whether this holds is evaluated in a subsequentclassification phase. Therefore, the distance of the extracted templates to theoriginal time series and the evaluation of the periodogram are used to estimatethe quality of the extracted patterns. Depending on these estimation factors,clusters of services are calculated – in the simplest case, services with relativelyhigh probability of being periodic are separated from those that are supposedto show irregular load development. To sum up, it is noticeable that the patternextraction proceeds with a minimum of parameterization, which is a prerequisitefor its applicability in the context of adaptive computing.
4.2 Short-term Load Forecasting
The dynamic controller uses patterns to forecast load for the monitored servicesin the near future. Figure 8 shows a typical load pattern for an ERP service,

06 Time
PIES
00 12 18 24
( )sp t
Fig. 8. Extracted Load Pattern
06Time
CPU-Load
00 12 18t t t+ ∆
, ( )s cl t
80%
100%
Fig. 9. Load Forecasting
where load increases in the morning and reaches peaks in the morning, beforemidday, and in the evening before users leave off work. The load is measured inPIES and one PIES corresponds to the capacity of a server with performanceindex one. Figure 9 shows the situation at time t. The solid line exhibits theload of the monitored instance and the dotted line exhibits the forecasted loadin the near future. Due to performance the controller only forecasts the load lsof the service s for the time t + ∆T , but for illustration purposes, we show thecomplete curve. The assumption
ls,c(t)ls(t)
=ls,c(t + ∆t)ls(t + ∆t)
is necessary to forecast future load. It states that the fraction of instance loadls,c of service s on server c by the service load ls is assumed constant for theforecasting period. This denotes that the distribution of the users or requests tothe service instances between t and t + ∆t remains constant. Under the precon-dition that the load of the service ps(t) extracted from the pattern for the timet is greater than zero the equation
ls,c(t + ∆t) =1
pic· ls,c(t) · ps(t + ∆t)
ps(t)
calculates the future load value ls,c for the time t + ∆t. If the pattern is correctps(t) equals ls(t) which is the monitored value. The current load of the instancels,c(t) multiplied by the relative change of the service load (last fraction) is theforecasted load of the instance in PIES. To obtain the load caused by the instanceon the server c, we divide this value by the performance index pic of the server c.
In case ps(t) is zero we need information about how the dispatcher distributesusers or user requests. Then, the controller can estimate the future load of theservice instances from the forecasted load of the service.
4.3 Reacting Proactively
The dynamic controller uses the forecasted load values and reacts if an excep-tional situation is forecasted. Therefore, the interval ∆t should be chosen care-fully. If ∆t is very small, the effect of the reaction probably is too late. If ∆t isvery large, on the one hand forecasted values are inaccurate because the aboveassumption is likely not to hold and on the other hand the controller reacts
Time
CPU-Load
t t+ ∆
80%
100%
t Server A
cl
c sl l+
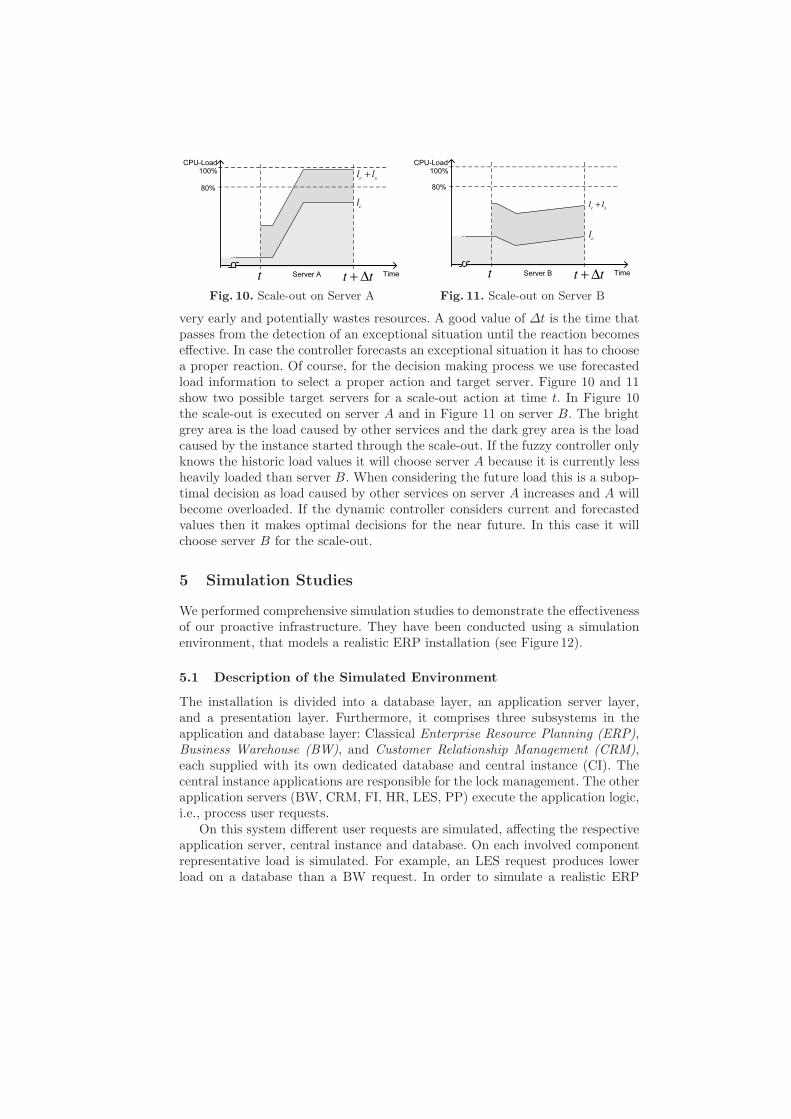
Fig. 10. Scale-out on Server A
CPU-Load
t t t+ ∆
80%
100%
Server B
cl
c sl l+
Time
Fig. 11. Scale-out on Server B
very early and potentially wastes resources. A good value of ∆t is the time thatpasses from the detection of an exceptional situation until the reaction becomeseffective. In case the controller forecasts an exceptional situation it has to choosea proper reaction. Of course, for the decision making process we use forecastedload information to select a proper action and target server. Figure 10 and 11show two possible target servers for a scale-out action at time t. In Figure 10the scale-out is executed on server A and in Figure 11 on server B. The brightgrey area is the load caused by other services and the dark grey area is the loadcaused by the instance started through the scale-out. If the fuzzy controller onlyknows the historic load values it will choose server A because it is currently lessheavily loaded than server B. When considering the future load this is a subop-timal decision as load caused by other services on server A increases and A willbecome overloaded. If the dynamic controller considers current and forecastedvalues then it makes optimal decisions for the near future. In this case it willchoose server B for the scale-out.
5 Simulation Studies
We performed comprehensive simulation studies to demonstrate the effectivenessof our proactive infrastructure. They have been conducted using a simulationenvironment, that models a realistic ERP installation (see Figure 12).
5.1 Description of the Simulated Environment
The installation is divided into a database layer, an application server layer,and a presentation layer. Furthermore, it comprises three subsystems in theapplication and database layer: Classical Enterprise Resource Planning (ERP),Business Warehouse (BW), and Customer Relationship Management (CRM),each supplied with its own dedicated database and central instance (CI). Thecentral instance applications are responsible for the lock management. The otherapplication servers (BW, CRM, FI, HR, LES, PP) execute the application logic,i.e., process user requests.
On this system different user requests are simulated, affecting the respectiveapplication server, central instance and database. On each involved componentrepresentative load is simulated. For example, an LES request produces lowerload on a database than a BW request. In order to simulate a realistic ERP

Presentation Layer
CI
FI FI FI PP PP
BW
CI
Database
CRM
CI
BW: Business Warehouse
CI: Central Instance
CRM: Customer Relationship Management
FI: Financial Accounting
HR: Human Resources
LES: Logistics Execution System
PP: Production and Planning System
DatabaseDatabase
HRLES LES LES LES
Fig. 12. Simulation System – Architecture
system, the load curves of the simulated services follow predetermined patternsthat can be observed in many organizations running ERP systems. For example,a BW application is mainly working during the night, while the LES’s peaksare in the morning, before lunch and in the evening. For further details on thesimulation system see [6].
We simulate an ERP environment supervised by the dynamic controller. Theapplication servers and central instances support scale-in and scale-out actionsand the database services are static and not scale-out capable. The dispatcherdistributes users to the instances of a service according to the performance in-dexes of the servers running the instances. After a scale-out of an application,users are not dynamically redistributed. They remain logged on until they com-plete their session. We simulate a fluctuation of users, i.e., users infrequently logthemselves off and reconnect to the least-loaded application server – a kind ofbehavior that can be observed in real systems, too.
We simulated 120% Users and used the following settings: To prevent the sys-tem from reacting too late, we set the threshold value for a CPU overload to 80%,i.e., if a server has more than 80% CPU load it is considered to be overloaded. Inthis case, the controller monitors the server for 10 minutes (watchTime) in ordernot to react on short load bursts. After executing an action, the affected servicesare protected – no actions can be executed on this service – for 30 minutes andthe affected servers for 60 minutes.
5.2 Results of the Simulation Studies
Figures 13, 14, and 15 demonstrate the effectiveness of our proposed concepts.They show the load curves for all servers and the average load of the whole systemindicated by a thick line. Figure 13 shows the load curves of the system managedby the dynamic controller that we proposed in [1]. This system has problemswhen the load increases rapidly at 8 AM. After some time it manages to remedythe overload situations. To prevent the system from exceptional situations wegave the system hints that are shown in table 3. The result of the simulationwith exploiting hints is shown in Figure 14 where we manage to avoid nearly all

6 AM - 6 PM 6 PM - 6 AM
Service Instances PIES Instances PIES
CRM > 2 > 8 = 1 > 3LES > 6 > 20 = 1 > 3FI > 5 > 18 = 1 > 3PP > 3 > 12 = 1 > 3HR > 2 > 8 = 1 > 3BW = 1 > 3 > 4 > 8
Table 3. Given Hints
overload situations. At 6 AM the controller starts additional instances to satisfythe temporary hints. Thus at 8 AM there are enough instances running to takeon the increasing load. In the evening the additional instances are stopped andthe resources are freed for other services.
In Figure 15 we have the same initial situation like in Figure 13 but now weuse our proposed load forecasting technique to prevent the system from over-load situations. We monitored the simulated system for some days and extractedpatterns from the historic load data. Using these patterns our proactive infra-structure forecasts load for 180 minutes in order to have enough time to instan-tiate more additional instances. In the morning the controller detects that theload will increase in three hours and starts additional instances of the services.Furthermore, it considers forecasted load values for the choice of target servers.Thus, the dynamic controller manages to avoid the overload situations.
5.3 Comparison
Both techniques – administrator given hints and short-term load forecasting –provide a well-balanced system and manage to avoid nearly all predictable over-load situations. Furthermore, they are complementing each other. Short-termload forecasting should be used for services with cyclical behavior and hintsshould be used additionally for mission critical services with irregular load con-sumptions as they cause more administration effort. Finally, temporary hintscan be used to execute services exclusively on a server, e.g., the BW-databaseshould be executed exclusively on the server during night while during day otherservices can run on it as well.
The conclusion of our studies is that reacting proactively improves the per-formance of self-organizing infrastructures. Using short-term load forecasting forperiodic services supplemented with administrator given hints for irregular situa-tions that are known in advance, we achieve to prevent the system from nearly alloverload situations. Of course, if an unpredictable exceptional situation appears,the dynamic controller will still recognize and remedy it.
6 Related Work
Previous work in the AutoGlobe project is described in [1]. It explains the archi-tecture, the fuzzy controller, and the concept of static and dynamic allocationmanagement in detail. [6] shows the results of the corresponding simulation

0 %
20 %
40 %
60 %
80 %
100 %
00:00 06:00 12:00 18:00 00:00 06:00 12:00 18:00 00:00 06:00 12:00 18:00 00:00 06:00
CP
U L
oad
Time
Fig. 13. CPU Load of all Servers
0 %
20 %
40 %
60 %
80 %
100 %
00:00 06:00 12:00 18:00 00:00 06:00 12:00 18:00 00:00 06:00 12:00 18:00 00:00 06:00
CP
U L
oad
Time
Fig. 14. CPU Load of all Servers with Exploitation of Hints
0 %
20 %
40 %
60 %
80 %
100 %
00:00 06:00 12:00 18:00 00:00 06:00 12:00 18:00 00:00 06:00 12:00 18:00 00:00 06:00
CP
U L
oad
Time
Fig. 15. CPU Load of all Servers with Load Forecasting
Blade1Blade2Blade3Blade4Blade5Blade6Blade7Blade8Blade9Blade10Blade11Blade12Blade13Blade14Blade15Blade16DBServer1DBServer2DBServer3AverageLoad

studies. The proactive control concept presented in this paper improves the dy-namic allocation management of AutoGlobe to react proactively. Weikum [7]motivates the automatic tuning concept in the database area and concludes thatit should be based on the paradigm of a feedback control loop which consistsof three phases: observation, prediction, and reaction. [8] presents IBM’s auto-nomic query optimizer—based on a feedback control loop—that automaticallyself-validates its cost model without requiring any user interaction to repair in-correct statistics or cardinality estimates.
Since IBM coined the term of autonomic computing [9] in October 2001several global industrial players initiated research projects in this area. An au-tonomic computing system provides self-managing capabilities, i.e., it handlesself-configuration, self-healing, self-optimization, and self-protection.
The author of [10] pragmatically explains the concepts and terminology ofload balancing. This book shows the complexity of load balancing in computinginfrastructures. [11] presents an architecture that combines resource reservationsand application adaptations in the context of network applications. The authorsexamine the interaction of reservations and adaptions in detail for the resourcenetwork bandwidth. [12], [13], and [14] present storage systems that provide self-organizing capabilities and support administrators during the design of storagesystems. [15] develops an architecture for multi-platform working, based on anautonomic computing concept, where the autonomic elements communicate their’vital signs’ to achieve self-healing capabilities. [16] is a framework for enablingautonomic grid applications. They use a decentralized deductive engine, that pro-vides core capabilities for supporting automatic compositions, adaptations, andoptimizations. While these projects monitor the system and react on exceptionalsituations our concept forecasts exceptional situations and reacts proactively.
7 Conclusion
We presented a novel concept for self-organizing infrastructures that are basedon a feedback control loop to react proactively and thus improve the perfor-mance of the system. Therefore, we introduced two techniques: short-term loadforecasting and exploitation of administrator given hints. Furthermore, we im-proved our dynamic controller to regard forecasted load values for the choice of atarget server. We implemented the two techniques within the scope of our proto-type AutoGlobe, which is based on a fuzzy controller that determines an actionand a target server to remedy the exceptional situation. Using our prototype wedemonstrated the effectiveness of our proposed concept by performing compre-hensive simulation studies. The results of the studies confirm the applicabilityof our two techniques.
We are currently investigating concepts to improve quality of service (QoS)in self-organizing infrastructures. For this purpose administrators specify servicelevel agreements (SLA). Using the SLAs and the system state the controllercan calculate reservations, such that the SLA are adhered. Furthermore, thecontroller monitors the QoS-Parameters and reacts on imminent SLA-violations.

References
1. Gmach, D., Seltzsam, S., Wimmer, M., Kemper, A.: AutoGlobe: Automatische Ad-ministration von dienstbasierten Datenbankanwendungen. In: Proceedings of theGI Conference on Database Systems for Business, Technology, and Web (BTW),Karlsruhe, Germany (2005) 205–224
2. Keidl, M., Seltzsam, S., Kemper, A.: Reliable Web Service Execution and Deploy-ment in Dynamic Environments. In: Proceedings of the International Workshopon Technologies for E-Services (TES). Volume 2819 of Lecture Notes in ComputerScience (LNCS)., Berlin, Germany (2003) 104–118
3. Keidl, M., Seltzsam, S., Stocker, K., Kemper, A.: ServiceGlobe: Distributing E-Services across the Internet (Demonstration). In: Proceedings of the InternationalConference on Very Large Data Bases (VLDB), Hong Kong, China (2002) 1047–1050
4. Seltzsam, S., Borzsonyi, S., Kemper, A.: Security for Distributed E-Service Com-position. In: Proceedings of the International Workshop on Technologies for E-Services (TES). Volume 2193 of Lecture Notes in Computer Science (LNCS).,Rome, Italy (2001) 147–162
5. Schlittgen, R., Streitberg, B.: Zeitreihenanalyse. 9 edn. R. Oldenbourg Verlag(2001)
6. AutoGlobe: Simulation studies. http://www-db.in.tum.de/research/projects/AutoGlobe (2005)
7. Weikum, G., Monkeberg, A., Hasse, C., Zabback, P.: Self-tuning Database Tech-nology and Information Services: from Wishful Thinking to Viable Engineering. In:Proceedings of the International Conference on Very Large Data Bases (VLDB),Hong Kong, China (2002) 20–31
8. Markl, V., Lohman, G.M., Raman, V.: LEO: An Autonomic Query Optimizer forDB2. IBM Systems Journal 42 (2003) 98–106
9. Horn, P.: Autonomic Computing: IBM’s Perspective on the State of InformationTechnology. http://www.research.ibm.com/autonomic/manifesto/autonomic_
computing.pdf (2001)10. Bourke, T.: Server Load Balancing. O’Reilly & Associates, Sebastopol, USA (2001)11. Foster, I., Roy, A., Sander, V.: A Quality of Service Architecture that Combines
Resource Reservation and Application Adaptation. In: 8th International Workshopon Quality of Service. (2000)
12. Ganger, G.R., Strunk, J.D., Klosterman, A.J.: Self-* Storage: Brick-Based Stor-age With Automated Administration. Technical report CMU-CS-03-178, CarnegieMellon University, Pittsburgh, USA (2003)
13. Uttamchandani, S., Yin, L., Alvarez, G.A., Palmer, J., Agha, G.: CHAMELEON: ASelf-Evolving, Fully-Adaptive Resource Arbitrator for Storage Systems. USENIXAnnual Technical Conference (2005) 75–88
14. Alvarez, G.A., Borowsky, E., Go, S., Romer, T.H., Becker-Szendy, R., Golding,R., Merchant, A., Spasojevic, M., Veitch, A., Wilkes, J.: Minerva: An AutomatedResource Provisioning Tool for Large-Scale Storage Systems. ACM Transactionson Computer Systems (TOCS) 19 (2001) 483–518
15. Sterritt, R., Bantz, D.F.: Pac-men: Personal autonomic computing monitoringenvironment. In: 15th International Workshop on Database and Expert SystemsApplications (DEXA 2004), IEEE Computer Society (2004) 737–741
16. Agarwal, M., Bhat, V., Liu, H., Matossan, V., Putty, V., Schmidt, C., Zhang, G.,Zhen, L., Parashar, M., Khargharia, B., Hariri, S.: AutoMate: Enabling AutonomicApplications on the Grid. In: Proceedings of the International Workshop on ActiveMiddleware Services (AMS), Seattle, WA, USA (2003) 48–59