Embed Size (px)
Citation preview
DYNAMIC LEARNING MAPS
ESSENTIAL ELEMENTS FOR
Mathematics

The Dynamic Learning Maps Essential Elements are copyrighted by the University of Kansas Center for Research. They are based substantially on an earlier version that was copyrighted by Edvantia. The Essential Elements may be reprinted, with appropriate citation, in part or entirety by anyone. However, no text in the document may be modified. Comments, explanations, or other additional materials may be interspersed as long as they are clearly indicated that they are not part of the Essential Elements and are not the opinions of DLM. Appropriate citations follows.
Dynamic Learning Maps Consortium (2013). Dynamic Learning Maps Essential Elements for English Language Arts. Lawrence, KS: University of Kansas.
and
Dynamic Learning Maps Consortium (2013). Dynamic Learning Maps Essential Elements for Mathematics. Lawrence, KS: University of Kansas.

3
Background on the Dynamic Learning Maps Essential Elements
The Dynamic Learning Maps Essential Elements are specific statements of knowledge
and skills linked to the grade-level expectations identified in the Common Core State Standards.
The purpose of the Dynamic Learning Maps Essential Elements is to build a bridge from the
content in the Common Core State Standards to academic expectations for students with the
most significant cognitive disabilities. The initial draft of the Dynamic Learning Maps Essential
Elements (then called the Common Core Essential Elements) was released in the spring of
2012.
The initial version of the Dynamic Learning Maps Essential Elements (DLM EEs) was
developed by a group of educators and content specialists from the 12 member states of the
Dynamic Learning Maps Alternate Assessment Consortium (DLM) in the spring of 2011. Led by
Edvantia, Inc., a sub-contractor of DLM, representatives from each state education agency and
the educators and content specialists they selected developed the original draft of DLM EEs.
Experts in mathematics and English language arts, as well as individuals with expertise in
instruction for students with significant cognitive disabilities reviewed the draft documents.
Edvantia then compiled the information into the version released in the spring of 2012.
Concurrent with the development of the DLM EEs, the DLM consortium was actively
engaged in building learning maps in mathematics and English language arts. The DLM learning
maps are highly connected representations of how academic skills are acquired, as reflected in
research literature. In the case of the DLM project, the Common Core State Standards helped to
specify academic targets, while the surrounding map content clarified how students could reach
the specified standard. Learning maps of this size had not been previously developed, and as a
4
result, alignment between the DLM EEs and the learning maps was not possible until the fall of
2012, when an initial draft of the learning maps was available for review.
Alignment of the DLM EEs to the DLM Learning Maps
Teams of content experts worked together to revise the initial version of the DLM EEs
and the learning maps to ensure appropriate alignment of these two critical elements of the
project. Alignment involved horizontal alignment of the DLM EEs with the Common Core State
Standards and vertical alignment of the DLM EEs with meaningful progressions in the learning
maps. The alignment process began when researchers Caroline Mark and Kelli Thomas
compared the learning maps with the initial version of the DLM EEs to determine how the map
and the DLM EEs should be adjusted to improve their alignment. The teams of content experts
most closely involved with this alignment work included:
Mathematics English Language Arts Kelli Thomas, Ph.D. (co-lead) Caroline Mark, Ph.D. (lead)
Angela Broaddus, Ph.D. (co-lead) Jonathan Schuster, Ph.D. Perneet Sood Russell Swinburne Romine, Ph.D.
Kristin Joannou Suzanne Peterson Bryan Candea Kromm
These teams worked in consultation with Sue Bechard, Ph.D. and Karen Erickson, Ph.D.,
who offered guidance based on their experience in alternate assessments of students with
significant cognitive disabilities.
The Alignment Process
The process of aligning the learning map and the DLM EEs began by identifying nodes in
the maps that represented the essential elements in mathematics and English language arts.
This process revealed areas in the maps where additional nodes were needed to account for
incremental growth reflected from an essential element in one grade to the next. Also identified
5
were areas in which an essential element was out of place developmentally, according to
research, with other essential elements. For example, adjustments were made when an
essential element related to a higher-grade map node appeared earlier on the map than an
essential element related to a map node from a lower grade (e.g., a fifth-grade skill preceded a
third-grade skill). Finally, the alignment process revealed DLM EEs that were actually written as
instructional tasks rather than learning outcomes.
This initial review step provided the roadmap for subsequent revision of both the learning
maps and the DLM EEs. The next step in the DLM project was to develop the claims document,
which served as the basis for the evidence-centered design of the DLM project and helped to
further refine both the modeling of academic learning in the maps and the final revisions to the
DLM EEs.
Claims and Conceptual Areas
The DLM system uses a variant of evidence-centered design (ECD) as the framework for
developing the DLM Alternate Assessment System. While ECD is multifaceted, it starts with a
set of claims regarding important knowledge in the domains of interest (mathematics and
English language arts), as well as an understanding of how that knowledge is acquired. Two
sets of claims have been developed for DLM that identify the major domains of interest within
mathematics and English language arts for students with significant cognitive disabilities. These
claims are broad statements about expected student learning that serve to focus the scope of
the assessment. Because the learning map identifies particular paths to the acquisition of
academic skills, the claims also help to organize the structures in the learning map for this
population of students. Specifically, conceptual areas within the map further define the
knowledge and skills required to meet the broad claims identified by DLM.

6
The claims are also significant because they provide another means through which to
evaluate alignment between the DLM EEs and the learning map nodes, and serve as the
foundation for evaluating the validity of inferences made from test scores. DLM EEs related to a
particular claim and conceptual area must clearly link to one another, and the learning map must
reflect how that knowledge is acquired. Developing the claims and conceptual areas for DLM
provided a critical framework for organizing nodes on the learning maps and, accordingly, the
DLM EEs that align with each node.
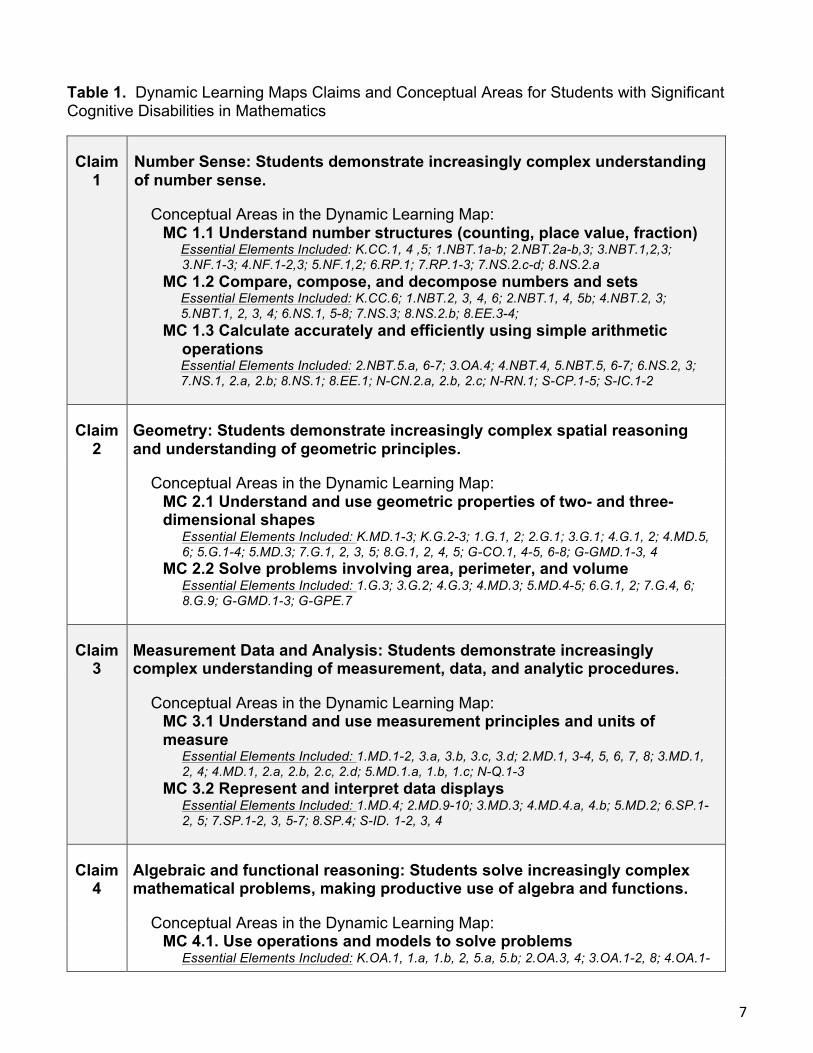
The table below reveals the relationships among the claims, conceptual areas, and DLM
EEs in mathematics. The DLM EEs are represented with codes that reflect the domains in
mathematics. For example, the first letter or digit represents the grade of record, the next code
reflects the domain, followed by the number that aligns with the Common Core State Standard
grade level expectation. As such, K.CC.1 is the code for the DLM EE that aligns with
kindergarten (K), counting and cardinality (CC), standard 1. Keys to the codes can be found
under the table.
Clearly articulated claims and conceptual areas for DLM served as an important
evidence-centered framework within which this version of the DLM EEs was developed. With
the claims and conceptual areas in place, the relationship between DLM EEs within a claim and
conceptual area or across grade levels is easier to track and strengthen. The learning maps, as
well as the claims and conceptual areas, had not yet been developed when the original versions
of the DLM EEs were created. As such, the relationship of DLM EEs within and across grade
levels was more difficult to evaluate at that time.
7
Table 1. Dynamic Learning Maps Claims and Conceptual Areas for Students with Significant Cognitive Disabilities in Mathematics
Claim 1
Number Sense: Students demonstrate increasingly complex understanding of number sense.
Conceptual Areas in the Dynamic Learning Map: MC 1.1 Understand number structures (counting, place value, fraction)
Essential Elements Included: K.CC.1, 4 ,5; 1.NBT.1a-b; 2.NBT.2a-b,3; 3.NBT.1,2,3; 3.NF.1-3; 4.NF.1-2,3; 5.NF.1,2; 6.RP.1; 7.RP.1-3; 7.NS.2.c-d; 8.NS.2.a
MC 1.2 Compare, compose, and decompose numbers and sets Essential Elements Included: K.CC.6; 1.NBT.2, 3, 4, 6; 2.NBT.1, 4, 5b; 4.NBT.2, 3; 5.NBT.1, 2, 3, 4; 6.NS.1, 5-8; 7.NS.3; 8.NS.2.b; 8.EE.3-4;
MC 1.3 Calculate accurately and efficiently using simple arithmetic operations Essential Elements Included: 2.NBT.5.a, 6-7; 3.OA.4; 4.NBT.4, 5.NBT.5, 6-7; 6.NS.2, 3; 7.NS.1, 2.a, 2.b; 8.NS.1; 8.EE.1; N-CN.2.a, 2.b, 2.c; N-RN.1; S-CP.1-5; S-IC.1-2
Claim 2
Geometry: Students demonstrate increasingly complex spatial reasoning and understanding of geometric principles.
Conceptual Areas in the Dynamic Learning Map: MC 2.1 Understand and use geometric properties of two- and three-dimensional shapes
Essential Elements Included: K.MD.1-3; K.G.2-3; 1.G.1, 2; 2.G.1; 3.G.1; 4.G.1, 2; 4.MD.5, 6; 5.G.1-4; 5.MD.3; 7.G.1, 2, 3, 5; 8.G.1, 2, 4, 5; G-CO.1, 4-5, 6-8; G-GMD.1-3, 4
MC 2.2 Solve problems involving area, perimeter, and volume Essential Elements Included: 1.G.3; 3.G.2; 4.G.3; 4.MD.3; 5.MD.4-5; 6.G.1, 2; 7.G.4, 6; 8.G.9; G-GMD.1-3; G-GPE.7
Claim 3
Measurement Data and Analysis: Students demonstrate increasingly complex understanding of measurement, data, and analytic procedures.
Conceptual Areas in the Dynamic Learning Map: MC 3.1 Understand and use measurement principles and units of measure
Essential Elements Included: 1.MD.1-2, 3.a, 3.b, 3.c, 3.d; 2.MD.1, 3-4, 5, 6, 7, 8; 3.MD.1, 2, 4; 4.MD.1, 2.a, 2.b, 2.c, 2.d; 5.MD.1.a, 1.b, 1.c; N-Q.1-3
MC 3.2 Represent and interpret data displays Essential Elements Included: 1.MD.4; 2.MD.9-10; 3.MD.3; 4.MD.4.a, 4.b; 5.MD.2; 6.SP.1-2, 5; 7.SP.1-2, 3, 5-7; 8.SP.4; S-ID. 1-2, 3, 4
Claim 4
Algebraic and functional reasoning: Students solve increasingly complex mathematical problems, making productive use of algebra and functions.
Conceptual Areas in the Dynamic Learning Map: MC 4.1. Use operations and models to solve problems
Essential Elements Included: K.OA.1, 1.a, 1.b, 2, 5.a, 5.b; 2.OA.3, 4; 3.OA.1-2, 8; 4.OA.1-
8
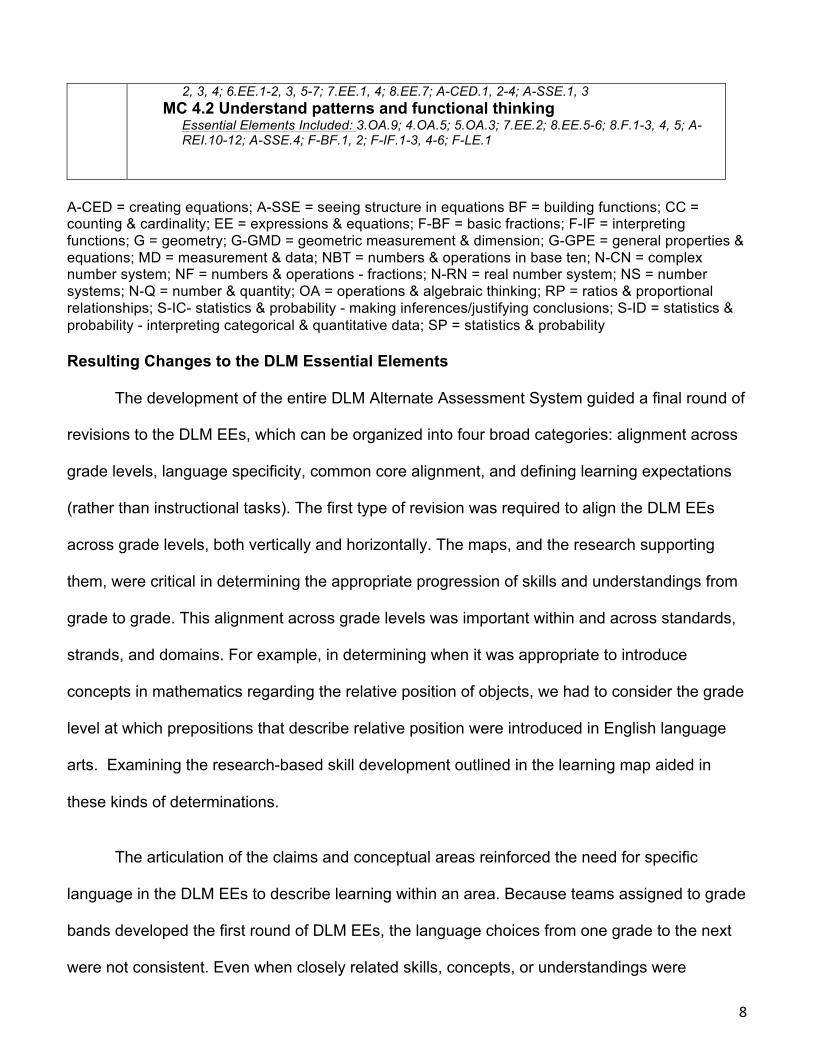
2, 3, 4; 6.EE.1-2, 3, 5-7; 7.EE.1, 4; 8.EE.7; A-CED.1, 2-4; A-SSE.1, 3 MC 4.2 Understand patterns and functional thinking
Essential Elements Included: 3.OA.9; 4.OA.5; 5.OA.3; 7.EE.2; 8.EE.5-6; 8.F.1-3, 4, 5; A-REI.10-12; A-SSE.4; F-BF.1, 2; F-IF.1-3, 4-6; F-LE.1
A-CED = creating equations; A-SSE = seeing structure in equations BF = building functions; CC = counting & cardinality; EE = expressions & equations; F-BF = basic fractions; F-IF = interpreting functions; G = geometry; G-GMD = geometric measurement & dimension; G-GPE = general properties & equations; MD = measurement & data; NBT = numbers & operations in base ten; N-CN = complex number system; NF = numbers & operations - fractions; N-RN = real number system; NS = number systems; N-Q = number & quantity; OA = operations & algebraic thinking; RP = ratios & proportional relationships; S-IC- statistics & probability - making inferences/justifying conclusions; S-ID = statistics & probability - interpreting categorical & quantitative data; SP = statistics & probability
Resulting Changes to the DLM Essential Elements
The development of the entire DLM Alternate Assessment System guided a final round of
revisions to the DLM EEs, which can be organized into four broad categories: alignment across
grade levels, language specificity, common core alignment, and defining learning expectations
(rather than instructional tasks). The first type of revision was required to align the DLM EEs
across grade levels, both vertically and horizontally. The maps, and the research supporting
them, were critical in determining the appropriate progression of skills and understandings from
grade to grade. This alignment across grade levels was important within and across standards,
strands, and domains. For example, in determining when it was appropriate to introduce
concepts in mathematics regarding the relative position of objects, we had to consider the grade
level at which prepositions that describe relative position were introduced in English language
arts. Examining the research-based skill development outlined in the learning map aided in
these kinds of determinations.
The articulation of the claims and conceptual areas reinforced the need for specific
language in the DLM EEs to describe learning within an area. Because teams assigned to grade
bands developed the first round of DLM EEs, the language choices from one grade to the next
were not consistent. Even when closely related skills, concepts, or understandings were
9
targeted, the same terms were not always selected to describe the intended learning outcome.
The teams of content experts who worked on this revised version of the DLM EEs were very
intentional in selecting a common set of terms to reflect the claims and conceptual areas and
applied them consistently across the entire set of DLM EEs.
Another important change in this version of the DLM EEs involved alignment to the
Common Core State Standards (CCSS). Given that the DLM EEs are intended to clarify the
bridge to the CCSS expectations for students with the most significant cognitive disabilities, it is
critical that alignment be as close as possible without compromising learning and development
over time. While there was never a one-to-one correspondence between the CCSS and the
DLM EEs, the revisions have made the alignment between the two more precise than it was in
the first version.
Finally, revisions to the DLM EEs involved shifting the focus of a small number of DLM
EEs that were written in the form of instructional tasks rather than learning expectations, and
adding “With guidance and support” to the beginning of a few of the DLM EEs in the primary
grades in English language arts to reflect the expectations articulated in the CCSS.
Members of the DLM consortium reviewed each of the changes to the original version of
the DLM EEs. Four states provided substantive feedback on the revisions, and this document
incorporates the changes those teams suggested.
Access to Instruction and Assessment
The DLM EEs specify learning targets for students with significant cognitive disabilities;
however, they do not describe all of the ways that students can engage in instruction or
demonstrate understanding through an assessment. Appropriate modes of communication, both
10
for presentation or response, are not stated in the DLM EEs unless a specific mode is an
expectation. Where no limitation has been stated, no limitation should be inferred. Students’
opportunities to learn and to demonstrate learning during assessment should be maximized by
providing whatever communication, assistive technologies, augmentative and alternative
communication (AAC) devices, or other access tools that are necessary and routinely used by
the student during instruction.
Students with significant cognitive disabilities include a broad range of students with
diverse disabilities and communication needs. For some students with significant cognitive
disabilities, a range of assistive technologies is required to access content and demonstrate
achievement. For other students, AAC devices or accommodations for hearing and visual
impairments will be needed. During instruction, teams should meet individual student needs
using whatever technologies and accommodations are required. Examples of some of the ways
that students may use technology while learning and demonstrating learning are topics for
professional development, and include:
• communication devices that compensate for a student’s physical inability to produce
independent speech.
• alternate access devices that compensate for a student’s physical inability to point to
responses, turn pages in a book, or use a pencil or keyboard to answer questions or
produce writing.
Guidance and Support
The authors of the CCSS use the words “prompting and support” at the earliest grade
levels to indicate when students are not expected to achieve standards completely
independently. Generally, “prompting” refers to “the action of saying something to persuade,
11
encourage, or remind someone to do or say something” (McKean, 2005). However, in special
education, prompting is often used to mean a system of structured cues to elicit desired
behaviors that otherwise would not occur. In order to clearly communicate that teacher
assistance is permitted during instruction of the DLM EEs and is not limited to structured
prompting procedures, the decision was made by the stakeholder group to use the more general
term guidance throughout the DLM EEs.
Guidance and support during instruction should be interpreted as teacher
encouragement, general assistance, and informative feedback to support the student in
learning. Some examples of the kinds of teacher behaviors that would be considered guidance
and support include verbal supports, such as
• getting the student started (e.g., “Tell me what to do first.”),
• providing a hint in the right direction without revealing the answer (e.g., Student wants
to write dog but is unsure how, so the teacher might say, “See if you can write the first
letter in the word, /d/og [phonetically pronounced].”),
• using structured technologies such as task-specific word banks, or
• providing structured cues such as those found in prompting procedures (e.g., least-to-
most prompts, simultaneous prompting, and graduated guidance).
Guidance and support as described above applies to instruction and is also linked to
demonstrating learning relative to DLM EEs, where guidance and support is specifically called
out within the standards.
Conclusion
12
Developing the research-based model of knowledge and skill development represented
in the DLM Learning Maps supported the articulation of assessment claims for mathematics and
English language arts. This articulation subsequently allowed for a careful revision of the DLM
EEs to reflect both horizontal alignment with the CCSS and vertical alignment across the
grades, with the goal of moving students toward more sophisticated understandings in both
domains. Though the contributions made by Edvantia and our state partners in developing the
initial set of DLM EEs were a critical first step, additional revisions to the DLM EEs were
required to ensure consistency across all elements of the Dynamic Learning Maps Alternate
Assessment System.
13
APPENDIX
Development of the Dynamic Learning Maps Essential Elements has been a collaborative effort
among practitioners, researchers, and our state representatives. Listed below are the reviews
and the individuals involved with each round of improvements to the Dynamic Learning Maps
Essential Elements. Thank you to all of our contributors.
Review of Draft Two of Dynamic Learning Maps Essential Elements
A special thanks to all of the experts nominated by their state to review draft two of the Dynamic
Learning Maps Essential Elements. We are grateful for your time and efforts to improve these
standards for students with significant cognitive disabilities. Your comments have been
incorporated into this draft. The states with teams who reviewed draft two include:
Illinois Oklahoma
Iowa Utah
Kansas Virginia
Michigan West Virginia
Missouri Wisconsin
Development of the Original Dynamic Learning Maps Common Core Essential Elements
A special thanks to Edvantia and the team of representatives from Dynamic Learning Maps
consortium states who developed the original Common Core Essential Elements upon which the
revised Dynamic Learning Maps Essential Elements are based. The team from Edvantia who
led the original effort included:
14
Jan Sheinker, Sheinker Educational Services, Inc. Beth Judy, Director, Assessment, Alignment, and Accountability Services Nathan Davis, Information Technology Specialist Kristen Deitrick, Corporate Communications Specialist
Linda Jones, Executive Assistant
Representatives from Dynamic Learning Maps consortium states included:
IOWA SEA Representatives: Tom Deeter, Emily Thatcher Stakeholders: Peggy Akins, Judy Hamer, Kathleen Kvamme-Promes, Donna Shaw KANSAS SEA Representatives: Debbie Matthews, Kris Shaw Stakeholders: Debby Byrne, Holly Draper, Dawn Gresham, Linda Hickey MICHIGAN SEA Representatives: Joanne Wilkelman, Adam Wyse Stakeholders: Debra Susan Asano, Thomai Gersh, Marcia O’Brian, Terri Portice MISSOURI SEA Representatives: Lynn Everett, Jane VanDeZande Stakeholders: Melia Franklin, Lou Ann Hoover, Debbie Jameson, Kate Sadler NEW JERSEY SEA Representatives: Melanie O’Dea Stakeholders: Brenda Berrios, Neal Webster, Tina Yurcho NORTH CAROLINA SEA Representatives: Claire Greer, Sarah Reives Stakeholders: Emma Hatfield-Sidden, Judy Jennings, Jennifer Michalenok, OKLAHOMA SEA Representatives: Jennifer Burnes, Amy Dougherty Stakeholders: Pam Cox, Dianna Daubenspeck, Sondra LeGrande, Christie Stephenson UTAH SEA Representatives: Wendy Carver, Kurt Farnsworth Stakeholders: James Bray, Janice Hill, Linda Stallviere, Ryan Webb VIRGINIA SEA Representative: John Eisenberg Stakeholders: Maria Beck, Daniel Blegun, Al Klugh, Cheryl Ann Prevatte WASHINGTON
15
SEA Representatives: Judy Kraft, Janice Tornow Stakeholders: Annalisa Brewster, Kim Cook, Jeffrey Dunn, Kimberly Perisho WEST VIRGINIA SEA Representatives: Beth Cipoletti, Melissa Gholson Stakeholders: Robert Bartlett, Gerald Hartley, Angel Harris, Angela See WISCONSIN SEA Representatives: Emilie Amundson, Kristen Burton Stakeholders: Lori Hillyer, Tamara Maxwell, Connie Persike, Sara Vold
48
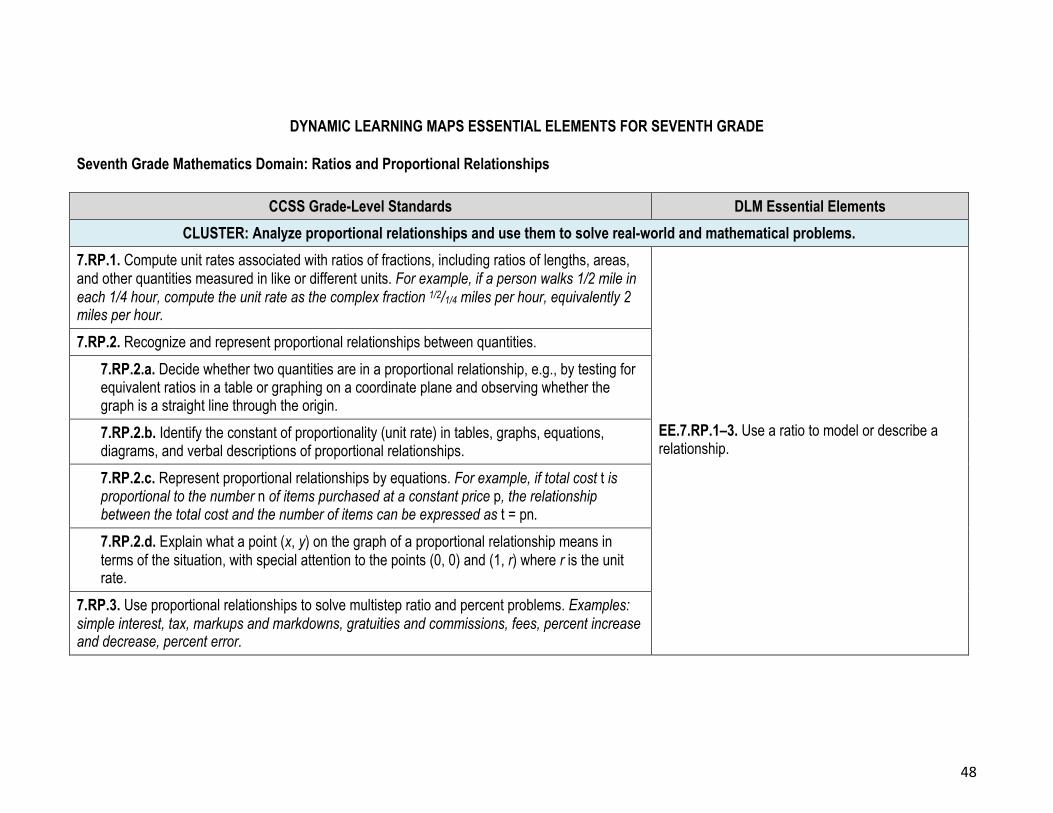
DYNAMIC LEARNING MAPS ESSENTIAL ELEMENTS FOR SEVENTH GRADE Seventh Grade Mathematics Domain: Ratios and Proportional Relationships
CCSS Grade-Level Standards DLM Essential Elements
CLUSTER: Analyze proportional relationships and use them to solve real-world and mathematical problems. 7.RP.1. Compute unit rates associated with ratios of fractions, including ratios of lengths, areas, and other quantities measured in like or different units. For example, if a person walks 1/2 mile in each 1/4 hour, compute the unit rate as the complex fraction 1/2/1/4 miles per hour, equivalently 2 miles per hour.
EE.7.RP.1–3. Use a ratio to model or describe a relationship.
7.RP.2. Recognize and represent proportional relationships between quantities.
7.RP.2.a. Decide whether two quantities are in a proportional relationship, e.g., by testing for equivalent ratios in a table or graphing on a coordinate plane and observing whether the graph is a straight line through the origin.
7.RP.2.b. Identify the constant of proportionality (unit rate) in tables, graphs, equations, diagrams, and verbal descriptions of proportional relationships.
7.RP.2.c. Represent proportional relationships by equations. For example, if total cost t is proportional to the number n of items purchased at a constant price p, the relationship between the total cost and the number of items can be expressed as t = pn.
7.RP.2.d. Explain what a point (x, y) on the graph of a proportional relationship means in terms of the situation, with special attention to the points (0, 0) and (1, r) where r is the unit rate.
7.RP.3. Use proportional relationships to solve multistep ratio and percent problems. Examples: simple interest, tax, markups and markdowns, gratuities and commissions, fees, percent increase and decrease, percent error.
49
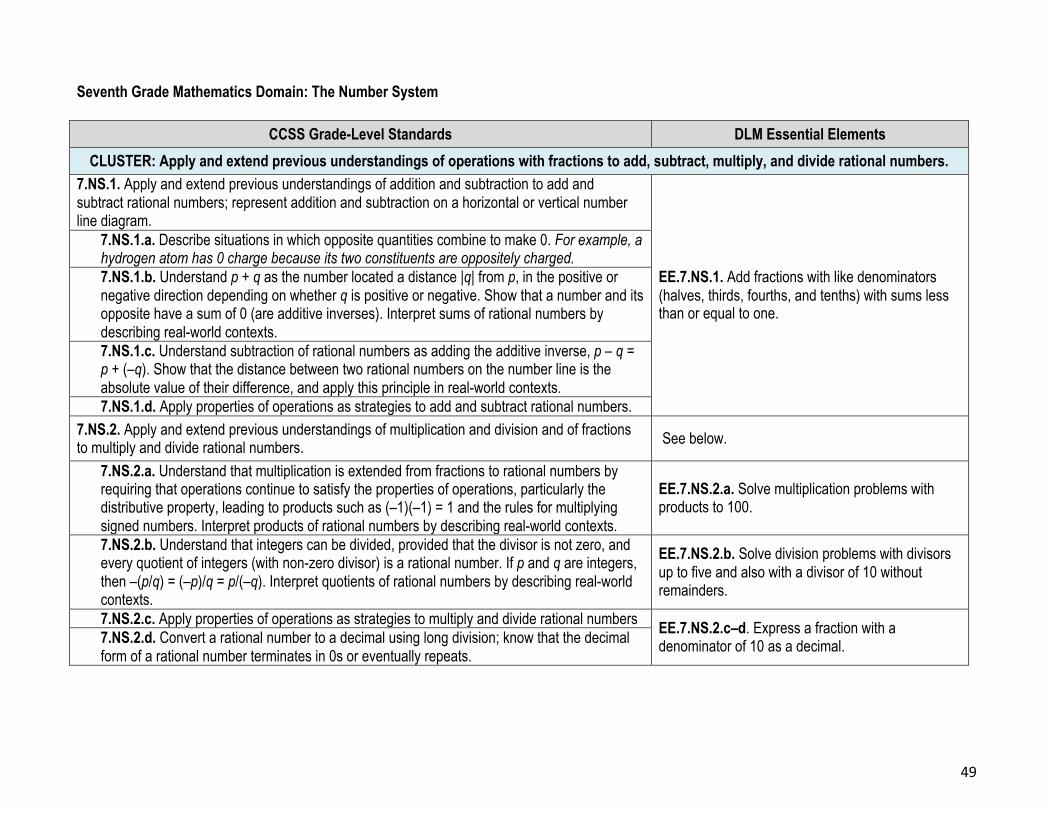
Seventh Grade Mathematics Domain: The Number System
CCSS Grade-Level Standards DLM Essential Elements
CLUSTER: Apply and extend previous understandings of operations with fractions to add, subtract, multiply, and divide rational numbers. 7.NS.1. Apply and extend previous understandings of addition and subtraction to add and subtract rational numbers; represent addition and subtraction on a horizontal or vertical number line diagram.
EE.7.NS.1. Add fractions with like denominators (halves, thirds, fourths, and tenths) with sums less than or equal to one.
7.NS.1.a. Describe situations in which opposite quantities combine to make 0. For example, a hydrogen atom has 0 charge because its two constituents are oppositely charged. 7.NS.1.b. Understand p + q as the number located a distance |q| from p, in the positive or negative direction depending on whether q is positive or negative. Show that a number and its opposite have a sum of 0 (are additive inverses). Interpret sums of rational numbers by describing real-world contexts. 7.NS.1.c. Understand subtraction of rational numbers as adding the additive inverse, p – q = p + (–q). Show that the distance between two rational numbers on the number line is the absolute value of their difference, and apply this principle in real-world contexts. 7.NS.1.d. Apply properties of operations as strategies to add and subtract rational numbers.
7.NS.2. Apply and extend previous understandings of multiplication and division and of fractions to multiply and divide rational numbers.
See below.
7.NS.2.a. Understand that multiplication is extended from fractions to rational numbers by requiring that operations continue to satisfy the properties of operations, particularly the distributive property, leading to products such as (–1)(–1) = 1 and the rules for multiplying signed numbers. Interpret products of rational numbers by describing real-world contexts.
EE.7.NS.2.a. Solve multiplication problems with products to 100.
7.NS.2.b. Understand that integers can be divided, provided that the divisor is not zero, and every quotient of integers (with non-zero divisor) is a rational number. If p and q are integers, then –(p/q) = (–p)/q = p/(–q). Interpret quotients of rational numbers by describing real-world contexts.
EE.7.NS.2.b. Solve division problems with divisors up to five and also with a divisor of 10 without remainders.
7.NS.2.c. Apply properties of operations as strategies to multiply and divide rational numbers EE.7.NS.2.c–d. Express a fraction with a denominator of 10 as a decimal. 7.NS.2.d. Convert a rational number to a decimal using long division; know that the decimal
form of a rational number terminates in 0s or eventually repeats.

50
CCSS Grade-Level Standards DLM Essential Elements
7.NS.3. Solve real-world and mathematical problems involving the four operations with rational numbers.20
EE.7.NS.3. Compare quantities represented as decimals in real-world examples to tenths.
20 Computations with rational numbers extend the rules for manipulating fractions to complex fractions.
51
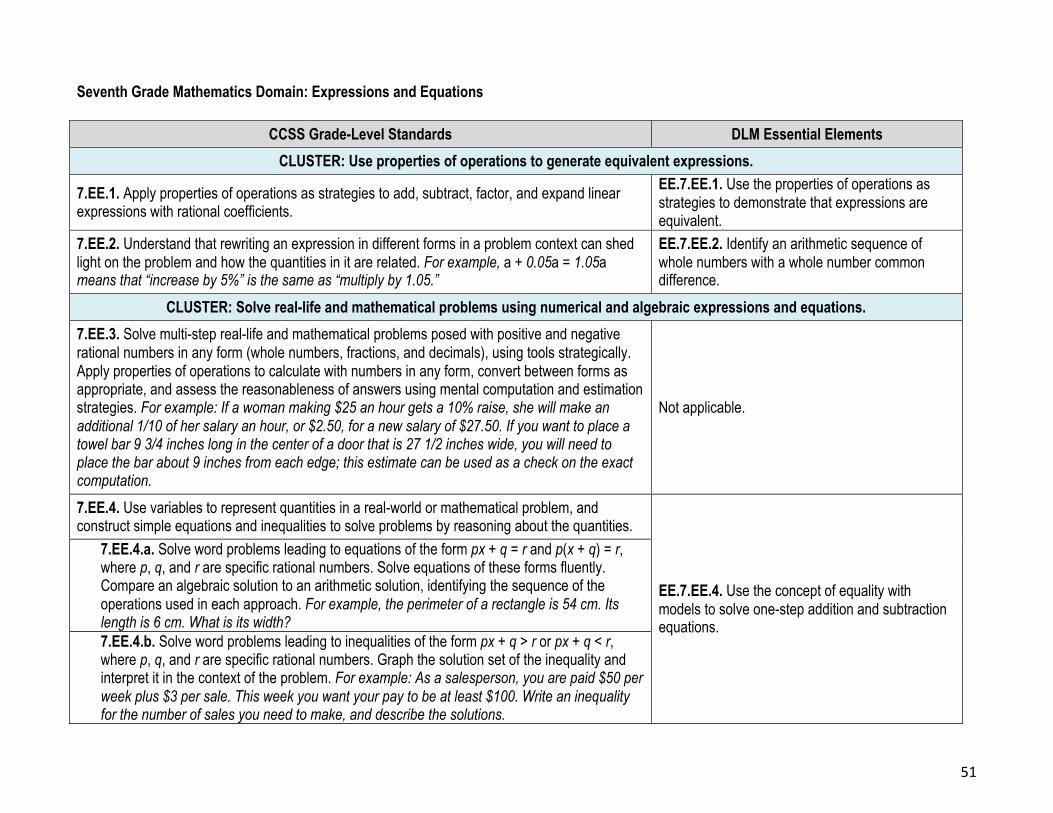
Seventh Grade Mathematics Domain: Expressions and Equations
CCSS Grade-Level Standards DLM Essential Elements
CLUSTER: Use properties of operations to generate equivalent expressions.
7.EE.1. Apply properties of operations as strategies to add, subtract, factor, and expand linear expressions with rational coefficients.
EE.7.EE.1. Use the properties of operations as strategies to demonstrate that expressions are equivalent.
7.EE.2. Understand that rewriting an expression in different forms in a problem context can shed light on the problem and how the quantities in it are related. For example, a + 0.05a = 1.05a means that “increase by 5%” is the same as “multiply by 1.05.”
EE.7.EE.2. Identify an arithmetic sequence of whole numbers with a whole number common difference.
CLUSTER: Solve real-life and mathematical problems using numerical and algebraic expressions and equations. 7.EE.3. Solve multi-step real-life and mathematical problems posed with positive and negative rational numbers in any form (whole numbers, fractions, and decimals), using tools strategically. Apply properties of operations to calculate with numbers in any form, convert between forms as appropriate, and assess the reasonableness of answers using mental computation and estimation strategies. For example: If a woman making $25 an hour gets a 10% raise, she will make an additional 1/10 of her salary an hour, or $2.50, for a new salary of $27.50. If you want to place a towel bar 9 3/4 inches long in the center of a door that is 27 1/2 inches wide, you will need to place the bar about 9 inches from each edge; this estimate can be used as a check on the exact computation.
Not applicable.
7.EE.4. Use variables to represent quantities in a real-world or mathematical problem, and construct simple equations and inequalities to solve problems by reasoning about the quantities.
EE.7.EE.4. Use the concept of equality with models to solve one-step addition and subtraction equations.
7.EE.4.a. Solve word problems leading to equations of the form px + q = r and p(x + q) = r, where p, q, and r are specific rational numbers. Solve equations of these forms fluently. Compare an algebraic solution to an arithmetic solution, identifying the sequence of the operations used in each approach. For example, the perimeter of a rectangle is 54 cm. Its length is 6 cm. What is its width? 7.EE.4.b. Solve word problems leading to inequalities of the form px + q > r or px + q < r, where p, q, and r are specific rational numbers. Graph the solution set of the inequality and interpret it in the context of the problem. For example: As a salesperson, you are paid $50 per week plus $3 per sale. This week you want your pay to be at least $100. Write an inequality for the number of sales you need to make, and describe the solutions.
52
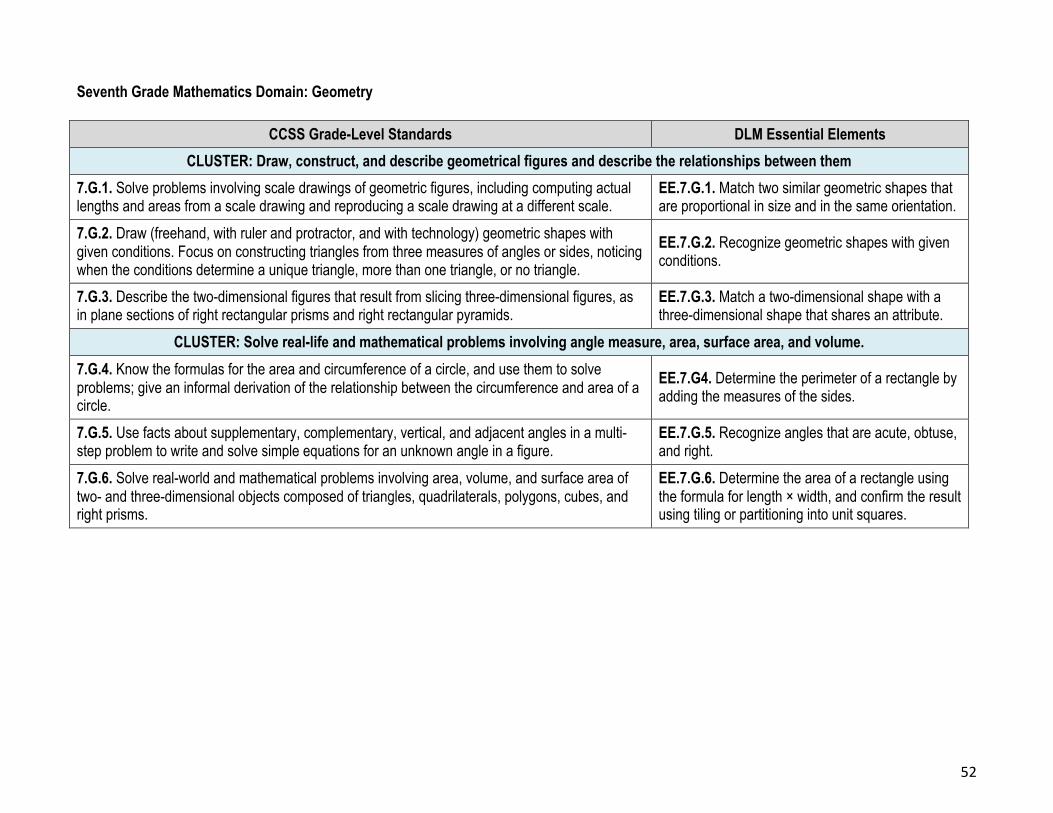
Seventh Grade Mathematics Domain: Geometry
CCSS Grade-Level Standards DLM Essential Elements
CLUSTER: Draw, construct, and describe geometrical figures and describe the relationships between them 7.G.1. Solve problems involving scale drawings of geometric figures, including computing actual lengths and areas from a scale drawing and reproducing a scale drawing at a different scale.
EE.7.G.1. Match two similar geometric shapes that are proportional in size and in the same orientation.
7.G.2. Draw (freehand, with ruler and protractor, and with technology) geometric shapes with given conditions. Focus on constructing triangles from three measures of angles or sides, noticing when the conditions determine a unique triangle, more than one triangle, or no triangle.
EE.7.G.2. Recognize geometric shapes with given conditions.
7.G.3. Describe the two-dimensional figures that result from slicing three-dimensional figures, as in plane sections of right rectangular prisms and right rectangular pyramids.
EE.7.G.3. Match a two-dimensional shape with a three-dimensional shape that shares an attribute.
CLUSTER: Solve real-life and mathematical problems involving angle measure, area, surface area, and volume. 7.G.4. Know the formulas for the area and circumference of a circle, and use them to solve problems; give an informal derivation of the relationship between the circumference and area of a circle.
EE.7.G4. Determine the perimeter of a rectangle by adding the measures of the sides.
7.G.5. Use facts about supplementary, complementary, vertical, and adjacent angles in a multi-step problem to write and solve simple equations for an unknown angle in a figure.
EE.7.G.5. Recognize angles that are acute, obtuse, and right.
7.G.6. Solve real-world and mathematical problems involving area, volume, and surface area of two- and three-dimensional objects composed of triangles, quadrilaterals, polygons, cubes, and right prisms.
EE.7.G.6. Determine the area of a rectangle using the formula for length × width, and confirm the result using tiling or partitioning into unit squares.
53
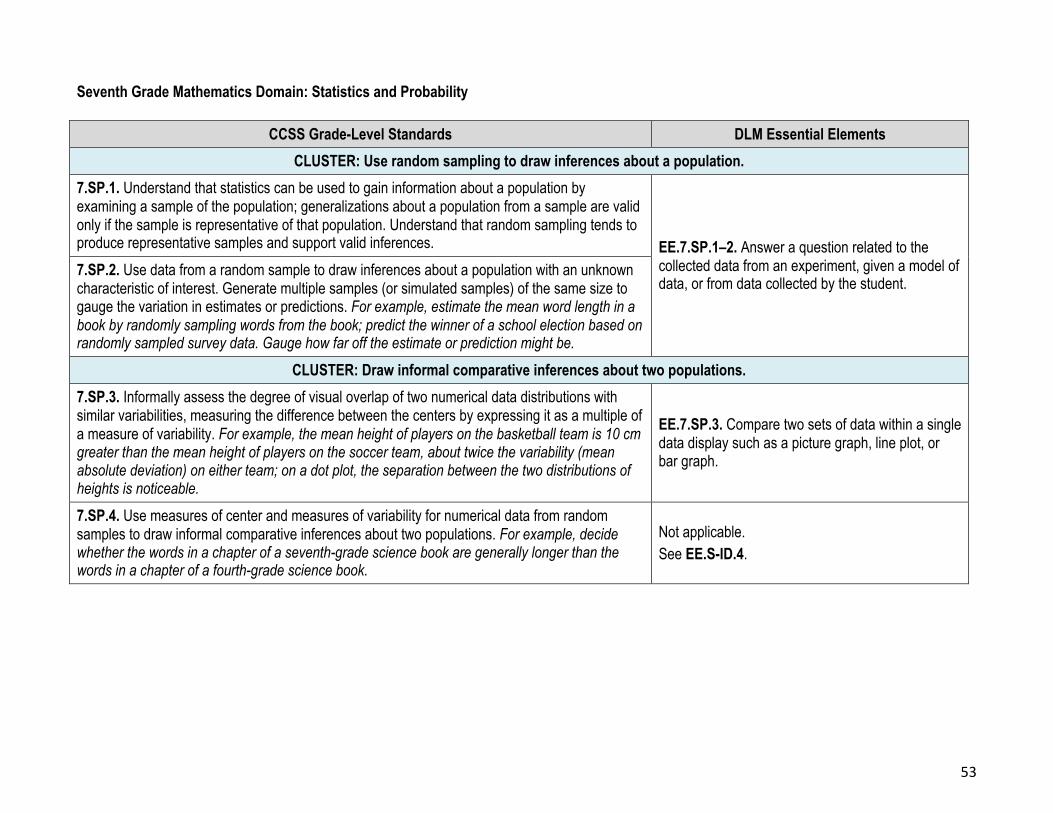
Seventh Grade Mathematics Domain: Statistics and Probability
CCSS Grade-Level Standards DLM Essential Elements
CLUSTER: Use random sampling to draw inferences about a population. 7.SP.1. Understand that statistics can be used to gain information about a population by examining a sample of the population; generalizations about a population from a sample are valid only if the sample is representative of that population. Understand that random sampling tends to produce representative samples and support valid inferences. EE.7.SP.1–2. Answer a question related to the
collected data from an experiment, given a model of data, or from data collected by the student.
7.SP.2. Use data from a random sample to draw inferences about a population with an unknown characteristic of interest. Generate multiple samples (or simulated samples) of the same size to gauge the variation in estimates or predictions. For example, estimate the mean word length in a book by randomly sampling words from the book; predict the winner of a school election based on randomly sampled survey data. Gauge how far off the estimate or prediction might be.
CLUSTER: Draw informal comparative inferences about two populations. 7.SP.3. Informally assess the degree of visual overlap of two numerical data distributions with similar variabilities, measuring the difference between the centers by expressing it as a multiple of a measure of variability. For example, the mean height of players on the basketball team is 10 cm greater than the mean height of players on the soccer team, about twice the variability (mean absolute deviation) on either team; on a dot plot, the separation between the two distributions of heights is noticeable.
EE.7.SP.3. Compare two sets of data within a single data display such as a picture graph, line plot, or bar graph.
7.SP.4. Use measures of center and measures of variability for numerical data from random samples to draw informal comparative inferences about two populations. For example, decide whether the words in a chapter of a seventh-grade science book are generally longer than the words in a chapter of a fourth-grade science book.
Not applicable. See EE.S-ID.4.

54
CCSS Grade-Level Standards DLM Essential Elements
CLUSTER: Investigate chance processes, and develop, use, and evaluate probability models. 7.SP.5. Understand that the probability of a chance event is a number between 0 and 1 that expresses the likelihood of the event occurring. Larger numbers indicate greater likelihood. A probability near 0 indicates an unlikely event, a probability around 1/2 indicates an event that is neither unlikely nor likely, and a probability near 1 indicates a likely event.
EE.7.SP.5–7. Describe the probability of events occurring as possible or impossible.
7.SP.6. Approximate the probability of a chance event by collecting data on the chance process that produces it and observing its long-run relative frequency, and predict the approximate relative frequency given the probability. For example, when rolling a number cube 600 times, predict that a 3 or 6 would be rolled roughly 200 times, but probably not exactly 200 times.
7.SP.7. Develop a probability model and use it to find probabilities of events. Compare probabilities from a model to observed frequencies; if the agreement is not good, explain possible sources of the discrepancy.
7.SP.7.a. Develop a uniform probability model by assigning equal probability to all outcomes, and use the model to determine probabilities of events. For example, if a student is selected at random from a class, find the probability that Jane will be selected and the probability that a girl will be selected. 7.SP.7.b. Develop a probability model (which may not be uniform) by observing frequencies in data generated from a chance process. For example, find the approximate probability that a spinning penny will land heads up or that a tossed paper cup will land open-end down. Do the outcomes for the spinning penny appear to be equally likely based on the observed frequencies?
55
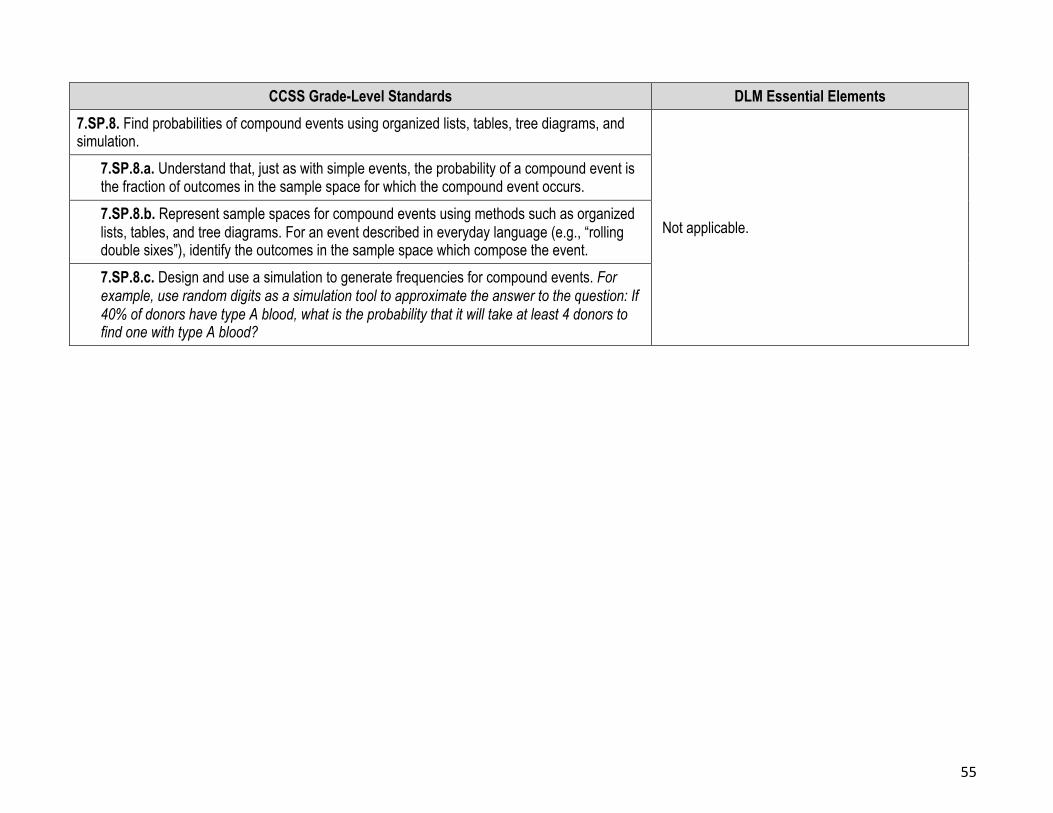
CCSS Grade-Level Standards DLM Essential Elements
7.SP.8. Find probabilities of compound events using organized lists, tables, tree diagrams, and simulation.
Not applicable.
7.SP.8.a. Understand that, just as with simple events, the probability of a compound event is the fraction of outcomes in the sample space for which the compound event occurs.
7.SP.8.b. Represent sample spaces for compound events using methods such as organized lists, tables, and tree diagrams. For an event described in everyday language (e.g., “rolling double sixes”), identify the outcomes in the sample space which compose the event.
7.SP.8.c. Design and use a simulation to generate frequencies for compound events. For example, use random digits as a simulation tool to approximate the answer to the question: If 40% of donors have type A blood, what is the probability that it will take at least 4 donors to find one with type A blood?


![Essential Elements Selection Record - · Web viewDynamic Learning Maps | Essential Elements Selection Record - MathPage 13 of 13 [Type text][Type text][Type text] Essential Elements](https://img.dokumen.tips/doc/110x75/5abb44357f8b9a567c8c6dad/essential-elements-selection-record-viewdynamic-learning-maps-essential-elements.jpg)