Embed Size (px)
Citation preview

Dynamic Emission Baffle Inspired by Horseshoe Bat Noseleaves
Yanqing Fu
Dissertation submitted to the Faculty of theVirginia Polytechnic Institute and State University
in partial fulfillment of the requirements for the degree of
Doctor of Philosophyin
Engineering Mechanics
Rolf Muller, ChairAlexander Leonessa
Hongxiao ZhuNicole AbaidSunny Jung
January 29, 2016Blacksburg, Virginia
Keywords: Noseleaf, Biosonar, Emission BaffleCopyright 2016, Yanqing Fu

Dynamic Emission Baffle Inspired by Horseshoe Bat Noseleaves
Yanqing Fu
(ABSTRACT)
The evolution of bats is characterized by a combination of two key innovations - powered flightand biosonar - that are unique among mammals. Bats still outperform engineered systems in bothcapabilities by a large margin. Bat biosonar stands out for its ability to encode and extract sensoryinformation using various mechanisms such as adaptive beamwidth control, dynamic sound emis-sion and reception, as well as cognitive processes. Due to the highly integrated and sophisticateddesign of their active sonar system, bats can survive in complex and dense environments using justa few simple smart acoustic elements. On the sound emission side, significant features that distin-guish bats from the current man-made sonar system are the time-variant shapes of the noseleaves.Noseleaves are baffles that surround the nostrils in bats with nasal pulse emission such as horse-shoe bats and can undergo non-rigid deformations large enough to affect their acoustic propertiessignificantly. Behavioral studies have shown that these movements are not random byproducts, butare due to specific muscular action. To understand the underlying physical and engineering prin-ciples of the dynamic sensing in horseshoe bats, two experimental prototypes ,i.e. intact noseleafand simplified noseleaf, have been used. We have integrated techniques of data acquisition, in-strument control, additive manufacturing, signal processing, airborne acoustics, 3D modeling andimage processing to facilitate this research. 3D models of horseshoe bat noseleaves were obtainedby tomographic imaging, reconstructed, and modified in the digital domain to meet the needs ofadditive manufacturing prototype. Nostrils and anterior leaf were abstracted as an elliptical outletand a concave baffle in the other prototype. As a reference, a circular outlet and a straight baffledesigned. A data acquisition and instrument control systemhas been developed and integrated withtransducers to characterize the dynamic emission system acoustically as well as actuators for recre-ating the dynamics of the horseshoe bat noseleaf. A conical horn and tube waveguide was designedto couple the loudspeaker to the outlet of bat noseleaf and simplified baffles. A pan-tilt was usedto characterize the acoustic properties of the deforming prototypes over direction. By using thosetechniques, the dynamic effect of the noseleaf was reproduced and characterized. It was suggestedthat the lancet rotation induced both beam-gain and beamwidth changes. Narrow outlet producedan isotropic beampattern and concave baffle had a significanttime-variant and frequency-varianteffect with just a small displacement. All those results cast light on the possible functions of thebiological morphology and provided new thoughts on the engineering device’s design.

Dedication
To my parents, for always encouraging me to study no matter inwhat conditions, my sister, for herendless love and support.
To my grandma, uncle and aunt, for raising me up.
To my undergraduate teacher and friend, Xuehui Li, for her unconditional love, support and en-couragement.
iii

Acknowledgments
I would like to express my sincere thanks to my advisor, Rolf Muller. It was very fortunate forme to have such a supervisor, who always ready to help whenever I encounter difficulties andencourage me to do the best.
Thanks very much the rest of my committee members, AlexanderLeonessa, Hongxiao Zhu, NicoleAbaid, Sunny Jung for their time and efforts to review the proposal and dissertation. Also, theirvaluable feedbacks.
I would like to thank my labmates, Anupam K Gupta, Chen Ming, Joseph Sutlive, Mingyi Liu,Philip Caspers, Syed Uzair Gilani, Yuan Lin for their discussions and support of my research.
Thanks very much the Ware Lab of Virginia Tech for machining the waveguide, Dreams Lab forprinting out the elastic noseleaf prototype, Shandong University - Virginia Tech International Labfor sharing the behavior study data.
Lastly, I would like to thank theGreater Horseshoe Batfor inspiring this research.
iv

Contents
1 Introduction 1
1.1 Bat Biosonar & Engineered Sonar . . . . . . . . . . . . . . . . . . . . . . .. . . 1
1.2 Horseshoe Bat Biosonar . . . . . . . . . . . . . . . . . . . . . . . . . . . . . .. 2
1.3 Dynamic Biosonar System Features . . . . . . . . . . . . . . . . . . . .. . . . . 4
1.4 Evidence for Dynamic Effects . . . . . . . . . . . . . . . . . . . . . . .. . . . . 7
1.5 Objectives and Approach . . . . . . . . . . . . . . . . . . . . . . . . . . .. . . . 7
1.6 Chapter Outline . . . . . . . . . . . . . . . . . . . . . . . . . . . . . . . . . . .. 8
2 Methods 9
2.1 Reproduction of Noseleaf . . . . . . . . . . . . . . . . . . . . . . . . . . .. . . . 9
2.2 Waveguides . . . . . . . . . . . . . . . . . . . . . . . . . . . . . . . . . . . . . .10
2.3 Baffle Curvature . . . . . . . . . . . . . . . . . . . . . . . . . . . . . . . . . . . .13
2.4 Prototype Manufacturing . . . . . . . . . . . . . . . . . . . . . . . . . .. . . . . 15
2.5 Actuation Mechanisms . . . . . . . . . . . . . . . . . . . . . . . . . . . . .. . . 16
2.6 Acoustic Measurements . . . . . . . . . . . . . . . . . . . . . . . . . . . .. . . . 16
2.7 Signal Processing . . . . . . . . . . . . . . . . . . . . . . . . . . . . . . . .. . . 20
3 Results 23
3.1 Waveguide Geometry . . . . . . . . . . . . . . . . . . . . . . . . . . . . . . .. . 23
3.2 Lancet Bending . . . . . . . . . . . . . . . . . . . . . . . . . . . . . . . . . . . .28
3.3 Outlet Geometry . . . . . . . . . . . . . . . . . . . . . . . . . . . . . . . . . .. 29
3.4 Baffle Geometry . . . . . . . . . . . . . . . . . . . . . . . . . . . . . . . . . . . .31
v

3.5 Static Characterization of Straight Baffle . . . . . . . . . . . . .. . . . . . . . . . 32
3.6 Static Characterization of Concave Baffle . . . . . . . . . . . . . . .. . . . . . . 35
3.7 Dynamic Characterization of Concave Baffle . . . . . . . . . . . . . .. . . . . . 38
4 Discussions 41
4.1 Interpretation of Results . . . . . . . . . . . . . . . . . . . . . . . . . .. . . . . 41
4.2 Relevance to Bat Biosonar . . . . . . . . . . . . . . . . . . . . . . . . . . . . .. 45
4.3 Relevance to Engineering . . . . . . . . . . . . . . . . . . . . . . . . . . .. . . . 46
5 Summary 48
5.1 Major Findings . . . . . . . . . . . . . . . . . . . . . . . . . . . . . . . . . . .. 48
5.2 Suggestions for Future Work . . . . . . . . . . . . . . . . . . . . . . . .. . . . . 49
Bibliography 50
vi

List of Figures
1.1 Noseleaf morphology of the greater horseshoe bat (Rhinolophus ferrumequinum) :a) photograph of a noseleaf (frontal view), b) rendering of adigital noseleaf model.The different noseleaf parts are: 1) lancet, 2) sella, 3) anterior leaf. . . . . . . . . . 4
1.2 Deformation pattern and numerical study of the lancet ofthe greater horseshoe bat(Rhinolophus ferrumequinum): a) high-speed video recording sequences of lancetmovement, b) time window of the emission pulse period and lancet motion, c)simulation results of the lancet bending effect on the beampattern. Reproducedfrom [86]. . . . . . . . . . . . . . . . . . . . . . . . . . . . . . . . . . . . . . . . 6
1.3 Deformation pattern of the anterior leaf of the greater horseshoe bat (Rhinolophusferrumequinum): a) anterior leaf motion detected by laser, b) anterior leaf twitchmotion pattern, c) simultaneous sound pressure, anterior leaf movement velocityand displacement measurements. Reproduced from [87]. . . . . .. . . . . . . . . 6
1.4 Typical workflow of the biosonar research. . . . . . . . . . . . .. . . . . . . . . . 8
2.1 Digital model and physical replica of noseleaf of the greater horseshoe bat (Rhi-nolophus ferrumequinum): a) original digital model, width 1 cm, height 2 cm, b)symmetric smooth model, c) physical elastic noseleaf of (b)generated by addi-tive manufacturing (scaled 2x). The dashed line in (a) indicates the cut plane formirroring the right half of the noseleaf to get the symmetricnoseleaf. All werepresented in the frontal view. . . . . . . . . . . . . . . . . . . . . . . . . .. . . . 10
2.2 Cross-section of the tested waveguides: the waveguide consists of a conical hornand a circular tube, the mouth diameter of horn was always fixed to the diameter ofthe loudspeaker membrane (5 cm), the arrows indicate the sound radiation directionof the loudspeaker. Different combinations of horn and tubewere tested in theexperiment: a) horn length 4 cm, tube length 16 cm, b) horn length 7 cm, tubelength 13 cm, c) horn length 11 cm, tube length 9 cm, d) horn length 15 cm, tubelength 5 cm, e) horn length 20 cm. Horn mouth diameter: 5 cm, throat diameter:7 mm, tube diameter: 7 mm. Horn length was measured in the axial direction. . . . 12
vii

2.3 Nostril and anterior leaf cross-section of the greater horseshoe bat (Rhinolophusferrumequinum): a) rendering of a digital noseleaf model, the dashed line indicatesthe position to get the cross-section of the anterior leaf, b) cross-section of thenostril, c) cross-section of the anterior leaf, the arrows indicate the sound radiationdirection of the nostril. . . . . . . . . . . . . . . . . . . . . . . . . . . . . .. . . 14
2.4 Tested sound outlets and simplified dynamic baffle prototypes: a) planar outletwith circular cross-section (frontal view), b) planar outlet with elliptical cross-section (frontal view), c) baffle with straight flanks mounted on an elliptical outlet(side view), d) baffle with concave flanks mounted on an elliptical outlet (sideview). The circular and elliptical outlets have cross-sectional areas of≈ 79mm2
and approximately 12 mm2 respectively. Both the straight and concave flanks havethe same width 15 mm. The dashed lines indicate the semiangleof the baffle open-ing (shown here is a semiangle of 60°). . . . . . . . . . . . . . . . . . . .. . . . . 15
2.5 Typical components of the acoustic measurements: soundgeneration and propa-gation, data acquisition, prototype orientation and actuation. . . . . . . . . . . . . 17
2.6 Experimental setup for characterization of the dynamicnoseleaf: 1) ultrasonicloudspeaker, 2) conical waveguide, 3) Styrofoam, 4) noseleaf (Figure 2.1c), 5)linear actuator, 6) frame, 7) pan-tilt unit. . . . . . . . . . . . . .. . . . . . . . . . 18
2.7 Experimental setup for characterization of the dynamicbaffles: 1) dynamic baffle(shown here is a straight baffle, Figure 2.4c), 2) conical waveguide, and 3) ultra-sonic loudspeaker mounted on a 4) pan-tilt unit. . . . . . . . . . .. . . . . . . . . 19
2.8 Signal processing for radiation pattern: a) acquired time domain signal was trans-formed into b) frequency domain by using Fourier transform,for one selected fre-quency (black vertical straight line in (b)) from 30 kHz to 40kHz, the gain wasplotted over full scanning space (azimuth: -90° to 90°, elevation: -30° to 90°) toget the c) 2D beampattern or just over the horizontal space (azimuth: -90° to 90°,elevation 0°, red horizontal line in (c)) to get the d) 1D beampattern. . . . . . . . . 21
2.9 Signal processing for the dynamic concave baffle: for oneselected frequency from30 kHz, 40 kHz and 50 kHz, the envelope of time domain data (blue in (a), (b),(c)) was extracted by using Hilbert transform and plotted over position (example:a) 30°, b) 0°, c) -60°) to get the d) time variant signature. Inset in (b) shows thedetailed envelope pattern. . . . . . . . . . . . . . . . . . . . . . . . . . . .. . . . 22
viii

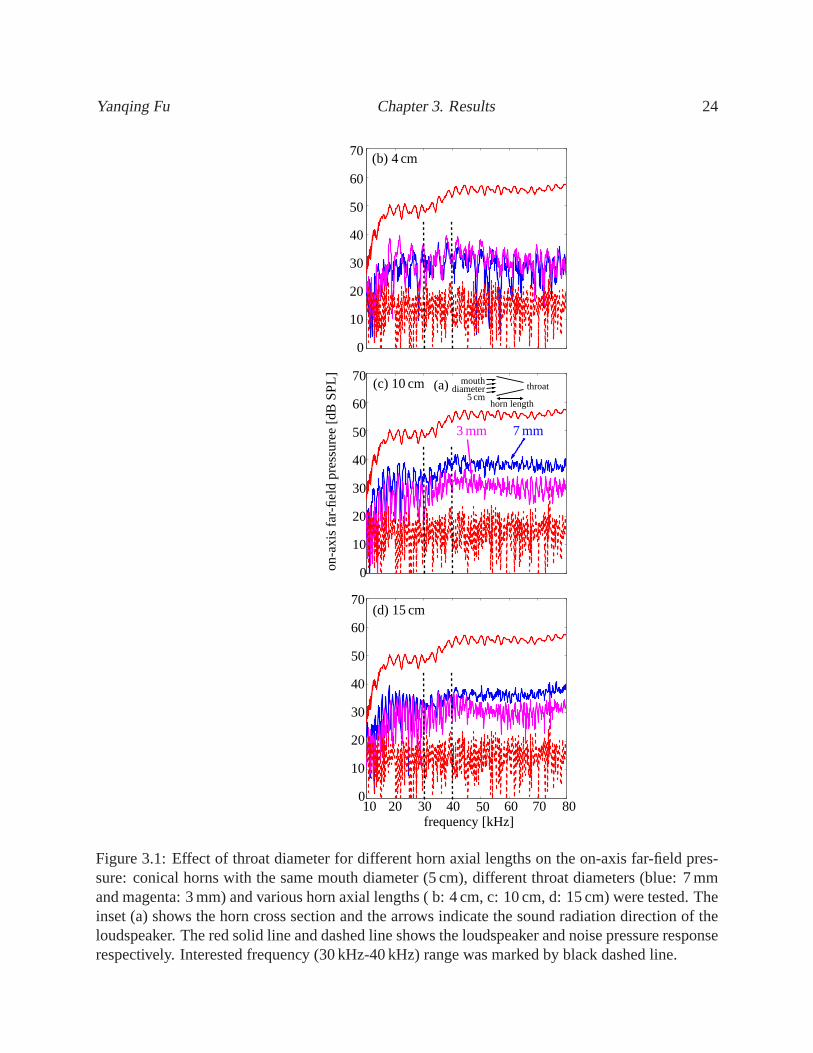
3.1 Effect of throat diameter for different horn axial lengths on the on-axis far-fieldpressure: conical horns with the same mouth diameter (5 cm),different throat di-ameters (blue: 7 mm and magenta: 3 mm) and various horn axial lengths ( b: 4 cm,c: 10 cm, d: 15 cm) were tested. The inset (a) shows the horn cross section and thearrows indicate the sound radiation direction of the loudspeaker. The red solid lineand dashed line shows the loudspeaker and noise pressure response respectively.Interested frequency (30 kHz-40 kHz) range was marked by black dashed line. . . . 24
3.2 Effect of waveguide horn axial length on the on-axis far-field pressure: conicalhorn and circular tube waveguides with the same mouth diameter (5 cm), throatdiameter (7 mm), tube length (8 cm) and different horn axial lengths (magenta:4 cm, green: 10 cm, blue: 15 cm) were tested. The inset shows the conical hornand circular tube waveguide cross section and the arrows indicate the sound ra-diation direction of the loudspeaker. Red solid line and dashed line shows theloudspeaker and noise pressure response respectively. Interested frequency range(30 kHz-40 kHz) was marked by black dashed line. . . . . . . . . . . .. . . . . . 25
3.3 Effect of waveguide tube length on the on-axis far-field pressure: conical hornand circular tube waveguides with fixed mouth diameter (5 cm), throat diameter(7 mm), horn axial length (10 cm) and different tube lengths (magenta: 4 cm, green:8 cm, blue: 12 cm) were tested. The inset shows the conical horn and circular tubewaveguide cross section and the arrows indicate the sound radiation direction ofthe loudspeaker. Red solid line and dashed line shows the loudspeaker and noisepressure response respectively. Interested frequency range (30 kHz-40 kHz) wasmarked by black dashed line. . . . . . . . . . . . . . . . . . . . . . . . . . . .. . 26
3.4 Effect of horn axial length and tube length ratio on the on-axis far-field pressure:two different conical horn and circular tube waveguides with the same mouth di-ameter (5 cm) and throat diameter (7 mm) were tested (blue: horn axial length4 cm, tube length 16 cm, ratio 0.2; magenta: horn axial length15 cm, tube length5 cm, ratio 0.8. Here just shows two examples of Figure 2.2). The top inset showsthe conical horn and circular tube waveguide cross section and the arrows indi-cate the sound radiation direction of the loudspeaker. Red solid line and dashedline shows the loudspeaker and noise pressure response respectively. Interestedfrequency range (30 kHz-40 kHz) was marked by black dashed line. . . . . . . . . 27
3.5 Beampatterns at various bending stages of the noseleaf replica: for each exper-imental repetition (a and b), the lancet was bent from 0° to 5°in steps of 1°,frequencies range from 30 kHz (corresponds to 60 kHz in bats)to 38 kHz (cor-responds to 76 kHz in bats) in steps of 4 kHz. Experiment setupwas showed inFigure 2.6 and signal processing method was showed in Figure2.8. . . . . . . . . . 28
ix

3.6 Influence of circular outlet diameter on the beampatterns: a) 30 kHz, b) 32 kHz,c) 34 kHz, d) 36 kHz e) 38 kHz, f) 40 kHz. Circular outlets with different diame-ters (green: 2 mm, magenta: 6 mm, blue: 10 mm) were tested. Signal processingmethod was showed in Figure 2.8. . . . . . . . . . . . . . . . . . . . . . . . .. . 30
3.7 Influence of elliptical outlet on the beampatterns: a) 30kHz, b) 32 kHz, c) 34 kHz,d) 36 kHz e) 38 kHz, f) 40 kHz. Elliptical outlets with the samemajor axis (red:15 mm) and different minor axises (black: 3 mm, cyan: 1 mm) were tested. Signalprocessing method was showed in Figure 2.8. . . . . . . . . . . . . . .. . . . . . 30
3.8 Beampattern effects due to the length of the straight baffle: different baffle lengths(b, 1 cm; c, 2 cm) and different baffle semiangles (blue: 60°, red: 30°) were testedat various frequencies: 30 kHz, 34 kHz, 38 kHz. The dashed lines indicate thesemiangle of the baffle opening (inset a, shown here is a semiangle of 60°). Ex-periment setup was showed in Figure 2.7, beampattern was measured along theminor axis (1 mm) of the elliptical outlet. Signal processing method was showedin Figure 2.8. . . . . . . . . . . . . . . . . . . . . . . . . . . . . . . . . . . . . . 32
3.9 Beampattern effects due to static bending of the straightbaffle: a) reference open-ing angle was 90°and bending angle varied, b) root-mean-square gain differencebetween beampatterns produced by a 90°-reference and a tested opening angle, allrms differences were computed with averaging over 21 frequencies ranging from30 kHz to 40 kHz in steps of 0.5 kHz as well as over angle, black straight lineshows the linear regression between the bending angle and the median (blue dot)of the rms difference, slope 0.05dB/°, coefficient of determinationr2 = 0.97, c) ex-ample beampatterns shown are for a frequency of 34 kHz of different baffle open-ing angles: 90°(black), 80°(blue), 70°(green), 60°(cyan), 50°(magenta), 40°(red),30°(purple). In the box-and-whisker plots, the whiskers denote the location of theminimum and maximum, the edges of the box the first and third quartiles, and thehorizontal line the median. Experiment setup was showed in Figure 2.7, beam-pattern was measured along the minor axis (1 mm) of the elliptical outlet. Signalprocessing method was showed in Figure 2.8. . . . . . . . . . . . . . .. . . . . . 34
3.10 Beampattern effects due to static bending of the concavebaffle: a) root-mean-square gain difference between beampatterns produced by a 90°-reference and atested opening angle (Figure 3.9a), all rms differences were computed with averag-ing over 21 frequencies ranging from 30 kHz to 40 kHz in steps of 0.5 kHz as wellas over angle, b) example beampatterns shown are for a frequency of 34 kHz of dif-ferent baffle opening angles: 90° (black), 80° (blue), 70° (green), 60° (cyan), 50°(magenta), 40° (red), 30° (purple). In the box-and-whiskerplots, the whiskers de-note the location of the minimum and maximum, the edges of thebox the first andthird quartiles, and the horizontal line the median. Experiment setup was showedin Figure 2.7, beampattern was measured along the minor axis(1 mm) of the ellip-tical outlet. Signal processing method was showed in Figure2.8. . . . . . . . . . . 37
x

3.11 Beampattern effects due to static bending of the concavebaffle over small angles(0° to 10°). Root-mean-square gain difference between beampatterns produced bya 90°-reference and a tested opening angle (Figure 3.9a). The reference openingangle was 90° for all conditions (Figure 3.9a). Black straight line shows the linearregression between the bending angle (from 3°to 10°) and themedian (blue dot)of the rms difference, slope 0.2dB/°, coefficient of determinationr2 = 0.92. Theexample beampattern plots show beampatterns for inwards bending angles relativeto the reference of (a) 3°, (b) 5°, and (c) 7°. All other experimental and displayparameters were the same as Figure 3.10. Experiment setup was showed in Fig-ure 2.7, beampattern was measured along the minor axis (1 mm)of the ellipticaloutlet. Signal processing method was showed in Figure 2.8. .. . . . . . . . . . . . 38
3.12 Example of a continuous time-variant signature created by motion of a concavebaffle: a) measurement direction relative to the baffle, b,c,d) magnitudes (envelopeof the analytic signal) of signal received from the dynamic baffle for frequenciesof b) 50 kHz, c) 40 kHz, and d) 30 kHz. The static reference (opening angle 60°)are shown in e) 50 kHz, f) 40 kHz, and g) 30 kHz. The baffle motionexecuted inthis example ranged from -60° to 30° in 250 ms. Signal was measured along theminor axis (1 mm) of the elliptical outlet. Signal processing method was showedin Figure 2.9. . . . . . . . . . . . . . . . . . . . . . . . . . . . . . . . . . . . . . 40
4.1 Governing equation and examples of the far-field radiation pattern of the ellipticaloutlet: a) governing equation of the elliptical outlet far-field radiation pattern,a isthe semi-minor axis andb is the semi-major axis of the elliptical outlet,J1 is thefirst kind Bessel equation.θ is the cone angle andφ is the azimuthal angle withinthe elliptical outlet plane, b) elliptical outlet far-fieldradiation pattern of 34 kHz,minor axis length 1 mm (red), major axis length 15 mm (blue). .. . . . . . . . . . 43
4.2 Normalized acoustic resistance of conical horn with different horn angles: 30°(red), 40°(green), 50° (blue), 60° (cyan), 70° (black), 80°(magenta), 90° (pur-ple). Inset shows the cross-section of the conical horn, throat diameter 1 mm, hornlength 2 cm. . . . . . . . . . . . . . . . . . . . . . . . . . . . . . . . . . . . . . . 44
4.3 Bending effect of the conical horn angle on the root-mean-square (rms) gain dif-ference between reference angle (90°) beampattern and tested angle (30°-80° insteps of 10°) beampattern: black straight line shows the linear regression betweenthe bending angle and the median (blue dot) of the rms difference, slope 0.2dB/°,coefficient of determinationr2 = 1. RMS beam-gain differences of 21 frequenciesranging from 30 kHz to 40 kHz in steps of 0.5 kHz are in each box-and-whisker plot. 45
xi

4.4 A horn approximation of the anterior leaf compared to other horns: a) cross-sections of the anterior leaf (thick line, circles) compared to Bessel (stars), con-ical (squares), and exponential (triangles) horns, b) numerical predictions of theacoustic resistances (normalized by a plane wave over the throat area of the horns)for the horn cross-sections shown in (a). The inset in (a) shows the cutting planethrough the anterior leaf that was used to obtain the anterior leaf cross-section. . . . 47
xii

List of Tables
3.1 Influence of the circular outlet diameter on the on-axis far-field pressure (dB SPL)for different frequencies . . . . . . . . . . . . . . . . . . . . . . . . . . . .. . . . 29
3.2 Influence of the baffle dimension on the -6 dB beamwidth (°)for different frequen-cies (beampattern was measured along the minor axis of the elliptical outlet) . . . . 31
3.3 Influence of the baffle dimension on the on-axis far-field pressure (dB SPL) for dif-ferent frequencies (beampattern was measured along the minor axis of the ellipticaloutlet) . . . . . . . . . . . . . . . . . . . . . . . . . . . . . . . . . . . . . . . . . 31
3.4 Influence of the bending angle on the median root mean square difference for 2 cmstraight baffle . . . . . . . . . . . . . . . . . . . . . . . . . . . . . . . . . . . . . 33
3.5 Influence of the bending angle on the on-axis far-field pressure response of 34 kHzfor 2 cm straight baffle . . . . . . . . . . . . . . . . . . . . . . . . . . . . . . . .33
3.6 Influence of the bending angle on the -6 dB beamwidth of 34 kHz for 2 cm straightbaffle . . . . . . . . . . . . . . . . . . . . . . . . . . . . . . . . . . . . . . . . . 33
3.7 Influence of the bending angle on the median root mean square difference for 2 cmconcave baffle . . . . . . . . . . . . . . . . . . . . . . . . . . . . . . . . . . . . 35
3.8 Influence of the small bending angle on the median root mean square differencefor 2 cm concave baffle . . . . . . . . . . . . . . . . . . . . . . . . . . . . . . . . 36
xiii

Chapter 1
Introduction
This chapter introduces the principles and advantages of the bat biosonar compared with the man-made sonar, provides detailed discussions of the emission and reception dynamics of the biosonarsystem and delivers the goals and approach of the current research.
1.1 Bat Biosonar & Engineered Sonar
The evolution of bats is characterized by a combination of two key innovations, powered flight andecholocation, which are unique among mammals [1, 2, 3].
Due to their flight ability, bats are distributed almost all over the world except for polar regionsand small remote islands. Their food varies from small insects to large vertebrates [4] and theirhabitats range from narrow dense forests to large open deserts [5, 6]. Lots of attention have beendirected toward to how they perceive the information of those different types of environments aswell as how they acquire food in challenging circumstances,which casts light on solutions forsimilar engineering problems. For example, researchers reported that the nectar-feeding bats havedeveloped highly mobile tongues to reach deep within the columnar flowers to obtain nectar [7]. Itwas found that the nectar-feeding bats can change the size and shape of their tongues dynamically,which could serve as a model for miniature liquid harvest robot.
Other than food acquisition problems, a volume of studies have been done regarding echolocationof bats [8]. Not all bats have the ability of echolocation. Some of the bats rely on vision or passivesensory methods [9], i.e. they get the information by makinguse of the sound emits from thesurroundings. Even though for the active sensing bats, not all of them echolocate the same way.The active sonar system consists of emitters (mouth or nostrils) and receivers (two ears). Many ofthe echolocating bats produce the ultrasound in the larynx,emit the sound from the mouth or noseand use the external ears to receive the echoes. Informationis obtained by analyzing the echoes toget the target properties, such as distance, angle and texture [10, 11, 12, 13]. The size of mouth or
1

Yanqing Fu Chapter 1. Introduction 2
the nostrils and the ears do not differ much from the wavelengths they used. The ears of bats, forexample, do not exceed a few centimeters in length [14] whilethe smallest received wavelengthsare still a few millimeters [15, 16]. Hence, the minimum ratio between ear size and wavelengthdoes not fall below 10−1. In contrast to this, technical sonar arrays are typically 100 or even 1000times larger than the wavelength they operate on [17, 18, 19].
Even though the echolocating bats have those simple biosonar elements and small size-to-wavelengthratio, the performance of their sonar systems outperform the current state-of-art engineering sonarsystems in a variety of ways [20].
First of all, depending on the sensory needs, echolocating bats can actively control the parametersof the emitting sound, such as intensity, duration, bandwidth and repetition rate [21, 22]. Itwas pointed out that during the final stage of the bat hunting activity, the sound repetition rateincreased [23] and can reach to 220 Hz [24]. The superfast laryngeal muscle enables them to do so[25]. Accompanied with a high repetition rate, the pulse duration was decreased [26]. Those robustcall design and waveform diversity in bats could be used in the current radar and sonar systems toassist tasks such as autonomous navigation and target classification [27].
Second, echolocating bats have a mature spatial orientation ability regardless of the relativelywide sonar beam they used. Operation in a regime where devicesize exceeds wavelength bytwo or more orders of magnitude allows engineered sonar and radar systems to gather sensoryinformation on the environment through scans with narrow beam arrays [28, 29]. In their verydifferent size-to-wavelength regime, bats are very poorlysuited for this paradigm. Indeed, batsused comparatively wide beamwidth with reported values ranging from 28° to 80° (full width at-6 dB) [30, 31, 32, 33, 34, 35]. For example, in the greater horseshoe bat, the -6 dB beamwidth is48° elevation and 46° azimuth [32]. Yet, despite their wide beams, bats are able to navigate andpursue their prey in structure-rich natural environments [36, 37, 38, 39]. Take greater horseshoebat for example, it was found that the bats could detect echoes from the fluttering insects even in acluttered environment [40].
At last, the effectiveness and efficiency of the man-made sonar highly depend on the current tech-nology [41, 42] while biosonar has more flexibility. For example, in the man-made sonar, theproperties of the transducers influence the waveforms they generate [42].
In the process of time, bats have developed a sophisticated active sonar system to survive, whichneed to be better understood and then utilized to improve thecurrent engineering sonar systems ordesign them from the ground up.
1.2 Horseshoe Bat Biosonar
According to their time-frequency structure, the emissionpulses can be divided into two compo-nents: constant frequency (CF) and frequency modulation (FM). Horseshoe bats are FM-CF-FM[43, 44] and high duty cycle echolocators [16]. In those bats, sound emission and reception hap-

Yanqing Fu Chapter 1. Introduction 3
pens at the same time, thus they need to separate the calls andechoes in frequency. The sound theyemit from the nostrils (rather than from mouth) consists of three parts, a short frequency modulated(FM) upward sweep at the beginning, a long constant frequency(CF) part and a brief FM down-ward sweep at the end. In the greater horseshoe bat, the frequency range of the sound they emitis 60 kHz-80 kHz (2nd harmonic). The morphology and acousticfunctions of the ear and noseleafare associated with those echolocation features.
On the reception side, the general shape of ear could be approximated as a truncated conicalhorn [45, 46, 47], the dimension of the ear is correlated withthe emission frequency [14] and thelocal features, such as flaps in the pinna wall, tragus and antitragus in the pinna rim, folds betweenthe pinnae [48, 49, 50], play an important role in beamforming. Obviously, the pinna itself deter-mines interaural level differences (ILD) and the ear’s sensitivity to echoes [51, 52, 53, 54, 55, 56].Object discrimination experiment [57], prey capture performance experiment [58] and numericalsimulation [59] all showed that the tragus aids the verticallocalization of the bat. Removing theflap in the pinna wall induces a decrease of the directional information, which indicates that thepresent of the flap improves the spatial information [60]. Even the small ridges in the pinna walland the skin folds between the pinnae have a narrowing effecton the beampattern [61, 62].
While one can find ears in all bats, noseleaves are found acrossseveral large and diverse bat fami-lies such as Old World leaf-nosed bats (Hipposideridae), New World leaf-nosed bats (Phyllostomi-dae) and horseshoe bats (Rhinolophidae) [63, 64, 65]. In the greater horseshoe bat (Rhinolophusferrumequinum), the complex noseleaf consists of three distinguished parts [66, 67] (Figure 1.1):
1) lancet, located right above the nostrils and has several furrows in it;
2) sella, a protrusion extending from the lancet plane;
3) anterior leaf, a horseshoe-shaped plate closely around the two nostrils.
Like the ear, the dimension of the noseleaf is correlated with the emission frequency [68], whichindicates that the noseleaf is related with acoustic function. A behavior study demonstrated thatif the upper part of the noseleaf was covered with petroleum jelly, the beampattern became notsmooth [32]. This case is hard to explain whether the noseleaf itself has impact on the beampatternas there are hairs in the noseleaf surface. But direct evidence showed that the noseleaf is a kind offunctional structure: bending the lancet back increased the vertical beamwdidth [69]. Moreover,numerical simulation showed that the furrows in the lancet acted as resonators, which resulted ina narrower sonar beam [70, 71, 72, 73]. The sella and the anterior leaf also has the function offocusing the sonar beam [71, 74].
All in all, the horseshoe bat has a sophisticated active sonar system with complex sound diffractionstructures.

Yanqing Fu Chapter 1. Introduction 4
(a) (b)
1
2
3
Figure 1.1: Noseleaf morphology of the greater horseshoe bat (Rhinolophus ferrumequinum) : a)photograph of a noseleaf (frontal view), b) rendering of a digital noseleaf model. The differentnoseleaf parts are: 1) lancet, 2) sella, 3) anterior leaf.
1.3 Dynamic Biosonar System Features
It was still unclear which factor contributed to the high performance of biosonar, but it was hy-pothesized that the high performance was at least due to the bats’ dynamic periphery of theirsophisticated sonar systems. The sonar systems in bats, i.e., the ears and noseleaves, are not staticfeatures and they can undergo non-rigid deformations.
The pinna movements were first discovered in the greater horseshoe bat (Rhinolophus ferrume-quinum) [75]. Some of the bats hold their ears fixed in the space relative to their head position,but others move them in various ways, such as the greater horseshoe bat mentioned before. Otherthan independent movement, the ears also move simultaneously. Those movements are controlledby ear muscles [75]. One group of the muscles enable the rigidrotation of the ear, the other groupis in charge of non-rigid deformation. The maximum displacement of the ear tip was more than

Yanqing Fu Chapter 1. Introduction 5
4 mm, which is comparable with the wavelength of the constantfrequency (80 kHz) componentof the emit sound. More interestingly, the ear alternating movements were closely related to thesound emission [76, 77, 78, 79, 80]. When bats are interested in things close by, one ear movesforward and the other ear moves backward rapidly while emitting the buzz pulse, which is highlyconsist. If the ear movements were disabled by cutting the nerves and muscles, the obstacle avoid-ance performance of the vertical target localization degraded while the ability of the horizontaltarget localization remained intact [81]. Further, numerical simulation showed that during the non-rigid deformation sequences, the sensitivity of the main lobe of the beampattern remained almostconstant. On the contrary, the sensitivity of the side lobe increased [82]. A smart reception dy-namic baffle was designed based on all those acoustic effectsof the ear structures [83]. Whenimplemented the local ear features (ridges, incision, antitragus) into an obliquely truncated coneseparately, there was no significant effect on the beampattern. If one combined all those localfeatures, stronger sidelobes appeared, which quantitatively agreed with the simulation results andindicated that the local ear features have a higher degree ofsystem integration [50]. In addition, itwas suggested that the biomimetic dynamic sound reception baffle had a significant time-varianteffect [84].
Later, similar non-rigid dynamics were also observed on theemission side. The structures asso-ciated with the noseleaf, such as lancet and anterior leaf can undergo non-random motions withspecific muscular control [85]. Those motions are not a byproduct of physiological activities, thebats can actively control the motion and switch it on an off [86, 87]. The lancet can bend forwardand recover backward during the sound emission period (Figure 1.2a,b). The maximum rotation ofthe lancet can reach to 12° and the average linear displacement was less than 1 mm. As the lancetwas bent, sidelobes were generated at low frequencies, while it didn’t has a big effect on the beam-pattern at high frequencies (Figure 1.2c) [86, 73]. Comparedwith the lancet, the anterior leaf ofthe noseleaf can twitch inward and forward, thus changing the curvature of the horseshoe-shapedplane (Figure 1.3) and finally diffracting the outgoing waves [87]. The average distal and proximaldisplacement of the anterior leaf was around 0.4 mm. Even though the displacement was small, itwas notable compared with the size of the noseleaf and the emission wavelengths (4 mm-6 mm).A biomimetic prototype was developed in order to reproduce the emission dynamics observed inbats [88, 89, 90].
Up to now, many details of emission dynamics still have to be characterized to better understandthe principle behind those dynamic features.

Yanqing Fu Chapter 1. Introduction 6
(a) (c)
(b)
Figure 1.2: Deformation pattern and numerical study of the lancet of the greater horseshoe bat(Rhinolophus ferrumequinum): a) high-speed video recording sequences of lancet movement, b)time window of the emission pulse period and lancet motion, c) simulation results of the lancetbending effect on the beampattern. Reproduced from [86].
(a) (b)
(c)
Figure 1.3: Deformation pattern of the anterior leaf of the greater horseshoe bat (Rhinolophusferrumequinum): a) anterior leaf motion detected by laser, b) anterior leaf twitch motion pattern,c) simultaneous sound pressure, anterior leaf movement velocity and displacement measurements.Reproduced from [87].

Yanqing Fu Chapter 1. Introduction 7
1.4 Evidence for Dynamic Effects
The dynamic system features could have an influence on the acoustic function: many evidencesshowed that bats can change their emission beamwidth under certain circumstances to controltheir field of view [91, 92, 93, 94, 95, 96]. Adaptive beamwidth control was observed both inthe Vespertilionid bats (Myotis daubentonii) and horseshoe bats (Rhinolophus ferrumequinum nip-pon) [91, 93]. When those two kind of bats approached the prey, thewidth of the emission beamincreased compared with the initial hunting phase. By doing so, the bat can increase the preycapture performance. In the case of prey escaping, the bat can still have the chance to recapturethe prey due to the larger field of view. In the Vespertilionidbats, by lowering the emit frequency,the beamwidth got wider [91]. Since the Vespertilioind batsemit the sound from the mouth, bychanging the size of mouth, the beamwidth also changed [95].But, for the horseshoe bats, theydidn’t change the frequency in their buzz phase [93], which suggested that the horseshoe batsimplement other methods to change the beamwidth. Since the beamwidth depends on the relation-ship between the wavelength and the aperture size [97] and the horseshoe bats emit the ultrasoundfrom the nose, it was hypothesized that changing the curvature of the noseleaf could induce thebeamwidth change, which needs experimental verification and validation.
1.5 Objectives and Approach
From behavioral study point of view, acoustic function of the noseleaf could be obtained by directlyinvestigating the live bat unless the experimental subjectcooperates sustainability. In order to makethe problem easy to handle, experimental approach was used.
The objectives of this research are (Figure 1.4):
1) design a dynamic emission baffle based on the horseshoe batnoseleaf;
2) design an experimental setup which can continuously control the baffle;
3) investigate acoustic effects of the dynamic emission baffle and
4) understand how biology sonar system works and give insights into the engineering sonar design.

Yanqing Fu Chapter 1. Introduction 8
Behavior
StudyBat
Tune Understanding
Systems
BioinspiredBiosonarDynamicsPrinciples
Design EngineeringApplications
Dynamic Sensors
Figure 1.4: Typical workflow of the biosonar research.
1.6 Chapter Outline
The remaining parts of the thesis are arranged as follows:
Chapter 2describes the designed emission prototypes, the data acquisition setup and the digitalsignal processing techniques.
Chapter 3presents the static and dynamic characterization of the emission baffle.
Chapter 4discusses the principles behind the experimental results.
Chapter 5summarizes the current research and suggests the future research directions.

Chapter 2
Methods
Two prototypes were proposed, i.e. intact noseleaf and simple noseleaf, based on the biologicalmorphology of the greater horseshoe bat (Rhinolophus ferrumequinum).
In order to allow the prototypes to mimic the correlated behavior between the sound emission andthe dynamic baffle motion, an automated experimental setup was designed.
Both the time domain and frequency domain signal processing methods were used to investigatethe dynamic effect of the prototypes.
2.1 Reproduction of Noseleaf
The biomimetic prototype designed here was in an attempt to preserve the original features of thenoseleaf. To meet this need, digital image processing and additive manufacturing methods wereadopted.
The studied intact noseleaf model came from the greater horseshoe bat (Rhinolophus ferrume-quinum), which was captured in caves near Jinan, Shandong, China [86].
In an effort to get the physical replica of the noseleaf, the following manufacturing procedure(Figure 2.1) was implemented:
1. the µCT (Skyscan 1072) was used to get the digital model fromthe fresh died bat, the width ofthe noseleaf is 1 cm and the height is 2 cm;
2. the noseleaf was cut through the mid-plane and the right half was mirrored to get the symmetricnoseleaf (software: Zbrush), thus the acoustic effect of the asymmetric structure was eliminated;
3. the surface of the symmetric noseleaf model was smoothed (software: Zbrush) in order to getrid of the roughness effect;
9

Yanqing Fu Chapter 2. Methods 10
4. the noseleaf was fabricated through additive manufacturing technique (Objet Connex 350, serialnumber 35019) by using elastic material (Objet TangoBlackPlus FullCure980).
As mentioned before, the width of the noseleaf is about 1 cm, which is hard to handle. In orderto allow more freedom to manipulate the noseleaf, the prototype size was scaled two times thanthe original size of the noseleaf. Correspondingly, the interested frequency range one should lookinto was 30 kHz to 40 kHz on the ground of size-frequency relationship [68]. On the contrary, thethickness was not scaled since it was believed that the thickness of the material plays no role in theacoustic function [98].
(a) (b) (c)
widthhe
ight
Figure 2.1: Digital model and physical replica of noseleaf of the greater horseshoe bat (Rhinolo-phus ferrumequinum): a) original digital model, width 1 cm, height 2 cm, b) symmetric smoothmodel, c) physical elastic noseleaf of (b) generated by additive manufacturing (scaled 2x). Thedashed line in (a) indicates the cut plane for mirroring the right half of the noseleaf to get thesymmetric noseleaf. All were presented in the frontal view.
2.2 Waveguides
Since the available ultrasonic loudspeaker (Ultra Sound Advice S56 with Ultra Sound AdviceS55 amplifier) had a larger dimension of sound source (diameter 5 cm) than the narrow nostrils, aconical horn and circular tube waveguide was brought up to make up this dimension difference.

Yanqing Fu Chapter 2. Methods 11
The conical horn was always attached to the loudspeaker. Thepart of conical horn next to the loud-speaker is called ”mouth” and the narrow outlet far away fromthe loudspeaker is called ”throat”.
Different kinds of waveguide were tested to investigate thegeometry effect on the gain and patternof the on-axis far-field frequency response:
1. conical horn of different axial lengths (4 cm, 10 cm, 15 cm), different throat diameters (3 mm,7 mm) and fixed mouth diameter 5 cm were used to investigate acoustic effect of the horn axiallength and throat diameter;
2. conical horn and circular tube waveguide with different horn axial lengths and tube lengths (totalhorn axial length and tube length is 20 cm, Figure 2.2), fixed horn mouth diameter 5 cm, throatdiameter 7 mm and tube diameter 7 mm were used to study acoustic effect of the ratio between thehorn axial length and tube length.
A calibrated microphone (Bruel and Kjær 4138-1/8′′ pressure-field microphone with Bruel andKjær NEXUS 2690-A-0S1 1-channel Microphone Conditioning Amplifier) was placed in the farfield (1 m away from the loudspeaker) to measure the frequencyresponse of the waveguides.
The desired conical horn and circular tube waveguide is the one which can maintain a sufficientsignal-to-noise ratio as well as produce a smooth (no big peaks and valleys) on-axis far-field fre-quency response.

Yanqing Fu Chapter 2. Methods 12
mouth diameter5 cm tube diameter
mouth diameter5 cm tube diameter
mouth diameter5 cm
mouth diameter5 cm tube diameter
mouth diameter5 cm throat diameter
15 cm
20 cm
5 cm
9 cm
7 cm
13 cm
16 cm
tube diameter
4 cm
11 cm
(a)
(b)
(c)
(d)
(e)
Figure 2.2: Cross-section of the tested waveguides: the waveguide consists of a conical horn anda circular tube, the mouth diameter of horn was always fixed tothe diameter of the loudspeakermembrane (5 cm), the arrows indicate the sound radiation direction of the loudspeaker. Differentcombinations of horn and tube were tested in the experiment:a) horn length 4 cm, tube length16 cm, b) horn length 7 cm, tube length 13 cm, c) horn length 11 cm, tube length 9 cm, d) hornlength 15 cm, tube length 5 cm, e) horn length 20 cm. Horn mouthdiameter: 5 cm, throat diameter:7 mm, tube diameter: 7 mm. Horn length was measured in the axial direction.

Yanqing Fu Chapter 2. Methods 13
2.3 Baffle Curvature
Different than the biomimetic prototype, the bioinspired baffle prototype developed here was tosimplify the complicate structure of the noseleaf while theimportant functional features of thenoseleaf were preserved.
The basic geometry of the bioinspired baffle prototype was motivated by the biological morphologyof the nostrils and anterior leaf. Attentive examination ofnoseleaf of the greater horseshoe bat(Rhinolophus ferrumequinum) showed that the nostril cross-section is not circular, which is narrowin the radial direction (diameter∼0.5 mm) and wide in the orthogonal direction (diameter 3 mm)with curve transition (Figure 2.3b). Additionally, It was found that the shape of the baffle closelysurrounding the nostrils, which is called anterior leaf, isneither convex nor straight but concave(Figure 2.3c).
Based on the above observations, an elliptical outlet (majoraxis length 15 mm, minor axis length1 mm, approximately 12 mm2 area, Figure 2.4b) was constructed to mimic the narrow nostril aper-ture. The outlet flanged with concave baffles (width 15 mm, length 20 mm, Figure 2.4d) was usedto model the anterior leaf.
As a control to the model baffle, circular outlets with different diameters (2 mm,6 mm and 10 mm,Figure 2.4a) and elliptical outlet flanged with straight baffles of different axial lengths (10 mm,20 mm, Figure 2.4c) were constructed.
The width of baffles was the same as the major axis of elliptical outlet (15 mm).
A conical horn (axial length 10 cm, mouth diameter 5 cm and throat diameter 1 cm) and nonuniformtube (length 5 cm) waveguide was used to couple the loudspeaker and the baffles. The mouth of theconical horn was connected with the loudspeaker and the throat was interfaced with on end of thetube (circular cross-section, diameter 1 cm), the other endof the tube had an elliptical cross-section(major axis length 15 mm, minor axis length 1 mm), where the baffles were attached perpendicularto the major axis. The whole assembly was mounted on a pan-tilt unit (FLIR Motion ControlSystem PTU-D48E), which scanned 180° horizontally (azimuth: -90° to 90°, elevation: 0°) with3° angular resolution.
A calibrated microphone (Bruel and Kjær 4138-1/8′′ pressure-field microphone with Bruel andKjær NEXUS 2690-A-0S1 1-channel Microphone Conditioning Amplifier) was placed in the farfield (1 m away from the loudspeaker) to measure the radiationpattern of the outlets and baffles.
The radiation pattern was used to figure out which outlet geometry will give an omnidirectionalbeampattern, which baffle dimension will produce obvious beampattern change and how the baffleshape as well as baffle angle changes the far-field radiation pattern.

Yanqing Fu Chapter 2. Methods 14
(a) (b)
(c)
Figure 2.3: Nostril and anterior leaf cross-section of the greater horseshoe bat (Rhinolophus fer-rumequinum): a) rendering of a digital noseleaf model, the dashed line indicates the position to getthe cross-section of the anterior leaf, b) cross-section ofthe nostril, c) cross-section of the anteriorleaf, the arrows indicate the sound radiation direction of the nostril.

Yanqing Fu Chapter 2. Methods 15
10 mm
x
x
z
y
1 mm
15 mm
20 mm
(b)
(c)
(d)
(a)
20 mm
60°
60°
Figure 2.4: Tested sound outlets and simplified dynamic baffle prototypes: a) planar outlet withcircular cross-section (frontal view), b) planar outlet with elliptical cross-section (frontal view), c)baffle with straight flanks mounted on an elliptical outlet (side view), d) baffle with concave flanksmounted on an elliptical outlet (side view). The circular and elliptical outlets have cross-sectionalareas of≈ 79mm2 and approximately 12 mm2 respectively. Both the straight and concave flankshave the same width 15 mm. The dashed lines indicate the semiangle of the baffle opening (shownhere is a semiangle of 60°).
2.4 Prototype Manufacturing
The manufacturing process of the biomimetic prototype was shown before.
The bioinspired baffles, including the outlets, were made ofpaper. By squeezing the circular outlet,one can get the elliptical outlet.
During the initial testing stage, the waveguides were made of paper. Once the desired dimensionwas set, the waveguide was machined from the Aluminum by using CNC method.

Yanqing Fu Chapter 2. Methods 16
2.5 Actuation Mechanisms
Different actuation configurations were applied to the prototypes based on the available actuatorsand the experimental feasibility. Both prototypes were actuated by the same actuation mechanism:point actuation.
For the biomimetic prototype, two linear actuators (Firgelli L12-1) were used to deform the nose-leaf. One actuator was used to bend the lancet while the otherwas used to move the anterior leafthrough thin rod.
The maximum speed of the linear actuator is 23 mm/s, maximum stroke is 30 mm and maximumside force is 40 N. The linear actuator weights 34 grams [99].
For the bioinspired baffle, angle template was used to determine the static bending angle and asingle actuator (Hitec digital servomotor HS-225BB Mighty Mini) was used to move the bafflecontinuously through thin rod too.
The maximum speed of this actuator is 545°/s and maximum torque is 0.5 Nm. The weight of theactuator is 27 grams [100].
2.6 Acoustic Measurements
The implemented experimental setup had the following capabilities: signal generation and propa-gation, data acquisition, prototype orientation and actuation. All those functions were integratedinto a single automated setup (Figure 2.5).
The loudspeaker (Ultra Sound Advice S56, diameter 5 cm with Ultra Sound Advice S55 ampli-fier) sent out the linear-frequency modulated chirp signal (duration 2 ms, 10 kHz-100 kHz, gatedby raised-cosine flanks), which traveled through the waveguide, was modulated by different pro-totypes and a calibrated microphone (Bruel and Kjær 4138-1/8′′ pressure-field microphone withBruel and Kjær NEXUS 2690-A-0S1 1-channel Microphone Conditioning Amplifier) captured thesignal in the far-field about 1 m away from the loudspeaker. The recorded signal was digitized bya PXI data acquisition system (National Instruments PXIe-1073 chassis with PXIe-6356 X seriesmultifunction data acquisition card) at a sampling rate of 1MHz and resolution of 16 bits.
In the biomimetic noseleaf setup (Figure 2.6), the two linear actuators (Firgelli L12-1) were housedin an enclosure below the waveguide (horn axial length 10 cm,mouth diameter 5 cm, throat diam-eter 7 mm, tube length 10 cm, tube diameter 7 mm) and behind thenoseleaf, thus the acoustic partsand electrical parts were not influence each other. The noseleaf was fixed on an artificial headconsisting of a Styrofoam hemisphere, which allows for stability of the noseleaf, blocks actuatornoise and directs reflections away from the noseleaf [88, 89].
In the bioinspired baffle setup (Figure 2.7), one end of the tube (tube length 5 cm) had a circularcross-section (diameter 1 cm), which was interfaced with the conical horn (axial length 10 cm,

Yanqing Fu Chapter 2. Methods 17
mouth diameter 5 cm and throat diameter 1 cm). The other end formed an elliptical cross-section(minor axis length 1 mm, major axis length 15 mm), which was merged with different designedbaffles.
In both cases, the whole setup was mounted on a pan-tilt-unit(FLIR Motion Control System PTU-D48E), which provided 180° azimuth and 120 ° elevation scanning range with a rotation step size of1° or 3°. Three repeated acoustic measurements were carriedout for each prototype conformationto establish repeatability and reduce measurement noise through averaging.
dataacquisitioncard
ultrasonicloudspeaker
dynamicemissionprototype
computer
pan−tilt unit
ultrasound
waveguide
amplifier
actuator
microphonepreamplifier
Figure 2.5: Typical components of the acoustic measurements: sound generation and propagation,data acquisition, prototype orientation and actuation.

Yanqing Fu Chapter 2. Methods 18
1
2 3
4
5
6
7
4 cm
Figure 2.6: Experimental setup for characterization of thedynamic noseleaf: 1) ultrasonic loud-speaker, 2) conical waveguide, 3) Styrofoam, 4) noseleaf (Figure 2.1c), 5) linear actuator, 6) frame,7) pan-tilt unit.

Yanqing Fu Chapter 2. Methods 19
4
2 13
Figure 2.7: Experimental setup for characterization of thedynamic baffles: 1) dynamic baffle(shown here is a straight baffle, Figure 2.4c), 2) conical waveguide, and 3) ultrasonic loudspeakermounted on a 4) pan-tilt unit.

Yanqing Fu Chapter 2. Methods 20
2.7 Signal Processing
Different signal processing approaches were used to characterize the dynamic noseleaf and baffle.
For the dynamic noseleaf experiments, the frequency domainresponse was obtained by applyinga fast Fourier transform with 2048 points to the time domain signals.
For one selected frequency from 30 kHz to 40 kHz, the gains of the one particular frequency overthe scanning space (-90°-90° azimuth, -30°-90° elevation,resolution: 3°, linear scale) were usedto describe the radiation pattern (2D beampattern) of the different noseleaf configurations (Fig-ure 2.8).
Same technique was used to characterize the static bending effect of the baffles but for 1D beam-pattern (azimuth: -90° to 90°, elevation: 0°, resolution: 3°, dB scale, Figure 2.8d).
Root-mean-square (rms) differences between beam-gains of two different baffle positions werecomputed to study the baffle bending effect (using amplitudes on a dB-scale).
For dynamic baffle experiments, the envelopes of the time domain signal (duration 250 ms) in dif-ferent spatial position (elevation: -60°-+30°, azimuth: 0°, resolution: 1°) were extracted usingHilbert transform to get the time-variant signature (Figure 2.9). Those envelops were also normal-ized with the overall maximum in order to see the systematic difference.

Yanqing Fu Chapter 2. Methods 21
Fourier transform
0
1
120frequency [kHz]
gain
[nrm
.]
position
time [ms]−1am
plitu
de [n
rm.]
0
1
2.1
(a) time domain signal
(b) spectrum
(c) 2D beampattern
(d) 1D beampattern
1050 40 30 20
0°
-60°
gain [dB SPL]
60°
0
-30°
-90°
1gain [linear scale]
90°
90°
Figure 2.8: Signal processing for radiation pattern: a) acquired time domain signal was trans-formed into b) frequency domain by using Fourier transform,for one selected frequency (blackvertical straight line in (b)) from 30 kHz to 40 kHz, the gain was plotted over full scanning space(azimuth: -90° to 90°, elevation: -30° to 90°) to get the c) 2Dbeampattern or just over the horizon-tal space (azimuth: -90° to 90°, elevation 0°, red horizontal line in (c)) to get the d) 1D beampattern.

Yanqing Fu Chapter 2. Methods 22
0 50 250200150100
0 50 250200150100
0 50 250200150100
1
1
1
envelope
−16 0amplitude (nrm.) [dB]
0
time [ms]
−1
0
ampl
itude
(nr
m.)
[lin
ear]
time [ms]
−1
0
ampl
itude
(nr
m.)
[lin
ear]
ampl
itude
(nr
m.)
[lin
ear]
time [ms]
−1
(d)
-60°
250ms
+30°
(a) +30°
(b) 0°
(c) -60°
Figure 2.9: Signal processing for the dynamic concave baffle: for one selected frequency from30 kHz, 40 kHz and 50 kHz, the envelope of time domain data (blue in (a), (b), (c)) was extractedby using Hilbert transform and plotted over position (example: a) 30°, b) 0°, c) -60°) to get the d)time variant signature. Inset in (b) shows the detailed envelope pattern.

Chapter 3
Results
In the greater horseshoe bat, the sound they emit consists offrequency from 60 -80 kHz. Since theprototype was scaled twice than the original size, so the studied frequency range was from 30 kHzto 40 kHz.
3.1 Waveguide Geometry
Overall, the throat diameter had larger effect on the on-axis far-field pressure response than otherwaveguide parameters (conical horn axial length, tube length).
The increase of the horn axial length and the throat diameterwas found to have a increase effect onthe average on-axis far-field pressure (Figure 3.1). For 4 cmaxial length horn, the average pressuregain was the same (31 dB SPL) in both cases (throat diameter: 3mm, 7 mm) while for 10 cm axiallength horn, the average pressure gain of the 7 mm throat hornwas higher (6 dB SPL) than the3 mm throat horn. Based on those findings, the throat diameter of the horn was fixed to 7 mm.
In the case of horn axial length, tube length and the ratio between them (fixed mouth diameter:5 cm, throat diameter and tube diameter: 7 mm), all those parameters didn’t have big effect onthe on-axis far-field pressure amplitude (Figure 3.2, 3.3, 3.4). But the short horn (axial length<10 cm) had higher peaks and valleys than the rest (Figure 3.2,3.4).
Although the present of the conical horn and circular tube waveguide did result in a significantdrop in the sound pressure level (by about 20 dB), the waveguide still provided reasonable signal-to-noise ratio (around 20 dB).
23
Yanqing Fu Chapter 3. Results 24
(a)
(d) 15 cm
10 20 30 40 50 60 70 80
0
10
40
50
60
70
20
30
0
10
40
50
60
70
20
30
7 mm3 mm
horn length5 cm
(c) 10 cm throatmouth
diameter
0
10
40
50
60
70
20
30
(b) 4 cm
frequency [kHz]
on-a
xis
far-
field
pres
sure
e[d
BS
PL]
Figure 3.1: Effect of throat diameter for different horn axial lengths on the on-axis far-field pres-sure: conical horns with the same mouth diameter (5 cm), different throat diameters (blue: 7 mmand magenta: 3 mm) and various horn axial lengths ( b: 4 cm, c: 10 cm, d: 15 cm) were tested. Theinset (a) shows the horn cross section and the arrows indicate the sound radiation direction of theloudspeaker. The red solid line and dashed line shows the loudspeaker and noise pressure responserespectively. Interested frequency (30 kHz-40 kHz) range was marked by black dashed line.

Yanqing Fu Chapter 3. Results 25
10 20 30 40 50 60 8070
70
60
50
40
20
0
10
30
frequency [kHz]
horn length
on−
axis
far−
field
pre
ssur
e [d
B S
PL]
mouthdiameter
4 cm
tube length 8 cm
10 cm 15 cm
throat diameter 7 mm5 cm
Figure 3.2: Effect of waveguide horn axial length on the on-axis far-field pressure: conical hornand circular tube waveguides with the same mouth diameter (5cm), throat diameter (7 mm), tubelength (8 cm) and different horn axial lengths (magenta: 4 cm, green: 10 cm, blue: 15 cm) weretested. The inset shows the conical horn and circular tube waveguide cross section and the arrowsindicate the sound radiation direction of the loudspeaker.Red solid line and dashed line shows theloudspeaker and noise pressure response respectively. Interested frequency range (30 kHz-40 kHz)was marked by black dashed line.

Yanqing Fu Chapter 3. Results 26
10 20 30 40 50 60 8070
70
60
50
40
20
0
10
30
frequency [kHz]
on−
axis
far−
field
pre
ssur
e [d
B S
PL]
mouthdiameter
horn length
4 cm
throat diameter 7 mm5 cm
8 cm 12 cm
tube length
10 cm
Figure 3.3: Effect of waveguide tube length on the on-axis far-field pressure: conical horn and cir-cular tube waveguides with fixed mouth diameter (5 cm), throat diameter (7 mm), horn axial length(10 cm) and different tube lengths (magenta: 4 cm, green: 8 cm, blue: 12 cm) were tested. Theinset shows the conical horn and circular tube waveguide cross section and the arrows indicate thesound radiation direction of the loudspeaker. Red solid lineand dashed line shows the loudspeakerand noise pressure response respectively. Interested frequency range (30 kHz-40 kHz) was markedby black dashed line.

Yanqing Fu Chapter 3. Results 27
tube length
horn length
mouthdiameter
10 20 30 40 50 60 8070
70
60
50
40
20
0
10
30
frequency [kHz]
on−
axis
far−
field
pre
ssur
e [d
B S
PL]
0.2
0.8
5 cmthroat diameter 7 mm
ratio = horn lengthhorn length+tube length
Figure 3.4: Effect of horn axial length and tube length ratioon the on-axis far-field pressure: twodifferent conical horn and circular tube waveguides with the same mouth diameter (5 cm) andthroat diameter (7 mm) were tested (blue: horn axial length 4cm, tube length 16 cm, ratio 0.2;magenta: horn axial length 15 cm, tube length 5 cm, ratio 0.8.Here just shows two examples ofFigure 2.2). The top inset shows the conical horn and circular tube waveguide cross section andthe arrows indicate the sound radiation direction of the loudspeaker. Red solid line and dashedline shows the loudspeaker and noise pressure response respectively. Interested frequency range(30 kHz-40 kHz) was marked by black dashed line.

Yanqing Fu Chapter 3. Results 28
3.2 Lancet Bending
It was shown that the deformations of the lancet didn’t have obvious effect on the beampattern(Figure 3.5) in most of the frequencies. In few frequencies,bending the lancet narrowed the beam-pattern.
Take 38 kHz of repetition (b) for example, as the lancet was bent from 0° to 5°, the azimuth -6 dBbeamwidth kept almost unchanged (21°) and elevation -6 dB beamwidth got narrower (51°-33°).
Meanwhile, the max beam-gain difference between the upright position and the bending stage ofthe lancet was around 1 dB over the entire beampattern.
Experiment repetitions of the biomimetic prototype was found to share qualitatively common fea-tures (Figure 3.5). All beampatterns were dominated by a mainlobe and as the frequency increased,the lobe narrowed in the azimuth direction.
0 1amplitude [linear scale]
(a) (b)
30 34 38 30 34 38f [kHz]
0°
1°
3°
2°
4°
5°
Figure 3.5: Beampatterns at various bending stages of the noseleaf replica: for each experimentalrepetition (a and b), the lancet was bent from 0° to 5° in stepsof 1°, frequencies range from 30 kHz(corresponds to 60 kHz in bats) to 38 kHz (corresponds to 76 kHz in bats) in steps of 4 kHz. Ex-periment setup was showed in Figure 2.6 and signal processing method was showed in Figure 2.8.

Yanqing Fu Chapter 3. Results 29
3.3 Outlet Geometry
It was observed that the narrow direction of the elliptical outlet produced an omnidirectional beam-pattern compared with the circular outlet.
The diameter of the circular outlet had influences on the pressure gain as well as the beamwidth ofthe beampattern (Figure 3.6). The increase of the circular outlet diameter did result in the increaseof the on-axis far-field pressure amplitude (Table 3.1). Forall the studied diameter cases (2 mm,6 mm and 10 mm), the maximum pressure gain difference was 7 dB SPL, 10 dB SPL, 6 dB SPL,7 dB SPL, 8 dB SPL 7 dB SPL for 30 kHz-40 kHz (2 kHz steps) respectively. On the other hand, theincrease of the circular outlet diameter led to a narrower beampattern. Take 34 kHz for example,the -6 dB beamwidth was 102°, 72°, 69° for 2 mm, 6 mm and 10 mm circular outlet respectively.
The acoustic effect of the elliptical outlet behaved different than the circular outlet (Figure 3.7).Beampattern measured along the minor axis (1 mm) of the elliptical outlet showed almost anisotropic beampattern (> 120°), the minimum gain change is 4 dB SPL and maximum gain changeis 7 dB SPL within 120°. In contrast, beampattern measured along the major axis (15 mm) washighly directional (within 60°). Take 34 kHz for example, the -6 dB beamwidth was 39° for majoraxis (15 mm) and 164° for minor axis (1 mm).
Beampattern measured along the 3 mm minor axis had a similar pattern of the 1 mm minor axis, buthad a slightly higher (3 dB) on-axis far-field pressure amplitude. In contrast, on-axis beam-gainsof the 15 mm major axis and 1 mm minor axis were the same for all frequencies.
The omnidirectional beampattern is the one we want since if we attached a baffle around it, thebeampattern can be easily changed and any change in the beampattern is due to the baffle effect.
In the following, the results shown were measured along the minor axis (1 mm) of the ellipticaloutlet.
Table 3.1: Influence of the circular outlet diameter on the on-axis far-field pressure (dB SPL) fordifferent frequencies
diameter (mm) 30 kHz 32 kHz 34 kHz 36 kHz 38 kHz 40 kHz2 34 31 34 35 37 386 39 38 38 40 41 4410 41 41 40 42 45 45

Yanqing Fu Chapter 3. Results 30
203050 40 10203050 40 10203050 40 10
203050 40 10203050 40 10 203050 40 10gain [dB SPL]
(a) 30 kHz (c) 34 kHz
(f) 40 kHz(d) 36 kHz (e) 38 kHz
-60°
0°
60°
(b) 32 kHz
10 mm 2 mm 6 mm
Figure 3.6: Influence of circular outlet diameter on the beampatterns: a) 30 kHz, b) 32 kHz, c)34 kHz, d) 36 kHz e) 38 kHz, f) 40 kHz. Circular outlets with different diameters (green: 2 mm,magenta: 6 mm, blue: 10 mm) were tested. Signal processing method was showed in Figure 2.8.
203050 40 10203050 40 10203050 40 10
203050 40 10203050 40 10 203050 40 10gain [dB SPL]
(a) 30 kHz (c) 34 kHz
(f) 40 kHz(d) 36 kHz (e) 38 kHz
-60°
0°
60°
(b) 32 kHz
3 mm 1 mm
15 mm
Figure 3.7: Influence of elliptical outlet on the beampatterns: a) 30 kHz, b) 32 kHz, c) 34 kHz, d)36 kHz e) 38 kHz, f) 40 kHz. Elliptical outlets with the same major axis (red: 15 mm) and differentminor axises (black: 3 mm, cyan: 1 mm) were tested. Signal processing method was showed inFigure 2.8.

Yanqing Fu Chapter 3. Results 31
3.4 Baffle Geometry
For the same amount of static baffle angle change, the 2 cm baffle had a narrower beampattern andhigher on-axis far-field pressure gain change than the 1 cm baffle.
In terms of the 1 cm baffle, as the baffle semiangle was changed from 60° to 30°, the beampat-tern remained almost constant in low frequency and got narrower in high frequency (Figure 3.8 ,Table 3.2). The maximum -6 dB beamwidth change was 35° for 38 kHz and on-axis far-field pres-sure amplitude remained almost constant (maximum difference was 1 dB SPL for all frequencies,Table 3.3).
In terms of 2 cm baffle, as the baffle semiangle was changed from60° to 30°, the beampatterngot narrower for all frequencies (Figure 3.8, Table 3.2). The maximum -6 dB beamwidth changewas 42°for 38 kHz and on-axis far-field pressure value increased for every frequency (maximumdifference was 4 dB SPL for 38 kHz, Table 3.3).
In summary, the 2 cm baffle produced more beampattern change than the 1 mm in terms of beamwidthand amplitude.
Table 3.2: Influence of the baffle dimension on the -6 dB beamwidth (°) for different frequencies(beampattern was measured along the minor axis of the elliptical outlet)
baffle length (cm) baffle angle (°) 30 kHz 34 kHz 38 kHz1 30 53 50 401 60 59 71 852 30 37 28 282 60 58 54 70
Table 3.3: Influence of the baffle dimension on the on-axis far-field pressure (dB SPL) for differentfrequencies (beampattern was measured along the minor axisof the elliptical outlet)
baffle length (cm) baffle angle (°) 30 kHz 34 kHz 38 kHz1 30 36 35 391 60 35 34 382 30 40 39 402 60 38 36 36

Yanqing Fu Chapter 3. Results 32
203050 40 10203050 40 10203050 40 10
203050 40 10203050 40 10 203050 40 10gain [dB SPL]
(a)
(b)
(c)
-60°
0°
60°
30°
60°
30 kHz 34 kHz 38 kHz
baffle length
1 cm
2 cm
Figure 3.8: Beampattern effects due to the length of the straight baffle: different baffle lengths (b,1 cm; c, 2 cm) and different baffle semiangles (blue: 60°, red:30°) were tested at various frequen-cies: 30 kHz, 34 kHz, 38 kHz. The dashed lines indicate the semiangle of the baffle opening (inseta, shown here is a semiangle of 60°). Experiment setup was showed in Figure 2.7, beampatternwas measured along the minor axis (1 mm) of the elliptical outlet. Signal processing method wasshowed in Figure 2.8.
3.5 Static Characterization of Straight Baffle
The median of the rms-difference depended on the bending angle of the straight baffle linearly.
The median rms-difference between repeated measurements of the beampatterns associated withthe 90°-open angle was found to be 2.8 dB (Figure 3.9, 0°), which was regarded as the systemnoise level for the all tested cases.
Over the angular bending distance of 60°, the rms differencebetween the beampattern gains in-creased monotonically from a base (measurement noise) level 2.8 dB to 6 dB, this relationshipwas found to be approximately linear (linear regression formedian rms difference versus angulardifference:r2=0.97, regression slope: 0.05dB/°) (Figure 3.9, Table 3.4).
The increasing on-axis pressure and narrowing beamwidth effect associated with the rotation of theflanges accounts for the increasing rms-difference. Take 34kHz for example (Figure 3.9(c)), as theflap was rotated, the on-axis pressure gain was changed from 32 dB SPL to 39 dB SPL (Table 3.5)and the -6 dB beamwith was changed from 119° to 30° corresponding to baffle opening angle 90°and 30° respectively (Table 3.6).

Yanqing Fu Chapter 3. Results 33
Table 3.4: Influence of the bending angle on the median root mean square difference for 2 cmstraight baffle
bending angle (°) median [minimum, maximum] rms-difference (dB)0 2.8 [2.3, 3.3]10 3.0 [2.4, 3.7]20 3.5 [2.9, 4.6]30 3.9 [3.4, 4.5]40 4.4 [3.7, 6.2]50 5.2 [3.9, 6.5]60 6.0 [4.5, 8.2]
Table 3.5: Influence of the bending angle on the on-axis far-field pressure response of 34 kHz for2 cm straight baffle
bending angle (°) on-axis far-field pressure response of 34 kHz (dB)30 3940 3750 3560 3370 3480 3390 32
Table 3.6: Influence of the bending angle on the -6 dB beamwidth of 34 kHz for 2 cm straight bafflebending angle (°) -6 dB beamwidth of 34 kHz (°)30 3040 5150 6960 8470 10080 10190 119

Yanqing Fu Chapter 3. Results 34
50 40 30 1020 50 40 30 1020 50 40 30 1020
50 40 30 102050 40 30 102050 40 30 1020gain [dB SPL]
0° 10° 20° 30° 40° 60°50°
(a) bending angle
10
5
0
90°
80° 70°
50°
-60°
0°
60°
40° 30°
60°
bending angle [reference angle 90°]
root
-mea
n-sq
uare
diffe
renc
ein
beam
-gai
n[d
B-le
vels
](b)
reference
(c) 34 kHz
r2 = 0.97
Figure 3.9: Beampattern effects due to static bending of the straight baffle: a) reference openingangle was 90°and bending angle varied, b) root-mean-squaregain difference between beampatternsproduced by a 90°-reference and a tested opening angle, all rms differences were computed withaveraging over 21 frequencies ranging from 30 kHz to 40 kHz insteps of 0.5 kHz as well as overangle, black straight line shows the linear regression between the bending angle and the median(blue dot) of the rms difference, slope 0.05dB/°, coefficient of determinationr2 = 0.97, c) examplebeampatterns shown are for a frequency of 34 kHz of differentbaffle opening angles: 90°(black),80°(blue), 70°(green), 60°(cyan), 50°(magenta), 40°(red), 30°(purple). In the box-and-whiskerplots, the whiskers denote the location of the minimum and maximum, the edges of the box thefirst and third quartiles, and the horizontal line the median. Experiment setup was showed inFigure 2.7, beampattern was measured along the minor axis (1mm) of the elliptical outlet. Signalprocessing method was showed in Figure 2.8.

Yanqing Fu Chapter 3. Results 35
3.6 Static Characterization of Concave Baffle
The beampatterns associated with the bending concave bafflebehaved very different from thestraight baffle flaps.
From an rms-error base line of 2.8 dB (identical to straight baffle), the rms difference betweenbeampatterns jumped to 5.7 dB within just a bending of 10° (Figure 3.10). For larger bendingangles, the rms difference appeared to oscillate between values as low as 4 dB (median value for30°, Figure 3.10) and as high as 5.8 dB (median value for 40°, Figure 3.10).
The oscillations of the rms-difference were due to the pronounced sidelobes in the beampatternsthat were associated with the concave baffle (Figure 3.10a-f). As the baffle was bent, the locationof the sidelobes and the notches that separated them from themainlobe were shifted, when thedirections of sidelobes and notches coincided, a large rms-difference resulted. Whenever the lobesof the compared beampattern overlapped, the rms-difference was small.
Small-scale rotations (0° to 10° in steps of 2° or 3°) showed that the transitions between similarand dissimilar beampatterns within the bending were smoothas well (Figure 3.11). The distin-guish difference was that the sidelobe in the beampatterns changed its angular position as wellas gain. Again, the relationship between rms differences and bending angle was approximatelylinear (r2=0.87, i.e., not quite as well linearly correlated as the straight baffle, Figure 3.11), butthis happened over a much smaller angular range of 10° (regression slope 0.2dB/°, 4× the slope forthe straight baffle, Figure 3.10, Table 3.7). More importantly, to get the same rms-difference, thestraight baffle need to rotate 6× (60°) larger than the concave baffle.
Table 3.7: Influence of the bending angle on the median root mean square difference for 2 cmconcave baffle
bending angle (°) median [minimum, maximum] rms-difference (dB)0 2.8 [2.3, 3.3]10 5.7 [4.8, 6.5]20 5.0 [3.9, 5.5]30 4.0 [3.3, 5.7]40 5.8 [4.8, 6.9]50 5.5 [4.5, 6.6]60 4.4 [3.5, 5.1]

Yanqing Fu Chapter 3. Results 36
Table 3.8: Influence of the small bending angle on the median root mean square difference for2 cm concave baffle
bending angle (°) median [minimum, maximum] rms-difference (dB)0 2.8 [2.3, 3.3]3 4.4 [3.8, 5.2]5 4.4 [3.3, 5.2]7 5.0 [4.0, 5.8]10 5.7 [4.8, 6.5]

Yanqing Fu Chapter 3. Results 37
4050 102030
4050 102030 4050 102030
4050 102030
4050 102030
4050 102030
gain [dB SPL]
70°
10
5
0
root
-mea
n-sq
uare
diffe
renc
ein
beam
-gai
n[d
B-le
vels
](a)
bending angle [reference angle 90°]0° 10° 20° 30° 40° 50° 60°
80°
50° 40°
60°
30°
90°
-60° 60°
0°
(b) 34 kHz
Figure 3.10: Beampattern effects due to static bending of theconcave baffle: a) root-mean-squaregain difference between beampatterns produced by a 90°-reference and a tested opening angle(Figure 3.9a), all rms differences were computed with averaging over 21 frequencies ranging from30 kHz to 40 kHz in steps of 0.5 kHz as well as over angle, b) example beampatterns shown are fora frequency of 34 kHz of different baffle opening angles: 90° (black), 80° (blue), 70° (green), 60°(cyan), 50° (magenta), 40° (red), 30° (purple). In the box-and-whisker plots, the whiskers denotethe location of the minimum and maximum, the edges of the box the first and third quartiles,and the horizontal line the median. Experiment setup was showed in Figure 2.7, beampatternwas measured along the minor axis (1 mm) of the elliptical outlet. Signal processing method wasshowed in Figure 2.8.

Yanqing Fu Chapter 3. Results 38
5
050 40 30 1020
50 40 30 1020 50 40 30 1020
0° 3° 5° 7° 10°
87° 85°
83°
root
-mea
n-sq
uare
diffe
renc
ein
beam
-gai
n[d
B-le
vels
]
bending angle [reference angle 90°]
10
60°-60°
90°
gain [dB SPL]
(b) 34 kHz(a) 34 kHz
(c) 34 kHz
0°
r2 = 0.92
Figure 3.11: Beampattern effects due to static bending of theconcave baffle over small angles(0° to 10°). Root-mean-square gain difference between beampatterns produced by a 90°-referenceand a tested opening angle (Figure 3.9a). The reference opening angle was 90° for all conditions(Figure 3.9a). Black straight line shows the linear regression between the bending angle (from 3°to10°) and the median (blue dot) of the rms difference, slope 0.2dB/°, coefficient of determinationr2 = 0.92. The example beampattern plots show beampatterns for inwards bending angles relativeto the reference of (a) 3°, (b) 5°, and (c) 7°. All other experimental and display parameters werethe same as Figure 3.10. Experiment setup was showed in Figure 2.7, beampattern was measuredalong the minor axis (1 mm) of the elliptical outlet. Signal processing method was showed inFigure 2.8.
3.7 Dynamic Characterization of Concave Baffle
When the concave baffle was continuously actuated in synchrony with the emission, a signaturewas created that depended on time, frequency (30, 40, 50 kHz)as well as direction (Figure 3.12).

Yanqing Fu Chapter 3. Results 39
Take 40 kHz for example (Figure 3.12c,f), when the baffle was held its position, the amplitude ofthe time domain signal was constant along the time axis and varied across spatial direction. Butwhen the baffle was moved during the pulse, the amplitude of the time domain signal varied bothin the time axis and across direction. Moreover, the magnitudes of the lower range (-60° to -30°)of dynamic case was higher than (more than 10 dB difference ) the same range of the static case.

Yanqing Fu Chapter 3. Results 40
-16 -14 -12 -10 -8 -6 -4 -2 0amplitude (nrm.) [dB]
250ms
50 kHz
30 kHz
40 kHz
(c)
(b)
(d)
(e)
(f)
(g)
(a)
-60°
+30°dynamic static
Figure 3.12: Example of a continuous time-variant signature created by motion of a concave baffle:a) measurement direction relative to the baffle, b,c,d) magnitudes (envelope of the analytic signal)of signal received from the dynamic baffle for frequencies ofb) 50 kHz, c) 40 kHz, and d) 30 kHz.The static reference (opening angle 60°) are shown in e) 50 kHz, f) 40 kHz, and g) 30 kHz. Thebaffle motion executed in this example ranged from -60° to 30°in 250 ms. Signal was measuredalong the minor axis (1 mm) of the elliptical outlet. Signal processing method was showed inFigure 2.9.

Chapter 4
Discussions
4.1 Interpretation of Results
The waveguide dimension, i.e. the horn throat diameter, thehorn axial length, plays an importantrole in the acoustic performance of the waveguide.
The horn throat diameter controls the on-axis far-field pressure response gain. For constant soundintensity inside the horn, the larger the throat area (the larger the throat diameter), the more powerit radiates according to sound power equals sound intensitytimes the area relationship. Hence, thehigher on-axis far-field pressure gain for larger throat diameter.
The horn axial length mainly influences the on-axis far-fieldpressure response pattern. For shorthorn, the sound reflects more inside the horn than the long horn, thus less sound radiates from thehorn, which explains why shorter horn had high peaks and valleys than the longer horn.
The geometry of the outlet, i.e. shape and dimension, determines the on-axis far-field pressureresponse as well as far-field radiation pattern.
Again, larger outlet area resulted in a higher on-axis far-field pressure output. Meanwhile, the far-field radiation pattern of the circular and elliptical outlet was governed by the following normalized(with respect to the on-axis pressure amplitude) directivity function [101, 102]:
D(θ, φ) =2J1(ksinθ
√b2cos2φ+a2sin2φ)
ksinθ√
b2cos2φ+a2sin2φ
wherea is the semi-minor axis andb is the semi-major axis of the elliptical outlet, whena = b, theequation reduces to the circular outlet case.J1 is the first kind Bessel equation.θ is the cone angle(determines the beam direction measured with reference to the normal to the outlet plane) andφ isthe azimuthal angle within the elliptical outlet plane (Figure 4.1a). Whenk
√
b2cos2φ+ a2sin2φ
is smaller than 1, the far-field radiation pattern is omnidirectional and when it is larger than 1,radiation pattern becomes narrow. Take an elliptical outlet (minor axis 1 mm, major axis 15 mm)
41

Yanqing Fu Chapter 4. Discussions 42
for example, 34 kHz beampattern measured along the minor axis (k√
b2cos2φ+ a2sin2φ = 0.3)was more wider than beampattern measured along the major axis (k
√
b2cos2φ+ a2sin2φ = 5)(Figure 4.1b), which is qualitatively agree with the experimental results.
Since the elliptical outlet produced an omnidirectional beampattern along the minor axis, if oneattached baffles perpendicular to the minor axis direction,the beampattern could be easily changedand any change in the beampattern was due to the baffle change,which was showed in the experi-mental results.
When either straight baffle or concave baffle was attached to the elliptical outlet and if the attachedangle was changed, the corresponding acoustic impedance was also changed. Acoustic impedanceis a measurement of the sound radiation efficiency. It consists of two parts: real part is acousticresistance and imaginary part is acoustic reactance. As thebaffle opening angle decreases (bendingangle increases), the throat acoustic resistance increases [103, 104]. Simulation results by usingmodal propagation method [105, 106, 107] also showed this kind of trend (Figure 4.2). For aconstant velocity source, the acoustic power is proportional to the acoustic resistance [103, 108],thus high acoustic resistance results in high radiation efficiency. Hence the root-mean-square(rms)gain difference between reference angle (90°) beampatternand tested angle (30°-80° in steps of10°) beampattern increases as the bending angle increases (Figure 4.3).
On the contrary, the resonance effect of the concave baffle complicates this relationship [109, 110],thus the trend between the rms gain difference and the bending angle of the concave baffle becomesoscillated and continuously moving the concave baffle couldhave a dramatic time-variant effect.

Yanqing Fu Chapter 4. Discussions 43
a= 1/2mmb= 15/2mm
34 kHz
φ
D(θ,φ) = 2J1(ksinθ√
b2cos2φ+a2sin2φ)
ksinθ√
b2cos2φ+a2sin2φ
2a
2b(a)
(b)
Figure 4.1: Governing equation and examples of the far-fieldradiation pattern of the ellipticaloutlet: a) governing equation of the elliptical outlet far-field radiation pattern,a is the semi-minoraxis andb is the semi-major axis of the elliptical outlet,J1 is the first kind Bessel equation.θ is thecone angle andφ is the azimuthal angle within the elliptical outlet plane, b) elliptical outlet far-fieldradiation pattern of 34 kHz, minor axis length 1 mm (red), major axis length 15 mm (blue).

Yanqing Fu Chapter 4. Discussions 44
25 30 35 40 45
0.4
0.3
0.2
0.1
0
frequency [kHz]
acou
stic
res
ista
nce
[nrm
.]
anglediameter
throat
50°80°60°
70°90°
2 cm 30° 40°
1 mm
Figure 4.2: Normalized acoustic resistance of conical hornwith different horn angles: 30° (red),40°(green), 50° (blue), 60° (cyan), 70° (black), 80° (magenta), 90° (purple). Inset shows the cross-section of the conical horn, throat diameter 1 mm, horn length 2 cm.

Yanqing Fu Chapter 4. Discussions 45ro
ot-m
ean-
squa
redi
ffere
nce
inbe
am-g
ain
[dB
leve
ls]
10
8
6
0
2
4
10° 20° 30° 50° 60°40°bending angle [reference 90°]
reference angle 90°
bending angle
r2 = 1
Figure 4.3: Bending effect of the conical horn angle on the root-mean-square (rms) gain differencebetween reference angle (90°) beampattern and tested angle(30°-80° in steps of 10°) beampattern:black straight line shows the linear regression between thebending angle and the median (bluedot) of the rms difference, slope 0.2dB/°, coefficient of determinationr2 = 1. RMS beam-gaindifferences of 21 frequencies ranging from 30 kHz to 40 kHz insteps of 0.5 kHz are in each box-and-whisker plot.
4.2 Relevance to Bat Biosonar
It was observed that the bat nostrils are “comma-shaped”, which is narrow radially but wide tan-gentially and can be approximated as elliptical shape. The anterior leaf was attached tangentially.Hence, it can be hypothesized that the comma-shaped bat nostrils create a near-field that is wellsuited for illuminating the flanges of the anterior leaf and hence create strong effects when theanterior leaf is deformed. It was also found that a bioinspired concave shape creates pronounced

Yanqing Fu Chapter 4. Discussions 46
time-variant signatures with just a small displacement (less than 10°), which could be the functionof concave profile of the horseshoe bat anterior leaf. Both those two features enhance the dynamicsensing in bat biosonar.
4.3 Relevance to Engineering
In engineering, the shape of horn loudspeaker is convex and it usually operates below 20 kHz.Within this frequency range, the convex horn has higher acoustic resistance compared with theconical and concave horn [111].
While for the shape of the anterior leaf, when compared with other horn provides commonlyused in engineering (Fig. 4.4a) using a modal propagation method for numerical estimation ofacoustic resistance [105, 106, 107], the concave baffle cross-section of show a resistance maximumjust above 80 kHz, which is about 30% higher than other testedhorns. This indicates that forengineering device, it is possible to adopt the anterior leaf shape if the device needs to operate inthe higher frequency.
Horn loudspeaker and other directivity device, such as antenna, is static in the local sense. For thefuture design, dynamic features could be added to improve the detection range as the time-variantsignature generated by the continuous movement of the concave baffle.

Yanqing Fu Chapter 4. Discussions 47
1
1.2
1.0
55 756560 70 80
3
2
(b)
0 0.5 1frequency [kHz]axial distance [mm]
0.6
acou
stic
resi
stan
ce(n
rm.)(a)
radi
aldi
stan
ce[m
m]
thro
at
0.8
0.4
0.2
Figure 4.4: A horn approximation of the anterior leaf compared to other horns: a) cross-sections ofthe anterior leaf (thick line, circles) compared to Bessel (stars), conical (squares), and exponential(triangles) horns, b) numerical predictions of the acoustic resistances (normalized by a plane waveover the throat area of the horns) for the horn cross-sections shown in (a). The inset in (a) showsthe cutting plane through the anterior leaf that was used to obtain the anterior leaf cross-section.

Chapter 5
Summary
5.1 Major Findings
Based on the biological morphology of the bat noseleaf, two prototypes were designed. An auto-mated experimental setup was used to measure the radiation pattern of the two prototypes. Bothtime domain and frequency domain signal processing methodswere used to analyze the experi-mental data. By doing so, the following major findings were achieved:
1. In the current experimental design, the rotation of the lancet (0°-5°) induced acoustic effectswith overall 1 dB beam-gain change.
2. The minor axis direction of the elliptical outlet produces omnidirectional radiation pattern in thefar-field.
3. For the straight baffle, the root-mean-square (rms) gain difference between reference angle(90°) beampattern and tested angle (30°-80° in steps of 10°)beampattern linearly depends on thebending angle (reference angle-tested angle).
4. For the concave baffle, the rms gain difference between reference angle (90°) beampattern andtested angle (30°-80° in steps of 10°) beampattern oscillates as bending angle (reference angle-tested angle) increases. But linearly increases as the bending angle increases from 0° to 10° insteps of 2° or 3°.
5. To get the same acoustic gain change ( 6 dB rms difference),the straight baffle need rotate sixtimes (60°) more than the concave baffle (10°).
6. Concave baffle produces a time-variant, frequency-variant signature when rotating it continu-ously.
48

Yanqing Fu Chapter 5. Summary 49
5.2 Suggestions for Future Work
To gain further insights into bisonar, the following could be done in the future:
1. Systematic experimental and numerical (finite element method) investigate the acoustic proper-ties of convex, conical and concave baffle.
2. Correlate the time-variant signature with the frequency-variant root-mean-square (rms) gaindifference.
3. The model developed here is a one dimension model and a moresophisticated model could becreated. Individual and interact acoustic effect of the noseleaf model could be investigated.
4. Adding target and echo reception part in the experiment toinvestigate the engineering aspect ofthe whole echolocation system.

Bibliography
[1] H.T. Arita and M.B. Fenton. Flight and echolocation in theecology and evolution of bats.Trends Ecol. Evol., 12(2):53–58, Feb. 1997.
[2] J.R. Speakman. The evolution of flight and echolocation inbats: another leap in the dark.Mammal Rev., 31(2):111–130, Dec. 2001.
[3] G. Neuweiler. Evolutionary aspects of bat echolocation. J. Comp. Physiol. A, 189(4):245–256, Apr. 2003.
[4] M.B. Fenton.Just bats. University of Toronto Press, Buffalo, Toronto, 2nd edition, 1983.
[5] G. Neuweiler. Foraging, echolocation and audition in bats.Naturwissenschaften, 71(9):446–455, Sep. 1984.
[6] H.U. Schnitzler, C.F. Moss, and A. Denzinger. From spatial orientation to food acquisitionin echolocating bats.Trends Ecol. Evol., 18(8):386–394, Aug. 2003.
[7] C.J. Harper, S.M. Swartz, and E.L. Brainerd. Specialized bat tongue is a hemodynamicnectar mop.Proc. Natl. Acad. Sci. U.S.A., 110(22):8852–8857, May 2013.
[8] R. Muller and R. Kuc. Biosonar-inspired technology: goals, challenges and insights.Bioinsp. Biomim., 2(4):S146–S161, Oct. 2007.
[9] D. Russo, G. Jones, and R. Arlettaz. Echolocation and passive listening by foraging mouse-eared batsMyoti myotisandM. blythii. J. Exp. Biol., 210(1):166–176, 2007.
[10] J.A. Simmons. The resolution of target range by echolocating bats.J. Acoust. Soc. Am.,54(1):157–173, 1973.
[11] J.A. Simmons, S.A. Kick, B.D. Lawrence, C. Hale, C. Bard, andB. Escudie. Acuity ofhorizontal angle discrimination by the echolocating bat,Eptesicus fuscus. J. Comp. Physiol.,153(3):321–330, Sep. 1983.
[12] J.A. Simmons. A view of the world through the bat’s ear: The formation of acoustic imagesin echolocation.Cognition, 33(1-2):155–199, Nov. 1989.
50
[13] B. Falk, T. Williams, M. Aytekin, and C.F. Moss. Adaptive behavior for texture discrimi-nation by the free-flying big brown bat,Eptesicus fuscus. J. Comp. Physiol. A, 197(5):491–503, May 2011.
[14] M.K. Obrist, M.B. Fenton, J.L. Eger, and P.A. Schlegel. What ears do for bats: a compara-tive study of pinna sound pressure transformation in Chiroptera. J. Exp. Biol, 180(1):119–152, 1993.
[15] M.E. Bates, J.A. Simmons, and T.V. Zorikov. Bats use echo harmonic structure to distin-guish their targets from background clutter.Science, 333(6042):627–630, Jul. 2011.
[16] M.B. Fenton, P.A. Faure, and J.M. Ratcliffe. Evolution ofhigh duty cycle echolocation inbats.J. Exp. Biol., 215(17):2935–2944, 2012.
[17] EdgeTech. 4200 series side scan sonar system. product brochure, 2014.
[18] Teledyne Reson. Seabat 7125 - ultra high resolution multibeam echosounder. productbrochure, 2014.
[19] NORBIT. Wideband multibeam sonar. product brochure.
[20] J.G. Rees. Science, technical innovation and applications in bioacoustics: summary of aworkshop. Technical Report CR/04/201, British Geological Survey, Jul. 2004.
[21] G. Jones and M.W. Holderied. Bat echolocation calls: adaptation and convergent evolution.Proc. R. Soc. B., 274(1612):905–912, Apr. 2007.
[22] K. Fawcett, D.S. Jacobs, A. Surlykke, and J.M. Ratcliffe. Echolocation in the bat,Rhinolo-phus capensis: the influence of clutter, conspecifics and prey on call design and intensity.Biol. Open, 4(6):693–701, Jun. 2015.
[23] D.R. Griffin and J.A. Simmons. Echolocation of insects byhorseshoe bats.Nature,250:731–732, Aug. 1974.
[24] J.M. Ratcliffe, C.P.H. Elemans, L. Jakobsen, and A. Surlykke. How the bat got its buzz.Biol. Lett., 9(2):20121031, Jan. 2013.
[25] C.P.H. Elemans, A.F. Mead, L. Jakobsen, and J.M. Ratcliffe. Superfast muscles set maxi-mum call rate in echolocating bats.Science, 333(6051):1885–1888, Sep. 2011.
[26] Y. Shiori, S. Hiryu, Y. Watanabe, H. Riquimaroux, and Y. Watanabe. Pulse-echo interactionin free-flying horseshoe bats,Rhinolophus ferrumequinum nippon. JASA Express Letters,126(3):EL80–EL85, Aug. 2009.
[27] M. Vespe, G. Jones, C. Baker, and D. Blacknell. Biologicallyinspired waveform diversityfor synthetic autonomous navigation sensing. Technical Report RTO-EN-SET-119, Uni-veristy of College London, Nov. 2009.

[28] E.T. Bick, M.E. Fife, and S.A. Hudson. Bow dome sonar, Jan.2002. Patent.
[29] M. Noonan. Design and method for improving the performance of submarine and otherwater craft sonar sensors, arrays and/or hydrophones, Jul.2010. Patent.
[30] J.A. Simmons. Acoustic radiation patterns for the echolocaing batsChilonycteris rubiginosaandEptesicus fuscus. J. Acoust. Soc. Am., 46(4B):1054–1056, 1969.
[31] G.K. Strother and M. Mogus. Acoustical beam patterns for bats: some theoretical consider-ations.J. Acoust. Soc. Am., 48(6B):1430–1432, 1970.
[32] H.U. Schnitzler and A.D. Grinnell. Directional sensitivity of echolocation in the horseshoebat, Rhinolopus ferrumequinum. I. Directionality of sound emission.J. Comp. Physiol.,116(1):51–61, Jan. 1977.
[33] A.D. Grinnell and H.U. Schnitzler. Directional sensitivity of echolocation in the horseshoebat,Rhinolopus ferrumequinum. II. Behavioral directionality of hearing.J. Comp. Physiol.,116(1):63–76, Jan. 1977.
[34] A. Surlykke, S.B. Pedersen, and L. Jakobsen. Echolocating bats emit a highly directionalsonar sound beam in the field.Proc. R. Soc. B, 276(1658):835–860, Mar. 2009.
[35] L. Jakobsen, J.M. Ratcliffe, and A. Surlykke. Convergentacoustic field of view in echolo-cating bats.Nature, 493(7430):93–96, Jan. 2013.
[36] N. Ulanovsky and C.F. Moss. What the bat’s voice tells the bat’s brain. Proc. Natl. Acad.Sci. U.S.A., 105(25):8491–8498, Jun. 2008.
[37] C.F. Moss and A. Surlykke. Probing the natural scene by echolocation in bats.Front. Behav.Neurosci., 4:33, Aug. 2010.
[38] M.S. Lewicki, B.A. Olshausen, A. Surlykke, and C.F. Moss.Scene analysis in the naturalenvironment.Front. Psychol., 5:199, Apr. 2014.
[39] M. Geva-Sagiv, L. Las, Y. Yovel, and N. Ulanovsky. Spatial cognition in bats and rats: fromsensory acquisition to multiscale maps and navigation.Nat. Rev. Neurosci., 16(2):94–108,Jan. 2015.
[40] G. von der Emde and H.U. Schnitzler. Classification of insects by echolocating greaterhorseshoe bats.J. Comp. Physiol. A, 167(3):423–430, Aug. 1990.
[41] W.C. Knight, R.G. Pridham, and S.M. Kay. Digital signal processing for sonar.Proceedingsof the IEEE, 69(11):1451–1506, Nov. 1981.
[42] S. Stergiopoulos.Advanced signal processing handbook: theory and implementation forradar, sonar, and medical imaging real time systems. CRC Press, Boca Raton, FL, 2000.

[43] B. Vogler and G. Neuweiler. Echolocation in the noctule (Nyctalus noctula) and horseshoebat (Rhinolophus ferrumequinum). J. Comp. Physiol., 152(3):421–432, Sep. 1983.
[44] G. Jones and J.M.V Rayner. Foraging behavior and echolocation of wild horseshoe bats(Rhinolophus ferrumequinum) and R. hipposideros(Chiroptera, Rhinolophidae).Behav.Ecol. Sociobiol., 25(3):183–191, Sep. 1989.
[45] N.H. Fletcher and S. Thwaites. Obliquely truncated simple horns: idealized models forvertebrate pinnae.Acta Acustica united with Acustica, 65(4):194–204, Mar. 1988.
[46] N.H. Fletcher.Acoustic systems in Biology. Oxford University Press, 1992.
[47] J. Ma and R. Muller. A method for characterizing the biodiversity in bat pinnae as a basisfor engineering analysis.Bioinsp. Biomim., 6(2):026008, May 2011.
[48] J.E. Hill and J.D. Smith.Bats: a natural history. British Museum, London, 1984.
[49] J.D. Altringham.Bats: biology and behaviour. Oxford University Press, Oxford, 1998.
[50] M. Pannala, S.Z. Meymand, and R. Muller. Interplay of static and dynamic features inbiomimetic smart ears.Bioinspir. Biomim., 8(2):026008, 2013.
[51] J.M. Wotton, T. Haresign, and J.A. Simmons. Spatially dependent acoustic cues generatedby the external ear of the big brown bat,Eptesicus fuscus. J. Acoust. Soc. Am., 98(3):1423–1445, 1995.
[52] J.M. Wotton, T. Haresign, M.J. Ferragamo, and J.A. Simmons. Sound source elevationand external ear cues influence the discrimination of spectral notches by the big brown bat,Eptesicus fuscus. J. Acoust. Soc. Am., 100(3):1764–1776, 1996.
[53] T. Shimozawa, N. Suga, P. Hendler, and S. Schuetze. Directional sensitivity of echolocationsystem in bats producing frequency-modulated signals.J. Exp. Biol., 60(1):53–69, 1974.
[54] P.H.S. Jen and D. Chen. Directionality of sound pressuretransformation at the pinna ofecholocating bats.Hearing Research, 34(2):101–117, 1988.
[55] E. Aytekin, M. Grassi, M. Sahota, and C.F. Moss. The bat head-related transfer functionreveals binaural cues for sound localization in azimuth andelevation.J. Acoust. Soc. Am.,116:3594–3605, Dec. 2004.
[56] S. Kim, R. Allen, and D. Rowan. Range dependent characteristics in the head-relatedtransfer functions of a bat-head cast: part 2. Binaural characteristics. Bioinspir. Biomim.,7(4):046015, Dec. 2012.
[57] B.D. Lawrence and J.A. Simmons. Echolocation in bats: the external ear and perception ofthe vertical positions of targets.Science, 218(4571):481–483, Oct. 1982.

[58] C. Chiu and C.F. Moss. The role of the external ear in vertical sound localization in the freeflying bat,Eptesicus fuscus. J. Acoust. Soc. Am., 121(4):2227–2235, Apr. 2007.
[59] R. Muller. A numerical study of the role of the tragus in the big brown bat.J. Acoust. Soc.Am., 116(6):3701–3712, Dec. 2004.
[60] R. Muller, H. Lu, and J.R. Buck. Sound-diffracting flap in the ear ofa bat generates spatialinformation.Phys. Rev. Lett., 100(10):108701, Mar. 2008.
[61] R. Kuc. Model predicts bat pinna ridges focus high frequencies to form narrow sensitivitybeams.J. Acoust. Soc. Am., 125(5):3454–3459, May 2009.
[62] X. Wang and R. Muller. Pinna-rim skin folds narrow the sonar beam in the lesser falsevampire bat (Megaderma spasma). J. Acoust. Soc. Am., 126(6):3311–3318, Sep. 2009.
[63] A. Goudy-Trainor and P.W. Freeman. Call parameters and facial features in bats: a surpris-ing failure of form following function.Acta Chiropterologica, 4(1):1–16, 2002.
[64] H.T. Arita. Noseleaf morphology and ecological correlates in Phyllostomid bats.J. Mam-mal., 71(1):36–47, Feb. 1990.
[65] H.T. Arita. Description of noseleaves of Phyllostomidbats using Fourier analysis.RevistaMexicana de Mastozoologia, 1(1):59–68, 1995.
[66] C. Dietz. Aspects of ecomorphology in the five European horseshoe bats(Chiroptera: Rhi-nolophidae) in the area of sympatry. PhD thesis, University of Tubingen, Dec. 2007.
[67] A Monadjem and P.J. Taylor.Bats of southern and central Africa: a biogeographic andtaxonomic synthesis. Wits University Press, Johannesburg, 2010.
[68] M.F. Robinson. A relationship between echolocation calls and noseleaf widths in bats of thegenerarhinolophusandhipposideros. J. Zool. Lond., 239(2):389–393, 1996.
[69] D.J. Hartley and R.A. Suthers. The sound emission pattern and the acoustical role of thenoseleaf in the echolocating bat,Carollia perspicillata. J. Acoust. Soc. Am., 82(6):1892–1900, Dec. 1987.
[70] Q. Zhuang and R. Muller. Noseleaf furrows in a horseshoe bat act as resonance cavitiesshaping the biosonar beam.Phys. Rev. Lett., 97(21):218701, Nov. 2006.
[71] Q. Zhuang and R. Muller. Numerical study of the effect of the noseleaf on biosonar beam-forming in a horseshoe bat.Physical Review E, 76(5):051902, 2007.
[72] D. Vanderelst, R. Jonas, and P. Herbert. The furrows of Rhinolophidae revisited.J. R. Soc.Interface, 9(70):1100–1103, 2012.
[73] A.K. Gupta, D. Webster, and R. Muller. Interplay of furrows and shape dynamics in thelancet of the horseshoe bat noseleaf.J. Acoust. Soc. Am., 138(5):3188–3194, Nov. 2015.

[74] Z. Zhang, S.N. Truong, and R. Muller. Acoustic effects accurately predict an extreme caseof biological morphology.Phys. Rev. Lett., 103(3):038701, Jul. 2009.
[75] H. Schneider and F.P. Mohres. Die ohrbewegungen der hufeisenfledermause (Chiroptera,Rhinolophidae) und der mechanismus des bildhorens.Z. Vergl. Physiol., 44(1):1–40, Sep.1960.
[76] D.R. Griffin, D.C. Dunning, D.A. Cahlander, and F.A. Webster. Correlated orientationsounds and ear movements of horseshoe bats.Nature, 196(4860):1185–1186, Dec. 1962.
[77] J.D. Pye, M. Flinn, and A. Pye. Correlated orientation sounds and ear movements of horse-shoe bats.Nature, 196(4860):1186–1188, Dec. 1962.
[78] J.D. Pye and L.H. Roberts. Ear movements in a Hipposiderid bat. Nature, 225:285–286,Jan. 1970.
[79] R.A. Holland and D.A. Waters. Echolocation signals and pinna movement in the fruitbat,Rousettus aegyptiacus. Acta Chiropterologica, 7(1):83–90, 2005.
[80] X. Yin, P. Nguyen, T.J. Tucker, and R. Muller. A comparative study of pinna motions inhorseshoe bats and Old World leaf-nosed bats.J. Acoust. Soc. Am., 138(3):1761, Sep. 2015.
[81] J. Mogdans, J. Ostwald, and H.U. Schnitzler. The role ofpinna movement for the local-ization of vertical and horizontal wire obstacles in the greater horseshoe bat,Rhinolopusferrumequinum. J. Acoust. Soc. Am., 84(5):1676–1679, Nov. 1988.
[82] L. Gao, S. Balakrishnan, W. He, Z. Yan, and R. Muller. Ear deformations give bats a physicalmechanism for fast adaptation of ultrasonic beam patterns.Phys. Rev. Lett., 107(21):214301,Nov. 2011.
[83] R. Muller, M. Pannala, O.P.K. Reddy, and S.Z. Meymand. Design of adynamic sensorinspired by bat ears.Smart Mater. Struct., 21(9):094025, 2012.
[84] S.Z. Meymand, M. Pannala, and R. Muller. Characterization of the time-variant behavior ofa biomimetic beamforming baffle.J. Acoust. Soc. Am., 133(2):1141–1150, Feb. 2013.
[85] L. Gobbel. Morphology of the external nose inHipposideros diademaandLavia fronswithcomments on its diversity and evolution among leaf-nosed Microchiroptera.Cells TissuesOrgans, 170(1):39–60, 2002.
[86] W. He, S.C. Pedersen, A.K. Gupta, J.A. Simmons, and R. Muller. Lancet dynamics ingreater horseshoe bats,Rhinolophus ferrumequinum. PLoS ONE, 10(4):e0121700, Apr.2015.
[87] L. Feng, L. Gao, H. Lu, and R. Muller. Noseleaf dynamics during pulse emission in horse-shoe bats.PLoS ONE, 7(5):e34685, May 2012.

[88] A.K. Gupta, Y. Fu, D. Webster, and R. Muller. Bat noseleaves an an inspiration for smartemission baffle structures. InProceedings of the ASME 2013 Conference on Smart Materi-als, Adaptive Structures & Intelligent Systems, volume 2, page V002T06A010, Sep. 2013.
[89] B. Goodman, R. Castro, Y. Fu, R. Muller, and M. Philen. A robotic reproduction of thedynamic sonar sensing in horseshoe bats. InProc. SPIE, volume 9061, page 90614B, Apr.2014.
[90] Y. Fu, P. Caspers, and R. Muller. Dynamic baffle shapes for sound emission inspired byhorseshoe bats.J. Acoust. Soc. Am., 138(3):1789, Sep. 2015.
[91] L. Jakobsen and A. Surlykke. Vespertilionid bats control the width of their biosonar soundbeam dynamically during prey pursuit.Proc. Natl. Acad. Sci. U.S.A., 107(31):13930–13935,Aug. 2010.
[92] Y. Yovel, B. Falk, C.F. Moss, and N. Ulanovsky. Active control of acoustic field of view ina biosonar system.PLoS Biol, 9(9):e1001150, Sep. 2011.
[93] N. Matsuta, S. Hiryu, E. Fujioka, Y. Yamada, H. Riquimaroux, and Y. Watanabe. Adap-tive beam-width control of echolocation sounds by cf-fm bats, Rhinolopus ferrumequinumnippon, during prey-capture flight.J. Exp. Biol., 216(7):1210–1218, Apr. 2013.
[94] C. Geberl, S. Brinkløv, L. Wiegrebe, and A. Surlykke. Fastsensory-motor reactions inecholocating bats to sudden changes during the final buzz andprey intercept.Proc. Natl.Acad. Sci. U.S.A., 112(13):4122–4127, Mar. 2015.
[95] P. Kounitsky, J. Rydell, E. Amichai, A. Boonman, O. Eitan,A.J. Weiss, and Y. Yovel. Batsadjust their mouth gape to zoom their biosonar field of view.Proc. Natl. Acad. Sci. U.S.A.,112(21):6724–6729, May 2015.
[96] L. Jakobsen, M.N. Olsen, and A. Surlykke. Dynamics of the echolocation beam during preypursuit in aerial hawking bats.Proc. Natl. Acad. Sci. U.S.A., 112(26):8118–8123, Jun. 2015.
[97] Y.H. Kim. Sound propagation: an impedance based approach. Wiley, NJ, 2010.
[98] M. Pannala. Design of a biomimetic dynamic microphone baffle. PhD thesis, VirginiaPolytechnic Institute and State University, Dec. 2013.
[99] Firgelli Technologies Inc. Miniature linear motion series, l12. product brochure.
[100] Hitec RCD USA Inc. Hs-225bb mighty mini servo, part no: 31225s. product brochure.
[101] J. W.Thompson. The computation of self- and mutual-radiation impedances for annular andelliptical pistons using bouwkamp’s integral.J. Sound Vib., 17(2):221–233, 1971.
[102] Y.P. Kathuria. Far-field radiation patterns of elliptical apertures and its annulli.IEEE Trans.Antennas Propag., AP-31(2):360–364, Mar. 1983.

[103] J.E. Freehafer. The acoustical impedance of an infinite hyperbolic horn.J. Acoust. Soc. Am,11:467–476, Apr. 1940.
[104] E.R. Geddes. Acoustic waveguide theory.J. Audio Eng. Soc., 37(7-8):554–569, Jul. 1989.
[105] B. Kolbrek. Simulation of sound propagation in an axisymmetric duct. Technical report,Dec. 2011.
[106] B. Kolbrek. Modal propagation in acoustic horns, an investigation of the modal propagationmethod. Technical report, Jun. 2012.
[107] B. Kolbrek. Modal sound propagation in curved horns of rectangular cross-section. Master’sthesis, Norwegian University of Science and Technology, Jun. 2013.
[108] P.M. Morse.Vibration and sound. McGraw-Hill, New York, 2nd edition, 1948.
[109] H. Suzuki and J. Tichy. Sound radiation from convex andconcave domes in an infinitebaffle. J. Acoust. Soc. Am, 69(1):41–49, Jan. 1981.
[110] H. Suzuki.Acoustic radiation and diffraction effects from convex andconcave domes. PhDthesis, Pennsylvania State University, Aug. 1981.
[111] L.L. Beranek and T. Mellow.Acoustics: sound fields and transducers. Academic Press,2012.