Embed Size (px)
Citation preview

Dynamic analysis of automotive clutch dampers
C.L. Gaillard, R. Singh *
Acoustics and Dynamics Laboratory, Department of Mechanical Engineering and Center for Automotive
Research, The Ohio State University, 206 West 18th Avenue, Columbus, OH 43210-1107, USA
Received 16 July 1997; received in revised form 17 January 1999; accepted 24 January 1999
Abstract
The torsional dynamic characteristics of an automotive clutch are simulated by ®ve lumpedparameter linear or nonlinear models. Each nonlinear model includes visco-elastic and dry
friction elements. Dynamic sti�ness and energy dissipation spectra clearly show excitationamplitude and frequency dependent behavior. Also, dynamic hysteresis curves are predictedand analyzed. The proposed models compare well with limited experimental data. Finally, theutility of such models is illustrated via a transmission rattle simulation program. # 2000
Elsevier Science Ltd. All rights reserved.
Keywords: Vehicle driveline; Dynamic hysteresis; Nonlinear models
1. Introduction
Vibro-impacts in manual transmissions are of critical concern to vehicle manu-facturers based on noise, vibration and reliability considerations. This phenomenonis often perceived as the gear rattle problem, and some practical solutions have beensuggested that may either reduce the noise or eliminate the likelihood of its occur-rence [1±7]. Proper selection of clutch parameters such as multi-valued spring andhysteresis rates is necessary to solve the problem [5, 6]. Several computer simulationmodels, based on the linear and nonlinear analyses, have been proposed [1±9]. Mostoften, these are lumped parameters torsional models that describe nonlinear andlinear components [2,7±12]; comparable multibody dynamics approaches have alsobeen suggested [4]. Fig. 1 shows a simpli®ed 4 degree of freedom (DOF) model with¯ywheel, clutch hub, input gear and output gear inertial elements, each characterizedby torsional displacement �. Dampers on the gears account for the drag torques and
Applied Acoustics 60 (2000) 399±424
www.elsevier.com/locate/apacoust
0003-682X/00/$ - see front matter # 2000 Elsevier Science Ltd. All rights reserved.
PI I : S0003-682X(00 )00005 -0
* Corresponding author. Tel.: +1-614-292-9044; fax: +1-614-292-3163.
E-mail address: [email protected] (R. Singh).

the input shaft is represented by a linear torsional spring. The interfacial contactbetween the gears is represented by the mesh sti�ness and a backlash. The clutch (C)is located between the ¯ywheel and the input shaft. Assume that the ¯ywheel velo-city 1� � and torque T� � are given in terms of mean (m) and ¯uctuating (p) compo-nents; these may be related to engine, transmission and vehicle parameters andconditions: 1 t� � � 1m �1p t� � and Te t� � � T1m � Tep t� �:The clutch characteristics in terms of torque (Tc) vs. relative angular displacement
(�C) are invariably based on static measurements. Practical design evidence andlimited experimental measurements suggest otherwise [1,5,10]. It is seen thatdynamic characteristics are frequency and amplitude dependent. Since this issue isnot well understood, it is the subject of this article.
2. Problem formulation
Fig. 2 shows typical static and dynamic characteristics of clutch dampers. Dualstaged curve TC �C� � is shown in Fig. 2a that is similar to those measured under static(zero frequency) conditions. This may be described by two sti�nesses and a constanthysteresis; it is also a source of clearance nonlinearity since the sti�ness changesabruptly from one value to the other. Fig. 2b compares the static and dynamiccurves when the clutch is being operated in the ®rst stage. Observe that sti�nessunder dynamic excitation di�ers from the one measured under the static case. Also,dynamic hysteresis deviates from the static curve. Fig. 2c shows the typical energydissipation curve Ð it will be discussed later.As a component, the clutch may be modeled as shown in Fig. 3a and b where the
harmonic excitation may be in the form of harmonic displacement �c t� � at frequency
Fig. 1. Vehicle gearbox model used for gear rattle analysis.
400 C.L. Gaillard, R. Singh /Applied Acoustics 60 (2000) 399±424

Fig. 2. Typical clutch properties. (a) Static torque vs. displacement. (b) Dynamic torque vs. displacement.
(c) Energy dissipation per unit amplitude for various displacement amplitudes �C. Here, f is the frequency
in Hz.
C.L. Gaillard, R. Singh /Applied Acoustics 60 (2000) 399±424 401

Fig. 3. (a) Free body diagram of the clutch in torsional mode (b) Dynamic clutch testing concept. (c)
Dynamic parameters extracted from the experiment.
402 C.L. Gaillard, R. Singh /Applied Acoustics 60 (2000) 399±424

! under a given set of conditions such as speed 1 and the boundary condition may be®xed. Only the steady state (and not the transient state) is studied in this paper. Theresulting dynamic torque TC t� � of the whole system is measured or calculated. In thisstudy, simpli®ed lumped parameter models are developed in order to analyze theclutch behavior in terms of TC vs. �C at given !: Internal damping phenomena suchas viscous and dry-friction damping are not evaluated from a microscopic view-point. Instead, an assumption is made that both viscous and dry-friction dampingcomponents are of interest and that the cyclic energy dissipation �d is proportionalto the bounded area of the hysteretic loop. Therefore, each nonlinear visco-elasticmodel will include elastic sti�ness, viscous damping and a dry-friction element.March and Powell [11] have suggested an empirical approach where the clutch
damper sti�ness is obtained from measured static data, and the hysteresis anddamping values are calculated from dynamic measurements; however, no details areprovided in this article. Their model [11] appears to show an excellent correlationwith the measured static properties, but not with the measured dynamic responsethat is reported only at 50 Hz with one excitation amplitude (1.0 degree). To the bestof our knowledge, no dynamic models of clutch dampers are currently available.Further the literature on the measured dynamic behavior of clutches is virtuallynon-existent [5,10,15]. Nonetheless, prior studies on elastomers and constrainedlayer damping treatments suggest that this approach is viable [16±18]. Speci®cobjectives of this study are, therefore, to develop ®ve lumped parameter dynamicmodels based on theory, study these models in terms of dynamic sti�ness k�; lossfactor � and cyclic energy dissipation �d; and then compare with available experi-mental results [10,13]. Finally some of these models are included in a gear rattlesimulation program [9,19].Results of experimental tests on several clutches were made available to this study
[10,13]. The clutch was tested ®rst with a locked shaft, which means that the clutchassembly did not rotate and was dynamically excited by a torsional actuator [14].Then a rotating shaft rig test was carried out with a mean velocity �
:Cm � 1m:
Reference [14] describes the test methodology.Results show that the rotational speed 1 has an in¯uence only beyond 2000 rpm.
This is believed to be outside the range of concern for gear rattle type problems [13].Tests have been run at four di�erent excitation frequencies: 1 (quasi-static), 50, 75and 100 Hz. For the quasi-static case, the complete cycle has been obtained. At theother frequencies, cycles of 2 degrees of peak-to-peak amplitude, centered at 3degrees have been obtained. Also, for each curve, the signal is ®ltered using a lowpass ®lter with a cut-o� frequency of 400 Hz. Fig. 4 shows sample results for 50 and100 Hz excitation frequencies. These curves may be de®ned in terms of storagemodulus and hysteresis. For an ideal linear system, the curve would be a perfectellipse, and the storage modulus (or torsional sti�ness) line would be determined bythe points of maximum strain on each side of the curve. In our case, the curves seemto be a combination of a parallelogram due to dry-friction, and an ellipse due toviscous damping. Still, we can roughly estimate the storage modulus slope byignoring the o�set created by dry friction. The storage sti�ness values are 20.3,22.11, 19.4 and 18.9 Nm/deg at 1, 50, 75 and 100 Hz, respectively.
C.L. Gaillard, R. Singh /Applied Acoustics 60 (2000) 399±424 403
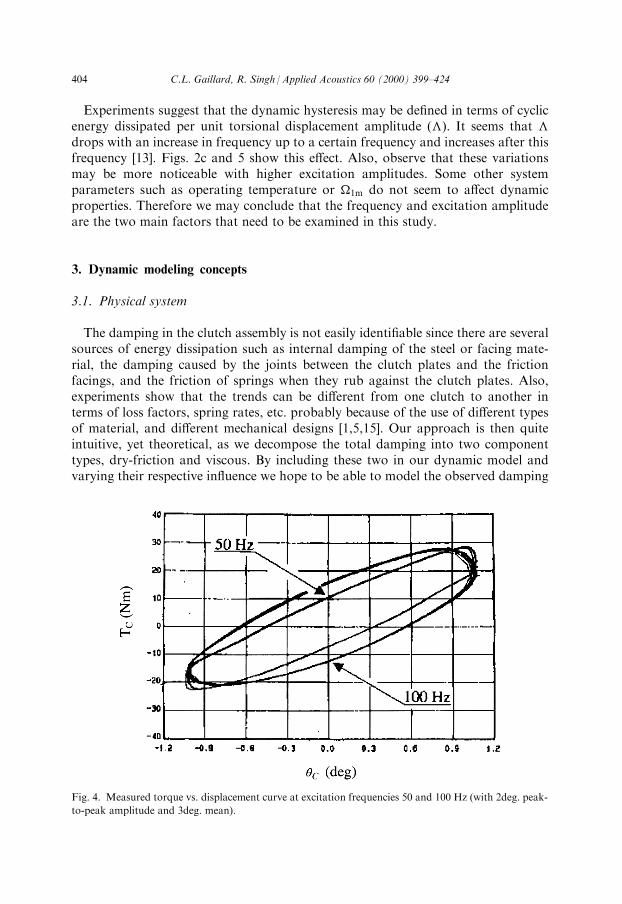
Experiments suggest that the dynamic hysteresis may be de®ned in terms of cyclicenergy dissipated per unit torsional displacement amplitude (�). It seems that �drops with an increase in frequency up to a certain frequency and increases after thisfrequency [13]. Figs. 2c and 5 show this e�ect. Also, observe that these variationsmay be more noticeable with higher excitation amplitudes. Some other systemparameters such as operating temperature or 1m do not seem to a�ect dynamicproperties. Therefore we may conclude that the frequency and excitation amplitudeare the two main factors that need to be examined in this study.
3. Dynamic modeling concepts
3.1. Physical system
The damping in the clutch assembly is not easily identi®able since there are severalsources of energy dissipation such as internal damping of the steel or facing mate-rial, the damping caused by the joints between the clutch plates and the frictionfacings, and the friction of springs when they rub against the clutch plates. Also,experiments show that the trends can be di�erent from one clutch to another interms of loss factors, spring rates, etc. probably because of the use of di�erent typesof material, and di�erent mechanical designs [1,5,15]. Our approach is then quiteintuitive, yet theoretical, as we decompose the total damping into two componenttypes, dry-friction and viscous. By including these two in our dynamic model andvarying their respective in¯uence we hope to be able to model the observed damping
Fig. 4. Measured torque vs. displacement curve at excitation frequencies 50 and 100 Hz (with 2deg. peak-
to-peak amplitude and 3deg. mean).
404 C.L. Gaillard, R. Singh /Applied Acoustics 60 (2000) 399±424

trends. With reference to Fig. 3, Tfacings and Ttransmission are the input and outputtorques, where Tfacings is the torque transmitted by the ¯ywheel to the clutch andTtransmission is the torque transmitted by the clutch to the transmission. The othertorques such as the friction damping, viscous damping, and elastic (spring) torquesare internal to the clutch. The e�ect of the clutch inertia Ic is described by accelera-tion ��C: Taking all these elements into account, we obtain the equation of motion:
IC��C � Tfacings ÿ Tfrictionÿdamper ÿ Tviscousÿdamper ÿ Tspring ÿ Ttransmission �1�
3.2. Dry friction model
The dry-friction is modeled using the Coulomb friction model. As shown in Fig. 6,it is de®ned by two system parameters: (1) shear sti�ness (kf ) between the facingsand the pressure plate or the ¯ywheel, and (2) saturation friction torque (Tf ), i.e.torque transmitted during slipping. Some other models were also investigated tosimulate the dry-friction phenomenon [18]. In particular, a model that included aspeed-dependent friction coe�cient has been considered but the rounded shape ofthe hysteresis cycle such as Fig. 2 is mostly determined by the viscous damping. Thusthe main contribution of the dry-friction is the parallelogram-like shape of the loop.Another reason why our model should not be too complex is that the data extractedfrom experimental results may not be very accurate. Consequently, we intend tosimulate trends and not try to match the exact numbers.The behavior of the dry-friction element can be divided into three di�erent states,
namely stick state, positive state and negative state. The positive state is de®ned by apositive slip speed �
:f > 0 during which the transmitted torque is Tf : The transition
Fig. 5. Measured energy dissipation per unit amplitude (�) of clutch damper vs. frequency (f), as
extracted from [10]. Here the excitation amplitudes (�C) vary from 0.1 to 1.5 degrees.
C.L. Gaillard, R. Singh /Applied Acoustics 60 (2000) 399±424 405

to the stick state occurs when the decreasing slip speed reaches �:f � 0: During this
state, there is no relative slipping between �1 and �f ; therefore �:f � �
:1: If �1 �
�1 cos !t� �; this occurs for !t � 0� 2k�; k 2 N , i.e. when �1 � �1: The negativeslip state is de®ned by �
:f < 0 and during this state, the transmitted torque is ÿ Tf :
The transition to the stick state occurs when the increasing slip speed reaches �:f � 0;
this is when !t � �� 2k�; k 2 N; i.e. when �1 � ÿ�1: The stick state is de®ned by�:f � 0: During this state, the transmitted torque is dictated by the spring sti�ness,T � kf �1 ÿ �f0
ÿ �where �f0 is the value of �f at the end of the preceding state and
during the stick state. If the positive slip is the preceding state, then �f0 � �1 ÿTf=kf ; and if negative slip is the preceding state, then �f0 � ÿ �1 ÿ Tf=kf� �: Thetransition to the negative slip state occurs when the transmitted torque reaches ÿTf ; this is when �1 � �1 ÿ 2Tf=kf � ': The transition to the positive slip state occurswhen the transmitted torque reaches Tf ; this is when �1 � ÿ �1 ÿ 2Tf=kf� � � ÿ':
Fig. 6. Torque vs. excitation displacement �1 for the dry friction element.
406 C.L. Gaillard, R. Singh /Applied Acoustics 60 (2000) 399±424
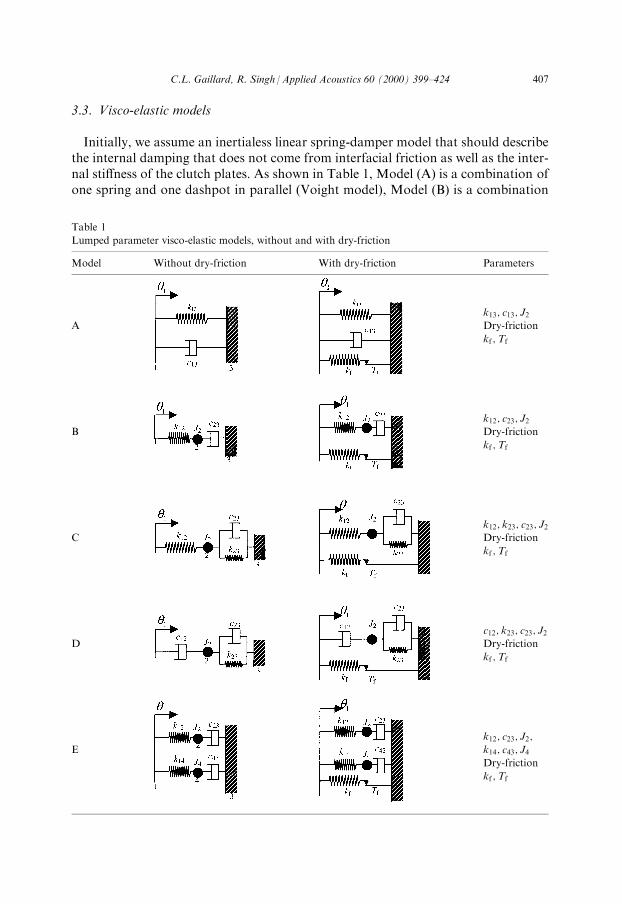
3.3. Visco-elastic models
Initially, we assume an inertialess linear spring-damper model that should describethe internal damping that does not come from interfacial friction as well as the inter-nal sti�ness of the clutch plates. As shown in Table 1, Model (A) is a combination ofone spring and one dashpot in parallel (Voight model), Model (B) is a combination
Table 1
Lumped parameter visco-elastic models, without and with dry-friction
Model Without dry-friction With dry-friction Parameters
A
k13; c13; J2Dry-friction
kf ;Tf
B
k12; c23; J2Dry-friction
kf ;Tf
C
k12; k23; c23; J2Dry-friction
kf ;Tf
D
c12; k23; c23; J2Dry-friction
kf ;Tf
E
k12; c23; J2;k14; c43; J4Dry-friction
kf ;Tf
C.L. Gaillard, R. Singh /Applied Acoustics 60 (2000) 399±424 407

of one spring and one dashpot in series (Maxwell model), Model C is a Voightmodel in series with a spring, and Model D is a Voight model in series with a dash-pot. One might yet come up with more visco-elastic elements [16] but let us limit thechoices for the sake of simplicity. Finally, one needs to investigate the possibility ofincluding clutch inertia in the model. If it is included, where should it be located?One may lump them at location 1 of Table 1 where it would not a�ect the sti�nessand damping properties of the clutch as a component but it would a�ect the drive-line system dynamics. Or one may lump them at location 2 where it may a�ect theclutch dynamic properties. All of the nonlinear lumped parameter models combinethe dry-friction damping element and one of the visco-elastic elements (Table 1).
3.4. Dynamic sti�ness concept
At any frequency !; the complex dynamic sti�ness k~ is as follows with respect toFig. 3c.
k~ � T�Tei !t��F� �
�cei!t� T�Tei�F
�c� T~ T
�c� k~��� ���ei�K �2a�
k~ � k0 � ik00 � k0 1� i�� � �2b�
Examine the linear (without friction) models of Table 1 and refer to Eq. (2) forderiving the following expressions. The cyclic energy dissipation �d is given by theproduct of harmonic displacement and torque TT for one cycle. Since TT can beobtained from k~ as
TT � k~��� �����c; �d is given by
�d ��k~ ��c
��� ���d�c ��k~ ��c
��� ��� d�c
dtdt �3�
For harmonic excitation displacement �c t� � � �cei!t; the expression becomes
�d ��k0�c cos !t� � ÿ k00�c sin !t� �� � ÿ�c! sin !t� �� �dt � �k00�2
c �4�
4. Illustrative example (model D)
4.1. Contribution from the visco-elastic element
Writing �c � �1 � �1ej!t; the transmitted torque is
T~ Tej!t � k23 � c23j!� �c12j!c12j!� k23 ÿ J2!2 � c23j!
�1ej!t:
408 C.L. Gaillard, R. Singh /Applied Acoustics 60 (2000) 399±424
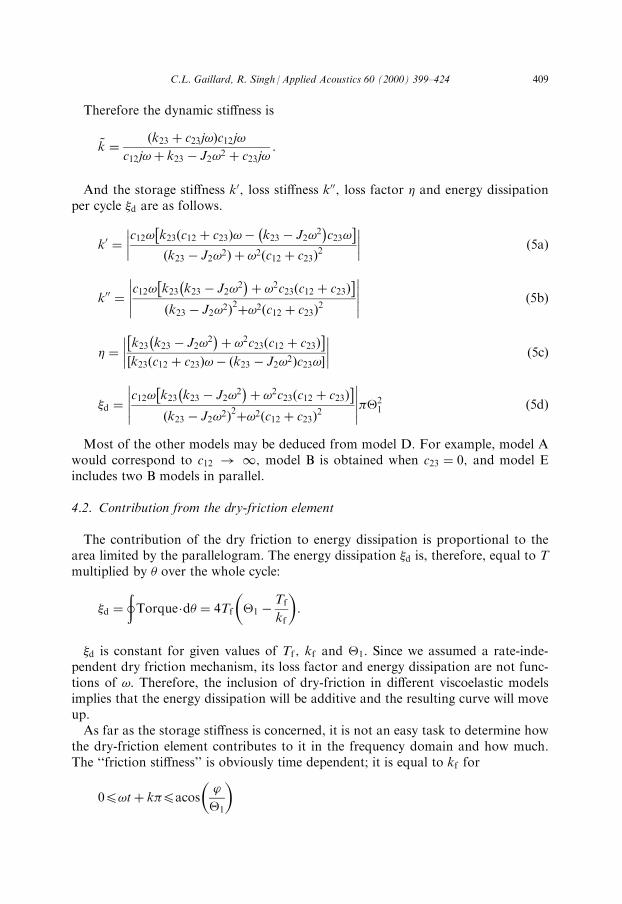
Therefore the dynamic sti�ness is
k~ � k23 � c23j!� �c12j!c12j!� k23 ÿ J2!2 � c23j!
:
And the storage sti�ness k0; loss sti�ness k00; loss factor � and energy dissipationper cycle �d are as follows.
k0 � c12! k23 c12 � c23� �!ÿ k23 ÿ J2!2
ÿ �c23!
� �k23 ÿ J2!2� � � !2 c12 � c23� �2
���� ���� �5a�
k00 � c12! k23 k23 ÿ J2!2
ÿ �� !2c23 c12 � c23� �� �k23 ÿ J2!2� �2�!2 c12 � c23� �2
���������� �5b�
� � k23 k23 ÿ J2!2
ÿ �� !2c23 c12 � c23� �� �k23 c12 � c23� �!ÿ k23 ÿ J2!2� �c23!� ����� ���� �5c�
�d �c12! k23 k23 ÿ J2!
2ÿ �� !2c23 c12 � c23� �� �
k23 ÿ J2!2� �2�!2 c12 � c23� �2�����
�������21 �5d�
Most of the other models may be deduced from model D. For example, model Awould correspond to c12 ! 1; model B is obtained when c23 � 0; and model Eincludes two B models in parallel.
4.2. Contribution from the dry-friction element
The contribution of the dry friction to energy dissipation is proportional to thearea limited by the parallelogram. The energy dissipation �d is, therefore, equal to Tmultiplied by � over the whole cycle:
�d ��
Torque�d� � 4Tf �1 ÿ Tf
kf
� �:
�d is constant for given values of Tf ; kf and �1: Since we assumed a rate-inde-pendent dry friction mechanism, its loss factor and energy dissipation are not func-tions of !: Therefore, the inclusion of dry-friction in di�erent viscoelastic modelsimplies that the energy dissipation will be additive and the resulting curve will moveup.As far as the storage sti�ness is concerned, it is not an easy task to determine how
the dry-friction element contributes to it in the frequency domain and how much.The ``friction sti�ness'' is obviously time dependent; it is equal to kf for
04!t� k�4acos'
�1
� �
C.L. Gaillard, R. Singh /Applied Acoustics 60 (2000) 399±424 409

and equal to 0 for acos'
�1
� �4!t� k�4� when �1 � �1 cos !t� � (Fig. 6). On the
other hand, ' is dependent upon kf : The higher the value of kf ; the smaller the valueof ': Plotted in the time domain, this corresponds to an ``sti�ness impulse''. In par-ticular, for the simplest Coulomb friction model, the transmitted torque jumpsinstantaneously from the negative value (ÿ Tf ) to the positive value (Tf ) and vice-versa. This corresponds to an in®nite sti�ness over an in®nitesimal instant and it canbe correlated to a perfect impulse. The contribution of the friction element to thesystem storage sti�ness in the frequency domain is therefore neglected in this study.
5. Results based on linear models
5.1. Typical spectral contents
Figs. 7 to 10 show the typical spectra that are obtained for �d; k0 and � for selected
models. One may identify three groups of models in terms of the behavior of theenergy dissipation. For the Voight model (A), �d increases monotonically in a linearmanner. For models B and C, the energy dissipation spectrum exhibits only onepeak, but for models D and E (double Maxwell model), we obtain two peaks and avalley in between. Some experimental tests show �d to decrease up to a certain ! andthen increase afterward. Hence it is interesting to note that model D or E mayrepresent this behavior. The storage sti�ness spectra also show similar trends. k0 ofthe Voight model (A) is constant and k0 of models B, C and D increases mono-tonically and rapidly, then seems to follow a horizontal asymptote. For the doubleMaxwell model (E), k0 also increases monotonically, but the rate of increase is lowerwhen �d is between the two peaks. Note that experimental results show a slightdecrease in k0 as ! is increased [13].Default parameter values are, however, model-dependent and reasonable values
are chosen so as to match typical experimental hysteresis loops in terms of slope andhysteresis loop width. To estimate the clutch inertia, we computed the order ofmagnitude value by assuming a disk of radius r � 100 mm, and mass M � 1 kg. Thisleads to J � 0:5Mr2 � 0:005 kgm2: We study the in¯uence of parameters on theenergy dissipation �d and storage sti�ness k0 and how the hysteresis is a�ected. As anexample, examine model D. First consider the energy dissipation spectrum thatshows the combination of a peak and a valley (Fig. 9). For a smaller value of c12; thepeak is broad and moves toward higher frequencies. Therefore, a high c12 valuemakes the peak sharper, as well as the valley. Conversely, c23 controls the rate ofincrease of the linear curve. For a smaller value of c23; the peak is dominant and thein¯uence of the linear curve is small. The slope of the linear part of the curveincreases with c23; which results in the appearance of a valley. When c23 becomes toolarge, the linear curve completely dominates and ultimately the peak disappears. Thek23 value controls the amplitude of the peak and a high k23 corresponds to a highpeak amplitude. As a consequence, the valley moves toward higher frequencies. Fora high inertia J2; the peak dominates and a valley can be seen, similar to what is
410 C.L. Gaillard, R. Singh /Applied Acoustics 60 (2000) 399±424

Fig. 7. Dynamic characteristics of model A.
C.L. Gaillard, R. Singh /Applied Acoustics 60 (2000) 399±424 411

Fig. 8. Dynamic characteristics of model B.
412 C.L. Gaillard, R. Singh /Applied Acoustics 60 (2000) 399±424

Fig. 9. Dynamic characteristics of model D.
C.L. Gaillard, R. Singh /Applied Acoustics 60 (2000) 399±424 413

Fig. 10. Dynamic characteristics of model E.
414 C.L. Gaillard, R. Singh /Applied Acoustics 60 (2000) 399±424

observed for model B (Fig. 8). When computing the loss sti�ness, take the absolutevalue and account for the sign in the phase calculation. Since the energy dissipationis zero at the natural frequency, this creates a valley.Next consider the storage sti�ness. The curve is a combination of a curve similar
to the storage sti�ness of the model B, and a linearly increasing curve. Here, c12controls the peak and for a small c12; k
0 ®rst rises slowly but then tends to decrease.For a large c12; k0 rises quickly, then becomes almost ¯at and ®nally increasesslowly. The c23 value controls the slope of the linearly increasing curve and a highc23 corresponds to a high slope. But k23 controls the peak amplitude. The peakamplitude increases with k23: For a high J2; the curve decreases faster after it hasreached the peak. Since this curve is the superposition of a peak and a linear curve,for smaller values of J2; k
0 keeps increasing because the slope of the linear curve islarger than the slope of the peak on the decreasing side in absolute terms. Con-versely for a high value of J2; the opposite is seen and k0 decreases. Finally, considerthe hysteresis loop. For smaller values of c12; the bounded area of the hysteresisfollows the same trend as the dissipated energy. It is largest around 30 Hz. The slopeof the loop, which follows the trend of the storage sti�ness, increases fast with fre-quency. For a larger c12; the slope increases slowly with ! and so does the boundedarea. For a high value of c23; the slope of the hysteresis increases slightly faster with! than with lower values of c23: The bounded area increases faster for higher valuesof c23: Note that k23 controls the slope of the hysteresis and a large k23 implies highslope. At lower frequencies, high k23 results in more energy dissipation.
5.2. Experimental veri®cation
Experimental results are restricted up to 100 Hz since the upper frequency range islimited due to excessive heating and lubrication problems. Two models seem todescribe the experiments: the modi®ed Voight model (D) and the double Maxwellmodel (E). Indeed, from the parametric studies, observe that increasing c23 in modelA moves the energy dissipation peak towards low frequencies. Therefore if wechoose a lower value of c for one Maxwell branch and a high value of c for theother, we obtain two distinct peaks (Fig. 10). The behavior of the energy dissipationcurve for the modi®ed Voight model (D) and the double Maxwell model (E) aredi�erent at higher frequencies. For the ®rst one, the curve will keep rising while forthe second one, it will decrease back to zero. For both models E and D, the k0 curveis acceptable above 20 Hz where it slowly increases which is in accordance withexperimental results. However, below 20 Hz, the curve drops down to zero for theMaxwell model (B) and down to
k12 �k23k12 � k23
� k0static
for model D, which is half of the maximum value when k12 � k23: This trend needsto be veri®ed in real-life experiments.
C.L. Gaillard, R. Singh /Applied Acoustics 60 (2000) 399±424 415

5.3. Comparison of visco-elastic models
Since the Voight model (A) is the simplest, it o�ers several advantages. The k0 curvedoes not drop down at lower frequencies like other dynamic models; here it remainsconstant over the entire frequency range. Experimental results show that it decreasesvery slowly; therefore, a constant value is better than an increasing value which we®nd in other models except for the Maxwell model. Another advantage of this modelis that there is a simpler relationship between parameters and performance char-acteristics; therefore it is rather easy to obtain a desired slope for the energy dis-sipation and a constant value for the storage sti�ness. The disadvantages are that wecannot obtain a minimum of energy dissipation at a given frequency, nor can weobtain a slowly decreasing k0 over the frequency range.Assumptions for theMaxwell model (B) include that inertia plays an important role
in in¯uencing the dynamics of the system and that there is a natural frequency under50 Hz that is set here at 30 Hz. Such an assumption is realistic since a clutch havinga spring-damper mass of 2.5 kg and a radius of 180 mm would give an inertia (J) of0.04 kgm2 that is needed to obtain the natural frequency of 30 Hz. From the dynamicsti�ness equations, observe that we take the absolute value of the energy dissipationand the sign is taken into account in the phase calculation; also, at the natural frequencyof the system, �d reaches zero. This explains the shape of the curve of energy dissipation(Fig. 8). The reason why either measured or simulated curve does not go down to zeroin this particular plot is that �d due to the dry-friction is included. It may be approxi-mated as 0.2. Nm.rad which yields an energy dissipation per unit amplitude of 11.46Nm.rad/rad. For similar reasons, k0 starts decreasing after 30 Hz. The advantages ofthis model are that we can obtain an increasing �d and also a decreasing k0 curvefrom 50 to 100 Hz. Models D and E are more complex and each system parameterplays a critical role. Chief advantage of these models is that one can obtain a mini-mum of energy dissipation without assuming a low natural frequency. The energydissipation curves are more similar to the measured ones given in [10]. However, themain disadvantage is that the storage sti�ness keeps increasing with !; especially formodel E.Based on the discussion, it is obvious that one cannot de®ne a best model since
there are many variations in design and materials. Instead, one may state that somedynamic models are more adequate than others in simulating a particular dynamicphenomenon or the trend associated with a change in certain parameters.
6. Results based on nonlinear models
6.1. Frequency-dependent dry-friction
The dry-friction model that has been used in Section 5 is frequency-independent.However, the slipping torque Tf may be de®ned by a friction coe�cient �f and anormal load Nf such that Tf � �f �Nf : And it is quite conceivable, in particular if thenormal load arises from the springs rubbing against the housing, that it might vary
416 C.L. Gaillard, R. Singh /Applied Acoustics 60 (2000) 399±424

with the centrifugal acceleration which varies with speed or frequency !: Hence, thedry-friction term would be frequency-dependent. At each point of contact (say M)between the spring and the housing, de®ne the local coordinates with normal vectorn! in the direction OM
��!where O is the center of rotation of the clutch. In a Gallilean
referential, the speed of M is
v!� dOM��!dt� R�
:�!
where �! is the tangential vector of the local coordinates and R � OM��! : The
acceleration of M is
d2OM��!
dt2�
Rd �: � �!
� �dt
� R�� �!� R�:2 n!;
and the centrifugal acceleration is equal to R�:2: Therefore, for harmonic excitation
�c t� � � �c cos !t� �; the time-averaged value over a period 2�!
ÿ �of the normal accel-
eration isR�2
c!2
2 : The slipping torque is then de®ned as a function of frequency,
Tf !� � � �f �mR�2c!
2
2
where m is the net mass of all springs. Thus the net energy dissipation due to dry-friction is equal to �d !� � � 4Tf !� � and it is frequency-dependent. Using model Bwith frequency-dependent dry-friction, one can obtain an energy dissipation curve.Note that a minimum of energy dissipation is observed in Fig. 11. Here, m � 0:2 kg,�f � 0:35 and R � 0:1 m.
6.2. In¯uence of the excitation displacement
For the linear models, the excitation displacement amplitude does and should nothave any in¯uence on k~: However, it does have an in¯uence on the energy dissipa-tion per amplitude. Consider model D which is the simplest model showing a mini-mum of energy dissipation. The simulated curve from the linear model (D) fordi�erent amplitudes have essentially the same shape and are scaled. Therefore, theycannot cross each other, as it is observed from experimental curves of Fig. 5. Next,examine how the nonlinearity may a�ect the energy dissipation spectrum. For thismodel, assuming kf ! 1; the energy dissipation per unit amplitude � is given asfollows.
� � �d
�c� ��ck� 4Tf � ��c
c12! k223 � !2c23 c12 � c23� �ÿ �k223 � !2 c12 � c23� �2 � 4Tf �6�
C.L. Gaillard, R. Singh /Applied Acoustics 60 (2000) 399±424 417

Fig. 11. Energy dissipation contribution from (a) visco-elastic model B only, (b) frequency-dependent
dry-friction only, and (c) a combination of visco-elastic and frequency dependent dry-friction elements.
418 C.L. Gaillard, R. Singh /Applied Acoustics 60 (2000) 399±424

Assume that k23 (and only k23) of Table 2 is function of the amplitude �c:Modifythe energy dissipation curve of model D to obtain curves that follow the trends ofFig. 5 when varying the excitation amplitude. Notice that all experimental curvescross a ``knot''. This ``knot'' is determined by the frequency that is designated hereas !k; and the corresponding energy dissipation per unit amplitude is de®ned by �k
as shown in Fig. 2c. Finally, de®ne the excitation amplitude as �c � �refp; where�ref is the reference amplitude and p is the non-dimensional amplitude. Insert theconstraint of this ``knot'' in Eq. (6); i.e. force every curve to pass through this``knot''. This is illustrated by the following equation where � is equal to the con-stant �k at frequency !k; independently of the displacement amplitude p:
��refpc12!k k223 � !2
kc23 c12 � c23� �ÿ �k223 � !2
k c12 � c23� �2 � 4Tf � �k �7�
Assume k23 to be the only parameter as a function of the excitation amplitude p:De®ne A � ��refc12!k ; B � ��refc12c23 c12 � c23� �!3
k ; C � �ÿ 4Tf and D ��ÿ 4Tf� � c12 � c23� �2!2
k to yield Apk223 � Bpÿ Ck223 ÿD � 0: Finally,
k23 p� � ��������������������ÿBp�D
Apÿ C
s�8�
The curve of k23 p� � de®ned by Eq. (8), �; � and k0 obtained using this expressionare given in Fig. 12. Obtain similar results when forcing c12 or c23 to be functions ofthe amplitude.We indeed obtain a ``knot'' for curves with various excitation amplitudes. Note
that c23 decreases exponentially with increasing excitation amplitudes, and theresulting energy dissipation curves exhibit an increase of the slope of the linear curve(after the minimum) with displacement amplitude. However, the results depend onthe choice of excitation-dependent system parameter. Likewise, k23 would decreaseexponentially with increasing excitation amplitudes; as a result, the peak magnitudeof energy dissipation would decrease with increasing displacement amplitude. Simi-larly, c12 would decrease with increasing excitation amplitudes, and the energydissipation peak frequency would increase and be less sharp. One should be rathercareful with the conclusions that may be drawn here. These tell us how one excita-tion-dependent parameter behaves. For example, we see that c23 or k23 would haveto decrease in an exponential manner. However, it is quite conceivable that both ofthese parameters may simultaneously depend on the excitation amplitude. Thisissue should be pursued in future studies after additional experimental results areavailable.
7. Results based on gearbox simulation model
Finally, we employ the gear rattle simulation model of Fig. 1 and study the e�ectof clutch dynamics. Rattle phenomenon associated with the clearance nonlinearity
C.L. Gaillard, R. Singh /Applied Acoustics 60 (2000) 399±424 419

Table 2
Gearbox simulation results for the single harmonic torque input. Rattle is observed in all cases except those noted
Clutch model Relative displacement amplitude
(deg) between ¯ywheel and clutch hub
System energy dissipation �d
(Nmrad) over a time period (1 s)
Relative gear acceleration (m/s2)
(maximum value only)
25 Hz 50 Hz 75 Hz 100 Hz 25 Hz 50 Hz 75 Hz 100 Hz 25 Hz 50 Hz 75 Hz 100 Hz
Dynamic model A 0.1175 0.1230 0.0820 0.0843 0.27 0.576 0.560 0.789 0.058 0.265 0.089 0.090
Dynamic model D 0.0870 0.0649 0.0360 0.0290 0.209 0.315 0.264 0.283 0.021 0.061 0
no rattle
0
no rattle
Static model 0.1569 0.2684 0.2434 0.4153 0.32 1.06 1.44 3.206 0.100 0.185 0.353 0.200
420
C.L.Gailla
rd,R.Singh/Applied
Acoustics
60(2000)399±424

Fig. 12. Study of amplitude dependence for parameter k23 of model D.
C.L. Gaillard, R. Singh /Applied Acoustics 60 (2000) 399±424 421
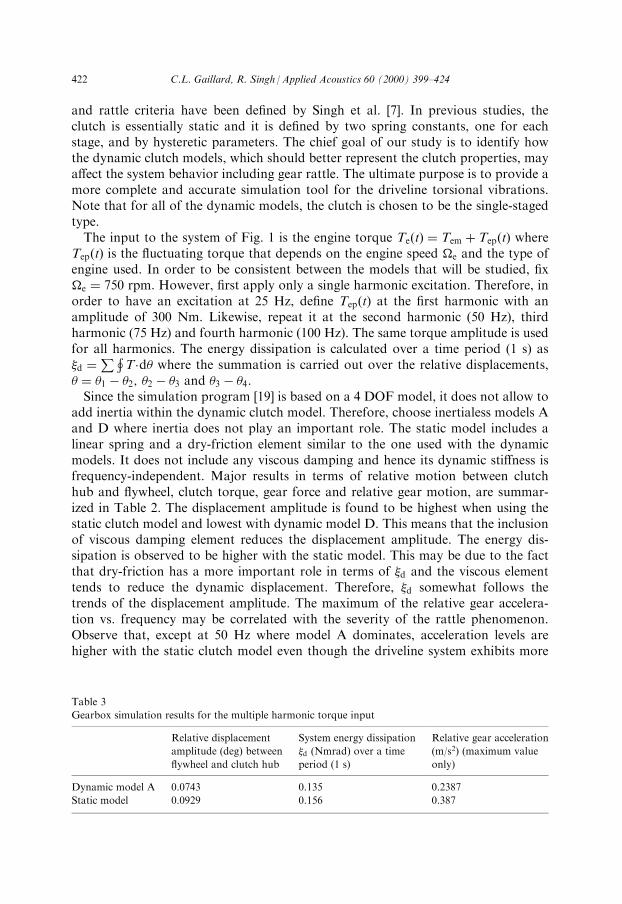
and rattle criteria have been de®ned by Singh et al. [7]. In previous studies, theclutch is essentially static and it is de®ned by two spring constants, one for eachstage, and by hysteretic parameters. The chief goal of our study is to identify howthe dynamic clutch models, which should better represent the clutch properties, maya�ect the system behavior including gear rattle. The ultimate purpose is to provide amore complete and accurate simulation tool for the driveline torsional vibrations.Note that for all of the dynamic models, the clutch is chosen to be the single-stagedtype.The input to the system of Fig. 1 is the engine torque Te t� � � Tem � Tep t� � where
Tep t� � is the ¯uctuating torque that depends on the engine speed e and the type ofengine used. In order to be consistent between the models that will be studied, ®xe � 750 rpm. However, ®rst apply only a single harmonic excitation. Therefore, inorder to have an excitation at 25 Hz, de®ne Tep t� � at the ®rst harmonic with anamplitude of 300 Nm. Likewise, repeat it at the second harmonic (50 Hz), thirdharmonic (75 Hz) and fourth harmonic (100 Hz). The same torque amplitude is usedfor all harmonics. The energy dissipation is calculated over a time period (1 s) as�d �
P�T�d� where the summation is carried out over the relative displacements,
� � �1 ÿ �2; �2 ÿ �3 and �3 ÿ �4:Since the simulation program [19] is based on a 4 DOF model, it does not allow to
add inertia within the dynamic clutch model. Therefore, choose inertialess models Aand D where inertia does not play an important role. The static model includes alinear spring and a dry-friction element similar to the one used with the dynamicmodels. It does not include any viscous damping and hence its dynamic sti�ness isfrequency-independent. Major results in terms of relative motion between clutchhub and ¯ywheel, clutch torque, gear force and relative gear motion, are summar-ized in Table 2. The displacement amplitude is found to be highest when using thestatic clutch model and lowest with dynamic model D. This means that the inclusionof viscous damping element reduces the displacement amplitude. The energy dis-sipation is observed to be higher with the static model. This may be due to the factthat dry-friction has a more important role in terms of �d and the viscous elementtends to reduce the dynamic displacement. Therefore, �d somewhat follows thetrends of the displacement amplitude. The maximum of the relative gear accelera-tion vs. frequency may be correlated with the severity of the rattle phenomenon.Observe that, except at 50 Hz where model A dominates, acceleration levels arehigher with the static clutch model even though the driveline system exhibits more
Table 3
Gearbox simulation results for the multiple harmonic torque input
Relative displacement
amplitude (deg) between
¯ywheel and clutch hub
System energy dissipation
�d (Nmrad) over a time
period (1 s)
Relative gear acceleration
(m/s2) (maximum value
only)
Dynamic model A 0.0743 0.135 0.2387
Static model 0.0929 0.156 0.387
422 C.L. Gaillard, R. Singh /Applied Acoustics 60 (2000) 399±424

energy dissipation. Also, note that with model D, the system rattles at 25 and 50 Hz,but not at 75 and 100 Hz.In order to simulate a more realistic engine torque input, de®ne a periodic func-
tion with multiple harmonics. Simulation is run again using the static and dynamicclutch models; only model A is used for the analysis. Results are summarized inTable 3. The trends of the single harmonic torque input case are observed here.Speci®cally, relative displacement between ¯ywheel and clutch hub and energy dis-sipation are larger with the static clutch model; however the corresponding rattlelevel is higher.
8. Conclusion
Dynamic lumped parameter models of vehicle clutches are developed under theassumption that the clutch damping comes from both dry friction and viscousdamping elements. Therefore, the models may include a visco-elastic componentsuch as a Voight model, Maxwell model or modi®ed Voight models, and a dry-frictionelement based on the Coulomb model. First, the clutch is studied as a single com-ponent and dynamic sti�ness, loss factor and energy dissipation spectra are calculated.Predictions are then compared with available experimental data. Dynamic visco-elastic models with dry-friction component successfully simulate trends observed inclutch experiments and demonstrate that the dynamic properties depend on excita-tion frequency and amplitude. In particular, the shape of energy dissipation per unitamplitude with a minimum at a certain frequency [10] can be reproduced with sev-eral models. For one model it is suggested, in order to obtain correct spectrum, thatthe clutch inertia must be included. Consequently, the storage sti�ness slightlydecreases at higher frequencies, which is also observed in experimental results. Fur-ther correlation with experimental data should be carried out. For example, it issuggested that inertia might have an in¯uence on the dynamic properties. In order toverify this, it may be necessary to run new experimental tests. Also, the viscousdamping models that have been used in this study are linear. Some e�orts have beenmade to investigate nonlinearities, but additional re®nements are needed in order tofurther improve prediction capabilities. In particular, the dependence of dynamicproperties on displacement amplitude is clearly demonstrated (Fig. 12) and it wouldbe interesting to identify which parameters are responsible for this behavior and toexplain the meaning of the ``knot'' that is observed in measured or calculated spectra.Both dynamic and static models are introduced in a gearbox simulation program
that analyses gear rattle. The system energy dissipation over a ®xed time period iscomputed as well as the relative displacement amplitude between the ¯ywheel andthe clutch hub. Also the relative acceleration between gears is calculated which esti-mates the severity of the rattle phenomenon. It is observed that the system exhibitsmore energy dissipation with a static clutch model because the relative displacementis larger. However, the rattle level is lower with dynamic clutch models. Finally,experimental correlation would be of considerable help in re®ning simulation codesand in understanding various clutch dynamic phenomena.
C.L. Gaillard, R. Singh /Applied Acoustics 60 (2000) 399±424 423

Acknowledgements
The Gear Rattle Consortium sponsors (Eaton R&D, Fiat CRF, LuK, Eaton``Spicer'' Clutch, Saab and Volvo Trucks) are gratefully acknowledged for their®nancial and technical support. Thanks are extended to Dr. C. Padmanabhan fordeveloping a preliminary model and T.C. Kim for providing help.
References
[1] Shaver R. Manual transmission clutch systems AE-17. SAE 1997.
[2] Couderc P, Callenaere J, Der Hagopian J, Ferraris G, Kassai A, Borjeson Y. et al. Vehicle driveline
dynamic behaviour: experimentation and computer simulation. Journal of Sound and Vibration
1998;218(1):133±57.
[3] Ohnuma S, Yahata S, Inagawa M, Fujimoto T. Research on idling rattle of manual transmission
1985. SAE Technical Paper no. 850979.
[4] Pfei�er F, Prestl W. Rattling in gears Ð a review. I. Mech. E. Proceedings 1966; VDI Berichte 1230,
pp. 719±737.
[5] Reik W, Keck K, Schnurr M, Albers A, Maucher P. Torsional vibrations in the drive train. In: 4th
International Symposium, LuK, 1990.
[6] Szadkowski A. Mathematical model and computer simulation of idle gear rattle. SAE Technical
Paper No. 910641.
[7] Singh R, Xie H, Comparin R. Analysis of automotive neutral gear rattle. Journal of Sound and
Vibration 1989;131(2):177±96.
[8] Padmanabahn C, Rook TE, Singh R. Modeling of automotive gear rattle phenomenon: state of the
art. SAE Technical Paper No. 951316.
[9] Trochon EP. Analytical formulation of automotive drivetrain rattle problems; M.S. thesis. The Ohio
State University, 1997.
[10] Szadkowski A, Prange E, Naganathan NG. Hysteresis e�ects on driveline torsional vibrations. SAE
Technical Paper No. 951293.
[11] March JP, Powell NN. Practical applications of dynamic system modelling in powertrain & vehicle
re®nement. In: Proceedings of the International Symposium on Vehicle NVH, Korea, 1996. p. 297±
313.
[12] Keeney CS, Shih S. Prediction and control of heavy duty powertrain torsional vibration. SAE
Technical Paper No. 922481.
[13] Personal communication with CRF Fiat (Italy) 1998. Experimental results.
[14] MTS Comp. Application Note on MTS Model 217: Spinning Torsion Actuators 1998.
[15] Sawanobori T, Suehiro K. An analysis of clutch judder. SAE Technical Paper No. 951318.
[16] Lazan BJ. Damping of materials and members in structural mechanics. Oxford: Pergamon Press Ltd,
1968.
[17] Gandhi F, Chopra I. A time-domain nonlinear viscoelastic damper model. Smart Mater Struct
1996;5:517±28.
[18] Yang BD, Chu ML, Menq CH. Stick-slip-separation analysis and nonlinear sti�ness and damping
characterization of friction contacts having variable normal load. Journal of Sound and Vibration
1998;210(4):461±81.
[19] KIM TC. Rattle99J program. The Ohio State University, 1999.
424 C.L. Gaillard, R. Singh /Applied Acoustics 60 (2000) 399±424