Embed Size (px)
Citation preview

23
Chapter 2Dynamic Analysis of a Heavy Vehicle Using Lumped Parameter Model
© Science Press, Beijing and Springer-Verlag Berlin Heidelberg 2015S. Yang et al., Dynamics of Vehicle-Road Coupled System, DOI 10.1007/978-3-662-45957-7_2
The interaction between a vehicle and the road is a very complicated dynamic pro-cess, which involves many fields such as vehicle dynamics, pavement dynamics, and tribology. From the aspect of dynamics, the dynamic process between the vehicle and the road can be briefly summarized as follows: (1) when a vehicle is moving on the road surface, the random vibration excited by the uneven road profile is transferred to the vehicle body through the tires and the suspension. (2) The vehicle body vibration is transferred to the road surface through the suspension as well as the tires. The re-peated dynamic contact stresses (vertical and lateral) caused by the vehicle load may result in accumulative deformation of the road profile. (3) The changed road profile excites a new round of vibration on the vehicle once again. It is widely believed that contact stress is the main reason for road damage, especially for cracking and rutting. It should be noted that the tire and the suspension are two core transmission parts that define the relationship between the pavement and the vehicle. In this chapter, the damping of the shock absorber and the stiffness of the leaf spring are first obtained in a laboratory experiment. Through experimental data fitting and parameter identifica-tion, the nonlinear models for the shock absorbers and the leaf spring are established. Then the lumped parameter models of two-axle and three-axle vehicle systems are established and the dynamic responses are analyzed in detail.
2.1 Experimental Modeling for the Nonlinear Components in Vehicle Suspension
The shock absorber and the leaf springs are both key components of a heavy vehicle suspension. The damping and stiffness characteristics have an important influence on vehicle ride comfort and road friendliness. These parts are usually simplified as a linear model for the sake of convenience of calculation. However, the lin-ear model cannot reflect their nonlinear characteristics and thus the vehicle vibra-tion responses are distorted. So it is necessary to establish nonlinear models for the shock absorber and the leaf spring through experiments.
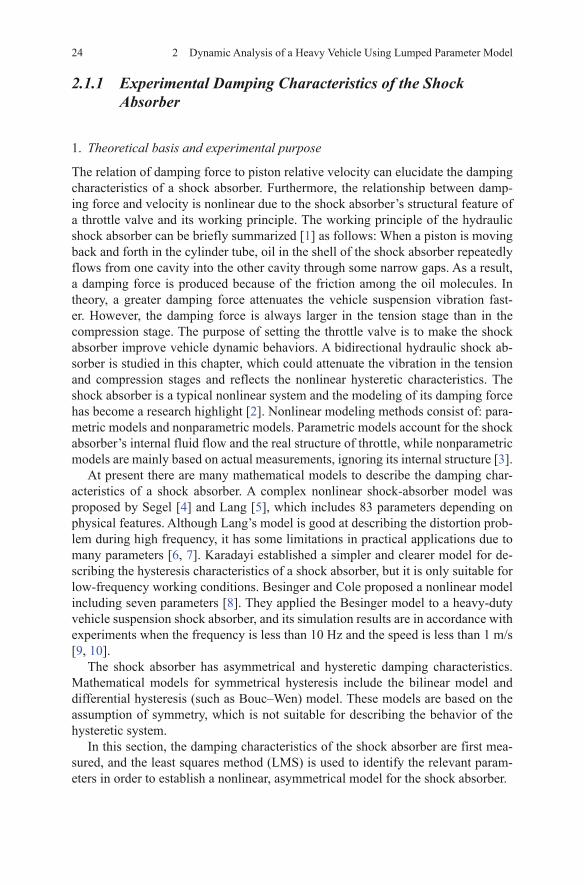
24 2 Dynamic Analysis of a Heavy Vehicle Using Lumped Parameter Model
2.1.1 Experimental Damping Characteristics of the Shock Absorber
1. Theoretical basis and experimental purpose
The relation of damping force to piston relative velocity can elucidate the damping characteristics of a shock absorber. Furthermore, the relationship between damp-ing force and velocity is nonlinear due to the shock absorber’s structural feature of a throttle valve and its working principle. The working principle of the hydraulic shock absorber can be briefly summarized [1] as follows: When a piston is moving back and forth in the cylinder tube, oil in the shell of the shock absorber repeatedly flows from one cavity into the other cavity through some narrow gaps. As a result, a damping force is produced because of the friction among the oil molecules. In theory, a greater damping force attenuates the vehicle suspension vibration fast-er. However, the damping force is always larger in the tension stage than in the compression stage. The purpose of setting the throttle valve is to make the shock absorber improve vehicle dynamic behaviors. A bidirectional hydraulic shock ab-sorber is studied in this chapter, which could attenuate the vibration in the tension and compression stages and reflects the nonlinear hysteretic characteristics. The shock absorber is a typical nonlinear system and the modeling of its damping force has become a research highlight [2]. Nonlinear modeling methods consist of: para-metric models and nonparametric models. Parametric models account for the shock absorber’s internal fluid flow and the real structure of throttle, while nonparametric models are mainly based on actual measurements, ignoring its internal structure [3].
At present there are many mathematical models to describe the damping char-acteristics of a shock absorber. A complex nonlinear shock-absorber model was proposed by Segel [4] and Lang [5], which includes 83 parameters depending on physical features. Although Lang’s model is good at describing the distortion prob-lem during high frequency, it has some limitations in practical applications due to many parameters [6, 7]. Karadayi established a simpler and clearer model for de-scribing the hysteresis characteristics of a shock absorber, but it is only suitable for low-frequency working conditions. Besinger and Cole proposed a nonlinear model including seven parameters [8]. They applied the Besinger model to a heavy-duty vehicle suspension shock absorber, and its simulation results are in accordance with experiments when the frequency is less than 10 Hz and the speed is less than 1 m/s [9, 10].
The shock absorber has asymmetrical and hysteretic damping characteristics. Mathematical models for symmetrical hysteresis include the bilinear model and differential hysteresis (such as Bouc–Wen) model. These models are based on the assumption of symmetry, which is not suitable for describing the behavior of the hysteretic system.
In this section, the damping characteristics of the shock absorber are first mea-sured, and the least squares method (LMS) is used to identify the relevant param-eters in order to establish a nonlinear, asymmetrical model for the shock absorber.

252.1 Experimental Modeling for the Nonlinear Components in Vehicle Suspension
2. Testing system and scheme
In this section, a dynamic material testing system (Hongda HT-911) is chosen to test the damping characteristics of the shock absorber. The principle of the test system is shown in Fig. 2.1 [11].
The test system includes a servo control system, a signal acquisition system, a function generator, a security monitoring system, a digital A/D interface system, a servo-valve driver, and a twin-tube hydraulic shock absorber.
The key specifications of this testing machine are: static and dynamic load rat-ing: 500 – 50,000 kN, actuator nominal displacement range: 0–25 mm, frequency range: 0.05–50 Hz.
The specific testing scheme is designed as follows:
1. Clamping the shock absorber
The lower end of the shock absorber is vertically fixed to the hydraulic servo-plat-form and the upper end is fastened to a rigid beam equipped with a force sensor. The shock absorber is adjusted along the vertical direction to ensure that the piston does not produce eccentric wear during the loading process. The initial position of the servo-console is also adjusted to ensure that the piston is located in the middle of the effective stroke.
Fig. 2.1 Test principle schematics of a shock absorber. (Reprinted from ref. [11], Copyright 2013, with kind permission from Maxwell Scientific organization)
26 2 Dynamic Analysis of a Heavy Vehicle Using Lumped Parameter Model
2. Loading the shock absorber
The excitation frequency, amplitude and sampling frequency are all input into the computer. A sinusoidal driving signal is produced through a function generator. The signal is amplified by the digital A/D interface to make the servo platform excite the shock absorber with the pre-input frequency and amplitude.
3. Collecting the data
Because the applied driving excitation is a displacement of the shock-absorber pis-ton, the displacement signal can be directly obtained as the pre-input signal. And the damping force can be recorded through the force sensor on the rigid beam.
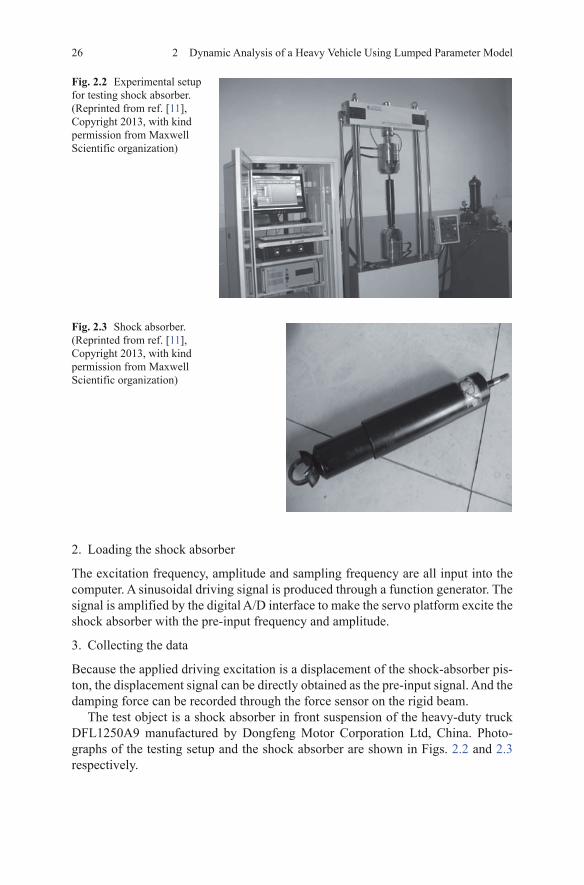
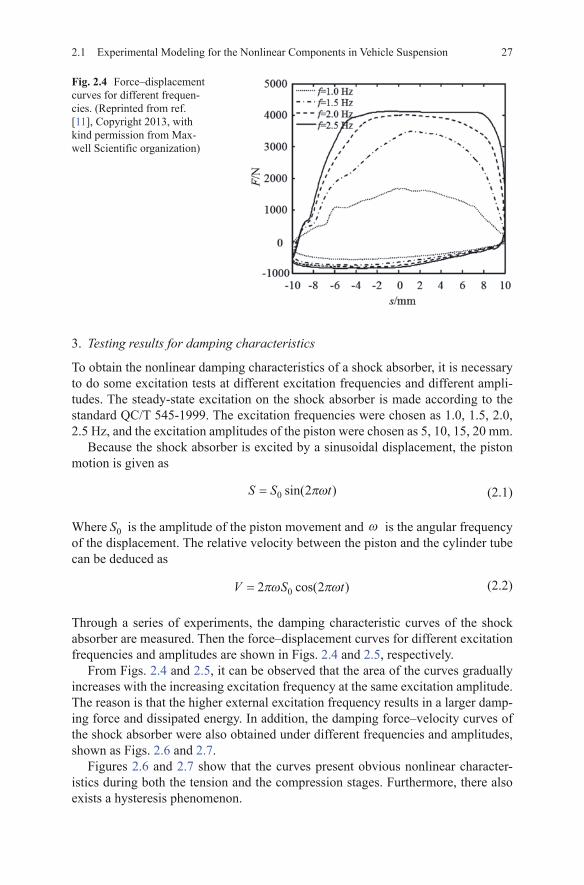
The test object is a shock absorber in front suspension of the heavy-duty truck DFL1250A9 manufactured by Dongfeng Motor Corporation Ltd, China. Photo-graphs of the testing setup and the shock absorber are shown in Figs. 2.2 and 2.3 respectively.
Fig. 2.3 Shock absorber. (Reprinted from ref. [11], Copyright 2013, with kind permission from Maxwell Scientific organization)
Fig. 2.2 Experimental setup for testing shock absorber. (Reprinted from ref. [11], Copyright 2013, with kind permission from Maxwell Scientific organization)
272.1 Experimental Modeling for the Nonlinear Components in Vehicle Suspension
3. Testing results for damping characteristics
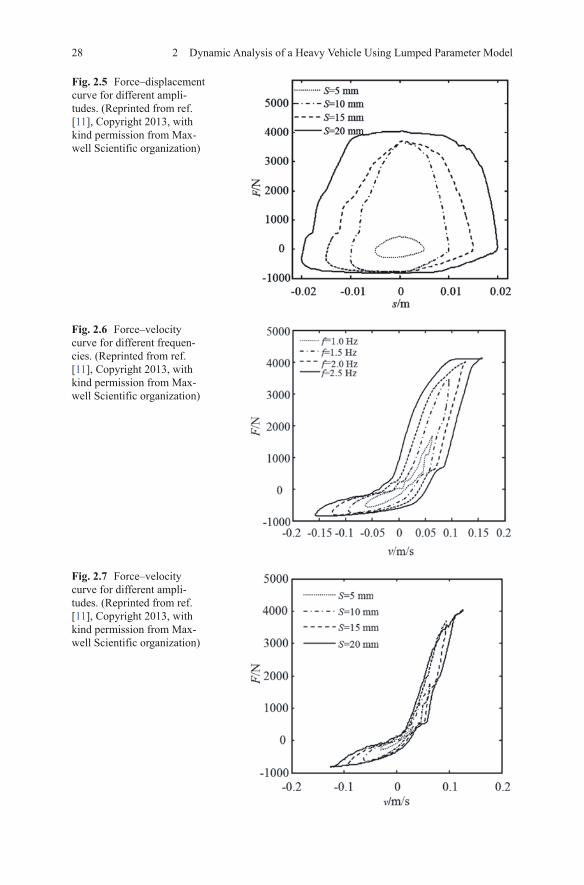
To obtain the nonlinear damping characteristics of a shock absorber, it is necessary to do some excitation tests at different excitation frequencies and different ampli-tudes. The steady-state excitation on the shock absorber is made according to the standard QC/T 545-1999. The excitation frequencies were chosen as 1.0, 1.5, 2.0, 2.5 Hz, and the excitation amplitudes of the piston were chosen as 5, 10, 15, 20 mm.
Because the shock absorber is excited by a sinusoidal displacement, the piston motion is given as
(2.1)
Where S0 is the amplitude of the piston movement and ω is the angular frequency of the displacement. The relative velocity between the piston and the cylinder tube can be deduced as
(2.2)
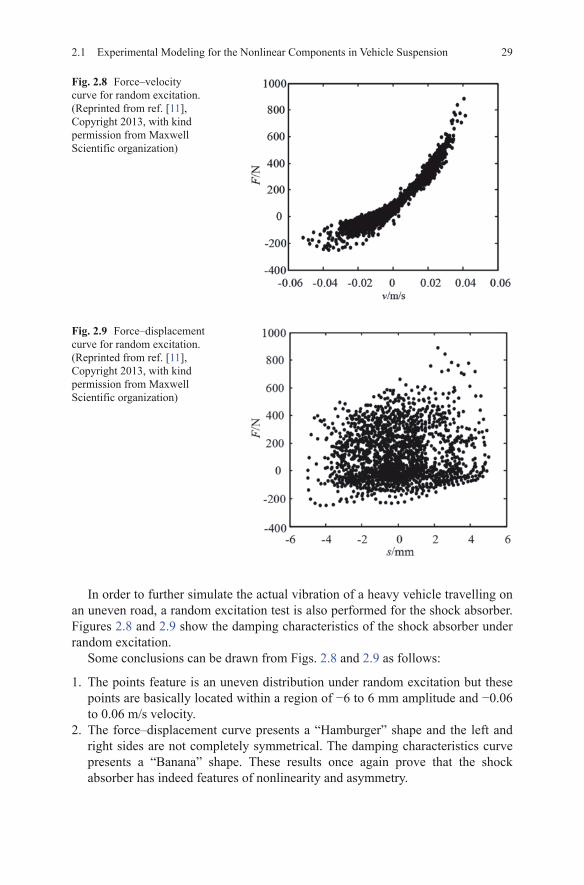
Through a series of experiments, the damping characteristic curves of the shock absorber are measured. Then the force–displacement curves for different excitation frequencies and amplitudes are shown in Figs. 2.4 and 2.5, respectively.
From Figs. 2.4 and 2.5, it can be observed that the area of the curves gradually increases with the increasing excitation frequency at the same excitation amplitude. The reason is that the higher external excitation frequency results in a larger damp-ing force and dissipated energy. In addition, the damping force–velocity curves of the shock absorber were also obtained under different frequencies and amplitudes, shown as Figs. 2.6 and 2.7.
Figures 2.6 and 2.7 show that the curves present obvious nonlinear character-istics during both the tension and the compression stages. Furthermore, there also exists a hysteresis phenomenon.
S S t= 0 2sin( )πω
V S t= 2 20πω πωcos( )
Fig. 2.4 Force–displacement curves for different frequen-cies. (Reprinted from ref. [11], Copyright 2013, with kind permission from Max-well Scientific organization)
28 2 Dynamic Analysis of a Heavy Vehicle Using Lumped Parameter Model
Fig. 2.7 Force–velocity curve for different ampli-tudes. (Reprinted from ref. [11], Copyright 2013, with kind permission from Max-well Scientific organization)
Fig. 2.6 Force–velocity curve for different frequen-cies. (Reprinted from ref. [11], Copyright 2013, with kind permission from Max-well Scientific organization)
Fig. 2.5 Force–displacement curve for different ampli-tudes. (Reprinted from ref. [11], Copyright 2013, with kind permission from Max-well Scientific organization)
292.1 Experimental Modeling for the Nonlinear Components in Vehicle Suspension
In order to further simulate the actual vibration of a heavy vehicle travelling on an uneven road, a random excitation test is also performed for the shock absorber. Figures 2.8 and 2.9 show the damping characteristics of the shock absorber under random excitation.
Some conclusions can be drawn from Figs. 2.8 and 2.9 as follows:
1. The points feature is an uneven distribution under random excitation but these points are basically located within a region of −6 to 6 mm amplitude and −0.06 to 0.06 m/s velocity.
2. The force–displacement curve presents a “Hamburger” shape and the left and right sides are not completely symmetrical. The damping characteristics curve presents a “Banana” shape. These results once again prove that the shock absorber has indeed features of nonlinearity and asymmetry.
Fig. 2.9 Force–displacement curve for random excitation. (Reprinted from ref. [11], Copyright 2013, with kind permission from Maxwell Scientific organization)
Fig. 2.8 Force–velocity curve for random excitation. (Reprinted from ref. [11], Copyright 2013, with kind permission from Maxwell Scientific organization)
30 2 Dynamic Analysis of a Heavy Vehicle Using Lumped Parameter Model
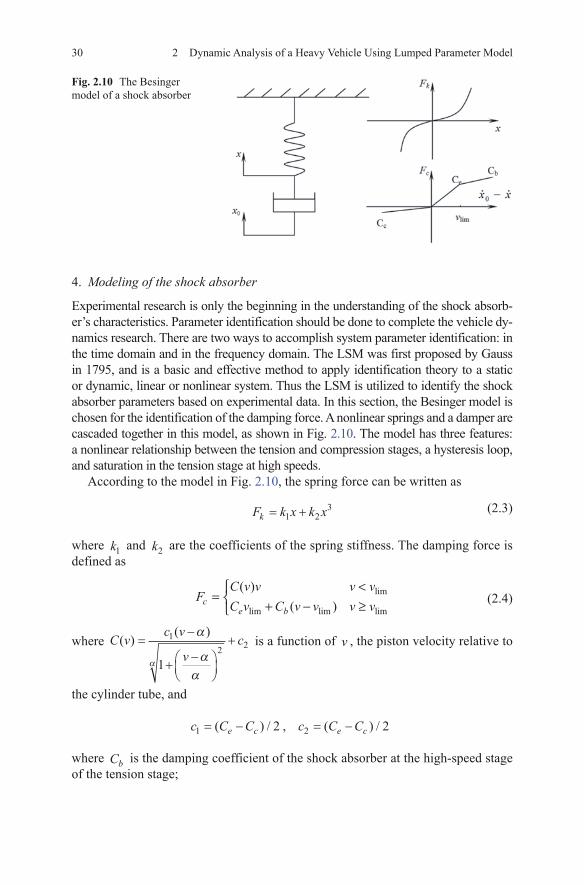
4. Modeling of the shock absorber
Experimental research is only the beginning in the understanding of the shock absorb-er’s characteristics. Parameter identification should be done to complete the vehicle dy-namics research. There are two ways to accomplish system parameter identification: in the time domain and in the frequency domain. The LSM was first proposed by Gauss in 1795, and is a basic and effective method to apply identification theory to a static or dynamic, linear or nonlinear system. Thus the LSM is utilized to identify the shock absorber parameters based on experimental data. In this section, the Besinger model is chosen for the identification of the damping force. A nonlinear springs and a damper are cascaded together in this model, as shown in Fig. 2.10. The model has three features: a nonlinear relationship between the tension and compression stages, a hysteresis loop, and saturation in the tension stage at high speeds.
According to the model in Fig. 2.10, the spring force can be written as
(2.3)
where k1 and k2 are the coefficients of the spring stiffness. The damping force is defined as
(2.4)
where C v c v
vc( )
( )=
−
+−
+12 2
1
α
αα
α
is a function of v , the piston velocity relative to
the cylinder tube, and
where Cb is the damping coefficient of the shock absorber at the high-speed stage of the tension stage;
F k x k xk = +1 23
FC v v v vC v C v v v vce b
=<
+ − ≥
( )( )
lim
lim lim lim
c C C c C Ce c e c1 22 2= − = −( ) / , ( ) /
Fig. 2.10 The Besinger model of a shock absorber

312.1 Experimental Modeling for the Nonlinear Components in Vehicle Suspension
Ce is the damping coefficient of the shock absorber at the low-speed stage of the tension stroke;
Cc is the damping coefficient of the shock absorber in the compression stage;vlim is the transition speed between the high- and low-speed stages during the
tensile stroke;α is the transition parameter between the compressive and tensile damping
forces.Figure 2.11 illustrates the trend of C(v) with the relative velocity and the transi-
tion parameter.Combining (2.3) with (2.4), the first-order differential expression of the shock
absorber damping force is
(2.5)
5. Parameter identification of the shock absorber
According to the Besinger model, when the relative velocity of the piston is rel-atively low, there is a nonlinear relationship between the damping force and the relative velocity. When the relative velocity of the piston exceeds vlim , there is a piecewise relationship between the damping force and the relative velocity. The Besinger model includes the seven parameters Cc , Ce , Cb , vlim , α , k1 , and k2 .
x
k x k xC v
x v v
k x k xC
C CC
v x v vb
e b
b
=
+( ) + <
++
−+ ≥
1 23
0
1 23
0
lim
lim lim
Fig. 2.11 Curve of the damping function C(v). (Reprinted from ref. [11], Copyright 2013, with kind permission from Maxwell Scientific organization)

32 2 Dynamic Analysis of a Heavy Vehicle Using Lumped Parameter Model
In order to identify these model parameters from the experimental data, a parameter identification process is designed as Fig. 2.12. For the Cc , Ce , Cb , α parameters of Besinger, the objective function can be defined as
(2.6)
( )
2
12 lim21
2lim lim lim1
1 min2
1
1 [ ( )] min2
N ii i i ii
i
N
i e b i ii
c vF v c v v v
vJ
F C v C v v v v
α
α
αα
-
-
- Σ - - → < - = +
Σ - - - → ≥
Fig. 2.12 Parameter identification flowchart of the shock absorber. (Reprinted from ref. [11], Copyright 2013, with kind permission from Maxwell Scientific organization)

http://www.springer.com/978-3-662-45956-0