Embed Size (px)
Citation preview

Waste Sector

i | I C C S R
AUTHORS
Indonesia Climate Change Sectoral Roadmap – ICCSR Waste Sector Adviser Prof. Armida S. Alisjahbana, Minister of National Development Planning/Head of Bappenas Editor in Chief U. Hayati Triastuti, Deputy Minister for Natural Resources and Environment, Bappenas ICCSR Coordinator Edi Effendi Tedjakusuma, Director of Environmental Affairs, Bappenas Editors Irving Mintzer, Syamsidar Thamrin, Heiner von Luepke, Dieter Brulez Synthesis Report Coordinating Author for Mitigations: Hardiv Haris Situmeang Waste Sector Report Authors: Asep Sofyan, Enri Damanhuri, Oman Abdurrahman Technical Supporting Team Chandra Panjiwibowo, Indra Ni Tua, Edi Riawan, Hendra Julianto Administrative Team Altamy Chrysan Arasty, Risnawati, Rinanda Ratna Putri, Siwi Handinah, Wahyu Hidayat, Eko Supriyatno, Rama Ruchyama, Arlette Naomi, Maika Nurhayati, Rachman

ii | I C C S R
ACKNOWLEDGMENTS The Indonesia Climate Change Sectoral Roadmap (ICCSR) is meant to provide inputs for the next five year Medium-term Development Plan (RPJM) 2010-2014, and also for the subsequent RPJMN until 2030, laying particular emphasis on the challenges emerging in the forestry, energy, industry, agriculture, transportation, coastal area, water, waste and health sectors. It is Bappenas’ policy to address these challenges and opportunities through effective development planning and coordination of the work of all line ministries, departments and agencies of the Government of Indonesia (GoI). It is a dynamic document and it will be improved based on the needs and challenges to cope with climate change in the future. Changes and adjustments to this document would be carried out through participative consultation among stakeholders. High appreciation goes to Mrs. Armida S. Alisyahbana as Minister of National Development Planning /Head of the National Development Planning Agency (Bappenas) for the support and encouragement. Besides, Mr. Paskah Suzetta as the Previous Minister of National Development Planning/ Head of Bappenas who initiated and supported the development of the ICCSR, and Deputy Minister for Natural Resources and Environment, Ministry of National Development Planning /Bappenas, who initiates and coordinates the development of the ICCSR. To the following steering committee, working groups, and stakeholders, who provide valuable comments and inputs in the development of the ICCSR Waste Sector document, their contributions are highly appreciated and acknowledged: Steering Committee (SC) Deputy of International Cooperation, Coordinating Ministry for Economy; Secretary of Minister, Coordinating Ministry for Public Welfare; Secretary General, Ministry of Public Works; Deputy of Economy, Deputy of Infrastructures, Deputy of Development Funding, Deputy of Human Resources and Culture, Deputy of Regional Development and Local Autonomy, National Development Planning Agency; and Chief of Secretariat of the National Council for Climate Change. Working Group Ministry of Environment Sulistyowati, Haneda Sri Mulyanto, Dadang Hilman, Upik S. Aslia, Agus Gunawan, Yulia Suryanti Ministry of Public Works Djoko Murjanto, Mochammad Amron, Susmono, A. Hasanudin, Djoko Mursito, Handy Legowo, Setya Budi Algamar, Agus S.K, Adelia Untari.S, Leonardo B, Desfitriana, Devina Suzan, Nur. F. K, Agung. T, Rindy Farrah, Yuke Ratnawulan, Zubaidah. K, Savitri. R

iii | I C C S R
National Development Planning Agency Sriyanti, Yahya R. Hidayat, Bambang Prihartono, Mesdin Kornelis Simarmata, Arum Atmawikarta, Montty Girianna, Wahyuningsih Darajati, Basah Hernowo, M. Donny Azdan, Budi Hidayat, Anwar Sunari, Hanan Nugroho, Jadhie Ardajat, Hadiat, Arif Haryana, Tommy Hermawan, Suwarno, Erik Amundito, Rizal Primana, Nur H. Rahayu, Pungki Widiaryanto, Maraita, Wijaya Wardhana, Rachmat Mulyanda, Andiyanto Haryoko, Petrus Sumarsono, Maliki Universities and Professionals ITB: Saut Lubis, Retno Gumilang; Asia Carbon: Architrandi Priambodo, Susy Simarangkir Grateful thanks to all staff of the Deputy Minister for Natural Resources and Environment, Ministry of National Development Planning/ Bappenas, who were always ready to assist the technical facilitation as well as in administrative matters for the finalization process of this document. The development of the ICCSR document was supported by the Deutsche Gesellschaft fuer Technische Zusammenarbeit (GTZ) through its Study and Expert Fund for Advisory Services in Climate Protection and its support is gratefully acknowledged.

iv | I C C S R
Remarks from Minister of National Development Planning/
Head of Bappenas
We have seen that with its far reaching impact on the world’s ecosystems as well as human security and development, climate change has emerged as one of the most intensely critical issues that deserve the attention of the world’s policy makers. The main theme is to avoid an increase in global average temperature that exceeds 2˚C , i.e. to reduce annual worldwide emissions more than half from the present level in 2050. We believe that this effort of course requires concerted international response – collective actions to address potential conflicting national and international policy
initiatives. As the world economy is now facing a recovery and developing countries are struggling to fulfill basic needs for their population, climate change exposes the world population to exacerbated life. It is necessary, therefore, to incorporate measures to address climate change as a core concern and mainstream in sustainable development policy agenda. We are aware that climate change has been researched and discussed the world over. Solutions have been proffered, programs funded and partnerships embraced. Despite this, carbon emissions continue to increase in both developed and developing countries. Due to its geographical location, Indonesia’s vulnerability to climate change cannot be underplayed. We stand to experience significant losses. We will face – indeed we are seeing the impact of some these issues right now- prolonged droughts, flooding and increased frequency of extreme weather events. Our rich biodiversity is at risk as well. Those who would seek to silence debate on this issue or delay in engagement to solve it are now marginalized to the edges of what science would tell us. Decades of research, analysis and emerging environmental evidence tell us that far from being merely just an environmental issue, climate change will touch every aspect of our life as a nation and as individuals. Regrettably, we cannot prevent or escape some negative impacts of climate change. We and in particular the developed world, have been warming the world for too long. We have to prepare therefore to adapt to the changes we will face and also ready, with our full energy, to mitigate against further change. We have ratified the Kyoto Protocol early and guided and contributed to world debate, through hosting the 13th
Convention of the Parties to the United Nations Framework Convention on Climate Change (UNFCCC), which generated the Bali Action Plan in 2007. Most recently, we have turned our attention to our biggest challenge yet, that of delivering on our President’s promise to reduce carbon emissions by 26% by 2020. Real action is urgent. But before action, we need to come up with careful analysis, strategic planning and priority setting.
I am delighted therefore to deliver Indonesia Climate Change Sectoral Roadmap, or I call it ICCSR, with the aim at mainstreaming climate change into our national medium-term development plan.

v | I C C S R
The ICCSR outlines our strategic vision that places particular emphasis on the challenges emerging in the forestry, energy, industry, transport, agriculture, coastal areas, water, waste and health sectors. The content of the roadmap has been formulated through a rigorius analysis. We have undertaken vulnerability assessments, prioritized actions including capacity-building and response strategies, completed by associated financial assessments and sought to develop a coherent plan that could be supported by line Ministries and relevant strategic partners and donors. I launched ICCSR to you and I invite for your commitment support and partnership in joining us in realising priorities for climate-resilient sustainable development while protecting our population from further vulnerability.
Minister for National Development Planning/ Head of National Development Planning Agency
Prof. Armida S. Alisjahbana

vi | I C C S R
Remarks from Deputy Minister for Natural Resources and
Environment, Bappenas
To be a part of the solution to global climate change, the government of Indonesia has endorsed a commitment to reduce the country’s GHG emission by 26%, within ten years and with national resources, benchmarked to the emission level from a business as usual and, up to 41% emission reductions can be achieved with international support to our mitigation efforts. The top two sectors that contribute to the country’s emissions are forestry and energy sector, mainly emissions from deforestation and by power plants, which is in part due to the fuel used,
i.e., oil and coal, and part of our high energy intensity. With a unique set of geographical location, among countries on the Earth we are at most vulnerable to the negative impacts of climate change. Measures are needed to protect our people from the adverse effect of sea level rise, flood, greater variability of rainfall, and other predicted impacts. Unless adaptive measures are taken, prediction tells us that a large fraction of Indonesia could experience freshwater scarcity, declining crop yields, and vanishing habitats for coastal communities and ecosystem. National actions are needed both to mitigate the global climate change and to identify climate change adaptation measures. This is the ultimate objective of the Indonesia Climate Change Sectoral Roadmap, ICCSR. A set of highest priorities of the actions are to be integrated into our system of national development planning. We have therefore been working to build national concensus and understanding of climate change response options. The Indonesia Climate Change Sectoral Roadmap (ICCSR) represents our long-term commitment to emission reduction and adaptation measures and it shows our ongoing, inovative climate mitigation and adaptation programs for the decades to come.
Deputy Minister for Natural Resources and Environment National Development Planning Agency
U. Hayati Triastuti

vii | I C C S R
Table of Content AUTHORS ....................................................................................................................................................i
ACKNOWLEDGMENTS ....................................................................................................................... ii
Remarks from Minister of National Development Planning/ ............................................................ iv
Head of Bappenas ...................................................................................................................................... iv
Remarks from Deputy Minister for Natural Resources and Environment, Bappenas ................... vi
Table of Content ....................................................................................................................................... vii
List of Table ................................................................................................................................................ ix
List of Figure ............................................................................................................................................... x
List of Acronyms, Abbreviations, and Units ........................................................................................ vii
CHAPTER 1 INTRODUCTION ....................................................................................................... 1
1.1 Background and Objective .............................................................................................................. 1
1.2 Reporting Methodology ................................................................................................................... 2
1.2.1 Analysis ................................................................................................................................. 2
1.2.2 Stakeholders’ Participation Process .................................................................................. 3
1.2.3 Reporting Systematics ........................................................................................................ 3
CHAPTER 2 CURRENT CONDITION AND FUTURE CHALLENGES ............................ 5
2.1 Municipal Solid Waste Source Condition ..................................................................................... 6
2.2 Transportation Condition ................................................................................................................ 9
2.3 Waste Processing Condition ......................................................................................................... 10
2.4 Reduce, Reuse, Recycle (3R) Condition ...................................................................................... 13
2.5 Policies and Laws ............................................................................................................................ 14
2.6 Future Challenges of Waste Management .................................................................................. 15
CHAPTER 3 MITIGATION POTENTIAL IN WASTE SECTOR ......................................... 17
3.1 Calculation Method ........................................................................................................................ 17
3.2 Utilization of CH4 from Landfill into Electrical Energy .......................................................... 20
CHAPTER 4 POTENTIAL MITIGATION SCENARIO AND STRATEGIC ISSUES OF
CLIMATE CHANGE IN WASTE SECTOR .................................................................................... 22
4.1 Greenhouse Gas Mitigation Scenario of Waste Sector ............................................................. 22
4.2 Greenhouse Gas Mitigation Scenario in Urban Area ................................................................ 23
4.3 Greenhouse Gas Mitigation Scenario in Rural Area ................................................................. 30
4.4 Calculation Result of GHGs Scenario for Mitigation on Waste Sector ................................. 33
4.5 Calculation of Abatement Cost .................................................................................................... 43

viii | I C C S R
CHAPTER 5 INTEGRATION OF MITIGATION POLICIES INTO WASTE SECTOR
PLANNING 47
5.1 Alternative Formulation of Mitigation Policies based on the Funding difference ............... 47
5.2 Strategic Issues of Climate Change in Waste Sector ................................................................. 67
5.2.1 Data Inventory and Planning Group ................................................................................. 68
5.2.2 Regulationand Policy Group ............................................................................................... 68
5.2.3 Implementation Group ........................................................................................................ 69
5.2.4 Capacity Building Group ..................................................................................................... 70
REFERENCES ......................................................................................................................................... 71
APPENDIX A .......................................................................................................................................... 73

ix | I C C S R
List of Table Table 2.1 Waste Management Condition in Indonesia in 2005 ......................................................... 11
Table 3.1 Emission Factor for Each Activity of Waste Management ............................................... 18
Table 3.2 Cost for Each Activity of Waste Management ................................................................... 19
Table 4.1 Comparison Matrix of GHG Emission Mitigation Scenario from Waste Sector in
Indonesia for Urban Areas. ..................................................................................................................... 39
Table 4.2 Comparison Matrix of GHGs Emission Mitigation Scenario from Waste Sector in
Indonesia for Rural Areas. ....................................................................................................................... 42
Table 5.1 Assumptions used in Alternative 1 (BAU) .......................................................................... 49
Table 5.2 Assumptions recapitulation in Alternative 1 (BAU) .......................................................... 49
Table 5.3 Assumptions used in alternative 2 (Law-Based, Maximum funding) .............................. 50
Table 5.4 Assumptions recapitulation in Alternative 2 (Law-Based, Maximum Funding) ............ 51
Table 5.5 Assumptions used in alternative 3 (Optimistic) .................................................................. 52
Table 5.6 Assumptions recapitulation in Alternative 3 (Optimistic Funding) ................................. 53
Table 5.7 Assumptions used in Policy Alternative 4 (Moderate funding) ........................................ 54
Table 5.8 Assumptions recapitulation in Alternative 4 (Moderate Funding) ................................... 55
Table 5.9 Assumptions used in alternative 5 (Pessimistic funding) ................................................... 56
Table 5.10 Assumptions recapitulation in Alternative 5 (Pessimistic Funding) .............................. 57
Table 5.11 Mitigation Action Matrix of Alternative Policies (based on the difference in the
amounts of funding) ................................................................................................................................. 60

x | I C C S R
List of Figure
Figure 2.1 Prediction of urban and rural population in Indonesia until 2030 ................................... 6
Figure 2.2 Prediction of solid waste generation percapita until 2030 ................................................ 6
Figure 2.3 Prediction of solid waste generation until 2030 ................................................................... 7
Figure 2.4 Distribution map of waste generation in Indonesia in 2010 ............................................. 8
Figure 2.5 Distribution map of waste generation in Indonesia in 2030 ............................................. 8
Figure 2.6 Solid waste management condition in Indonesia in 2005 ................................................ 9
Figure 2.7 Prediction of solid waste that is collected and transported by local government ....... 10
Figure 2.8 Solid waste processing in urban and rural in Indonesia in 2005 ..................................... 12
Figure 2.9 Solid waste processing that is managed by community in 2005 ...................................... 12
Figure 4.1 Urban waste generation per capita in Source Reduction Scenario ................................ 24
Figure 4.2 Waste generation in Source Reduction Scenario compared with BAU ........................ 25
Figure 4.3 Projection of % waste processing by Local Government in 3R and Composting
Scenario in Urban areas ........................................................................................................................... 26
Figure 4.4 Projection of % waste processing by Local Community in 3R and Composting
Scenario in Urban areas ........................................................................................................................... 26
Figure 4.5 Projection of % waste processing by Local Government in SL+CL Scenario in
Urban areas ................................................................................................................................................ 27
Figure 4.6 Projection of % waste processing by Local Community in SL+CL Scenario in Urban
areas ............................................................................................................................................................ 28
Figure 4.7 Projection of % waste processing by Local Government in SL+LFG Scenario in
Urban areas ................................................................................................................................................ 29
Figure 4.8 Projection of % waste processing by Local Community in SL+LFG Scenario in Urban
areas ............................................................................................................................................................ 29
Figure 4.9 Projection of % waste processing by Local Government in BAU Scenario in Rural 30
Figure 4.10 Projection of % waste processing by Local Community in BAU Scenario in Rural 31
Figure 4.11 Projection of waste generation percapita in Source Reduction Scenario in Rural
compared with BAU ................................................................................................................................. 32
Figure 4.12 Projection of waste generation in Source Reduction Scenario in Rural compared
with BAU ................................................................................................................................................... 32
Figure 4.13 GHG emissions (in Gg CO2 eq) in urban areas for every scenario ............................. 34
Figure 4.14 GHG emissions (in Gg CO2 eq) in rural areas for every scenario .............................. 35
Figure 4.15 GHG emission reduction (in Gg CO2 eq) in urban areas for every scenario ............ 36

xi | I C C S R
Figure 4.16 GHG emission reduction (in Gg CO2 eq) in rural areas for every scenario .............. 36
Figure 4.17 Waste Management cost in urban areas for every scenario ........................................... 37
Figure 4.18 Mitigation cost (Scenario Cost - BAU Cost) in urban areas for every scenario ......... 37
Figure 4.19 Waste Management cost in rural areas for every scenario ............................................. 38
Figure 4.20 Mitigation cost (Scenario Cost - BAU Cost) in rural areas for every scenario ........... 38
Figure 4.21 Calculation of NPV for Emision Reductions (in tons CO2 eq) for each scenario in
urban areas ................................................................................................................................................. 43
Figure 4.22 Calculation of NPV for Emision Reductions (in tons CO2 eq) for each scenario in
rural areas ................................................................................................................................................... 44
Figure 4.23 Calculation of NPV for Mitigation Costs (in USD) for each scenario in urban areas 44
Figure 4.24 Calculation of NPV for Mitigation Costs (in USD) for each scenario in rural areas . 45
Figure 4.25 Abatement Costs for each scenario in urban areas (in USD/ton) ................................ 45
Figure 4.26 Abatement Costs for each scenario in rural areas (in USD/ton) .................................. 46
Figure 5.1 GHG emissions (in tons CO2 eq) for each alternative compared to Alternative 1
(BAU) .......................................................................................................................................................... 58
Figure 5.2 GHG emission reductions (in tons CO2 eq) compared to Alternative 1 (BAU) ......... 59
Figure 5.3 Mitigations cost for each scenario compared to Alternative 1 (BAU) ........................... 59

vii | I C C S R
List of Acronyms, Abbreviations, and Units BL Baseline scenario cap capita CDM clean development mechanism CER certified emission reduction CH4 methane CL controlled landfill CO carbon monoxide CO2CO
carbon dioxide 2
DOC degradable organic carbon eq carbon dioxide equivalent
DOCF degradable organic carbon dissimilated EF emission factor eq equivalent g gram Gg gigagram GHG greenhouse gas Gt gigatonne H2H2O water
hydrogen
ha hectare IPCC Intergovernmental Panel on Climate Change k methane generation rate constant kg kilogram kt kilotonne kWh kilowatt-hour L litre L0
LFG landfill gas methane generation potential
m metre m3 cubic metre MCF methane conversion factor Mt megatonnes MSW municipal solid waste Mt megatonne mV millivolt MW megawatt N nitrogen N2 nitrogen gas NA not applicable N/A not available N2O nitrous oxide O2 oxygen OD open dumping OECD Organisation for Economic Co-operation and Development ppb part per billion ppbv part per billion by volume ppm part per million

viii | I C C S R
SL sanitary landfill SO2 sulphur dioxide SOx sulphur oxides t tonne t-km tonne-kilometre TWh terrawatt-hour UNFCCC United Nations Framework Convention on Climate Change

1 | I C C S R
CHAPTER 1 INTRODUCTION
1.1 Background and Objective
As efforts to climate change mitigation on national level, Indonesia has implemented the
following steps:
• Government of Indonesia has ratified United Nations Framework of Climate Change Convention
(UNFCCC) through Act No. 6, in1994
• Government of Indonesia has ratified Kyoto Protocol through Act No. 17, in 2004.
• On November 26th
• Indonesia was the host of UN’s 13
2007, the Ministry of Environment has compiled Rencana Aksi Nasional
Perubahan Iklim (RAN-PI) as a commitment to greenhouse gas and climate change mitigation. th Conference of Parties (COP) in Global Warming in Bali
on December 3rd-14th
• According to the speech of President Susilo Bambang Yudhoyono, the Government of
Indonesia has committed to reduce greenhouse gases targeting a reduction of 26% in 2020
(including Landuse, Landuse Change and Forestry). With the right mixture of domestic
policies and international support, the Government of Indonesia is confident that
greenhouse gas emissions can be reduced by as much as 41% [
2007.
SBY, 2009]. A presidential
decree, stipulating this commitment, had been prepared in January 2010.
• In September 2009, the National Development Planning Agency (Bappenas) has launched
Indonesia’s Climate Change Trust Fund [ICCTF, 2009], as a financing mechanism to bridge
international architecture for climate change in an efficient, transparent, and
accountable
manner.
In general greenhouse gas (GHG) emissions from waste occur during the incineration and open
burning of waste, wastewater treatment and discharge, biological treatment of solid waste and
from solid waste disposal. In Indonesia the major source of greenhouse gas emissions among the
mentioned sources is the disposal and open burning of solid waste. Approximately 42.76
megatonnes of solid waste will be produced in Indonesia in 2010 and hence a signicant amount
of GHG equivalents, especially methane (CH4) emitted. CH4 emissions occur in managed and
unmanaged landfills from anaerobic degradation of organic material. They cannot be controlled,
because final waste disposal technology has not been applied yet and open dumping is still
common practice. Currently there are about 400 landfills (open dumping) in Indonesia, which

2 | I C C S R
are managed by the local governments. At national level the local governments are supported by
the Ministry of Public Works with technical assistant, regulation and quality control of solid
waste management, while environmental aspects are supported and controlled by the Ministry of
Environment.
This chapter of the Climate Change Sectoral Roadmap, the Waste Sector Roadmap, attempts to
be a facts-based assessment of emissions reduction potential in the Indonesian waste sector,
medium (2020) and long term (2030) stating cost estimates for each of the described reduction
opportunities. The purpose is to give direction for the mitigation of GHG emissions from
domestic solid waste disposal and open burning, as well as integrating these mitigation measures
into development planning to build up a sustainable national waste sector management.
In this Waste Sector Roadmap, mitigation options will be discussed for GHG emissions from
domestic solid waste only, because (1) they are the major source of GHG emissions from the
waste sector, and (2) the management of solid waste seems to be more advanced than the
management of wastewater etc. and yet ready to implement GHG emissions mitigation measures
in both short and long term. The detailed objectives of this Waste Sector Roadmap are:
• To estimate Indonesia’s potential GHG emissions resulting from domestic solid waste to
year 2030;
• To estimate the size of GHG emissions mitigation potential from domestic solid waste as
a contribution to Indonesia’s national commitments to reduce GHG emissions;
• To incorporate the waste sector’s emissions reduction efforts into the national economic
development plans;
• To position solid waste management as a priority for action in the short and medium-
terms; and
• To identify technologies and programs required to support activities that can reduce
GHG emissions from solid waste disposal and open burning.
1.2 Reporting Methodology
1.2.1 Analysis Analysis in the formulation of the Climate Change Sectoral Roadmap for the waste sector was
conducted in the following way:

3 | I C C S R
a) Collect and review documents related to the Indonsian waste sector from the Ministry of
Public Works, the State Ministry of Environment, the National Development Planning
Agency and the Agency for the Assessment and Application of Technology (BPPT) such
as Synthesis Report for Indonesia's Technology Need Assessment on Climate Change Mitigation
(Agency for the Assessment and Application of Technology - GTZ, March 2009).
b) Conduct a literature review and a scientific basis study of the impact of domestic waste
on climate change, e.g. by reviewing the document of 2006 IPCC Guideline.
c) Estimate the amount of solid waste generated in Indonesia and derive the GHG
emissions originating from domestic solid waste.
d) Build GHG emissions scenarios for different GHG emissions mitigation options.
e) On the base of these GHG emissions scenarios develop a mitigation program for the
Indonesian waste sector within the mentioned boundaries.
1.2.2 Stakeholders’ Participation Process
• Consultation and discussion conducted with the officials, researchers, and experts in the
relevant agencies, especially the National Development Planning Agency, Ministry of Public
Works, and Ministry of Environment.
Participation of stakeholders during the process of preparing this Waste Sector Roadmap could
be achieved in several ways, including:
• Implementation of Forum Group Discussion (FGD), Pre-FGD, and coordination meeting
with the Ministry of Public Works and related agencies, which have been conducted both in
Bappenas and in the Ministry of Public Works. This FGD also discussed cross-sectoral issues.
1.2.3 Reporting Systematics
This Waste Sector Roadmap is divided into 5 chapters with the following systematics:
• Chapter 1 discusses background and objective of the Waste Sector Roadmap
• Chapter 2 discusses the condition of waste management in Indonesia
• Chapter 3 discusses the calculation methodology of greenhouse gases from landfills and its
potential in Indonesia, as well as various assumptions used in the calculation.
• Chapter 4 discusses various scenarios for the mitigation of GHG emissions from landfills. In
order to elucidate the most effective and efficient scenario, the abatement costs of the
scenarios are compared.
• Chapter 5 discusses various solid waste management policy alternatives based on cost
assumptions of the Government of Indonesia (GoI). These alternatives differ in their

4 | I C C S R
assumptions about the implementaion of laws and regulations for GHG emissions mitigation
and the costs, the GOI has to calculate for these programs. The discussion will focus on
different issues than the discussion in Chapter 4, which concentrated on various mitigation
technologies. In addition, Chapter 5 also discusses mid- and long-term programs as a result
of FGDs with related sectors, especially the Ministry of Public Works.

5 | I C C S R
CHAPTER 2 CURRENT CONDITION AND FUTURE CHALLENGES
Post-consumer waste is one of the contributors to global greenhouse gas (GHG) emissions with
the largest amount of waste generated methane (CH4
) originationg from landfills. There are
about 400 landfills in Indonesia, which are all open dump sites. Solid waste management services
in Indonesia are authorized by local governments to encompass collection, transportation,
treatment and final disposal of waste. Eventhough currently the dominant final disposal option is
still open dumping, which causes many environmental and social problem, most of the local
governments have attempted to improve their waste management in an environmentally and
socially satisfactory manner using the most economical means available. Solid waste management
follows Act No. 18 of 2008 on Waste Management.
Setting a baseline for GHG emissions from domestic solid waste is an essential step for assessing
potential GHG emissions mitigation scenarios and actions. A baseline serves as the reference
period, which the future change in the amount GHG emissions under different scenarios is
estimated from. The choice of the baseline period often depends on the availability of required
data. This Waste Sector Roadmap uses the year 2005 as the baseline year, because the available
dataset for this year is more comprehensive than for other years.
The baseline condition of waste management in Indonesia in 2005 can be divided into (1) waste
source condition, (2) waste transportation condition, (3) waste processing condition, (4) reduce,
reuse, recycle (3R) condition, and (5) policies and laws.

6 | I C C S R
Figure 2.1 Prediction of urban and rural population in Indonesia until 2030
2.1 Municipal Solid Waste Source Condition
In 2005 Indonesia’s population counted 218.8 million inhabitants (BPS, 2006). The level of waste
generation was estimated to be around 0.6 kg/capita/day for urban areas and 0.3 kg/capita/day
for rural areas, resulting in a total amunt of 33.5 Mt of solid waste in 2005. As described in figure
2.2, solid waste generation in Indonesia will continue to increase in such way, that in 2030 it will
reach a level of 1,2 kg/capita/day for urban areas and 0.55 kg/capita/day for urban area.
Figure 2.2 Prediction of solid waste generation percapita until 2030
-
50,000,000
100,000,000
150,000,000
200,000,000
250,000,000
300,000,000
2005 2010 2015 2020 2025 2030
Popu
latio
n (p
eopl
e)
YearUrban population Rural Population Total Population
0.00
0.20
0.40
0.60
0.80
1.00
1.20
1.40
2005 2010 2015 2020 2025 2030
Kg/C
apita
/day
i
YearUrban Waste Generation Percapita Rural Waste Generation Percapita
7 | I C C S R
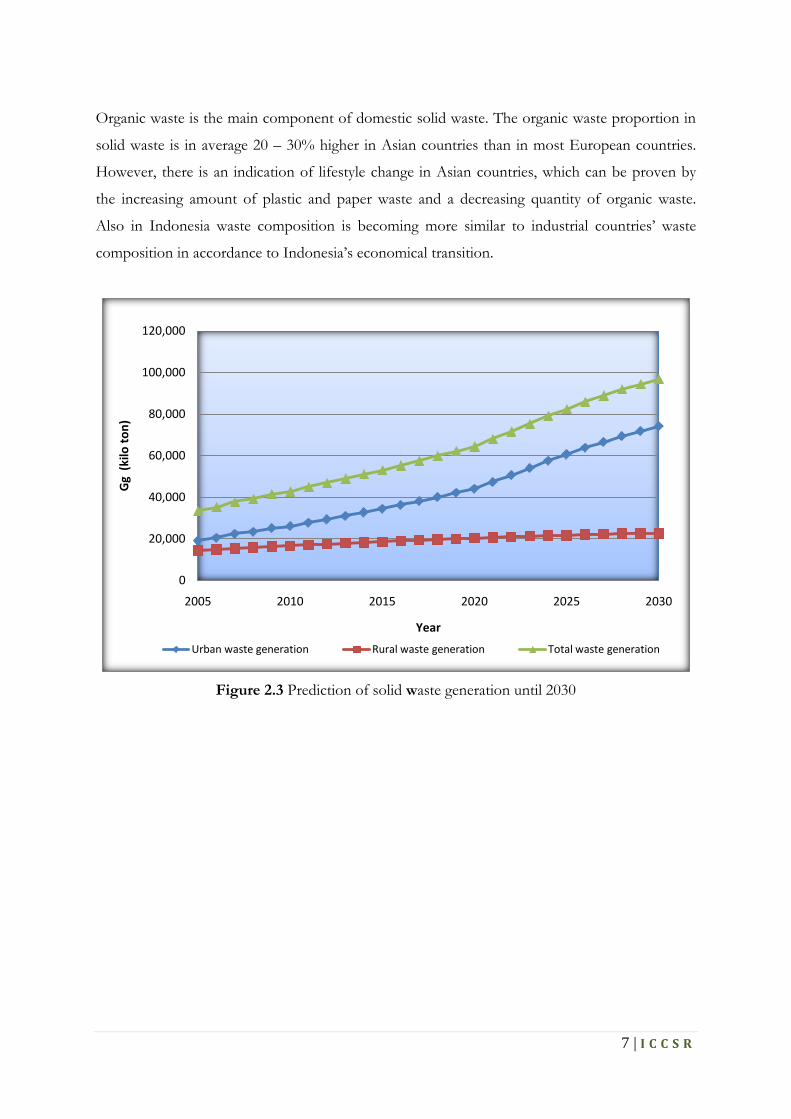
Organic waste is the main component of domestic solid waste. The organic waste proportion in
solid waste is in average 20 – 30% higher in Asian countries than in most European countries.
However, there is an indication of lifestyle change in Asian countries, which can be proven by
the increasing amount of plastic and paper waste and a decreasing quantity of organic waste.
Also in Indonesia waste composition is becoming more similar to industrial countries’ waste
composition in accordance to Indonesia’s economical transition.
Figure 2.3 Prediction of solid waste generation until 2030
0
20,000
40,000
60,000
80,000
100,000
120,000
2005 2010 2015 2020 2025 2030
Gg
(kilo
ton)
Year
Urban waste generation Rural waste generation Total waste generation

8 | I C C S R
Figure 2.4 and 2.5 show distribution maps of predicted waste generation in Indonesia in 2010
and 2030.
Figure 2.4 Distribution map of waste generation in Indonesia in 2010
As cities grow economically, business activity and consumption patterns drive up solid waste
quantities. Figures 2.5 shows that the high volume solid waste area is not only Java island but
also Sumatera Island.
Figure 2.5 Distribution map of waste generation in Indonesia in 2030

9 | I C C S R
2.2 Transportation Condition
In Indonesia solid waste originates to approximately 50% in urban areas and 20% in rural areas.
It is transported collectively by the Department of Local Solid Waste Management or other
appropriate institutions, which are obligated by the local government (figure 2.6). Solid waste,
which is not transported by the government, has to be self-managed by the community.
Figure 2.6 Solid waste management condition in Indonesia in 2005
According to the governments’ work plans, solid waste transportation is predicted to increase
continuously from year to year (figure 2.7). In general, the duty of the Department of Local Solid
Waste Management is to collect solid waste from the polling station to the landfill, while urban
communities organize the waste collection from the source (house) to the polling station
independently. Such solid waste collection system has many weaknesses, since a large amount of
solid waste is not collected and instead thrown away into the drainage channels or rivers. In
addition, there are still technical problems associated with equipments and supplies in waste
management. Generally, cities and regencies in Indonesia are short of vehicles for collecting and
transporting solid waste.
50%50%
Waste Management (2005) Urban
Collective by Government
Collective by Community
20%
80%
Waste Management (2005)Rural
Collective by Government
Collective by Community

10 | I C C S R
Another important aspect is the source of finance of domestic solid waste management. In most
Indonesian cities finance originates from the governments’ development budget, in some cases
from offshore loans or from solid waste retribution charged to the waste generator. Since the
economic crisis, the income through retribution in the city has been decreasing along with the
slackening economic capacity of society/community. It is indeed hard to raise the retribution,
considering the still limited economic capacity of society/community.
Figure 2.7 Prediction of solid waste that is collected and transported by local government
2.3 Waste Processing Condition
The solid waste transported collectively by the local government is not entirely processed in
landfills as described in Figure 2.8. The conditions of waste management in Indonesia are
represented in Table 2-1 in detail. Based on the research data of the area of Bandung Raya and
other secondary information from several places in Indonesia in 2005 (see Tabel 2-1), we found
that 1
1 The % unit used in this report is to the weight of wet waste. Usually, the shown data by waste manager in Indonesia is based on % to wet volumewhich will have different density.
(a) 3% of anorganic solid waste was recovered, (b) 1% of organic solid waste was
composted, (c) 0.5% of solid waste was burned at the polling stations and landfills; 45% ended
up in covering open dumping; and 0.5% in covering landfill equipped with a sanitary biogas
capture.
0%
10%
20%
30%
40%
50%
60%
70%
80%
90%
100%
2005 2010 2015 2020 2025 2030% w
aste
gen
erat
ion
tran
spor
t by
gove
rnm
ent
YearUrban Transport Rural Transport

11 | I C C S R
Some waste are managed by the community themselves with a composition of anorganic solid
waste-recovery of 3%, organic solid waste composting of 1%, solid waste burning of 5%, and
waste disposal into river channels and open dumping anywhere were 1% and 40%, respectively.
Only around 20% of solid waste in rural areas were transported collectively by Governmental
organizations, while the remaining 80% were managed by the community.
Table 2.1 Waste Management Condition in Indonesia in 2005 Year 2005 Unit Urban Rural
Waste generated kg/capita/day 0.6 0.3 Increase of waste generated per year % 2.5 1 Waste transported collectively (Office) % 50 20 Increase of collectively transported waste per year % 2.5 1 Waste managed collectively in 2005:
• Inorganic recovered % 3 0.5 • Organic composted % 1 5.5 • Burned at polling stations and landfills % 0.5 10 • Covering open dumping % 45 4 • Covering sanitary landfill + biogas
capture % 0.5 0 Total % 50 20 Waste managed by community in 2005: Inorganic recovered % 3 5 Organic composted % 1 40 Burned % 5 20 Discharged into river channels % 1 5 Hide anywhere % 40 10 Total % 50 80
Source: Damanhuri, 2008
Figure 2.8 shows that of the 50% of solid waste collected and transported in the urban areas,
45% were processed in open dump sites, and the rest were recovered, composted, burned, and
processed at the sanitary landfills. In addition, from the total of 20% of solid waste collected and
transported in rural areas, 10% were burned at the polling stations and landfills and some were
covered at open dump sites, composted, etc.,

12 | I C C S R
Figure 2.8 Solid waste processing in urban and rural in Indonesia in 2005
Untransported solid waste is self-managed by the community. Figure 2.9 shows the solid waste
management activity by urban and rural community.
Figure 2.9 Solid waste processing that is managed by community in 2005
The system of domestic solid waste management in Indonesia largely depends on the existence
of landfills. Landfills are becoming one of the important issues in handling solid waste due to
limited number of landfills in Indonesia, which are correctly maintained. Most of the solid waste
transported to the landfill is processed through open dumping, and it was estimated that only
10% is processed through a better system, such as controlled landfill. There is only a little
protection or monitoring of ground water, so that alkali from waste can contaminate
groundwater or the river. In addition, landfill foundations are usually rocky, gravel, or swamp
3% 1%0.5%
45%
0.5%
Solid Waste Processing by Government for Urban (Total 50%)
Recovery Anorganik (3R)Composting
Open Burning at polling stations and/or landfills Open Dumping
0.5%5.5%
10%
4% 0%
Solid Waste Processing by Government for Rural (Total 20%)
Recovery Anorganik (3R)
Composting
Open Burning at polling stations and/or landfills Open Dumping
3% 1%5%
1%
40%
Solid Waste Processing by Community for Urban (Total 50%)
Recovery Anorganik (3R)Composting
Open Burning
Discharges into the river channels Dump anywhere
5%
40%20%
5%10%
Solid Waste Processing by Community for Rural (Total 80%)
Recovery Anorganik (3R)Composting
Open Burning
Discharges into the river channels Dump anywhere

13 | I C C S R
areas, which are very sensitive to water pollution (Damanhuri, 2008). Other problems are, the
refusal of community/society to change their land into landfills.
The main reason that open dumping continues to be applied in Indonesia is due to the limited
operational budget. It is very difficult to cover areas with a layer of soil and compact the waste
layer by layer with such limited operational budgets. Open dumping causes many problems such
as smoke, odor and flies. In many cases, industrial waste and hospital pathogens waste are also
found in the landfill, although in 1995 the GoI set the 3B criteria for waste landfills. Because of
the mixing of the waste from various different criterias, the danger posed by landfill is growing.
Another serious problem solid waste management using landfills is, that landfills are still being
used when they are already “full”. Attention is only risen, when the landfill began to fall or in
case of operation interferences.
2.4 Reduce, Reuse, Recycle (3R) Condition
In general, Solid Waste Management (SWM) in Indonesia is very dependent on the presence of
landfills/ TPA. Community treatment centers (3R – reduce, reuse, recycle) were formed as a
solution to reduce the amount of solid waste. Conditions of reduction, reuse and recycling in
2005 are described in Figure 2.8, Figure 2.9, and Table 2.1 Through the method of 3R, a number
of big cities such as Jakarta, Bandung, Surabaya, Medan, Semarang and Yogyakarta began to
develop a mid-level processing by composting and recycling anorganic waste to reduce the
amount of solid waste disposed at the landfill.. Mid-level processing was built as an attempt to
reduce the amount of solid waste disposed to the landfill. Until now, there are only a few mid-
level processings, which are professionally managed in Indonesia. One problem was the high
price of compost produced compared to the price of inorganic fertilizer, approximately Rp 300 -
400/kg. Indonesia's anorganic waste is usually recycled by a scavenger. From the economic
aspect of this sector, it provides significant economical benefit.
Waste compositions are a very determining factor in composting and recycling. There are two
main waste compositions, namely wet waste or organic waste (food waste, etc) that could be
composted and dry waste or anorganic waste (plastic, paper, glass, etc.) that could be recycled. It
should be noted that some of the waste components in Indonesia, such as newspapers, used
book/magazines, used clothes, and used electronic components are not treated as solid waste

14 | I C C S R
and disposed to the trashcan. These components are usually collected by the informal sector
such as a junkman or a scavenger and could be sold to the waste trader/ junk storage.
Other important aspects of domestic solid waste management are recycling and the role of the
informal sector. In Indonesia, there are two main recycle flows. First, the collectors (informal
sector), who collect recycleable material from the generators of the solid waste. Second, these
collected materials are separated and recycled by the municipality after the MSW collection. The
describes cycle involves housewives, cleaning service, and scavangers.
In developing countries, the level of recycling of anorganic waste is high enough to have a
positive impact on the economy of the community. Although the methods employed for sorting
and separating solid waste in these countries are still considered inappropriate, the existing
methods do not only provide an income stream to hundreds of thousand of people involved in
the informal sector, but also ensure that a far greater amount of solid waste is recycled.
2.5 Policies and Laws
Waste management is implemented to improve public health, prevent environmental pollution,
and protect clean water resources as stated in Act No. 32/2009 on Environmental Management.
Waste management is specifically regulated in Act No. 18/2008 of Waste Management. Prior to
the issue of Act No.18/2008, the Government Regulation (PP) No.16/2005 has determined the
protection of water resources due to pollution from landfill as one of the subjects to focus on.
PP No. 16/2005 is a regulation under the Law of Water Resources (Act No.7/2004).
Act No.18/2008 of Waste Management outlined that solid waste management has to support the
(a) reduction and (b) waste handling approach. Solid waste reduction is based on the principle of
(a) restriction (reduce), reuse, and recycle of waste, which is known as the 3R approach. It can be
defined as upstream waste management starting from the effort of how to generate only a
minimum amount of waste (reduce) in daily activities. An example for such effort is the change
of industrial employment patterns and product packaging, which aims to produce and use
environment-friendly packaging with as little volume as possible so that its waste can easily be
recycled and handled further. They also outlined to not remain hands-off on the packaging,
namely in the form of extended producers responsibility (EPR). To achieve a full implementatin
of the 3R approach the involvement of all stakeholders is needed. Solid Waste or the remaining
residue has to be further treated professionally through placement, collection, removal,
transportation and processing. Residues of these activities must be removed from the

15 | I C C S R
environment safely. Therefore, Act No. 18/2008 outlined that within the first 5 years after its
issuing, open dumping has to be replaced by a better method, such as controlled landfill and
sanitary landfill. Furthermore, the law emphasized the strengthening of institutional capability
and improvement of stakeholders’ relation to work together as partners in managing and
improving investment source.
Government's eagerness to promote the 3R approach has significantly advanced in Regulation
21/PRT/M/2006 of the Minister of Public Works. The regulation focuses on 3R as the national
strategy and outlines that until 2014, solid waste should be reduced up to 20%2
1. Support the achievement of service level of solid waste up to 60% in 2010.
. Targets of the
national strategy on waste management sector are as follows:
2. Support the reduction of solid waste through 3R method up to 20% in 2014.
3. Improve the quality of landfill:
- Controlled Landfill (CLF) for small and medium-sized cities.
- Sanitary Landfill (SLF) for large and metropolitan cities.
- Termination of Open Dumping.
4. Support implementation at institutional level and regional cooperation.
Currently, the implementation of domestic solid waste management at the regional level is
conducted by local government regulation, which affects the organization of domestic solid
waste management, retribution fee and transportation cost of solid waste from the source to the
landfill. The biggest obstacle lies in the lack of legal power that causes weak implementation of
these regulations.
2.6 Future Challenges of Waste Management
Population and economic growth will increase the amount of solid waste volume. The
projections of generated domestic solid waste for urban and rural areas from 2005 to 2030 are
shown in Figure 2-1. This increasing amount of waste volume will become a serious
environmental problem if not well handled. Thus, a good municipal waste management is a
must.
2 The unit used is % wet volume. The use of this unit needs careful interpretation such as in claiming the success of recycle efforts. Example: 1 empty plastic bottle truck has an equivalent volume with 1 wet waste truck, but possess different weight.

16 | I C C S R
Domestic Waste Management (Municipal Solid Waste/MSW) in Indonesia still faces many
problems, such as:
• The majority of cities does not have a consistent plan (master plan) in handling solid
waste because the Domestic Solid Waste Management still has not formalized;
• Domestic Waste Management has not been given sufficient priority in local government
regulation, which limits the budget for solid waste management;
• Facilities for collecting, transportating, and storing the solid waste are limited;
• Most of the landfills (TPA) are open dump sites, which cause water pollution, air
pollution, and odor.
To solve the mentioned problems, (regency) district/city government as the head of waste
management in the (regency) district/city level should increase their waste management
revitalitation program. This includes the perfection of waste management institutions, related
laws, waste management technical issues, supporting infrastructure, financing and investment
alternatives, along with increasing the society’s awareness, culture, and knowledge on better
waste management.
In addition, two main policies had at least to be implemented for future waste management. The
first policy states, that domestic solid waste should be reduced (reduce) as much as possible, used
again (reuse), and recycled (recycle) (3R) before transported to the landfill. The second policy
outlined, that domestic waste management should involve public participation. These two
policies are used as the basic principles of solid waste management as described in the laws of
solid waste. Meanwhile, the active participation of community in the 3R solid waste program
starts from the household level by changing the habit of society to be cleaner and healthier.
Industrial participation will be achieved by implemented EPR (Extended Producer
Responsibility) as the principle for waste producers and hazardous waste importers.
Future waste management must start to calculate waste conversion to energy resources. In
addition, waste management must be integrated in climate change mitigation activities thus
creating a co-benefit. Creating a more evironmentally friendly regional development includes
focused programs or increased budget, both a challenge for every (regency) district/city.

17 | I C C S R
CHAPTER 3 MITIGATION POTENTIAL IN WASTE SECTOR
3.1 Calculation Method
Greenhouse gases from the waste sector are generally emitted in the form of methane (CH4),
produced from landfill and Carbondioxide (CO2) generated from open burning. Emissions from
open burning are more difficult to control than emission from landfills. In addition, the burning
and recycling of paper and plastic causes nitrous oxide (N2O) emissions, which equal the 310fold
of the impact of the same amount of CO2
.
Based on the descriptions in chapter 2, in Indonesia waste is mostly composted, burned, thrown
into rivers, covered, disposed in landfills, etc. The amount of greenhouse gases produced varies
depending, which of the mentioned methods is applied. For open burning and natural
decomposition, the proportion of waste that can be broken down biologically in Indonesia is
higher than in other countries. In the combustion process an aerobic reaction occurs, which
produces CO2 without the release of greenhouse gases into the air. CH4
emissions from landfills
are the result of anaerobic decomposition of organic components in waste. Waste in landfills
decomposes slowly and decomposition can last a few decades.
Prior to the development of mitigation strategies for the waste sector, CH4 emissions generated
from the waste need to be calculated. Basically, emissions from landfills are calculated using the
IPCC First Order Decay (FOD) model (IPCC, 2006) with the basic equation for estimating CH4
CH
emissions are as follows:
4 year t (Gg/year) = ∑x [A ● k ● MSW(t) (x) ● MSW(F) (x) ● Lo (x)) ●e-k(t-x)
Where
]
CH4 = CH4
t = year of inventory
generated in year t, Gg/year
x = years for which input data should be added
A = (1-e-k
MSW
)/k ; normalisation factor which corrects the summation
T
MSW
(x) = Total municipal solid waste (MSW) generated in year x (Gg/yr)
F
Lo(x) = Methane generation potential (Gg CH
(x) = Fraction of MSW disposed at SWDS in year x
4
/Gg waste)

18 | I C C S R
The rate of CH4
emissions from landfills is very specific to certain areas, because its formation
depends on the type of waste disposed of, elements of humidity, age of the waste and local
climatic conditions. So for this report local research data were used as found in Table 3.1.
Table 3.1 Emission Factor for Each Activity of Waste Management
Activity Emission Factor Note 1. Waste Transportation
Source: Alisan Smith et al, 2001: Waste management options and climate change, AEA Techno-Environment
0.71 kg CO2 The average trip to the landfill = 50 km per 2.5 ton of waste
/km
2. Waste Degradation in Landfill (Calculated based on waste condition in Indonesia: water content, organic carbon level, etc.)
75 kg CH4 Emission of good sanitary landfill can be captured until
90%.
/ton of waste 210 kg CO2
3. Waste Combustion
/ton of waste
Paper & Organic 0.05 kg N2 NO/ton 2O = 310 CO2
and CH4 = 22 CO2, later reffered to as CO2
Plastic
eq.
2237 kg CO2
0.05 N
/ton
2
Activity O/ton
Emission Factor Note 4. Composting 670 kg CO2 /ton of waste 5. Recycle Paper and
Organic 0.05 kg N2
NO/ton
2O = 310 CO2 and CH4 = 22 CO2, later reffered to as CO2
eq.
Plastic 2237 kg CO2
0.05 N
/ton
2
6. Other waste management O/ton
Waste dumped anywhere and thrown into the river
750 kg CO2/ton of waste
Source: Damanhuri, 2008
To calculate the cost of mitigation, a unit price has to be assumed for operating and waste
management unit maintenance as shown in Table 3.2. Emission reduction means the difference
between the GHG emissions generated under the BAU (Business as usual) scenario and a
specific GHG emission reduction scenario. GHG emissions are presented in units of CO2

19 | I C C S R
equivalent (CO2 eq). The formulas for calculating the emission reduction in CO2 eq are as
follows:
The calculation formula of GHG Emissions Reduction (in CO2 eq):
Emissions Reduction (in CO2
eq) = BAU emission – ERS emission
BAU = Business as Usual
ERS = Emission Reduction Scenario
Table 3.2 Cost for Each Activity of Waste Management
Activity Operating and maintenance cost per Ton Waste
(Indonesia Rupiah) (Approx. in USD Dollar)
1. Transportation 50,000.00 – 60,000.00 5 – 6
2. Sanitary Landfill 60,000.00 – 100,000.00 6 – 10
3. Open Dumping 10,000.00 – 20,000.00 1 – 2
4. Controlled Landfill 30,000.00 – 50,000.00 3 – 5
5. Composting 15,000.00 – 20,000.00 1.5 – 2
Source: Damanhuri, 2008
The development of mitigation strategies of greenhouse gas emissions can take place after the
process of identifying the amount of emissions and its source is completed. In general, mitigation
of greenhouse gas emission can be achieved easiest in a place where the solid waste is
accumulated (collected) in high volume and under anaerobic condition. For solid waste, landfill is
the source of the most significant greenhouse gas release. In addition, GHG emissions are also
produced from the transportation of solid waste to the landfill, plastic and paper combustion, as
well as composting.
In 2015, referring to the MDG’s target, 80% of solid waste in urban areas and 50% in rural areas
should be transported to the landfill. This can only be achieved via a realistic management plan,
which has to be implemented in the future.
Mitigation costs are calculated based on investment costs and operational/maintenance costs.
The interest rate used is 12%/ year. ACERS (Emissions Reduction Scenario Abatement Costs)
are calculated based on (Situmeang, 2009):

20 | I C C S R
ACERS = [NPV (Total Cost of BAU ) –NPV (Total Costs of ERS )][NPV (Total Emission of BAU ) –NPV (Total Emission ERS )]
ACERS = Abatement Costs of the Emissions Reduction Scenario
NPV = Net Present Value
ERS = Emission Reduction Scenario
3.2 Utilization of CH4 from Landfill into Electrical Energy In developed countries, landfills have become a promising source of electrical energy through
the utilization of CH4
that is emitted. The potential to capture CH₄ and utilize it for electricity
generation has never been exploited in Indonesia. However, research has been done within the
CDM framework showing that the main obstacle to the implementation of these types of
projects is the associated investment cost, which deems them not profitable.
The selling price of electricity from landfills is regulated by the Ministry of Energy and Mineral
Resources Regulation No. 31 of 2009, specifically determining the ‘Power Purchase Price by PT
PLN (Persero) from Power Plants Using Small and Medium Scale Renewable Energy or Excess
Power’. According to the regulation, PT PLN (Persero) must purchase electricity from power
plants using small and medium scale renewable energy technologies with a capacity of up to 10
MW of electricity or excess power from state owned enterprises, local owned enterprises, private
enterprises, cooperatives, and governmental organizations to strengthen the system of local
electricity supply.
The power purchase price is determined as follows:
a. USD 656/kWh x F, if interconnected on High Voltage;
b. USD 1.004/kWh x F, if interconnected on Low Voltage.
F is the location-incentive factor in accordance with the purchase of electricity by PT PLN
(Persero) with the following scale:
a. Java and Bali region, F = 1;
b. Sumatra and Sulawesi region, F = 1.2;
c. Kalimantan, West Nusa Tenggara and East Nusa Tenggara region, F = 1.3;
d. Maluku and Papua region, F = 1.5.

21 | I C C S R
This Waste Sector Roadmap states that sanitary landfill can be supported by flaring facilities,
while electricity generated from CH4 can be sold to PT PLN. In order to make national scale
estimates, the assumptions listed in Table 3.3 are made. These are largely based on a feasibility
study conducted on the use of CH4
for electrical energy generation in Makassar, Indonesia
(World Bank, 2007).
Table 3.3 Landfill planing assumptions, flarring installation, and power generation Parameter Assumptions
Landfill:
1 unit of Landfill capacity
1 unit of Sanitary Landfill investment cost
1 unit of Controlled Landfill investment cost
1 unit of Open Dumping investment cost
Flaring and Power:
CH4
Electricity efficiency
efficiency
Generated Electricity (per Unit Sanitary Landfill)
Flaring and Electricity facilities investment cost
300 Gg/year
4.000.000 USD
3.000.000 USD
2.000.000 USD
50%
99%
1 MWh
6.000.000 USD

22 | I C C S R
CHAPTER 4 POTENTIAL MITIGATION SCENARIO AND STRATEGIC
ISSUES OF CLIMATE CHANGE IN WASTE SECTOR 4.1 Greenhouse Gas Mitigation Scenario of Waste Sector
Potential mitigation scenario projections of the waste sector were made based on Waste
Management Act No. 18/2008. As stated in the Act, the efforts to reduce greenhouse gas
emissions in the waste sector are to consist of LFG (landflill gas) recovery either from open
dumping land which is to be converted to sanitary landfill, or from making new sanitary landfills.
Efforts to terminate open dumping and build sanitary landfill sites with LFG recovery
technology in its place are in agreement with the Act, which states that all open dumping sites
should be closed by 2015. Other actions to reduce greenhouse gas emissions are to consist of
efforts to reduce solid waste at its source (household), TPS (Polling station), or TPA (-Landfill)
using 3R (reduce, reuse, recycle) techniques. The final proccesing of solid waste in urban and
rural areas in Indonesia is to differ. The emphasis in urban areas will be on landfill technology
(open dumping, controlled landfill, sanitary landfill), while rural areas will predominantly rely on
composting technology. The 3R method can be applied in both urban and rural areas.
The greenhouse gas mitigation scenarios based on Act No. 18/2008, are as follows:
Urban Area:
1) Open Dumping scenario
This scenario is the closest description to the current situation, which is the use of open
dumping as the final proccessing method of solid waste in urban areas.
2) Waste Reduction at the source scenario
This scenario applies waste reduction efforts at the source, such as conduct campaigns and
capacity building aimed at the reduction of plastic, paper, packaging, etc.
3) 3R and Composting scenario
This scenario applies 3R (reduce, reuse, recycle) in TPS and TPA, and also does composting.
4) Conversion to Sanitary Landfill without LFG installation scenario
This scenario converts open dumping to sanitary and controlled landfill without the use of
CH4
5) Conversion to Sanitary Landfill and the installation of LFG scenario
gas from landfill for electricity generation.

23 | I C C S R
This scenario converts open dumping to sanitary landfills and makes use of CH4
gas from
landfill for electricity generation.
Rural Area:
1) Burned and dumped anywhere scenario
This scenario is the closest description to the current situation in rural areas, which consists of
waste being burned and dumped anywhere.
2) Waste reduction at the source scenario
This scenario applies reducing the amount of solid waste at the source.
3) 3R and Composting scenario
This scenario makes use of a combination of composting technology and 3R.
4.2 Greenhouse Gas Mitigation Scenario in Urban Area
The assumptions made for the projection of GHG mitigation scenarios in urban areas are as
follows:
1) Business as Usual (BAU) or Open Dumping scenario
This is the projected BAU condition in accordance with population and economic growth. As
explained in chapter 2, the open dumping scenario is the current situation in Indonesia. The
assumptions made are the following:
• Transportation of solid waste by the government
•
had a 50% service level in 2005. The
level of service is expected to increase 1 - 2% per year from 2005 to 80% in 2020, and to
90% in 2030.
• The proportion of solid waste generation that is self-managed by the community and
dumped anywhere was 25% in 2005 and is expected to decrease to 5% in 2030. Solid
waste dumped in rivers was 1% in 2005 and is expected to decrease to 0.2% in 2030.
Solid waste burning (combustion) in urban areas is collectively transported and is
expected to increase from 0.5% in 2005 to 0.8% in 2020, and 0.9% in 2030. Self-
managed solid waste burning on the other hand, is expected to decrease from 24% in
2005 to 4.8% in 2030.
•
The proportion of solid waste that is openly dumped in urban areas was about 49.5% in
2005, and is expected to increase to 89.10% in 2030.

24 | I C C S R
2) Waste Reduction at the Source Scenario
• The assumptions made in relation to the transportation of solid waste are similar to those
made for the BAU scenario: service levels were at 50% in 2005 and are expected to
increase 1 – 2% per year from 2005 to 2020, reaching 80% in 2020 and 90% in 2030.
•
Solid waste generation of urban areas increased from 0.6 kg/ person/ day in 2005 to 1.1
kg/person/day in 2030. Increases in solid waste generation can be minimized by
reducing domestic solid waste at its source so that solid waste generation per capita
decreases by 20% compared to BAU. Reducing the amount of solid waste signifies a
reduction of GHG emissions generated by its disposal.
Figure 4.1 Urban waste generation per capita in Source Reduction Scenario
0.00
0.20
0.40
0.60
0.80
1.00
1.20
1.40
2005 2010 2015 2020 2025 2030
Kg/C
apita
/day
i
Urban waste generation (Open Dumping (BAU) ) Urban waste generation (Source Reduction)

25 | I C C S R
Figure 4.2 Waste generation in Source Reduction Scenario compared with BAU
3) 3R and Composing scenario
• The assumptions made in relation to the transportation of solid waste are similar to
those made for the BAU scenario: service levels were at 50% in 2005 and are
expected to increase 1 – 2% per year from 2005 to 2020, reaching 80% in 2020 and
90% in 2030.
• The proportion of solid waste which is collectively transported (by government) for
composting was 2.5% in the year 2005 and is expected to increase to 4.5% in 2030.
The proportion of self-managed (by local community) composted solid waste on the
other hand was 5% in 2005, and is expected to decrease to 1% in 2030.
• Collectively transported recycled plastic waste is expected to increase from 2.5% in
2005 to 4% in 2020, reaching 4.5% in 2030. The proportion of self-managed recycled
plastic waste was 5% in 2005 and is expected to decrease to 1% in 2030.
• Collectively transported recycled paper waste is expected to increase from 2.5% in
2005 to 4.5% in 2030, while self-managed recycled paper waste is expected to
decrease from 5% in 2005 to 1% in 2030.
0
10,000
20,000
30,000
40,000
50,000
60,000
70,000
80,000
2005 2010 2015 2020 2025 2030
Gg
(kilo
ton)
Urban waste generation (Open Dumping (BAU) ) Urban waste generation (Source Reduction)

26 | I C C S R
Figure 4.3 Projection of % waste processing by Local Government in 3R and Composting
Scenario in Urban areas
Figure 4.4 Projection of % waste processing by Local Community in 3R and Composting
Scenario in Urban areas
0%
10%
20%
30%
40%
50%
60%
70%
80%
2005 2010 2015 2020 2025 2030
% W
aste
pro
cess
ing
Open Dumping (BAU) Composting Plastic RecyclingPaper Recycling Open Burning
0%
5%
10%
15%
20%
25%
30%
35%
2005 2010 2015 2020 2025 2030
% W
aste
Pro
cess
ing
Plie Anywhere Discharge to Rivers Plastic RecyclingPaper Recycling Composting Open Burning

27 | I C C S R
4) Sanitary Landfill without LFG installation
• The assumptions made in relation to the transportation of solid waste are similar to
those made for the BAU scenario: service levels were at 50% in 2005 and are
expected to increase 1 – 2% per year from 2005 to 2020, reaching 80% in 2020 and
90% in 2030.
•
•
The conversion of open dumping to sanitary landfill is expected to increase the
proportion of solid waste that is brought to sanitary landfills from 0.5% in 2005 to
2.4% in 2010, reaching 56% in 2020 and 63% in 2030.
The proportion of waste processed in controlled landfill was 4% in 2005 and is
expected to increase to 23.4% in 2020 and 26.1% in 2030.
Figure 4.5 Projection of % waste processing by Local Government in SL+CL Scenario
in Urban areas
0%
10%
20%
30%
40%
50%
60%
70%
2005 2010 2015 2020 2025 2030
% W
aste
Pro
cess
ing
Open Dumping Open Burning Sanitary Landfill Controlled Landfill

28 | I C C S R
Figure 4.6 Projection of % waste processing by Local Community in SL+CL Scenario in Urban
areas
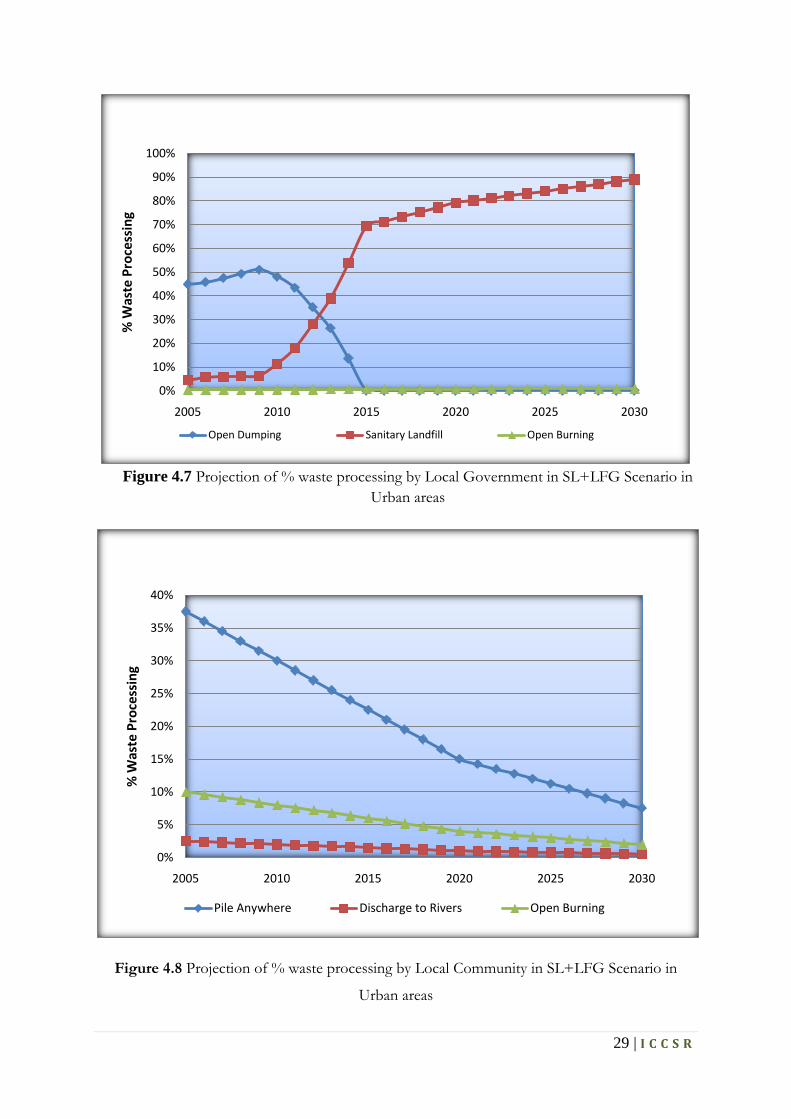
5) Sanitary Landfill with LFG Installation Scenario
• The assumptions made in relation to the transportation of solid waste are similar to
those made for BAU scenario,: service level s were at 50% in 2005 and are expected
to increase 1 – 2% per year from 2005 to 2020, reaching 80% in 2020 and 90% in
2030.
• The conversion of
•
open dumping to sanitary landfill is expected to increase the
proportion of solid waste brought to sanitary landfills from 4.5% in 2005, to 79.2%
in 2020 and 89.10% in 2030.
Sanitary landfills are equipped with LFG (Landfill Gas) capture technologies, so an
estimate on the potential revenue for each kWh generated has been made.
0%
5%
10%
15%
20%
25%
30%
35%
40%
2005 2010 2015 2020 2025 2030
% W
aste
Pro
cess
ing
Plie Anywhere Discharge to Rivers Open Burning
29 | I C C S R
Figure 4.7 Projection of % waste processing by Local Government in SL+LFG Scenario in
Urban areas
Figure 4.8 Projection of % waste processing by Local Community in SL+LFG Scenario in
Urban areas
0%
10%
20%
30%
40%
50%
60%
70%
80%
90%
100%
2005 2010 2015 2020 2025 2030
% W
aste
Pro
cess
ing
Open Dumping Sanitary Landfill Open Burning
0%
5%
10%
15%
20%
25%
30%
35%
40%
2005 2010 2015 2020 2025 2030
% W
aste
Pro
cess
ing
Pile Anywhere Discharge to Rivers Open Burning

30 | I C C S R
4.3 Greenhouse Gas Mitigation Scenario in Rural Area
1) Open Dumping and Open Burning Everywhere Scenario
•
• The proportion of self managed solid waste that is dumped anywhere was 28% in 2005
and is expected to decrease to 23.63% in 2030, while the proportion of solid waste that
is dumped into rivers was 12% in 2005 and is expected to decrease to 10.13% in 2030.
Solid waste burning (combustion) in urban areas that has been collectively transported is
expected to increase from 12% in 2005 to 19.5% in 2030, while the proportion of self-
managed solid waste burning (combustion) is expected to decrease from 40% in 2005 to
33.75% in 2030.
Figure 4.9 Projection of % waste processing by Local Government in BAU Scenario in
Rural
2) Source Reduction Scenario
•
•
The assumptions made in relation to transportation are similar to those made for the
burning and dumping anywhere scenario: solid waste burning (combustion) in urban
areas which is collectively transported is expected to increase from 12% in 2005 to 19.5%
in 2030. The proportion of self-managed solid waste burning (combustion) is expected to
decrease from 40% in 2005 to 33.75% in 2030
Rural waste generation per capita is expected to increase from 0.3 kg/capita/day in 2005
to 0.5 kg/capita/day in 2030.
0%
5%
10%
15%
20%
25%
2005 2010 2015 2020 2025 2030
% W
aste
Pro
cess
ing
Pile Anywhere Open Burning

31 | I C C S R
•
The increase of rural waste up to 0.5 kg/capita/day comes as a result of reduction efforts
(including capacity building) . Otherwise quanitites would reach 0.55 kg/capita/day as is
the case in the BAU scenario.
Figure 4.10 Projection of % waste processing by Local Community in BAU Scenario in
Rural
0%
5%
10%
15%
20%
25%
30%
35%
40%
45%
2005 2010 2015 2020 2025 2030
% W
aste
Pro
cess
ing
Plie Anywhere Discharge to Rivers Open Burning

32 | I C C S R
Figure 4.11 Projection of waste generation percapita in Source Reduction Scenario in Rural
compared with BAU
Figure 4.12 Projection of waste generation in Source Reduction Scenario in Rural compared
with BAU
0.00
0.10
0.20
0.30
0.40
0.50
0.60
2005 2010 2015 2020 2025 2030
Kg/C
apita
/day
Rural waste generation percapita (Open Dumping (BAU) )
Rural waste generation percapita (Source Reduction)
0
5,000
10,000
15,000
20,000
25,000
2005 2010 2015 2020 2025 2030
Gg
(kilo
ton)
Rural waste generation (Open Dumping (BAU) )Rural waste generation (Source Reduction)

33 | I C C S R
3) 3R and Composting
•
• The proportion ofsolid waste generation that is collectively transported for composting
was 5.5% in the year 2005 and is expected to increase to 19.3% in 2030, while self-
managed composted solid waste was 28% in 2005 and is expected to decrease to 10.5%
in 2030.
The assumptions made for transportiation are similar to those made in the burning and
dumping anywhere scenario: solid waste burning (combustion) in urban areas which is
collectively transported is expected to increase from 12% in 2005 to 19.5% in 2030. The
proportion of self-managed solid waste burning (combustion) is expected to decrease
from 40% in 2005 to 33.75% in 2030.
• The proportion of collectively transported recycled plastic waste is expected to increase
from 1% in 2005 to 3.5% in 2030, while self managed recycled plastic waste was 4% in
2005 and is expected to decrease to 1.5% in 2030.
• The proportion of collectively transported recycled paper waste is expected to increase
from 1% in 2005 to 3.5% in 2030, while self managed recycled paper waste is expected
to decrease from 4% in 2005 to 1.8% in 2030.
4.4 Calculation Result of GHGs Scenario for Mitigation on Waste Sector
Figure 4.13 shows the results of the calculation of GHG emissions from the waste sector. The
largest proportion of emissions are generated by the BAU (open dumping) scenario, followed by
the other scenarios. The reduction at the source scenario does not decrease GHG emissions
significantly due to the limited campaign activities and capacity building that are included.
Economic progress might trigger the society to continue to increase the amount of solid waste.
Reduction at the source scenario can be successful if it is supported by policies and legislation
that follow up with sanctions.
The SL + CL (conversion from open dumping to a Sanitary Landfill and Controlled Landfill)
scenario results in higher GHG emissions than the 3R (reduce, reuse, recycle) and composting
scenario due to the fact that processing of solid waste in SL and CL increases the anaerobic
process that is responsible for CH4 generation; nevertheless, its emissions are not as high as that
of the open dumping scenario. The process of aerobically composting solid waste does not

34 | I C C S R
produce CH4, however 3R activities, such as processing and recycling of plastic, do produce
emissions in the form of CO2 from the combustion process associated with recycling. The SL +
LFG scenario has the smallest proportion of emissions due to the flaring (combustion) of CH4
into CO2 and H2O, and its use of CH4
for electricity generation.
Figure 4.13 GHG emissions (in Gg CO2 eq) in urban areas for every scenario
Figure 4.14 shows GHG emissions produced by solid waste processing in rural areas. BAU
scenario emissions are the highest, while emissions from the reduction at the source scenario and
the 3R + composting scenario produces less GHG than BAU. In rural areas, composting is
recommended for the following reasons: (1) the composition of solid waste in the rural areas is
dominated by organic waste suitable for composting, (2) composting activities in rural areas will
grow rapidly because land is still widely available, (3) a market is available, as the main users of
compost is the agricultural sector and plantation farmers, (4) compost can improve soil quality,
(5) composting technology is relatively simple, so it is easy to carry out by villagers. The biggest
obstacles to using organic fertiliziser are perceived problems associated with farmers’ practice of
using chemical fertilizers. Thus, it is necessary to make farmers aware of the detrimental effect
that the use of chemical fertilizers have on the quality of the soil in the long run. Another
problem is that organic fertilizer requires a relatively long time to be produced. This problem
can be tackled by developing a special bacteria to speed up the associated process. Hence, the
development of biotechnology related to composting should be developed in line with efforts to
increase the uptake of of organic fertilizer use.
0
20,000
40,000
60,000
80,000
100,000
120,000
140,000
160,000
2010 2015 2020 2025 2030
GHG
Em
issi
on(G
g CO
2 eq
)
GHG Emission every scenario in Urban areas
Open Dumping (BAU)Source Reduction
3R + Composting
SL + CL
SL + LFG

35 | I C C S R
Figure 4.14 GHG emissions (in Gg CO2 eq) in rural areas for every scenario
Figure 4.15 and 4.16 shows GHG emission reductions from each scenario. Emission reduction is
calculated by the following formula:
Emissions Reduction = BAU’s Emissions- Scenarios’ Emissions
As shown in Figure 4.15, the largest reduction of emissions scenario in urban area is SL + LFG.
Figure 4.16 shows the reduction of GHG emissions from each scenario in the rural areas.
0
5,000
10,000
15,000
20,000
25,000
30,000
35,000
40,000
45,000
2010 2015 2020 2025 2030
GHG
Em
issi
on (G
g CO
2 eq
)
GHG Emission every scenario in Rural areas
Dumped Anywhere (BAU)
Source Reduction
3R + Composting

36 | I C C S R
Figure 4.15 GHG emission reduction (in Gg CO2
eq) in urban areas for every scenario
Figure 4.16 GHG emission reduction (in Gg CO2
eq) in rural areas for every scenario
Figure 4.17 shows the cost of waste management. Figure 4.18 shows the cost of mitigation,
namely a certain waste management costs reduced by BAU’s scenario costs.
0
10,000
20,000
30,000
40,000
50,000
60,000
70,000
2010 2015 2020 2025 2030
GHG
Em
issi
on R
educ
tion
(Gg
CO2
eq)
Emission Reduction in Urban areas
Source Reduction 3R + Composting SL + CL SL + LFG
0
2,000
4,000
6,000
8,000
10,000
12,000
2010 2015 2020 2025 2030
GHG
Em
issi
on R
educ
tion
(Gg
CO2
eq)
Emission Reduction in Rural areas
Source Reduction 3R + Composting

37 | I C C S R
Figure 4.17 Waste Management cost in urban areas for every scenario
Figure 4.18 Mitigation cost (Scenario Cost - BAU Cost) in urban areas for every scenario
0
200,000,000
400,000,000
600,000,000
800,000,000
1,000,000,000
1,200,000,000
2010 2015 2020 2025 2030
(USD
)Open Dumping (BAU) Source Reduction 3R + Composting SL + CL SL + LFG
-100,000,000
0
100,000,000
200,000,000
300,000,000
400,000,000
500,000,000
600,000,000
2010 2015 2020 2025 2030
(USD
)
Source Reduction 3R + Composting SL + CL SL + LFG

38 | I C C S R
Figure 4.19 Waste Management cost in rural areas for every scenario
Figure 4.20 Mitigation cost (Scenario Cost - BAU Cost) in rural areas for every scenario
0
50,000,000
100,000,000
150,000,000
200,000,000
250,000,000
300,000,000
350,000,000
2010 2015 2020 2025 2030
(USD
)
Dump Anywhere (BAU) Source Reduction 3R + Composting
0
50,000,000
100,000,000
150,000,000
200,000,000
250,000,000
300,000,000
350,000,000
2010 2015 2020 2025 2030
(USD
)
Source Reduction 3R + Composting

39 | I C C S R
Table 4.1 Comparison Matrix of GHG Emission Mitigation Scenario from Waste Sector in Indonesia for Urban Areas.
Scen
ario
s
Perio
d
Em
issi
on R
educ
tion
Acc
umul
atio
n
(Mt C
O2)
Tot
al C
ost o
f M
itiga
tion
(b
illio
n U
SD)
Aba
tem
ent C
ost
(USD
/t C
O2)
Em
issi
on R
educ
tion
Com
pare
d to
BA
U
(%)
Policies Required
Source
Reduction
2010 – 2020 17.73 0.13 7.61 5.12% (1) Carry out an inventory study of GHG from the waste sector
which is comprehensive and reliable, accompanied by a systematic
GHG reduction plan. (2) Apply infrastructure development policies
of source reduction regulation in solid waste, supported by applied
technology research and development with an environmental
perspective.
2010 – 2030 45.14 0.13 2.90 11.30%
3R +
Composting
2010 – 2020 143.56 0.16 1.14 37.32% (1) Carry out an inventory study of GHG from the waste sector
which is comprehensive and reliable, accompanied by a systematic
GHG reduction plan. (2) Develop and implement environmental
policies that support the principle of 3R (reduce, reuse, recycle) and
composting in waste management. (3) Develop and establish a 3R
and composting center in every city/regency in Indonesia.
2010 – 2030 211.17 0.33 1.57 35.58%
SL + CL 2010 – 2020 28.94 0.96 33.34 7.07% (1) Carry out an inventory study of GHG from the waste sector,

40 | I C C S R
Scen
ario
s
Perio
d
Em
issi
on R
educ
tion
Acc
umul
atio
n
(Mt C
O2)
Tot
al C
ost o
f M
itiga
tion
(b
illio
n U
SD)
Aba
tem
ent C
ost
(USD
/t C
O2)
Em
issi
on R
educ
tion
Com
pare
d to
BA
U
(%)
Policies Required
2010 – 2030
35.77
1.57
43.84
4.74%
which is comprehensive and reliable, accompanied by a systematic
GHG reduction plan. (2) Apply infrastructure development policies
of conversion of open dumping to sanitary and controlled landfill,
supported by applied technology research and development with an
environmental perspective. (3) Apply waste management in the TPA
(final disposal) from open dumping to controlled landfills in small
and medium-sized cities; and sanitary landfills in large and
metropolitan cities.
SL + LFG 2010 – 2020
159.18 1.49 9.35 42.28% (1) Carry out an inventory study of GHG from the waste sector,
which is comprehensive and reliable, accompanied by a systematic
GHG reduction plan. (2) Apply infrastructure development policies
of conversion from open dumping to sanitary landfill, and install
LFG electricity generators, supported by applied technology
research and development with an environmental perspective. (3)
Waste management in the TPA from open dumping to sanitary
2010 – 2030 243.67 2.27 9.33 43.46%

41 | I C C S R
Scen
ario
s
Perio
d
Em
issi
on R
educ
tion
Acc
umul
atio
n
(Mt C
O2)
Tot
al C
ost o
f M
itiga
tion
(b
illio
n U
SD)
Aba
tem
ent C
ost
(USD
/t C
O2)
Em
issi
on R
educ
tion
Com
pare
d to
BA
U
(%)
Policies Required
landfills (4) Improved methods of waste gas management (landfill
gas - LFG) through collection and combustion, as well as the
application of energy to electricity.

42 | I C C S R
Table 4.2 Comparison Matrix of GHGs Emission Mitigation Scenario from Waste Sector in Indonesia for Rural Areas.
Scen
ario
s
Perio
d
Em
issi
on R
educ
tion
Acc
umul
atio
n
(Mt C
O2)
Tot
al C
ost o
f M
itiga
tion
(b
illio
n U
SD)
Aba
tem
ent C
ost
(USD
/t C
O2)
Em
issi
on R
educ
tion
Com
pare
d to
BA
U
(%)
Policies Required
Source
Reduction
2010 – 2020 27.81 0.04 1.56 15.15% (1) Carry out an inventory study of GHG from the waste sector
which is comprehensive and reliable, accompanied by a systematic
GHG reduction plan. (2) Apply infrastructure development policies
related to source reductions in the waste sector, supported by
applied technology research and development with an
environmental perspective, (3) Apply source reduction policy
2010 – 2030 43.66 0.05 1.17 20.02%
3R +
Composting
2010 – 2020
2010 – 2030
50.40
64.14
0.81
1.23
16.10 19.23
24.76%
22.41%
(1) Carry out an inventory study of GHG from the waste sector,
which is comprehensive and reliable, accompanied by a systematic
GHG reduction plan. (2) Apply infrastructure development policies
of 3R and composting regulation, supported by applied technology
research and development with an environmental perspective. (3)
Implement the 3R principle (reduce, reuse, recycle) in waste
management. (4) Develop and establish a 3R and composting center
in every city/regency in Indonesia.

43 | I C C S R
4.5 Calculation of Abatement Cost
Mitigation costs are calculated based on investment costs and operational/maintenance costs.
The interest rate here is 12% / year. ACERS (Emissions Reduction Scenario Abatement Costs )
are calculated based on (Situmeang, 2009):
ACERS = [NPV (Total Cost of BAU ) –NPV (Total Costs of ERS )][NPV (Total Emission of BAU ) –NPV (Total Emission ERS )]
ACERS =
NPV = Net Present Value
Emissions Reduction Scenario Abatement Costs
ERS = Emission Reduction Scenario
To calculate Abatement Costs, both Mitigation Costs and Emission Reductions arecalculated
according to the NPV method; the results of the calculation are as follows:
Figure 4.21 Calculation of NPV for Emision Reductions (in tons CO2 eq) for each scenario in urban areas
0
5,000,000
10,000,000
15,000,000
20,000,000
25,000,000
30,000,000
35,000,000
40,000,000
45,000,000
50,000,000
2010 2015 2020 2025 2030
NPV
Em
issi
on R
educ
tion
(ton
CO
2 eq
)
Open Dumping (BAU) Source Reduction 3R + Composting SL + CL SL + LFG

44 | I C C S R
Figure 4.22 Calculation of NPV for Emision Reductions (in tons CO2 eq) for each scenario in rural areas
Figure 4.23 Calculation of NPV for Mitigation Costs (in USD) for each scenario in urban areas
0
5,000,000
10,000,000
15,000,000
20,000,000
25,000,000
30,000,000
2010 2015 2020 2025 2030
NPV
Em
issi
on R
educ
tion
(ton
CO
2 eq
)Dumped Anywhere (BAU) Source Reduction 3R + Composting
0
50,000,000
100,000,000
150,000,000
200,000,000
250,000,000
300,000,000
350,000,000
400,000,000
2010 2015 2020 2025 2030
NPV
Miti
gatio
n Co
st (U
SD)
Open Dumping (BAU) Source Reduction 3R + Composting SL + CL SL + LFG

45 | I C C S R
Figure 4.24 Calculation of NPV for Mitigation Costs (in USD) for each scenario in rural areas Figure 4.25 and 4.26 show the abatement costs for the different scenarios in urban and rural
areas respectively.
Figure 4.25 Abatement Costs for each scenario in urban areas (in USD/ton)
0
20,000,000
40,000,000
60,000,000
80,000,000
100,000,000
120,000,000
2010 2015 2020 2025 2030
NPV
Miti
gatio
n Co
st (U
SD)
Dumped Anywhere (BAU) Source Reduction 3R + Composting
0
2
4
6
8
10
12
14
16
18
20
2010 2015 2020 2025 2030
Abat
emen
t Cos
t (U
SD/t
on)
Open Dumping (BAU) Source Reduction 3R + Composting SL + CL SL + LFG
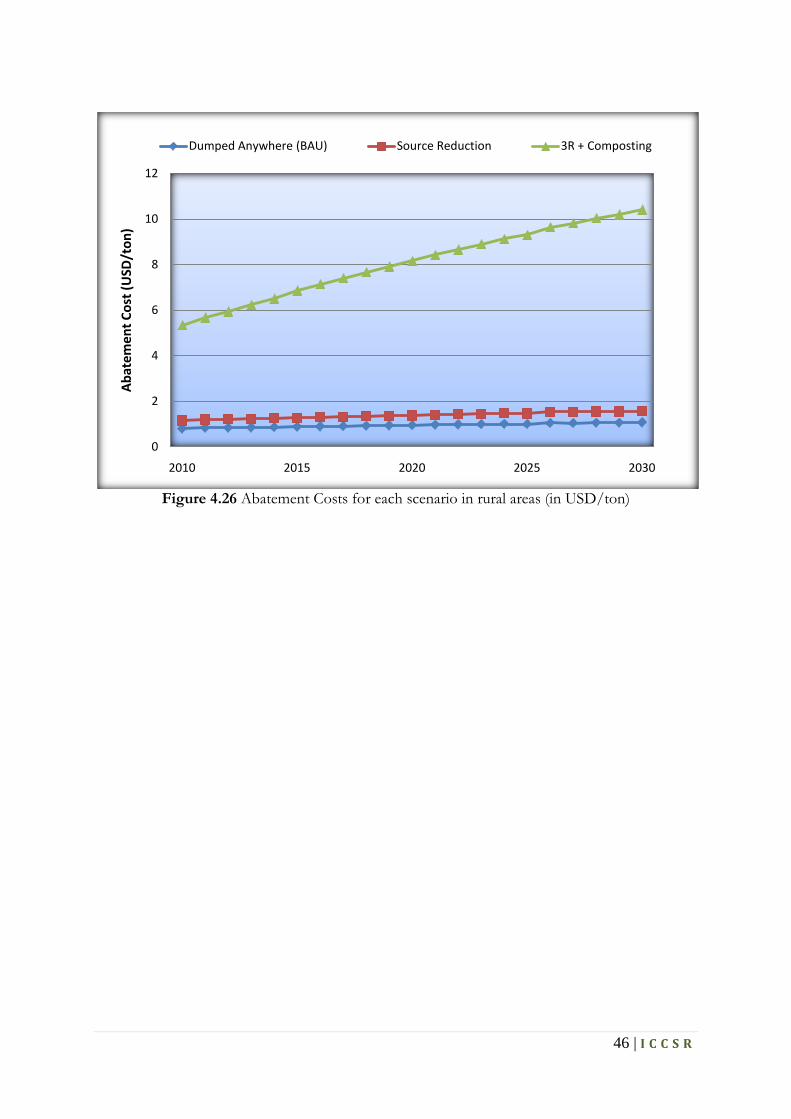
46 | I C C S R
Figure 4.26 Abatement Costs for each scenario in rural areas (in USD/ton)
0
2
4
6
8
10
12
2010 2015 2020 2025 2030
Abat
emen
t Cos
t (U
SD/t
on)
Dumped Anywhere (BAU) Source Reduction 3R + Composting

47 | I C C S R
CHAPTER 5 INTEGRATION OF MITIGATION POLICIES INTO
WASTE SECTOR PLANNING 5.1 Alternative Formulation of Mitigation Policies based on the Funding difference
In Chapter 4 the degree of efficiency of each mitigation action for greenhouse gases from the
waste sector has been presented. In solid waste management, however, detached actions auch as
only 3Ror landfills are not sufficient. Waste management is an integrated activity of various
mitigation actions and their implementation according to technical capacitiesand available
funding. Therefore chapter 5 will present several alternativewaste management policies in order
to determine the most efficient policy mix with the least abatment costs.
Against the background of operational needs of related sectors (according to Ministry of Public
Works) and the stage of development in Indonesia, the criteria for the assessment of alternative
policies are costs.
(maximum cost, optimistic, moderate, pessimistic, and minimum cost).:
1) Alternative 1 describes current practices in Indonesia (minimum funding), called BAU
(Bussiness As Usual) means that open dumping remains the widespread practice
until 2030
2) Alternative 2 is the most ideal alternative policy of achieviing the target of Act No.
18/2008, which in the year 2015 the entire open dumping have been converted to
sanitary/controlled landfill. This alternative is the maximum funding alternative, also
called as the law-based alternative.
3) Alternative 3 is less ambitious than alternative 2, so that the funding needed is also
lower as (so called optimistic alternative).
4) Alternative 4 is again less ambitious than policy 3 and also requires less funding (so
called moderate alternative).
5) Alternative 5 is the least ambitious policy requiring the least funding (so called as
pessimistic alternative).
Policy alternative 1 (BAU) does not imply waste reduction measures, whereas Alternatives 2 to 5
do suggest this in varying degrees and depending on the available funding. Alternative 2 with
maximum financing achieves the largest waste reduction, followed by Alternative 3 (optimistic)

48 | I C C S R
and Alternative 4 (moderate). Alternative 5 (pessimistic) has the smallest impact on waste
generation..
The next paragraph elaborates the different policy alternatives in more detail:
1) Alternative 1 reflects current practices (BAU) and does not forsee a reduction of the volume
of generated waste for the future. Nevertheless, this assumptions also implies increasing
(financial) capacities of local governments and s a consequence increasing waste
management capabilities. However, the practices of the waste management themselves are
not projected to change, the “gather-transport-disposed” cycle remains the prevailing
practice in this scenario, increasing coverage of transportation of waste deposits to landfills
will have positive effects on the urban living space. The main technique of waste treatment
in landfills will be covering of former open dumpings.
2) Policy Alternative 2 (supports the enforcement of Act No. 18/2008, therefore called law-
based, or maximum funding) is a scenario that reflects the current volume of waste
generation and future projections and focuces on waste management through (a) reduction
of solid waste to the principle of 3R, and (b) the sound handling of solid waste from
containing and transport till final disposal. . One of the mandate of Act No.18/2008 is the
conversion of Open Dumpings into Sanitary Landfills by 100% until 2014 and Policy
Alternative 2 aims at enforcing this law through the systematic use of sanitary landfills.
.
3) Alternative 3 (optimistic funding assumption), is apolicy based on the results of the FGDs
with the Ministry of Public Works on 18 November 2009, targeting at an at a gradual
conversion of an average 30 Open Dumping per year to Sanitary Landfill and Controlled
Landfills.
4) Policy alternative 4 (moderate funding assumption) is based on the results of the FGDs with
the Ministry of Public Works on November 18, 2009 and targets at the conversion of sOpen
Dumpings into Sanitary Landfills and the processing of solid waste in Controlled Landfills.
.
5) Alternative 5 (minimum or pessimistic funding assumption) is also based on the results of
the FGDs with the Ministry of Public Works on 18 November 2009 and aims at the with
conversion target from Open Dumping to Sanitary Landfill and solid waste-processing in
Controlled Landfill, but with a lower coverage.

49 | I C C S R
Table 5.1 through Table 5.10 show the assumptions used, the phases of the program and the
targets of each Policy Alternative in an overview:
Table 5.1 Assumptions used in Alternative 1 (BAU) Waste Management Component Assumptions used
1) Waste deposits transported to landfillsc
• •
Transportation ofwaste was at 50% in 2005.
•
The level of service increases by 2% every year, thus reaching in 2020.
2)Waste reduction
It is assumed that from 2020 onwards, the level of service increases by 1%, reaching 90% in 2030.
•
•
3R is a recommendation, not followed by adequate public policies of the Central and Local Government(i.e. 3R target).
•
Urban waste generation increases from 0.6 kg/ person/ day in 2005 to 1.2 kg/ person/ day in 2030.
3)Final Processing
Rural waste generation increases from 0.3 kg / person / day in 2005 to 0.55 kg / person / day in 2030.
•
•
The amount of waste generations covered in Open Dumpings is at approximately 45% in 2005, and increases up to 76.50% in 2030.
4)Other waste management activities
Conversion is achieved for Open Dumpings into Sanitary Landfills for 0.5% in 2005. It is assumed that this will increase only up to 3.2% in 2020 and 3.6% in 2030.
• Informal waste management practices such as combustion etc. continue with insignificant changes.
Table 5.2 Assumptions recapitulation in Alternative 1 (BAU) 2005 2010 2020 2030 Urban
Areas Rural Areas
Urban Areas
Rural Areas
Urban Aereas
Rural Areas
Urban Areas
Rural Areas
Unit: % (percentage) Waste deposits transported to landfills
50 20 60 22.5 80 27.5 90 32.5
Waste managed collectively: Plastic recycling 1.5 0.25 1.8 0.45 2.4 0.83 3.6 0.98 Paper recycling 1.5 0.25 1.8 0.45 2.4 0.83 3.6 0.98 Composting of 1 5.5 1.2 6.3 2.4 8 2.7 9.8

50 | I C C S R
2005 2010 2020 2030 Urban
Areas Rural Areas
Urban Areas
Rural Areas
Urban Aereas
Rural Areas
Urban Areas
Rural Areas
organic substances Burned at the TPS dan TPA
0.5 10 0.6 9.68 0 8.25 0 7.8
Covered at the Open Dumping
45 4 53.4 5.63 69.6 9.63 76.5 13
Covered with sanitary landfill + biogas captured
0.5 - 1.2 - 3.2 - 3.6 -
Self managed Waste: Plastic recycling 1.5 2.4 1.2 2.33 0.6 2.18 0.3 2.03 Paper recycling 1.5 4 1.2 3.88 0.6 3.63 0.3 3.38 Composting 1 40 0.8 38.8 0.4 36.3 0.2 33.8 Burned 5 20 4 19.38 2 18.13 1 16.88 Dumping in river 1 4 0.8 3.88 0.4 3.63 0.2 3.38 Dumping anywhere
40 9.6 32 9.3 16 8.7 8 8.1
Table 5.3 Assumptions used in alternative 2 (Law-Based, Maximum funding) Waste Management
Component Assumptions used
1) Waste deposits transported to landfills
•
2)Waste reduction
Transportation of 50% of total waste in 2005 .The level of service has increased by 2% per year in 2020 reaches 80% and 90% in 2030.
• Waste reduction is taking place. •
•
Urban waste generation increases from 0.6 kg/ person/ day in 2005 to 1 kg/ person/ day in 2030.
3)Final Processing
Rural waste generation increases from 0.3 kg / person / day in 2005 to 0.45 kg / person / day in 2030.
•
•
The amount of solid waste generation covered in the Open Dumping is about 45% in 2005, and decreases to 0% in 2030.
4) Other waste management activities
Open Dumping sites will be converted into Sanitary Landfills with a waste generation percentage of 0.5% in 2005 and increase to 56% in 2020 and 63% in 2030 respectively. Sanitary landfills are assumed to capture emissions by 90%.
• Percentage of the waste generations composted in urban area increases from 1% in 2005 to 6.4% in 2020 and 7.2% in 2030.

51 | I C C S R
Waste Management Component
Assumptions used
• Plastic recycling increases from 1.5% in 2005 to 4.80% in 2020 and 5.40% in 2030.
• Paper recycling increases from 2.4% in 2005 to 3.7% in 2020 and 4.6% in 2030.
• Burning of waste decreases from 0.5% in 2005 to 0% in 2020 and 0% in 2030.
Table 5.4 Assumptions recapitulation in Alternative 2 (Law-Based, Maximum Funding) 2005 2010 2020 2030 Urban
Areas Rural Areas
Urban Areas
Rural Areas
Urban Areas
Rural Areas
Urban Areas
Rural Areas
Unit: % (percentage) Waste deposits transported to landfills
50 20 60 30 80 50 90 70
Waste managed collectively: Plastic recycling
1.5 0.25 1.8 1.2 4.8 2.5 5.4 4.2
Paper recycling
1.5 0.25 1.8 1.2 4.8 2.5 5.4 4.2
Composting of organic substances
1 5.5 2.4 9 6.4 20 7.2 35
Burning at the TPS and TPA
0.5 10 0.6 12 0 12 0 9.1
Covered Open Dumping
45 4 48 6.6 0 13 0 17.5
g Conversion into sanitary landfill + biogas capture
0.5 - 2.4 - 56 - 63 -
Conversion intocontrolled landfill + biogas capture
0 - 3 - 8 - 9 -

52 | I C C S R
2005 2010 2020 2030 Urban
Areas Rural Areas
Urban Areas
Rural Areas
Urban Areas
Rural Areas
Urban Areas
Rural Areas
Selfmanaged Waste: Plastic recycling
1.5 2.4 1.6 2.8 1.2 3 0.7 2.4
Paper recycling
1.5 4 1.6 4.9 1.2 4 0.8 2.4
Composting of organic substances
1 40 1.6 42 2 36.5 1.2 23.7
Burning 5 20 3.2 10.5 0.6 2.5 0.3 0 Dumping in the river
1 4 0.8 2.8 0.2 1 0 0.3
Dumping anywhere
40 9.6 31.2 7 14.8 3 7 1.2
*) Reductions of CO2
eq emissions express the difference between the emissions released by the BAU scenario (see Table 5) and Policy Alternative 2 (Maximum Funding)
Table 5.5 Assumptions used in alternative 3 (Optimistic) Waste Management
Component Assumptions used
1)Waste deposits transported to landfills
• Waste deposit transported to landfills•
/ by 50% in 2005
2)Waste reduction
The level of service increased 2% per year so in 2020 it reaches 80% and 90.1% in 2030.
• Waste reduction is taking place. •
•
Urban waste generation increases from 0.6 kg/ person/ day in 2005 to 1.05 kg/ person/ day in 2030.
3)Final Processing
Rural waste generations increase from 0.3 kg / person / day in 2005 to 0.48 kg / person / day in 2030.
•
•
The amount of waste generations covered in the Open Dumping is about 45% in 2005, and decreases to 0% in 2030. Conversion is done for Open Dumping to Sanitary Landfill with a percentage of waste transported to Sanitary Landfills of 0.5% in 2005 to 44% in 2020 and 49.5% in 2030. In addition, conversion is also achieved from Open Dumping into Controlled Landfill from 0% in 2005 to 20% in 2020 and 22.5% in 2030. It is assumed here that Sanitary Landfills and Controlled Landfills are usedto capture emissions by 75%. This optimistic scenario involves the FGD results on November 18, 2009 with the Ministry of Public Works(target of conversion of 30 Open Dumping per year into Sanitary

53 | I C C S R
Waste Management Component
Assumptions used
Landfills). 4)Other waste management activities
• Percentage of waste generation composted increases from 1% in 2005 to 6.4% in 2020 and 7.2% in 2030.
• Plastic recycling increases from 1.5% in 2005 to 4.8% in 2020 and 5.4% in 2030.
• Paper recycling increases from 1.5% in 2005 to 4.8% in 2020 and 5.4%. in 2030
• Burning of waste decreases from 0.5% in 2005 to 0% in 2030.
Table 5.6 Assumptions recapitulation in Alternative 3 (Optimistic Funding) 2005 2010 2020 2030 Urban
Areas Rural Areas
Urban Areas
Rural Areas
Urban Areas
Rural Areas
Urban Areas
Rural Areas
Unit: % (percentage) Waste deposits transported to landfills
50 20 60 30 80 50 70 45
Waste managed collectively: Plastic recycling
1.5 0.25 1.8 1.2 4.8 2.5 5.4 4.2
Paper recycling
1.5 0.25 1.8 1.2 4.8 2.5 5.4 4.2
Composted organic
1 5.5 2.4 9 6.4 20 7.2 31.5
Burned at the TPS dan TPA
0.5 10 0.6 12 0 12 0 9.1
Covered at the Open Dumping
45 4 48 6.6 0 13 0 21
Covered with sanitary landfill + biogas captured
0.5 - 1.8 - 44 - 49.5 -
Covered with controlled landfill +
0 - 3 - 20 - 22.5 -
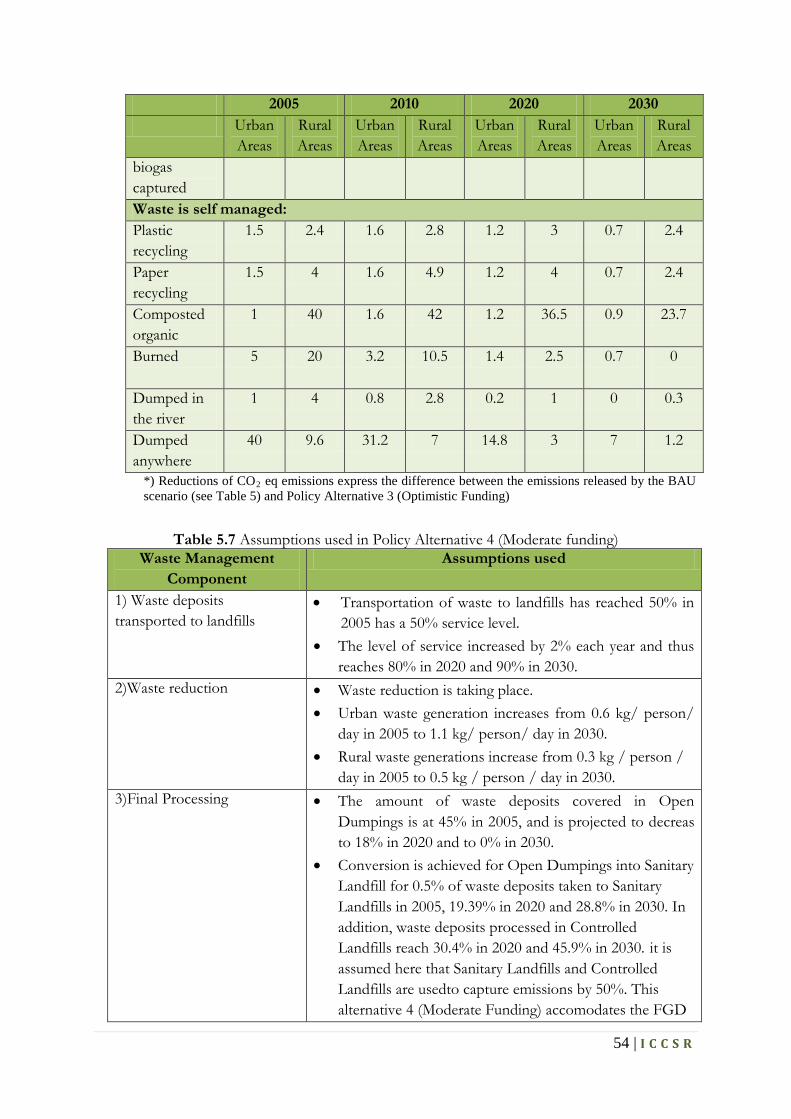
54 | I C C S R
2005 2010 2020 2030 Urban
Areas Rural Areas
Urban Areas
Rural Areas
Urban Areas
Rural Areas
Urban Areas
Rural Areas
biogas captured Waste is self managed: Plastic recycling
1.5 2.4 1.6 2.8 1.2 3 0.7 2.4
Paper recycling
1.5 4 1.6 4.9 1.2 4 0.7 2.4
Composted organic
1 40 1.6 42 1.2 36.5 0.9 23.7
Burned 5 20 3.2 10.5 1.4 2.5 0.7 0
Dumped in the river
1 4 0.8 2.8 0.2 1 0 0.3
Dumped anywhere
40 9.6 31.2 7 14.8 3 7 1.2
*) Reductions of CO2
eq emissions express the difference between the emissions released by the BAU scenario (see Table 5) and Policy Alternative 3 (Optimistic Funding)
Table 5.7 Assumptions used in Policy Alternative 4 (Moderate funding) Waste Management
Component Assumptions used
1) Waste deposits transported to landfills
•
•
Transportation of waste to landfills has reached 50% in 2005 has a 50% service level.
2)Waste reduction
The level of service increased by 2% each year and thus reaches 80% in 2020 and 90% in 2030.
• Waste reduction is taking place. •
•
Urban waste generation increases from 0.6 kg/ person/ day in 2005 to 1.1 kg/ person/ day in 2030.
3)Final Processing
Rural waste generations increase from 0.3 kg / person / day in 2005 to 0.5 kg / person / day in 2030.
•
•
The amount of waste deposits covered in Open Dumpings is at 45% in 2005, and is projected to decreas to 18% in 2020 and to 0% in 2030. Conversion is achieved for Open Dumpings into Sanitary Landfill for 0.5% of waste deposits taken to Sanitary Landfills in 2005, 19.39% in 2020 and 28.8% in 2030. In addition, waste deposits processed in Controlled Landfills reach 30.4% in 2020 and 45.9% in 2030. it is assumed here that Sanitary Landfills and Controlled Landfills are usedto capture emissions by 50%. This alternative 4 (Moderate Funding) accomodates the FGD

55 | I C C S R
Waste Management Component
Assumptions used
results on November 18, 2009 with the Ministry of of Public Works.
4)Other waste management activities
• Percentage of waste deposits composted increase from 1% in 2005 to 5.6% in 2020 and 7% in 2030.
• Plastic recycling increase from 1.5% in 2005 to 3.2% in 2020 and 4.5% in 2030.
• Paper recycling increases from 1.5% in 2005, in 2020 reaches 3.2% and in 2030 reaches 4.5%.
• Burning of waste decreases from 0.5% in 2005 to 0% in 2030.
Table 5.8 Assumptions recapitulation in Alternative 4 (Moderate Funding) 2005 2010 2020 2030 Urban
Areas Rural Areas
Urban Areas
Rural Areas
Urban Areas
Rural Areas
Urban Areas
Rural Areas
Unit: % (percentage) Waste deposits transported to landfills
50 20 60 25 80 35 90 45
Waste managed collectively: Plastic recycling 1.5 0.25 1.8 0.5 3.2 1.75 4.5 2.7 Paper recycling 1.5 0.25 1.8 0.5 3.2 1.75 4.5 2.7 Composting of organic material
1 5.5 2.4 7.5 5.6 12.3 6.3 18
Burning at the TPS and TPA
0.5 10 0.6 10 0 8.4 0 5.85
Covered at Open Dumpings
45 4 40.5 6.5 18 10.85 0 15.75
Coversion into Sanitary Landfills + biogas capture
0.5 - 5.28 - 19.39 - 28.8 -
Conversion into Controlled Landfill + biogas capture
0 - 7.8 - 30.4 - 45.9 -
Self-managed waste: Plastic recycling 1.5 2.4 1.6 3 1.2 3.9 0.7 3.85 Paper recycling 1.5 4 1.6 3.75 1.2 3.9 0.7 4.4 Composting of organic substances
1 40 1.6 41.3 1.2 42.3 0.8 38.5

56 | I C C S R
2005 2010 2020 2030 Urban
Areas Rural Areas
Urban Areas
Rural Areas
Urban Areas
Rural Areas
Urban Areas
Rural Areas
Burning 5 20 3.2 16.5 1.4 9.75 0.7 5.5
Dumping in the river
1 4 0.8 3 0.2 1.3 0 0.55
Dumpinganywhere 40 9.6 31.2 7.5 14.8 3.9 7.1 2.2 *) Reductions of CO2
eq emissions express the difference between the emissions released by the BAU scenario (see Table 5) and Alternative 4 (Moderate Funding)
Table 5.9 Assumptions used in alternative 5 (Pessimistic funding) Waste Management
Component Assumptions used
1) Waste deposits transported to landfills
• Transportation of waste deposits to landfills
2)Waste reduction
covers 50% in 2005.The level of service increases by 2% each year and reaches 80% in 2020 and 90% in 2030.
• Waste reduction is taking place. •
•
Urban waste generation increases from 0.6 kg/ person/ day in 2005 to 1.15 kg/ person/ day in 2030.
3)Final Processing
Rural waste generation increases from 0.3 kg / person / day in 2005 to 0.53 kg / person / day in 2030.
•
•
The amount of waste generation covered in Open Dumpings equals 45% of total waste volume in 2005, and decreases to 36.8% in 2020 and 32.4% in 2030. Conversion of Open Dumpings into Sanitary Landfill increases from 0% of waste generation in 2005 to 16.8% in 2020 and 23.4% in 2030. In addition, waste processing in Controlled Landfills will reach 12.8% in 2020 and 18.9% in 2030. Its is assumed here that anitary Landfills and Controlled Landfill
4)Other waste management activities
are used to capture emissions by 40%. This alternative 5 (Pessimistic Funding) accommodates the FGD results on November 18, 2009 with the Ministry of Public Works.
• The percentage of waste composted increases from 1% in 2005 to 5.6% in 2020 and 6.3% in 2030.
• Plastic recycling increases from 1.5% in 2005 to 4% in 2020 and 4.5% in 2030.
• Paper recycling increases from 1.5% in 2005, in 2020 reaches 4% and in 2030 reaches 4.5%.
• Burning of waste decreases from 0.5% in 2005 to 0% in 2030.

57 | I C C S R
Table 5.10 Assumptions recapitulation in Alternative 5 (Pessimistic Funding) 2005 2010 2020 2030 Urban
Aresa Rural Areas
Urban Areas
Rural Areas
Urban Areas
Rural Areas
Urban Ares
Rural Areas
Unit: % (percentage) Waste deposits transported to landfills
50 20 60 22.5 80 27.5 90 32.5
Waste managed collectively: Plastic recycling
1.5 0.25 1.8 0.45 4 1.1 4.5 1.63
Paper recycling
1.5 0.25 1.8 0.45 4 1.1 4.5 1.63
Composting of organic substances
1 5.5 2.4 6.3 5.6 9.35 6.3 11.05
Burningat the TPS and TPA
0.5 10 0.6 9.45 0 7.43 0 6.83
Covered at Open Dumpings
45 4 43.2 5.85 36.8 8.53 32.4 11.38
Conversion into Sanitary Landfills + biogas capture
0 - 6.6 - 16.8 - 23.4 -
Conversion into Controlled Landfills + biogas capture
0.5 - 3.6 - 12.8 - 18.9 -
Self-managed waste: Plastic recycling
1.5 2.4 1.6 3.1 1 4.35 0.5 4.05
Paper recycling
1.5 4 1.6 3.88 0.8 4.35 0.7 4.05
Composting of organic substances
1 40 1.6 41.1 1.6 43.5 0.8 43.9
Burning 5 20 3.2 18.6 1.6 14.5 0.8 12.15

58 | I C C S R
2005 2010 2020 2030 Urban
Aresa Rural Areas
Urban Areas
Rural Areas
Urban Areas
Rural Areas
Urban Ares
Rural Areas
Dumping in the river
1 4 0.8 3.1 0.2 1.45 0 0.68
Dumping anywhere
40 9.6 31.2 7.75 14.8 4.35 7.2 2.7
*)Reduction of CO2
eq emissions expressed the difference between the emissions released by the BAU scenario (see Table 5) with Alternative 5 (Pessimistic Funding)
The calculation of the results of each scenario above is presented in Figure 5.1, 5.2.Figure 5.3
visualizeds the trend of CO2
emissions, emission reductions, and mitigation costs compared to
the Business As Usual Scenario (BAU).
Figure 5.1 GHG emissions (in tons CO2
eq) for each alternative compared to Alternative 1 (BAU)
-
20,000
40,000
60,000
80,000
100,000
120,000
140,000
160,000
2010 2015 2020 2025 2030
GHG
Em
issi
ons (
Gg
CO2e
q)
YearAlternative 1 (BAU) Alternative 2 (Based-Law) Alternative 3 (Optimistic)
Alternative 4 (Moderate) Alternative 5 (Pessimistic)

59 | I C C S R
Figure 5.2 GHG emission reductions (in tons CO2
eq) compared to Alternative 1 (BAU)
Figure 5.3 Mitigations cost for each scenario compared to Alternative 1 (BAU)
-
5,000
10,000
15,000
20,000
25,000
30,000
35,000
40,000
2010 2015 2020 2025 2030
GHG
Em
issi
ons R
educ
tion
(Gg
CO2e
q)
YearAlternative 2 (Based-Law) Alternative 3 (Optimistic)Alternative 4 (Moderate) Alternative 5 (Pessimistic)
-200,000,000
0
200,000,000
400,000,000
600,000,000
800,000,000
1,000,000,000
2010 2015 2020 2025 2030
Miti
gatio
n Co
st (
USD
)
Year
Alternative 1 (BAU) Alternative 2 (Based-Law) Alternative 3 (Optimistic)
Alternative 4 (Moderate) Alternative 5 (Pessimistic)
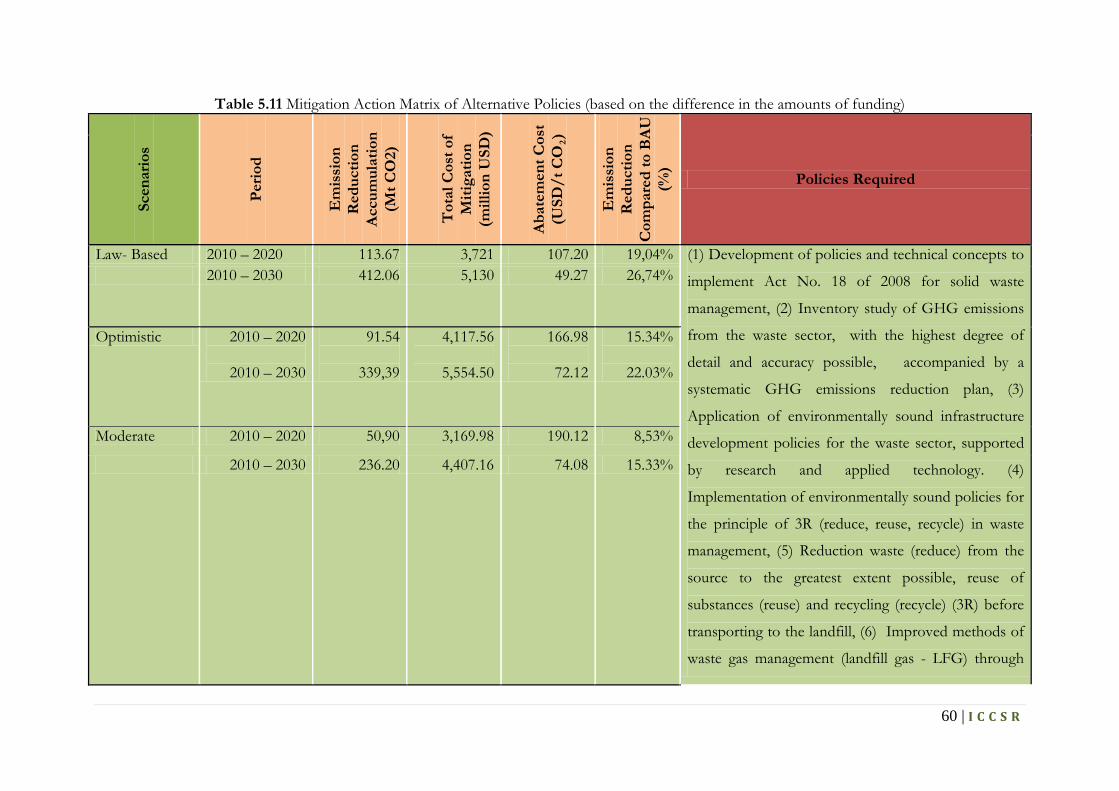
60 | I C C S R
Table 5.11 Mitigation Action Matrix of Alternative Policies (based on the difference in the amounts of funding)
Scen
ario
s
Perio
d
Em
issi
on
Red
uctio
n A
ccum
ulat
ion
(M
t CO
2)
Tot
al C
ost o
f M
itiga
tion
(m
illio
n U
SD)
Aba
tem
ent C
ost
(USD
/t C
O2)
Em
issi
on
Red
uctio
n C
ompa
red
to B
AU
(%
)
Policies Required
Law- Based 2010 – 2020 113.67 3,721 107.20 19,04% (1) Development of policies and technical concepts to
implement Act No. 18 of 2008 for solid waste
management, (2) Inventory study of GHG emissions
from the waste sector, with the highest degree of
detail and accuracy possible, accompanied by a
systematic GHG emissions reduction plan, (3)
Application of environmentally sound infrastructure
development policies for the waste sector, supported
by research and applied technology. (4)
Implementation of environmentally sound policies for
the principle of 3R (reduce, reuse, recycle) in waste
management, (5) Reduction waste (reduce) from the
source to the greatest extent possible, reuse of
substances (reuse) and recycling (recycle) (3R) before
transporting to the landfill, (6) Improved methods of
waste gas management (landfill gas - LFG) through
2010 – 2030 412.06 5,130 49.27 26,74%
Optimistic 2010 – 2020
2010 – 2030
91.54
339,39
4,117.56
5,554.50
166.98
72.12
15.34%
22.03%
Moderate 2010 – 2020 50,90 3,169.98 190.12 8,53%
2010 – 2030 236.20 4,407.16 74.08 15.33%

61 | I C C S R
Scen
ario
s
Perio
d
Em
issi
on
Red
uctio
n A
ccum
ulat
ion
(M
t CO
2)
Tot
al C
ost o
f M
itiga
tion
(m
illio
n U
SD)
Aba
tem
ent C
ost
(USD
/t C
O2)
Em
issi
on
Red
uctio
n C
ompa
red
to B
AU
(%
)
Policies Required
Pessimistic 2010 – 2020 28.30 2,770.80 333.63 4.74 collection and combustion or through application of
energy recovery systems. (6) Development of 3R
TPST in every city / regency in Indonesia. 2010 – 2030 159.62 4,057.06 101.16 10.36

67 | I C C S R
5.2 Strategic Issues of Climate Change in Waste Sector
Waste management and waste management related activities in Indonesia fall under
governmental regulation of Act No.18 from the year2008. Referring to this regulation, waste
management activities are based on public service by the local government, which has set the 3R
principle (Reduce, Reuse, and Recycle) as its target and clearly supports the EPR principle
(Extended Producer Responsibility).
Another strategic decision taken by this new regulation is the prohibition of Open Dumpings
and the responsibility for local governments to convert these into Controlled Landfills (CLF) in
small and medium-sized cities and into Sanitary Landfills (SLF) in cities and metropolitans until
the year 2015.
A financial strategy for waste management has to take into account the fact that the allocation
of government funds for domestic waste management is still low (<3%). In the future, it is
expected that waste management in Indonesia will be based on self-funding or private initiatives,
such as local sanitation companies or Public Service Agencies. Government fees for domestic
waste management and annual budget allocatins from central and local governments influence
such an financial strategy.
From the various strategies that have been mentioned above, the most important strategy is the
one dealing with social aspects and community participation. Without community involvement,
waste management policies cannot be implemented. Significant impacts on the
communitiesshould be taken into account by any government program related to waste
management.
In order to achieve GHG emissions reductions from the waste sector, different mitigation
options are available, using different alternative policy approaches as described below:
-
-
Inventory studes of GHGs from the waste sector, with the highest degree of detail and
accuracy possible., accompanied by systematic recommendations for the reduction of
GHG emissions.
-
Environment-friendly infrastructure development policies in the waste sector,supported
by research and of application of environmentally sound technologies
Application of environmentally sound policies for the principle of 3R (reduce, reuse,
recycle) in waste management.

68 | I C C S R
-
- Conducting infrastructure development including aspects of capacity building, including
human resources and institutional competence, while acknowledging the independence
of local governments in the development of environmental infrastructure and
encouraging the role of the private sector and communities.
Sustainable infrastructure development policies (under consideration of the three
development pillarseconomic, social, and environmental aspects) for reduction of GHG
emissions and increased carbon absorption.
-
- Enforcement of the application of the EPR principle (Extended Producer
Responsibility) for producers and importers of B3 waste.
Development ofwaste management technologies that are environment-friendly and
climate-friendly.
- Development of technologies to improve the quality of landfills:
o
o
Controlled Landfills (CLF) for small and medium-sized cities,
o Termination of Open Dumping
Sanitary Landfills (SLF) for large and metropolitan cities
-
Policy strategies outlined above in the priority program related to climate change mitigation are
divided into four main clusters:
- Regulation and policy
Data inventory and planning
- Implementation
- Capacity building (strengthening local governments, private and public institutions)
5.2.1 Data Inventory and Planning Group
5.2.2 Regulationand Policy Group
The program group of data inventory and planning shall be formed in the beginning of the five-
year plan (2010-2014) to conduct GHG assessments and formulation mitigation options for the
waste sector.
• Strengthening environmentally sound policy approaches for waste management and support
standardization (step-by-step approach).
Regulation and mitigation policies for solid waste are divided into four periods of program. For
the period of 2010-2014, the strategies that will be applied to each island are as follow:

69 | I C C S R
• Issuance of waste product regulations by the local government according to the NSPK of
city/district.
• Enforcementof waste-management-related regulations.
•
•
Preparation of NSPM for the waste sector.
•
Regulation, coaching, supervising, development of financial source, and investment patterns
for waste management.
• Formulation of NSPKs for the waste sector.
Formulation of guidelines for waste control.
•
Creating provision of Bantek, Bimtek and assistance (SSK) of waste management.
•
The secondfive-year period (2015-2019) will launch two leading programs:
•
Supervision and development of financial sources and investment patterns for waste
management.
Development of a monitoring system for waste products by the local governments according
to the NSPK.
The main program in the regulation and policy group for the periods of 2020-2024 and 2025-
2030 is the waste monitoring and evaluation system developed by the local governments
according to the NSPK. Anther program in the period of 2020-2024 shall be drafting
legislationsilfor public-private partnerships in waste management. For the final period covered
by this Roadmap (2025-2030) the legislation for public-private partnerships shall be
implemented.
.
5.2.3 Implementation Group
•
The implementation group also has several major programs for the 7 main islands in Indonesia
(see Appendix A for division of districts/regency and different cities: matrix of mitigation policy
recommendations for the waste sector). The points below are general policy recommendations
for mitigation in the waste sector:
•
Instlallment of waste development commissioner in regencies/cities.
Waste management in landfills, conversion from Open Dumping into Controlled
Landfills (CLF) in small and medium-sized cities; and Sanitary Landfills (SLF) in large
and metropolitan cities.

70 | I C C S R
•
•
Reduction of domestic solid waste (reduce) from the sourcereuse and recycle (3R) to the
greatest extent possible.
•
Improvement of Landfill Gas (LFG) managementthrough collection and combustion or
through the application of energy recovery systems.
•
Procurement of waste development (bantek) replication on the district/city level.
• Provision of CDM landfill projects in metropolitan cities.
Provision of waste infrastructure on the district/city level in every island in Indonesia.
•
• Transportation of waste in cities/districts on every island in Indonesia.
Provision of waste management facilities.
•
•
Transportation of waste in every island in Indonesia.
Development of 3R in TPST in all cities/districts in Indonesia
5.2.4 Capacity Building Group
•
Community involvement and society mpowerment becomes an important aspect for realizing
emission reductions from the waste sector in Indonesia. This has to be taken into account in
planning and policy development. Suggestions how to achieve this are outlined below:
•
Strengthening government and community partnerships.
•
Strengthening local government institution in waste management.
• Development of financial sources and investment fornthe waste sector through cooperations
between the government and international public entities and companies.
Monitoring and evaluation of waste management

71 | I C C S R
REFERENCES
1. Interg
2. IPCC, Climate Change 2007: The Physical Science Basis. Contribution of WorkingGroup I
to the Fourth Assessment Report of the Intergovernmental Panel on Climate Change, S.
Solomon, D. Qin,M.Manning, Z. Chen,M.Marquis, K, 2007
IPCC, Climate Change 2007: The Physical Science Basis. Contribution of
WorkingGroup I to the Fourth Assessment Report of the Intergovernmental Panel on
Climate Change, S. Solomon, D. Qin,M.Manning, Z. Chen,M.Marquis, K, 2007
3. Damanhuri, Enri. 2008. A Future Prospect Of Municipal Solid Waste Management in Indonesia. The
5th Asian-Pacific Landfill Symposium in Sapporo, Japan.
4. Damanhuri Enri. 2005. Some Principal Issues On Municipal Solid Waste Management In Indonesia.
Expert Meeting on Waste Management in Asia-Pacific Islands, Japan.
5. AEA Technology (1998) Options to reduce nitrous oxide emissions. Report to DG XI of
the European Commission.
6. United Nations Framework Convention on Climate Change (1995) – the Kyoto Protocol.
http://www.unfccc.int/resource/process/components/response/respkp.html
7. OECD 1999, ‘OECD Environmental Data 1999’, Chapter 7, Waste.
8. APME (Association of Plastics Manufacturers in Europe) (1999) Information system on
plastic consumption and waste management in Western Europe. European overview – 1997
data. Report by Taylor Nelson Sofres Consulting.
9. BPS (2004); Statistik Perumahan dan Permukiman, Modul SUSENAS 2004.
10. BPPT; Kajima & Tohoku Corp. (2006); Jelekong Landfill Gas Collection and Energy
Recovery CDM Project
11. BPPT (2008) ; Studi Neraca Gas Rumah Kaca di Indonesia, Laporan Akhir
12. Ditjen Cipta Karya -DPU (2007); Sasaran Pembangunan Nasional 2009 dan Strategi
Pencapaian Millenium Development Goals (MDGs) 2015
13. Hansen, J. & Sato, M., 2001. Trends of measure climate forcing agents. Proc. Natl. Acad. Sci.
USA 98(26), pp. 14778-14783.
14. Mikaloff Fletcher, S., Tans, P., Bruhwiler, L., Miller, J. & Heimann, M., 2004b. CH4 sources
estimated from atmospheric observations of CH4 and its 13C/12C isotopic ratios: 2. Inverse
modeling of CH4 fluxes from geograpgical regions. Global Biogeochem. Cycles 18, GB4005,
doi:10.1029/2004GB002224.

72 | I C C S R
15. NOAA, 2005. Radiative climate forcing by long-lived greenhouse gases: the NOAA annual
greenhouse gas index (aggi). NOAA Earth System Research Laboratory, R/GMD, 325
Broadway, Boulder, USA. http://www.cmdl.noaa.gov/aggi/
16. World Bank, Feasibility Study of Makassar Gas Project, (November 16, 2007)

73 | I C C R
APPENDIX A
CLIMATE CHANGE MITIGATION STRATEGIES RECOMMENDATION FOR WASTE SECTOR 1. Sumatera
Scientific Base Mitigation Alternative Strategies
Recommendation
Priority Programs for Sumatera Inventorization of
GHG 2010 – 2014 2015 – 2019 2020 – 2024 2024 – 2029
• GHG emission from urban solid waste sector in the form of methane (CH4) emitted by landfill and CO2 emitted by open combustion activity.
• Domestic waste level of 0.6 kg/person/day for urban and 0.3 kg/person/day
• Overall, only 21% from the total solid waste that was transported to the landfill (Dept. of Public Works, 2009).
• Carry out an inventory study of GHG from the solid waste sector, a more complete and perfect plan, accompanied by a systematic reduction in GHG.
• Applying the environment-friendly infrastructure development policy in the waste sector which is supported by the development of applied technology research and environmental perspective.
• Develop the application of environmental policy for the principle of 3R (reduce, reuse, recycle) in waste management.
• Develope a sustainable infrastructure development (with three balancing development pillars, which are economic, social, and environment) to reduce emission of GHG (Green House Gases) and increase carbon absorption
• Conducting infrastructure development of waste that is more concern to the aspect of capacity building, including human resources and institutional competence and the independence of local government in the development of environmental infrastructure and drive private and society sector’s participation.
Data Inventory and Planning • Inventorization study and
GHG reduction from the solid waste sector.
Regulatory and Policy • Strengthening
environmental policy approach to waste management and standardization (stepwise approach).
• Issuance of waste product development setting by the local government according to the NSPK of city/district.
• Settlement of waste regulation
• Preparation of NSPM in the waste field.
• Setting, coaching, supervising, developing finance source, and investing pattern in waste management
• Creating provision of guideline for waste control.
• Creating NSPK in the waste field
• Creating provision of Bantek, Bimtek and assistance (SSK) of waste
Regulatory and Policy • Supervision and
development of source of finance and investment pattern in waste management
• Monitoring waste product development setting by the local government according to the NSPK.
Implementation of Program
• Improvement of waste management in landfill, from open dumping to become controlled landfill in small and medium-sized cities; and sanitary landfill in large and metropolitan cities by 20%
• Reduction of domestic solid waste (reduce) from the source as much as possible, use again (reuse) and recycle (3R) before transported to the landfill by 30%.
• Improve method of
Regulatory and Policy • Drafting legislation
related to public-private partnerships in waste management
• Waste monitoring and evaluation of product development setting by the local government according to the NSPK.
Implementation of Program • Improvement of waste
management in landfill, from open dumping to become controlled landfill in small and medium-sized cities; and sanitary landfill in large and metropolitan cities by 30%
• Reduction of domestic solid waste (reduce) from the source as much as possible, use again (reuse) and recycle (3R) before transported to the landfill by 40%.
• Improve method of managing waste gas (landfill gas - LFG) through collection and
Regulatory and Policy • Waste monitoring and
evaluation of product development setting by the local government according to the NSPK.
• Evaluation of law implementation related to public private partnership in waste management.
Implementation of Program • Increase of waste
management in landfill, from open dumping to become controlled landfill in small and medium-sized cities; and sanitary landfill in large and metropolitan cities by 50%
• Reduction of domestic solid waste (reduce) from the source as much as possible, use again (reuse) and recycle (3R) before

74 | I C C R
• Develop a waste management technology that is environment-friendly and anticipative to climate change.
• Develop the technology to improve the quality of landfill: (1) Controlled Landfill (CLF) for
small and medium-sized cities, (2) Sanitary Landfill (SLF) for large
and metropolitan cities (3) Termination of Open
Dumping. • Develop the application of EPR
(Extended Producer Responsibility) for producer and importer of hazardous waste
management Implementation of Program • Implementation of waste
development commissioner in the district/city.
• Waste management in landfill, from open dumping to become controlled landfill in small and medium-sized cities; and sanitary landfill in large and metropolitan cities by 10%.
• Reduction of domestic solid waste (reduce) from the source as much as possible, use again (reuse) and recycle (3R) before transported to the landfill by 20%.
• Improve method of managing waste gas (landfill gas - LFG) through collection and combustion or through application of energy recovery system by 5%.
• Procurement of waste development (bantek) replication in the district/city.
• Provision of waste infrastructure in 41 districts/cities in Sumatera.
• Provision of CDM landfill facility in 6 metropolitan cities
• Provision of waste management facility of 411 unit
• Transportation of waste in
managing waste gas (landfill gas - LFG) through collection and combustion or through application of energy recovery system by 20%.
• Building of example project (3R, CDM, biogas)
• Provision of waste infrastructure in 86 districts/cities.
• Building of waste management facility by 453 unit
• Building of CDM landfill facility in 2 Metropolitan cities
• Transportation of waste in 86 districts/cities
• Transportation of waste in Sumatera by 45%.
• 3R integrated landfill in all districts/cities in Sumatera.
combustion or through application of energy recovery system by 30%.
• Infrastructure maintenance and improvement of waste service in 41 districts/cities in Sumatera.
• Building of CDM landfill facility in 3 major cities
• Provision of waste management facility by 498 unit
• Improvement of waste transportation in 41 districts/cities in Sumatera.
• Transportation of waste in Sumatera by 60%.
• Evaluation, maintenance, and development of example project (3R, CDM, biogas)
Capacity building (strengthening of the local government, private, and society institutions) • Forming of condusive
climate for the bussiness (private) world to actively participate in giving waste service, either in transportation handling or landfill management.
transported to the landfill by 50%.
• Improve method of managing waste gas (landfill gas - LFG) through collection and combustion or through application of energy recovery system by 50%.
• Infrastructure maintenance and improvement of waste service in 86 districts/cities
• Building of CDM landfill facility in 3 large cities
• Procurement of waste management facility by 548 unit
• Development of waste transportation in 86 districts/cities.
• Improve method of managing waste gas (landfill gas - LFG) through collection and combustion or through application of energy recovery system by 70%.
• Evaluation, maintenance, and development of example project (3R, CDM, biogas)
• Transportation of waste in Sumatera by 75%.
Capacity building

75 | I C C R
41 districts/cities in Sumatera.
• Transportation of waste in Sumatera by 30%.
• Development of 3R in TPST in all city/district in Sumatera.
Capacity building (strengthening of the local government, private, and society institutions) • Strengthening government
and community partnerships.
• Strengthening local government institution in waste management.
• Procurement of monitoring and evaluation of performance of waste management development
• Procurement of facility for financing source development activity and pattern of investment in the waste sector through cooperation of government and international public business
(strengthening of the local government, private, and society institutions) • Awareness increase
for all stakeholders to the importance of increasing waste service.
• Development of condusive climate for business (private) world to participate in giving waste service, either in handling transporatation or in landfill management.
• Increase in stakeholders’ participation in the effort to reach waste development target.

76 | I C C R
2. Java, Madura, Bali Scientific Base Mitigation Alternative
Strategies Recommendation
Priority Programs for Java, Madura, and Bali Inventorization of GHG
2010 – 2014 2015 – 2019 2020 – 2024 2024 – 2029
• GHG emission from urban solid waste sector in the form of methane (CH4) emitted by landfill and CO2 emitted by open combustion activity.
• Domestic waste level of 0.61 kg/person/day (TNA, 2009).
• Overall, only 21% from the total solid waste that was transported to the landfill (Dept. of Public Works, 2009).
• Carry out an inventory study of GHG from the solid waste sector, a more complete and perfect plan, accompanied by a systematic reduction in GHG.
• Applying the environment-friendly infrastructure development policy in the waste sector which is supported by the development of applied technology research and environmental perspective.
• Develop the application of environmental policy for the principle of 3R (reduce, reuse, recycle) in waste management.
• Develope a sustainable infrastructure development (with three balancing development pillars, which are economic, social, and environment) to reduce emission of GHG (Green House Gases) and increase
Data Inventory and Planning • Inventorization study and
GHG reduction from the solid waste sector.
Regulatory and Policy • Strengthening
environmental policy approach to waste management and standardization (stepwise approach).
• Issuance of waste product development setting by the local government according to the NSPK of city/district.
• Settlement of waste regulation
• Preparation of NSPM in the waste field.
• Setting, coaching, supervising, developing finance source, and investing pattern in waste management
• Creating provision of guideline for waste control.
• Creating NSPK in the waste field
• Creating provision of Bantek, Bimtek and assistance (SSK) of waste management
Implementation of Program • Implementation of waste
Regulatory and Policy • Supervision and
development of source of finance and investment pattern in waste management
• Monitoring waste product development setting by the local government according to the NSPK.
Implementation of Program
• Improvement of waste management in landfill, from open dumping to become controlled landfill in small and medium-sized cities; and sanitary landfill in large and metropolitan cities by 20%
• Reduction of domestic solid waste (reduce) from the source as much as possible, use again (reuse) and recycle (3R) before transported to the landfill by 30%.
• Improve method of
Regulatory and Policy • Drafting legislation
related to public-private partnerships in waste management
• Waste monitoring and evaluation of product development setting by the local government according to the NSPK.
Implementation of Program • Improvement of
waste management in landfill, from open dumping to become controlled landfill in small and medium-sized cities; and sanitary landfill in large and metropolitan cities by 30%
• Reduction of domestic solid waste (reduce) from the source as much as possible, use again (reuse) and recycle (3R) before transported to the landfill by 40%.
Regulatory and Policy • Waste monitoring
and evaluation of product development setting by the local government according to the NSPK.
• Evaluation of law implementation related to public private partnership in waste management.
Implementation of Program • Increase of waste
management in landfill, from open dumping to become controlled landfill in small and medium-sized cities; and sanitary landfill in large and metropolitan cities by 50%
• Reduction of domestic solid waste (reduce) from the source as much as possible, use again (reuse) and recycle (3R) before transported to the

77 | I C C R
Scientific Base Mitigation Alternative Strategies
Recommendation
Priority Programs for Java, Madura, and Bali Inventorization of GHG
2010 – 2014 2015 – 2019 2020 – 2024 2024 – 2029
carbon absorption • Conducting
infrastructure development of waste that is more concern to the aspect of capacity building, including human resources and institutional competence and the independence of local government in the development of environmental infrastructure also encourage private and society participation.
• Develop a waste management technology that is environment-friendly and anticipative to climate change.
• Develop the technology to improve the quality of landfill: (4) Controlled
Landfill (CLF) for small and medium-sized cities,
(5) Sanitary Landfill (SLF) for large and metropolitan cities
(6) Termination of Open Dumping.
• Develop the
development commissioner in the district/city.
• Waste management in landfill, from open dumping to become controlled landfill in small and medium-sized cities; and sanitary landfill in large and metropolitan cities by 10%.
• Reduction of domestic solid waste (reduce) from the source as much as possible, use again (reuse) and recycle (3R) before transported to the landfill by 20%.
• Improve method of managing waste gas (landfill gas - LFG) through collection and combustion or through application of energy recovery system by 5%.
• Procurement of waste development (bantek) replication in the district/city.
• Provision of waste infrastructure in 42 districts/cities in Java, Bali, and Madura
• Provision of CDM landfill facility in 12 metropolitan cities
• Provision of waste management facility of 411 unit
• Transportation of waste in 42 districts/cities in Java, Bali, andMadura
managing waste gas (landfill gas - LFG) through collection and combustion or through application of energy recovery system by 20%.
• Building of example project (3R, CDM, biogas)
• Provision of waste infrastructure in 65 districts/cities.
• Building of waste management facility by 453 unit
• Building of CDM landfill facility in 5 Metropolitan cities
• Transportation of waste in 65 districts/cities
• Transportation of waste in Java, Madura, Bali by 45%.
• 3R integrated landfill in all districts/cities in Jawa, Bali, and Madura
• Improve method of managing waste gas (landfill gas - LFG) through collection and combustion or through application of energy recovery system by 30%.
• Infrastructure maintenance and improvement of waste service in 42 districts/cities in Java, Madura, Bali.
• Building of CDM landfill facility in 15 large cities
• Provision of waste management facility by 498 unit
• Improvement of waste transportation in 42 districts/cities Jawa, Bali, and Madura
• Transportation of waste in Pulau Jawa, Madura, Bali by 60%.
• Evaluation, maintenance, and development of example project (3R, CDM, biogas)
Capacity building (strengthening of the local government,
landfill by 50%. • Improve method of
managing waste gas (landfill gas - LFG) through collection and combustion or through application of energy recovery system by 50%.
• Infrastructure maintenance and improvement of waste service in 65 districts/cities
• Building of CDM landfill facility in 4 large cities
• Procurement of waste management facility by 548 unit
• Development of waste transportation in 65 districts/cities.
• Improve method of managing waste gas (landfill gas - LFG) through collection and combustion or through application of energy recovery system by 70%.
• Evaluation, maintenance, and development of example project (3R, CDM, biogas)
• Transportation of and Madura by 75%.

78 | I C C R
Scientific Base Mitigation Alternative Strategies
Recommendation
Priority Programs for Java, Madura, and Bali Inventorization of GHG
2010 – 2014 2015 – 2019 2020 – 2024 2024 – 2029
application of EPR (Extended Producer Responsibility) for producer and importer of hazardous
waste
• Transportation of waste in Java, Bali, and Madura by 30%.
• Development of 3R in TPST in all city/district in Java, Madura, Bali.
Capacity building (strengthening of the local government, private, and society institutions) • Strengthening government
and community partnerships.
• Strengthening local government institution in waste management.
• Procurement of monitoring and evaluation of performance of waste management development
• Procurement of facility for financing source development activity and pattern of investment in the waste sector through cooperation of government and international public business
private, and society institutions) • Forming of
condusive climate for the bussiness (private) world to actively participate in giving waste service, either in transportation handling or landfill management.
Capacity building (strengthening of the local government, private, and society institutions) • Awareness
increase for all stakeholders to the importance of increasing waste service.
• Development of condusive climate for business (private) world to participate in giving waste service, either in handling transporatation or in landfill management.
• Increase in stakeholders’ participation in the effort to reach waste development target.

79 | I C C R
3. Kalimantan
Scientific Base Mitigation Alternative
Strategies Recommendation Priority Programs for Kalimantan
Inventorization of GHG
2010 – 2014 2015 – 2019 2020 – 2024 2024 – 2029
• GHG emission from urban solid waste sector in the form of methane (CH4) emitted by landfill and CO2 emitted by open combustion activity.
• Domestic waste level of 0.61 kg/person/day (TNA, 2009).
• Overall, only 21% from the total solid waste that was transported to the landfill (Dept. of Public Works, 2009).
• Carry out an inventory study of GHG from the solid waste sector, a more complete and perfect plan, accompanied by a systematic reduction in GHG.
• Applying the environment-friendly infrastructure development policy in the waste sector which is supported by the development of applied technology research and environmental perspective.
• Develop the application of environmental policy for the principle of 3R (reduce, reuse, recycle) in waste management.
• Develope a sustainable infrastructure development (with three balancing development pillars, which are economic, social, and environment) to reduce emission of GHG (Green House Gases) and increase carbon absorption
• Conducting infrastructure
Data Inventory and Planning • Inventorization study and
GHG reduction from the solid waste sector.
Regulatory and Policy • Strengthening
environmental policy approach to waste management and standardization (stepwise approach).
• Issuance of waste product development setting by the local government according to the NSPK of city/district.
• Settlement of waste regulation
• Preparation of NSPM in the waste field.
• Setting, coaching, supervising, developing finance source, and investing pattern in waste management
• Creating provision of guideline for waste control.
• Creating NSPK in the waste field
• Creating provision of Bantek, Bimtek and assistance (SSK) of waste management
Implementation of Program
Regulatory and Policy • Supervision and
development of source of finance and investment pattern in waste management
• Monitoring waste product development setting by the local government according to the NSPK.
Implementation of Program
• Improvement of waste management in landfill, from open dumping to become controlled landfill in small and medium-sized cities; and sanitary landfill in large and metropolitan cities by 20%
• Reduction of domestic solid waste (reduce) from the source as much as possible, use again (reuse) and recycle (3R) before transported to the
Regulatory and Policy • Drafting legislation
related to public-private partnerships in waste management
• Waste monitoring and evaluation of product development setting by the local government according to the NSPK.
Implementation of Program • Improvement of
waste management in landfill, from open dumping to become controlled landfill in small and medium-sized cities; and sanitary landfill in large and metropolitan cities by 30%
• Reduction of domestic solid waste (reduce) from the source as much as possible, use again (reuse) and recycle (3R) before
Regulatory and Policy • Waste monitoring
and evaluation of product development setting by the local government according to the NSPK.
• Evaluation of law implementation related to public private partnership in waste management.
Implementation of Program • Increase of waste
management in landfill, from open dumping to become controlled landfill in small and medium-sized cities; and sanitary landfill in large and metropolitan cities by 50%
• Reduction of domestic solid waste (reduce) from the source as much as possible, use again (reuse) and recycle

80 | I C C R
Scientific Base Mitigation Alternative Strategies Recommendation
Priority Programs for Kalimantan Inventorization of GHG
2010 – 2014 2015 – 2019 2020 – 2024 2024 – 2029
development of waste that is more concern to the aspect of capacity building, including human resources and institutional competence and the independence of local government in the development of environmental infrastructure also encourage private and society participation.
• Develop a waste management technology that is environment-friendly and anticipative to climate change.
• Develop the technology to improve the quality of landfill: (7) Controlled Landfill
(CLF) for small and medium-sized cities,
(8) Sanitary Landfill (SLF) for large and metropolitan cities
(9) Termination of Open Dumping.
• Develop the application of EPR (Extended Producer Responsibility) for producer and importer of hazardous
waste
• Implementation of waste
development commissioner in the district/city.
• Waste management in landfill, from open dumping to become controlled landfill in small and medium-sized cities; and sanitary landfill in large and metropolitan cities by 10%.
• Reduction of domestic solid waste (reduce) from the source as much as possible, use again (reuse) and recycle (3R) before transported to the landfill by 20%.
• Improve method of managing waste gas (landfill gas - LFG) through collection and combustion or through application of energy recovery system by 5%.
• Procurement of waste development (bantek) replication in the district/city.
• Provision of waste infrastructure in 41 districts/cities in Kalimantan.
• Provision of waste management facility of 411 unit
• Transportation of waste in 41 districts/cities in Kalimantan.
landfill by 30%. • Improve method of
managing waste gas (landfill gas - LFG) through collection and combustion or through application of energy recovery system by 20%.
• Building of example project (3R, CDM, biogas)
• Provision of waste infrastructure in 15 districts/cities.
• Building of waste management facility by 453 unit
• Transportation of waste in 15 districts/cities
• Transportation of waste in Kalimantan by45%.
• 3R integrated landfill in all districts/cities in Kalimantan.
transported to the landfill by 40%.
• Improve method of managing waste gas (landfill gas - LFG) through collection and combustion or through application of energy recovery system by 30%.
• Infrastructure maintenance and improvement of waste service in 41 districts/cities in Kalimantan.
• Provision of waste management facility by 498 unit
• Improvement of waste transportation in 41 districts/cities in Kalimantan.
• Transportation of waste in Kalimantan by 60%.
• Evaluation, maintenance, and development of example project (3R, CDM, biogas)
Capacity building (strengthening of the local government, private, and society institutions)
(3R) before transported to the landfill by 50%.
• Improve method of managing waste gas (landfill gas - LFG) through collection and combustion or through application of energy recovery system by 50%.
• Infrastructure maintenance and improvement of waste service in15 kab/kota
• Procurement of waste management facility by 548 unit
• Development of waste transportation in 15 districts/cities.
• Improve method of managing waste gas (landfill gas - LFG) through collection and combustion or through application of energy recovery system by 70%.
• Evaluation, maintenance, and development of example project (3R, CDM, biogas)
• Transportation of waste in Kalimantan by 75%.

81 | I C C R
Scientific Base Mitigation Alternative Strategies Recommendation
Priority Programs for Kalimantan Inventorization of GHG
2010 – 2014 2015 – 2019 2020 – 2024 2024 – 2029
• Transportation of waste in Kalimantan by 30%.
• Development of 3R in TPST in all city/district inPulau Kalimantan.
Capacity building (strengthening of the local government, private, and society institutions) • Strengthening government
and community partnerships.
• Strengthening local government institution in waste management.
• Procurement of monitoring and evaluation of performance of waste management development
• Procurement of facility for financing source development activity and pattern of investment in the waste sector through cooperation of government and international public business
• Forming of condusive climate for the bussiness (private) world to actively participate in giving waste service, either in transportation handling or landfill management.
Capacity building (strengthening of the local government, private, and society institutions) • Awareness increase
for all stakeholders to the importance of increasing waste service.
• Development of condusive climate for business (private) world to participate in giving waste service, either in handling transporatation or in landfill management.
• Increase in stakeholders’ participation in the effort to reach waste development target.

82 | I C C R
4. Sulawesi Scientific Base Mitigation Alternative
Strategies Recommendation Priority Programs for Sulawesi
Inventorization of GHG
2010 – 2014 2015 – 2019 2020 – 2024 2024 – 2029
• GHG emission from urban solid waste sector in the form of methane (CH4) emitted by landfill and CO2 emitted by open combustion activity.
• Domestic waste level of 0.61 kg/person/day (TNA, 2009).
• Overall, only 21% from the total solid waste that was transported to the landfill (Dept. of Public Works, 2009).
• Carry out an inventory study of GHG from the solid waste sector, a more complete and perfect plan, accompanied by a systematic reduction in GHG.
• Applying the environment-friendly infrastructure development policy in the waste sector which is supported by the development of applied technology research and environmental perspective.
• Develop the application of environmental policy for the principle of 3R (reduce, reuse, recycle) in waste management.
• Develope a sustainable infrastructure development (with three balancing development pillars, which are economic, social, and environment) to reduce emission of GHG (Green House Gases) and increase carbon absorption
• Conducting infrastructure development of waste that is more concern to
Data Inventory and Planning • Inventorization study and
GHG reduction from the solid waste sector.
Regulatory and Policy • Strengthening
environmental policy approach to waste management and standardization (stepwise approach).
• Issuance of waste product development setting by the local government according to the NSPK of city/district.
• Settlement of waste regulation
• Preparation of NSPM in the waste field.
• Setting, coaching, supervising, developing finance source, and investing pattern in waste management
• Creating provision of guideline for waste control.
• Creating NSPK in the waste field
• Creating provision of Bantek, Bimtek and assistance (SSK) of waste management
Implementation of Program
Regulatory and Policy • Supervision and
development of source of finance and investment pattern in waste management
• Monitoring waste product development setting by the local government according to the NSPK.
Implementation of Program
• Improvement of waste management in landfill, from open dumping to become controlled landfill in small and medium-sized cities; and sanitary landfill in large and metropolitan cities by 20%
• Reduction of domestic solid waste (reduce) from the source as much as possible, use again (reuse) and recycle (3R) before transported to the landfill by 30%.
• Improve method of
Regulatory and Policy • Drafting legislation
related to public-private partnerships in waste management
• Waste monitoring and evaluation of product development setting by the local government according to the NSPK.
Implementation of Program • Improvement of
waste management in landfill, from open dumping to become controlled landfill in small and medium-sized cities; and sanitary landfill in large and metropolitan cities by 30%
• Reduction of domestic solid waste (reduce) from the source as much as possible, use again (reuse) and recycle (3R) before transported to the landfill by 40%.
Regulatory and Policy • Waste monitoring
and evaluation of product development setting by the local government according to the NSPK.
• Evaluation of law implementation related to public private partnership in waste management.
Implementation of Program • Increase of waste
management in landfill, from open dumping to become controlled landfill in small and medium-sized cities; and sanitary landfill in large and metropolitan cities by 50%
• Reduction of domestic solid waste (reduce) from the source as much as possible, use again (reuse) and recycle (3R) before transported to the

83 | I C C R
Scientific Base Mitigation Alternative Strategies Recommendation
Priority Programs for Sulawesi Inventorization of GHG
2010 – 2014 2015 – 2019 2020 – 2024 2024 – 2029
the aspect of capacity building, including human resources and institutional competence and the independence of local government in the development of environmental infrastructure also encourage private and society participation.
• Develop a waste management technology that is environment-friendly and anticipative to climate change.
• Develop the technology to improve the quality of landfill: (10) Controlled Landfill
(CLF) for small and medium-sized cities,
(11) Sanitary Landfill (SLF) for large and metropolitan cities
(12) Termination of Open Dumping.
• Develop the application of EPR (Extended Producer Responsibility) for producer and importer of B3 waste
• Implementation of waste
development commissioner in the district/city.
• Waste management in landfill, from open dumping to become controlled landfill in small and medium-sized cities; and sanitary landfill in large and metropolitan cities by 10%.
• Reduction of domestic solid waste (reduce) from the source as much as possible, use again (reuse) and recycle (3R) before transported to the landfill by 20%.
• Improve method of managing waste gas (landfill gas - LFG) through collection and combustion or through application of energy recovery system by 5%.
• Procurement of waste development (bantek) replication in the district/city.
• Provision of waste infrastructure in 39 districts/cities in Sulawesi.
• Provision of waste management facility of 411 unit
• Transportation of waste
managing waste gas (landfill gas - LFG) through collection and combustion or through application of energy recovery system by 20%.
• Building of example project (3R, CDM, biogas)
• Provision of waste infrastructure in 31 districts/cities.
• Building of waste management facility by 453 unit
• Transportation of waste in 31 districts/cities
• Transportation of waste in Sulawesi by 45%.
• 3R integrated landfill in all districts/cities in Sulawesi.
• Improve method of managing waste gas (landfill gas - LFG) through collection and combustion or through application of energy recovery system by 30%.
• Infrastructure maintenance and improvement of waste service in 39 districts/cities in Sulawesi.
• Provision of waste management facility by 498 unit
• Improvement of waste transportation in 39 districs/cities in Sulawesi.
• Transportation of waste in Sulawesi by 60%.
• Evaluation, maintenance, and development of example project (3R, CDM, biogas)
Capacity building (strengthening of the local government, private, and society institutions) • Forming of
condusive climate for the bussiness
landfill by 50%. • Improve method of
managing waste gas (landfill gas - LFG) through collection and combustion or through application of energy recovery system by 50%.
• Infrastructure maintenance and improvement of waste service in 31 districts/cities
• Procurement of waste management facility by 548 unit
• Development of waste transportation in 31 districts/cities.
• Improve method of managing waste gas (landfill gas - LFG) through collection and combustion or through application of energy recovery system by 70%.
• Evaluation, maintenance, and development of example project (3R, CDM, biogas)
• Transportation of waste in Sulawesi by 75%.
Capacity building

84 | I C C R
Scientific Base Mitigation Alternative Strategies Recommendation
Priority Programs for Sulawesi Inventorization of GHG
2010 – 2014 2015 – 2019 2020 – 2024 2024 – 2029
in 39 districts/cities in Sumatera.
• Transportation of waste in Sulawesi by 30%.
• Development of 3R in TPST in all city/district in Sulawesi.
Capacity building (strengthening of the local government, private, and society institutions) • Strengthening
government and community partnerships.
• Strengthening local government institution in waste management.
• Procurement of monitoring and evaluation of performance of waste management development
• Procurement of facility for financing source development activity and pattern of investment in the waste sector through cooperation of government and international public business
(private) world to actively participate in giving waste service, either in transportation handling or landfill management.
(strengthening of the local government, private, and society institutions) • Awareness
increase for all stakeholders to the importance of increasing waste service.
• Development of condusive climate for business (private) world to participate in giving waste service, either in handling transporatation or in landfill management.
• Increase in stakeholders’ participation in the effort to reach waste development target.

85 | I C C R
5. Nusa Tenggara Islands Scientific Base Mitigation Alternative
Strategies Recommendation Priority Programs for Nusatenggara Islands
Inventorization of GHG
2010 – 2014 2015 – 2019 2020 – 2024 2024 – 2029
• GHG emission from urban solid waste sector in the form of methane (CH4) emitted by landfill and CO2 emitted by open combustion activity.
• Domestic waste level of 0.61 kg/person/day (TNA, 2009).
• Overall, only 21% from the total solid waste that was transported to the landfill (Dept. of Public Works, 2009).
• Carry out an inventory study of GHG from the solid waste sector, a more complete and perfect plan, accompanied by a systematic reduction in GHG.
• Applying the environment-friendly infrastructure development policy in the waste sector which is supported by the development of applied technology research and environmental perspective.
• Develop the application of environmental policy for the principle of 3R (reduce, reuse, recycle) in waste management.
• Develope a sustainable infrastructure development (with three balancing development pillars, which are economic, social, and environment) to reduce emission of GHG (Green House Gases) and increase carbon absorption
• Conducting infrastructure development of waste that is more concern to
Data Inventory and Planning • Inventorization study and
GHG reduction from the solid waste sector.
Regulatory and Policy • Strengthening
environmental policy approach to waste management and standardization (stepwise approach).
• Issuance of waste product development setting by the local government according to the NSPK of city/district.
• Settlement of waste regulation
• Preparation of NSPM in the waste field.
• Setting, coaching, supervising, developing finance source, and investing pattern in waste management
• Creating provision of guideline for waste control.
• Creating NSPK in the waste field
• Creating provision of Bantek, Bimtek and assistance (SSK) of waste management
Implementation of Program
Regulatory and Policy • Supervision and
development of source of finance and investment pattern in waste management
• Monitoring waste product development setting by the local government according to the NSPK.
Implementation of Program
• Improvement of waste management in landfill, from open dumping to become controlled landfill in small and medium-sized cities; and sanitary landfill in large and metropolitan cities by 20%
• Reduction of domestic solid waste (reduce) from the source as much as possible, use again (reuse) and recycle (3R) before transported to the landfill by 30%.
• Improve method of
Regulatory and Policy • Drafting legislation
related to public-private partnerships in waste management
• Waste monitoring and evaluation of product development setting by the local government according to the NSPK.
Implementation of Program • Improvement of
waste management in landfill, from open dumping to become controlled landfill in small and medium-sized cities; and sanitary landfill in large and metropolitan cities by 30%
• Reduction of domestic solid waste (reduce) from the source as much as possible, use again (reuse) and recycle (3R) before transported to the landfill by 40%.
Regulatory and Policy • Waste monitoring
and evaluation of product development setting by the local government according to the NSPK.
• Evaluation of law implementation related to public private partnership in waste management.
Implementation of Program • Increase of waste
management in landfill, from open dumping to become controlled landfill in small and medium-sized cities; and sanitary landfill in large and metropolitan cities by 50%
• Reduction of domestic solid waste (reduce) from the source as much as possible, use again (reuse) and recycle (3R) before transported to the

86 | I C C R
Scientific Base Mitigation Alternative Strategies Recommendation
Priority Programs for Nusatenggara Islands Inventorization of GHG
2010 – 2014 2015 – 2019 2020 – 2024 2024 – 2029
the aspect of capacity building, including human resources and institutional competence and the independence of local government in the development of environmental infrastructure also encourage private and society participation.
• Develop a waste management technology that is environment-friendly and anticipative to climate change.
• Develop the technology to improve the quality of landfill: (13) Controlled Landfill
(CLF) for small and medium-sized cities,
(14) Sanitary Landfill (SLF) for large and metropolitan cities
(15) Termination of Open Dumping.
• Develop the application of EPR (Extended Producer Responsibility) for producer and importer of B3 waste
• Implementation of waste
development commissioner in the district/city.
• Waste management in landfill, from open dumping to become controlled landfill in small and medium-sized cities; and sanitary landfill in large and metropolitan cities by 10%.
• Reduction of domestic solid waste (reduce) from the source as much as possible, use again (reuse) and recycle (3R) before transported to the landfill by 20%.
• Improve method of managing waste gas (landfill gas - LFG) through collection and combustion or through application of energy recovery system by 5%.
• Procurement of waste development (bantek) replication in the district/city.
• Provision of waste infrastructure insemua kab/kota di Nusa Tenggara Islands.
• Provision of waste management facility of 411 unit
• Transportation of waste
managing waste gas (landfill gas - LFG) through collection and combustion or through application of energy recovery system by 20%.
• Building of example project (3R, CDM, biogas)
• Provision of waste infrastructure in all districts/cities.
• Building of waste management facility by 453 unit
• Transportation of waste in all districs/cities
• Transportation of waste in Nusa Tenggara Islands by 45%.
• 3R integrated landfill in all districts/cities in Nusa Tenggara.
• Improve method of managing waste gas (landfill gas - LFG) through collection and combustion or through application of energy recovery system by 30%.
• Infrastructure maintenance and improvement of waste service in all districts/cities di Nusa Tenggara Islands.
• Provision of waste management facility by 498 unit
• Improvement of waste transportation in alldistricts/cities in Nusa Tenggara Islands.
• Transportation of waste in Nusa Tenggara Islands by 60%.
• Evaluation, maintenance, and development of example project (3R, CDM, biogas)
Capacity building (strengthening of the local government, private, and society institutions)
landfill by 50%. • Improve method of
managing waste gas (landfill gas - LFG) through collection and combustion or through application of energy recovery system by 50%.
• Infrastructure maintenance and improvement of waste service in all districts/cities
• Procurement of waste management facility by 548 unit
• Development of waste transportation in all districts/cities.
• Improve method of managing waste gas (landfill gas - LFG) through collection and combustion or through application of energy recovery system by 70%.
• Evaluation, maintenance, and development of example project (3R, CDM, biogas)
• Transportation of waste in Nusa Tenggara Islands by 75%.
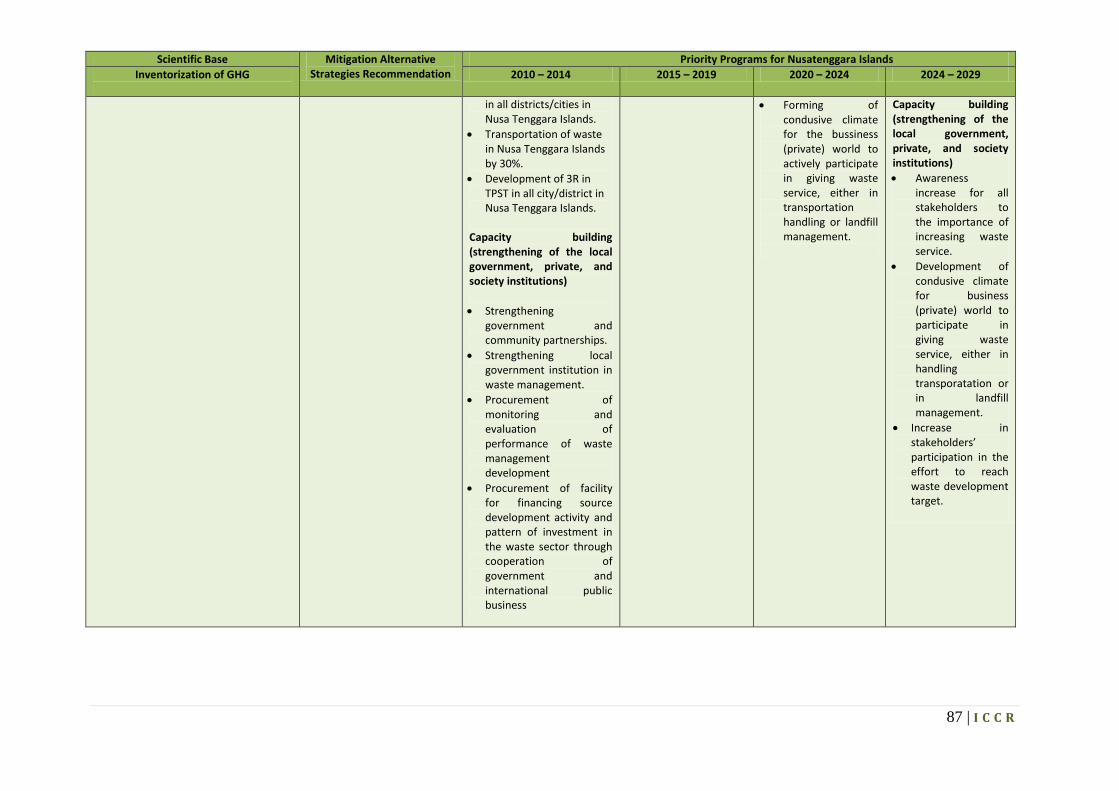
87 | I C C R
Scientific Base Mitigation Alternative Strategies Recommendation
Priority Programs for Nusatenggara Islands Inventorization of GHG
2010 – 2014 2015 – 2019 2020 – 2024 2024 – 2029
in all districts/cities in Nusa Tenggara Islands.
• Transportation of waste in Nusa Tenggara Islands by 30%.
• Development of 3R in TPST in all city/district in Nusa Tenggara Islands.
Capacity building (strengthening of the local government, private, and society institutions) • Strengthening
government and community partnerships.
• Strengthening local government institution in waste management.
• Procurement of monitoring and evaluation of performance of waste management development
• Procurement of facility for financing source development activity and pattern of investment in the waste sector through cooperation of government and international public business
• Forming of condusive climate for the bussiness (private) world to actively participate in giving waste service, either in transportation handling or landfill management.
Capacity building (strengthening of the local government, private, and society institutions) • Awareness
increase for all stakeholders to the importance of increasing waste service.
• Development of condusive climate for business (private) world to participate in giving waste service, either in handling transporatation or in landfill management.
• Increase in stakeholders’ participation in the effort to reach waste development target.

88 | I C C R
6. Maluku Islands
Scientific Base Mitigation Alternative Strategies Recommendation
Priority Programs for Maluku Islands Inventorization of GHG
2010 – 2014 2015 – 2019 2020 – 2024 2024 – 2029
• GHG emission from urban solid waste sector in the form of methane (CH4) emitted by landfill and CO2 emitted by open combustion activity.
• Domestic waste level of 0.61 kg/person/day (TNA, 2009).
• Overall, only 21% from the total solid waste that was transported to the landfill (Dept. of Public Works, 2009).
• Carry out an inventory study of GHG from the solid waste sector, a more complete and perfect plan, accompanied by a systematic reduction in GHG.
• Applying the environment-friendly infrastructure development policy in the waste sector which is supported by the development of applied technology research and environmental perspective.
• Develop the application of environmental policy for the principle of 3R (reduce, reuse, recycle) in waste management.
• Develope a sustainable infrastructure development (with three balancing development pillars, which are economic, social, and environment) to reduce emission of GHG (Green House Gases) and increase carbon absorption
• Conducting infrastructure development of waste
Data Inventory and Planning • Inventorization study and
GHG reduction from the solid waste sector.
Regulatory and Policy • Strengthening
environmental policy approach to waste management and standardization (stepwise approach).
• Issuance of waste product development setting by the local government according to the NSPK of city/district.
• Settlement of waste regulation
• Preparation of NSPM in the waste field.
• Setting, coaching, supervising, developing finance source, and investing pattern in waste management
• Creating provision of guideline for waste control.
• Creating NSPK in the waste field
• Creating provision of Bantek, Bimtek and assistance (SSK) of waste management
Regulatory and Policy • Supervision and
development of source of finance and investment pattern in waste management
• Monitoring waste product development setting by the local government according to the NSPK.
Implementation of Program
• Improvement of waste management in landfill, from open dumping to become controlled landfill in small and medium-sized cities; and sanitary landfill in large and metropolitan cities by 20%
• Reduction of domestic solid waste (reduce) from the source as much as possible, use again (reuse) and recycle (3R) before transported to the landfill by 30%.
Regulatory and Policy • Drafting legislation
related to public-private partnerships in waste management
• Waste monitoring and evaluation of product development setting by the local government according to the NSPK.
Implementation of Program • Improvement of
waste management in landfill, from open dumping to become controlled landfill in small and medium-sized cities; and sanitary landfill in large and metropolitan cities by 30%
• Reduction of domestic solid waste (reduce) from the source as much as possible, use again (reuse) and recycle (3R) before transported to the
Regulatory and Policy • Waste monitoring
and evaluation of product development setting by the local government according to the NSPK.
• Evaluation of law implementation related to public private partnership in waste management.
Implementation of Program • Increase of waste
management in landfill, from open dumping to become controlled landfill in small and medium-sized cities; and sanitary landfill in large and metropolitan cities by 50%
• Reduction of domestic solid waste (reduce) from the source as much as possible, use again (reuse) and recycle (3R) before

89 | I C C R
Scientific Base Mitigation Alternative Strategies Recommendation
Priority Programs for Maluku Islands Inventorization of GHG
2010 – 2014 2015 – 2019 2020 – 2024 2024 – 2029
that is more concern to the aspect of capacity building, including human resources and institutional competence and the independence of local government in the development of environmental infrastructure also encourage private and society participation.
• Develop a waste management technology that is environment-friendly and anticipative to climate change.
• Develop the technology to improve the quality of landfill: (16) Controlled Landfill
(CLF) for small and medium-sized cities,
(17) Sanitary Landfill (SLF) for large and metropolitan cities
(18) Termination of Open Dumping.
• Develop the application of EPR (Extended Producer Responsibility) for producer and importer of B3 waste
Implementation of Program • Implementation of waste
development commissioner in the district/city.
• Waste management in landfill, from open dumping to become controlled landfill in small and medium-sized cities; and sanitary landfill in large and metropolitan cities by 10%.
• Reduction of domestic solid waste (reduce) from the source as much as possible, use again (reuse) and recycle (3R) before transported to the landfill by 20%.
• Improve method of managing waste gas (landfill gas - LFG) through collection and combustion or through application of energy recovery system by 5%.
• Procurement of waste development (bantek) replication in the district/city.
• Provision of waste infrastructure in 11 districts/cities in Maluku Islands.
• Provision of waste management facility of 411 unit
• Improve method of managing waste gas (landfill gas - LFG) through collection and combustion or through application of energy recovery system by 20%.
• Building of example project (3R, CDM, biogas)
• Provision of waste infrastructure in 7 districts/cities.
• Building of waste management facility by 453 unit
• Transportation of waste in 7 districts/cities
• Transportation of waste in Maluku Islands by 45%.
• 3R integrated landfill in all districts/cities in Maluku.
landfill by 40%. • Improve method of
managing waste gas (landfill gas - LFG) through collection and combustion or through application of energy recovery system by 30%.
• Infrastructure maintenance and improvement of waste service in 11 districts/cities in Maluku Islands.
• Provision of waste management facility by 498 unit
• Improvement of waste transportation in 11 districts/cities in Maluku Islands.
• Transportation of waste in Maluku Islands by 60%.
• Evaluation, maintenance, and development of example project (3R, CDM, biogas)
Capacity building (strengthening of the local government, private, and society institutions) • Forming of
condusive climate
transported to the landfill by 50%.
• Improve method of managing waste gas (landfill gas - LFG) through collection and combustion or through application of energy recovery system by 50%.
• Infrastructure maintenance and improvement of waste service in 7 districts/cities
• Procurement of waste management facility by 548 unit
• Development of waste transportation in 7 districts/cities.
• Improve method of managing waste gas (landfill gas - LFG) through collection and combustion or through application of energy recovery system by 70%.
• Evaluation, maintenance, and development of example project (3R, CDM, biogas)
• Transportation of waste in Maluku Islands by 75%.

90 | I C C R
Scientific Base Mitigation Alternative Strategies Recommendation
Priority Programs for Maluku Islands Inventorization of GHG
2010 – 2014 2015 – 2019 2020 – 2024 2024 – 2029
• Transportation of waste in 11 districts/cities in Maluku Islands.
• Transportation of waste in Maluku Islands by 30%.
• Development of 3R in TPST in all city/district in Maluku Islands.
Capacity building (strengthening of the local government, private, and society institutions) • Strengthening
government and community partnerships.
• Strengthening local government institution in waste management.
• Procurement of monitoring and evaluation of performance of waste management development
• Procurement of facility for financing source development activity and pattern of investment in the waste sector through cooperation of government and international public business
for the bussiness (private) world to actively participate in giving waste service, either in transportation handling or landfill management.
Capacity building (strengthening of the local government, private, and society institutions) • Awareness
increase for all stakeholders to the importance of increasing waste service.
• Development of condusive climate for business (private) world to participate in giving waste service, either in handling transporatation or in landfill management.
• Increase in stakeholders’ participation in the effort to reach waste development target.

91 | I C C R
7. Papua
Scientific Base Mitigation Alternative Strategies Recommendation
Priority Programs for Papua Inventorization of GHG
2010 – 2014 2015 – 2019 2020 – 2024 2024 – 2029
• GHG emission from urban solid waste sector in the form of methane (CH4) emitted by landfill and CO2 emitted by open combustion activity.
• Domestic waste level of 0.61 kg/person/day (TNA, 2009).
• Overall, only 21% from the total solid waste that was transported to the landfill (Dept. of Public Works, 2009).
• Carry out an inventory study of GHG from the solid waste sector, a more complete and perfect plan, accompanied by a systematic reduction in GHG.
• Applying the environment-friendly infrastructure development policy in the waste sector which is supported by the development of applied technology research and environmental perspective.
• Develop the application of environmental policy for the principle of 3R (reduce, reuse, recycle) in waste management.
• Develope a sustainable infrastructure development (with three balancing development pillars, which are economic, social, and environment) to reduce emission of GHG (Green House Gases) and increase carbon absorption
• Conducting infrastructure development of waste
Data Inventory and Planning • Inventorization study and
GHG reduction from the solid waste sector.
Regulatory and Policy • Strengthening
environmental policy approach to waste management and standardization (stepwise approach).
• Issuance of waste product development setting by the local government according to the NSPK of city/district.
• Settlement of waste regulation
• Preparation of NSPM in the waste field.
• Setting, coaching, supervising, developing finance source, and investing pattern in waste management
• Creating provision of guideline for waste control.
• Creating NSPK in the waste field
• Creating provision of Bantek, Bimtek and assistance (SSK) of waste management
Regulatory and Policy • Supervision and
development of source of finance and investment pattern in waste management
• Monitoring waste product development setting by the local government according to the NSPK.
Implementation of Program
• Improvement of waste management in landfill, from open dumping to become controlled landfill in small and medium-sized cities; and sanitary landfill in large and metropolitan cities by 20%
• Reduction of domestic solid waste (reduce) from the source as much as possible, use again (reuse) and recycle (3R) before transported to the landfill by 30%.
Regulatory and Policy • Drafting legislation
related to public-private partnerships in waste management
• Waste monitoring and evaluation of product development setting by the local government according to the NSPK.
Implementation of Program • Improvement of
waste management in landfill, from open dumping to become controlled landfill in small and medium-sized cities; and sanitary landfill in large and metropolitan cities by 30%
• Reduction of domestic solid waste (reduce) from the source as much as possible, use again (reuse) and recycle (3R) before transported to the
Regulatory and Policy • Waste monitoring
and evaluation of product development setting by the local government according to the NSPK.
• Evaluation of law implementation related to public private partnership in waste management.
Implementation of Program • Increase of waste
management in landfill, from open dumping to become controlled landfill in small and medium-sized cities; and sanitary landfill in large and metropolitan cities by 50%
• Reduction of domestic solid waste (reduce) from the source as much as possible, use again (reuse) and recycle (3R) before
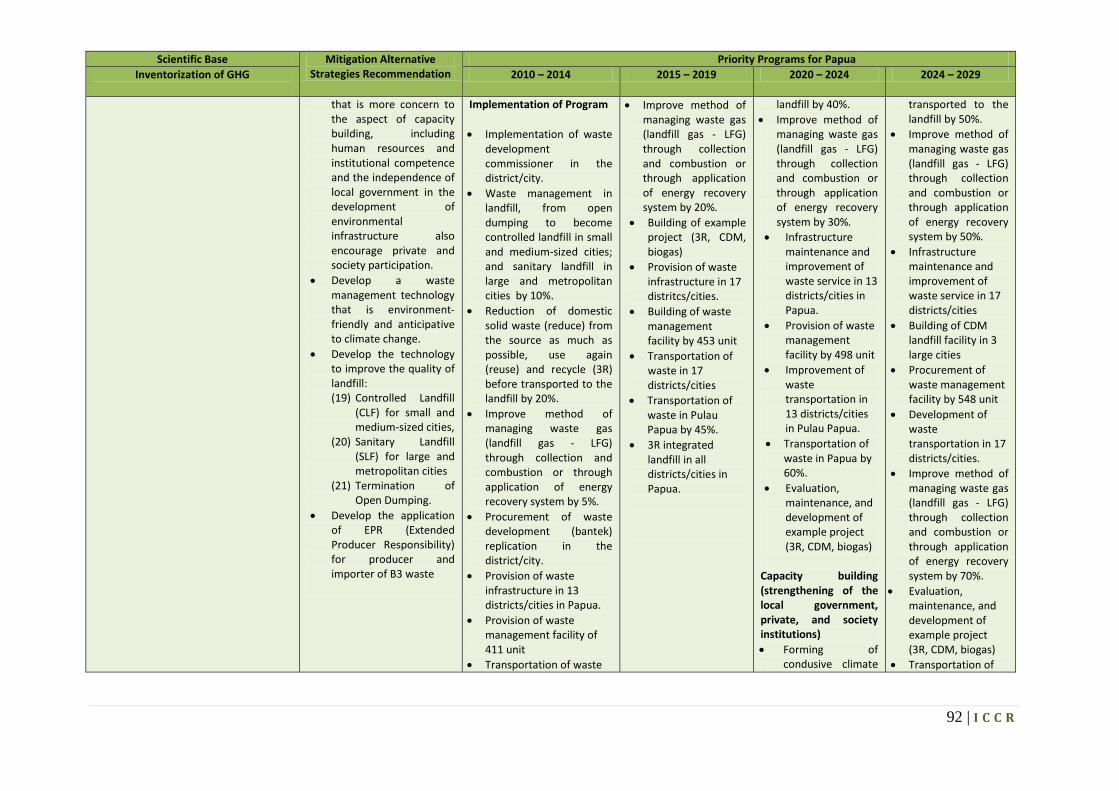
92 | I C C R
Scientific Base Mitigation Alternative Strategies Recommendation
Priority Programs for Papua Inventorization of GHG
2010 – 2014 2015 – 2019 2020 – 2024 2024 – 2029
that is more concern to the aspect of capacity building, including human resources and institutional competence and the independence of local government in the development of environmental infrastructure also encourage private and society participation.
• Develop a waste management technology that is environment-friendly and anticipative to climate change.
• Develop the technology to improve the quality of landfill: (19) Controlled Landfill
(CLF) for small and medium-sized cities,
(20) Sanitary Landfill (SLF) for large and metropolitan cities
(21) Termination of Open Dumping.
• Develop the application of EPR (Extended Producer Responsibility) for producer and importer of B3 waste
Implementation of Program • Implementation of waste
development commissioner in the district/city.
• Waste management in landfill, from open dumping to become controlled landfill in small and medium-sized cities; and sanitary landfill in large and metropolitan cities by 10%.
• Reduction of domestic solid waste (reduce) from the source as much as possible, use again (reuse) and recycle (3R) before transported to the landfill by 20%.
• Improve method of managing waste gas (landfill gas - LFG) through collection and combustion or through application of energy recovery system by 5%.
• Procurement of waste development (bantek) replication in the district/city.
• Provision of waste infrastructure in 13 districts/cities in Papua.
• Provision of waste management facility of 411 unit
• Transportation of waste
• Improve method of managing waste gas (landfill gas - LFG) through collection and combustion or through application of energy recovery system by 20%.
• Building of example project (3R, CDM, biogas)
• Provision of waste infrastructure in 17 distritcs/cities.
• Building of waste management facility by 453 unit
• Transportation of waste in 17 districts/cities
• Transportation of waste in Pulau Papua by 45%.
• 3R integrated landfill in all districts/cities in Papua.
landfill by 40%. • Improve method of
managing waste gas (landfill gas - LFG) through collection and combustion or through application of energy recovery system by 30%.
• Infrastructure maintenance and improvement of waste service in 13 districts/cities in Papua.
• Provision of waste management facility by 498 unit
• Improvement of waste transportation in 13 districts/cities in Pulau Papua.
• Transportation of waste in Papua by 60%.
• Evaluation, maintenance, and development of example project (3R, CDM, biogas)
Capacity building (strengthening of the local government, private, and society institutions) • Forming of
condusive climate
transported to the landfill by 50%.
• Improve method of managing waste gas (landfill gas - LFG) through collection and combustion or through application of energy recovery system by 50%.
• Infrastructure maintenance and improvement of waste service in 17 districts/cities
• Building of CDM landfill facility in 3 large cities
• Procurement of waste management facility by 548 unit
• Development of waste transportation in 17 districts/cities.
• Improve method of managing waste gas (landfill gas - LFG) through collection and combustion or through application of energy recovery system by 70%.
• Evaluation, maintenance, and development of example project (3R, CDM, biogas)
• Transportation of

93 | I C C R
Scientific Base Mitigation Alternative Strategies Recommendation
Priority Programs for Papua Inventorization of GHG
2010 – 2014 2015 – 2019 2020 – 2024 2024 – 2029
in 13 districts/cities in Papua.
• Transportation of waste in Papua by 30%.
• Development of 3R in TPST in all city/district in Papua.
Capacity building (strengthening of the local government, private, and society institutions) • Strengthening
government and community partnerships.
• Strengthening local government institution in waste management.
• Procurement of monitoring and evaluation of performance of waste management development
• Procurement of facility for financing source development activity and pattern of investment in the waste sector through cooperation of government and international public business
for the bussiness (private) world to actively participate in giving waste service, either in transportation handling or landfill management.
waste in Papua by 75%.
Capacity building (strengthening of the local government, private, and society institutions) • Awareness
increase for all stakeholders to the importance of increasing waste service.
• Development of condusive climate for business (private) world to participate in giving waste service, either in handling transporatation or in landfill management.
• Increase in stakeholders’ participation in the effort to reach waste development target.
![· PDF file*1 ri -xqh $phqghg3urshuw\6hfwru&rgh 3urshuw\vhfwrufrpplwvlwvhoiwrwkhlpsohphqwdwlrq riwudqvirupdwlrqzlwklqwkhsurshuw\vhfwrufrgh *ryhuqphqw*d]hwwh 1r](https://img.dokumen.tips/doc/110x75/5aaa75017f8b9a9a188e3d87/1-ri-xqh-phqghg3urshuw6hfwrurgh-3urshuwvhfwrufrpplwvlwvhoiwrwkhlpsohphqwdwlrq.jpg)


![RI %LR 0HGLFDO :DVWH &ROOHFWLRQ %DJV0hglfdo :dvwh &roohfwlrq %djv´ 7kh 7hfkqlfdo %lg´ zloo eh dqdo\]hg dqg )lqdqfldo %lg Æ ri rqo\ wkrvh ilupv zkr duh irxqg holjleoh lq 7hfkqlfdo](https://img.dokumen.tips/doc/110x75/603bcea2c5585565cd7e9805/ri-lr-0hglfdo-dvwh-roohfwlrq-0hglfdo-dvwh-roohfwlrq-djv-7kh-7hfkqlfdo.jpg)


![+D]DUGRXV :DVWH 0DQLIHVWV IRU WKH 2II 6LWH … · appendix g-4 +d]dugrxv :dvwh 0dqlihvwv iru wkh 2ii 6lwh 7udqvsruw ri 76&$ 5&5$ 5hjxodwhg 0dwhuldov wr wkh :d\qh 'lvsrvdo )dflolw\](https://img.dokumen.tips/doc/110x75/5c3bd73993f3c37a955971b7/ddugrxv-dvwh-0dqlihvwv-iru-wkh-2ii-6lwh-appendix-g-4-ddugrxv-dvwh-0dqlihvwv.jpg)


