Embed Size (px)
Citation preview

Page 1
Dutch Auctions and Reserve Prices: A Field Experiment on the Internet
Shane Kim 1
Abstract
I test the canonical predictions of Riley and Samuelson (1981) of the effects of reserve prices on Dutch
auction outcomes in an online field experiment. I compare my results to those of Reiley (2006), which tests
the same predictions in a first-price, sealed-bid format. I find strong evidence supporting the underlying
predictions of Riley and Samuelson (1981) and equilibrium bidding strategies, particularly regarding the
probability of sale and auction revenue conditional on sale. I also present qualitative evidence supporting
predictions of strategic behavior in Dutch auctions with reserve prices, associating higher reserve prices with
more aggressive bidding behavior.
1 Yale University, Economics, Class of 2017. Submitted for consideration of Distinction in the Major. I would like to thank my thesis advisor, Professor Mitsuru Igami, for his guidance throughout the year. I would also like to thank Professor Philip Haile, Professor Dirk Bergemann, and Professor Larry Samuelson for their valuable insight and advice as I developed by thesis. I am especially grateful for the team at HookBang, including Marc Formeister, Kevin Nadeau, Tony Morone, and Frank Roan, for their assistance in conducting the field experiment on their platform. Finally, I would like to thank my friends and family for their support over the past four years.

Page 2
1. Introduction
Over the past two decades, there have been a number of empirical studies focused on the effects of
reserve prices on auction outcomes. Much of this research has taken advantage of Internet-based platforms,
which enable economists to conduct field experiments in a wide variety of formats under a variety of different
auction parameters. Katkar and Lucking-Reiley (2001) test the effects of public and secret reserve prices by
auctioning Pokemon cards on Ebay. Bajari and Hortacsu (2003) study sellers’ reserve prices in common values 2
Ebay auctions. Trautmann and Traxler (2009) examine the theory of reserve prices as reference points, 3
proposed by Rosenkranz and Schmitz (2007) in the online auction of football players. Ostrovsky and 4
Schwarz (2011) estimate and implement optimal reserve prices in the context of sponsored search auctions
through Yahoo!. 5
None of these studies test the effects of reserve prices in the Dutch auction format. I attempt to 6
correct this gap in the literature. I examine the predictions of Riley and Samuelson (1981), a canonical
theoretical auction model of reserve prices, in the context of a field experiment using online Dutch auctions. 7
In doing so, I replicate the methodology of Reiley (2006), who conducts a similar field experiment on the
effects of reserve prices in a first-price, sealed-bid auction format, conducted through an Internet forum. My 8
empirical results support the predictions of Riley and Samuelson (1981), demonstrating a reduction in the
probability of sale and increase in revenues conditional on sale with the imposition of reserve prices. I also
map out the empirical revenue curve, unconditional on sale, in response to exogenous variation of the reserve
price. A qualitative analysis of the data supports the prediction that bidders react strategically to changes in
the reserve prices.
I organize this paper as follows. Section 2 reviews the model of reserve prices proposed by Riley and
Samuelson (1981), and outlines the key predictions to be tested. Section 3 covers the methodology and
findings of Reiley (2006), which are broadly consistent with Riley and Samuelson (1981) and with the findings
in this paper. Section 4 describes the context in which this field experiment takes place. Section 5 provides an
2 Katkar, Rama, and David Lucking-Reiley. Public versus secret reserve prices in Ebay Auctions: Results from a Pokémon field experiment. No. w8183. National bureau of economic research, 2001. 3 Bajari, Patrick, and Ali Hortacsu. "The winner's curse, reserve prices, and endogenous entry: Empirical insights from eBay auctions." RAND Journal of Economics (2003): 329-355. 4 Trautmann, Stefan T., and Christian Traxler. "Reserve prices as reference points–Evidence from auctions for football players at Hattrick. org." Journal of Economic Psychology 31, no. 2 (2010): 230-240; Rosenkranz, Stephanie, and Patrick W. Schmitz. "Reserve prices in auctions as reference points." The Economic Journal 117, no. 520 (2007): 637-653. 5 Ostrovsky, Michael, and Michael Schwarz. "Reserve prices in internet advertising auctions: a field experiment." In Proceedings of the 12th ACM conference on Electronic commerce, pp. 59-60. ACM, 2011. 6 For convenience, I briefly outline key terms and concepts in Appendix A. 7 Riley, John G., and William F. Samuelson. "Optimal auctions." The American Economic Review 71, no. 3 (1981): 381-392. 8 Reiley, David H. "Field experiments on the effects of reserve prices in auctions: More magic on the internet." The RAND Journal of Economics 37, no. 1 (2006): 195-211.

Page 3
overview of the relevant literature. Section 6 summarizes my experimental design and data. Section 7 outlines
my results, and I conclude with a brief summary of my findings and proposals for future research.
2. Model
2.1 Introduction
In this section, I analyze the model developed by Riley and Samuelson (1981). This model is
employed by Reiley (2006) to define the theoretical predictions of changes in the reserve price in a first-price,
sealed-bid format. I segment my review of their model into three parts: assumptions, equilibrium bidding
strategy, and reserve price implications. I apply each of these segments to the virtual environment of my field
experiment, matching the environment’s and bidders’ characteristics to those of the theoretical model.
2.2 Assumptions
Riley and Samuelson (1981) make five assumptions underlying their model: first, a single indivisible
good is sold to the highest bidder, second, each good is auctioned to a group of n exogenously-determined
bidders, third, higher valuations correspond to higher bids, fourth, bidders are risk-neutral, and have
valuations drawn from a common distribution, and fifth, bidders’ valuations are independent. I defend these
assumptions in the context of the field experiment setting.
First, each Dutch auction consisted of a single, indivisible good, auctioned in a single market. There
is a chance that the same good may have been available on the market at the same time, though under
different auction parameters and outside of the controls of the field experiment. This is a limitation of field 9
experiments in general, and one accepted by Reiley (2006) and other economists working with field data.
Second, each good sold was available to a fixed number of bidders who were logged into the
platform during the auction’s duration. However, bidders choose whether or not to participate in any given
auction, implying an endogenous entry component. Models with endogenous entry often assume that 10
bidding is costly, associated either directly with the bid or with preparing the bid itself. I made an effort to
reduce these endogenous entry costs. There are no direct costs or fees associated with bidding. Goods 11
auctioned were in high demand, and players on PackRat are generally aware of their private valuations and
willingness-to-pay for these cards beforehand. Moreover, in the context of online auctions, search costs were
9 For example, see: Peters, Michael, and Sergei Severinov. "Internet auctions with many traders." Journal of Economic Theory 130, no. 1 (2006): 220-245. 10 For an example of auctions with endogenous entry, See: Samuelson, William F. "Competitive bidding with entry costs." Economics letters 17, no. 1-2 (1985): 53-57. 11 Reiley (2006) acknowledges an endogenous entry component in his field experiment, though he does not explicitly test its effects.

Page 4
minimal, as auctions in the field experiment were pushed to the “front page” of the market, immediately
accessible for all players online during a given auction wave.
The third point, that higher valuations correspond to higher bids in a common equilibrium strategy in
the given context, is generally accepted as valid. It seems like a simple proposition to suggest that the more
valuable a card is, the more a player is willing to bid for the item. It also seems counterintuitive to suggest that
the more a player wants a card, the less they would be willing to bid for the card. I posit that no further
analysis is necessary beyond this simple construction.
Fourth, we assume that bidders are risk-neutral, and that their valuations are drawn from some
common distribution. These assumptions are essential to testing the predictions of Riley and Samuelson
(1981), and form the backbone of canonical auction theory models, such as Vickrey (1961) and Myerson
(1981). There are a two claims we can make to defend the former assumption: 12
● First, the bidders’ degree of risk-aversion should not influence the underlying predictions of Riley
and Samuelson (1981). They note that in the “high bid [first-price, sealed-bid] auction, as bidders
become more risk-averse, they make uniformly higher bids” and that the “optimal seller reserve price
is a declining function of the degree of risk aversion.” Risk-aversion influences the revenue 13
equivalence between the two auction formats. Predictions relating reserve prices to changes in
bidding strategy should still hold.
● Second, we are testing the predictive capabilities of orthodox auction theory in the context of a field
experiment. While the environment may not perfectly fit their risk-neutral setting, the purpose of this
experiment is to test the relevance of their theory to applications in the real-world.
To defend the latter assumption -- that valuations are drawn from a common distribution -- the goal of this
field experiment is to examine theoretical predictions and the empirical revenue curve despite the unknown
distribution of values. Though each card may have an individual underlying value distribution, expressing
reserve prices and revenues as a fraction of market prices allow us to both make cross-card comparisons and
evaluate the average effect of reserve prices on all cards.
Fifth, we assume independent, private values for the goods sold. Much like for Magic: The Gathering,
there are a few structural characteristics that validate this assumption. First, the purpose of PackRat is to
collect cards; players purchase these goods to complete collections. This provides an incentive for players to
hold on to cards indefinitely, removing the good from the market altogether. The common values model is
often applied situations in which goods have resale value. Second, players have values for cards independent 14
12 Vickrey, William. "Counterspeculation, auctions, and competitive sealed tenders." The Journal of finance 16, no. 1 (1961): 8-37; Myerson, Roger B. "Optimal auction design." Mathematics of operations research 6, no. 1 (1981): 58-73. Riley and Samuelson (1981) can be seen as an extension of Vickrey (1961) to reserve prices. 13 Riley and Samuelson (1981), at p. 390-391. 14 Informally, there is a culture against purchasing cards for immediate resale on the platform, though it is not explicitly prohibited. Having monitored one of PackRat’s publically-available message boards, there are several documented

Page 5
of other players. Importantly, the private value of the card to my personal collection will be independent of 15
others’ valuations, as players have vastly different aims, goals, and priorities in the short-run. Third, common
values auctions are often characterized by bidders being uncertain about the true value of the good, though
they may gather more information by observing the behavior of other bidders. In PackRat, all information
about the card is easily available, either on the auction screen or through third-party tools. Thus, a 16
symmetric IPV model may be a good approximation of behavior in PackRat.
In all, there is sufficient evidence to suggest that the experiment’s environment conforms to the
assumptions put forth by Riley and Samuelson (1981). Even without strict adherence to the model, Reiley
(2006) presents a compelling argument of testing the canonical auction model’s predictive capabilities in a
real-world environment. A model, after all, is only as good as its assumptions, and only as useful as its ability
to predict real-world behavior. This field experiment tests the latter, holding the former’s conditions to be
applicable.
2.3 Bidding Strategy
Riley and Samuelson (1981) suggest that the bidding function takes some general form: 17
Note that in both our definition and assumptions of the canonical auction model, this value of B(Vi) is
strictly increasing with the valuation of the good. In particular, bidders attempt to maximize the following
pseudo-expression: 18
Expected Buyer Gain = (Valuation)(Probability of Winning) - (Expected Payment)
There are a few takeaways from this expression. First, an increase in one’s valuation increases the potential
absolute payoff from winning the auction. Second, an increase in one’s valuation should also correspond to
an increase in one’s bid. An increase in the bid is also associated with an increase in the probability of
winning. However, an increase in one’s bid also increases the expected payment; the bidder, therefore, must
find an optimal tradeoff between an increase in the probability of winning and an increase in the expected
payment. Riley and Samuelson (1981) derive this equilibrium bidding strategy for a buyer in the first-price,
sealed-bid auction format, the strategic equivalent of the Dutch auction: 19
instances in which players noted that resale was against the spirit of the game. In addition, there are also instances in which auctions with a resale component may not be common values. See: Haile, Philip A. Auctions with resale. Social Systems Research Institute, University of Wisconsin, 1999. 15 For example, my personal valuation of the Humpback Whale card is some likely some function of the card’s rarity, availability on public markets, and its private value to my personal collection. 16 In fact, the standard market price of a card (“CTV”) is published directly on the auction screen. 17 Riley and Samuelson (1981), at page 383. 18 Ibid., at page 383. 19 Ibid. at page. 385.

Page 6
Bo is the reserve price announced by the seller. Bidders only submit bids if their valuation is above the reserve
price. The intuition is simply that the player in this auction format shades his submitted bid below his
valuation, ensuring a positive payoff and making the ideal tradeoff between the expected payoff and expected
payment. This shading is determined by the underlying value distribution and the number of bidders with
valuations above the reserve price and up-to the individual bidder’s valuation.
2.4 Reserve Price and Predictions
One of the more important contributions of Riley and Samuelson (1981) is its characterization of the
optimal reserve price. In particular, they note that the revenue-maximizing reserve price satisfies the following
equation: 20
Vo is the seller’s personal valuation of the good. An important characteristic this equation is that the reserve 21
price is independent of the number of bidders, and dependent on both the underlying value distribution and
the seller’s valuation.
In a detailed analysis, Reiley (2006) outlines the theoretical effects of an increase in the reserve price
on auction outcomes. I summarize those predictions below: 22
1. An increase in the reserve price should reduce the number of bidders who submit bids, as reserve
prices will screen out bidders with valuations lower than the minimum bid.
2. An increase in the reserve price should reduce the probability of the good being sold, again by
screening out bidders with valuations below the reserve.
3. An increase in the reserve price should increase the revenue earned on a good, conditional on it
being sold. 23
20 Ibid. at page 385. 21 And while not considered in this thesis, the optimal reserve price may be related to the seller’s valuation of the good, preventing the seller from taking a loss upon the sale of the good. 22 Reiley (2006), at p. 197. 23 A simple example is to assume that bidders’ valuations are uniformly distributed from 0 to 1. Taking the expected value of the full distribution results in a value of 0.5, whereas the expected value of the remaining distribution after the imposition of a reserve price is (½)(1 + r), given (0 < r < 1). Trivial examination suggests the latter is greater than the former, and is referred to herein as the exclusion principle. A related effect, often expounded upon in the context of second-price auctions, is that the reserve price serves as a floor on potential auction revenue. Reserve prices may allow the seller to extract a payoff that would instead go to the highest valuation bidder.

Page 7
4. An increase in the reserve price will cause a strict increase in the value of bids for bidders with
valuations above the reserve price. 24
5. The empirical revenue curve will have a steeper slope above the optimal reserve price than below, as
the unconditional revenue declines with the reduced probability of sale at higher reserve prices. 25
I test these predictions in my field experiment. Given the nature of the Dutch auction, in which only one 26
bid -- the winning bid -- is ever observed in the field, a few modifications must be made to my experimental
results.
● I test (1) and (2) concurrently. They both refer to a similar effect: an increase in the reserve price may
screen out potential bidders, particularly those for which the reserve price exceeds their valuation. So,
testing the probability of a good being sold is testing the same “screening” effect, which also
determines whether the number of bidders submitting bids decreases with an increase in the reserve
price.
● I test (3) and (4) concurrently. With only one bid collected per auction, observing whether or not
individual bids increased with the imposition or increase in the reserve price is correlated with
whether the reserve price increased the revenue earned on a good, conditional on sale. To disentangle
the effects of strategic behavior from conditional revenue, I analyze qualitative evidence from the
distribution of normalized sale prices in response to changes in the reserve price.
● I test (5) by exploring the general shape of the revenue curve, unconditional on sale. While not
directly comparable to Reiley (2006), the general predictions of the theory should hold true in this
context.
24 This is the result of the Bayes-Nash Equilibrium bidding strategy, in which b(v;r + ∆r) > b(v;r) for all bidders in which v > r + ∆r. Intuitively, bidders are aware that with an increase in the reserve price, the remaining competitors have, on average, higher valuations than the original pool of bidders. Therefore, the remaining bidders will bid reduce the amount by which they shade their bids in the face of perceived heightened competition. 25 Reiley (2006) comes to this conclusion by assuming bidders’ valuations are drawn from a uniform distribution (page 197). He observes that the unconditional expected revenue curve declines sharply as the reserve price exceeds the optimum reserve price for a given number of bidders. 26 Levin and Smith (1994) present a model of reserve prices incorporating endogenous entry, with bidders’ entry decisions determined by reserve prices. The predictions of their model are consistent with (1) and (2), noting that an increase in the reserve price should still screen out bidders with valuations below the reserve. However, the effects of reserve prices on (3), (4), and (5), or conditional revenue, strategic behavior, and the revenue curve, are ambiguous. See: Levin, Dan, and James L. Smith. "Equilibrium in auctions with entry." The American Economic Review (1994): 585-599; Choi, Syngjoo, Lars Nesheim, and Imran Rasul. "Reserve price effects in auctions: estimates from multiple RD designs." (2015).

Page 8
3 Reiley (2006)
In this segment, I review the study published by Reiley (2006) on the effects of reserve prices in
first-price, sealed-bid auctions of Magic: The Gathering cards. I structure this review into two components:
experimental design and results.
To test the predictions of Riley and Samuelson (1981), Reiley (2006) uses two experimental designs:
within-cards and between-cards. I summarize both designs below:
● The within-cards experiment tests a simple binary treatment: whether or not reserve prices were
employed. Reiley (2006) auctions the same card twice -- once with a minimum bid, and once without
a minimum bid -- in separate auction waves. Reiley (2006) conducts four simultaneous auctions of 86
cards each, with each auction lasting one week, and with a one week gap between auction waves. The
first wave did not employ minimum bids; the second wave employs minimum bids of 90% of the
cards’ standard market values. To control for temporal variation, he then auctions a different set of
cards in reverse order. 27
● The between-cards experiment treats reserve prices as a discrete variable, auctioning a variety of
cards at different reserve prices, expressed as a percentage relative to the cards’ standard market
prices. He again conducts four simultaneous auctions, each with 99 cards. He sets the reserve price as
a fraction of each individual card’s standard value, ranging from 10% to 150%. By normalizing using
individual standard market values, Reiley (2006) contends that cross-card comparisons are valid.
However, because there was a six-month gap between the within-cards and between-cards
experiment, the data between the two experiments are not directly comparable.
Turning to the results, Reiley (2006) finds evidence supporting the predictions of Riley and Samuelson (1981).
He notes that holding all else constant, reserve prices “(1) reduces the number of bidders, (2) increases the
frequency with which goods go unsold, and (3) increases the revenues received on the goods conditional on
their having been sold” and (4) bidders strategically increase their bids in response to reserve prices. In 28
addition, he finds that the shape of the revenue curve as a function of reserve prices follows theoretical
predictions. Thus, Reiley (2006) presents empirical evidence from the field confirming the predictions of 29
Riley and Samuelson (1981) with regard to first-price, sealed-bid auctions.
27 Reiley (2006), at page 200. His justification for reversing this order is twofold: first, the demand for these cards may have changed over time, and second, the first auction may have affected demand for the cards in the second auction. 28 Reiley (2006), at page 210. 29 Id. at page 31. Reiley (2006) compares the empirical shape of the revenue curve with some general examples from theory. While he finds anomalous behavior at low and very high reserve prices, the general comparisons hold.

Page 9
4 Context
4.1 Overview
This study take place in the context of first-price, descending auctions conducted for cards on
PackRat, a card-collecting platform developed by HookBang. The premise of the game is straightforward.
Players accumulate cards in an attempt to complete collections, or themed-sets of cards. The game was first
released in 2007, and over the past decade has released hundreds of cards and collections; for example,
Hookbang released their 500th unique collection in early March.
Cards can be won through a lottery system (“FlipRat”), purchased in fixed-price markets, or won
through player-run Dutch auctions. There are two auction houses, one for each currency format. There are
more subtle nuances to the values of cards, though for the purposes of the field experiment, are held constant
across cards auctioned.
4.2 Currencies
There are two currencies used in the market: credits and tickets. Credits can be earned from basic
in-game activities: logging in, playing FlipRat, or watching advertisements. Tickets can be purchased for “real”
money given a menu of prices. They can also be won in FlipRat, or received as a regular endowment from a
premium (“XL”) subscription. Tickets can be exchanged into credits through an official fixed rate, and cannot
be re-converted into cash.
4.3 Comparison with Reiley (2006)
This auction environment is ideal as a companion study to Reiley (2006) beyond the superficial
comparison of selling trading cards on the Internet. I highlight four reasons: first, players face similar
incentives to hold on to cards, second, players have comparable amounts of information when participating
in the auctions, third, players in PackRat are in many ways similar those participating in Magic: The Gathering
auctions, and fourth, some cards may have complements within the market.
● First, participants in PackRat face similar incentives to hold on to cards. As mentioned in Section 2,
players generally purchase cards to complete collections.
● Second, participants in PackRat have similar amounts of information to those in Magic: The Gathering
when participating in the auctions. For example, in both experiments, bidders do not know the
number of potential competitors. Moreover, players have access to the same “standard” market

Page 10
values and other vital card information, either through third-party tools, or through an official Card
Ticket Value (“CTV”) published on the auction screen. 30
● Third, the underlying population in PackRat is similar to those who participated in the Magic: The
Gathering auctions. Players come from a wide range of backgrounds -- with varying levels of
economic knowledge -- and but share an “intense interest in the auctioned items, making them
representative subjects for a test of auction theory.” 31
● Fourth, cards in PackRat may be complementary to one another in a manner similar to those in Magic:
The Gathering. For example, base cards can be combined through “recipes” to form new cards
required to complete a given collection, while cards in Magic: The Gathering are combined in playing
decks with complex aims and strategies.
5 Literature Review
This section provides an overview of the relevant literature. First, I establish the importance of this
study in the context of existing literature on Dutch auctions. I then defend the validity of the study, focusing
on claims regarding the use of artificial currency and the virtual environment.
5.1 Dutch Auctions
In this section, I establish the importance of this field experiment in the context of existing literature.
There is ample research indicating that Dutch auction outcomes can deviate significantly from the predictions
of canonical auction theory; primarily, that Dutch auctions and first-price, sealed-bid auctions are both
strategically and revenue equivalent, and that Dutch auction bidding behavior closely follows orthodox
predictions.
Lucking-Reiley (1999) finds evidence that the Dutch auction generates, on average, 30% higher
revenues than the first-price auction format. Much like his study of reserve prices, Lucking-Reiley (1999) 32
conducts a field experiment by selling Magic: The Gathering cards under different auction formats on an
internet forum. His results highlight a surprising failure of strategic and revenue equivalence between the
Dutch auction and the first-price, sealed-bid auction. While he does not advance a formal conclusion or
explanation for this breakdown in traditional auction theory predictions, Lucking-Reiley (1999) posits that the
30 In this context, CTV represents the standard market price for a given card, and is used to normalize my results across cards. 31 Reiley (2006), at page. 198. 32 Lucking-Reiley, David. "Using field experiments to test equivalence between auction formats: Magic on the Internet." American Economic Review (1999): 1063-1080.

Page 11
Dutch auction may have a “psychological anchoring effect, suggesting a high price to a person who may not
have an explicit cash valuation in mind.” 33
This psychological anchoring effect is explored formally by Ehrhart and Ott (2014), who explore the
theoretical difference between Dutch and first-price, sealed-bid auctions using reference-dependent utility. 34
They define personal equilibrium (PE) profiles in first- and second-price dynamic auctions -- ascending and
descending auctions -- with symmetric bidders and independent private values. Specific to this thesis, they
contrast the PE profile for the Dutch auction with the PE profile for the first-price, sealed-bid auction
derived in Belica and Ehrhart (2013). They find that Dutch auctions should result in higher PE bids than in 35
the first-price, sealed-bid format, providing a theoretical framework for the empirical results observed in
Lucking-Reiley (1999).
Contributing to the tension within Dutch auction literature is a laboratory experiment done by
Turocy, Watson, and Battalio (2007), who find evidence opposite of Lucking-Reiley (1999), demonstrating
that bidders in the first-price, sealed-bid auction format tend to bid more aggressively than those in the Dutch
auction format. They explore learning, framing, and presentation effects, conducting repeated trials over a 36
number of periods and utilizing an interface that informed users of their expected payoff for a given bid. In
both auction formats, bidders tended to bid at higher levels than one would expect in a risk-neutral, Nash
equilibrium strategy. The authors do not provide a formal, alternative economic model to explain their
findings or the difference in price levels between formats. They also reported a non-trivial amount of
heterogeneity of price levels within the Dutch auction format.
An earlier set of studies on the equivalence of Dutch auctions and first-price, sealed-bid auctions may
offer a partial explanation for the results obtained by Turocy, Watson, and Battalio (2007). Coppinger, Smith,
and Titus (1980) , Cox, Robertson, and Smith (1982) , Cox, Smith, and Walker (1983) , found that the 37 38 39
Dutch auction format produced lower revenues than sealed-bid auctions in a laboratory setting. In particular,
Cox, Smith, and Walker (1983) test two hypotheses: first, that bidders systematically violate Bayes’ rule, and
second, that bidders derive some form of utility from the suspense of the Dutch auction. Both hypotheses
suggest that Dutch auctions will result in lower bids than in the first-price, sealed-bid auction. Cox, Smith,
33 Lucking-Reiley (1999), at page. 1074. 34 Ehrhart, K. M., and M. Ott. Reference-dependent bidding in dynamic auctions. Mimeo, 2014. 35 Belica, M., and K. M. Ehrhart. Reference-dependent bayesian games. Working Paper, 2013. 36 Turocy, Theodore L., Elizabeth Watson, and Raymond C. Battalio. "Framing the first-price auction." Experimental Economics 10, no. 1 (2007): 37-51. 37 Coppinger, Vicki M., Vernon L. Smith, and Jon A. Titus. "INCENTIVES AND BEHAVIOR IN ENGLISH, DUTCH AND SEALED-BID AUCTIONS." Economic inquiry 18, no. 1 (1980): 1-22. 38 Cox, James C., Bruce Roberson, and Vernon L. Smith. "Theory and behavior of single object auctions." Research in experimental economics 2, no. 1 (1982): 1-43. 39 Cox, James C., Vernon L. Smith, and James M. Walker. "A test that discriminates between two models of the Dutch-first auction non-isomorphism." Journal of Economic Behavior & Organization 4, no. 2-3 (1983): 205-219.

Page 12
and Walker (1983) find evidence supporting the former hypothesis -- that bidders fail to update their
probabilities and bidding strategies during the dynamic game -- and reject the latter.
The cited research on Dutch auctions highlight three forms of tension: first, between the predictions
of orthodox auction theory and empirical investigation, second, between orthodox auction theory and
non-traditional auction theory, and third, between field and laboratory experiments. There is sufficient
research to indicate that Dutch auctions and first-price, sealed-bid auctions may deviate from revenue
equivalence in a significant manner. The primary aim of my research is to explore the first two forms of
tension by conducting an empirical investigation of Dutch auction outcomes, and comparing those to the
predictions made by traditional theory and the empirical research in support of that theory.
One final note on Dutch auction literature is the importance of testing the role auction parameters
may play in Dutch auction outcomes, particularly in its relationship with the first-price, sealed-bid auction.
Katok and Kwasnica (2008) conduct a field experiment comparing the effects of “slow” and “fast” clock
speeds, benchmarked against the first-price, sealed-bid auction format. Testing a model incorporating 40
impatient bidders, they find that slowing the clock speed led to higher revenues than the first-price, sealed-bid
auction. In fact, they note that their findings may explain some of the disparities in findings between
Lucking-Reiley (1999) and Cox et al. (1982, 1983).
5.2 Artificial Currency
A primary concern for this experiment is the validity of the currency format. Users in this experiment
bid for objects with “tickets”, the in-game currency that is purchased using real money. To affirm the external
validity of this experiment, I point to research that suggests that agents can use artificial currency to engage in
“normal” economic behavior.
Sönmez and Ünver (2010) first describe the problem with artificial currency in examining the
course-bidding process at business schools. They argue that the use of artificial currency in a one-shot 41
setting prevents bids from being used to infer student preferences, and that the magnitude of the bids fail to
act as a measure of cardinal preferences. Budish and Kessler (2016), building upon the work of Sönmez and
Ünver (2010), argue instead that artificial currency in an infinitely-repeated setting may adequately incentivize
agents to engage in standard economic behavior. This point is expanded upon by Prendergast (2015) in her 42
40 Katok, Elena, and Anthony M. Kwasnica. "Time is money: The effect of clock speed on seller’s revenue in Dutch auctions." Experimental Economics 11, no. 4 (2008): 344-357. 41 Sönmez, Tayfun, and M. Utku Ünver. "Course bidding at business schools." International Economic Review 51, no. 1 (2010): 99-123. 42 Budish, Eric, and Judd B. Kessler. Bringing Real Market Participants' Real Preferences into the Lab: An Experiment that Changed the Course Allocation Mechanism at Wharton. No. w22448. National Bureau of Economic Research, 2016. They outline the intuition of Sönmez and Ünver, stating, “the mathematical difference is that preferences are not quasi-linear over objects and money because the money is fake and the game is finite. Intuitively, someone who bids 10,000 dollars in a real-money auction and loses to someone who bids 10,001 may be disappointed, but at least they can put their money to

Page 13
examination of artificial currency and its use by food banks as an allocation mechanism. She present four 43
criteria under which the use of fake money functions effectively as a store of value and medium of exchange:
an infinitely-repeated setting, a high-flow of offerings, heterogeneity in the marginal valuations across goods,
and a large number of players.
I argue that the virtual environment in which I conduct my field experiment satisfies these four
conditions.
● First, PackRat is not a one-shot game. The platform has been around for ten years; players participate
with the understanding that the platform will continue for many more. It certainly defeats the
purpose of a game revolved around the purchase and collection of digital goods, if those goods are
expected to disappear in the future.
● Second, PackRat has thousands of cards to collect, as part of more than 500 collections, and is
continuously developing new cards and new collections for players to acquire. This strikes me as a
sufficiently-diverse setting for artificial currency to function as a medium of exchange. Moreover, the
auction markets within the game maintain a constant, high-flow of offerings. Approximately 5,000
cards were auctioned successfully in the entire ticket market over the course of the experiment, with
a daily average trading volume of 176 cards per day.
● Third, players have unique goals and priorities in playing the game. While the ultimate goal is
certainly to collect every available card, and to complete every possible collection, players have vastly
differing short-term priorities. For example, I may seek to collect the White House card, part of the
2016 Presidential Election collection, while the vast majority of users may have already done so, or care
very little to do so relative to other short-run priorities. Thus, we can expect significant marginal
valuations of individual goods over the course of the experiment.
● Fourth, PackRat has a large number of players -- approximately 4000 unique active users over the
course of the experiment -- that likely satisfies Prendergast’s (2015) fourth condition.
In all, there is sufficient reason to believe that my field experiment is incentive-compatible, at least in regard
to the currency format. There is little reason to believe that players’ bidding strategies and responses to
minimum bids will deviate from theoretical predictions on the account of the currency format.
5.3 Virtual Worlds
some alternative use, whereas a student who bids 10,000 points in a fake-money auction and loses to someone who bids 10,001 may end up graduating with a large budget of useless course-auction currency. As a result, unlike the Vickrey auction, the bidding points auction is not strategy-proof and equilibrium outcomes can be highly unfair and inefficient. Note, however, that if the game were infinitely repeated then unspent fake money would always have a future use and so the quasi-linearity assumption would be valid.” 43 Prendergast, Canice. "The Allocation of Food to Food Banks." (2016).

Page 14
Another concern regarding the external validity of this field experiment is its setting in a virtual
world. To alleviate these concerns, I highlight a few examples of research conducted in virtual environments.
The general consensus is that there is nothing specific to virtual worlds and environments that would imply
that players would behave in a manner that arbitrarily and significantly deviates from their behavior in a
real-world environment.
Castronova (2008) uses a virtual environment to test the law of demand. He conducts a simple 44
controlled trial using two identical virtual worlds, with the only difference being the price of a specific,
in-game good. Observing the difference in player purchasing behavior regarding the good, he finds evidence
for players in virtual environments to behave in an “economically normal” fashion.
Chesney, Chuah, and Hoffman (2009) examine the relevance of virtual worlds and environments for
experimental economics. They find that player economic behavior in Second Life -- touted for its many 45
similarities to the “real-world” -- does not deviate significantly or systematically from economic behavior in
more traditional settings.
In short, there is little evidence to suggest that player behavior in the PackRat ticket auction market
should deviate significantly from a real-world analogues.
6 Experimental Design and Data
6.1 Overview
I conduct two forms of field experiments: within-cards and between-cards. In the within-cards
experiment, I auction the same card twice, once with a non-trivial reserve price of 60% of the card’s standard
market value, and once with a trivial reserve price. In the between-cards experiment, I auction cards with
reserve prices at varying levels expressed as a fraction of their standard market price. I use this data to
supplement my within-cards tests, as well as map out the shape of the revenue curve as a function of these
exogenously-varied reserve prices. Given the structure of PackRat’s auction market, I conduct both
experiments simultaneously, auctioning waves of cards participating in both the within-cards and
between-cards experiment. Each auction wave contained a set of 10 non-overlapping cards. These cards are
auctioned for 12 hours, with a new wave beginning after the conclusion of the prior. Auctions were
conducted from March 3, 2017, to April 2, 2017. In all, I auctioned 408 cards. 46
44 Castronova, Edward. "A test of the law of demand in a virtual world: Exploring the petri dish approach to social science." (2008). 45 Chesney, Thomas, Swee-Hoon Chuah, and Robert Hoffmann. "Virtual world experimentation: An exploratory study." Journal of Economic Behavior & Organization 72, no. 1 (2009): 618-635. 46 Some cards were dropped from the within-cards experiment, as they repeated pairs of cards that had already been auctioned. Some earlier auctions were also dropped from the dataset, as I adjusted some minor auction parameters and the underlying distribution of cards to be sampled for this experiment.

Page 15
6.2 Auction Timing
I chose to run auction waves for twelve hours, with no-gap between auction waves. I chose this setup
for a number of reasons:
● First, given the dynamic nature of PackRat, there are likely significant changes in long-run demand for
cards over time. Reiley (2006) allows his field experiment to run over the course of six-months. A
similar setup on the platform would have rendered both within-cards and between-cards comparison
invalid, with significant changes to demand and potential shifts in the underlying pool of bidders.
● Second, I was given a fixed number of cards per wave to work with. To generate enough data,
without running afoul of the long-run changes in demand and players, I compressed auction
durations and gaps between auctions.
● Third, while long-run trends and changes in demand are difficult to predict or control for, I can easily
control for short-term changes in demand. For example, I can easily include a control for which card
in the within-cards experiment was shown first.
6.3 Auction Descent
One notable feature of the PackRat Dutch auction is the manner in which prices fall over the course
of the auction. Prices fall at an exponential rate with discrete, evenly-spaced time intervals, determined as a
function of the starting price, minimum bid, and auction duration. 47
Implicitly, the experimental design employed in this paper makes an important tradeoff between
analyzing the predictions of Riley and Samuelson (1981) and controlling for the descent speed of any given
auction. Holding the starting price and auction duration constant, an increase in the reserve prices necessarily
decreases the range of prices an auction may display, making each discrete jump in prices smaller. Given its
near-perfect correlation with the posted reserve, this gap is difficult to control for. Katok and Kwasnica
(2008) demonstrate that this may affect Dutch auction outcomes, particularly when compared to first-price,
sealed-bid auctions. However, to allow the starting price to vary would make it difficult to analyze the effects
of reserve prices on revenues, since the starting price caps potential auction revenue. Similarly, allowing
auction duration to vary would negate the useful control that simultaneous auction waves provides.
Ultimately, I made the decision to hold the starting price and auction duration constant. Riley and
Samuelson (1981) are silent on the role of auction descent in auction outcomes, whereas fixed starting prices
and auction durations were essential to testing the model’s predictions.
47 This limits the prices available to players, and may affect bidders on the margin. The auction screen, however, communicates the time until the next drop in prices. Moreover, these time intervals are short enough, given the condensed auction durations, that it should not significantly affect player behavior.

Page 16
6.4 Within-Cards
For the within-cards experiment, I was able to auction 158 cards, or 79 matching pairs, over the
course of the field experiment. There were no “repeats” for the within-cards experiment; each pair of cards is
unique. The order in which these cards were presented on the market -- with or without reserve prices -- was
randomly assigned. The minimum bid for “no-reserve prices” was set to a trivial 1 ticket, due to platform
constraints; the minimum bid for cards with reserve prices was set to 60% of the market price for each card.
The starting price of these auctions was set to 110% of the card’s standard market price. Summary statistics
are provided in Table 1.
6.5 Between-Cards
For the between-cards experiment, I auctioned 250 cards across multiple reserve price levels. The
reserve price level for a given card is determined by dividing the minimum bid by the standard market price
of the card. The reserve prices for these cards vary from 10% to 150% of the market price for each card, and
each reserve price “bin” contains 9 to 30 observations. Repeat cards were allowed in this design, though not 48
within the same auction wave. The starting price of these auctions was set to 200% of the cards standard
price. Summary statistics for both the between-cards and pooled data are presented in Table 2.
6.6 Limitations
The field experiment format imposes a few limitations on this study. I summarize them below:
● First, I am unable to observe bidders’ valuations, or estimate the underlying value distribution for the
cards auctioned. 49
● Second, much like Reiley (2006), bidders are uniformly unaware of the number of other potential
bidders for each card. This is primarily a limitation of the single-bid format of the Dutch auction,
rather than the intentional design choice made by Reiley (2006), though the effect is similar. 50
● Third, while the pool of available bidders include all players online at the time of the auction, there is
likely an endogenous entry component as users decide which auctions to participate in.
48 The 110% reserve price level contained 9 cards auctioned, and the 40% reserve price level contained 30 cards auctioned. The mean count for each reserve price bin in the between-cards experiment was 16.667, with a median of 17. 49 Though it is possible to derive the underlying distributions (See: Brendstrup, Bjarne, and H. Paarsch. Nonparametric estimation of Dutch and first-price, sealed-bid auction models with asymmetric bidders. Working Paper, University of Iowa Department of Economics, 2003; Athey, Susan, and Philip A. Haile. "Identification of standard auction models." Econometrica 70, no. 6 (2002): 2107-2140; Athey, Susan, and Philip Haile. "Nonparametric approaches to auctions." Handbook of econometrics 6, no. Part A (2007): 3847-3965.) 50 This shortcoming is not considered by Reiley (2006), though the equilibrium bidding strategy in Riley and Samuelson (1981) is dependent on the number of potential competitors. A more formal comparison of bidding under uncertainty is described by Levin and Ozdenoren (2004). See: Levin, Dan, and Emre Ozdenoren. "Auctions with uncertain numbers of bidders." Journal of Economic Theory 118, no. 2 (2004): 229-251.

Page 17
● Fourth, the exact number of exogenous bidders participating in each auction is unknown, though
rough approximations can be inferred and controls can be implemented for each auction wave.
The first three limitations are set aside by Reiley (2006) as part of the tradeoff between laboratory and field
experiment designs. The fourth limitation is one unique to this experiment, a result of both the Dutch auction
format and the virtual environment. Changes in users between auction waves can be accounted for with a 51
control variable for each wave, though the absolute number of participants and the magnitude of their impact
may be unknown. I accept this as a necessary tradeoff for my study to take place, limiting the scope of some
of my analyses. 52
6.7 Departure from Reiley (2006)
An important point of departure from Reiley (2006) is the ability to compare data from the
between-cards and within-cards experiment directly. Reiley (2006) notes that the “data from the between-card
auctions are not directly comparable to the within-card auctions, because the size and composition of the
pool of participating bidders changed considerably during the intervening six months.” In my study, the 53
underlying pool of bidders is the same in each auction wave; and therefore, the same in both experiments.
Cards participating in either experimental design were randomly allocated to each auction wave, and sampled
from the same collections of cards. There is no overlap of cards within each auction wave, to prevent conflict
between the two experimental designs. The only difference between experiments is the starting price. I use
this fact to enhance my analysis of auction revenue conditional and unconditional on sale, including a control
variable to indicate which experiment the card took part of.
6.8 Subject Pool
The exogenous pool of bidders consists broadly of all users online and with tickets to spend during
the time of the auction. Over the course of the field experiment, there were 1959 daily active users, 2745
weekly active users, and 4052 unique users. Of these 4052 unique users, 2650 had access to tickets during 54
this span, and would at some point have been able to participate in the experiment. Of the daily active users,
963 are premium subscribers with guaranteed access to tickets; of the weekly active users, 1169 are premium
51 An approximation of the number of bidders participating in each auction wave can be made with the number of users online during the auction wave. By selling cards in high-demand, we can assume the vast majority of players are interested in participating in these auctions. 52 For example, Reiley (2006) claims that the optimal reserve price may be increasing in the number of bidders. He also notes that reserve prices “should have less of an effect on auction revenues as the number of participating bidders increases” (p. 211). These claims would be considered outside the scope of my analyses, and I cannot consider the effect the number of exogenous bidders may have had on my auction outcomes, or the potential effects of endogenous entry. 53 Reiley (2006), at page 202. 54 This information was provided by Kevin Nadeau and the team at HookBang. Correspondence is available upon request.

Page 18
subscribers; of the unique users, 1304 are premium subscribers. 105 unique bidders purchased cards
participating in the experiment.
It is unclear what the best summary statistic for the number of exogenous participants might be. The
ideal approximation would be the number of unique users with tickets per day; aggregating this statistic,
however, is much more complicated than daily, weekly, and total unique users. The simultaneous auction
design allows me to control for variations in the number of potential bidders across auction waves, though
the specific values may be unobserved.
7 Results
In this section, I analyze the predictions of Riley and Samuelson (1981) in the context of my
empirical study. This section is broken down into four parts: probability of sale, revenue conditional on sale,
revenue unconditional on sale, and strategic behavior.
7.1 Probability of Sale
In this segment, I assess the impact of reserve prices on the probability of sale, using data from both
the within-cards and between-cards experiment. An increase in the reserve price should reduce the probability
of sale, by discouraging bidders with valuations lower than the reserve from submitting bids. I use the 55
binomial variable SOLD, which takes a value of 1 if the card was sold over the duration of the auction, and 0
if the auction expired without a bid.
For the within-cards experiment, there is ample evidence to suggest that reserve prices reduced the
probability of sale. I employ two analytical methods with this data: a simple test for equality of proportions,
and a linear probability model. First, the raw probability of sale for cards with a trivial minimum bid is 56
84.8%, while the probability of sale for cards with a minimum bid is 54.4%. The resulting two-sample test for
equality of proportions, testing the alternative hypothesis that the probability of sale is greater with the
no-minimum cards than it is for the cards with minimums, carries a Chi-squared statistic of 15.83, significant
at the 90% level of confidence. This result is consistent with the prediction of Riley and Samuelson (1981). 57
Second, I estimate a fixed effects model using this within-cards data. I regress the binary outcome, SOLD, on
55 Similarly, it should reduce the number of bidders with the same screening effect, though under the Dutch auction format, that effect is unobserved. 56 I justify the use of linear probability models for this thesis in Appendix B. 57 In this paper, I employ a 90% level of confidence. The 90% confidence level is appropriate in this study for two reasons: first, a relatively small expected sample size, and second, a certain level of comfort with uncertainty. Considering my results under the 95% confidence level led to qualitatively similar conclusions, though the effects of reserve prices are less pronounced. I made a tradeoff between uncertainty -- whether or not the true population values fall within my constructed confidence intervals -- and keeping my empirical results relevant.

Page 19
minimum.f, a dummy variable indicating whether or not the card took a non-trivial reserve price, along with
control variables for auction waves and order of presentation. To control for differences in demand and 58
card quality across all cards in the experiment, I specify this model with a full set of card-specific fixed effects.
The regression model takes the form:
SOLD = minimum.f + kind + created_at + earliest_obs + e 59
I present the results in Table 3. Employing heteroscedasticity-consistent standard errors with a
degrees-of-freedom correction (“HC1”), I find that the imposition of a reserve price leads to a 17.1%
reduction in the probability of sale, with a t-statistic of -1.557, 44 degrees of freedom, and a one-tailed p-value
of 0.0635, significant at the 90% level of confidence. The within-cards data confirms the prediction that the 60
probability of sale decreases with the imposition of reserve prices, consistent with the screening of
low-valuation bidders from the auction.
I also use the between-cards to test how the probability of sale responds to an increase in the level of
the reserve price. Like Reiley (2006), I specify a linear probability model with relevant controls. By regressing 61
the binary variable SOLD on each of the reserve price levels, I calculate the mean probability of sale for each
of the reserve price levels. My regression takes the form: 62
SOLD = NORMRES.f + created_at + market_price + e
I present the regression results in Table 4. The probability of sale is generally decreases with an increase in the
reserve price, starting with a 68.1% probability of sale for the 10% reserve price level, and ending with a
24.5% probability of sale at the 150% reserve price level. While the decline in the probability of sale does not
appear to be monotonic, the general trend confirms the prediction of Riley and Samuelson (1981). I conduct
a Tukey’s Honest Significant Differences (HSD) Test to formally confirm the decline in the probability of sale
with an increase in the reserve price, using HC1 standard errors. At the 90% level of confidence, several 63
58 I discuss these control variables in Appendix C. I normally include the market price, though in this case, its effect is incorporated into kind. Created_at is a control for each individual auction wave, and earliest_obs takes a value of 1 if the card was the first observed of the matching pair. 59 I also ran a regression interacting earliest_obs with minimum.f, accounting for whether the order the cards were presented in affected the probability of sale. Not only were the results statistically insignificant, but the interaction term also confounded the economic interpretation of the results. 60 Unless noted otherwise, I report all regression results with HC1 errors. 61 I also fit a binomial logistic regression model to confirm my findings. Because some reserve price levels and auction waves contained either no unsold cards or only unsold cards, I treated the reserve price level and the auction wave as continuous variables. This is possible since both reserve price levels and auction waves are evenly-spaced intervals. The results are qualitatively similar to the linear probability model, showing a coefficient much less than zero at the 90% level of confidence (z-value: -5.334). 62 In the absence of the control variables. Reiley (2006) notes that this model amounts to estimating the probability of sale as a “nonparametric function of the reserve price r” (page 203). 63 I use Tukey’s HSD test, both for its simplicity of implementation and because it is conservative when dealing with unequal sample sizes. While the probability of sale does not take on a normal distribution, the Tukey HSD method is fairly robust to deviations from normality (See: Salkind, Neil J., ed. Encyclopedia of research design. Vol. 1. Sage, 2010, at

Page 20
contrasts are both statistically and economically significant, demonstrating a decline in probability of sale with
an increase in the reserve price. For example, the 30% reserve price level has a greater probability of sale than
the 90%, 130%, and 140% reserve price levels (t = 3.46; 2.936; 2.967). We can certainly at least reject the
hypothesis that the probability of sale at a higher reserve price is greater than the probability of sale for any
smaller reserve price.
The results from both the within-cards and between-cards experiment generally confirm that the
probability of sale decreases with the imposition of reserve prices. This is also consistent with the prediction
that the imposition of reserve prices reduce the number of bidders who submit bids in an auction, inferred by
the same screening effect. The impact is more nuanced in the between-cards experiment, with a seemingly
non-monotonic decline in the probability of sale with regard to the level of the reserve, but the general trend
remains supportive of the canonical prediction.
7.2 Auction Revenue, Conditional on Sale
Having examined predictions regarding the probability of sale, I now turn to auction revenue,
conditional on sale. Riley and Samuelson (1981) predict that an increase in the reserve price will increase
auction revenue, conditional on the good being sold, through both the exclusion principle and through
strategic bidding behavior. I use both within-cards and between-cards data to explore this claim.
From the within-cards data, I limit my analysis to the pairs of cards in which both were sold over the
course of the experiment. I conduct an OLS regression on the standardized revenue, NORMREV, using the
dummy variable minimum.f, using these twice-sold cards. Much like the linear probability model using 64
within-cards data, I include the full-set of card-specific fixed effects, as well as the usual auction controls. My
regression takes the form:
NORMREV = minimum.f + kind + created_at + earliest_obs + e
I present the results in Table 3. I find that the imposition of a reserve price in this format leads to a 0.1684
increase in standardized revenue, with a t-value of 1.403, standard error of 0.1200, and a one-sided p-value of
0.092, significant at the 90% level of confidence. This suggests that imposition of a reserve price does lead 65
to an increase in revenue conditional on sale, consistent with theory.
page 1570). However, it can be sensitive to deviations from homoscedasticity, which is why I use conservative HC1 errors to test contrasts in this setting. 64 I also conducted a two-sample comparison of means on the within-cards data. The t-statistic was -1.0946, with a one-tailed p-value of 0.1386 and 73.698 degrees of freedom. While not significant at the 90% level of confidence, the results were close enough to warrant further analysis using a more formal regression model. 65 An issue with this regression is that the two-sided t-test of minimum.f1, or the minimum-bid treatment, is insignificant at the 90% level of confidence, and though minimum.f carries a Type II ANOVA F-statistic of 2.9303. More twice-sold cards are likely necessary to formally confirm this regression’s results, though the results are illustrative of the effect on conditional revenue confirmed in the between-cards regressions. Running the regression without the fixed effects also resulted in auction revenues increasing conditional on sale for twice-sold cards.

Page 21
I also make use of the between-cards data to explore how conditional revenues responded to an
increase in the level of the reserve price. I pool cards sold in both experiments to explore the effects of
reserve prices on auction revenue. I model normalized revenue as a function of the reserve prices and all 66
relevant controls. Additionally, I include the parameter experiment, to identify which cards were sold in which 67
experiment. The regression takes the form:
NORMREV = NORMRES.f + created_at + market_price + experiment + e
I report the regression results in Table 5. There is a noticeable increase in normalized revenue conditional on
sale after the 80% reserve price level. I conduct a Tukey HSD test for a pairwise comparison of all normalized
revenues as a function of reserve prices, again employing HC1 errors. We can reject the hypothesis that
revenues conditional on sale decreased for any increase in the reserve price level, for any combination of
levels. As the regression coefficients suggest, there are significant contrasts between normalized revenues
from reserve prices from those within the 0-70% reserve price level and from those within the 80-150%
reserve price levels, at a 90% level of confidence. These contrasts support the claim that revenues conditional
on sale increased with an increase in the reserve price. While this increase is not monotonic or continuous,
the evidence does suggest that the predictions of Riley and Samuelson (1981) hold in this context. Higher
reserve prices correspond to an increase in revenues conditional on sale, though also result in a decrease in
the probability of sale.
7.3 Auction Revenue, Unconditional on Sale
I now examine the general effect of reserve prices on normalized revenue, unconditional on sale. The
predictions of Riley and Samuelson (1981) are ambiguous in this regard. For example, they derive the
following general revenue curve: 68
66 My experimental design allows me to run this joint-data regression, since the underlying pool of bidders is the same in each auction wave. As discussed before, the only difference between the two experimental designs is the starting price. 67 I also specified a model using only the between-cards data. The interpretation is essentially the same as the pooled-data model. We can reject the hypothesis that revenue conditional on sale decreased with any increase in the reserve price, and can in fact demonstrate several contrasts in which conditional revenue improved with an increase in the reserve, at the 90% level of confidence. Simply put, the contrasts in the pooled-data OLS model are more pronounced and still viable given the experimental design setup. 68 Adapted from Reiley (2006), at page 197.

Page 22
This revenue curve is heavily dependent on the underlying, unknown distribution of bidders’ valuations for
each card. Our data consists of a wide variety of cards, with revenue expressed as a fraction of each card’s
standard market price. These two factors make it difficult to test any specific prediction regarding the general
revenue curve, despite its relevance to PackRat auctioneers. In general, we might expect unconditional
revenues to fall off significantly after the imposition of “high” reserve prices -- for example, those well-above
the market price -- as more bidders are screened out the auction. I explore the effects of reserve prices on this
general revenue curve, using both within-cards and between-cards data.
For the within-cards data, I conduct a two-sample t-test for a comparison of means of the
normalized revenues between the two treatment conditions. While the aggregated mean normalized revenue
for cards without a reserve price (0.617) is greater than the aggregated mean normalized revenue for cards
with a reserve price (0.509), this two-sided difference is not statistically significant at the 90% level of
confidence (t = 1.4631, df = 154.33). Because there is no general theoretical prediction, a one-tailed t-test is
inappropriate, though the test outcome would demonstrate a decline in unconditional revenue with the
imposition of reserve prices. 69
To examine this result more thoroughly, I supplement my within-cards data with my between-cards
data, specifying an OLS model on all available data. The regression model is similar to the one on auction
revenue conditional on sale, and takes the form:
NORMREV = NORMRES.f + created_at + market_price + experiment + e
I present the regression results in Table 5. The revenue curve appears to begin at approximately 60% of the 70
cards’ market prices, increases to approximately 70% of market prices at the 10% reserve price level, and then
slowly, but non-monotonically, declines with an increase in the reserve price. Perhaps the most interesting 71
feature is the spike in unconditional normalized revenues at the 50% reserve price level, to approximately
67% of the market price, and a similar spike to 55% in unconditional normalized revenues at the 150%
reserve price level. 72
69 I also break down the normalized revenues by both minimum bid and whether or not the card was the first shown of the pair. Unlike Reiley (2006), the order in which the cards were shown does not have a statistically significant effect on unconditional revenues. The mean revenues for each subgroup are relatively close to their aggregated means. 70 The coefficient on market price is significant at the 90% level of confidence, taking a value of approximately (-0.004). In the context of unconditional revenues, which have already been normalized by market price, implies generally that cards with higher absolute market values have lower expected unconditional revenue. One explanation for this effect is that cards with higher market values may screen out budget-constrained bidders, exacerbating the decline in the probability of sale for these cards. This would be consistent with our between-cards regression on the probability of sale, in which market price likewise took a negative value (-0.002), significant at the 90% level of confidence. The coefficients on the other control variables are statistically significant as well. 71 In particular, the 0% price level only exists in the within-cards experiment, so the adjusted coefficient with the two effects is in fact 0.633. 72 I discuss the behavior at the 150% reserve price level in the section on strategic bidding behavior.

Page 23
Again, while it is difficult to test a general theory in this context, we can examine the claim that the
empirical revenue curve will fall off at very high reserve price levels, as the probability of sale declines
significantly. The shape of the empirical revenue curve as a function of reserve prices generally supports this
claim, though by using Tukey’s HSD Test, the contrasts between individual reserve price levels are generally
statistically insignificant. Reiley (2006) proposes that one compare “low”, “intermediate”, and “very high” 73
aggregated reserve price levels, comparing test statistics from each of these grouped contrasts. Illustratively, 74
I follow a similar technique here, comparing the mean normalized revenues of aggregated reserve price levels
of 0-20% (“low”), 40-60% (“mid”) and 130-140% (“high”) using all available data and a Bonferroni
correction. The mean normalized revenue is significantly higher for “low” reserve prices (mean = 0.579, 107 75
observations) is significantly higher than that of “high” reserve prices (31 observations, mean = 0.117, t =
4.84), and greater than “mid” reserve prices (144 observations, mean = 0.470, t = 1.6625). Revenues from the
“mid” reserve price levels are significantly greater than those of the “high” reserve price levels (t = 3.785).
These results are consistent with the prediction that the empirical revenue curve falls at very high reserve
prices, as the decline in the probability of sale offsets the higher conditional revenues. 76
The revenue curve carries surprising implications for auctioneers on PackRat. Individual, unadjusted
contrasts imply local maxima at the 10% and 150% reserve price levels. The 10% reserve price may permit 77
all bidders to participate in the auction, forcing bidders to reduce the amount they shade their desired bids
while maintaining a high probability of sale, though with some risk of the card being sold at a less-than-ideal
price. At the 150% reserve price level, very few transactions occur, but cards that are sold trade at extremely 78
high values relative to to their market price, enough to offset the significant reduction in the probability of
sale. Auctioneers in PackRat may decide to set reserve prices on either extreme based on their personal
risk-preferences, with desirable results.
73 Without correcting for multiple t-tests, using either Tukey’s HSD or a Bonferroni correction, many of the contrasts are statistically significant. More data to tighten the heteroscedasticity-robust standard errors is likely necessary for these pairwise comparisons to be statistically significant. 74 Reiley (2006), at pages 17-18. It appears as if Reiley (2006) compares the mean unconditional revenues of these subgroups directly through two-sample independent t-tests, which could be appropriate given the statistical insignificance of his control variables. 75 I ran these tests using both data limited to the between-cards experiment, and with all available data. The results are qualitatively similar, though the comparison between “low” and “mid” unconditional revenues is statistically insignificant at the 90% level of confidence, with a Bonferroni correction, using between-cards data. Comparisons of both subgroups to the “high” group with between-cards data are statistically and economically significant, confirming the expected decline in unconditional revenues at very high reserve levels. 76 With the exception of the 150% reserve price level. 77 The 40-50% reserve price range may also constitute a local maximum, but the standard errors are large enough to reject comparisons on either side of the range. 78 This result is consistent with Bulow and Klemperer (1996), who argue that any auction with n+1 bidders are always optimal when compared to an optimal auction with n bidders, though they focus on the English auction format. See: Bulow, Jeremy, and Paul Klemperer. Auctions vs. negotiations. No. w4608. National Bureau of Economic Research, 1994.

Page 24
7.4 Strategic Behavior
Having examined the general revenue curve, I turn to the predictions of strategic behavior implied by
Riley and Samuelson (1981) and explicitly covered by Reiley (2006). With an increase in the reserve price, we
expect that bidders’ equilibrium bidding strategy to have the property db/dr > 0 for bidders with v > r. Thus,
bidders with valuations above the reserve will not raise their bids simply to the level of the reserve, but rather,
to a value above the reserve price. This prediction is easy to test in the first-price, sealed-bid format used by
Reiley (2006), but the Dutch auction format imposes both theoretical and practical limitations. With regard to
theory, because the only bids observed are the winning bids, the strategic behavior we would like to explicitly
observe is confounded by separate, but related, mechanisms that increase conditional revenue. With regard 79
to practical limitations, the first-price, sealed-bid format allows an auctioneer to collect a large volume of data
by including non-winning bids. The Dutch auction format is limited to winning bids, restricting the amount
of data available. Nevertheless, I use both within-cards and between-cards data to examine three hypotheses 80
relating strategic behavior to an increase in the reserve price: first, a decrease in bids submitted at the level of
the reserve, second, an increase in bids submitted above the reserve price, and third, an increase in bids
submitted at the auction’s starting price. 81
From the within-cards experiment, I first examine the change in bids submitted at or greater than the
level of the reserve. In the no-minimum condition (67 cards sold), 8 cards (12% of cards sold) were auctioned
at the minimum bid of one ticket, and 59 cards (88%) were sold at a price greater than a reserve. In the
minimum-bid condition (43 cards sold), 3 (7%) were auctioned at the level of the reserve, and 40 cards (93%)
were auctioned at a price greater than the reserve. While more data is likely necessary to confirm this with any
statistical significance, the qualitative trend supports the prediction of strategic behavior, as the proportion of
cards sold at the reserve decreases with the imposition of reserve prices, and the proportion of cards sold at a
price greater than the reserve increases.
I also examine the distribution of bids for twice-sold cards. By focusing on this subset of the data, we
can observe directly how the submitted bids changed with the imposition of reserve prices, controlling for
79 The function of reserve prices to screen out bidders with low valuations is a key driver to both increases in conditional revenue and in strategic behavior. The former concerns a change in the expected value of the auction; the latter relates to the perceived heightened competition by individual bidders. For example, when we observed higher revenues conditional on sale, we likely observed some interaction of the change in expected value and strategic behavior, which is consistent with the theory but difficult to disentangle in this context. 80 The obvious solution is to run more auctions. As mentioned earlier, my experiment was constrained by time- and market-related factors, especially with regard to changes in demand. 81 The first two effects are tested explicitly by Reiley (2006), and are implied by db/dr > 0 for bidders with v > r. When faced with competition with higher valuations, bidders are less-inclined to wait until the price reaches the reserve to submit a bid. I also contend that bidders reacting strategically to the imposition or increase in reserve prices in this context are more likely to submit bids at the starting price. This constitutes the aggressive bidding behavior we would expect in theory, as bidders are unwilling to risk the loss of the good when faced with stiffer competition.

Page 25
card-specific factors. The primary takeaway from this subset is that the number of cards sold at the starting 82
price increases from 14 to 17 with the imposition of the 60% reserve price, consistent with the prediction of
more aggressive bidding strategies. Additionally, the number of bids submitted at the 80% reserve price level 83
increases from 3 to 8 with the imposition of the 60% reserve price. Conversely, there is mild evidence against
strategic behavior, with more bids submitted at 90% (7 compared to 4) and 100% of the market prices (9
compared to 7) in favor of cards without minimums. More data would need to be collected at these higher
reserve prices to provide convincing evidence of either effect.
The between-cards experiment provides a nuanced approach to strategic behavior in these auctions.
Table 6 contains the number of cards sold at the level of the reserve, the number of cards sold at a higher
price than the reserve, and the total number of cards sold at each reserve price. The general trend suggests
that as the reserve price increases, the number of cards sold at a price greater than the reserve increases. In
fact, from the 90% reserve price onward, cards were only sold at prices greater than the reserve. While more
data would need to be collected to formally confirm this trend, the preliminary results support the predictions
of strategic behavior. 84
A striking example of strategic behavior occurs at the 150% reserve price level. Of the four cards
successfully auctioned, the mean adjusted sale price is 1.94, or 194% of the cards’ standard market values,
with a minimum bid of 190% of the market price. The cards sold, auction waves, and participating buyers 85
are all unique. This aggressive bidding is consistent with the strategic behavior prediction. Bidders with
valuations equal to or greater than 150% of the card’s market price were seemingly aware that their
competition also had valuations greater than 150% of the card’s market price, and adjusted their bidding
strategy to the heightened competition. A similar pattern is observed at the 130% reserve price level, with
three cards sold at a mean normalized revenue of 180% of the cards’ market prices.
While qualitative observations support the predictions of strategic reactions to reserve prices in this
Dutch auction experiment, I stress that these stylized facts are at best weak evidence. More observations from
82 In particular, controlling for the underlying distribution of bidders’ valuations. 83 One concern with this qualitative analysis could be a bidder exclusion effect, as the bidder with the highest valuation for the card may not participate in the second auction, given participation in the first. While there are enough daily active players on PackRat, all potential bidders, to alleviate these concerns, I examine the distributions of cards that appeared first and cards that appeared second. Evidence of strategic behavior is actually more pronounced in the second-appearance auctions. For example, in the set of second-appearance cards, 10 cards were sold at the starting price of 110% when reserve prices were employed, compared to only 3 in the second-appearance, no-reserve condition. 84 For some reserve price levels, this claim is trivial, with only one card sold at that reserve price level. Reiley (2006) also notes some difficulty in observing successful transactions at high reserve prices. 85 These large values are also the key driver to the observed unconditional revenue curve at the 150% reserve price level. The cards that are sold attain revenues that offset the large decline in the probability of sale.

Page 26
the field or a controlled laboratory experiment would be necessary to confirm these findings with statistical
significance, or to reveal behavior to the contrary. 86
8 Conclusion
In this study, I implemented a field experiment testing the effects of the existence and level of
reserve prices on Dutch auction outcomes in a virtual environment. While there were certain limitations and
drawbacks to my experimental design, particularly concerning the number of bidders, I was able to satisfy
many of the assumptions of Riley and Samuelson (1981) to conduct a conditional test of the theory’s
predictions regarding auction outcomes.
The results from this paper uphold the predictions of Riley and Samuelson (1981). Reserve prices
tended to decrease the probability of sale and increase revenues conditional on sale. Though unobserved in
this experiment, the screening effect implied by the decrease in the probability of sale is also consistent with a
decrease in the number of bidders. While predictions regarding the general shape of the revenue curve are
ambiguous, its empirical shape was mostly consistent with the theory, with a decline in unconditional
revenues observed at very high reserve prices. The results also provide qualitative evidence supporting the
prediction that bidders behave strategically to reserve prices, bidding more aggressively when facing
competition with higher valuations. This strategic behavior is likely responsible for the anomalous behavior of
the unconditional revenue curve at the highest reserve price level, though more evidence is required to make a
definitive conclusion on strategic behavior. Finally, by verifying the predictions of Riley and Samuelson
(1981), I provide field evidence in conjunction with Reiley (2006) for the strategic equivalence of Dutch
auctions and first-price, sealed-bid auctions. While the magnitudes and specific reactions may differ, the
general theoretical predictions were upheld in both field experiments and auction formats.
I conclude with three suggestions for future research. First, the results of this paper would be
strengthened by additional data. My experiment was limited by time- and market-constraints; perhaps Dutch
auctions in a different field environment could accumulate a higher volume of data. Second, research on
Dutch auctions in this environment would benefit from a better understanding of the number of bidders.
While I was able to control for the number of bidders, I was unable to observe the exact numbers
participating in each auction wave. Future experiments on Dutch auctions may be able to incorporate the
number of bidders into their analyses, and perhaps test theoretical predictions associating reserve prices with
endogenous entry. Third, the results from this field experiment would benefit greatly from a companion
laboratory study. While the assumptions of Riley and Samuelson (1981) were approximately true in this
86 It is difficult to characterize evidence contradicting strategic behavior with the data available. Selling a good at the level of the reserve, for example, does not necessarily contradict predictions of strategic behavior, especially when accounting for the discrete price intervals and the rounding used in this paper.

Page 27
environment, a controlled analysis of reserve prices in the Dutch auction format would be valuable.
Moreover, a laboratory experiment may be able to collect more nuanced bid data. For example, by allowing
bidders to submit bids even after the submission of the winning bid, the auctioneer can empirically observe
predictions regarding the number of bids and strategic behavior in response to changes in the reserve price,
an auction design parameter unlikely to exist in the field.

Page 28
References
Angrist, Joshua D., and Jörn-Steffen Pischke. Mostly harmless econometrics: An empiricist's companion.
Princeton university press, 2008
Athey, Susan, and Philip A. Haile. "Identification of standard auction models." Econometrica 70, no. 6 (2002):
2107-2140.
Athey, Susan, and Philip Haile. "Nonparametric approaches to auctions." Handbook of econometrics 6, no. Part A
(2007): 3847-3965.
Belica, M., and K. M. Ehrhart. Reference-dependent bayesian games. Working Paper, 2013.
Bajari, Patrick, and Ali Hortacsu. "The winner's curse, reserve prices, and endogenous entry: Empirical
insights from eBay auctions." RAND Journal of Economics (2003): 329-355.
Black, John, Nigar Hashimzade, and Gareth Myles. "first-price auction." In A Dictionary of Economics. : Oxford
University Press, 2009.
Brendstrup, Bjarne, and H. Paarsch. Nonparametric estimation of Dutch and first-price, sealed-bid auction models with
asymmetric bidders. Working Paper, University of Iowa Department of Economics, 2003
Budish, Eric, and Judd B. Kessler. Bringing Real Market Participants' Real Preferences into the Lab: An Experiment
that Changed the Course Allocation Mechanism at Wharton. No. w22448. National Bureau of Economic
Research, 2016.
Bulow, Jeremy, and Paul Klemperer. Auctions vs. negotiations. No. w4608. National Bureau of Economic
Research, 1994.
Castronova, Edward. "A test of the law of demand in a virtual world: Exploring the petri dish approach to
social science." (2008).
Castronova, Edward. Synthetic worlds: The business and culture of online games. University of Chicago press, 2008.
Chesney, Thomas, Swee-Hoon Chuah, and Robert Hoffmann. "Virtual world experimentation: An
exploratory study." Journal of Economic Behavior & Organization 72, no. 1 (2009): 618-635.
Choi, Syngjoo, Lars Nesheim, and Imran Rasul. "Reserve price effects in auctions: estimates from multiple
RD designs." (2015).
Coppinger, Vicki M., Vernon L. Smith, and Jon A. Titus. "INCENTIVES AND BEHAVIOR IN
ENGLISH, DUTCH AND SEALED-BID AUCTIONS." Economic inquiry 18, no. 1 (1980): 1-22.
Cox, James C., Bruce Roberson, and Vernon L. Smith. "Theory and behavior of single object auctions."
Research in experimental economics 2, no. 1 (1982): 1-43.
Cox, James C., Vernon L. Smith, and James M. Walker. "A test that discriminates between two models of the
Dutch-first auction non-isomorphism." Journal of Economic Behavior & Organization 4, no. 2-3 (1983):
205-219.

Page 29
"Dutch auction." In A Dictionary of Business and Management, edited by Law, Jonathan.: Oxford University
Press, 2016.
Deke, John. “Using the Linear Probability Model to Estimate Impacts on Binary Outcomes in Randomized
Controlled Trials.” Evaluation Technical Assistance Brief for OAH & ACYF Teenage Pregnancy
Prevention Grantees, Brief no. 6. (2014).
Ehrhart, K. M., and M. Ott. Reference-dependent bidding in dynamic auctions. Mimeo, 2014.
Haile, Philip A. Auctions with resale. Social Systems Research Institute, University of Wisconsin, 1999.
Horrace, William C., and Ronald L. Oaxaca. "Results on the bias and inconsistency of ordinary least squares
for the linear probability model." Economics Letters 90, no. 3 (2006): 321-327.
Katkar, Rama, and David Lucking-Reiley. Public versus secret reserve prices in Ebay Auctions: Results from a Pokémon
field experiment. No. w8183. National bureau of economic research, 2001.
Katok, Elena, and Anthony M. Kwasnica. "Time is money: The effect of clock speed on seller’s revenue in
Dutch auctions." Experimental Economics 11, no. 4 (2008): 344-357.
Levin, Dan, and Emre Ozdenoren. "Auctions with uncertain numbers of bidders." Journal of Economic Theory
118, no. 2 (2004): 229-251.
Levin, Dan, and James L. Smith. "Equilibrium in auctions with entry." The American Economic Review (1994):
585-599.
Lucking-Reiley, David. "Using field experiments to test equivalence between auction formats: Magic on the
Internet." American Economic Review (1999): 1063-1080.
Milgrom, Paul R., and Robert J. Weber. "A theory of auctions and competitive bidding." Econometrica: Journal
of the Econometric Society (1982): 1089-1122.
Myerson, Roger B. "Optimal auction design." Mathematics of operations research 6, no. 1 (1981): 58-73.
Ostrovsky, Michael, and Michael Schwarz. "Reserve prices in internet advertising auctions: a field
experiment." In Proceedings of the 12th ACM conference on Electronic commerce, pp. 59-60.
ACM, 2011.
Peters, Michael, and Sergei Severinov. "Internet auctions with many traders." Journal of Economic Theory 130,
no. 1 (2006): 220-245.
Prendergast, Canice. "The Allocation of Food to Food Banks." (2016).
"Reserve price." In A Dictionary of Business and Management, edited by Law, Jonathan. : Oxford University Press,
2016.
Riley, John G., and William F. Samuelson. "Optimal auctions." The American Economic Review 71, no. 3 (1981):
381-392.
Rosenkranz, Stephanie, and Patrick W. Schmitz. "Reserve prices in auctions as reference points." The Economic
Journal 117, no. 520 (2007): 637-653.

Page 30
Samuelson, William F. "Competitive bidding with entry costs." Economics letters 17, no. 1-2 (1985): 53-57.
Sönmez, Tayfun, and M. Utku Ünver. "Course bidding at business schools." International Economic Review 51,
no. 1 (2010): 99-123.
Trautmann, Stefan T., and Christian Traxler. "Reserve prices as reference points–Evidence from auctions for
football players at Hattrick. org." Journal of Economic Psychology 31, no. 2 (2010): 230-240.
Turocy, Theodore L., Elizabeth Watson, and Raymond C. Battalio. "Framing the first-price auction."
Experimental Economics 10, no. 1 (2007): 37-51.
Vickrey, William. "Counterspeculation, auctions, and competitive sealed tenders." The Journal of finance 16, no.
1 (1961).
Wooldridge, Jeffrey M. Introductory econometrics: A modern approach. Nelson Education, 2015

Page 31
Table 1: Summary Statistics for Within-Cards Experiments
All Within-Cards Twice-Sold Cards
Number of Cards Auctioned 158 86
Number of Cards Sold 110 86
Matching Pairs 79 43
Unique Buyers 74 53
Total Revenue (Tickets) 2421 2079
Mean Normalized Sale Price 0.81 0.91
Number of Auction Waves 49 39
Minimum Bid First? 34 18
No Minimum First? 46 25
Table 2: Summary Statistics for Between-Cards Experiments and Pooled Data
Between-Cards Pooled Data
Number of Cards Auctioned 250 408
Number of Cards Sold 72 182
Unique Buyers 52 105
Total Revenue (Tickets) 1646 4068
Number of Auction Waves 50 50
Mean Reserve Level 80% 60%
Mean Normalized Sale Price 1.03 0.896

Page 32

Page 33
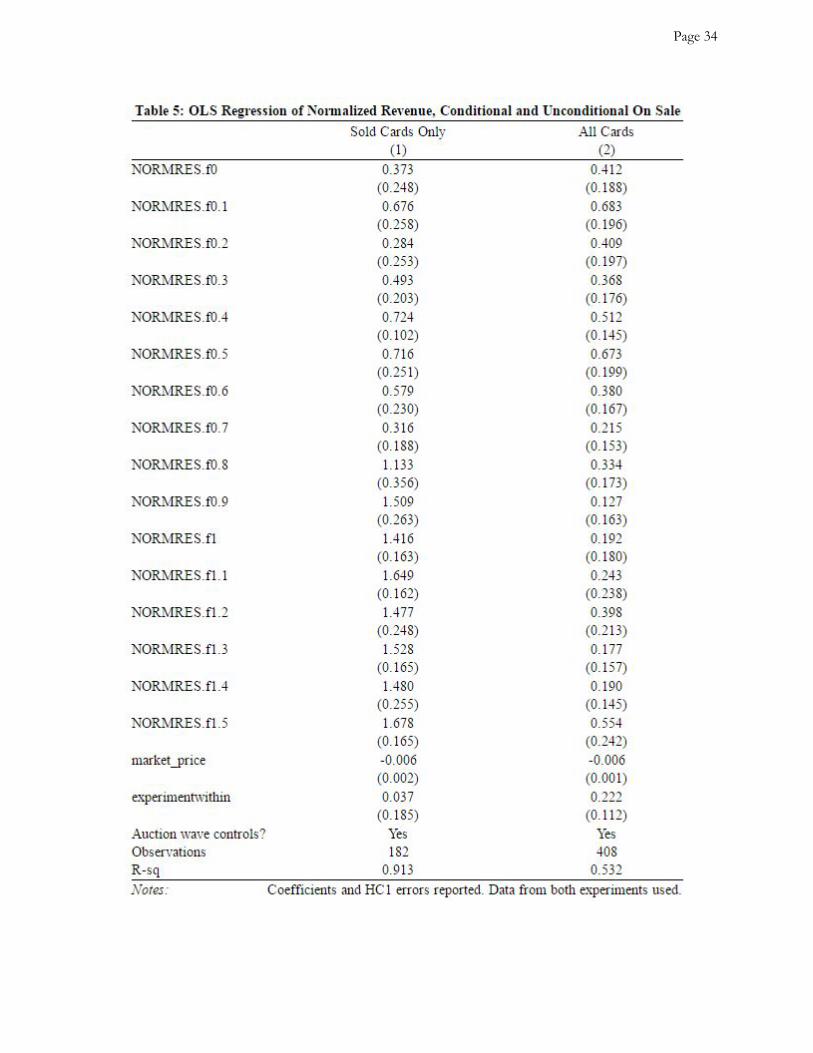
Page 34

Page 35
Table 6: Sale Price and Reserve Prices, Between-Cards
Reserve
Price
10% 20% 30% 40% 50% 60% 70% 80% 90% 100% 110% 120% 130% 140% 150%
Sale
Equals
Reserve
2 2 2 2 5 2 2 1 0 0 0 0 0 0 0
Sale
Greater
than
Reserve
7 6 5 11 6 4 1 2 1 1 1 3 1 1 4
Total 9 8 7 13 11 6 3 3 1 1 1 3 1 1 4

Page 36
Appendix A
A.1 Definitions
Because auction terms have been used interchangeably -- for example, the distinction between a
single-unit Dutch auction, and the multiunit Dutch Flower Auction -- I provide standard definitions of the
terms used for convenience.
● Dutch Auction: “Here the auctioneer starts by announcing a price level thought to be higher than
any buyer is willing to pay. The auctioneer then decreases the price in decrements until the first buyer
accepts by shouting “mine.” The name derives from the auctioning of flowers in Holland many years
ago.” 87
● First-Price, Sealed-Bid Auction: “Here bidders make their bids simultaneously and put them in sealed
envelopes. The highest bidder is then awarded the item. The weekly auction of U.S. treasury
securities uses this procedure.” 88
● Reserve Price: “The lowest price a seller is willing to accept for an article offered for sale by public
auction. If the reserve price is not reached by the bidding, the auctioneer is instructed to withdraw
the article from sale.” 89
A.2 Strategic Equivalence
It is a well-established fact in canonical auction theory that the first-price, sealed-bid auction is the
strategic equivalent of the first-price, descending auction. A formal analysis of this proposition was first
explored by Vickrey (1961). An informal explanation is offered by Milgrom and Weber (1982): 90
“Recall that in the Dutch auction, the auctioneer begins by naming a very high price and then lowers
it continuously until some bidder stops the auction and claims the object for that price. An insight
due to Vickrey is that the decision faced by a bidder with a particular valuation is essentially static, i.e.
the bidder must choose the price level at which he will claim the object if it has not yet been claimed.
The winning bidder will be the one who chooses the highest level, and the price he pays will be equal
to that amount. This, of course, is also the way that the winner and price are determined in the
sealed-bid first-price auction. Thus, the same set of strategies and the mapping from strategies to
87 "Dutch auction." In A Dictionary of Business and Management, edited by Law, Jonathan.: Oxford University Press, 2016. 88 Black, John, Nigar Hashimzade, and Gareth Myles. "first-price auction." In A Dictionary of Economics. : Oxford University Press, 2009. 89 "Reserve price." In A Dictionary of Business and Management, edited by Law, Jonathan. : Oxford University Press, 2016. 90 Vickrey (1961).

Page 37
outcomes are the same for both auction forms. Consequently, the equilibria of the two auction games
must coincide.” 91
To summarize, bidders must make the same tradeoffs regarding the probability of winning and their potential
payoff in both the Dutch auction the the first-price, sealed-bid auction. This results in the same Bayesian
Nash Equilibrium bidding strategies, and therefore, a strategic equivalence between the two auction formats.
A.3 Riley and Samuelson (1981) Auction Definition
Riley and Samuelson (1981) begin by characterizing auction formats with four common properties:
first, bidders submit bids above the minimum price, second, buyers with the highest bid are awarded the
object, third, bidders are treated equally, and fourth, there is a common equilibrium strategy for each bidder,
as a strictly increasing function of their valuation. The first, second, and third conditions are applicable to 92
the Dutch auction format upon trivial examination. The fourth condition is assumed true of bidding strategies
in general. 93
Appendix B
Linear probability models have been heavily scrutinized in economic literature. In particular, there are a four 94
textbook concerns with using OLS to estimate a discrete, binary variable: first, predicted probabilities are not
bounded between 0 and 1, second, probability cannot be “linearly related to the independent variables for all
their possible values”, third, the variance of a binary variable violates the Gauss-Markov assumption, taking
the form Var(y|x) = p(x)[1-p(x)], and fourth, the error term violates the normality assumption. However, for 95
the purposes of this study, there is sufficient justification to use linear probability models.
● First, by regressing the probability of sale on each discrete reserve-price bin, we take the mean
probability of sale for each reserve price level. This, unlike the log-odds output of a binomial logistic
regression, is simple to interpret and compare across reserve price bins. Moreover, the regression
model itself is essentially a non-parametric function of the reserve price, and is used in Reiley (2006).
91 Milgrom, Paul R., and Robert J. Weber. "A theory of auctions and competitive bidding." Econometrica: Journal of the Econometric Society (1982): 1089-1122. Quote taken from p. 1091. 92 Riley and Samuelson (1981), p. 382-383. 93 Myerson (1981) outlines a similar model to Riley and Samuelson (1981) and provides a more formal take upon this fourth condition, requiring bidding strategies to be continuous and strictly increasing as a function of one’s valuation. 94 Horrace, William C., and Ronald L. Oaxaca. "Results on the bias and inconsistency of ordinary least squares for the linear probability model." Economics Letters 90, no. 3 (2006): 321-327. 95 Wooldridge, Jeffrey M. Introductory econometrics: A modern approach. Nelson Education, 2015, at pages 251-252.

Page 38
● Second, we are following an experimental design with the random allocation of cards across auction
waves, and random allocation to each reserve-price level. We are investigating the “average treatment
effect” at each reserve price level. While covariates should improve the precision of our fit,
ultimately, the average treatment effect should be well-estimated by OLS, even with multiple
reserve-price bins.
● Third, there is little reason to believe that the linear probability models would generate results that
deviate significantly from the logistic regression. I report heteroskedasticity-consistent (“HC1”)
errors when appropriate, though they do not meaningfully change my analysis of the results. In many
situations, they are similar to the standard errors reported in vanilla OLS.
● Fourth, to verify my results, I run a binomial logistic regression to estimate the effect of reserve
prices on the probability of sale, and observe qualitatively the same results.
● Fifth, the use of linear probability models has been justified in econometric literature. Woolridge
notes that, “in many applications, the usual OLS statistics are not far off, and it is still acceptable in
applied work to present a standard OLS analysis of a linear probability model.” 96
● Sixth, in the case of a binary treatment variable, many criticisms of the linear probability model are
irrelevant. Functional form critiques are not important when estimating the impact of the treatment 97
variable. The impact estimate should be unbiased, given that it is uncorrelated with potential
covariates.
Appendix C
In this section, I provide and discuss the controls used in my regression models. In general, the controls do
not significantly change my analysis of the effect of reserve prices on auction outcomes.
● Created_at: This time-based variable is a control for each auction wave. I especially intend for this
control variable to account for how the underlying number of potential bidders may have changed
from auction-to-auction. For example, a certain subset of users may login on Saturday and Sunday,
but refrain from playing the rest of the week. Created_at accounts for this exogenous variation in the
number of potential bidders, in addition to dynamic changes to the platform. Since cards from both
96 Woolridge (2015), at page 252. Angrist and Pischke (2008) also present a spirited defense of linear probability models in “Mostly Harmless Econometrics.” See: Angrist, Joshua D., and Jörn-Steffen Pischke. Mostly harmless econometrics: An empiricist's companion. Princeton university press, 2008, at pages 103-107. 97 Deke, John. “Using the Linear Probability Model to Estimate Impacts on Binary Outcomes in Randomized Controlled Trials.” Evaluation Technical Assistance Brief for OAH & ACYF Teenage Pregnancy Prevention Grantees, Brief no. 6. (2014).

Page 39
experiments were randomly assigned to each auction wave, there is no meaningful correlation
between the assigned reserve prices level and time.
● Market_Price: This is used to control for the market price of the card, which may influence players’
purchasing decisions independently of the reserve price. High-priced cards, for example, may screen
out a significant number of players who can’t afford it, an effect independent of the normalized
reserve price level.
● Kind: For the within-cards analysis, Kind allows for a full-set of card-specific fixed effects, accounting
for differences in demand across all cards compared. This, in turn, allows me to estimate the
within-cards effect of the imposition of reserve prices.
● Experiment: When running a full-dataset regression, Experiment serves as a correction for the different
starting prices used in the within-cards and between-cards experiment design.
● Earliest_obs: I use this dummy variable for the within-cards analysis, to indicate if a given card was the
first of its pair to be auctioned.