Embed Size (px)
Citation preview

DUST STORM DETECTION USING MODIS DATA OVER THE MIDDLE EAST
A. Zandkarimi 1, *, P. Fatehi 2
1 Dept. of Remote Sensing, Tabriz University, Tabriz, Iran- [email protected]
2 Dept. of Forestry and Forest Economics, Faculty of Natural Resources, University of Tehran, Karaj, Iran- [email protected]
Commission VI, WG VI/4
KEY WORDS: Detection, Dust, MODIS, Remote sensing, Evaluation, Middle East.
ABSTRACT:
Dust storms are one of the common phenomena in the arid and semi-arid regions which cause many economic and environmental
losses also affect human health. Therefore, it is necessary to be able to detect dust storms. Several methods exist for dust monitoring,
such as Ground-based measurements, satellite remote sensing, video surveillance, wireless sensors. Remote sensing technology
provides wide coverage, high spectral and temporal resolutions, even near real-time data, which can offer a valuable data source for
dust storm monitoring. We used an algorithm based on Moderate Resolution Imaging Spectroradiometer (MODIS) images for
detecting dust storm over the Middle East. The proposed algorithm uses the brightness temperature using multi-bands. The
performance of the algorithm was evaluated using the ground-based observations of synoptic stations. The results showed that by
applying the algorithm, the dust area can be clearly separated, especially in the regions that cloud is mixed with dust and achieved
overall accuracy was ~78%.
1. INTRODUCTION
Dust storms occur frequently in the windy arid and semi-arid
regions (Awad and Mashat 2013, Taghavi et al., 2017). The
majority of dust aerosol sources are generated from the west
coast of North Africa, the Middle East region, Central and
South Asia, and China (Prospero et al. 2002).
Dust storms have a huge impact on the air quality (Gunaseelan
et al., 2014), human health (Morabbi, 2011), economic
condition (Jafari & Malekian, 2015), ecosystem services (Singh
et al., 2008), and atmospheric radiation (DeMott et al., 2003).
Thus, it is crucial to be able to monitor dust storms to reduce
dust-caused damages.
Dust storms are the result of the combination of dry conditions
and strong wind draws, which in turn raise a large amount of
dust from the land into the sky. It makes air quality problems
and reduce visibility to less than 1 km (Samadi et al., 2014).
This event occurs commonly and frequently in many parts of
the Middle East. In fact, the Middle East is one of the most
dust-prone regions with a frequent occurrence of dust storms
(Kutiel & Furman, 2003). In recent decades, there has been a
rapid increase in the occurrence of the dust storm in the Middle
East. (Khoshakhlagh et al., 2012). The strong wind in this
region contributes to the long-range transport of dust, thereby
the large parts of the area are affected by dust storms (Shao,
2008).
According to the World Meteorological Organization (WMO)
protocol, dust events are classified according to visibility into
the following categories: (1) dust in suspension, visibility>10
km; (2) blowing dust, 1 km< visibility<10 km; (3) dust storm,
200 m<visibility <1,000 m; and (4) Sever dust storm,
visibility<200 m (Shao and Dang 2006).
Due to the high spatial variability of dust occurrence make the
in-situ measurement limited, however, satellite remote sensing
technology, which has a high temporal and spatial monitoring
capability, becomes an effective tool for dust storm survey
(Kaufman et al., 2002; Al-Dousari et al., 2017). In particular,
many previous studies have used Moderate Resolution Imaging
Spectroradiometer (MODIS) imagery for dust detection (Zhang
et al., 2008; Jafari and Malekian, 2015; Butt & Mashat, 2018).
Numerous researchers have explored different MODIS spectral
wavelengths such as, the Infra-red (IR) wavelengths (e.g. Wald
et al. 1998; She et al., 2018) or a combination of visible and
infrared spectral bands (e.g. Shenk and Curran 1974;Samadi et
al. 2014; Albugami et al., 2018) to detect dust storm. As a
result, the less attention is given to the longer wavelength for
mapping dust storm therefore, in this study the dust detection
algorithm using thermal infrared channels is explored.
In this paper, a dust detection algorithm based on Moderate
Resolution Imaging Spectroradiometer (MODIS) over the
Middle East region is proposed. Additionally, 211 synoptic
stations covering a 1-year time period is used for validating the
reliability of the algorithm. The suggested algorithm has
resolved the limitation to the common issues reported by
previous studies (i.e. Problems with seasonal changes and with
dust discrimination from other objects like clouds).
2. DATA AND STUDY AREA
2.1 STUDY AREA
The study region is composed of a major part of the Middle
East, i.e., Iraq, Syria, Jordan, Iran, Saudi Arabia and Turkey.
Basically, it is one of the largest dust sources in the world. Most
of these areas are located in the semi-arid and arid region and
have many deserts (figure 1).
The International Archives of the Photogrammetry, Remote Sensing and Spatial Information Sciences, Volume XLII-4/W18, 2019 GeoSpatial Conference 2019 – Joint Conferences of SMPR and GI Research, 12–14 October 2019, Karaj, Iran
This contribution has been peer-reviewed. https://doi.org/10.5194/isprs-archives-XLII-4-W18-1147-2019 | © Authors 2019. CC BY 4.0 License.
1147
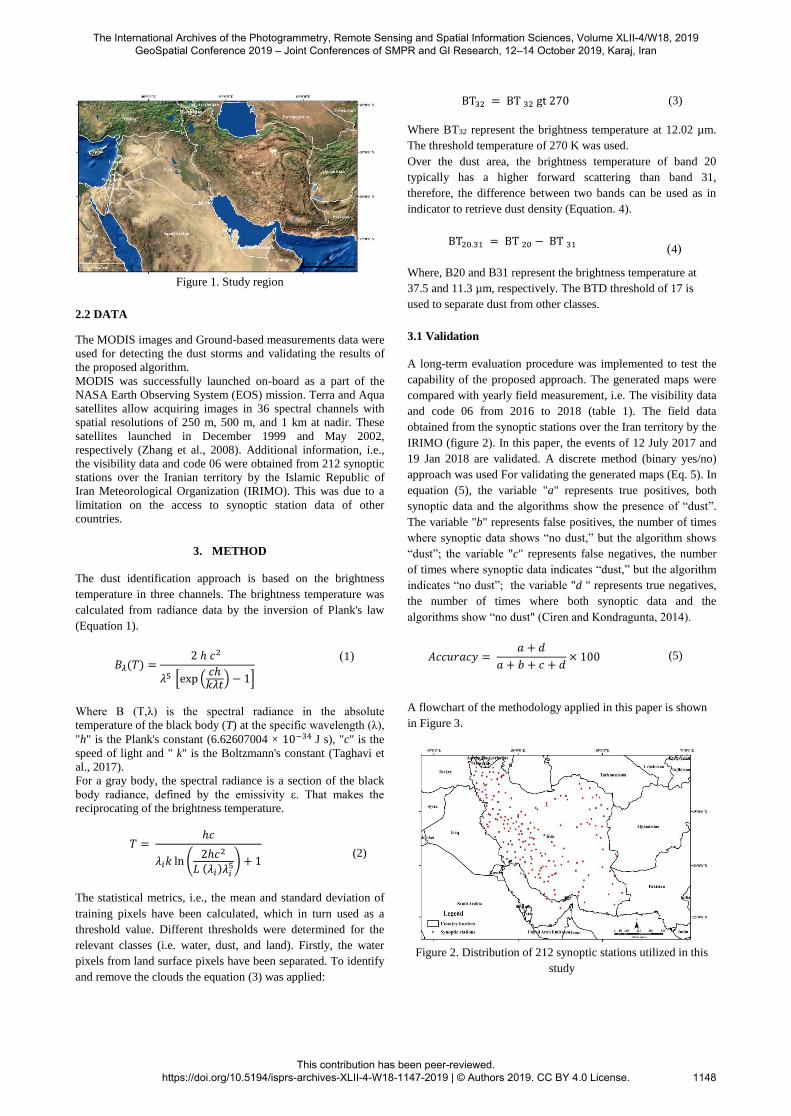
Figure 1. Study region
2.2 DATA
The MODIS images and Ground-based measurements data were
used for detecting the dust storms and validating the results of
the proposed algorithm.
MODIS was successfully launched on-board as a part of the
NASA Earth Observing System (EOS) mission. Terra and Aqua
satellites allow acquiring images in 36 spectral channels with
spatial resolutions of 250 m, 500 m, and 1 km at nadir. These
satellites launched in December 1999 and May 2002,
respectively (Zhang et al., 2008). Additional information, i.e.,
the visibility data and code 06 were obtained from 212 synoptic
stations over the Iranian territory by the Islamic Republic of
Iran Meteorological Organization (IRIMO). This was due to a
limitation on the access to synoptic station data of other
countries.
3. METHOD
The dust identification approach is based on the brightness
temperature in three channels. The brightness temperature was
calculated from radiance data by the inversion of Plank's law
(Equation 1).
𝐵𝜆(𝑇) =2 ℎ 𝑐2
𝜆5 [exp (𝑐ℎ
𝑘𝜆𝑡) − 1]
(1)
Where B (T,λ) is the spectral radiance in the absolute
temperature of the black body (T) at the specific wavelength (λ),
"h" is the Plank's constant (6.62607004 × 10⁻³⁴ J s), "c" is the
speed of light and " k" is the Boltzmann's constant (Taghavi et
al., 2017).
For a gray body, the spectral radiance is a section of the black
body radiance, defined by the emissivity ε. That makes the
reciprocating of the brightness temperature.
𝑇 = ℎ𝑐
𝜆𝑖𝑘 ln (2ℎ𝑐2
𝐿 (𝜆𝑖)𝜆𝑖5) + 1
(2)
The statistical metrics, i.e., the mean and standard deviation of
training pixels have been calculated, which in turn used as a
threshold value. Different thresholds were determined for the
relevant classes (i.e. water, dust, and land). Firstly, the water
pixels from land surface pixels have been separated. To identify
and remove the clouds the equation (3) was applied:
BT32 = BT 32 gt 270 (3)
Where BT32 represent the brightness temperature at 12.02 µm.
The threshold temperature of 270 K was used.
Over the dust area, the brightness temperature of band 20
typically has a higher forward scattering than band 31,
therefore, the difference between two bands can be used as in
indicator to retrieve dust density (Equation. 4).
BT20.31 = BT 20 − BT 31
(4)
Where, B20 and B31 represent the brightness temperature at
37.5 and 11.3 µm, respectively. The BTD threshold of 17 is
used to separate dust from other classes.
3.1 Validation
A long-term evaluation procedure was implemented to test the
capability of the proposed approach. The generated maps were
compared with yearly field measurement, i.e. The visibility data
and code 06 from 2016 to 2018 (table 1). The field data
obtained from the synoptic stations over the Iran territory by the
IRIMO (figure 2). In this paper, the events of 12 July 2017 and
19 Jan 2018 are validated. A discrete method (binary yes/no)
approach was used For validating the generated maps (Eq. 5). In
equation (5), the variable "a" represents true positives, both
synoptic data and the algorithms show the presence of “dust”.
The variable "b" represents false positives, the number of times
where synoptic data shows “no dust,” but the algorithm shows
“dust”; the variable "c" represents false negatives, the number
of times where synoptic data indicates “dust,” but the algorithm
indicates “no dust”; the variable "d " represents true negatives,
the number of times where both synoptic data and the
algorithms show “no dust" (Ciren and Kondragunta, 2014).
𝐴𝑐𝑐𝑢𝑟𝑎𝑐𝑦 = 𝑎 + 𝑑
𝑎 + 𝑏 + 𝑐 + 𝑑× 100 (5)
A flowchart of the methodology applied in this paper is shown
in Figure 3.
Figure 2. Distribution of 212 synoptic stations utilized in this
study
The International Archives of the Photogrammetry, Remote Sensing and Spatial Information Sciences, Volume XLII-4/W18, 2019 GeoSpatial Conference 2019 – Joint Conferences of SMPR and GI Research, 12–14 October 2019, Karaj, Iran
This contribution has been peer-reviewed. https://doi.org/10.5194/isprs-archives-XLII-4-W18-1147-2019 | © Authors 2019. CC BY 4.0 License.
1148

Gathering of appropriate MODIS images
(Dusty Days) and synoptic observations
Georeferencing Data preparation
Mosaicing
Calculation of brightness temperature
Execution different dust indices
Implementation of Determination of threshold
the method Implementation of the algorithm
Computation of visibility data
Preparation different
outputs
Investigation of the relations between Analysis of the
visibility data and output results
Validation Interpretation of the results
Figure 3. The flow chart of the study
4. RESULTS AND DISCUSSIONS
In this study, MODIS satellite imagery was used for detecting
dust storm events over the Middle East. We focused on using
the thermal infrared channel to develop an algorithm with a
minimum false. In order to evaluate the proposed algorithm
ground observations were obtained from the synoptic stations.
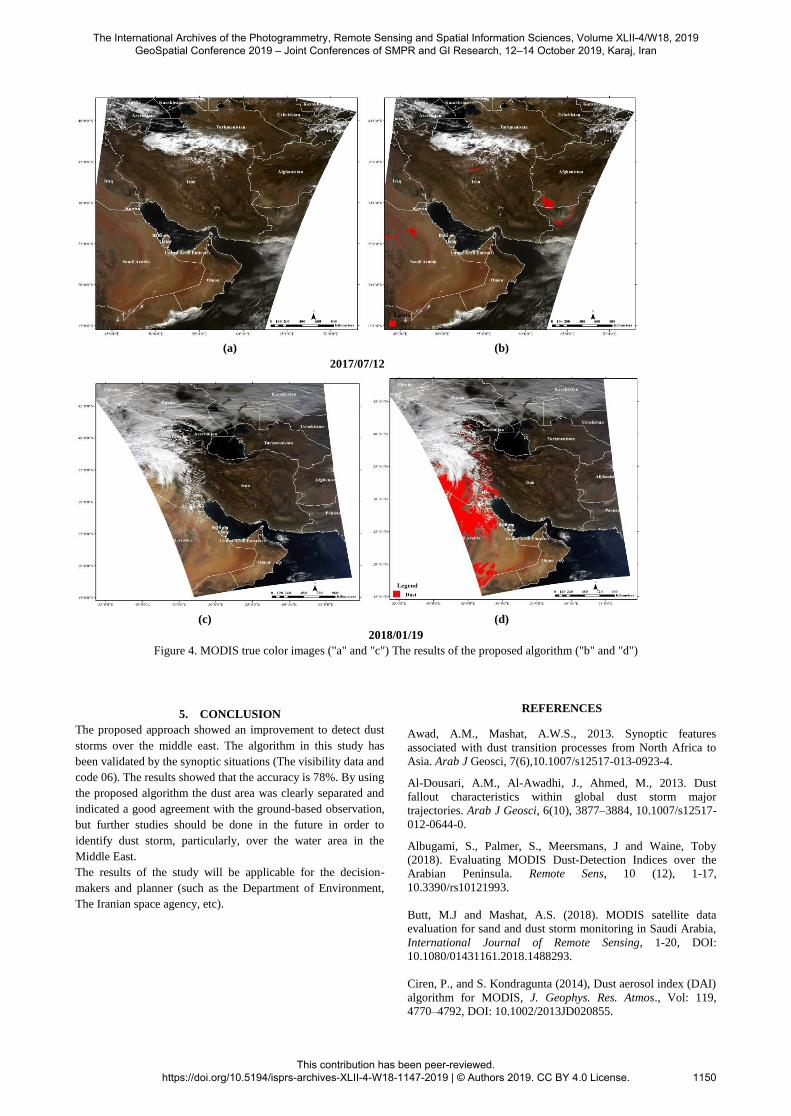
Figure 4 indicates the dust detection results in which dust pixels
are shown in red color. Figure 4 ("b" and "d") shows that the
dust storm is mixed with the clouds. As shown the dusty areas
were clearly distinguished by applying the proposed approach
(Figure 4 ("a" and "c" images)). The quantitative validation of
detected areas based on the ground-based observations is shown
in Table 1. It is important to mention that the difference time
between MODIS data acquisition and Ground-based
observations were less than 20 min.
Table 1. The result of Validation
ID Accuracy
The proposed algorithm 78%
As shown in Table 1, the accuracy is ~ 78%.
Pre-p
roce
ssin
g
Pro
cess
ing
A
naly
sis
of
the
resu
lts
The International Archives of the Photogrammetry, Remote Sensing and Spatial Information Sciences, Volume XLII-4/W18, 2019 GeoSpatial Conference 2019 – Joint Conferences of SMPR and GI Research, 12–14 October 2019, Karaj, Iran
This contribution has been peer-reviewed. https://doi.org/10.5194/isprs-archives-XLII-4-W18-1147-2019 | © Authors 2019. CC BY 4.0 License.
1149
(a)
2017/07/12
(b)
(c) (d)
2018/01/19
Figure 4. MODIS true color images ("a" and "c") The results of the proposed algorithm ("b" and "d")
5. CONCLUSION
The proposed approach showed an improvement to detect dust
storms over the middle east. The algorithm in this study has
been validated by the synoptic situations (The visibility data and
code 06). The results showed that the accuracy is 78%. By using
the proposed algorithm the dust area was clearly separated and
indicated a good agreement with the ground-based observation,
but further studies should be done in the future in order to
identify dust storm, particularly, over the water area in the
Middle East.
The results of the study will be applicable for the decision-
makers and planner (such as the Department of Environment,
The Iranian space agency, etc).
REFERENCES
Awad, A.M., Mashat, A.W.S., 2013. Synoptic features
associated with dust transition processes from North Africa to
Asia. Arab J Geosci, 7(6),10.1007/s12517-013-0923-4.
Al-Dousari, A.M., Al-Awadhi, J., Ahmed, M., 2013. Dust
fallout characteristics within global dust storm major
trajectories. Arab J Geosci, 6(10), 3877–3884, 10.1007/s12517-
012-0644-0.
Albugami, S., Palmer, S., Meersmans, J and Waine, Toby
(2018). Evaluating MODIS Dust-Detection Indices over the
Arabian Peninsula. Remote Sens, 10 (12), 1-17,
10.3390/rs10121993.
Butt, M.J and Mashat, A.S. (2018). MODIS satellite data
evaluation for sand and dust storm monitoring in Saudi Arabia,
International Journal of Remote Sensing, 1-20, DOI:
10.1080/01431161.2018.1488293.
Ciren, P., and S. Kondragunta (2014), Dust aerosol index (DAI)
algorithm for MODIS, J. Geophys. Res. Atmos., Vol: 119,
4770–4792, DOI: 10.1002/2013JD020855.
The International Archives of the Photogrammetry, Remote Sensing and Spatial Information Sciences, Volume XLII-4/W18, 2019 GeoSpatial Conference 2019 – Joint Conferences of SMPR and GI Research, 12–14 October 2019, Karaj, Iran
This contribution has been peer-reviewed. https://doi.org/10.5194/isprs-archives-XLII-4-W18-1147-2019 | © Authors 2019. CC BY 4.0 License.
1150

DeMott, P. J., Sassen, K., Poellot, M., Baumgardner, D.,
Rogers, D. C., Brooks, S., Prenni, A.J and Kreidenweis, S.M
(2003). African dust aerosols as atmospheric ice nuclei.
Geophysical Research Letters, 30 (14), 1-4,
10.1029/2003GL017410.
Gunaseelan, I., B. V. Bhaskar, and Muthuchelian K.. 2014. The
Effect of Aerosol Optical Depth on Rainfall with Reference to
Meteorology over Metro Cities in India, Environmental Science
and Pollution Research, 21 (13), 8188–8197. 10.1007/s11356-
014-2711-4.
Jafari, R., Malekian, M., 2015. Comparison and evaluation of
dust detection algorithms using MODIS Aqua/Terra Level 1B
data and MODIS/OMI dust products in the Middle East.
International Journal of Remote Sensing. 36 (2), 597–617,
https://doi.org/10.1080/01431161.2014.999880.
Kaufman, Y.J., Tanre, D., Boucher, O., 2002. A satellite view
of aerosols in the climate system. Nature. 419, 215–223,
10.1038/nature01091.
Kutiel, H and Furman, H., (2003). Dust storms in the Middle
East: Sources of origin and their temporal characteristics.
Indoor Built Environment, 12 (6), 419–426.
https://doi.org/10.1177%2F1420326X03037110.
Khoshakhlagh, F., Najafi, M.S., Samadi, M., 2012. An analysis
on synoptic patterns of springtime dust occurrence in West of
Iran. Physical Geography Research Quarterly, 44 (2), 99–124.
Morabbi, M., 2011. Risk warning and crisis management for
dust storm effects on western border of Iran. United Nations
International Conference on Space-based Technologies for
Disaster Risk Management. Beijing, China.
Prospero, J. M., Ginoux, P., Torres, O., Nicholson, S. E., Gill,
T. E., 2002. Environmental Characterization of Global Sources
of Atmospheric Soil Dust Identified with the Nihpaus 7 Total
Ozone Mapping Spectrometer (TOMS) Absorbing Aerosol
Product. Review of Geophysics, 40 (1).10.1029/2000RG000095.
Samadi, M., Darvishi Boloorani, A., Alavipanah, S.K.,
Mohamadi, H., Najafi, M. S., 2014. Global dust Detection Index
(GDDI); a new remotely sensed methodology for dust storm
detection. J Environ Health Sci Eng, 12 (1), 1-14,
10.1186/2052-336X-12-20.
Shao, Y., 2008. Physics and modelling of wind erosion (2nd
edn.). Heidelberg: Springer. ISBN: 978-1-4020-8895-7, 1-458,
doi: 10.1007/978-1-4020-8895-7.
Shao, Y and Dong C.H., 2006. A review of East Asian dust
storm, climate, modelling and monitoring, Global and
Planetary Change, Vol: 52, Pp: 1–22.
She, L., Xue, Y., Yang, Xi., Guang, J., Li, Y., Che, Y., Fan, Ch
., Xie, Y., 2018. Dust Detection and Intensity Estimation Using
Himawari-8/AHI Observation. Remote Sens. 10 (4), 1-20,
10.3390/rs10040490.
Shenk, W.E., Curran, R.J., 1974. The detection of dust storms over
land and water with satellite visible and infrared measurements.
Mon Weather Rev, 102, https://doi.org/10.1175/1520
0493(1974)102<0830:TDODSO>2.0.CO;2.
Singh, R. P., Prasad, A. K., Kayetha, V. K., and Kafatos, M.,
2008. Enhancement of oceanic parameters associated with dust
storms using satellite data. Journal of Geophysical Research,
113, 1- 13, https://doi.org/10.1029/2008JC004815.
Taghavi, F., Owlad, E. & Ackerman, S.A., 2017. Enhancement
and identification of dust events in the south-west region of Iran
using satellite observations. J Earth Syst Sci. 126 (28). 1-17.
https://doi.org/10.1007/s12040-017-0808-0.
Wald, AE., Kaufman, Y.J., Tanre, D., Gao, B.C., 1998. Daytime
and nighttime detection of mineral dust over desert using
infrared spectral contrast. J Geophys Res, 103 (D24), 32307–
32313, https://doi.org/10.1029/98JD01454.
Zhang, B., Tsunekawa, A., Tsubo, M., 2008. Contributions of
sandy lands and stony deserts to long-distance dust emission in
China and Mongolia during 2000–2006. Global and Planetary
Change, 60, 487–504, http://dx.doi.org/10.1016/j.
The International Archives of the Photogrammetry, Remote Sensing and Spatial Information Sciences, Volume XLII-4/W18, 2019 GeoSpatial Conference 2019 – Joint Conferences of SMPR and GI Research, 12–14 October 2019, Karaj, Iran
This contribution has been peer-reviewed. https://doi.org/10.5194/isprs-archives-XLII-4-W18-1147-2019 | © Authors 2019. CC BY 4.0 License.
1151