Embed Size (px)
Citation preview

China and Latin America
Economic relations in the twenty-first century
Rhys Jenkins / Enrique Dussel Peters (Editors)
Studies49
This book analyses the impact of China on Latin Americaneconomies and focuses specifically on the challenges whichChina poses for the region at the beginning of the 21st century.Latin America has also felt the impact of China´s emergence andis now one of the top three trade partners for many Latin Ameri-can countries, paralleled by closer diplomatic relations.
This study is based on case studies on Argentina, Brazil, Chile andMexico and the particular economic relationship with China,including issues such as trade, employment, firm strategies,changes in production patterns, firm strategies and foreign directinvestments. These unique contributions are valuable for currentknowledge on the socioeconomic effects of China on the region,and respective policy implications.
ChinaandLatinAmerica
Econom
icrelationsinthetwenty-firstcentury
RhysJenkins/Enrique
DusselPeters(eds.)

China and Latin America Economic relations in the twenty-first century
German Development Institute / Deutsches Institut für Entwicklungspolitik (DIE)
The German Development Institute (DIE) is a multidisciplinary research, consul-tancy and training institute for Germany’s bilateral and for multilateral develop-ment cooperation. On the basis of independent research, it acts as a consultant to public institutions in Germany and abroad on current issues of cooperation be-tween developed and developing countries. Through its nine-month training course, the German Development Institute prepares German and European univer-sity graduates for a career in the field of development policy.
Center for Chinese-Mexican Studies (CECHIMEX)
The Center for Chinese-Mexican Studies (CECHIMEX) is an academic institution at the National Autonomous University of Mexico (UNAM) and focuses on im-proving the knowledge and preparation in Mexico on China and emphasizes the bilateral relationship. Together with the private, public and academic sectors CECHIMEX supports the deepening of Latin America´s and Mexico´s increasing socioeconomic relationship with China.
Studies Deutsches Institut für Entwicklungspolitik
China and Latin America Economic relations in the twenty-first century
Rhys Jenkins / Enrique Dussel Peters (eds.)
Deutsches Institut für Entwicklungspolitik (DIE)
in cooperation with
Universidad Nacional Autónoma de México (UNAM) / Centro de Estudios China-México (CECHIMEX)
Bonn,
Bonn, Mexiko City 2009
49

Studies / Deutsches Institut für Entwicklungspolitik ISSN 1860-0468
China and Latin America : economic relations in the twenty-first century / Rhys Jenkins ... (eds.). Deutsches Institut für Entwicklungspolitk in cooperation with Universidad Nacional Autónoma de México (UNAM) / Centro de Estudios China-México (CECHIMEX). – Bonn [u.a.] : DIE [u.a.], 2009. – (Studies / Deut-sches Institut für Entwicklungspolitik ; 49) ISBN 978-3-88985-485-8
© Deutsches Institut für Entwicklungspolitik gGmbH Tulpenfeld 6, 53113 Bonn ℡ +49 (0)228 94927-0
+49 (0)228 94927-130 E-Mail:[email protected] http://www.die-gdi.de
© Universidad Nacional Autónoma de México (UNAM) Av. Universidad 3000, Ciudad Universitaria, 04510 México, D.F. ℡ +52-55-56222195
+52-55-56222158 E-Mail: [email protected] http://www.unam.mx and http://www.economia.unam.mx/cechimex

Contents Abbrevations Chapter 1 Introduction 1 Ray Jenkins and Enrique Dussel Peters Chapter 2 The Latin American Case 21 Ray Jenkins Chapter 3 The Argentine Case 65 Andrés López and Daniela Ramos Chapter 4 The Brazilian Case 159 Daniel Saslavsky and Ricardo Rozemberg Chapter 5 The Chilean Case 227 Jonathan R. Barton Chapter 6 The Mexican Case 279 Enrique Dussel Peters On the Authors 395


Abbreviations
AAGR Average Annual Growth Rate AD Antidumping ADM Archer Daniels Midland Company AMSDE Mexican Association of Economic Secretaries APEC Asia-Pacific Economic Cooperation AQSIQ Administration of Quality, Supervision, Inspection and
Quarantine of the People’s Republic of China ATC Agreement on Textiles and Clothing BCB Brazilian Central Bank BDI Baltic Dry Index CAEI Argentine Center of International Studies CAP Corporación Andina de Fomento CAFTA United States-Dominican Republic-Central America Free Trade
Agreement CAMEX Brazil’s Chamber of Foreign Trade CASRECH Chamber of Minimarkets and Supermarkets owned by
Chinese Residents of the Metropolitan Area of Buenos Aires CCPIT Chinese Consulate for the Promotion of International Trade CECHIMEX Center for Chinese-Mexican Studies CEMA Conveyor Equipment Manufacturers Association CENIT Centro de Investigaciones para la Transformación, Argentina (Cen-
ter for Research on Transformation, Argentina) CEP Center of Production Studies CEPAL Comisión Económica para América Latina y el Caribe
(Economic Commission for Latin America and the Caribbean) CET Common External Tariff CICA Argentinean Chamber for the Tanning Industry CIF Cost, Insurance and Freight CIF Código de Identificación Fiscal (Tax Identification Code) CIMA Argentinean Chamber of Leather Goods CIPPEC Centro de Implementación de Políticas Públicas para la Equidad el
Crecimiento (Center for the Implementation of Public Policies Promoting Equity and Growth)

CMS Constant Market Share CNAE Clasivicadión Nacional de Actividades Económicas (National
Classification of Economic Activities) CNCE National Commission of International Trade CORFO The Chilean Development Agency CuPIC Partners Investment Company Ltd. CVRD Comphania Vale do Rio Doce DR-CAFTA Dominican Republic-Central America Free Trade Agreement EAP Economically Active Population ECLAC Economic Commission for Latin America and the Caribbean EIU Economist Intelligence Unit ESI Export-Similarity Index ESRC Economic and Social Research Council EURE Latin American Journal of Urban and Regional Studies DIE Deutsches Institut für Entwicklungspolitik FDI Foreign Direct Investment FOB Free on Board FTA Free Trade Agreement FTAAP Free Trade Area of the Asia Pacific FUNCEX Brazilian Foreign Trade Studies Foundation GAN Grupo de Alto Nivel China-México (High Level Group China-
Mexico) GATT General Agreement on Tariffs and Trade GDE Global Demand Effect GDP Gross Domestic Product GMM Generalized Method of Moment GRUMA Grupo Maseca GTAP Global Trade Analysis Project GVC Global Value Chain HTS Harmonized Tariff System IBGE Instituto Brasileiro de Geografía e Estatística (Brazilian Institute of
Geography and Statistics) ICMS Value Added Tax ICTs Information and Communication Technologies

IDB Inter-American Development Bank IMF International Monetary Fund IMSS Mexican Institute of Social Security INAI Institute for Agricultural International Negotiations INDEC National Institute of Statistics and Census, Argentina INEGI Instituto Nacional de Estadística, Geografía e Información (Na-
tional Institute of Statistics and Geography) IPI Industrial Products Tax IRIAP Institute of International Relations for Asia and the Pacific ISI Import Substitution Industrialization ISIC International Standard Industrial Classification ITC International Trade Commission LAC Latin America and the Caribbean M&A Merger and Acquisition MCC Metallurgical Group Corporation MDIC Ministry of Development, Industry and Trade MERCOSUR Mercado Común del Sur (Common Market of the South( MES Market Economy Status MFA Multi-Fiber Arrangement MFN Most Favored Nation MOU Memorandum of Understanding NAFTA North American Free Trade Agreement NBTT Net Barter Terms of Trade NCM MERCOSUR’s version of the Harmonized System NES Not elsewhere specified NGO Non-governmental Organization NOS Not otherwise specified NRI National Registry of Investment NTAX Non-Traditional Export OECD Organisation for Economic Co-operation and Development PC Personal Computer PPP Purchasing Power Parity R&D Research & Development

RBC Responsible Business Conduct RCA Revealed Comparative Advantage ROW Rest of the World SAGyPA Argentina’s Agricultural, Cattle and Fishing State Department SDE Structural Demand Effect SE Ministry of the Economy SECEX Ministry of Foreign Trade SITC Standard International Trade Classification SME Small and Medium Enterprise SNBT Swedish National Board of Trade SSCs Shared Services Centres TFP Total Factor Productivity TIE Temporary Import Entries TNC Transnational Corporation TT Terms of Trade UBA University of Buenos Aires UNAM Universidad Nacional Autónoma de México/National Autonomous
University of Mexico UNCTAD United Nations Conference on Trade and Development UNRISD United Nations Research Institute for Social Development USA United States of America USITC United States International Trade Commission UTDT Instituto Torcuato Di Tella VAT Value Added Tax VILLA Victoria Institute for Links with Latin America WDI World Development Indicators WIPO World Intellectual Property Organization WTA World Trade Atlas WTO World Trade Organization

Introduction
Rhys Jenkins / Enrique Dussel Peters Editors


Introduction
DIE − UNAM / CECHIMEX 3
Contents
1 China’s re-emergence as a global economic power 5
2 Growing relations between Latin America and China 7
3 Main themes in the debate 8
4 Contents of the book 13
Bibliography 17


Introduction
DIE − UNAM / CECHIMEX 5
Introduction
Rhys Jenkins / Enrique Dussel Peters
1 China’s re-emergence as a global economic power China’s rapid economic growth and increased openness has been one of the most significant developments in the global economy over the past quarter century and even since the beginning of capitalism in the 15th century. This re-emergence of China dates at least from the late 1970s when Deng Xiaoping began the process of reform and economic opening. It has led to China becoming the third largest economy in the world in terms of gross domestic product (GDP) at official exchange rates (and the second largest at purchasing power parity rates). The significance of China’s development is being felt around the globe and there is much talk of the twenty first century being “the Asian century”.
This book analyses the impact of China on Latin American economies and focuses specifically on the challenges which China poses for the region at the beginning of the 21st century. First, however, the spectacular eco-nomic performance of China will be briefly documented.1 While Latin America entered a period of economic stagnation in the 1980s, China was starting a period of rapid economic growth.2 In 1980 China’s total GDP was only 14% of that of Latin America and the Caribbean but by 2007 it had risen to 93% of the total for the region in constant US dollars. Since 1980, the Chinese economy has grown at almost 10% p.a. and as a result per capita income has increased seven-fold.
Not only did China grow rapidly, but it also became a much more open economy. Between 1995 and 2005, Chinese exports grew by 18% p.a. in value terms and imports by 17% p.a. In the 1970s, before the start of the economic opening, trade as a share of GDP in China was less than 10%. By 2007 this had increased to over 40% (World Bank 2009). As a result, China’s share of world trade has risen from less than 1% in 1980 to around
1 For more detailed accounts of China’s growth since 1979, see Maddison (2007), Nolan
(2004) and Naughton (2007). 2 Chinese GDP increased by an average of 9.9% p.a. in the 1980s while that of Latin
America grew by 1.3% p.a. (Devlin / Estevadeordal / Rodríguez-Clare 2006, Table 1.1).

Rhys Jenkins / Enrique Dussel Peters
DIE − UNAM / CECHIMEX 6
7%, making it the third largest trading economy. It has been predicted that it would become the world’s largest exporter by the beginning of the next decade (OECD 2005) and probably much earlier as a result of the current global crisis.
The fact that China’s export growth has been so spectacular has led to a growing trade surplus and accumulation of large foreign exchange re-serves of over US$2.1 trillion and to China becoming a major purchaser of US treasury bonds. In recent years China has also been a major destination for foreign direct investment (FDI), accounting for around 6% of global FDI inflows between 2005 and 2007 (UNCTAD 2008). It is still of only marginal significance as a source of foreign investment, with less than 2% of world FDI outflows over the same period, although Chinese FDI is growing rapidly and a number of Chinese companies have become impor-tant global players, particularly in the extractive industries, but also in-creasingly in manufacturing in sectors such as electronics, autoparts and automobiles, among others. With levels below US$5 billion prior to 2005, Chinese FDI is expected to be around US$60 billion in 2009. Chinese outflows are also increasing through foreign acquisitions by China’s sov-ereign wealth fund.
China’s rapid growth is unprecedented, and it shows similarities with earlier growth episodes in Japan, South Korea and Taiwan. What is differ-ent about China is the dynamism it has exhibited for over three decades as well as the sheer size of its economy (Winters / Yusuf 2007, 9–10). This means that the heightened competitiveness of China and its increased presence in world markets is having a major impact on both developed and developing countries. It is estimated that China accounted for 12.8% of world economic growth between 1995 and 2004 and this is projected to rise to 15.8% for the period 2005–2020 (Winters / Yusuf 2007, Table 1.1). With the world recession, the importance of China as a source of global growth has taken on even greater meaning.
The impact of China’s rapid industrial development has been particularly significant in terms of its increasing demand for primary products and it is now the world’s leading consumer of many minerals and agricultural products. It accounts for around a third of world consumption of tin, coal, iron ore, steel and cotton and almost a quarter of world demand for soy oil, rubber, aluminum and copper (Winters / Yusuf 2007, Table 1.4). Looked

Introduction
DIE − UNAM / CECHIMEX 7
at in terms of the contribution to the increase in world demand for these products, China’s share is even greater.
The effects of the emergence of China are being felt around the world. In Europe and North America it is seen as a source of cheap manufactured goods and as a booming market for exports and investment. Other Asian countries are becoming increasingly integrated with China through the development of production networks which have created a regional divi-sion of labor and substantial intra-regional trade and investment flows. Africa has seen a rapid increase of Chinese presence, particularly in the extractive industries which have led to growing exports to China and sig-nificant inflows of Chinese investment, as well as increased aid from China to a number of African countries.
In all these cases – in Africa, Europe and the US – China’s rapid integra-tion into the world market is accompanied by varying responses: from debates on the new opportunities that China poses, to discussions about the competition and “threat” of China in their domestic markets and in third markets.
2 Growing relations between Latin America and China Although it may not be as clear as in other parts of the developing world, Latin America has also felt the impact of China’s emergence. A decade ago, trade was limited between China and the region; but this has changed significantly. China is now one of the top three trade partners for many Latin American countries. In 2007, over 5% of the region’s exports went to China and more than 10% of imports were supplied by China (see Chapter 2, Tables 1 and 3). Chinese firms are also beginning to invest in Latin America and some Latin American companies have established operations in China; the best known example for this is the Brazilian air-craft manufacturer Embraer.
These growing economic links have been paralleled by closer diplomatic relations between Latin America and China. Until 1970 Cuba was the only Latin American country to recognize the People’s Republic of China (PRC). Most South American countries and Mexico recognized the PRC between 1970 and 1980; however, the Central American countries, a num-ber of Caribbean islands and Paraguay still maintain diplomatic relations with Taiwan. The latest country in the region to switch its recognition
Rhys Jenkins / Enrique Dussel Peters
DIE − UNAM / CECHIMEX 8
from Taiwan to the PRC was Costa Rica in 2007. It is expected that sev-eral Central American and Caribbean countries will follow with this path.
Over the last five years there have been intensified political exchanges between Latin America and China with Chinese President Hu Jintao visit-ing the region three times, in 2004, 2005 and 2008, while Latin American leaders have been frequent visitors to Beijing. In 2008 China published its first Policy Paper on relations with Latin America (Ministry of Foreign Affairs 2008). China has also increased its multilateral involvement in the region becoming a full member of the Inter-American Development Bank (IDB) in 2008.
Political and economic relations have come together in negotiations for free trade agreements between China and individual Latin American coun-tries. The first of these was with Chile and came into force in 2006. An agreement was then signed with Peru in 2009 and one is currently under negotiation with Costa Rica. China is of course a member of Asia-Pacific Economic Cooperation (APEC) (to which Chile, Peru and Mexico also belong) and it has engaged in dialogues with Mercado Común del Sur (MERCOSUR) and the Andean Community.
3 Main themes in the debate Up to now there have been relatively few academic studies on the implica-tions of the growing involvement of China in Latin America as a whole. The principal studies on the economic dimensions of this phenomenon have been produced by international organizations; particularly the Economic Commission for Latin America and the Caribbean (ECLAC 2004, 2008), the Inter-American Development Bank (Devlin / Estevadeordal / Rodríguez- Clare 2006; Cesarín / Moneta 2005), OECD (Santiso 2007) and the World Bank (Lederman / Olarreaga / Perry 2008). Other studies include Roett / Paz (2008), Oropeza (2008), Ellis (2009) and Jenkins / Mesquita Moreira / Dussel Peters (2008). There have also been a few studies on individual Latin American countries’ relations with China, most notably in Mexico (Dussel Peters 2005; Dussel Peters 2007; Dussel Peters / Trápaga 2007) and, to a lesser extent, Argentina (Cesarín 2006, Tramutola / Castro / Monat 2005).
Introduction
DIE − UNAM / CECHIMEX 9
The focus of this book is on the economic impact that China’s increased global presence presents for Latin America. Although these effects clearly have political implications both within Latin America and for the region’s international relations, they will not be addressed here. There are also social and environmental consequences of these economic changes and although these are touched on by some of the authors in this volume, again they are not the central line of argument.
The theme that has received most attention in the economic literature on China’s impact on Latin America has been the effect of Chinese competi-tion on the region’s exports to third countries. This was the main preoccu-pation of 2 out of 5 Chapters in the IDB study, 3 out of 5 in the Organisa-tion for Economic Co-operation and Development (OECD) collection and 3 out of 10 in the World Bank study. The dominant view presented by these international organizations is that, with the exception of Mexico, Latin American countries’ exports are not likely to be particularly affected by Chinese competition because the structures of their exports are dissimi-lar. This contrasts with the perception of many business organizations in the region which see China as a major threat to their exports. The optimis-tic view of the limited extent to which Latin American countries are threatened by Chinese competition has also been challenged by some academic studies which suggest that the impact has been more pervasive and has increased over time as a result of China’s accession to the World Trade Organization (WTO) and the phasing out of the Agreement on Tex-tiles and Clothing (Dussel Peters 2005; Mesquita Moreira 2007; Jenkins 2008; Gallagher / Moreno-Bird / Porzecanski 2008). This issue requires much more detailed study of the region and of specific countries –with the respective policy recommendations- in the future.
Another major theme in the discussion of economic relations between China and Latin America has been the growing significance of China as a market for the region’s exports. Over the last decade China’s booming demand for primary commodities contributed significantly to the increase in Latin American exports. Some authors emphasize the complementari-ties between the Latin American and Chinese economies, and the benefi-cial effects of Chinese growth on Latin America in terms of improved terms of trade, increased export earnings and produced higher government revenues (Blázquez-Lidoy / Rodriguez / Santiso 2007; Lederman / Olarreaga / Perry 2008). While such benefits have undoubtedly been seen in the short-

Rhys Jenkins / Enrique Dussel Peters
DIE − UNAM / CECHIMEX 10
term, other commentators have raised concerns about the long-term impli-cations, pointing to the “primarization” of the region’s exports and their overall economic structure. These critics point to an overdependence on a narrow range of commodity exports (copper, iron ore, soybeans) and a possible return to a traditional centre-periphery trade pattern which has been criticized in the region since the 1940s (Prebisch 1950). These trends raise the possibility of deindustrialization in the region or of the increased difficulty for Latin American countries to move into dynamic industrial sectors in the future (Mesquita Moreira 2007; Phillips 2007; Lall / Weiss 2005).
A more recent phenomenon that has received less attention in the literature is the impact of the growth of Chinese exports to the region. This has been an important focus of political debate in many Latin American countries with domestic producers who face increased competition from imported Chinese goods calling for protection from “unfair” competition (Murphy / Swann / Drajem 2007). Several Latin American countries have imposed anti-dumping restrictions on a range of Chinese goods in response to these demands. On the other hand, there are those who stress the advantages of imports from China, both in terms of reducing the cost of living to con-sumers and in providing local manufacturers with cheaper industrial inputs and low cost machinery and equipment which help increase their competi-tiveness.3
Issues around Foreign Direct Investment (FDI) have also played an impor-tant role in the debate over economic relations between China and Latin America. When President Hu Jintao visited Latin America in 2004, there were great expectations that there would be massive inflows of Chinese investment to the region.4 These investments have not materialized, lead-ing to discouragement in the region. Recently even some of the flagship Chinese investments that were announced have been dropped; such as the
3 For example in Brazil see the contrasting stances of FIESP (Industrial Federation of the
State of Sao Paulo) and CEBC (China-Brazil Business Council) on the impact of Chi-nese imports.
4 There is some controversy surrounding statements that were made by the Chinese President at the time and whether these expectations were the result of inadvertent mis-translation or were deliberately inflated by the media or the Latin American govern-ments involved. Whatever the reason, large sums of future Chinese investment came to be expected in the region.
Introduction
DIE − UNAM / CECHIMEX 11
joint venture between Baosteel and Vale to produce steel in Brazil, and the FAW investment in a car plant in Mexico. This raises questions as to why Chinese investment in Latin America has been so limited up to now and what the prospects are for future FDI flows. Is the low level of FDI a result of obstacles posed by Latin American governments and the lack of a suit-able investment climate? Or is it a consequence of Chinese strategies which, in certain high profile cases, have looked at means other than FDI to secure stable long-term supplies of key raw materials (such as loans in return for guaranteed supplies, as in the recent agreement with Petrobras in Brazil)? Similar considerations apply to the low level of FDI by Latin American firms in China. Are these a reflection of a lack of initiative by the region’s firms or obstacles faced by firms wishing to invest in China? Unfortunately there is relatively little information available on these is-sues.
Another controversial issue is whether FDI from third countries has been diverted from Latin America to China as a result of the increased growth and global competitiveness of the latter. The previously mentioned studies by the Inter-American Development Bank, the OECD and the World Bank each devote a chapter to this issue (Devlin / Estevadeordal / Rodríguez-Clare 2006, Ch.III; Garcia-Herrero / Santabárbera 2007; Cravino / Leder-mann / Olarreago 2008). It has also been the subject of several academic papers. While some authors believe that there has been a diversion of FDI from some Latin American countries –most notably Mexico to China- others are skeptical. One study has even found that increased investment in China has been associated with increased flows to the region, rather than a diversion away from it; implying that there is a complementarity between FDI flows to China and to Latin America (see Chapter 2 below for a fuller discussion of this issue).
In addition to the economic effects of China on Latin America, there has been a growing interest in the lessons that Latin America can learn from China’s rapid economic development. To some extent this is a re-run of an earlier debate over the lessons that could be learnt in the region from the growth of the first generation of East Asian newly industrializing countries (South Korea, Taiwan, Hong Kong and Singapore), which took place in the 1980s and 1990s (Jenkins 1991).
Rhys Jenkins / Enrique Dussel Peters
DIE − UNAM / CECHIMEX 12
For some authors, the Chinese experience provides a clear challenge to the Washington Consensus policies that have been applied in Latin America since the 1980s (Fernández Gilberto / Hogenboom [s. a.]; Paus [s. a.]). China is “the worst student getting the best marks” with a performance 10.9 times higher than Latin America in terms of GDP per capita for 1980-2007. It poses massive challenges for Latin America’s political and eco-nomic elites, as well as for the development strategies implemented in most of the region since the 1980s (Dussel Peters s. a. a). China is seen as a developmental state with a clear long-term economic development strat-egy, which is not afraid to use industrial and trade policies in a strategic way to promote economic growth. The lesson that Latin America should draw from this is to use mechanisms and policies itself to allow for tech-nological upgrading and long-term development goals. Free trade and/or macroeconomic stability alone are clearly not sufficient.
However, another interpretation sees China’s success as the result of the liberalization of the economy that has taken place since 1979 (Lora 2005; OECD 2005). Although this process is still far from complete and needs to be continued further to resolve remaining imbalances, it is a vindication of the role of the market in economic development. On this view, the lessons for Latin America are to complete the process of economic reform, par-ticularly in relation to the labor market, to privatize state-owned firms, and to intensify the deregulation process against different types of monopolies and quasi-monopolies.
Although these debates on the lessons that the Latin American countries should draw from the Chinese development experience are touched on in some of the contributions to this volume, the main focus is on the eco-nomic impact of China’s growth on the region. No attempt is made to systematically analyze the causes of China’s spectacular economic growth nor to compare its overall performance with that of the Latin American economies and to draw policy conclusions from such an analysis.

Introduction
DIE − UNAM / CECHIMEX 13
4 Contents of the book
Chapter 2 by Rhys Jenkins provides an overview of both the direct and indirect effects of China on 19 Latin American countries. Six different channels are identified through which these forms of impact have been felt: Latin American exports to China; the region’s imports from China; bilateral FDI flows; competition from China in Latin American export markets; impact on FDI flows to Latin America from other countries; and the impact of China on global commodity prices. It is shown that these channels vary in importance between different countries of the region. Up to now the effects of trade have been much more significant than those of FDI, although it is possible that investment flows will become more sig-nificant in the future. It is also shown that the indirect effects of China’s growth may be at least as important for the region as the direct effects that arise from bilateral relations between China and Latin America.
The remaining chapters of the book present case studies of four countries which are both highly relevant in terms of Latin America’s relations with China and also represent contrasting experiences with respect to the level of importance of the main channels through which they have been affected by China’s global expansion. Brazil is China’s chief trade partner in Latin America. It is the largest exporter to China accounting for around two-fifths of the region’s total exports and is the main destination for Chinese FDI in Latin America (excluding tax havens in the Caribbean such as the Cayman Islands and the British Virgin Islands). Mexico, on the other hand, is the region’s largest importer from China. It is also the large Latin American economy which has been most affected by Chinese competition in the US market and where relocation of FDI to China has given rise to most concern. As a result, it is the Latin American country where tensions with China have been most acute, exacerbated recently by the outbreak of swine flu in Mexico and the reaction of the Chinese authorities who quar-antined Mexican citizens.
Chile is the country in the region (apart from Cuba) with the best relation-ship with China. It recognized the People’s Republic of China in 1970, even before the PRC was admitted to the United Nations. It was also the first country in the region to sign a Free Trade Agreement with China in 2006. It is the second largest exporter to China after Brazil and has bene-

Rhys Jenkins / Enrique Dussel Peters
DIE − UNAM / CECHIMEX 14
fited from the high world market price of copper, its major export, which has been driven partly by demand from China. Of all the Latin American countries covered by the Pew Global Attitudes Project, it reports the most favorable view of China among the public (Shambaugh 2009) Argentina in contrast has experienced growing tensions with China over the past couple of years. Although it is a major exporter to China, mainly of agricultural commodities in contrast to Chile, the government has been increasingly concerned about competition from Chinese imports and has taken steps to restrict their growth. Public attitudes towards China have become less favorable in the last couple of years and it now ranks, along with Mexico, as the country with the least positive view of China (Shambaugh, 2009).
In Chapter 3, Andrés Lopez and Daniela Ramos show that the main driver of Argentina’s economic relations with China has been the growing Chinese demand for soybeans and their derivatives. Exports to China have made a significant contribution to the growth of foreign exchange earnings and to government revenues, as well as improving Argentina’s terms of trade. However, these exports are concentrated in a few products supplied by a very small number of firms and there has not been any evidence of the export basket becoming more diversified over time. Imports have grown rapidly in recent years and the Argentine government has taken a number of protectionist measures in response. The authors provide some evidence that Chinese competition has had a negative impact on industrial employment in Argentina although this has been a major problem for only a few sectors. They also provide information on bilateral FDI flows and the major planned Chinese investments in Argentina.
Chapter 4, by Daniel Saslavsky and Ricardo Rozemberg, shows that Brazil’s exports are dominated by iron ore and soybeans; with crude oil also becoming increasing in importance recently. As in Argentina, a rela-tively small number of companies dominate exports to China. Brazil too has enjoyed improved terms of trade partly as a result of the Chinese de-mand for its major export commodities. However, unlike Argentina, in-creased trade with China has not significantly contributed to government revenues. Imports have grown rapidly in recent years, leading to an in-creasing number of anti-dumping cases and some voluntary agreements by China to restrain exports to Brazil in sectors such as textiles and toys. The

Introduction
DIE − UNAM / CECHIMEX 15
Chapter also discusses the negative effects of Chinese competition on Brazilian exports to the USA and the EU. Finally Saslavsky and Rozem-berg present information on FDI flows between the two countries while emphasizing that they have been on a relatively small scale up to now.
Chile’s trade with China is dominated by copper exports as Jonathan Bar-ton shows in Chapter 5. He argues that China’s demand for copper has intensified dependence on this one product, based on natural resources, and exposed Chile even more to the vagaries of fluctuating international commodity prices. The import of clothing and footwear and electronic and electrical goods has surged in recent years. While the latter are not pro-duced locally, the Chilean clothing and footwear industries have been affected by competition from Chinese imports. However, as Chile’s manu-facturing sector was in any case much smaller than in other Latin Ameri-can countries, the overall economic impact of competition from Chinese imports was not as significant as in the other countries discussed in the book. Indeed because the Chilean economy is so open, in many cases Chinese goods have displaced imports, often from other Latin American countries, rather than domestic production.
In Chapter 6, Enrique Dussel Peters provides an overview of economic relations between China and Mexico. He highlights some of the statistical problems of analyzing this relationship, which arise from the very large discrepancies in data provided by the Mexican and Chinese authorities. Nevertheless it is clear that unlike the other three cases considered here, Mexico has consistently had a large deficit in its trade with China. Be-cause of the significance of the US market for Mexico, the Chapter gives particular attention to the effects of Chinese competition in the USA. There is a high degree of similarity between the products exported by Mexico and China to the US and a tendency for unit values of exports from Mexico to fall in the sectors most affected by Chinese competition. The chapter also discusses the impact of Chinese competition on employ-ment in Mexican manufacturing and presents detailed policy recommenda-tions for improvement and with which to face the new dimensions of the bilateral relationship.
In addition to the mentioned analysis, and parallel to this book, one of the main contributions of this publication is the presentation of detailed infor-
Rhys Jenkins / Enrique Dussel Peters
DIE − UNAM / CECHIMEX 16
mation on the effects of China on Latin America and on each of the four countries discussed herein (Argentina, Brazil, Chile and Mexico). The results of this work are seven analyses on specific value-added chains and the impact of China: two on Mexico (on the electronics and autoparts-automobile segments), two on Argentina (on the soybean and leather chains), one on Chile (on the copper and textile chains), and two on Brazil (on mining and steel and electronics chains). The above can be down-loaded from the webpage of the German Development Institute (http:// www.die-gdi.de) and of the Center for Chinese Mexican Studies of the Department of Economics at the National Autonomous University of Mex-ico (http://www.economia.unam.mx/cechimex). We believe that these unique contributions are valuable for current knowledge on the socioeco-nomic effects of China on the region, and respective policy implications.
The research for these seven papers as well as the material included in this book was funded by the UK Economic and Social Research Council’s World Economy and Finance Research programme, Grant No. RES-165-25-005.

Introduction
DIE − UNAM / CECHIMEX 17
Bibliography
Blázquez-Lidoy, J. / J. Rodríguez / J. Santiso (2007): Angel or Devil? China’s trade impact on Latin American emerging markets, in: J. Santiso (ed.), The visible hand of China in Latin America, Paris: OECD, Development Centre Studies
Cesarín, S. (2006): China se Avecina: la re-evolución de una potencia emergente, Buenos Aires: Capital Intelectual
Cesarín, S. / C. Moneta (eds.) (2005): China y América Latina: nuevos enfoques sobre cooperación y desarrollo: una segunda ruta de la seda?, Buenos Aires: Instituto para la Integración de América Latina y el Caribe, Banco Interamericano de Desarrollo
Cravino, J. / D. Lederman / M. Olarreaga (2008): Foreign direct investment in Latin America during the emergence of China and India: stylized facts, in: D. Lederman / M. Olarreaga / G. Perry (eds.), China’s and India’s challenge to Latin America: opportunity or threat?, Washington, DC: World Bank
Devlin, R. / A. Estevadeordal / A. Rodríguez-Clare (eds.) (2006): The emergence of China: opportunities and challenges for Latin America and the Caribbean, Washington, DC, Cambridge, Mass.: IDB, DRCLAS, Harvard University
Dussel Peters, E. (2005 ): Economic opportunities and challenges pose by China for Mexico and Central America, Bonn: German Development Institute (Studies 8)
– (ed.) (2007): Oportunidades en la relación económica y commercial entre China y México, Mexico City: ECLAC
– (s. a. a): América Latina y China: implicaciones conceptuales y de política económica, Peru, forthcoming
– (s. a. b): The impact of China’s global expansion on Mexico: Mexico’s economic relationship with China: a case study of the PC industry in Jalisco, Bonn: DIE (Discussion Paper), forthcoming
Dussel Peters, E. / Y. Trápaga (eds.) (2007): China y México: implicaciones de una nueva relación, Mexico City: La Jornada Ediciones
ECLAC (Economic Commission for Latin America and the Caribbean) (2004): Oportunidades y retos económicos de China para México y Centroamérica, Mexico City
– (2008): Las relaciones económicas y comerciales entre América Latina y Asia-Pacífico: el vínculo con China, Santiago de Chile
Ellis, R. E. (2009): China and Latin America: the whats and wherefores, Boulder, Colo.: Lynne Rienner Publishers

Rhys Jenkins / Enrique Dussel Peters
DIE − UNAM / CECHIMEX 18
Fernández Gilberto, A. / B. Hogenboom (s. a.): Latin America and China: south-south relations in a new era), in: A. Fernández Gilberto / B. Hogenboom (eds.), Latin America vacing China: south-south relations beyond the Wash-ington Consensus, forthcoming
Gallagher, K. J. / C. Moreno-Brid / R. Porzecanski (2008): The dynamism of Mexican exports: lost in (Chinese) translation?, in: World Development 36 (8), 1365–380
García Herrero, A. / D. Santabárbara (2007): Does China have an impact on foreign direct investment to Latin America, in: J. Santiso (ed.), The visible hand of China in Latin America, Paris: OECD, Development Centre Studies
Jenkins, R. (1991): Learning from the gang: are there lessons for Latin America from East Asia?, in: Bulletin of Latin American Research 10 (1), 37–54
– (2008): China’s global growth and Latin American exports, Helsinki: UNU-WIDER (UNU-WIDER Research Paper 2008/104)
Jenkins, R. / M. Mesquita Moreira / E. Dussel Peters (2008): The impact of China on Latin America and the Caribbean, in: World Development 36 (2)
Lall, S. / J. Weiss (2005): China’s competitive threat to Latin America: an analysis for 1990–2002, in: Oxford Development Studies 33 (2), 163–94
Lederman, D. / M. Olarreaga / G. Perry (eds.) (2008): China’s and India’s chal-lenge to Latin America: opportunity or threat?, Washington, DC: World Bank
Lora, E. (2005): ¿Debe América Latina temerle a la China?, in: Documento de Trabajo 536
Maddison, A. (2007): Chinese economic performance in the long run, 960–2030, Paris: OECD
Mesquita Moreira, M. (2007): Fear of China: is there a future for manufacturing in Latin America? in: World Development 35 (3), 355–76
Ministry of Foreign Affairs (2008): China’s policy paper on Latin America and the Caribbean; online: http://www.fmprc.gov.cn/eng/zxxx/t521025.htm (accessed 10 July 2009)
Murphy, H. / C. Swann / M. Drajem (2007): Economic outlook: competition from China squeezes developing countries, in: International Herald Tribune 2 Apr. 2007
Naughton, B. (2007): The Chinese economy: transitions and growth, Cambridge, Mass: MIT Press Books
Nolan, P. (2004): Transforming China: globalization, transition and development, London: Anthem Press
OECD (Organisation for Economic Co-Operation and Development) (2005): Eco-nomic survey of China 2005: key challenges for the Chinese economy, Paris
Introduction
DIE − UNAM / CECHIMEX 19
Oropeza, A. (ed.), (2008): China-Latinoamérica: una visión sobre el nuevo papel de China en la región, México: UNAM
Paus, E. (s. a.): The rise of China: implications for Latin American development, in: Development Policy Review, forthcoming
Phillips, N. (2007): Consequences of an emerging China: is development space disappearing for Latin America and the Caribbean? Waterloo, ON, Canada: Centre for International Governance Innovation (CIGI Working Paper 14)
Prebisch, R. (1950): The economic development of Latin America and its principal problems, Santiago: ECLAC
Roett, R. / G. Paz (eds.), (2008): China’s expansion into the Western Hemisphere: implications for Latin America and the United States, Washington, DC: The Brookings Institution
Santiso, J. (ed.) (2007): The visible hand of China in Latin America, Paris: OECD, Development Centre Studies
Shambaugh, D. (2009): China’s multidimensional thrust into the Latin American region, presentation at the Third International Conference of the China-Brazil Business Council, China’s Presence in Latin America, Sao Paulo, 30 June 2009
Tarmutola, C. / L. Castro / P. Monat (2005): China: cómo puede la Argentina aprovechar la gran oportunidad, Buenos Aires: Edhasa
UNCTAD (United Nations Conference on Trade and Development (2009): World Investment Report, Geneva
World Bank (2008): World Development Indicators, Washington, DC Winters, L. A. / S. Yusuf (2007): Dancing with giants: China, India and the global
economy, Washington, DC, Singapore: World Bank, Institute of Policy Stud-ies


The Latin American Case
Rhys Jenkins

The Latin American Case
DIE − UNAM / CECHIMEX 23
Contents
Introduction 25
PART A: DIRECT EFFECTS
1 Latin American exports to China 27
2 Latin American imports from China 33
3 Foreign direct investment 42
PART B: INDIRECT EFFECTS
4 Competition in export markets 45
5 The impact of China on FDI flows to Latin America 50
6 China’s impact on global commodity prices 53
Conclusion 59
Bibliography 61

Rhys Jenkins
24 DIE − UNAM / CECHIMEX
Figures
Figure 1: China and Hong Kong’s imports from Latin America, 1990–2008 28
Figure 2: China and Hong Kong’s exports to Latin America, 1990–2008 34
Figure 3: Latin America’s trade balance with China, 1990–2007 (US$ mn) 41
Tables
Table 1: Exports to China and Hong Kong as a share of total exports, 1995, 2001, 2007 30
Table 2: Composition of Latin American exports to China and the rest of the world, 1995, 2001, 2006 (% share) 31
Table 3: Imports from China and Hong Kong as a share of total imports, 1995, 2001, 2007 35
Table 4: Composition of Latin American imports from China and the rest of the world, 1995, 2001, 2006 (% share) 36
Table 5: Argentine industries in which the share of Chinese imports in domestic demand increased by >5 %, 2001–2006 38
Table 6: Brazilian industries in which the share of Chinese imports in domestic demand increased by >10 %, 1998–2006 39
Table 7: FDI flows between China and Latin America, 2006 and 2007 (US$ mn) 43
Table 8: Loss of exports to the US to China, 1996-2001, 2001–2006, 2004–2006 (as % of country’s total exports to the US) 48
Table 9: China’s share of global consumption of primary commodities, 2002, 2006, 2007 (in volume terms) 54
Table 10: Impact of China on prices and the value of 15 main commodities exported from Latin America, 2002–2006 56

The Latin American Case
DIE − UNAM / CECHIMEX 25
The Latin American Case
Rhys Jenkins
Introduction
This chapter provides an overview of the economic effects of China’s growth and growing integration with the global economy on Latin Amer-ica. While providing an overview of the impacts on the region as a whole, it is also important to bear in mind the heterogeneity of the region and to recognize the different effects on individual countries within Latin Amer-ica. Where possible this is done by providing disaggregated data for 19 Latin American countries. Later chapters provide much more detailed ac-counts of the impact of China on four of these countries, where bilateral relations have been particularly significant, namely Argentina, Brazil, Chile and Mexico.
While China’s growth has been seen by some as a benefit for Latin Amer-ica – an “angel” not a “devil” in the words of one much quoted paper (Blázquez-Lidoy / Rodriguez / Santiso 2007) – there is today a growing skepticism over the impact of China in the region. Recently the Interna-tional Herald Tribune reported that Colombian textile manufacturers have seen their exports drop as a result of stronger competition from China and the president of the National Foreign Trade Council in Washington is quoted as saying “The least developed countries in Latin America are scared to death” (Murphy / Swann / Drajem 2007).
The effects of the rise of China on Latin America are multiple and com-plex, making it necessary to approach them within a systematic frame-work. The focus here is on trade and foreign direct investment (FDI). Chi-nese aid to Latin America is relatively limited, particularly in comparison with Africa, and will not be discussed here.1 Although there are reports of growing Chinese migration to the region, this too has yet to make a major impact.
1 One recent estimate of Chinese concessional loans and grants to different regions over
the period 2002–2007 put it at less than a tenth of the level provided to Africa (Lam et al. 2009)

Rhys Jenkins
DIE − UNAM / CECHIMEX 26
A number of different channels through which China’s growth affects other countries can be identified. The most obvious ones are those that arise from the growth of bilateral economic relations with China. These include the rising significance of China as a market for Latin American exports, the increased penetration of the Latin American market by Chi-nese goods and the growth of bilateral FDI between China and the region. These are the direct forms of impact of China on the Latin American countries.
But these are not the only channels, or even necessarily the most important ones, through which China has an effect on Latin America. Because of its sheer size, the rapid growth of the Chinese economy has a global eco-nomic impact on world markets and prices, which also have an impact on the Latin American economies even where bilateral trade and investment relations are limited. Three of these indirect effects are likely to be par-ticularly significant for Latin America. The first is the competition be-tween China and Latin America in export markets (particularly in the United States) leading to a potential loss of market share for Latin Ameri-can exporters. Second, there may be competition to attract inflows of for-eign investment and the possibility that investment is diverted from Latin America to China. Finally, China’s rapid growth may have an effect on the terms of trade of Latin American countries, particularly through the impact on the prices of primary commodities.2
This is not an exhaustive list of the possible effects of China on the global economy and thus indirectly on Latin America. It is widely recognized for example that the willingness of the Chinese government to buy US Treas-ury Bills has helped keep down US interest rates and, until recently, main-tain the growth of the US economy in the face of rising trade and budget deficits. The continued significance of the state of the US economy for Latin America suggests that this is another indirect impact of China on the region. However, the impact of US interest rates and gross domestic prod-uct (GDP) growth on the Latin American economies will not be analyzed here.
2 China may also have an impact on Latin American countries’ terms of trade through its
impact on prices of manufactured goods, but this effect will not be discussed here.

The Latin American Case
DIE − UNAM / CECHIMEX 27
In the literature on the impact of China’s growth on developing countries a distinction is also often drawn between competitive and complementary effects (Shafaeddin 2004; Jenkins / Edwards 2006; Schmitz 2006; Kap-linsky / Messner 2008). Complementary effects are seen as positive for the countries affected while competitive effects are negative. There is no sim-ple relationship between the different channels through which China af-fects the Latin American economies and the nature of its impact. The ef-fects of the growth of imports from China may be competitive – as for example where local producers are displaced by cheap imports of Chinese consumer goods – or complementary when they are able to reduce costs through imports of low cost Chinese inputs. The effects may also differ from country to country so that booming Chinese demand for primary products has a positive impact on those countries which export these goods, but a negative impact on those that are net importers of such prod-ucts. The impacts may also differ at a sub-national level between different regions, classes or groups. As a result, it is not possible to read off the im-pact of China on Latin American countries simply by identifying the channels through which they have been affected.
PART A: DIRECT EFFECTS
1 Latin American exports to China As was seen in Chapter 1, Latin American exports to China have grown spectacularly in recent years. While trade with China was expanding dur-ing most of the 1990s, a sharp increase in Chinese imports from the region occurred after 1999 (see Figure 1).3 A further inflection point occurred in 2002 when the growth of Chinese imports from the region accelerated fur-ther. Since this pattern holds for all the major Latin American countries
3 The data used covers 19 Latin American countries. Trade with Hong Kong is included
as well as with Mainland China. This is justified since although the trade statistics of the two are presented separately in international statistics, Hong Kong reverted to Chinese rule in 1997. Moreover a lot of China’s trade, particularly in the early years of its export growth, went through Hong Kong.

Figu
re 1
: C
hina
and
Hon
g K
ong'
s Im
port
s fro
m L
atin
Am
eric
a, 1
990–
2008
Sour
ce:
IMF,
Dire
ctio
n of
Tra
de S
tatis
tics
0
1000
0
2000
0
3000
0
4000
0
5000
0
6000
0
7000
0
8000
0 1990
1991
1992
1993
1994
1995
1996
1997
1998
1999
2000
2001
2002
2003
2004
2005
2006
2007
2008
est.
$ million
Arg
entin
aB
razi
lC
hile
Mex
ico
Oth
er
0
1000
0
2000
0
3000
0
4000
0
5000
0
6000
0
7000
0
8000
0 1990
1991
1992
1993
1994
1995
1996
1997
1998
1999
2000
2001
2002
2003
2004
2005
2006
2007
2008
est.
$ million
Arg
entin
aB
razi
lC
hile
Mex
ico
Oth
er
Rhys Jenkins
DIE − UNAM / CECHIMEX 28

The Latin American Case
DIE − UNAM / CECHIMEX 29
exporting to China, it would seem that the explanation must be sought in events in China rather than developments in the various Latin American countries. One explanation is that resource constraints really began to bite in China at the end of the 1990s. This view is supported by the sharp in-crease in China’s net trade deficit in a number of primary commodities which feature prominently in Latin America’s exports such as copper, iron ore, nickel and soybeans as of the late 1990s (UNCTAD 2005, Fig. 2.8). Furthermore the accession of China to the World Trade Organization (WTO) in 2001 and the sharp rise in commodity prices from 2002 gave an additional boost to the region’s exports.
However, not all Latin American countries have participated equally in the boom of exports to China. While China accounted for 5.4 % of the re-gion’s total exports in 2007, the shares for individual countries ranged from 1 % or less of total exports in Mexico, Ecuador, Paraguay and sev-eral Central American countries, to over 10 % in Chile, Costa Rica, Cuba and Peru (see Table 1). One obvious reason for this is that a number of countries, particularly those of Central America (apart from Costa Rica), continue to recognize Taiwan and therefore do not have diplomatic rela-tions with the People’s Republic of China. In contrast, the close political ties between Cuba and China and the fact that Cuba is excluded from its closest market, the USA, helps explain the high level of trade between the two countries.
In terms of the composition of exports to China, the region’s role is clearly as a supplier of primary products and resource based manufactures with a relatively low degree of processing. The former account for almost two-thirds of Latin American exports in 2006 and the latter for a further fifth (see Table 2). The main products exported from the region to China in 2006 were copper ore and concentrates, soybean and soya oil, iron ore, crude oil, refined copper and fishmeal.4
4 The only significant exports of manufactured goods from the region to China are of
integrated circuits which are largely accounted for by Intel in Costa Rica.

Rhys Jenkins
DIE − UNAM / CECHIMEX 30
Table 1: Exports to China and Hong Kong as a share of total exports, 1995, 2001, 2007
1995 2001 2007
Argentina 2.8 % 4.6 % 9.8 %
Bolivia 0.0 % 0.4 % 1.6 %
Brazil 3.5 % 4.0 % 7.7 %
Chile 2.3 % 5.7 % 14.9 %
Colombia 1.3 % 0.3 % 2.7 %
Costa Rica 2.0 % 0.3 % 17.1 %
Cuba 13.1 % 6.9 % 27.9 %
Dominican Republic 0.0 % 0.1 % 1.7 %
Ecuador 0.2 % 0.0 % 1.0 %
El Salvador 0.5 % 0.1 % 0.3 %
Guatemala 1.8 % 0.0 % 0.7 %
Honduras 0.0 % 0.1 % 0.3 %
Mexico 0.7 % 0.3 % 0.8 %
Nicaragua 0.3 % 0.0 % 0.0 %
Panama 1.0 % 1.2 % 6.5 %
Paraguay 0.8 % 2.3 % 0.7 %
Peru 7.3 % 6.4 % 12.9 %
Uruguay 8.2 % 6.2 % 6.8 %
Venezuela 0.0 % 0.2 % 3.2 %
Total 1.9 % 1.7 % 5.4 %
Source: Own elaboration from IMF, Direction of Trade Statistics
The Latin American Case
DIE − UNAM / CECHIMEX 31
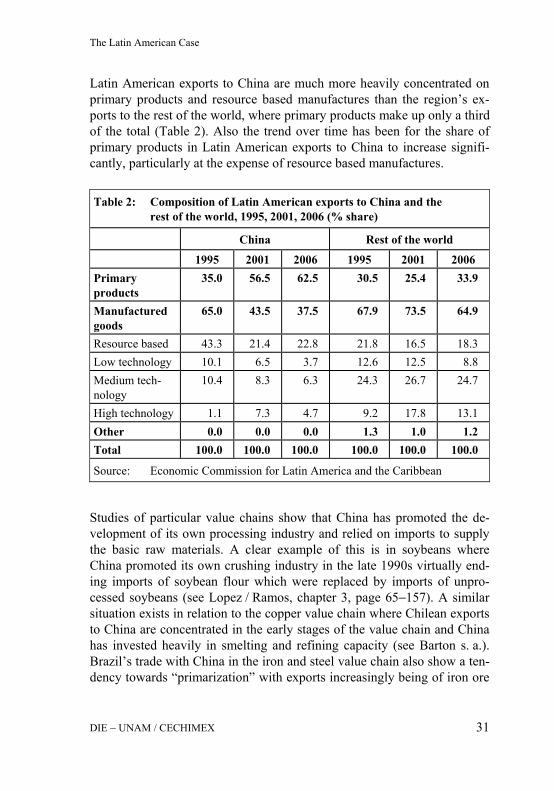
Latin American exports to China are much more heavily concentrated on primary products and resource based manufactures than the region’s ex-ports to the rest of the world, where primary products make up only a third of the total (Table 2). Also the trend over time has been for the share of primary products in Latin American exports to China to increase signifi-cantly, particularly at the expense of resource based manufactures.
Studies of particular value chains show that China has promoted the de-velopment of its own processing industry and relied on imports to supply the basic raw materials. A clear example of this is in soybeans where China promoted its own crushing industry in the late 1990s virtually end-ing imports of soybean flour which were replaced by imports of unpro-cessed soybeans (see Lopez / Ramos, chapter 3, page 65−157). A similar situation exists in relation to the copper value chain where Chilean exports to China are concentrated in the early stages of the value chain and China has invested heavily in smelting and refining capacity (see Barton s. a.). Brazil’s trade with China in the iron and steel value chain also show a ten-dency towards “primarization” with exports increasingly being of iron ore
Table 2: Composition of Latin American exports to China and the rest of the world, 1995, 2001, 2006 (% share)
China Rest of the world
1995 2001 2006 1995 2001 2006 Primary products
35.0 56.5 62.5 30.5 25.4 33.9
Manufactured goods
65.0 43.5 37.5 67.9 73.5 64.9
Resource based 43.3 21.4 22.8 21.8 16.5 18.3 Low technology 10.1 6.5 3.7 12.6 12.5 8.8 Medium tech-nology
10.4 8.3 6.3 24.3 26.7 24.7
High technology 1.1 7.3 4.7 9.2 17.8 13.1 Other 0.0 0.0 0.0 1.3 1.0 1.2 Total 100.0 100.0 100.0 100.0 100.0 100.0
Source: Economic Commission for Latin America and the Caribbean

Rhys Jenkins
DIE − UNAM / CECHIMEX 32
and pig iron as opposed to steel and steel products (Barbosa / Guimarães 2009).
Each Latin American country’s exports to China depend heavily on one or two products. In Argentina soybeans and their derivatives account for the bulk of exports (see Lopez / Ramos, Table 11, page 88). In Chile around 80 % of exports are of copper (see Barton, Table 3, page 250); while in Brazil soybeans and iron ore exports dominate (see Saslavsky / Rozem-berg, Table 8, page 177). The other major South American exporter to China, Peru, relies heavily on exports of copper and fishmeal. What is more, the trend has been for exports to become increasingly concentrated in a small number of products over recent years.
Not only are exports to China concentrated in terms of products, but also in terms of the firms involved. For example, five firms account for over 60 % of Chilean exports to China (see Barton, Table 2, page 240), while in Argentina the top ten firms make up more than 70 % of exports. Brazil’s exports to China also appear to be similarly concentrated in a handful of large companies. The most extreme example in the region is probably Costa Rica where Intel is responsible for 85 % of the country’s exports to China. This suggests that the benefits from exports to China may also be highly concentrated.
One way in which the benefits may be spread more widely is through gov-ernment revenues from the export sector. The most obvious example is Chile where the copper sector accounted for more than a fifth of govern-ment revenue in 2006. China accounted for about an eighth of total Chil-ean copper exports (by volume) in that year, suggesting that it may have accounted for between 2 % and 3 % of total government revenue. Another example is that of soybean grain and oil exports from Argentina to China where it has been estimated that revenues from export duties (“reten-ciones”) came to almost US$ 1,300 million in 2007, representing an al-most eight-fold increase over five years (see Lopez / Ramos, Table 25, page 112). However, these examples are the exception rather than the rule and it is unlikely that other countries’ exports to China have had such a significant impact on government revenues.

The Latin American Case
DIE − UNAM / CECHIMEX 33
2 Latin American imports from China
Latin American imports from China have also grown significantly in re-cent years. Figure 2 shows that Chinese exports to the region grew gradu-ally from the early 1990s (with slight dips in 1996 and 1999) until 2003, after which they accelerated markedly. This reflected the growing interna-tional competitiveness of China in an expanding range of manufactured goods and improved access to Latin American markets following China’s accession to the WTO in late 2001.
China’s share in total imports to Latin America increased more than five times from less than 2 % in 1995 to over 10 % in 2007. Table 3 shows the increasing share of imports from China in individual Latin American countries. Although the share of China varies between countries, the dif-ferences are not as marked as in the case of exports (see Table 3). Cuba is again the country with the highest share of trade with China, but it is closely followed by Argentina, Chile, Peru and Brazil. Although the Cen-tral American countries have below average shares of imports coming from Cuba, apart from Nicaragua, they are not negligible.

Figu
re 2
: C
hina
and
Hon
g K
ong’
s exp
orts
to L
atin
Am
eric
a, 1
990–
2008
Sour
ce:
IMF,
Dire
ctio
n of
Tra
de S
tatis
tics
0
1000
0
2000
0
3000
0
4000
0
5000
0
6000
0
7000
0
8000
0 1990
1991
1992
1993
1994
1995
1996
1997
1998
1999
2000
2001
2002
2003
2004
2005
2006
2007
2008
est.
$ million
Arg
entin
aB
razi
lC
hile
Mex
ico
Oth
er
0
1000
0
2000
0
3000
0
4000
0
5000
0
6000
0
7000
0
8000
0 1990
1991
1992
1993
1994
1995
1996
1997
1998
1999
2000
2001
2002
2003
2004
2005
2006
2007
2008
est.
$ million
Arg
entin
aB
razi
lC
hile
Mex
ico
Oth
er
Rhys Jenkins
DIE − UNAM / CECHIMEX 34

The Latin America Case
DIE − UNAM / CECHIMEX 35
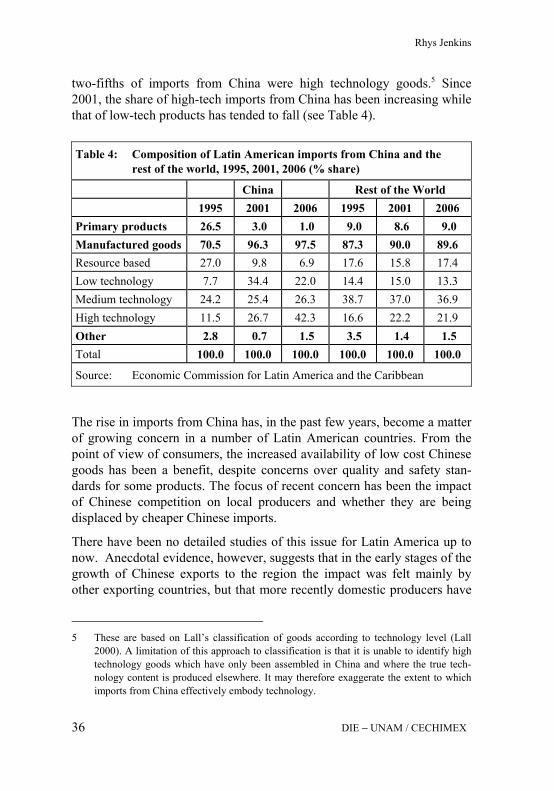
In terms of the type of goods imported from China, the pattern is the re-verse of that noted for Latin American exports to China. Almost all Latin American imports from China in 2006 were manufactured goods and over 90 % were non-resource based manufactures (see Table 4). Contrary to some popular perceptions, imports from China are not predominantly of low tech goods which account for just over a fifth of the total by 2006. While over a quarter are made up of medium-technology goods, more than
Table 3: Imports from China and Hong Kong as a share of total imports, 1995, 2001, 2007
1995 2001 2007 Argentina 3.5 % 5.5 % 12.1 % Bolivia 1.1 % 5.1 % 3.7 % Brazil 3.0 % 3.0 % 11.0 % Chile 3.2 % 5.8 % 11.3 % Colombia 0.7 % 4.0 % 10.4 % Costa Rica 1.2 % 1.8 % 5.4 % Cuba 6.3 % 10.6 % 13.4 % Dominican Republic 0.0 % 1.5 % 4.2 % Ecuador 0.0 % 0.0 % 8.0 % El Salvador 0.9 % 1.6 % 6.0 % Guatemala 0.8 % 2.7 % 7.4 % Honduras 0.0 % 1.1 % 3.7 % Mexico 0.9 % 2.6 % 10.7 % Nicaragua 2.1 % 0.0 % 0.0 % Panama 1.1 % 1.3 % 6.1 % Paraguay 4.4 % 11.6 % 10.5 % Peru 2.8 % 5.3 % 11.2 % Uruguay 2.5 % 4.8 % 9.7 % Venezuela 0.6 % 2.4 % 7.5 % Total 19 1.9 % 3.1 % 10.1 %
Source: Own elaboration from IMF, Direction of Trade Statistics
Rhys Jenkins
DIE − UNAM / CECHIMEX 36
two-fifths of imports from China were high technology goods.5 Since 2001, the share of high-tech imports from China has been increasing while that of low-tech products has tended to fall (see Table 4).
The rise in imports from China has, in the past few years, become a matter of growing concern in a number of Latin American countries. From the point of view of consumers, the increased availability of low cost Chinese goods has been a benefit, despite concerns over quality and safety stan-dards for some products. The focus of recent concern has been the impact of Chinese competition on local producers and whether they are being displaced by cheaper Chinese imports.
There have been no detailed studies of this issue for Latin America up to now. Anecdotal evidence, however, suggests that in the early stages of the growth of Chinese exports to the region the impact was felt mainly by other exporting countries, but that more recently domestic producers have
5 These are based on Lall’s classification of goods according to technology level (Lall
2000). A limitation of this approach to classification is that it is unable to identify high technology goods which have only been assembled in China and where the true tech-nology content is produced elsewhere. It may therefore exaggerate the extent to which imports from China effectively embody technology.
Table 4: Composition of Latin American imports from China and the rest of the world, 1995, 2001, 2006 (% share)
China Rest of the World 1995 2001 2006 1995 2001 2006
Primary products 26.5 3.0 1.0 9.0 8.6 9.0 Manufactured goods 70.5 96.3 97.5 87.3 90.0 89.6 Resource based 27.0 9.8 6.9 17.6 15.8 17.4 Low technology 7.7 34.4 22.0 14.4 15.0 13.3 Medium technology 24.2 25.4 26.3 38.7 37.0 36.9 High technology 11.5 26.7 42.3 16.6 22.2 21.9 Other 2.8 0.7 1.5 3.5 1.4 1.5 Total 100.0 100.0 100.0 100.0 100.0 100.0
Source: Economic Commission for Latin America and the Caribbean

The Latin America Case
DIE − UNAM / CECHIMEX 37
started to be affected. This appears to have been the case in Brazil where industrialists only began to realize the size of the challenge from China in 2005 (Jenkins et al. 2008). In other Latin American countries too, there have been increasing complaints from local manufacturers about the im-pact of Chinese imports (Murphy / Swann / Drajem 2007).
As two of the most industrialized countries in Latin America, domestic manufacturers in Brazil and Argentina could be among the most seriously affected in the region. In order to assess the possible impact of Chinese competition, data was collected on the share of imports from China and from the rest of the world in domestic demand in the two countries in the period up to 2006. In aggregate as imports from China supplied only 2.5 % of total Argentine demand for manufactures in 2006, compared to 23.2 % met by imports from other countries.6 The comparable figures for Brazil were 1.7 % and 15.0 % in the same year.7 This suggests that at the level of the manufacturing sector as a whole, the impact of China is quite marginal in both countries.
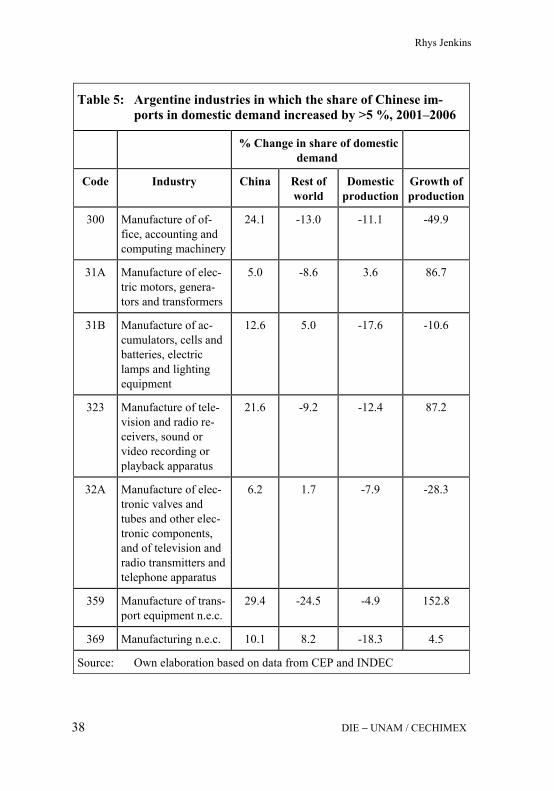
At a more disaggregated level it is possible to detect more significant ef-fects. Table 5 identifies those industries where China’s share of the Argen-tine market increased by more than five percentage points between 2001 and 2006. Of the seven industries included, the share of domestic produc-ers fell in six of them.8 Of these six, the share of imports from the rest of the world also fell in half of them, indicating that Chinese competition partly displaced imports from other countries. In the case of Motorbikes, Bikes etc. (359), the bulk of the impact was felt by other exporting coun-tries. In addition, despite a significant increase in the market share of Chi-nese imports in TV, Radio and VCRs (323), the rapid growth of demand for these products meant that production in Argentina increased over the period. This leaves four industries where competition from China could be regarded as having had a negative impact on domestic production, which contracted between 2001 and 2006 (300, 32A, 361B, 369). Thus although, in aggregate, increased imports from China have not had a major negative impact on domestic producers, they have presented a problem in certain sectors.
6 Own calculation based on data from Centro de Estudios y Publicaciones (CEP) and
Instituto Nacional de Estadística y Censos (INDEC). 7 Own calculation based on data from Instituto Brasileiro de Geografia e Estatística (IBGE). 8 The exception was Electric Motors, Generators and Transformers (31A).
Rhys Jenkins
DIE − UNAM / CECHIMEX 38
Table 5: Argentine industries in which the share of Chinese im- ports in domestic demand increased by >5 %, 2001–2006
% Change in share of domestic demand
Code Industry China Rest of world
Domestic production
Growth of production
300 Manufacture of of-fice, accounting and computing machinery
24.1 -13.0 -11.1 -49.9
31A Manufacture of elec-tric motors, genera-tors and transformers
5.0 -8.6 3.6 86.7
31B Manufacture of ac-cumulators, cells and batteries, electric lamps and lighting equipment
12.6 5.0 -17.6 -10.6
323 Manufacture of tele-vision and radio re-ceivers, sound or video recording or playback apparatus
21.6 -9.2 -12.4 87.2
32A Manufacture of elec-tronic valves and tubes and other elec-tronic components, and of television and radio transmitters and telephone apparatus
6.2 1.7 -7.9 -28.3
359 Manufacture of trans-port equipment n.e.c.
29.4 -24.5 -4.9 152.8
369 Manufacturing n.e.c. 10.1 8.2 -18.3 4.5
Source: Own elaboration based on data from CEP and INDEC

The Latin America Case
DIE − UNAM / CECHIMEX 39
Table 6 identifies those Brazilian industries which have seen the largest increase in the share of Chinese goods in local consumption.9 The market share of Brazilian producers fell in five of the six industries. The exception was office equipment where the increase in China’s market share was en-tirely at the expense of other exporters. Of the five industries in which Brazilian producers lost a significant share of the market to China, local production still increased over the period in three of them. Thus there were only two industries (315 and 321) where Chinese competition could be seen as having led to a decline in domestic production.
Given the alarm that Chinese competition has caused among local manu-facturers in Latin America recently, these findings are perhaps a little sur-
9 In this case we only show those industries in which the market share of China increased
by 10 % (as opposed to an increase of 5 % in Argentina). This was because of the longer time period covered and the more disaggregated data used. A total of 14 Brazil-ian industries showed an increase of over 5 % in the market share of Chinese imports over this period.
Table 6: Brazilian industries in which the share of Chinese imports in domestic demand increased by >10 %, 1998–2006
% Change in share of domestic demand
Code Industry China Rest of world
Domestic production
Growth of production
192 Travel goods and other leather prod-ucts
18.6 % -1.4 % -17.2 % 16.9 %
301 Office equipment 24.4 % -29.5 % 5.1 % -10.5 %314 Batteries and ac-
cumulators 13.4 % -3.0 % -10.3 % 31.6 %
315 Lamps and lighting 14.6 % 12.7 % -27.3 % -30.3 %321 Basic electronic
materials 11.3 % 14.4 % -25.6 % -29.5 %
334 Optical and photo-graphic equipment
24.0 % 0.9 % -24.9 % 28.5 %
Source: Own elaboration based on data from IBGE

Rhys Jenkins
DIE − UNAM / CECHIMEX 40
prising. However, there are a number of reasons why they may underesti-mate the effects of Chinese competition. First, the period covered is only up to 2006 and Chinese competition has become more intense since then. Second, the level of aggregation of the data is still relatively high so that the industries considered are quite broad. Individual firms, however, face competition in specific products and so may be more affected than indus-try level data suggests. Finally, the estimates provided here are based on data for legal imports and do not take into account any illegal imports from China. These are by definition very difficult to obtain information on. The estimates that do exist often come from local producers, who may have an interest in exaggerating the extent of such contraband. In the case of Mexico for instance, it has been estimated that up to 65 % of domesti-cally sold textiles and clothing are imported illegally, and as much as 80 % of watering cans, many of them from China (see Dussel Peters, Chapter 6, page 279−393). In Brazil, the textile and clothing trade association esti-mated losses of US$ 60 million in 2006 as a result of illegal imports from China (Paraguassu 2007). If systematic data were available on these im-ports, then the impact of China on domestic producers might be somewhat greater than suggested by the estimates provided here.
The rapid expansion of imports from China since 2003 has had a major impact on the trade balance between Latin America and China. Figure 3 shows that South America, which had a growing trade surplus with China in the early years of the twenty-first century as a result of the export boom in primary commodities, has seen these surpluses shrink rapidly and turn into a deficit in their bilateral trade with China in 2006 and 2007. When the trade deficit of Mexico and (less significantly) the Dominican Repub-lic-Central America Free Trade Agreement (DR-CAFTA) countries are added, then the picture is one of a rapidly increasing deficit in trade with China. The fall in commodity prices is likely to increase this deficit further in subsequent years.

Fi
gure
3:
Lat
in A
mer
ica'
s tra
de b
alan
ce w
ith C
hina
, 199
0–20
07 (U
S$ m
n)
Sour
ce:
own
elab
orat
ion
base
d on
IMF,
Dire
ctio
n of
Tra
de S
tatis
tics
-400
00
-350
00
-300
00
-250
00
-200
00
-150
00
-100
00
-500
0 0
5000
1000
0
1990
19
91
1992
1993
19
94
1995
19
9619
9719
9819
9920
0020
0120
0220
0320
0420
05
2006
20
07
Sout
h A
mer
ica
Mex
ico
+ D
RC
AFTA
Latin
Am
eric
a
The Latin America Case
DIE − UNAM / CECHIMEX 41

Rhys Jenkins
DIE − UNAM / CECHIMEX 42
3 Foreign direct investment Despite the high expectations of large inflows of foreign direct investment (FDI) from China in the region, the most striking feature of bilateral in-vestment flows is their relatively modest level up to now. If one ignores FDI flows between China and Caribbean tax havens such as the British Virgin Islands and the Cayman Islands, the role of FDI is not nearly as significant as that of trade in bilateral relations. In 2007, Chinese FDI flows to the region were just over US$ 300 million (see Table 7). Al-though this was a three-fold increase over the previous year, it still only represented around 1 % of worldwide Chinese FDI. The stock of Chinese investment in Latin America reached over US$ 1 billion in 2007.
Somewhat surprisingly in view of the expectations of large inflows of Chinese investment into the region, Latin American FDI flows to China were greater than the flows in the opposite direction before 2007, running at over US$ 100 million per year. However, the level of investment fell in 2007 and in any event had only accounted for about 0.2 % of total FDI inflows to China. Thus bilateral investment flows in 2007 came to around US$ 400 million which compares with total trade flows in that year of around US$ 100 billion.
Geographically, Chinese FDI in the region has gone mainly to Argentina, Brazil, Mexico, Peru and Venezuela, which between them account for three-quarters of the total stock at the end of 2007. Much of this invest-ment is of the “resource seeking” variety focusing on oil and minerals, as is suggested by the significant investments in Peru, Venezuela and Ecua-dor. There has also been some Chinese investment in manufacturing for example in textiles and electronics in Mexico (see Dussel Peters, Chap-ter 6, page 279−393) and in consumer electronics and telecommunications in Brazil (see Saslavsky / Rozemberg, Chapter 4, page 159−226).

The Latin America Case
DIE − UNAM / CECHIMEX 43
Table 7: FDI flows between China and Latin America, 2006 and 2007 (US$ mn)
Latin America FDI in China Chinese FDI in LA
2006 2007 2002–2007 2006 2007 2007
Flow Flow Cumulative Flow
Flow Flow Stock
Argentina 6.86 11.13 88.87 6.22 136.69 157.19
Bolivia 3.06 1.29 16.3 18 1.97 23.03
Brazil 55.6 31.64 174.62 10.09 51.13 189.55
Chile 5.6 7.19 42.44 6.58 3.83 56.8
Colombia 0.35 0.05 0.97 -3.36 0.22 6.77
Costa Rica 0.1 0 6.7
Cuba 2.8 0.63 18.8 30.37 6.58 66.49
Dominican Republic
1.64 1.82 17.19
Ecuador 0.1 1 2.76 2.46 3.58 49.18
El Salvador 0.2 0 0.37
Guatemala 1.6 1.16 2.63
Honduras 1.31 1.68 13.03 -4.38 0.9
Mexico 12.34 5.66 59.25 -3.69 17.16 151.44
Panama 59.56 25.8 243.48 8.33 55.31
Paraguay 1.58 0.58 13.55
Peru 0.73 5.27 15.85 5.4 6.71 137.11
Uruguay 0.13 0.1 1.27 0.48 2.11
Venezuela 0.98 2.09 9.14 18.36 69.53 143.88
Total 154.54 97.09 727.22 90.43 301.83 1039.76
Source: Outward Investment, 2007, Statistical Bulletin of China's Outward Foreign Direct Investment; Inward Investment, China Statistical Yearbook, various years
Rhys Jenkins
DIE − UNAM / CECHIMEX 44
Latin American FDI in China is equally limited. Among the major Latin American countries, Brazil has been the most significant investor10 with an accumulated investment of US$ 175 million between 2002 and 2007, fol-lowed by Argentina (US$ 89 million), Mexico (US$ 59 million) and Chile (US$ 42 million) (see Table 7). As the country chapters in this book show, only a few companies from the region have so far ventured into China through investment in productive activities.
10 Table 7 shows Panama as having the largest stock of FDI in China among the countries
listed. However Panama is a well known tax haven and it is therefore likely that a sig-nificant part of the recorded FDI involves “round-tripping” by Chinese investors who want to take advantage of the tax advantages offered to foreign investors in China. For a discussion of “round-tripping” see Geng (2004)
The Latin America Case
DIE − UNAM / CECHIMEX 45
PART B: INDIRECT EFFECTS
Two of the main concerns in Latin America about the growing economic significance of China arise not from the direct effects of bilateral eco-nomic relations with China but from the indirect effects on the region’s relations with third countries. In the case of trade, some countries see China as a serious competitive threat to their exports, particularly to de-veloped country markets; while in terms of FDI there is concern that in-vestment has been diverted from Latin America to China. This part will examine each of these threats in turn. A third indirect impact of China is on world commodity prices, which has a positive effect on those countries which are major exporters of these commodities. The third part of this section will estimate the extent to which the region may have benefited from this aspect of the “China effect”.
4 Competition in export markets11 The potential threat of China to Latin America’s exports to third markets has been one of the most widely studied aspects of the impact of China on the region. Previous studies which have compared Latin America with other regions have found that, apart from Mexico, the countries of the region are less threatened by Chinese exports to third markets than are the Asian economies or the transition economies of Eastern Europe (Blazquez-Lidoy / Rodriguez / Santiso 2007; IDB 2006, Ch. 5; Meller / Contreras 2003). The optimistic view, as expressed in a recent World Bank report, is that “there is come evidence of substitutability between LAC exports and Chinese exports within industries, but these effects are limited to a few countries (mainly Mexico and to a minor extent, Central America) and a few manufacturing sectors” (Lederman / Olarreaga / Perry 2006, 26). It is also argued that over time “LACs trade specialization pat-tern is becoming more complementary to the specialization pattern of China” (Lederman / Olarreaga / Rubiano 2006, 17).
However, there are reasons for believing that the threat to Latin American exports is more significant than this optimistic view would suggest. China’s accession to the WTO in 2001 and subsequently the phasing out,
11 This section is based on Jenkins (2008b).

Rhys Jenkins
DIE − UNAM / CECHIMEX 46
and final elimination on 1 January 2005, of import quotas for textiles and garments under the WTO Agreement on Textiles and Clothing (ATC) meant a significant increase in competition from China in developed coun-try markets. Also in terms of the countries affected, these are by no means restricted to Mexico. The Central American countries are also likely to have been negatively affected because they have specialized in exports of labor-intensive manufactures.
Most previous studies of the impact of China on Latin American exports have used various types of indices to estimate the similarity between the export structure of China and that of the different Latin American coun-tries as a way of identifying the potential threat that China poses.12 Here, however, we attempt to estimate the extent to which Latin American coun-tries have lost market share in the United States to China in recent years. Thus, rather than looking at the potential threat in the future, we will esti-mate the actual impact that China has had on Latin American exports in the recent past.
The methodology used to estimate the loss of market share to China is an extension of the Constant Market Share (CMS) analysis developed by Chami Batista (2008). The gains (losses) of market shares between coun-tries are related to their relative growth rates. In other words, countries gain from those countries whose exports are growing more slowly and lose to those that are growing faster than their own.13
12 For a fuller discussion of these studies and a critique of their methodology, see Jenkins
(2008a). 13 The loss of market share by a country (H) to China (C), in a particular product i is de-
fined as: ∆kHci = ∆kHi*ktCi - ∆ kCi* ktHi (1)
where: kHi is the share of country H in total imports of good i by the destination market kCi is the share of China in total imports of good i by the destination market
Superscript t represents the initial year of the period. Summing over all products gives the aggregate loss of market share to China:
Σ∆kHci = Σ∆kHi*ktCi - Σ∆ kCi* ktHi (2) Although this provides a useful way of attributing losses of market share between coun-
tries, one should note that the decomposition is based on accounting identities and should therefore be careful in making any causal inferences from it. For a fuller discus-sion of the methodology used, see Jenkins (2008b).

The Latin America Case
DIE − UNAM / CECHIMEX 47
This approach was used to estimate the loss of market share by Latin American countries to China. The analysis presented here focuses on the US since this has been the most significant market in terms of competition between China and Latin America. The data comes from the US Interna-tional Trade Commission (ITC) (http://dataweb.usitc.gov/) and covers imports from 18 countries in the region and from China and Hong Kong. Product data at the 5-digit level of the Standard International Trade Classi-fication (SITC) (Rev.3) was used. It was important to have a high level of disaggregation in order to ensure that the products being compared were close substitutes for each other.
The data was collected for four key years, 1996, 2001, 2004 and 2006. 1996 represents the situation some time before China became a member of the WTO. 2001 is immediately prior to WTO accession in December 2001. 2004 is the last year before the final removal of quotas on textiles and garments on 1 January 200514, and 2006 is the latest year for which data was available. The use of these four years makes it possible to ana-lyze how competition between China and Latin America has evolved over time in response to these changes in the trade regime.
The first point that stands out from Table 8 is the sharply increased impact of China on Latin American exports to the US in the period since it be-came a WTO member. Whereas between 1996 and 2001 the aggregate effect on the region as a whole amounted to US$ 1.3 billion (1 % of 1996 exports), over the next five years, the impact came to over US$ 18 billion (9.3 % of exports in 2001). This supports the view that far from decreasing over time, the impact of Chinese competition on Latin America has been on the increase.
Looking at the experience of individual countries, it can be seen that only two countries (Nicaragua and Peru) have not lost exports to the US to Chi-nese competition over the whole period 1996–2006. As well as Nicaragua, several other Central American countries (El Salvador, Guatemala and Honduras) were able to gain market share from China in the period before the latter became a WTO member. However, in all three countries, the gains were more than offset by losses after China joined WTO. These losses were particularly concentrated in the period after 2004 when even Nicaragua lost exports to China.
14 Although it should be noted that subsequently the US imposed new restrictions on Chi-
nese textile and clothing imports

Rhys Jenkins
DIE − UNAM / CECHIMEX 48
Table 8: Loss of exports to the US to China, 1996–2001, 2001–2006, 2004–2006 (as % of country’s total exports to the US)
1996–2001 2001–2006 2004–2006
Argentina -1.8 % -5.1 % -1.6 %
Bolivia -10.4 % 1.6 % -1.3 %
Brazil -4.1 % -7.7 % -3.3 %
Chile -1.3 % -3.0 % -1.3 %
Colombia -0.5 % -2.3 % -1.7 %
Costa Rica -1.3 % -7.8 % -1.6 %
Dominican Rep -2.4 % -13.0 % -6.1 %
Ecuador -1.0 % -1.1 % 0.0 %
El Salvador 6.5 % -12.3 % -10.5 %
Guatemala 6.2 % -10.5 % -8.7 %
Honduras 3.8 % -7.7 % -6.0 %
Mexico -1.1 % -11.4 % -4.5 %
Nicaragua 6.4 % 2.3 % -0.8 %
Panama -2.4 % -2.4 % -1.1 %
Paraguay -6.9 % -5.7 % -5.5 %
Peru 2.0 % 0.5 % -1.4 %
Uruguay -5.8 % -9.3 % -1.6 %
Venezuela 0.0 % -0.7 % -0.5 %
Latin America -1.0 % -9.3 % -3.8 %
Source: Own elaboration from USITC data (United States International Trade Commission)

The Latin America Case
DIE − UNAM / CECHIMEX 49
In the period from 1996–2001, the most severely affected countries were Bolivia, Paraguay, and Uruguay whose estimated losses to China repre-sented more than 5 % of their total exports to the US. Between 2001 and 2006, those worst hit were the Dominican Republic, El Salvador, Mexico and Guatemala, all of which lost over 10 %. As might be expected, be-tween 2004 and 2006, the countries which lost most in the aftermath of the phasing out of the ATC were the Dominican Republic and the Central American countries which rely heavily on textile and clothing exports to the US. The countries which have been least affected in the post 2001 pe-riod have been the Andean group countries whose exports to the US are mainly of minerals and oil and have therefore not faced significant Chi-nese competition.
Of the countries covered in detail in later chapters of this book, Mexico is the one which has been most affected by Chinese competition in the US market, and this is explored in more detail, with a particular emphasis on the electronics industry, in the chapter by Dussel Peters. In a companion piece on the personal computer (PC) industry in the state of Jalisco in Mexico, Dussel Peters (s. a.) describes how between 2001 and 2003 many of the leading producers of personal computers, laptops and peripherals, such as IBM, Hewlett Packard, Solectron and Jabil, transferred their pro-duction lines to Asia; particularly China. Mexico’s share of US imports of PCs fell by half from 14 % in 2001 to under 7 % in 2006, while China’s share more than tripled form 14 % to 45 % over the same period. As a result it has been estimated that more than 45,000 jobs were lost in the Jalisco electronics industry between 2001 and 2003. There is only one firm still producing PCs in the state today.
This led to a major restructuring of the electronics industry in Jalisco. While China specializes in mass produced PCs, Mexico and Jalisco are increasingly specializing in the final configuration of products and in high value segments that require rapid delivery. Thus Mexico is concentrating on those products and processes where it derives a competitive advantage from proximity to consumers and suppliers in the US. Whether this strat-egy proves to be sustainable in the longer term remains to be seen, but it has helped Jalisco recover somewhat from the impact of the crisis of 2001–2003.
While the main effect of Chinese competition in third markets for Mexico is to be seen in the US, for some of the South American economies, with

Rhys Jenkins
DIE − UNAM / CECHIMEX 50
more diversified trade patterns, the impacts on exports to the European Union and on intra-regional trade may also be significant. In the chapter on Brazil, Saslavsky and Rozemberg report that the country has been negatively affected by Chinese competition in the EU market as well as the US. There is also some evidence that Brazil is losing markets to China in the regional market. Sica (2007) reports that Brazilian exports to Argen-tina have been affected by Chinese competition. In a study of the con-sumer electronics sector, Barbosa and Guimarães (s. a. b) find that Brazil faces increasing competition from China in its Latin American export markets.
5 The impact of China on FDI flows to Latin America The second indirect effect of China’s growth on Latin America arises from the impact on global FDI flows. This could give rise to a competitive ef-fect if the increased attraction of China as a host for foreign investors led to reduced FDI flows to Latin America and the Caribbean. On the other hand, there may be positive effects where FDI in China involves the de-velopment of global production networks and hence is complementary to investment flows to other countries as has been argued in the case of East Asia (Chantasasawat et al. 2004).
Compared to the literature on trade, there have been relatively few studies of the effects of China on investment flows to other countries, particularly to Latin America. The prima facie case that the growth of China has led to a diversion of FDI from Latin America is based on the observation that inflows to China grew rapidly in the 1990s while investment in Latin America and the Caribbean lagged behind. Cravino / Ledermann / Olar-reaga (2006a) point out, however, that the lag was mainly during the pe-riod 1990–1997, and that since 1997 Latin America has performed rather well relative to China in attracting FDI. In any case any such correlation does not necessarily indicate a causal relationship.
There are a number of a priori reasons for being skeptical about the view that FDI has been diverted from Latin America to China. First, the nature of FDI in Latin America in general is not such that diversion is highly likely. In discussing foreign investment it is usual to distinguish between different types of FDI according to their motivation – natural resource seeking; market seeking; efficiency seeking. Diversion is most likely to
The Latin America Case
DIE − UNAM / CECHIMEX 51
occur in the last of these where FDI can reinforce changes in trade patterns as firms relocate to lower cost countries. It is less likely where investment is primarily resource seeking since these depend on the existence of natu-ral resources and are much less footloose. Market seeking investments occupy an intermediate position where investors may consider the relative attractiveness of different markets in terms of their size and growth. Al-though a significant part of FDI to China can be regarded as efficiency seeking, this is less important in Latin America and the Caribbean where natural resource and market seeking FDI have dominated (CEPAL 2004, Table I.6)
Second, the scale of FDI in China also limits the likelihood of major im-pacts on Latin America. Despite the rapid growth of inward investment from the early 1990s, China only accounts for about 6 % of world FDI inflows. In aggregate therefore, even if there were some diversion to China, the effects on the availability of foreign capital for other regions such as Latin America and the Caribbean is likely to be limited. However, if capital markets are imperfect, there may be significant effects on flows in individual sectors and for particular countries (IDB 2006, Ch. 6).
A third factor that suggests that diversion to China is not likely to have been very significant in terms of aggregate flows to Latin America is the different structure of FDI in terms of origin and sector. Investment in the region comes mainly from the US and the European Union, while FDI in China is mainly from East Asia. Similarly the sectoral distribution of FDI is also different. US FDI in China is mainly in manufacturing while other sectors dominate in Latin America (IDB 2006 Ch. 6).
These a priori considerations make it unlikely that diversion of FDI to China would be a major problem for Latin America as a whole. However, the situation does vary between countries and sectors and it is quite possi-ble that there may be impacts at a more disaggregated level. A clear exam-ple mentioned above was the PC industry in the state of Jalisco, Mexico, where major foreign investors relocated to China. There is a clear link here between competition in export markets and diversion of investment in that what appears in the trade data as a loss of market share by Mexico to China is driven by the decisions of major transnational corporations to invest in China rather than Mexico. Thus FDI diversion is more likely to arise in countries which have attracted efficiency seeking investment and
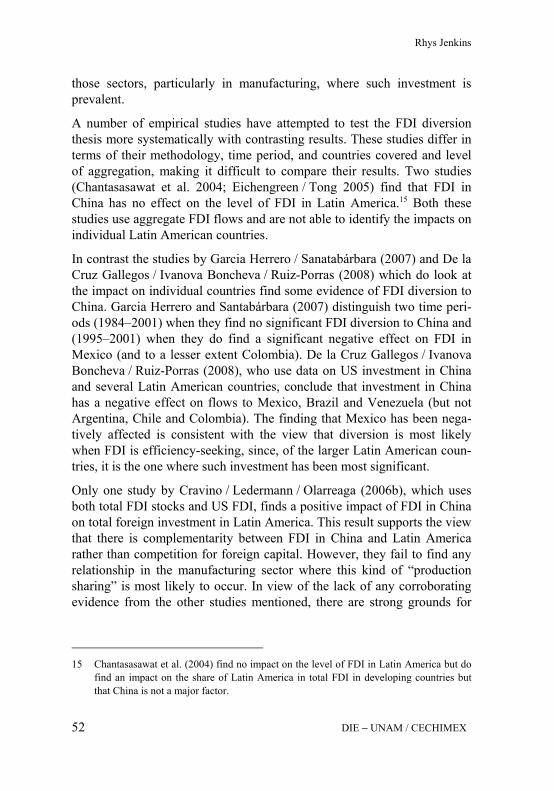
Rhys Jenkins
DIE − UNAM / CECHIMEX 52
those sectors, particularly in manufacturing, where such investment is prevalent.
A number of empirical studies have attempted to test the FDI diversion thesis more systematically with contrasting results. These studies differ in terms of their methodology, time period, and countries covered and level of aggregation, making it difficult to compare their results. Two studies (Chantasasawat et al. 2004; Eichengreen / Tong 2005) find that FDI in China has no effect on the level of FDI in Latin America.15 Both these studies use aggregate FDI flows and are not able to identify the impacts on individual Latin American countries.
In contrast the studies by Garcia Herrero / Sanatabárbara (2007) and De la Cruz Gallegos / Ivanova Boncheva / Ruiz-Porras (2008) which do look at the impact on individual countries find some evidence of FDI diversion to China. Garcia Herrero and Santabárbara (2007) distinguish two time peri-ods (1984–2001) when they find no significant FDI diversion to China and (1995–2001) when they do find a significant negative effect on FDI in Mexico (and to a lesser extent Colombia). De la Cruz Gallegos / Ivanova Boncheva / Ruiz-Porras (2008), who use data on US investment in China and several Latin American countries, conclude that investment in China has a negative effect on flows to Mexico, Brazil and Venezuela (but not Argentina, Chile and Colombia). The finding that Mexico has been nega-tively affected is consistent with the view that diversion is most likely when FDI is efficiency-seeking, since, of the larger Latin American coun-tries, it is the one where such investment has been most significant.
Only one study by Cravino / Ledermann / Olarreaga (2006b), which uses both total FDI stocks and US FDI, finds a positive impact of FDI in China on total foreign investment in Latin America. This result supports the view that there is complementarity between FDI in China and Latin America rather than competition for foreign capital. However, they fail to find any relationship in the manufacturing sector where this kind of “production sharing” is most likely to occur. In view of the lack of any corroborating evidence from the other studies mentioned, there are strong grounds for
15 Chantasasawat et al. (2004) find no impact on the level of FDI in Latin America but do
find an impact on the share of Latin America in total FDI in developing countries but that China is not a major factor.

The Latin America Case
DIE − UNAM / CECHIMEX 53
skepticism regarding this evidence of a positive impact on FDI in Latin America.
All these studies suffer from a number of limitations. The time period of the analysis may be important and even if it were the case that in the past there had been no significant diversion of FDI to China, this is no guaran-tee that it would not occur in the future. The results obtained by Garcia Herrero / Sanatabárbara (2007) and De la Cruz Gallegos / Ivanova Bon-cheva / Ruiz-Porras (2008) concerning the effects on different Latin American countries also indicate that aggregate data on the region as a whole may hide significant impacts on individual countries. There may also be sector specific effects which are not captured in the highly aggre-gated type of studies that have been carried out so far. This suggests a need for further work on this issue, particularly on the impact on individ-ual countries and sectors where diversion is most likely to occur.
6 China’s impact on global commodity prices The third major indirect impact that China has on the region is through its effects on primary commodity markets. In recent years China has ac-counted for a significant and increasing share of world demand for a num-ber of the major commodities exported from Latin America.
Table 9, which lists the fifteen most important primary products exported from the region, shows that in 2007 China accounted for more than half of world consumption of iron ore16, a third of aluminum and zinc, and more than a quarter of copper. It is also a major market for certain agricultural products, particularly soybeans, soybean oil and fishmeal, where it makes up between a fifth and a quarter of world consumption. In other commodi-ties, however, its share is not so striking. It does account for more than 10 % of world beef and poultry consumption, but consumes less than 10 % of world oil and other industrial inputs such as timber and pulp. It also has a relatively small share of the world market for tropical agricultural prod-ucts such as sugar, bananas and coffee.
16 This figure is somewhat inflated by the low iron content of much of the ore mined in
China. An adjusted figure which takes account of this would reduce China’s share to around 44 % of world consumption in 2007.
Rhys Jenkins
DIE − UNAM / CECHIMEX 54
Table 9: China’s share of global consumption of primary commodities, 2002, 2006, 2007 (in volume terms)
China’s share of global consumption
Increase in price
2002 2006 2007 2002–2007
Fuels
Oil 6.9 % 9.0 % 9.3 % 185.1 %
Minerals, ores and metals
Iron ore 30.3 % 50.7 % 54.3 % 184.7 %
Copper 18.2 % 21.2 % 27.1 % 356.5 %
Aluminum 21.1 % 25.4 % 33.2 % 95.4 %
Zinc 22.4 % 28.9 % 32.4 % 316.4 %
Feedstuffs
Soybean 18.4 % 20.2 % 20.9 % 80.6 %
Soya oil 21.2 % 24.2 % 25.9 % 94.0 %
Fishmeal 23.0 % 24.8 % 27.5 % 93.8 %
Tropical food and beverages
Coffee 0.3 % 0.4 % n. a. 125.6 %
Sugar 7.9 % 8.7 % 9.3 % 46.4 %
Bananas 8.4 % 10.0 % n. a. 28.6 %
Meat products
Beef 10.6 % 11.9 % 12.3 % 22.6 %
Poultry 16.8 % 16.3 % 17.2 % 23.9 %
Forest products
Sawn wood 4.0 % 4.2 % 8.6 % 63.6 %
Chemical pulp 5.7 % 6.8 % 7.8 % 55.5 %
n. a. – not available Source: China’s consumption – own elaboration from various sources Prices – UNCTAD (2008, Table 2.1) and UNCTAD, Commodity Price Statistics

The Latin America Case
DIE − UNAM / CECHIMEX 55
Table 9 also shows the substantial price increases that occurred for most primary commodities between 2002 and 2007. The most dramatic rises have been in metals, particularly copper and zinc, and in oil. Feedstuffs have also increased significantly in price, although this is largely attribut-able to dramatic increases between 2006 and 2007 associated with the de-mand for land to grow bio-fuels. Other agricultural products have had more modest price increases, with the notable exception of coffee. Al-though a number of different factors have led to these price increases, there is widespread agreement that the growth of demand in China has been an important contributor to the commodity boom (UNCTAD 2005, Ch. II; IMF 2006; Gottschalk / Prates 2005).
Latin America as a region benefited from the boom in commodity prices. Several of the chapters in this book illustrate the rise in export prices and the improvement that has taken place in the terms of trade. Lopez and Ramos show the substantial increase in export prices (particularly of oil-seeds and their products) in Argentina between 2000 and 2008 and the accompanying improvement in the terms of trade (see Lopez / Ramos, Table 27, page 115). In the case of Brazil, export prices to China almost doubled between 2001 and 2007, giving rise to a substantial improvement in the bilateral terms of trade (see Saslavsky / Rozemberg, Figure 3, page 190). Brazil’s terms of trade with other countries did not improve to the same extent but nevertheless there was an overall improvement. Chile is the country where the effect on commodity prices has been felt most strongly with the sharp increase in copper prices increasing export earn-ings and government revenues (Barton s. a.).
The question that this raises is: to what extent can these increases in export prices be attributed to the growing Chinese demand for primary commodi-ties? In order to estimate this, a hypothetical global demand was calculated for each product in 2006, assuming that China’s demand had grown at the same rate as in the rest of the world between 2002 and 2006. The differ-ence between this figure and the actual world demand in 2006 provides an estimate of the extent to which China’s exceptional economic performance increased world demand for the products concerned over the period. Table 10 shows that the impact of China’s growth on world demand varied from being insignificant in products such as sugar and coffee to a massive in-crease in world demand of over 40 % for iron ore.17
17 In the case of poultry Chinese demand has grown more slowly than for the rest of the
world, probably reflecting the impact of the bird flu outbreak on domestic demand.

Rhys Jenkins
DIE − UNAM / CECHIMEX 56
Table 10: Impact of China on prices and the value of 15 main commodities exported from Latin America, 2002–2006
China demand
effect
China Price effect Estimated effect of China on value of ex-
ports (US$ mn.)
Maximum Minimum Maximum Minimum
Crude oil 2.4 % 24.0 % 9.6 % 21,825 9,877
Iron ore 41.2 % 164.9 % 103.1 % 5,979 4,875
Copper 3.8 % 37.9 % 15.2 % 11,926 5,712
Aluminum 5.8 % 23.3 % 14.6 % 1,151 774
Zinc 8.4 % 83.5 % 33.4 % 1,831 1,008
Soybean 2.2 % 5.4 % 3.6 % 411 279
Soya oil 3.9 % 9.8 % 6.6 % 382 262
Fishmeal 2.4 % 6.1 % 4.1 % 105 71
Coffee 0.1 % 1.0 % 0.3 % 77 19
Sugar 0.9 % 9.2 % 1.8 % 655 141
Bananas 1.7 % 8.6 % 4.3 % 227 118
Beef 1.4 % 4.7 % 2.4 % 265 136
Poultry -0.7 % -2.2 % -1.1 % -75 -37
Sawn wood 0.3 % 1.3 % 0.4 % 41 14
Chemical Pulp 1.2 % 5.8 % 1.9 % 213 74
Total 45,014 23,322
Source: Jenkins (2008c)

The Latin America Case
DIE − UNAM / CECHIMEX 57
In order to calculate the impact of rapid Chinese growth on world price, it is necessary to have estimates of the global elasticity of supply for the concerned commodities. These are surprisingly difficult to come by and when they are available, there is often a considerable range of estimates, making it impossible to come up with a single reliable figure. Thus a range of elasticities has been used for each product to calculate the effect on prices.18 The effect varies from negligible in the case of coffee and wood to more than a doubling in price for iron ore. Copper, aluminum and zinc, the other metals for which Latin America is an important exporter, have also experienced a significant “China effect”.
Columns (4) and (5) of Table 10 present the estimated effect of Chinese demand on the value of Latin American exports in 2006. Despite the fact that China’s impact on oil prices has not been as pronounced as for metals, the sheer scale of oil exports from Latin America means that the largest absolute impact on export earnings has been from oil. The estimate indi-cates that the region’s exports would have been between US$ 9 and US$ 22 billion less in the absence of the “China Effect” on the oil market. Although individually the contribution of metals is less significant than for oil, taken together the four commodities included have a roughly similar impact to oil. Other commodities have a relatively small impact on Latin American export earnings. In aggregate, the impact of China on export earnings was estimated at between US$ 23 billion and US$ 45 billion (see Table 10). This represented between 10 % and 20 % of the total earned from the 15 commodities in 2006.
It is interesting to compare the extent to which Latin America has bene-fited indirectly from the growth of Chinese demand for the products which it exports, with the increase in export revenues from bilateral trade with China. The increase in direct exports to China between 2002 and 2006 came to US$ 20.8 billion. In other words the indirect impact of China on Latin American exports in this period was at least as great as the direct impact.
There are several caveats which need to be attached to these estimates. First, they depend critically on the assumptions made about the elasticities of global supply for the 15 commodities. These are relatively low because
18 For further details on the elasticities used, see Jenkins (2008c).
Rhys Jenkins
DIE − UNAM / CECHIMEX 58
of the short period of time being considered. In the longer term, supply elasticities would tend to be higher as new sources come on stream and consequently the impact on prices and export earnings would be reduced. Second, no account is taken of the fact that the high growth of demand in China may have been at the expense of growth elsewhere in the world, for example because industries using these commodities as inputs have relo-cated to China. To the extent that this is significant, then the overall im-pact will have been overestimated.
A third consideration is that the estimates presented here are based on the total value of the region’s exports of the 15 commodities in order to calcu-late the gain in export earnings. However some countries in the region import some of these commodities and it might therefore be more appro-priate to look at net exports rather than the total value. If this were done then the estimated gain to the region as a result of the “China effect” on commodity prices would be about 20 % lower (US$ 18–36 billion).
This highlights the fact that these estimates are for Latin America as a whole, and there has been no attempt to identify the impacts on individual countries within the region. However, it is easy to infer how these impacts would be distributed from the effects on different commodities. The main beneficiaries would be oil and mineral exporters such as Venezuela, Mex-ico, Ecuador, Peru, Chile and Brazil. Some benefits would also accrue to exporters of soybeans (Argentina, Brazil). However, other agricultural exporters would have benefited relatively little, particularly the Central American countries whose main exports are coffee, bananas and sugar.
The Latin America Case
DIE − UNAM / CECHIMEX 59
Conclusion
One should beware of exaggerating the significance of the rise of China for Latin America. As was indicated above, for the region as a whole, China is still far less important as a trade partner than either the United States or the European Union. It also lags a long way behind the traditional sources of foreign investment in the region. However, as long as China continues to grow at rates well above the average for the world economy as a whole, its impact on Latin America is likely to become increasingly significant over time.
All the countries of the region, even those which do not recognize the Peo-ple’s Republic and have limited trade links with the mainland, have been affected by the growth of China. The ways in which they have been af-fected vary from country to country. For some countries (Cuba, Costa Rica, Peru, Chile and Argentina), China has become a major export market and they have also benefited from the impact of Chinese demand on global prices for their primary commodity exports.19 Other countries (Bolivia, Ecuador, Venezuela), whose exports to China are relatively limited, have nevertheless benefited indirectly from the “China effect” on commodity prices. All the countries of the region have seen rapid growth in imports from China since 2002 which has benefited consumers but also had ad-verse impacts on local manufacturers in some sectors. Those countries which are important exporters of manufactures to the US (Mexico, most of Central America and the Dominican Republic) have been particularly af-fected by losing market share to Chinese competition. Brazil, as the largest and most diversified economy in the region, has been affected in all these ways.
The different patterns that have been observed underline the importance of carrying out individual country studies of the impact of China. Despite these differences in the channels through which China has affected the various Latin American countries, there is a general trend for the region to become more specialized in production of primary products and resource based manufactures, while China specializes in manufactured goods which are becoming more technologically sophisticated over time. This is not
19 Costa Rica is an exception in that its exports to China are of manufactures and its pri-
mary commodity exports have not been significantly affected by Chinese demand.
Rhys Jenkins
DIE − UNAM / CECHIMEX 60
just a matter of market forces leading to specialization based on different resource endowments. Despite China’s economic reforms since the late 1970s, the state continues to play a major role in Chinese development, promoting particular industries and protecting local producers. This is in sharp contrast to Latin America, where there have been no attempts to utilize industrial policies since the neo-liberal reforms of the 1980s and early 1990s. As a result, the high value parts of global value chains are being located in China, not in Latin America.
In this respect the rise of China is contributing further to the re-orientation of the Latin American economies towards a resource based model, which began in the late 1980s. The relative decline of the manufacturing sector gives rise to concern on two main grounds. With the commodity boom apparently at an end, the traditional concerns voiced by Prebisch and the Economic Commission for Latin America and the Caribbean concerning the negative effects of specializing in primary commodities on growth and technological development again come to the fore (Mesquita Moreira 2007). There are also likely to be negative distributional effects arising from this growth pattern. As former Inter-American Development Bank chief economist Guillermo Calvo stated recently, “if by development you mean better income distribution, then I’m not sure that China is a positive factor. Because when China imports soya, minerals, that sort of thing, that does not necessarily improve living conditions in Latin America. It doesn’t improve the quality of life of the majority” (Calvo 2007).

The Latin America Case
DIE − UNAM / CECHIMEX 61
Bibliography
Barbosa, A. / D. M. Guimarães (s. a. a): Economic relations between Brazil and China in the mining/steel sectors, Bonn: Deutsches Institut für Entwicklungs-politik (Discussion Paper), forthcoming
– (s. a. b): Economic relations between Brazil and China in the consumer elec-tronic sector, Bonn: Deutsches Institut für Entwicklungspolitik (Discussion Paper), forthcoming
Barton, J. (s. a.): The impact of China’s global expansion on Chile: the copper and textile value chains, Bonn: Deutsches Institut für Entwicklungspolitik (Dis-cussion Paper), forthcoming
Blazquez-Lidoy, J. / J. Rodriguez / J. Santiso (2007): Angel or Devil? China’s trade impact on Latin American emerging markets, in: J. Santiso (ed.), The visible hand of China in Latin America, Paris: OECD (Development Centre Studies)
Calvo, G. (2007): Interview: Who benefits from trade with China?, IDB America; online: http://www.iadb.org/idbamerica/index.cfm?thisid=4337 (accessed 21 March 2007)
CEPAL (Comisión Económica para América Latina y el Caribe) (2004): Foreign direct investment in Latin America and the Caribbean, Santiago de Chile
– (2005): Panorama de la inserción internacional 2004: Tendencias 2005, Santiago de Chile
Chami Batista, J. (2008): Competition between Brazil and other exporting coun-tries in the US import market: a new extension of constant-market-shares analysis, in: Applied Economics 40 (19), 2477–487
Chantasasawat, B. et al. (2004): Foreign direct investment in East Asia and Latin America: is there a People’s Republic of China effect?, Tokyo: Asian Devel-opment Institute (Discussion Paper 17)
Cravino, J. / D. Lederman / M. Olarreaga (2006a): Foreign direct investment in Latin America during the emergence of China and India: stylized facts: back-ground paper for the office of the Chief Economist for Latin America and the Caribbean Regional Study: Latin America respond to the growth of China and India, Washington, DC: World Bank
– (2006b): Substitution between foreign capital in China, India and the rest of the world: much ado about nothing: background paper for the office of the Chief Economist for Latin America and the Caribbean Regional Study: Latin America respond to the growth of China and India, Washington, DC: World Bank
Rhys Jenkins
DIE − UNAM / CECHIMEX 62
De la Cruz Gallegos, J. L. / A. Ivanova Boncheva / A. Ruiz-Porras (2008): Compe-tition between Latin America and China for US Direct Investment, in: Global Economy Journal 8 (2)
Dussel Peters, E. (s. a.): The Mexico-China economic relationship in electronics: a case study of the PC industry in Jalisco, Bonn: Deutsches Institut für Entwicklungspolitik (Discussion Paper), forthcoming
Eichgreen, B. / H. Tong (2005): Is FDI to China coming at the expense of other countries?, Cambridge, Mass.: National Bureau of Economic (Working Paper 11335)
García Herrero, A. / D. Santabárbara (2007): Does China have an impact on for-eign direct investment to Latin America, in: J. Santiso (ed.), The visible hand of China in Latin America, Paris: OECD (Development Centre Studies)
Geng, X. (2004): Round-tripping foreign direct investment in the People’s Repub-lic of China: scale, causes and implications, Tokyo: Asian Development In-stitute (Discussion Paper 7)
Gottschalk, R. / D. Prates (2005): The macro economic challenges of East Asia’s growing demand for primary commodities in Latin America: paper prepared for the G-24, Brighton: Institute of Development Studies
IDB (Inter-American Development Bank) (2006): The emergence of China: oppor-tunities and challenges for Latin America and the Caribbean, Cambridge, Mass.: Harvard University Press
IMF (International Monetary Fund) (2006): World Economic Outlook, Washing-ton, DC
Jenkins, R. (2008a): Measuring the competitive threat from China for other south-ern exporters, in: The World Economy 31 (10), 1351–366
– (2008b): China’s global growth and Latin American exports, Helsinki: United Nations University World Institute for Development Economic Research (UNU-WIDER Research Paper 2008/104)
– (2008c): The impact of China’s growth on global commodity prices and Latin American export earnings, mimeo
Jenkins, R. / C. Edwards (2006): The economic impact of China and India on sub-Saharan Africa: trends and prospects, in: Journal of Asian Economics 17 (2), 207–25
Jenkins, R. / E. Dussel Peters / M. Mesquita Moreira (2008): The impact of China on Latin America and the Caribbean, in: World Development 36 (2), 235–53
Kaplinsky, R. / D. Messner (2008): Introduction: the impact of Asian drivers on the developing world, in: World Development 36 (2), 197–209

The Latin America Case
DIE − UNAM / CECHIMEX 63
Lall, S. (2000): The technological structure and performance of developing country manufactured exports, 1985–2008, in: Oxford Development Studies 28 (3), 337–69
Lam, T. et al. (2009): China’s foreign aid activities in Africa, Latin America, and Southeast Asia, Washington, DC: Congressional Research Service (Report for Congress R40361)
Lederman, D. / M. Olarreaga / G. Perry (2006): Latin America and the Caribbean response to the growth of China and India: overview of research findings and policy implications, Draft version, Washington, DC: World Bank, Office of the Chief Economist for Latin America and the Caribbean Regional Study
Lederman, D. / M. Olarreaga / E. Rubiano (2006): Latin America’s trade speciali-zation and China and India’s growth: background paper for the Office of the Chief Economist for Latin America and the Caribbean Regional Study: Latin America Respond to the Growth of China and India, Washington, DC: World Bank
Meller, P. / G. Contreras (2003): La competitividad de las exportaciones chinas en los mercados de Estados Unidos y Japón, Santiago de Chile: Corporación de Estudios para Latinoamérica (CIEPLAN Serie Estudios Socio/Económicos 16)
Mesquita Moreira, M. (2007): Fear of China: is there a future for manufacturing in Latin America?, in: World Development 35 (3), 355-76
Murphy, H. / C. Swann / M. Drajem (2007): Economic outlook: competition from China squeezes developing countries, in: International Herald Tribune 2 April 2007
Paraguassu, F. (2007): O tamanho da ameaca, in: Industria Brasileira, April Schmitz, H. (2006): Asian drivers: typologies and questions, in: IDS Bulletin 37,
(1) Shafaeddin, S. M. (2004): Is China’s Accession to WTO threatening exports of
developing countries?, in: China Economic Review 15 (2), 109–44 Sica, D. (2007): Algunos elementos de análisis sobre la presencia de China en la
relácion Argentina-Brasil; online: http://www.abeceb.com, economía online UNCTAD (United Nations Conference on Trade and Development ) (2005): Trade
and Development Report 2005, Geneva – (2008): Trade and Development Report 2008, Geneva


The Argentine Case
Andrés López / Daniela Ramos


The Argentine Case
DIE − UNAM / CECHIMEX 67
Contents
Introduction 71
1 The trade relationships between China and Argentina 75
1.1 Exports to China 85
1.2 Imports from China 96
1.3 Argentina’s protectionist measures against China 104
1.4 Effects of trade with China 109
2 FDI flows and the incidence of China on Argentina’s global positioning 127
2.1 Chinese FDI: Recent trends and major projects in Argentina 128
2.2 Argentine FDI in China 143
2.3 China's impact on the integration of Argentina into global value chains 146
Conclusions 151
Bibliography 155
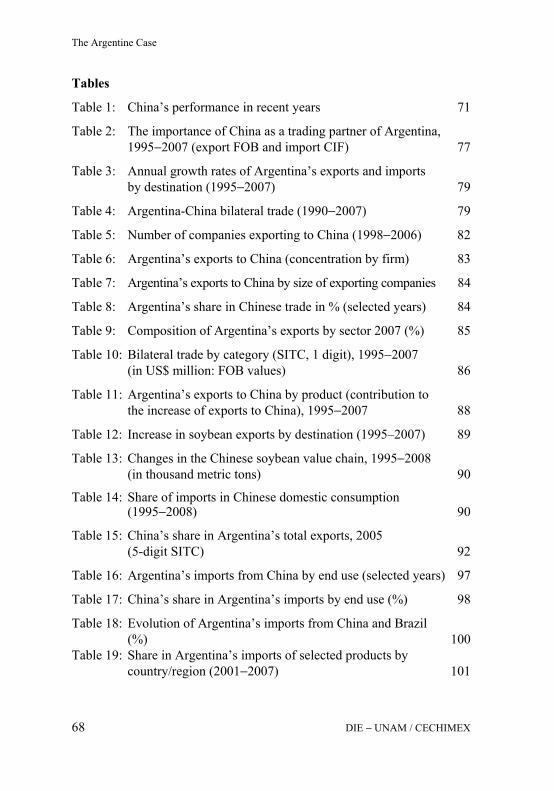
The Argentine Case
DIE − UNAM / CECHIMEX 68
Tables
Table 1: China’s performance in recent years 71
Table 2: The importance of China as a trading partner of Argentina, 1995−2007 (export FOB and import CIF) 77
Table 3: Annual growth rates of Argentina’s exports and imports by destination (1995−2007) 79
Table 4: Argentina-China bilateral trade (1990−2007) 79
Table 5: Number of companies exporting to China (1998−2006) 82
Table 6: Argentina’s exports to China (concentration by firm) 83
Table 7: Argentina’s exports to China by size of exporting companies 84
Table 8: Argentina’s share in Chinese trade in % (selected years) 84
Table 9: Composition of Argentina’s exports by sector 2007 (%) 85
Table 10: Bilateral trade by category (SITC, 1 digit), 1995−2007 (in US$ million: FOB values) 86
Table 11: Argentina’s exports to China by product (contribution to the increase of exports to China), 1995−2007 88
Table 12: Increase in soybean exports by destination (1995–2007) 89
Table 13: Changes in the Chinese soybean value chain, 1995−2008 (in thousand metric tons) 90
Table 14: Share of imports in Chinese domestic consumption (1995−2008) 90
Table 15: China’s share in Argentina’s total exports, 2005 (5-digit SITC) 92
Table 16: Argentina’s imports from China by end use (selected years) 97
Table 17: China’s share in Argentina’s imports by end use (%) 98
Table 18: Evolution of Argentina’s imports from China and Brazil (%) 100 Table 19: Share in Argentina’s imports of selected products by country/region (2001−2007) 101

The Argentine Case
DIE − UNAM / CECHIMEX 69
Table 20: China’s share of Argentina’s total imports by product at 5 digit of SITC 2005 (FOB values) 102
Table 21: Argentina-China bilateral trade, 2004−2008 (US$ million) 104
Table 22: Average prices of exports and imports (US$ / Tn) 105
Table 23: Antidumping and safeguard measures adopted by Argentina (available years), FOB values (%) 106
Table 24: Evolution of export taxes 111
Table 25: Fiscal revenues for taxes on exports, 1995−2007 (US$ million) 112
Table 26: International prices of the soybean complex: Argentine harbors FOB, 1990−2008 (US$ / Tn) 113
Table 27: Evolution of Argentina’s terms of trade (selected products 1995−2008) 115
Table 28: Employment changes in Argentina’s industrial sector: The impact of trade with China (number of employees) 119
Table 29: FDI flows: World total, China and Argentina (US$ billion) 128
Table 30: FDI flows into China by sector (2006) 129
Table 31: Chinese foreign direct investment in the world (US$ million) 131
Table 32: Destination of Chinese foreign direct investment, 2004−2007 (% of total) 135
Table 33: Destination of Chinese foreign direct investment (% share) 136
Table 34: Chinese FDI in Argentina (announced projects), 1998−2007 (US$ million) 138

Andrés López / Daniela Ramos
70 DIE − UNAM / CECHIMEX
Figures
Figure 1: Argentina-China bilateral trade (1990−2007) 78
Figure 2: China’s imports of primary goods, 1990−2006 (US$ million) 80
Figure 3: Diversification of Argentina’s export to China: Share of main products (SITC5-digit) in exports (%) 95
Figure 4: Imports from China involved in antidumping measures effectively adopted, available years (US$ million) 107
Figure 5: What barriers, if any, has your company had to deal with to undertake activities outside Continental China? 133
Figure 6: Argentine FDI flows into China, 1997−2006 (US$ million) 144

The Argentine Case
DIE − UNAM / CECHIMEX 71
The Argentine Case
Andrés López / Daniela Ramos
Introduction1
China’s emergence has generated a great impact on the economic per-formance of many countries, in particular those that have developed a strong commercial relationship with that country and those which compete with China in third export markets or in the sphere of foreign direct in-vestment (FDI) inflows.
During the last 15 years China has grown at an average real rate of 10% and its share in world industrial production has climbed from 1.9% in 1990 to 5.2% in 2005 (Ancochea 2007). In part, this performance has been sustained by the expansion of Chinese exports, which have increased at an annual rate of 17% since 1990, making it the third world exporter (see Table 1, where you may observe how China has gained presence in a number of key
Table 1: China’s performance in recent years
2001 2002 2003 2004 2005 2006Share in world FDI inflows 5.1 6.7 7.2 6.9 8.3 5.8 Share in world GDP* 4.2 4.5 4.5 4.7 5.0 7.0 Share in world GDP (at PPP**) 11.3 11.8 12.4 13.0 13.7 16.5
Share in world good exports 4.2 5.0 5.7 6.4 7.2 12.3 Share in world population 20.7 20.6 20.5 20.3 20.2 20.7
* At market exchange rates ** Purchasing power parity
Source: EIU / CPII (2006)
1 The authors wish to thank the valuable collaboration of Cecilia Simkievich and Gabriela
Starobinsky in the execution of this study, as well as the able assistance of Florencia Benítez Boiardi and Andrés Niembro. They also gratefully acknowledge the informa-tion and opinions provided by the organizations and persons interviewed during the re-search project on which this paper is based.

Andrés López / Daniela Ramos
DIE − UNAM / CECHIMEX 72
economic indicators). The entry of China into the World Trade Organization (WTO) in 2001 and the removal of Multi-Fiber Arrangement (MFA) quotas in 2005 both contributed to the expansion of Chinese exports.
In turn, some indicators suggest that China’s rapid growth could be main-tained in the future, in spite of the impact of the current international cri-sis. China’s rate of investment averaged 40% between 1997 and 2005 and productivity increased almost 10% annually between 1990 and 2001 (Pitsilis / Woetzel / Wong 2004), while Research & Development (R&D) expenditures grew at an average annual rate of 20 % in recent years to reach 1.4% of the GDP (Dougherly 2008).
In just a few years, China has become the main world importer of many primary products. Furthermore, since the 1990’s China has become the principal destination of foreign direct investment (FDI) within the devel-oping world, with almost US$ 70 billion of inward flows (average per year) between 2003 and 2007 (UNCTAD, years 2006−2008). All these figures give support to the following statement: “this economic giant mat-ters” (Dougherly 2008).
With the main goal of securing access to the continent’s vast natural re-sources and markets, China is forging deep economic and political ties with many Latin American countries. For these countries, China is a sig-nificant competitor and rival, but also a potential investor, customer, eco-nomic partner and a counterweight to US power (Malik 2006). China is now the second largest trading partner for Argentina, Peru and Brazil; and the third largest for Chile; also, trade with China now falls within the top ten for Paraguay and Uruguay. Following Santiso (2006), “China’s invisi-ble hand spreads through Latin America”.
In the particular case of Argentina, the emergence of China in the global economy has great current and potential future impact and hence it comes as no surprise that there is a growing interest in bilateral relations. On one hand, the announcement of possible huge Chinese investments in Argen-tina spurred a great amount of attention some years ago (although so far those investments have only been made in small quantities, as seen below). On the other hand, and more concretely, China has become a first rate trade partner of Argentina, due both to its increasing need for agricultural goods and raw materials and to its strong export capabilities.
Argentina’s exports to China went from less than US$ 160 million in 1980 to more than US$ 5 billion in 2007. In turn, imports from China rose from

The Argentine Case
DIE − UNAM / CECHIMEX 73
US$ 30 million to US$ 5 billion in the same years. As a consequence of these trends, China became the second export destination and the third import supplier for Argentina.
From the point of view of a developing country such as Argentina, China’s emergence has different and often contrasting interpretations. First, as previously mentioned, China has become the most attractive destination for foreign direct investment within the developing world.2 This could clearly have direct relevance for Argentina insofar as it competes with China in the attraction of FDI inflows. Of course, this is not the case for sectors in which China has very strong competitive advantages – such as the manufacturing industry or in cheap labor-intensive activities –, but it may occur in certain service activities or other sectors in which labor costs or scale of production are not the central sources of competitiveness.
Second, in the foreign trade area, the rapid growth of Chinese exports may result in fierce competition with Argentina’s domestic industry as well as in the displacement of Argentina’s exports in third markets. This naturally depends on the degree of substitutability of Argentina’s export basket vis-à-vis that of China. This last point is especially relevant be-cause, as stated by Mesquita Moreira (2006), China has a combination of endowments, scales, fast productivity growth and a strong state that makes it a formidable competitor for Latin America in general.3
Nevertheless, the growing Chinese demand and expansion of its domestic market at the same time, open new possibilities for exporting mainly natural resource-intensive goods and hence becoming a very attractive trade oppor-tunity for Argentina, as well as a motivation for new Chinese investments in the country. Furthermore, the strong Chinese demand for raw materials and its large manufacturing exports are among the factors that led to the im-provement in terms of trade observed in many developing countries, includ-ing Argentina, up until the current international crisis (see Kaplinsky 2006).
Third, China – together with other fast growing economies of Asia and Eastern Europe – plays a key role in production and trade restructuring at the world level associated with the deployment of global value chains
2 For an empirical analysis of the impact of China on FDI flow towards Latin America
see Chantasasawat et al (2004) and García-Herrero / Santabarbara (2007). 3 As an example, wages in China are four times lower than average wages in Latin
American countries (Blázquez-Lidoy / Rodríguez / Santiso 2006).
Andrés López / Daniela Ramos
DIE − UNAM / CECHIMEX 74
(GVCs). This process, which is relatively recent, is based on a number of factors linked to the characteristics of the economies integrated within those chains and to changes in the strategies of transnational corporations (TNCs). Among the former, it is important to highlight the importance of the cost advantages that are enjoyed by many of those countries, as well as the de-velopment of capabilities and competences which were lacking some years ago. Another significant factor is the emergence of global TNCs originating in those countries. Regarding these factors, the deployment of efficiency seeking strategies means that TNCs increasingly concentrate their affiliates in activities which contribute to their global competitiveness, while at the same time creating global outsourcing networks with the same objective. Hence, TNCs increasingly offshore production lines, areas or functions towards emerging countries in which those activities may be developed efficiently. All this has a clear impact on the role which countries such as Argentina may play in the GVCs that are being created. The challenge for such countries is to find a place in those chains if they want to have a sus-tainable insertion in global trade and investment flows.
In this scenario, the present work addresses some of the questions raised by the emergence of China as a global economic power. In particular, we have focused on the recent evolution of Argentina-China bilateral relations in two key areas: trade and investment. In the first case we are interested in learning about the current pattern of bilateral exchange and in knowing to what extent Argentina is taking advantage (or has the capabilities to do so) of the large and growing Chinese domestic market. The impact on Argentina of bilateral trade with China is also analyzed. Regarding in-vestments, this study surveys the main bilateral investment projects with the aim of analyzing to what extent Argentina has profited from increasing Chinese investment in Latin America. Finally, the study also deals with the potential impact of China on the possibilities in Argentina for sustain-able integration within the goods and services GVC that are being devel-oped at a global level.
The first part of this study analyzes bilateral trade between China and Argentina at a five digit level of disaggregation according to the Standard International Trade Classification (SITC) during the 1995−2006 period. It also includes information on the principal protectionist measures adopted by each country affecting the other partner, as well as an analysis of the impact of trade with China on government revenues, terms of trade and employment in Argentina. The second part focuses on bilateral FDI flows
The Argentine Case
DIE − UNAM / CECHIMEX 75
during the same years and includes a list of the main investment projects detected both in China and Argentina in recent years. The analysis is based on available data from official agencies, press releases, information pro-vided by key informants and other formal and informal sources. The last section provides a conclusion of this study.
1 The trade relationships between China and Argentina At present, bilateral trade between China and Argentina displays a clear pattern according to which Argentina has become a supplier of natural resource-based commodities and an importer of manufactured goods of assorted technological content. As mentioned previously, China is now the second export destination for Argentina and the third import supplier (be-hind Brazil and the United States).4
The first landmark in bilateral relations was the establishment of full dip-lomatic relations in 1972. Since then China and Argentina have signed many agreements, e.g. maritime transport (1978), scientific and techno-logical cooperation (1978), economic cooperation (1980), etc. At that time, China had established diplomatic relations with most Latin American countries and trade with the region began to grow rapidly – from US$ 150 million in the early 1970s to US$ 1,269 million in 1979 (Cesarín 2007).5
Since then, a number of presidential visits have taken place and several agreements have been reached. President Néstor Kirchner visited China in 2004 and both countries signed cooperative agreements in the areas of civil aviation, public health, culture, investment and agriculture. Some months later, in November 2004, President Hu Jintao visited Argentina. During this visit, he and President Kirschner expressed their willingness to establish a strategic association between the two countries. The objectives were to reinforce economic-commercial cooperation and enrich scientific-
4 Unless otherwise indicated, INDEC – the Argentinean National Institute of Statistics
and Census – official statistics are employed in this section. As stated by Jenkins and Dussel Peters (2006), there are some doubts regarding the accuracy of the trade figures provided by China insofar as they are often different from those supplied by its trade partners.
5 Before then, the relationship between China and the Latin American countries was weak, dominated by a few trade links and based on sporadic entrepreneurial links, mostly due to China’s international isolation.
Andrés López / Daniela Ramos
DIE − UNAM / CECHIMEX 76
technological exchange, to promote personal communications as well as the development of human resources, and to increase multilateral coopera-tion. After this visit, the Chinese authorities declared Argentina a tourism destination. This was probably the most important outcome of Hu Jintao’s visit; although so far, unfortunately, it has not had a real impact on tourist flows from China.
On that occasion, there were official announcements (by the Argentine Government) regarding China’s goal of investing around US$ 20 billion in Argentina during the following ten years in fields such as communications and satellite technology; Information and Communication Technologies (ICT); infrastructure; energy; and railways, etc. Those announcements were denied by the Chinese authorities and, according to some key infor-mants, they constituted a diplomatic mistake which damaged bilateral relations in the field of FDI. At the same time, in recent years Argentina – like many other countries – has taken a few offensive measures with the aim of benefiting from China’s increasing role in world trade. One of these actions was the negotiation of China’s accession to the WTO6 (which finally occurred in 2001), in exchange for some commercial benefits (tariff reductions in some products – mainly agricultural and metallurgical – most favored nation concessions, tariff-rate quotas for soybean oil, corn, wool wheat; negotiations on the openness of markets (bovine meat, lemons, mate, soybean oil) and agreements on some sanitary measures (Galperín / Gi-rado / Rodriguez Diez 2004).
As seen in Table 2, China’s share in Argentina’s foreign trade has been growing. The volume of trade between both countries was very low until the 1980’s when total trade (exports + imports) was under US$ 200 mil-lion. This is in striking contrast with the 2007 figures, when bilateral trade amounted to more than US$ 10 billion.
China’s share in Argentina’s exports rose from 1.4% to 9.3% between 1995 and 2007. The corresponding figures for imports were 3% and 11.4% growth (China contributed with 14% of the increase in exports between
6 China’s accession to the WTO implied its signature on some agreements, including:
reduction on tariffs, admission of FDI flows within the telecommunications sector, elimination of subsidies to exports and financial restrictions, etc.

The Argentine Case
DIE − UNAM / CECHIMEX 77
Table 2: The importance of China as a trading partner of Argentina, 1995−2007 (export FOB and import CIF)
Year Share in total exports (%)
Position as ex-port destination
(ranking)
Share in total im-ports (%)
Position as imports sup-
plier (ranking) 1995 1.4 17 3.0 8 1996 2.6 9 2.9 8 1997 3.3 5 3.3 8 1998 2.6 8 3.7 8 1999 2.2 11 3.9 8 2000 3.0 6 4.6 4 2001 4.2 4 5.2 3 2002 4.3 5 3.7 4 2003 8.3 4 5.2 4 2004 7.6 4 6.2 3 2005 7.8 4 7.8 3 2006 7.5 4 9.6 3 2007 9.3 2 11.4 3 Source: Author, based on information from INDEC, Argentina
1995 and 2007) is higher than in other Latin American countries.7 It is in fact since 2002 that bilateral trade has really soared: between that year and 2007, exports increased almost five times while imports grew more than 15-fold (see Figure 1 and Tables 3 and 4).
The outlook indicates that China will continue to increase its importance as trade partner of Argentina. First, because the projected increase in urban consumption and industrial demand for agricultural raw materials, the in-creasing sophistication of urban demand, the growing population, and the
7 Between 1995 and 2004 exports to China represented 9.7% of total export growth in
Brazil, 1.7% in Mexico, 2.5% in Venezuela and 2.4% in Colombia. But there are also cases in which China’s significance is even greater than in Argentina, such as Chile with 19% of its export growth in the same period, Costa Rica (34.9%) and Peru (15.9%) (Jenkins / Dussel Peters 2006).
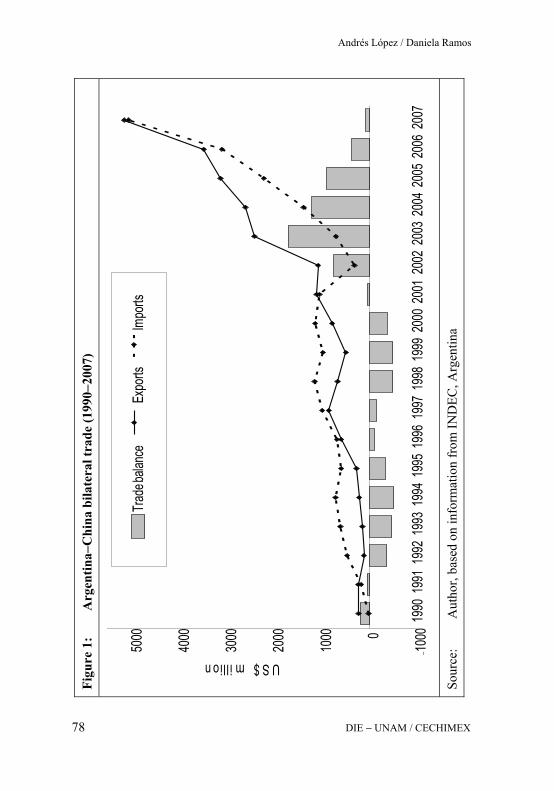
Figu
re 1
: A
rgen
tina−
Chi
na b
ilate
ral t
rade
(199
0−20
07)
Sour
ce:
Aut
hor,
base
d on
info
rmat
ion
from
IND
EC, A
rgen
tina
−10000
1000
2000
3000
4000
5000
1990
1991
1992
1993
1994
1995
1996
1997
1998
1999
2000
2001
2002
2003
2004
2005
2006
2007
US$millionTr
adeb
alanc
eIm
ports
Expo
rts
Andrés López / Daniela Ramos
DIE − UNAM / CECHIMEX 78

The Argentine Case
DIE − UNAM / CECHIMEX 79
Table 3: Annual growth rates of Argentina’s exports and imports by destination (1995−2007) Total China Rest of the world
Exports (%) 8.5 27.3 7.8 Imports (%) 6.9 19.4 6.1 Source: Author, based on data from INDEC, Argentina
Table 4: Argentina-China bilateral trade (1990−2007)
Average annual amount
(in US$ million) Average annual rate
(%) Period Exports Imports Balance of trade Exports Imports
1990−1995 215.1 444.4 -229.4 3.5 80.6 1996−2002 811.6 916.7 -105.1 22.8 13.7 2003−2006 2,932.8 1,870.3 1,062.5 33.8 75.3
2007 5,166.6 5,092.8 73.8 Source: Author, based on data from INDEC, Argentina
improvement in average income, are all indicators that China’s demand will be more important in the future (Cesarín 2007). Second, because Argen-tina’s export structure to China is, as seen below, concentrated in a small number of products that have been going through a very favorable price cycle in recent years and are expected, in spite of the effects of the current crisis, to continue enjoying high international prices over the next years.
Following Jenkins and Dussel Peters (2006), the explanation for the in-crease in Argentine exports, as in other Latin American countries, must be sought mainly in events in China, whose appetite for raw material and natural resources8 has grown sharply since the 1990s (Figure 2). In their study of China’s impact on Latin American and Caribbean Countries
8 China is the fourth importer of raw materials in the world (Cesarín 2007). In 2003,
China had become the first importer of cotton and the fourth importer of petroleum (Blázquez-Lidoy / Rodríguez / Santiso 2006). China is also, at present, the first importer of soybeans and the second importer of soybean oil in the world. In turn, between 2000 and 2004, China’s share in world imports of copper and steel climbed from 11% to 17% and from 7% to 9%, respectively (Ancochea 2007)

Figu
re 2
: C
hina
’s im
port
s of p
rim
ary
good
s, 19
90−2
006
(US$
mill
ion)
Sour
ce:
Nat
iona
l Bur
eau
of S
tatis
tics o
f Chi
na (2
007)
0
2000
4000
6000
8000
1000
0
1200
0
1400
0
1600
0
1800
0
2000
0
1990
1991
1992
1993
1994
1995
1996
1997
1998
1999
2000
2001
2002
2003
2004
2005
2006
Andrés López / Daniela Ramos
DIE − UNAM / CECHIMEX 80

The Argentine Case
DIE − UNAM / CECHIMEX 81
(LAC), Blázquez-Lidoy / Rodríguez / Santiso (2006) show that the weight of natural resource-based manufactures and raw materials in China’s im-port basket increased from 22.7% in 1990 to 29% in 2004. In the same work, the authors indicate that the rise in China’s soybean and petroleum oil imports between 1997 and 2004 were eight and three times greater than the global average increase, respectively. Vanishing cropland and dimin-ishing water supplies are hampering the ability of China to feed itself, and the increasing US use of farmland for biofuel production is pushing China to search for more of its agricultural staples in South America (Interna-tional Herald Tribune, April 5th, 2007). For better understanding, we have divided the analysis of trade with China into three different stages: 1990−1995, 1996−2002 and 2003 to the pre-sent. During the first period, average exports and imports were of US$ 215 million and US$ 444 million respectively, with a sharp increase in imports in 1992, explained, to a great extent, by the establishment of a new eco-nomic program in Argentina (the Convertibility Plan); the adoption of a trade liberalization program and an exchange rate regime which favored import flows as a result of the appreciation of the national currency. In that year, the trade balance, which had been positive in Argentina in the past, reversed dramatically. During the second period (1996−2002), exports to China increased mark-edly and imports continued to grow at a lower annual rate, which allowed the country to obtain a surplus as of 2001. As shown in Table 2, China overtook many countries as an export destination while its position as an import supplier climbed from 8th to 4th place in the ranking. The third stage starts in 2003, when exports to China more than doubled over the previous year. As seen below, this increase is almost entirely explained by the growth of exports of soybean and its sub-products. On the other hand, imports continued to grow at a very high average rate, in part due to the economic recovery that began after the Argentinean crisis of 2001−2002.9 The growth in exports was accompanied by an increase in the number of companies exporting to China since 2001 (Table 5). In turn, average
9 Between 2003 and 2008, Argentina’s Gross Domestic Product (GDP) grew at an aver-
age annual rate of 8.46% (around 50% accumulated); GDP per capita increased 43%; exports and imports rose 136% and 314% at current prices (but 40% and 204% at con-stant prices), respectively; monetary reserves climbed from US$ 14.100 to 46.400 mil-lion, and unemployment fell from 17% to 8%.

Andrés López / Daniela Ramos
DIE − UNAM / CECHIMEX 82
Table 5: Number of companies exporting to China (1998−2006)
Year Exporting companies Average exports / com-pany (US$ million)
1998 240 2.8
1999 220 2.3
2000 213 3.7
2001 248 4.5
2002 347 3.2
2003 333 7.3
2004 438 6.0
2005 470 6.7
2006 556 6.3
Source: Author, based on CEP and INDEC
exports by company grew significantly, from US$ 2.8 million in 1998 to US$ 4.5 million in 2001 and US$ 6.7 million in 2005, and they fell again in 2006 to US$ 6.3 million.10
According to information provided by the CEP (2006), 48% of companies exporting to China are large companies, 38% belong to the medium-sized group and 10% are small exporters.11 Nevertheless, there are still very few firms that export to China on a regular basis and the bulk of Chinese ex-ports is concentrated to a limited number of firms – mainly agricultural and agro-industrial ones – as shown in Table 6. In effect, during 2006 the top three exporting companies accounted for 40% of total exports to China while 95% of exports were concentrated in the top 10% of exporting firms.
10 As may be expected given the importance of primary products among exports to China,
average exports to that country by company are much greater than those corresponding to Argentina’s total exports (US$ 2.7 million in 2005) (Gatto 2007).
11 According to the methodology of the CEP (2006), SME exporters to China were firms with average exports of US$ 10,000 to US$ 100,000 during the period 2003−05. Me-dium-sized exporters were firms with exports of US$ 100,001 to US$ 3 million and big exporters were enterprises with exports above US$ 3 million.
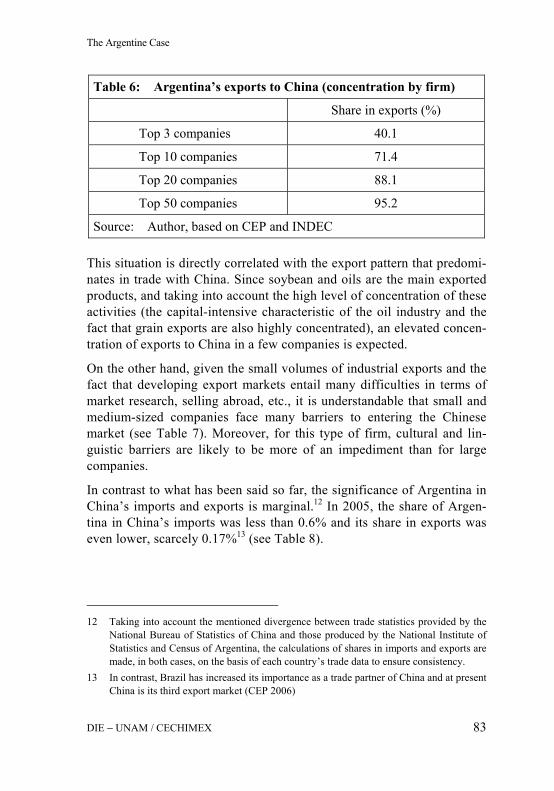
The Argentine Case
DIE − UNAM / CECHIMEX 83
Table 6: Argentina’s exports to China (concentration by firm)
Share in exports (%)
Top 3 companies 40.1
Top 10 companies 71.4
Top 20 companies 88.1
Top 50 companies 95.2
Source: Author, based on CEP and INDEC
This situation is directly correlated with the export pattern that predomi-nates in trade with China. Since soybean and oils are the main exported products, and taking into account the high level of concentration of these activities (the capital-intensive characteristic of the oil industry and the fact that grain exports are also highly concentrated), an elevated concen-tration of exports to China in a few companies is expected.
On the other hand, given the small volumes of industrial exports and the fact that developing export markets entail many difficulties in terms of market research, selling abroad, etc., it is understandable that small and medium-sized companies face many barriers to entering the Chinese market (see Table 7). Moreover, for this type of firm, cultural and lin-guistic barriers are likely to be more of an impediment than for large companies.
In contrast to what has been said so far, the significance of Argentina in China’s imports and exports is marginal.12 In 2005, the share of Argen-tina in China’s imports was less than 0.6% and its share in exports was even lower, scarcely 0.17%13 (see Table 8).
12 Taking into account the mentioned divergence between trade statistics provided by the
National Bureau of Statistics of China and those produced by the National Institute of Statistics and Census of Argentina, the calculations of shares in imports and exports are made, in both cases, on the basis of each country’s trade data to ensure consistency.
13 In contrast, Brazil has increased its importance as a trade partner of China and at present China is its third export market (CEP 2006)
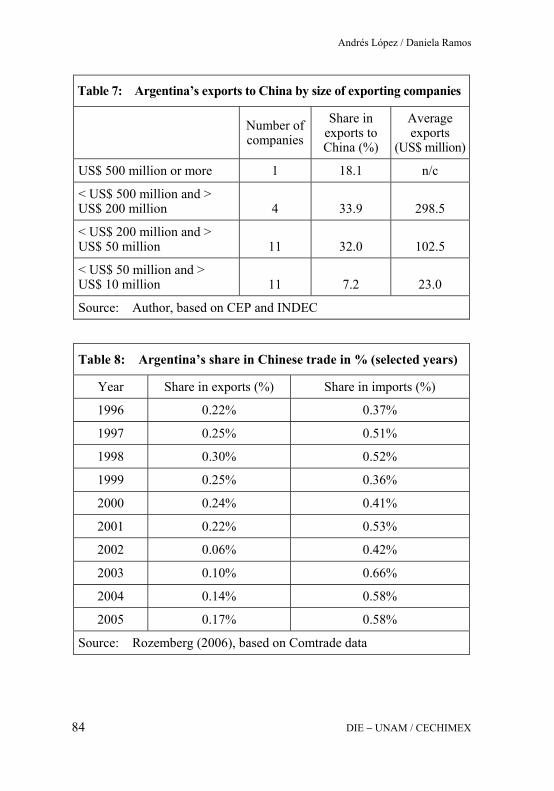
Andrés López / Daniela Ramos
DIE − UNAM / CECHIMEX 84
Table 7: Argentina’s exports to China by size of exporting companies
Number of companies
Share in exports to China (%)
Average exports
(US$ million)
US$ 500 million or more 1 18.1 n/c
< US$ 500 million and > US$ 200 million 4 33.9 298.5
< US$ 200 million and > US$ 50 million 11 32.0 102.5
< US$ 50 million and > US$ 10 million 11 7.2 23.0
Source: Author, based on CEP and INDEC
Table 8: Argentina’s share in Chinese trade in % (selected years)
Year Share in exports (%) Share in imports (%)
1996 0.22% 0.37%
1997 0.25% 0.51%
1998 0.30% 0.52%
1999 0.25% 0.36%
2000 0.24% 0.41%
2001 0.22% 0.53%
2002 0.06% 0.42%
2003 0.10% 0.66%
2004 0.14% 0.58%
2005 0.17% 0.58%
Source: Rozemberg (2006), based on Comtrade data
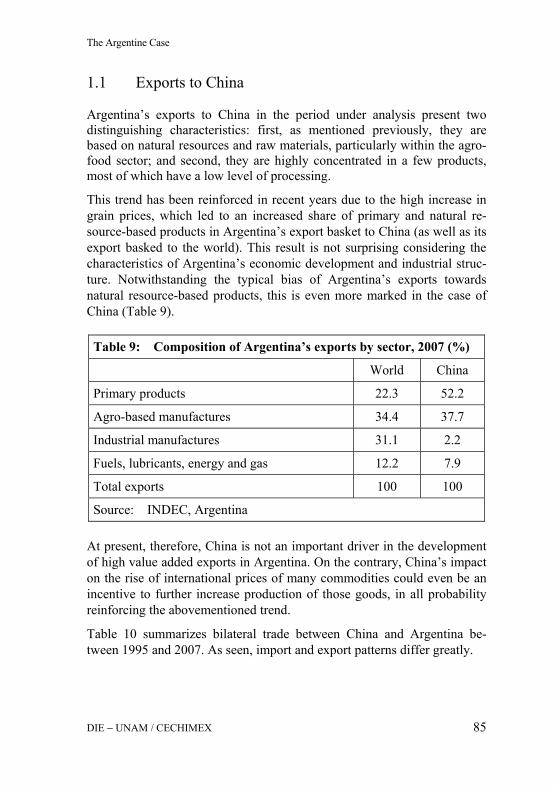
The Argentine Case
DIE − UNAM / CECHIMEX 85
1.1 Exports to China
Argentina’s exports to China in the period under analysis present two distinguishing characteristics: first, as mentioned previously, they are based on natural resources and raw materials, particularly within the agro-food sector; and second, they are highly concentrated in a few products, most of which have a low level of processing.
This trend has been reinforced in recent years due to the high increase in grain prices, which led to an increased share of primary and natural re-source-based products in Argentina’s export basket to China (as well as its export basked to the world). This result is not surprising considering the characteristics of Argentina’s economic development and industrial struc-ture. Notwithstanding the typical bias of Argentina’s exports towards natural resource-based products, this is even more marked in the case of China (Table 9).
Table 9: Composition of Argentina’s exports by sector, 2007 (%)
World China
Primary products 22.3 52.2
Agro-based manufactures 34.4 37.7
Industrial manufactures 31.1 2.2
Fuels, lubricants, energy and gas 12.2 7.9
Total exports 100 100
Source: INDEC, Argentina
At present, therefore, China is not an important driver in the development of high value added exports in Argentina. On the contrary, China’s impact on the rise of international prices of many commodities could even be an incentive to further increase production of those goods, in all probability reinforcing the abovementioned trend.
Table 10 summarizes bilateral trade between China and Argentina be-tween 1995 and 2007. As seen, import and export patterns differ greatly.

Andrés López / Daniela Ramos
DIE − UNAM / CECHIMEX 86
Tab
le 1
0:
Bila
tera
l tra
de b
y ca
tego
ry (S
ITC
, 1 d
igit)
, 199
5−20
07 (i
n U
S$ m
illio
n: F
OB
val
ues)
D
escr
iptio
n 19
95
2005
20
06
2007
Ex
- po
rts
Im-
ports
Ba
l- an
ce
Ex-
ports
Im
- po
rts
Bal-
ance
Ex
- po
rts
Im-
ports
Ba
l- an
ce
Ex-
ports
Im
- po
rts
Bal-
ance
Food
and
live
ani
mal
s 10
3 3
100
56
8 48
96
13
82
90
24
66
B
ever
ages
and
toba
cco
0 1
-1
3 0
3 2
1 2
17
0 17
In
edib
le cr
ude
mat
eria
ls,
exce
pt fu
els
87
4 83
1,
879
11
1,86
9 15
35
11
1,52
4 2,
781
17
2,76
4
Min
eral
fuel
s, lu
bric
ants
and
rela
ted
mat
eria
ls 2
0 2
227
24
203
907
2 90
5 42
3 13
41
0
Ani
mal
and
veg
etab
le
oils
, fat
s and
wax
es
27
0 27
72
9 0
729
661
0 66
1 1,
566
0 1,
566
Che
mic
als a
nd re
late
d pr
oduc
ts n
.e.s.
* 5
53
-48
50
295
-245
54
44
2 -3
88
61
831
-769
Man
ufac
ture
d go
ods
clas
sifie
d ch
iefly
by
mat
eria
ls
53
58
-5
185
244
-59
220
308
-88
198
544
-346
Mac
hine
ry a
nd tr
ans-
port
equi
pmen
t 7
186
-178
13
1,
172
-1,1
59
9 1,
854
-1,8
45
11
2,92
2 -2
,910
Mis
cella
neou
s man
u-fa
ctur
ed a
rticl
es
0 24
1 -2
40
12
314
-302
11
49
2 -4
82
19
743
-724
Tota
l 28
6 54
5 -2
59
3,15
42,
068
1,08
73,
494
3,12
237
2 5,
166
5,09
3 73
*
not e
lsew
here
spec
ified
So
urce
: A
utho
r, ba
sed
on IN
DEC
, Arg
entin
a

The Argentine Case
DIE − UNAM / CECHIMEX 87
Until 1995, the main export products to China were maize (15% of total exports) and wheat. Other important lines of export products corresponded to wool tops and non-carded cotton (23% of total exports to China). Soy-beans and crude soybean oil contributed, in that year, to 19% of total ex-ports. However, with the exception of wool tops,14 the importance of China as a buyer was still relatively low, e.g. China’s share in total soy-bean and crude soybean oil exports was around 4.1 and 2.6% respectively. During 1996 exports to China doubled. Two thirds of this increase was explained by the growth in the export of oilcake, pellets and other solid soybean residues (that increased from US$ 10.1 million to US$ 224 mil-lion) and the remaining 33% by the growth of crude soybean oil exports (+ US$ 107 million). From then until 1999, crude oil and soybean pellets became the main export products to China. The situation reversed in that year, and soybeans reached first place in the export basket to China, a position that they have sustained until now. As seen below, this shift in the trade pattern resulted from the development of the Chinese vegetable oil industry. The consequence was a reduction in the value-added of Argentina’s exports to China, at least within this sector. Soybeans have contributed strongly to the growth of Argentina’s exports to China throughout the period 1995−2007. During those years, total ex-ports to China rose from US$ 285 million to US$ 5.16 billion (FOB). As seen in Table 11, 53% of the increase in exports was explained by soy-beans while another 30% corresponded to crude soybean oil. In addition, as seen in Table 12, the growth of Argentina’s soybean ex-ports was almost entirely explained by the increase in exports to China. As a matter of fact, while soybean exports to the rest of the world rose only slightly between 1995 and 2007, exports to China increased by over US$ 2.6 billion. As a result, China accounts for almost 77% of Argentina’s soybean exports at present, against a 19% share in 1995. To explain why these changes took place we must understand what hap-pened to the Chinese oilseed processing industry in recent years. In the late 1990s the Chinese authorities decided to foster the development of a domestic soybean crushing industry aiming at self-sufficiency in this key input for animal feeding. To reach this objective, a number of measures were implemented to stimulate domestic production and increase the com-petitiveness of the Chinese crushing industry.
14 China also had an important share in frozen fish, rolls of iron and alloy and tankers,
among other products.

Andrés López / Daniela Ramos
DIE − UNAM / CECHIMEX 88
Table 11: Argentina’s exports to China by product (contribution to the increase of exports to China), 1995−2007
SITC 5 digits
Description USD million
% % Accu-mulated
2222 Soybeans 2,640.6 53.2 53.2
42111 Soybean crude oil, whether or not degummed
1,496.6 30.1 83.3
3330 Petroleum oils and oils obtained from bituminous minerals, crude
421.0 8.5 91.8
61142 Other bovine leather and equine leather, without hair on parchment-dressed or prepared after tanning
136.7 2.8 94.6
2831 Copper ores and concentrates 56.4 1.1 95.7
42151 Crude oil 34.6 0.7 96.4
61141 Other bovine leather and equine leather, without hair on tanned or retanned but not further prepared, whether or not split
30.8 0.6 97.0
01235 Poultry cuts and offal (other than liver), frozen
25.5 0.5 97.5
5799 Waste, parings and scrap, of plas-tics other
23.6 0.5 98.0
03639 Other molluscs and aquatic inverte-brates, frozen, dried, salted or in brine, including flours, meals and pellets of aquatic invertebrates other than crustaceans, fit for human consumption
20.6 0.4 98.4
8823 Photographic film in rolls, sensi-tized, unexposed, of any material other than paper, paperboard or textiles; instant print film in rolls, sensitized, unexposed
16.9 0.3 98.8
1212 Tobacco, wholly or partly stemmed/stripped
14.1 0.3 99.0
Total increment 4,964.9
Source: Author, based on INDEC

The Argentine Case
DIE − UNAM / CECHIMEX 89
Table 12: Increase in soybean exports by destination (1995–2007) World China Rest of the world
Var. in US$ million 2,899 2,641 259 % change 641 12,140 150 Source: Author, based on data from INDEC
As a result of these incentive measures, there was a process of strong in-vestment in modern plants. Most of these plants are located in the coastal region (near the harbors) to guarantee easy access to the raw material (around 64% of soybean processed in China comes from abroad).15 Soybean crushing in China grew from an average of 6.1 million tons in 1989−1990 to 38.05 million tons in 2007−2008 (data from the US De-partment of Agriculture). In 2004−2005 China had already become the second flour and oil producer in the world behind the US. Table 13 sum-marizes the main changes in the Chinese oil industry during the last dec-ade. Crushing capacity and flour and oil production have increased notably during this period. As a result, only a slight growth has been recorded in oil imports and flour imports have fallen, while soybean imports have grown rapidly in order to meet the demand of the processing industry. It is important to explain why flour imports decreased while those of oil kept growing although at a lower pace: the fact is that soybean oil production faces limitations due to some technical constraints in the production pro-cess.16 Since the growth rate of Chinese soybean oil production is lower than that of oil consumption, the gap must be filled by imports (see Table 14 where the changes in the share of imports within Chinese consumption may be observed for the different products of the soybean chain). This also suggests that in the near future China will keep importing soy-bean oil to supply the growing domestic demand. These changes have naturally had an impact on exports from Argentina to China. Soybean exports have grown significantly since 1999 (from US$ 90 million in 1999 to US$ 1.42 billion in 2006). At the same time, exports
15 As mentioned above, China is the first soybean importer in the world. In 2007−2008 its
share in world soybean imports was 45.17%. 16 Nearly 18% of the soybean is oil, another 7% corresponds to the shell (which is used for
fuel production) and the rest is the so called residue – flours and pellets –. This means that only a small part of the crushing process results in oil production.

Andrés López / Daniela Ramos
DIE − UNAM / CECHIMEX 90
Table 13: Changes in the Chinese soybean value chain, 1995−2008 (in thousand metric tons)
1995−1996 2007−2008 Accumulated variation (%)
Production Soybeans 13,500 14,300 5.93 Soybean flour 6,051 30,170 398.60 Soybean oil 1,150 6,800 491.30 Crushing capacity 7,470 38,050 409.37 Imports Soybeans 795 34,000 4176.73
Soybean flour 1,179 300 -74.55 Soybean oil 1,445 3,000 107.61 Domestic consumption Soybeans 14,073 48,250 242.86 Soybean flour 7,123 29,820 318.64 Soybean oil 2,575 9,790 280.19 Source: Author, based on the US Department of Agriculture
Table 14: Share of imports in Chinese domestic consumption
(1995−2008) 1995/1996 2000/2001 2006/2007 2007/2008
Soybeans 5.6 49.6 64.0 70.5 Soybean flour 16.6 0.7 1.2 1.0 Soybean oil 56.1 10.0 20.8 30.6 Source: Author, on the basis of the US Department of Agriculture
of flour and pellets – which were of some significance between 1996 and 1998 – have almost vanished. Soybean oil exports to China increased from US$ 25 million in 1995 to US$ 630 million in 2006. In turn, Argentina’s share in China’s soybean imports is 20% (US$ 1147 million), ranking third behind Brazil (US$ 3.02 billion) and the US (US$ 2.7 billion) (COMTRADE 2006). Soybeans are the only item in which Argentina has a significant share in Chinese imports.

The Argentine Case
DIE − UNAM / CECHIMEX 91
Apart from soybeans, Argentina exports crude petroleum oil, copper ores, dressed leather parchment, iron or steel tubing and drill pipes for oil or gas, bovine leather with different levels of processing, liquefied butane gas, semi-bleached or bleached wood pulp, wool tops and crude sunflower oil, among its main products. These product lines accounted for almost 95% of total exports to China in 2005. In conclusion, it is evident that the export basket to China has a very low degree of diversification. In fact, this situation has got worse over time: the top five products accounted for 90% of total exports to China in 2005, whereas in 1995 this proportion was 63% (Figure 3). It is also important to highlight the role played by China in the exports of some key products. While the average share of China in Argentina’s exports during 2005 was 7.8%, China accounts for more than 70% of the total export of products such as soybeans (75%), copper waste and plastic scrap (which together account for more than half of exports to China). China’s share is also high in the export of soybean oil, some types of leather and fish derivatives unfit for human consumption (see Table 15). In recent years, and after diplomatic negotiations, Argentina obtained the opening of four important export markets: fresh and thermo-processed meat (eleven companies were authorized to export meat to China; but the appearance of foot-and-mouth disease in February 2006 closed the Chi-nese market again17), poultry (since 2005, 16 firms are authorized), citrus fruits (since February 2005) and tobacco (since October 2006, though there are no exports yet). This could bring new opportunities to diversify the export structure, although it will take many years to gain a place in the Chinese market. Furthermore, as can be seen in the above list, exports only include resource-based products. Summing up, we may conclude that up until now Argentina is far from having taken advantage of the vast opportunities that have opened up in the Chinese domestic market to export industrial products; and instead, shows an export pattern which is increasingly based on primary and natu-ral resource-based products. These trends are not exclusive to Argentina, and in fact the same trends are observed in other Latin American countries.
17 In March 2007, Argentina was declared free of foot-and-mouth disease with vaccination
by the Chinese Sanitary authority.
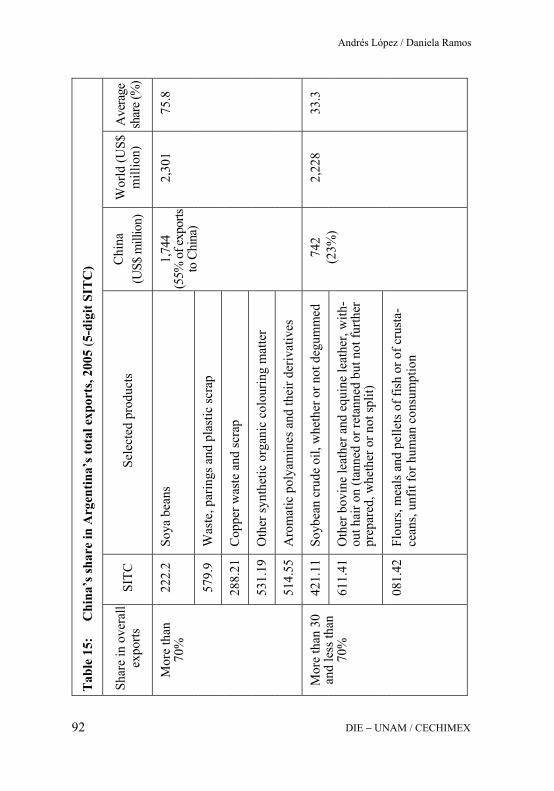
Tab
le 1
5:
Chi
na’s
shar
e in
Arg
entin
a’s t
otal
exp
orts
, 200
5 (5
-dig
it SI
TC
)
Shar
e in
ove
rall
expo
rts
SITC
Se
lect
ed p
rodu
cts
Chi
na
(US$
mill
ion)
W
orld
(US$
m
illio
n)
Ave
rage
sh
are (
%)
222.
2 So
ya b
eans
579.
9 W
aste
, par
ings
and
pla
stic
scra
p
288.
21
Cop
per w
aste
and
scra
p
531.
19
Oth
er sy
nthe
tic o
rgan
ic c
olou
ring
mat
ter
Mor
e th
an
70%
514.
55
Aro
mat
ic p
olya
min
es a
nd th
eir d
eriv
ativ
es
1,74
4
(55%
of e
x por
ts to
Chi
na)
2,30
1 75
.8
421.
11
Soyb
ean
crud
e oi
l, w
heth
er o
r not
deg
umm
ed
611.
41
Oth
er b
ovin
e le
athe
r and
equ
ine
leat
her,
with
-ou
t hai
r on
(tann
ed o
r ret
anne
d bu
t not
furth
er
prep
ared
, whe
ther
or n
ot sp
lit)
Mor
e th
an 3
0 an
d le
ss th
an
70%
081.
42
Flou
rs, m
eals
and
pel
lets
of f
ish
or o
f cru
sta-
cean
s, un
fit fo
r hum
an c
onsu
mpt
ion
742
(23%
) 2,
228
33.3
Andrés López / Daniela Ramos
DIE − UNAM / CECHIMEX 92
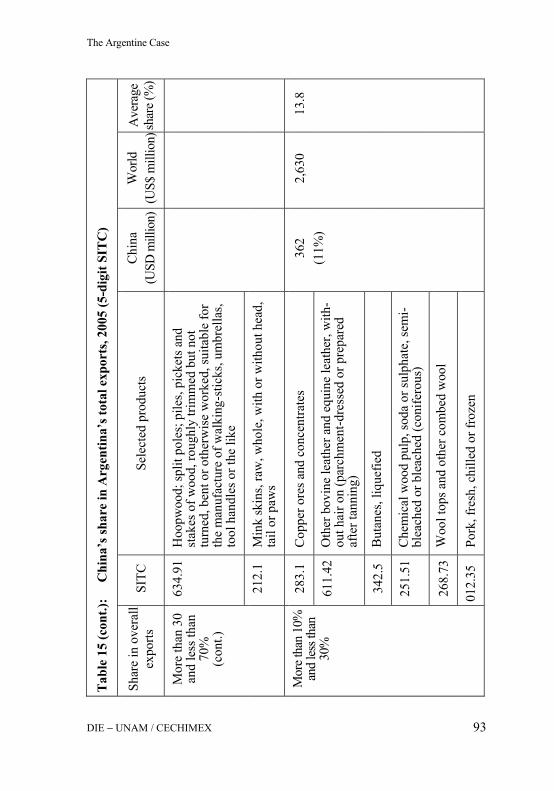
Tab
le 1
5 (c
ont.)
:
Chi
na’s
shar
e in
Arg
entin
a’s t
otal
exp
orts
, 200
5 (5
-dig
it SI
TC
)
Shar
e in
ove
rall
expo
rts
SITC
Se
lect
ed p
rodu
cts
Chi
na
(USD
mill
ion)
W
orld
(U
S$ m
illio
n) A
vera
ge
shar
e (%
)
634.
91
Hoo
pwoo
d; sp
lit p
oles
; pile
s, pi
cket
s and
st
akes
of w
ood,
roug
hly
trim
med
but
not
tu
rned
, ben
t or o
ther
wis
e w
orke
d, su
itabl
e fo
r th
e m
anuf
actu
re o
f wal
king
-stic
ks, u
mbr
ella
s, to
ol h
andl
es o
r the
like
Mor
e th
an 3
0 an
d le
ss th
an
70%
(c
ont.)
212.
1 M
ink
skin
s, ra
w, w
hole
, with
or w
ithou
t hea
d,
tail
or p
aws
283.
1 C
oppe
r ore
s and
con
cent
rate
s
611.
42
Oth
er b
ovin
e le
athe
r and
equ
ine
leat
her,
with
-ou
t hai
r on
(par
chm
ent-d
ress
ed o
r pre
pare
d af
ter t
anni
ng)
342.
5 B
utan
es, l
ique
fied
251.
51
Che
mic
al w
ood
pulp
, sod
a or
sulp
hate
, sem
i-bl
each
ed o
r ble
ache
d (c
onife
rous
)
268.
73
Woo
l top
s and
oth
er c
ombe
d w
ool
Mor
e tha
n 10
%
and
less
than
30
%
012.
35
Pork
, fre
sh, c
hille
d or
froz
en
362
(11%
) 2,
630
13.8
The Argentine Case
DIE − UNAM / CECHIMEX 93
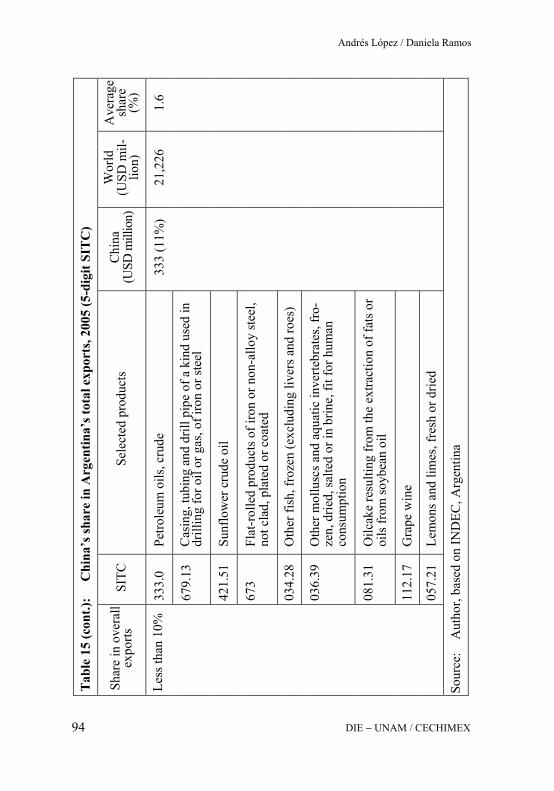
Tab
le 1
5 (c
ont.)
:
Chi
na’s
shar
e in
Arg
entin
a’s t
otal
exp
orts
, 200
5 (5
-dig
it SI
TC
)
Shar
e in
ove
rall
expo
rts
SITC
Se
lect
ed p
rodu
cts
Chi
na
(USD
mill
ion)
W
orld
(U
SD m
il-lio
n)
Ave
rage
sh
are
(%)
333.
0 Pe
trole
um o
ils, c
rude
679.
13
Cas
ing,
tubi
ng a
nd d
rill p
ipe
of a
kin
d us
ed in
dr
illin
g fo
r oil
or g
as, o
f iro
n or
stee
l
421.
51
Sunf
low
er c
rude
oil
673
Flat
-rol
led
prod
ucts
of i
ron
or n
on-a
lloy
stee
l, no
t cla
d, p
late
d or
coa
ted
034.
28
Oth
er fi
sh, f
roze
n (e
xclu
ding
live
rs a
nd ro
es)
036.
39
Oth
er m
ollu
scs a
nd a
quat
ic in
verte
brat
es, f
ro-
zen,
drie
d, sa
lted
or in
brin
e, fi
t for
hum
an
cons
umpt
ion
081.
31
Oilc
ake
resu
lting
from
the
extra
ctio
n of
fats
or
oils
from
soyb
ean
oil
112.
17
Gra
pe w
ine
Less
than
10%
057.
21
Lem
ons a
nd li
mes
, fre
sh o
r drie
d
333
(11%
) 21
,226
1.
6
Sour
ce:
Aut
hor,
base
d on
IND
EC, A
rgen
tina
Andrés López / Daniela Ramos
DIE − UNAM / CECHIMEX 94

Figu
re 3
: D
iver
sific
atio
n of
Arg
entin
a’s e
xpor
t to
Chi
na: S
hare
of m
ain
prod
ucts
(SIT
C5-
digi
t) in
ex
port
s (%
)
Sour
ce:
Aut
hor,
base
d on
IND
EC, A
rgen
tina
62.8
85.9
87.5
94.9
89.1
93.6
Top
5 p
rodu
cts
Top
10 p
rodu
cts
1995
2000
2005
The Argentine Case
DIE − UNAM / CECHIMEX 95
Andrés López / Daniela Ramos
DIE − UNAM / CECHIMEX 96
As Blázquez-Lidoy / Rodríguez / Santiso (2006) point out, given the trade pattern of Latin American countries with China, the possibility (in the short term) of increasing their exports is confined to a narrow range of products. At the same time, an increase in trade with China would require greater specialization in these (low value-added) goods instead of advanc-ing along the value chain. Therefore, the challenge is seemingly that of finding ways to penetrate in other market segments, possibly on the basis of product differentiation in natural resource-based goods, since it is in this area where China identifies Argentina as a competitive producer. So far though, this has not occurred, due, among other reasons, to the fact that these differentiated or niche goods are often produced by small and me-dium-sized firms in Argentina, which are precisely those that find more barriers (cultural, linguistic, financial, regulatory, etc.) to competing in the Chinese domestic market.
1.2 Imports from China There is a popular belief in Argentina that China is mainly an exporter of (cheap and low quality) consumption goods. This reputation – or myth – seems to be more a consequence of the past than a reflection of the present situation. In effect, China’s exports to Argentina are at present composed not only of consumer goods, as may have been the case in the past, but also of machin-ery and capital goods, with an increasing level of quality (see Table 16).18
18 The question about the quality of China’s manufactures is at the centre of debate today.
As Hexter and Woetzel (2007) mention, “today China is open for business, and compe-tition from both multinationals and local companies is increasing. Strategies based on creating and sustaining privileged access look more and more outdated. (…) In other words, China has turned a corner, from an emerging market, where local context drives most strategic and operating decisions, to a maturing one, with world-class execution a cornerstone for success”. The expansion of multinationals is changing the morphology of Chinese industry and companies need to ensure that their organizations develop, pro-duce and sell goods as effectively and efficiently as possible. For instance, Alcoa intro-duced its Alcoa Business System at its Shanghai manufacturing plant in 1998. Modeled on Toyota’s integrated lean operations, the system helped boost the company to a global leadership position in its sector during the 1990s. Within six years of beginning the transformation of the Shanghai plant, Alcoa shortened lead times by 30 to 50 percent, doubled sales volumes (for domestic sales and exports alike), and greatly reduced in-ventories. GE has introduced its Six Sigma quality control standards at its lighting divi-sion’s plants there. Citigroup and HSBC have extended their leadership-training and de-velopment processes and systems to China. Cleveland-based Preformed Line Products (PLP), a telecommunications hardware supplier, is another company that has introduced world-class lean techniques in its manufacturing operations in China.
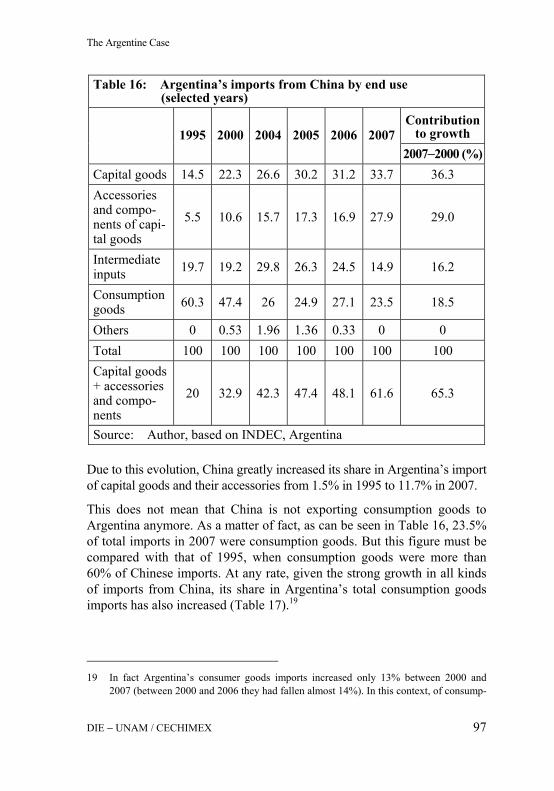
The Argentine Case
DIE − UNAM / CECHIMEX 97
Table 16: Argentina’s imports from China by end use (selected years)
Contribution to growth
1995 2000 2004 2005 2006 2007
2007−2000 (%)Capital goods 14.5 22.3 26.6 30.2 31.2 33.7 36.3 Accessories and compo-nents of capi-tal goods
5.5 10.6 15.7 17.3 16.9 27.9 29.0
Intermediate inputs 19.7 19.2 29.8 26.3 24.5 14.9 16.2
Consumption goods 60.3 47.4 26 24.9 27.1 23.5 18.5
Others 0 0.53 1.96 1.36 0.33 0 0 Total 100 100 100 100 100 100 100 Capital goods + accessories and compo-nents
20 32.9 42.3 47.4 48.1 61.6 65.3
Source: Author, based on INDEC, Argentina
Due to this evolution, China greatly increased its share in Argentina’s import of capital goods and their accessories from 1.5% in 1995 to 11.7% in 2007.
This does not mean that China is not exporting consumption goods to Argentina anymore. As a matter of fact, as can be seen in Table 16, 23.5% of total imports in 2007 were consumption goods. But this figure must be compared with that of 1995, when consumption goods were more than 60% of Chinese imports. At any rate, given the strong growth in all kinds of imports from China, its share in Argentina’s total consumption goods imports has also increased (Table 17).19
19 In fact Argentina’s consumer goods imports increased only 13% between 2000 and
2007 (between 2000 and 2006 they had fallen almost 14%). In this context, of consump-
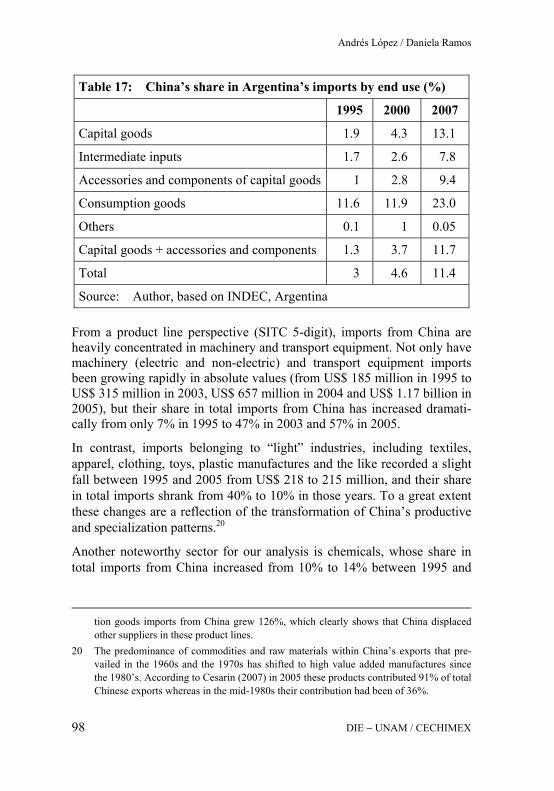
Andrés López / Daniela Ramos
DIE − UNAM / CECHIMEX 98
Table 17: China’s share in Argentina’s imports by end use (%)
1995 2000 2007
Capital goods 1.9 4.3 13.1
Intermediate inputs 1.7 2.6 7.8
Accessories and components of capital goods 1 2.8 9.4
Consumption goods 11.6 11.9 23.0
Others 0.1 1 0.05
Capital goods + accessories and components 1.3 3.7 11.7
Total 3 4.6 11.4
Source: Author, based on INDEC, Argentina
From a product line perspective (SITC 5-digit), imports from China are heavily concentrated in machinery and transport equipment. Not only have machinery (electric and non-electric) and transport equipment imports been growing rapidly in absolute values (from US$ 185 million in 1995 to US$ 315 million in 2003, US$ 657 million in 2004 and US$ 1.17 billion in 2005), but their share in total imports from China has increased dramati-cally from only 7% in 1995 to 47% in 2003 and 57% in 2005.
In contrast, imports belonging to “light” industries, including textiles, apparel, clothing, toys, plastic manufactures and the like recorded a slight fall between 1995 and 2005 from US$ 218 to 215 million, and their share in total imports shrank from 40% to 10% in those years. To a great extent these changes are a reflection of the transformation of China’s productive and specialization patterns.20
Another noteworthy sector for our analysis is chemicals, whose share in total imports from China increased from 10% to 14% between 1995 and
tion goods imports from China grew 126%, which clearly shows that China displaced other suppliers in these product lines.
20 The predominance of commodities and raw materials within China’s exports that pre-vailed in the 1960s and the 1970s has shifted to high value added manufactures since the 1980’s. According to Cesarín (2007) in 2005 these products contributed 91% of total Chinese exports whereas in the mid-1980s their contribution had been of 36%.

The Argentine Case
DIE − UNAM / CECHIMEX 99
2005 after having reached 25% in 2003. Additionally, the contribution of metals and their manufactures to total imports rose from less than 4% to nearly 8% between 1995 and 2005.
If we analyze the composition of imports within the leading import sector – machinery and transport equipment – in 2005, 28% of these corre-sponded to computers and their parts and accessories, while 25% of these imports were associated with consumer electronics (TV, audio, radios) and telecommunications equipment. Other groups of products with high import levels are electric and non-electric machinery (20% and 13% of total ma-chinery and transport equipment imports respectively).
Turning now to an analysis by product line, we observe that in 2005 the first ten items contributed with more than 30% of total imports from China, while 20 product lines were responsible for almost 42% of that total. Fourteen of those 20 product lines belonged to machinery and trans-port equipment. Among the products with higher imports are parts and accessories for computers (4.5% of total imports from China), other or-ganic-inorganic compounds – mostly sodium glyphosate, an herbicide used with genetically modified soy – (4.4%), ferro-alloys (4.1%), input or output units for computers (3.9%) and video recording apparatus (2.8%). This is a very different structure than that prevailing in 1995, when the first import items were toys, radio receivers and footwear.
If we compare the years 2004−2005 with 1994−1995, an increase is ob-served from less than US$ 590 million to almost US$ 1.7 billion, on a yearly average. Almost 30% of this approximate US$ 1.1 billion increase is explained by the first five items mentioned above, which were those with the highest absolute growth levels. In contrast, the items with the highest absolute decrease were toys representing animals or non-human creatures (US$ 8.8 million), toys n.e.s. (US$ 7.6 million), cotton shirts (US$ 7.2 million), dolls (US$ 6.8 million) and shirts not made of cotton (US$ 6.3 million).
As we have mentioned, the share of China as a supplier to Argentina has been on a rise in recent years. Table 2 showed that China is cur-rently the third import supplier, while it ranked eighth in 1995. More-over, between 1995 and 2007 imports from China increased more than 700%, whereas imports from Brazil – the biggest economy in Mercosur

Andrés López / Daniela Ramos
DIE − UNAM / CECHIMEX 100
and the first commercial partner of Argentina – increased only 248% (see Table 18).
Table 18: Evolution of Argentina’s imports from China and Brazil (%)
Variation
2007/1995 (%) Variation
2007/2001 (%) China 737.8 377.6 Hong Kong -55.8 -22.4 China + Hong Kong 649.7 362.0 Brazil 247.9 177.7 Source: Author, based on INDEC
Table 19 shows the main changes that took place in Argentina’s imports between 2001 and 2007 regarding the import origin of the ten products that experienced the largest growth (in absolute terms).
We may conclude that between 2001 and 2007 China increased its market share in almost all of the listed products (remember they are the ten posi-tions which recorded the largest absolute increase in imports between the years under analysis). The other side of the coin of China’s increasing share is the sharp fall of USA and the UE-25 shares in these products.21 Most observers agree that this process of displacement of the traditional suppliers (e.g. USA and UE-25) will continue in the future. In the same vein, Table 20 shows that in some product lines China is one of Argentina’s most important suppliers (radio receivers, toys, baby car-riages, etc.). As mentioned before, during recent years China has displaced other important suppliers to Argentina in a few specific products. As an example, between 2003 and 2006 China replaced Brazil as the first sup-plier in many product lines, including those in which the Mercosur partner previously accounted for more than 50% of imports, e.g. TV sets, laser printers, chemical products, vacuum machines, etc.22 (abeceb.com 2007).
21 Notwithstanding, another study carried out by abeceb.com (2007) shows a slightly
different situation for the period 2003-2005; that is to say, the period immediately after the devaluation of the Peso.
22 Products in which Brazil accounted for less than 50% of Argentina’s imports and have been substituted by China were, amongst others: PET, electronic devices, toys, hard disks, etc.
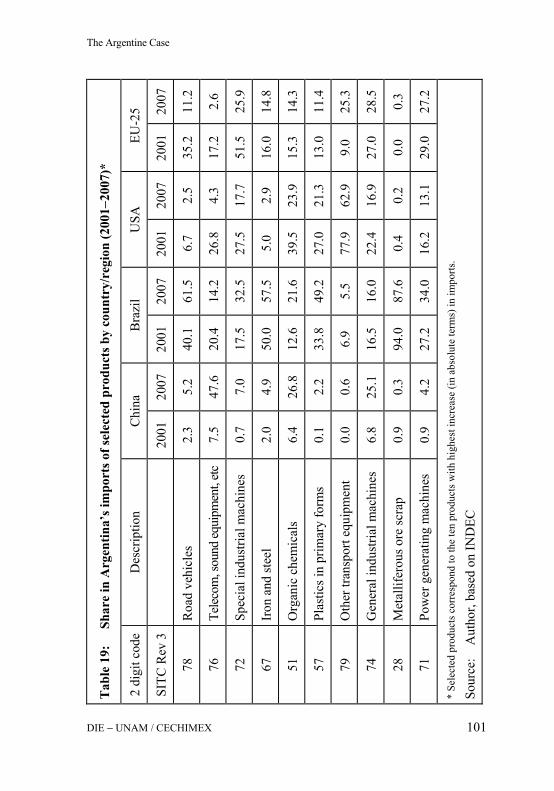
Tab
le 1
9:
Sha
re in
Arg
entin
a’s i
mpo
rts o
f sel
ecte
d pr
oduc
ts b
y co
untr
y/re
gion
(200
1−20
07)*
2 di
git c
ode
Des
crip
tion
Chi
na
Bra
zil
USA
EU
-25
SITC
Rev
3
20
01
2007
20
01
2007
20
01
2007
20
01
2007
78
Roa
d ve
hicl
es
2.3
5.2
40.1
61
.5
6.7
2.5
35.2
11
.2
76
Tele
com
, sou
nd eq
uipm
ent,
etc
7.5
47.6
20
.4
14.2
26
.8
4.3
17.2
2.
6
72
Spec
ial i
ndus
trial
mac
hine
s 0.
7 7.
0 17
.5
32.5
27
.5
17.7
51
.5
25.9
67
Iron
and
stee
l 2.
0 4.
9 50
.0
57.5
5.
0 2.
9 16
.0
14.8
51
Org
anic
che
mic
als
6.4
26.8
12
.6
21.6
39
.5
23.9
15
.3
14.3
57
Plas
tics i
n pr
imar
y fo
rms
0.1
2.2
33.8
49
.2
27.0
21
.3
13.0
11
.4
79
Oth
er tr
ansp
ort e
quip
men
t 0.
0 0.
6 6.
9 5.
5 77
.9
62.9
9.
0 25
.3
74
Gen
eral
indu
stria
l mac
hine
s 6.
8 25
.1
16.5
16
.0
22.4
16
.9
27.0
28
.5
28
Met
allif
erou
s ore
scra
p 0.
9 0.
3 94
.0
87.6
0.
4 0.
2 0.
0 0.
3
71
Pow
er g
ener
atin
g m
achi
nes
0.9
4.2
27.2
34
.0
16.2
13
.1
29.0
27
.2
* Se
lect
ed p
rodu
cts c
orre
spon
d to
the
ten
prod
ucts
with
hig
hest
incr
ease
(in
abso
lute
term
s) in
impo
rts.
Sour
ce:
Aut
hor,
base
d on
IND
EC
The Argentine Case
DIE − UNAM / CECHIMEX 101
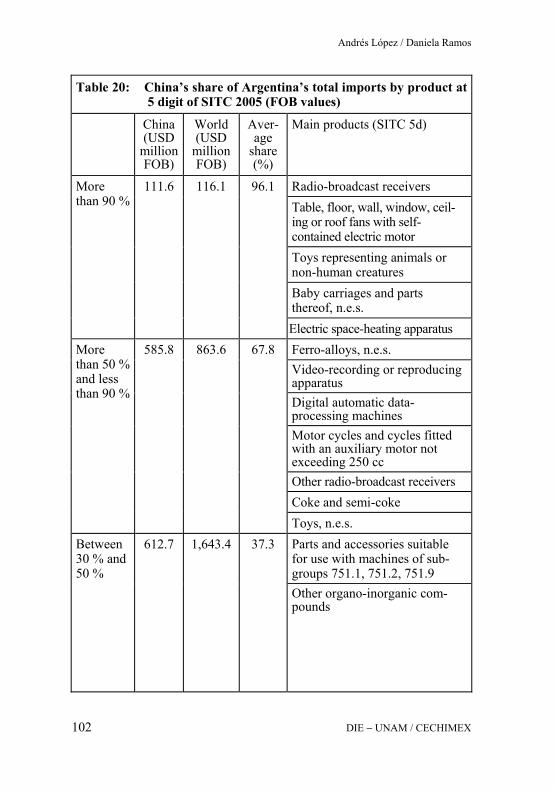
Andrés López / Daniela Ramos
DIE − UNAM / CECHIMEX 102
Table 20: China’s share of Argentina’s total imports by product at 5 digit of SITC 2005 (FOB values)
China(USD
million FOB)
World(USD
million FOB)
Aver-age
share (%)
Main products (SITC 5d)
Radio-broadcast receivers Table, floor, wall, window, ceil-ing or roof fans with self-contained electric motor Toys representing animals or non-human creatures Baby carriages and parts thereof, n.e.s.
More than 90 %
111.6 116.1 96.1
Electric space-heating apparatus Ferro-alloys, n.e.s. Video-recording or reproducing apparatus Digital automatic data-processing machines Motor cycles and cycles fitted with an auxiliary motor not exceeding 250 cc Other radio-broadcast receivers Coke and semi-coke
More than 50 % and less than 90 %
585.8 863.6 67.8
Toys, n.e.s. Parts and accessories suitable for use with machines of sub-groups 751.1, 751.2, 751.9
Between 30 % and 50 %
612.7 1,643.4 37.3
Other organo-inorganic com-pounds

The Argentine Case
DIE − UNAM / CECHIMEX 103
Table 20 (cont.): China’s share of Argentina’s total imports by product at 5 digit of SITC 2005 (FOB values)
China(USD
million FOB)
World(USD
million FOB)
Aver-age
share (%)
Main products (SITC 5d)
Automatic data-processing ma-chines, whether or not presented with the rest of a system and whether or not containing stor-age units in the same housing Storage units, whether or not presented with the rest of a sys-tem Television picture tubes colour Other apparatus for carrier-current line systems
Between 30 % and 50 % (cont.)
612.7 1,643.4 37.3
Telephone sets Less than 30 %*
757.6 24,6789* 3.1 Parts and accessories suitable for use with the apparatus of division 76
Compressors used in refrigerat-ing equipment
Transmission apparatus incorpo-rating reception
Television receivers, colour Data-processing equipment,
n.e.s. Static converters (e.g., rectifiers) Total (FOB) 2,067.6 27,302 7.6
* Includes products not imported from China
Source: Author, based on INDEC, Argentina

Andrés López / Daniela Ramos
DIE − UNAM / CECHIMEX 104
1.3 Argentina’s protectionist measures against China In recent years the expansion of China has posed a threat of potential dam-age to domestic production in some critical sectors that compete with imported products. This situation is repeated in many other Latin Ameri-can countries. In this sense, Facchini et al. (2007) mention that requests for explicit protection have become more and more common among LAC countries and that governments have responded using antidumping and safeguard rules and other instruments (such as quantitative restrictions, technical regulations and ad valorem equivalents of non tariff barriers). In an econometric analysis, these authors found that, on average, tariffs and non tariff barriers tended to be higher for goods that were heavily imported from China to LAC countries.
Worries about China were intensified during 2007, due mainly to two factors. First, the growing share of China in Argentine imports and the continuous reduction of trade surplus with that country. In 2007 exports to China grew a remarkable 48% vis-à-vis 2006, but imports increased by 63%. The trade surplus with China almost disappeared in 2007 and in fact the trade balance turned negative in the first six months of 2008, with a deficit of US$ 536 million (Table 21).
Table 21: Argentina-China bilateral trade, 2004−2008 (US$ million)
2004 2005 2006 2007 2008* Var % 07/06
Var % 06/05
Exports to China 2627.9 3154.3 3508.2 5186.6 2769 47.8 11.2 Imports from China 1401.8 2237.1 3121.9 5092.7 3305 63.1 39.5 Trade balance 1226.0 917.2 386.3 93.9 -536 -75.7 -57.9* First six months Source: INDEC, Argentina
Second, there are also concerns about the bilateral trade pattern. We have mentioned previously that imports from China are almost entirely of manufactured goods, while the opposite occurs with Argentina’s exports. This difference is clearly reflected in the average price of Argentina’s imports and exports to and from China, which could be taken as a proxy for the value-added of trade. As seen in Table 22, the average price per ton

The Argentine Case
DIE − UNAM / CECHIMEX 105
Table 22: Average prices of exports and imports (US$ / Tn)
Exports to China Imports from China 1999 296 3,451 2000 235 2,827 2001 207 3,124 2002 277 1,344 2003 299 2,026 2004 368 2,560 2005 310 3,187 2006 336 3,469 2007 400 3,397
Source: Author, on the basis of INDEC, Argentina
of exports to China is ten times lower than the average price per ton of imports from China.
In this context, it is not surprising to find that many companies and busi-ness chambers in Argentina have denounced China during the last decade-for unfair commercial practice and its potential damage to local produc-tion.23 As seen in Table 23, according to the data provided by the National Commission of International Trade (CNCE) – the agency responsible for decisions on antidumping – an average of 18 antidumping measures were effectively applied to China each year between 1998 and 2005. With 21 cases, China outranked the countries with the greatest number of effective antidumping measures applied in 2007 (the second was Brazil with 10 cases), and occupied second place when measured by the amount of im-ports involved (Brazil being the first with 36.5% of total imports). In 2007, imports from China under antidumping measures reached US$ 137 mil-
23 The application of safeguard measures is pertinent in situations of fair trade, where the
growth of imports could cause serious damage to a domestic industry directly compet-ing with an imported product. Measures are aimed at preventing the damage and provid-ing the national industry sufficient time to adapt its production under the new circum-stances. Competitiveness conditions within the domestic market must be re-established as fast as possible. Safeguards are measures on a specific product, independently of where it comes from, and they must be applied during the period needed to prevent or to repair the damage and to facilitate readjustment of the industry.

Andrés López / Daniela Ramos
DIE − UNAM / CECHIMEX 106
lion; that is to say 2.7% of all imports from China in that year (Figure 4 and Table 23). The weight of China in these statistics reflects not only the impact of its exports on the industrial structure but the lobbying activity of the main Chambers and local companies to prevent the dumping of Chi-nese imports into the domestic market.
Information from 2007 indicates that, among the Chinese products with antidumping measures in force were stainless steel pipes, steel chains, connection terminals, microwave ovens, bicycles, irons, measuring tapes, heaters and cards.
Table 23: Antidumping and safeguard measures adopted by Argentina (available years), FOB values (%)
Year Number of cases of anti-dumping or subsidies adopted
Share of China in total imports investigated (%)
Investigated imports / total im-
ports from China (%)
Imports from
China/Worldimports (%)
China World Number of cases
US$
1998 17 63 27 27 4.9 3.7 1999 17 48 35 12 3.5 3.9 2001 17 98 17 15 4.8 5.2 2002 19 98 19 21 12.1 3.7 2003 n/a n/a n/a n/a 7.2 5.2 2004 19 82 23 31 8.6 6.2 2005 21 81 26 24 4.3 8.2 2006 21 79 27 27.7 3.4 9.1 2007 21 73 29 30 2.7 11.4
Source: Author, based on CNCE and INDEC, Argentina

Figu
re 4
: Im
port
s fr
om C
hina
invo
lved
in a
ntid
umpi
ng m
easu
res
effe
ctiv
ely
adop
ted,
ava
ilabl
e ye
ars
(US$
mill
ion)
Sour
ce:
Aut
hor,
base
d on
CN
CE,
Arg
entin
a
52.8
31.7
47.2
37.2
48.7
137
105.
5
88.8
111.
2
1998
1999
2001
2002
2003
2004
2005
2006
2007
Ava
ilabl
e yea
rs (U
SD m
illio
n)
The Argentine Case
DIE − UNAM / CECHIMEX 107

Andrés López / Daniela Ramos
DIE − UNAM / CECHIMEX 108
Due to intense pressure from the domestic industrial sector, in August 2007 the Argentine government established a set of measures aimed at restricting imports from Asian countries, particularly from China. The new measures intensified customs control with the aim of preventing disloyal practices that could have a negative effect on many industrial sectors. The first measure to be applied was the establishment of “spe-cialized customs”, an instrument that results in a much more careful control of imported products. This measure was applied to a range of products considered as the core threat of China’s imports: plastic prod-ucts, leather products, textile and footwear, metal tools, electric ma-chines, tires, optical and clockwork instruments and toys.
In the case of leather products, the Argentine government established additional restrictions such as the obligation to present documentation authorizing the import of this kind of product from Asian countries (the so called “Note of Diverse Imported Manufactures”). Similar measures have been taken to protect the footwear industry. In this case, the local government stipulated that imports that are specifically ad-dressed to local final consumption must present a “Note of Footwear Parts Imports”
Besides these norms, the official General Customs Agency has intro-duced additional measures against countries from Group 4 (Democratic Korea, Republic of Korea, China, Philippines, Hong Kong, India, In-donesia, Malaysia, Pakistan, Taiwan, Thailand, Singapore and Viet-nam). Extra documentation from these countries will be required when declared prices are below the “official value” established by this Agency.24
The other industrial sector that is strongly protected by these new measures is textiles. The multilateral Agreement on Textiles and Cloth-ing (ATC) concluded in January 2008. This agreement – established by the WTO in 1995 – allowed Argentina and many other countries to use a special safeguard mechanism to protect their local industries during a “transition period” (which lasted more than ten years). On the other hand, on December 31st, 2008 the Textile Chapter of the Working Party Report expired; a document that was signed by China and all the members of WTO in October of 2001, one month prior to the signing
24 Undervaluation of imports is one of the disloyal practices most denounced by local firms.

The Argentine Case
DIE − UNAM / CECHIMEX 109
of China’s Protocol of Accession to the WTO. This chapter established that any member of the WTO may impose special safeguard mecha-nisms in cases of serious damage or threat of damage to domestic tex-tile producers. Given the situation, Argentina has far fewer instruments to protect its industry against Chinese competition. Therefore, the Ar-gentine government decided to include this sector under the protection-ist plan launched in August 2007. With this in view, the government is analyzing the possibility of introducing other measures related to the quality of imported textiles, and the General Customs Agency has been studying the case of United Kingdom, which imposed new sanitary restrictions on Asian textiles in 2007 based on health concerns.25
The adoption of protectionist measures against Chinese competition may be understood especially from the point of view of the (negative) effects of said competition on domestic employment; and, as seen be-fore, Argentina is not the only country adopting protective measures against China. It is clear from all this that China’s emergence is here to stay, and this creates the challenge of how to face the competition from now on. If the only answer is protectionism it will be very difficult to overcome this challenge. Hence, other policies are required beyond these defensive measures, both in restructuring the existing activities that face Chinese competition and in fostering new activities which may already present or develop competitive advantages vis-à-vis China (more on this in the concluding section).
1.4 Effects of trade with China The increasing significance of China as a trade partner of Argentina has different and often contrasting effects. On one hand, sales to China generate significant amounts of money for the State insofar as they are subject to high export taxes. Furthermore, the presence of China as a global economic power has contributed to some extent to the improve-ment in the terms of trade for many developing countries, including Argentina. On the other hand, the increasing number of manufactured
25 In this regard, it may also be mentioned that as was the case in many other countries, Mattel
had to recall some toys made in China from the Argentine market due to health hazards.

Andrés López / Daniela Ramos
DIE − UNAM / CECHIMEX 110
product imports from China may be a threat to domestic employment. All these subjects are analyzed in the following sections.
Government revenues
The impact of trade with China on Government revenues began to be significant in April 2002, when Argentina’s Government imposed a tariff on exports called “retenciones”. From 1995 until then, export tariffs had been applied only to specific products, and in our analysis, the most relevant of these were soybean, sunflower beans and leather with different degrees of processing; and revenues from tariff on ex-ports were practically negligible (the average annual revenue from exports to China was around US$ 8.5 million).
As a consequence of the 2001 crisis and with the strong depreciation of national currency, President Duhalde decided to generalize the applica-tion of tariffs on exports to the entire range of products in order to prevent a rise in domestic prices. The adopted measure included a three-level scheme: the upper tariff corresponded to natural resource-based products (petroleum oil, oilseeds and cereals), the middle tariff went to food and consumer goods (dairy, meat, fruit, vegetables, etc) and the lower tariff26 corresponded to manufactured goods. Although these measures were thought to be temporary, they are currently still in force, though they have suffered some changes in recent years.
These changes may be observed in the figure below. It is clear that those products which have more weight in the export basket to China – soybeans and soybean oil – are those with the highest export tax levels as well as those in which the increase in said taxes has been higher (Table 24).
26 Average export tariffs were around 20%, 10% and 5%, respectively.

Soyb
ean
23.5
23.5
23.5
27.5
35
Soyb
ean
Der
ivat
ives
2020
2024
32
Whe
at20
2020
2028
Cor
n20
2020
2025
Oil
2024
45
Fuel
55
5
Milk
55
1010
1010
Mea
t5
515
1515
15
Reg
iona
l Pro
duct
s
(Fru
its, V
eget
able
s, et
c.)10
1010
1010
10
Man
ufac
ture
d G
oods
55
55
55
Mob
ile S
chem
e.48
%Mob
ile S
chem
ew
ith
initi
al ri
se. G
rain
41.
8%,
Der
ivat
ives
38.
8M
obile
Sch
eme.
27.1
%
Mob
ile S
chem
e.24
.5%
Soyb
ean
23.5
23.5
23.5
27.5
35
Soyb
ean
Der
ivat
ives
2020
2024
32
Whe
at20
2020
2028
Cor
n20
2020
2025
Oil
2024
45
Fuel
55
5
Milk
55
1010
1010
Mea
t5
515
1515
15
Reg
iona
l Pro
duct
s
(Fru
its, V
eget
able
s, et
c.)10
1010
1010
10
Man
ufac
ture
d G
oods
55
55
55
Mob
ile S
chem
e.48
%Mob
ile S
chem
ew
ith
initi
al ri
se. G
rain
41.
8%,
Der
ivat
ives
38.
8M
obile
Sch
eme.
27.1
%
Mob
ile S
chem
e.24
.5%
Tab
le 2
4:
Evo
lutio
n of
exp
ort t
axes
20
02
2004
20
06
2007
Ja
n-08
M
ar-0
8
Sour
ce:
M&
S C
onsu
lting
The Argentine Case
DIE − UNAM / CECHIMEX 111

Andrés López / Daniela Ramos
DIE − UNAM / CECHIMEX 112
As a result, tax collection derived from exports to China has not only grown in absolute terms but also vis-à-vis total export tax collection in Argentina. As seen in Table 25, tax collection associated with exports to China was around 12% of total export tax collection up to 2006 (while China’s share in total exports was about 7−8% during those years), but in 2007 there was a sharp increase and it reached almost of a fifth of that total.27
Table 25: Fiscal revenues for taxes on exports, 1995−2007 (US$ million)
China World China / World (%) Exports Export
taxes Exports Export
taxes Exports Export
taxes 1995 285.7 0.7 20,963.1 1.4 1996 607.4 2.3 23,810.7 2.6 1997 871.0 0.0 26,430.9 3.3 1998 681.8 3.1 26,433.7 2.6 1999 507.9 5.5 23,308.6 2.2 2000 796.9 18.0 26,341.0 3.0 2001 1,122.6 28.0 26,542.7 4.2 2002 1,093.5 155.1 25,650.6 1,521.7 4.3 10.2 2003 2,440.8 390.5 29,938.8 3,070.7 8.2 12.7 2004 2,627.9 413.5 34,575.7 3,424.0 7.6 12.1 2005 3,154.3 522.4 40,351.9 4,220.0 7.8 12.4 2006 3,508.0 581.0 46,570.0 4,745.7 7.5 12.2 2007 5,186.6 1,273.9 55,933.4 6,512.6 9.3 19.6
Note: Revenues on tariffs are calculated as follows: t*X/(1+t), where t is tariff on exports and X is exports.
Source: Author, based on data from INDEC, CEP and M&S Consult-ing (www.mysconsultores.com)
27 In 2006 the weighted average export tax for exports to China was around 17%, while for
exports to the rest of the world the corresponding figure was lower than 10%.
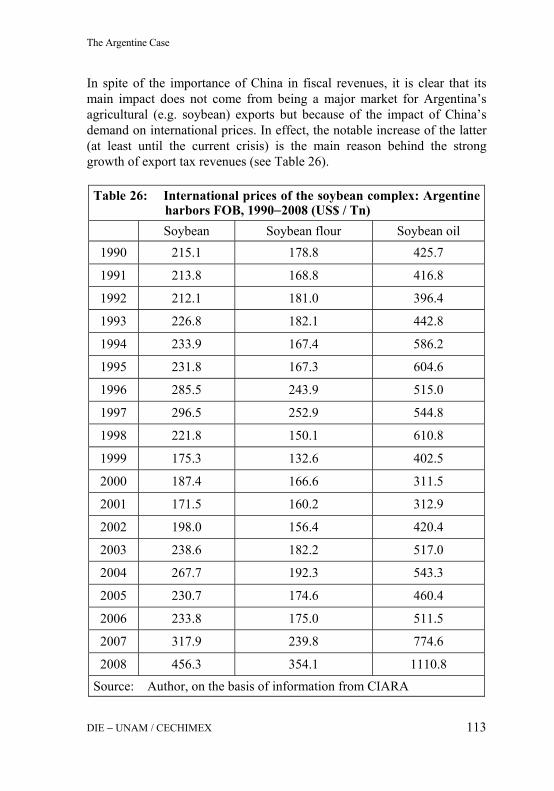
The Argentine Case
DIE − UNAM / CECHIMEX 113
In spite of the importance of China in fiscal revenues, it is clear that its main impact does not come from being a major market for Argentina’s agricultural (e.g. soybean) exports but because of the impact of China’s demand on international prices. In effect, the notable increase of the latter (at least until the current crisis) is the main reason behind the strong growth of export tax revenues (see Table 26).
Table 26: International prices of the soybean complex: Argentine harbors FOB, 1990−2008 (US$ / Tn)
Soybean Soybean flour Soybean oil 1990 215.1 178.8 425.7
1991 213.8 168.8 416.8
1992 212.1 181.0 396.4
1993 226.8 182.1 442.8
1994 233.9 167.4 586.2
1995 231.8 167.3 604.6
1996 285.5 243.9 515.0
1997 296.5 252.9 544.8
1998 221.8 150.1 610.8
1999 175.3 132.6 402.5
2000 187.4 166.6 311.5
2001 171.5 160.2 312.9
2002 198.0 156.4 420.4
2003 238.6 182.2 517.0
2004 267.7 192.3 543.3
2005 230.7 174.6 460.4
2006 233.8 175.0 511.5
2007 317.9 239.8 774.6
2008 456.3 354.1 1110.8
Source: Author, on the basis of information from CIARA

Andrés López / Daniela Ramos
DIE − UNAM / CECHIMEX 114
This clearly shows that to the extent that there are alternative markets for exports that are currently sent to China, the apparent “fiscal dependence” on China does not exist. And this is really the case since the products which are exported to China are agricultural commodities that could be sold in other markets with relative ease.
Terms of trade
During recent years Argentina’s terms of trade have improved substan-tially. This is perhaps one of the most significant effects of China’s global expansion insofar as its growing demand for primary products, natural resources, food, minerals and fuels, along with other factors, has helped maintain and even increase the prices of those commodities, favoring countries such as Argentina which are major exporters of such products.
As seen in Table 27, the purchasing power of Argentina’s exports in-creased three-fold between 1995 and 2008. This is the result of the sus-tained increase in export prices – essentially associated with the soybean complex: between 2000 and 2008, the export price index for oilseeds, vegetable oils and pellets grew by 107.7%, 219.9% and 82.6%, respec-tively. The improvement in Argentina’s terms of trade generated a trade gain of more than US$ 17 billion (at constant prices of 2003) in 2008; that is around 40% of total exports corresponding to that year.
Some authors – e.g. Kaplinsky (2006) – state that the downward trend of manufacturing prices – especially those in which China is a major pro-ducer – and the upward trend of some commodity prices (including both “soft” and “hard” commodities) will keep operating in the near future. Quoting Bloch / Sapsford (2000) Kaplinsky argues that these trends could be more a secular change than phenomena associated with a specific busi-ness cycle. If this forecast holds true, this is clearly a positive factor for a country such as Argentina. In any case, the evolution of international prices is not only associated with China’s emergence but also with other factors (including, for instance, adopted policies adopted regarding biofu-els), and will of course be affected by the ongoing world economic crisis and its further impact.
Notwithstanding the future evolution of world prices, it is clear that the improvement in the terms of trade that benefited Argentina in recent years

Tab
le 2
7:
Evo
lutio
n of
Arg
entin
a’s t
erm
s of t
rade
(sel
ecte
d pr
oduc
ts 1
995−
2008
)
U
nit
1995
20
00
2007
20
08
Var
. %
2008
/200
0 Ex
ports
(A)
Cons
tant p
rices
(1
993)
US$
mill
ion
19,2
67.6
026
,878
.60
41,6
17.1
041
,961
.63
56.1
Expo
rt pr
ice
inde
x
Gen
eral
leve
l B
ase
1993
=100
10
8.8
98
134.
4 16
8.2
71.7
Prim
ary
prod
ucts
B
ase
1993
=100
11
4.4
90.7
13
3.4
187.
6 10
6.8
Oils
eeds
B
ase
1993
=100
97
.3
84.2
12
9.5
174.
9 10
7.7
A
gric
ultu
ral m
anuf
actu
res
Bas
e 19
93=1
00
103.
1 82
.7
122.
5 16
9.2
104.
6
V
eget
able
oils
B
ase
1993
=100
13
5 72
.7
156.
7 23
2.6
219.
9
O
ilsee
d pe
llets
and
othe
r pro
duct
s B
ase
1993
=100
77
.7
88.6
11
7.4
161.
7 82
.6
Leat
her
Bas
e 19
93=1
00
99.7
95
.3
96.7
96
.8
1.5
Impo
rt pr
ice
inde
x B
ase
1993
=100
10
6.9
92.4
10
7.2
118.
8 28
.6
Term
s of t
rade
inde
x (B
) B
ase
1993
=100
10
1.8
106.
1 12
5.4
141.
6 33
.5
Purc
hasi
ng p
ower
of e
xpor
ts
(C)=
(A).(
B)/1
00
Cons
tant p
rices
(1
993)
US$
mill
ion
19,6
14.4
028
,518
.20
52,1
76.7
059
,419
.30
108.
4
Gai
n (o
r los
s) o
f tra
de (D
)=(C
)-(A
) Co
nstan
t pric
es
(199
3) U
S$ m
illio
n34
6.8
1,63
9.60
10
,559
.60
17,4
57.6
7 96
4.8
Sour
ce:
Aut
hor,
base
d on
IND
EC
The Argentine Case
DIE − UNAM / CECHIMEX 115

Andrés López / Daniela Ramos
DIE − UNAM / CECHIMEX 116
is not the result of “virtuous” structural factors (e.g. the technological upgrade of its exports basket), but the consequence of changes in the in-ternational markets. History teaches us that this kind of dependence could be dangerous from the point of view of the sustainability of development processes. Therefore, it may be wise to take advantage of this improve-ment in terms of trade to foster the development of some activities which could help to transform the specialization pattern of the Argentinean econ-omy (and China may well help with this transformation given the enor-mous potential of its domestic market). We return to these issues in the concluding section.
Employment
The third variable which it is important to analyze from the point of view of the impact of China on Argentina is employment, both in those sectors which have been favored by access to China’s market, and in those that face competition with China’s imports.
Following Jenkins and Sen (2006), to analyze the impact of trade with China on employment we use a Chenery-type exercise in order to learn about the sources of employment changes in the industrial sector. This exercise is inspired by a growth accounting methodology used by Chenery in which changes in production are attributed to changes in domestic de-mand and export and import penetration, according to the following equa-tion:
where: Dit is domestic demand of industry i at time t Qit is domestic production of industry i at time t Xit is exports of industry i at time t Mit is imports of industry i at time t
Then, changes in employment can be decomposed as follows:
itititit MXDQ −+=
01101101 )()()1( iiiiiiiiiiii QlDmmlXlDmlL Δ+−+Δ+Δ−=Δ

The Argentine Case
DIE − UNAM / CECHIMEX 117
where:
Lit is employment in industry i at time t
Hence, changes in total employment may be attributed to the impact of changes in domestic demand on employment (first term of the equation), the effect of changes in exports (second term), the impact of changes in import penetration (third term) and the effects of productivity changes (final term).
According to the objective of our analysis, which is to learn about the impact of trade with China, changes in import and export penetration will be decomposed as follows:
where:
XitCh is exports to China of industry i at time t
XitRW is exports to the rest of the world of industry i at time t
MitCh is imports to China of industry i at time t
MitRW is imports to the rest of the world of industry i at time t
In this new equation the second term measures the impact of changes in exports to China and the third term the effect of changes in exports to the rest of the world. The fourth and first terms, in turn, represent the impact of changes in imports from China and from the rest of the world, respec-tively.
The limitations and assumptions of this analysis must be highlighted. Al-though others could be mentioned, at least five facts must be considered in this regard. First, it assumes that productivity changes are independent
it
itit Q
Ll =
it
itit D
Mm =
0110111011101 )()()()1( iiiRW
iRW
iiiCh
iCh
iiRW
iiCh
iiiiii QlDmmlDmmlXlXlDmlL Δ+−+−+Δ+Δ+Δ−=Δ
Andrés López / Daniela Ramos
DIE − UNAM / CECHIMEX 118
from changes in other variables (including trade). Second, as no updated input-output data are available, only direct effects on employment can be captured, while indirect effects are not taken into account. Third, when analyzing the impact of changes in imports (exports) from (to) China sepa-rately from those coming from the rest of the world, we are not sure to what extent increased imports from China displace imports from else-where or domestic production, or whether increased exports to China might have been destined for other countries. Fourth, we are not taking into account other effects of trade with China that go beyond those that can be associated with direct imports (exports) from (to) said country (for instance, the fact that China’s demand may have impacted positively on the export prices of our commodities). Last but not least, this exercise assumes that the ratio labor/production is equal for production sold in domestic market and abroad.28 With these comments in mind, now we analyze the results of our calcula-tions. Table 28 summarizes the results for the industrial sector as a whole (in fact, the relatively few branches where there is no trade with China were removed) and for each manufacturing branch. The analysis is carried out at 3-digit level of the International Standard Industrial Classification (ISIC), revision 3. The period under study is 2001−2006. When looking at the results for the industrial sector as a whole, it becomes clear that, in the context of a significant increase in industrial employment, the only factor that has a negative impact on employment is increased import penetration with China. The positive contribution of imports from the rest of the world reflects a kind of “import substitution” effect, al-though as we said before, we do not know whether increased imports from China could have been supplied from elsewhere or if they are displacing domestic production. Anyway, what these figures reflect is the fact that China has been gaining a share in the total of Argentina’s industrial im-ports. The negative impact of growing imports from China cannot be compen-sated by the relatively small contribution of increased exports to the coun-try. Hence, the net effect of trade with China on employment is clearly negative.
28 This is an important assumption taking into account that at this level of disaggregation,
within a sector many different products coexist, and it is therefore likely that many of them have different labor ratios.
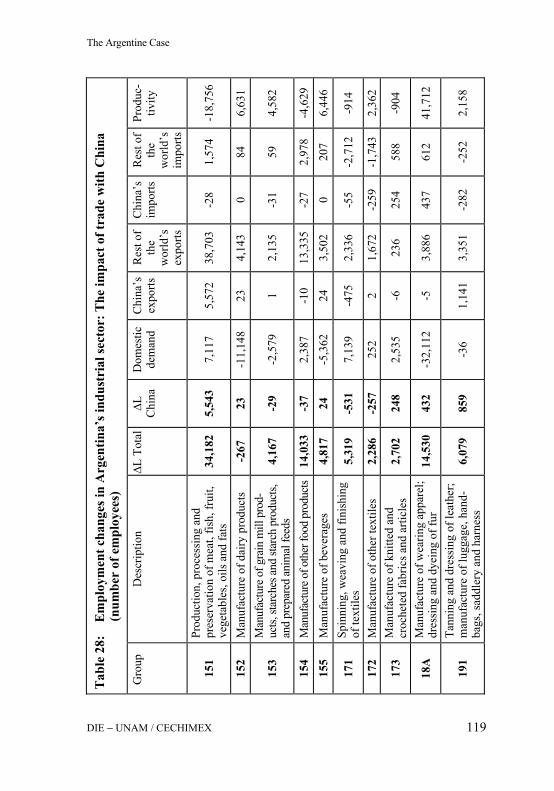
The Argentine Case
DIE − UNAM / CECHIMEX 119
Tab
le 2
8:
Em
ploy
men
t cha
nges
in A
rgen
tina’
s ind
ustr
ial s
ecto
r: T
he im
pact
of t
rade
with
Chi
na
(num
ber
of e
mpl
oyee
s)
Gro
up
Des
crip
tion
∆L T
otal
∆L
C
hina
D
omes
tic
dem
and
Chi
na’s
ex
ports
Res
t of
the
wor
ld’s
ex
ports
Chi
na’s
im
ports
R
est o
f th
e w
orld
’s
impo
rts
Prod
uc-
tivity
151
Prod
uctio
n, p
roce
ssin
g an
d pr
eser
vatio
n of
mea
t, fis
h, fr
uit,
vege
tabl
es, o
ils a
nd fa
ts
34,1
82
5,54
3 7,
117
5,57
2 38
,703
-2
8 1,
574
-18,
756
152
Man
ufac
ture
of d
airy
pro
duct
s -2
67
23
-11,
148
23
4,14
3 0
84
6,63
1
153
Man
ufac
ture
of g
rain
mill
pro
d-uc
ts, st
arch
es an
d sta
rch
prod
ucts,
an
d pr
epar
ed an
imal
feed
s 4,
167
-29
-2,5
79
1 2,
135
-31
59
4,58
2
154
Man
ufac
ture
of o
ther
food
pro
duct
s 14
,033
-3
7 2,
387
-10
13,3
35
-27
2,97
8 -4
,629
15
5 M
anuf
actu
re o
f bev
erag
es
4,81
7 24
-5
,362
24
3,
502
0 20
7 6,
446
171
Spin
ning
, wea
ving
and
fini
shin
g of
text
iles
5,31
9 -5
31
7,13
9 -4
75
2,33
6 -5
5 -2
,712
-9
14
172
Man
ufac
ture
of o
ther
text
iles
2,28
6 -2
57
252
2 1,
672
-259
-1
,743
2,
362
173
Man
ufac
ture
of k
nitte
d an
d cr
oche
ted
fabr
ics a
nd a
rticl
es
2,70
2 24
8 2,
535
-6
236
254
588
-904
18A
M
anuf
actu
re o
f wea
ring
appa
rel;
dres
sing
and
dye
ing
of fu
r 14
,530
43
2 -3
2,11
2 -5
3,
886
437
612
41,7
12
191
Tann
ing
and
dres
sing
of l
eath
er;
man
ufac
ture
of l
ugga
ge, h
and-
bags
, sad
dler
y an
d ha
rnes
s 6,
079
859
-36
1,14
1 3,
351
-282
-2
52
2,15
8

Tab
le 2
8 (c
ont.)
: E
mpl
oym
ent c
hang
es in
Arg
entin
a’s i
ndus
tria
l sec
tor:
The
impa
ct o
f tra
de w
ith C
hina
(n
umbe
r of
em
ploy
ees)
G
roup
D
escr
iptio
n ∆L
Tot
al
∆L
Chi
na
Dom
estic
de
man
d C
hina
’s
expo
rts
Res
t of
the
wor
ld’s
ex
ports
Chi
na’s
im
ports
R
est o
f th
e w
orld
’s
impo
rts
Prod
uc-
tivity
192
Man
ufac
ture
of f
ootw
ear
-1,6
75
-1,3
28
4,69
1 2
999
-1,3
30
226
-6,2
64
20A
Man
ufac
ture
of w
ood
and
of
prod
ucts
of w
ood
and
cork
, ex
cept
furn
iture
; man
ufac
ture
of
artic
les o
f stra
w a
nd p
laiti
ng
mat
eria
ls
12,8
38
123
21,0
37
209
8,24
5 -8
6 69
2 -1
7,25
9
210
Man
ufac
ture
of p
aper
and
pap
er
prod
ucts
4,
141
-29
1,39
9 9
2,14
0 -3
8 26
0 37
1
221
Publ
ishi
ng
-75
-67
-8,9
88
0 86
4 -6
7 27
9 7,
837
222
Prin
ting
and
serv
ice
activ
ities
re
late
d to
prin
ting
-2,8
99
-16
522
1 35
2 -1
6 94
-3
,851
232
Man
ufac
ture
of r
efin
ed p
etro
-le
um p
rodu
cts
521
8 1,
374
9 1,
495
-1
-458
-1
,898
23A
M
anuf
actu
re o
f cok
e ov
en p
rod-
ucts
11
0 10
23
2 0
37
10
-229
60
241
Man
ufac
ture
of b
asic
che
mic
als
1,11
9 -3
08
4,61
1 52
1,
420
-360
1,
016
-5,6
20
242
Man
ufac
ture
of o
ther
che
mic
al
prod
ucts
10
,891
-4
63
-5,4
27
76
7,21
9 -5
39
-4,5
79
14,1
40
243
Man
ufac
ture
of m
an-m
ade
fibre
s -7
24
-73
328
3 -5
06
-75
-404
-6
9
Andrés López / Daniela Ramos
DIE − UNAM / CECHIMEX 120

Tab
le 2
8 (c
ont.)
: E
mpl
oym
ent c
hang
es in
Arg
entin
a’s i
ndus
tria
l sec
tor:
The
impa
ct o
f tra
de w
ith C
hina
(n
umbe
r of
em
ploy
ees)
G
roup
D
escr
iptio
n ∆L
Tot
al
∆L
Chi
na
Dom
estic
de
man
d C
hina
’s
expo
rts
Res
t of
the
wor
ld’s
ex
ports
Chi
na’s
im
ports
R
est o
f th
e w
orld
’s
impo
rts
Prod
uc-
tivity
251
Man
ufac
ture
of r
ubbe
r pro
duct
s 1,
687
-222
3,
003
7 2,
174
-230
-4
51
-2,8
17
252
Man
ufac
ture
of p
last
ics p
rodu
cts
11,6
32
-400
11
,445
0
3,72
5 -4
00
-666
-2
,471
261
Man
ufac
ture
of g
lass
and
gla
ss
prod
ucts
68
5 -6
1 1,
675
0 24
8 -6
0 -7
-1
,171
269
Man
ufac
ture
of n
on-m
etal
lic
min
eral
pro
duct
s n.e
.c.
17,4
57
-675
24
,032
4
4,02
8 -6
79
439
-10,
365
271
Man
ufac
ture
of b
asic
iron
and
steel
1,
023
-262
8,
629
-98
1,03
1 -1
64
326
-8,7
00
272
Man
ufac
ture
of b
asic
pre
ciou
s an
d no
n-fe
rrou
s met
als
352
-39
1,75
8 1
1,58
7 -4
0 73
-3
,027
281
Man
ufac
ture
of s
truct
ural
met
al
prod
ucts
, tan
ks, r
eser
voirs
and
st
eam
gen
erat
ors
6,44
1 -2
1 5,
317
0 1,
186
-21
-83
42
289
Man
ufac
ture
of o
ther
fabr
icat
ed
met
al p
rodu
cts;
met
al w
orki
ng
serv
ice
activ
ities
6,
310
-490
12
,638
-6
1,
163
-484
-1
66
-6,8
35
291
Man
ufac
ture
of g
ener
al p
urpo
se
mac
hine
ry
10,6
89
-1,7
30
9,03
8 38
3,
530
-1,7
68
215
-364
292
Man
ufac
ture
of s
peci
al p
urpo
se
mac
hine
ry
13,4
64
-31
16,9
72
-13
-548
-1
8 16
,986
-1
9,91
4
The Argentine Case
DIE − UNAM / CECHIMEX 121
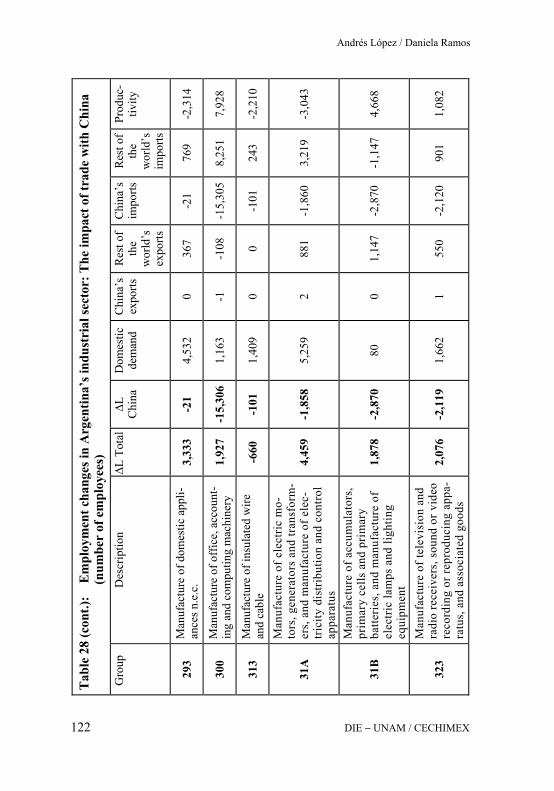
Tab
le 2
8 (c
ont.)
: E
mpl
oym
ent c
hang
es in
Arg
entin
a’s i
ndus
tria
l sec
tor:
The
impa
ct o
f tra
de w
ith C
hina
(n
umbe
r of
em
ploy
ees)
G
roup
D
escr
iptio
n ∆L
Tot
al
∆L
Chi
na
Dom
estic
de
man
d C
hina
’s
expo
rts
Res
t of
the
wor
ld’s
ex
ports
Chi
na’s
im
ports
R
est o
f th
e w
orld
’s
impo
rts
Prod
uc-
tivity
293
Man
ufac
ture
of d
omes
tic a
ppli-
ance
s n.e
.c.
3,33
3 -2
1 4,
532
0 36
7 -2
1 76
9 -2
,314
300
Man
ufac
ture
of o
ffic
e, a
ccou
nt-
ing
and
com
putin
g m
achi
nery
1,
927
-15,
306
1,16
3 -1
-1
08
-15,
305
8,25
1 7,
928
313
Man
ufac
ture
of i
nsul
ated
wire
an
d ca
ble
-660
-1
01
1,40
9 0
0 -1
01
243
-2,2
10
31A
Man
ufac
ture
of e
lect
ric m
o-to
rs, g
ener
ator
s an
d tra
nsfo
rm-
ers,
and
man
ufac
ture
of e
lec-
trici
ty d
istri
butio
n an
d co
ntro
l ap
para
tus
4,45
9 -1
,858
5,
259
2 88
1 -1
,860
3,
219
-3,0
43
31B
Man
ufac
ture
of a
ccum
ulat
ors,
pr
imar
y ce
lls a
nd p
rim
ary
batte
ries,
and
man
ufac
ture
of
elec
tric
lam
ps a
nd li
ghtin
g eq
uipm
ent
1,87
8 -2
,870
80
0
1,14
7 -2
,870
-1
,147
4,
668
323
Man
ufac
ture
of t
elev
isio
n an
d ra
dio
rece
iver
s, s
ound
or v
ideo
re
cord
ing
or re
prod
ucin
g ap
pa-
ratu
s, a
nd a
ssoc
iate
d go
ods
2,07
6 -2
,119
1,
662
1 55
0 -2
,120
90
1 1,
082
Andrés López / Daniela Ramos
DIE − UNAM / CECHIMEX 122

Tab
le 2
8 (c
ont.)
: E
mpl
oym
ent c
hang
es in
Arg
entin
a’s i
ndus
tria
l sec
tor:
The
impa
ct o
f tra
de w
ith C
hina
(n
umbe
r of
em
ploy
ees)
G
roup
D
escr
iptio
n ∆L
Tot
al
∆L
Chi
na
Dom
estic
de
man
d C
hina
’s
expo
rts
Res
t of
the
wor
ld’s
ex
ports
Chi
na’s
im
ports
R
est o
f th
e w
orld
’s
impo
rts
Prod
uc-
tivity
32A
Man
ufac
ture
of e
lect
roni
c va
lves
an
d tu
bes a
nd o
ther
ele
ctro
nic
com
pone
nts,
and
man
ufac
ture
of
tele
visi
on a
nd ra
dio
trans
mitt
ers
and
appa
ratu
s for
line
tele
phon
y an
d lin
e te
legr
aphy
-380
-4
,997
4,
306
-2
-169
-4
,995
-1
,351
1,
831
33A
Man
ufac
ture
of m
edic
al a
ppli-
ance
s an
d in
stru
men
ts a
nd
appl
ianc
es fo
r mea
surin
g,
chec
king
, tes
ting,
nav
igat
ing
and
othe
r pur
pose
s, e
xcep
t op
tical
inst
rum
ents
; man
ufac
-tu
re o
f opt
ical
inst
rum
ents
and
ph
oto-
grap
hic
equi
pmen
t, an
d m
anuf
actu
re o
f wat
ches
and
cl
ocks
1,39
8 -9
28
1,27
2 13
2,
784
-941
-1
,294
-4
36
341
Man
ufac
ture
of m
otor
veh
icle
s 1,
258
-35
4,73
3 9
5,34
9 -4
4 -3
,429
-5
,359
342
Man
ufac
ture
of b
odie
s (co
ach-
wor
k) fo
r mot
or v
ehic
les;
man
u-fa
ctur
e of
trai
lers
and
sem
i-tra
ilers
982
-45
4,59
4 0
457
-45
151
-4,1
75
The Argentine Case
DIE − UNAM / CECHIMEX 123

Tab
le 2
8 (c
ont.)
: E
mpl
oym
ent c
hang
es in
Arg
entin
a’s i
ndus
tria
l sec
tor:
The
impa
ct o
f tra
de w
ith C
hina
(n
umbe
r of
em
ploy
ees)
G
roup
D
escr
iptio
n ∆L
Tot
al
∆L
Chi
na
Dom
estic
de
man
d C
hina
’s
expo
rts
Res
t of
the
wor
ld’s
ex
ports
Chi
na’s
im
ports
R
est o
f th
e w
orld
’s
impo
rts
Prod
uc-
tivity
343
Man
ufac
ture
of p
arts
and
acc
es-
sorie
s for
mot
or v
ehic
les a
nd
thei
r eng
ines
14
,533
-1
90
15,3
47
7 11
,022
-1
96
-6,4
90
-5,1
57
351
Bui
ldin
g an
d re
pairi
ng o
f shi
ps
and
boat
s 3,
574
-3
3,25
7 1
718
-4
2,78
8 -3
,184
359
Man
ufac
ture
of t
rans
port
equi
pmen
t n.e
.c.
53
-2,1
07
862
0 62
-2
,107
1,
757
-521
35A
Man
ufac
ture
of r
ailw
ay a
nd
tram
way
loco
mot
ives
and
roll-
ing
stoc
k, a
nd m
anuf
actu
re o
f ai
rcra
ft an
d sp
acec
raft
-123
0
522
0 -9
4 0
-385
-1
66
361
Man
ufac
ture
of f
urni
ture
2,
706
-986
-2
6,66
7 -1
8 -9
01
-968
-3
,528
34
,788
369
Man
ufac
turin
g n.
e.c.
24
6 -3
,202
-3
,706
2
1,23
7 -3
,205
-2
,614
8,
531
T
otal
21
9,09
6-3
4,56
7 10
1,10
3 6,
575
136,
989
-41,
142
12,7
96
2,77
5
Sour
ce:
A
utho
r, ba
sed
on C
EP
Andrés López / Daniela Ramos
DIE − UNAM / CECHIMEX 124

The Argentine Case
DIE − UNAM / CECHIMEX 125
What happens when the results are analyzed by industrial sector? The whole positive impact of exports to China on employment is concentrated in only two sectors: the food processing and leather industries. On aver-age, both industries have relatively low labor intensities. On the other hand, as the export of textile products to China fell – and considering this is a labor intensive activity –, there was an ensuing negative contribution to employment in this sector.
In the case of imports, negative figures appear in almost all sectors, re-flecting the growing widespread penetration of industrial imports from China. Different sectoral situations may be distinguished in this regard. On one hand, among the few activities in which employment fell, it is in the shoe sector – another labor intensive activity – that the negative impact of China’s imports is most relevant (nearly 80% of employment reduction in that industry may be attributed to China’s import competition). In the publishing industry there is also a great impact of China on employment reduction, but absolute figures are very low.
In the case of electric components and TV, and radio and communication transmitters, the negative impact of China’s imports on employment is far greater than the total employment reduction. Moreover, the figure for employment reduction attributable to increased imports from China is higher than total employment at the beginning of the period under study (2001). How can we interpret these figures? In this case, domestic demand grew significantly while local production fell. The growing gap was cov-ered by imports, among which China’s share increased markedly during the period under analysis. As in this particular case, it is uncertain whether, in the absence of competition from China, domestic production could have met increasing demand. It could be perhaps the case that the negative effect on employment would have been observed anyway with imports from other countries.
The case is similar for the manufacture of accounting, office and comput-ing machinery, in which there was an increase in employment but a very strong negative effect of import penetration from China. As in the case above, growing domestic demand goes hand in hand with a fall in local production. Furthermore, imports from other countries diminished during the period under study. Again, we could ask the same question as in the preceding paragraph, and the answer would probably be the same. In fact, in both cases it may be that China’s growing share in imports is to some

Andrés López / Daniela Ramos
DIE − UNAM / CECHIMEX 126
extent a consequence of new production strategies by large TNCs in this sector on one hand, and the result of independent import decisions by local buyers on the other hand.
The sector that produces lamps, lighting equipment and batteries faced a very similar situation to that of the two industries mentioned above. How-ever, in this case it is possible that domestic capabilities might have ex-isted to meet the increased domestic demand, at least from a technological point of view. The same occurred in other sectors where there was a simi-lar combination of events – falling production, growing demand, and in-creased share of Chinese imports. Some examples are: furniture29 and a miscellaneous sector that includes sports goods, games and toys. All these cases had adequate local production capabilities in the past and some still do.
Finally, considering only those sectors in which absolute figures for em-ployment reduction associated with increased Chinese competition are high (and in which the share of Chinese imports vis-à-vis domestic de-mand is also high), there are four more sectors in which there was both domestic production and an increase in demand between 2001 and 2006 and high rises in China’s share of total imports. These are: general purpose machinery, electric machinery, transport equipment n.e.c. and TV and radio receivers and sound and video equipment. Considering that domestic production increased during the period under study it is also plausible that at least a part of China’s negative impact on employment may reflect the displacement of local production.
In any case, it is clear that our thoughts about the counterfactual situation in the absence of increased competition from China are purely speculative and would need further research to confirm or reject them.
29 Production is measured in US dollars. Therefore, a part of the fall in local production in
the sectors under analysis could be attributed to the impact of the 2002 devaluation on domestic prices nominated in US dollars. However, among the sectors analyzed in these paragraphs, in terms of quantities, local production only increased in furniture. In the other sectors the decrease was observed in quantities as well as in US dollars.

The Argentine Case
DIE − UNAM / CECHIMEX 127
2 FDI flows and the incidence of China on Argentina’s global positioning
China has become the principal destination of FDI towards developing countries.30 According to the World Investment Report 2008 (UNCTAD 2008), it received almost US$ 73 billion in FDI in 2006 and over US$ 80 billion in 2007, while Hong Kong received US$ 43 billion and almost US$ 60 billion, respectively. This represents 4.6% of global FDI in 2007 and approximately 7.8% of FDI if we consider Hong Kong.
Although market seeking investments are also important, the growing attraction of China is to a large extent responsible for the trend towards production offshoring that has been observed world-wide for a couple of decades, and in recent years this phenomenon, that was limited to manufacturing industry, has spread to the services. This reconfigura-tion of global production resulted in changes in the division of labor, in trade flows and also in FDI flows. Why do we mention this? Because China emerges as one of the key players of the new global scenario and without doubt its attractiveness as a destination for FDI has an impact on other developing countries that also seek a place in this new scheme.
Argentina is outside of this process. First, as occurs in developed coun-tries, some (so far only a few) Argentine companies are starting to relocate part of their production activities to offshore locations. This is particularly significant in some sectors, in which the organization of production allows for this type of division of labor and in which the Argentine companies have the size and, therefore, the capacity to undertake such a process.31 China is one of the destinations to which these companies are directing their efforts, essentially motivated by efficiency seeking reasons. Thus, a growing number of Argentine companies see China not only as a market in which to place their export products, but also as a location in which to carry out production.
30 Globally, China ranks sixth as a destination for FDI after the US, UK, France, Canada
and Netherlands. 31 It is important to note that the development of offshore-type activities - either within the
corporation itself (captive offshoring) or outsourced (outsource offshoring) - requires an important degree of coordination between the supplier and the customer, and often also includes the transfer of technology and knowledge with different levels of codification, etc., so that it is unlikely that very small firms could carry out such processes.
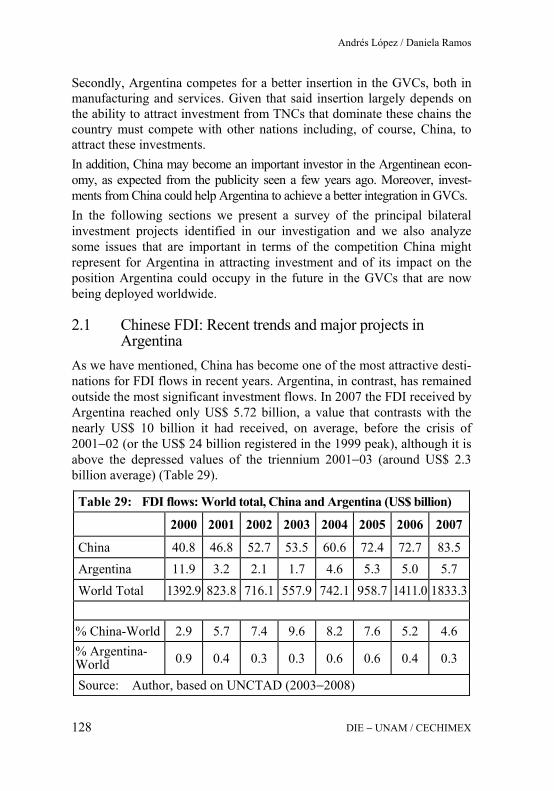
Andrés López / Daniela Ramos
DIE − UNAM / CECHIMEX 128
Secondly, Argentina competes for a better insertion in the GVCs, both in manufacturing and services. Given that said insertion largely depends on the ability to attract investment from TNCs that dominate these chains the country must compete with other nations including, of course, China, to attract these investments. In addition, China may become an important investor in the Argentinean econ-omy, as expected from the publicity seen a few years ago. Moreover, invest-ments from China could help Argentina to achieve a better integration in GVCs. In the following sections we present a survey of the principal bilateral investment projects identified in our investigation and we also analyze some issues that are important in terms of the competition China might represent for Argentina in attracting investment and of its impact on the position Argentina could occupy in the future in the GVCs that are now being deployed worldwide.
2.1 Chinese FDI: Recent trends and major projects in Argentina
As we have mentioned, China has become one of the most attractive desti-nations for FDI flows in recent years. Argentina, in contrast, has remained outside the most significant investment flows. In 2007 the FDI received by Argentina reached only US$ 5.72 billion, a value that contrasts with the nearly US$ 10 billion it had received, on average, before the crisis of 2001−02 (or the US$ 24 billion registered in the 1999 peak), although it is above the depressed values of the triennium 2001−03 (around US$ 2.3 billion average) (Table 29).
Table 29: FDI flows: World total, China and Argentina (US$ billion)
2000 2001 2002 2003 2004 2005 2006 2007
China 40.8 46.8 52.7 53.5 60.6 72.4 72.7 83.5 Argentina 11.9 3.2 2.1 1.7 4.6 5.3 5.0 5.7 World Total 1392.9 823.8 716.1 557.9 742.1 958.7 1411.0 1833.3
% China-World 2.9 5.7 7.4 9.6 8.2 7.6 5.2 4.6 % Argentina-World 0.9 0.4 0.3 0.3 0.6 0.6 0.4 0.3
Source: Author, based on UNCTAD (2003−2008)

The Argentine Case
DIE − UNAM / CECHIMEX 129
In addition to Hong Kong (which represents nearly one third of total FDI in China), the largest investors in that country are Japan, US, Korea, Tai-wan, Singapore, and Germany; with shares of 9%, 7%, 7 %, 5%, 4% and 2% of the total, respectively. Most investment is directed to coastal cities or the "second string" (Yearbook 2002−2006) while in terms of sectors, the manufacturing sector absorbs about 64% of resources (figures for 2006)32 (Table 30).
Table 30: FDI flows into China by sector (2006)
Sector % over total FDI entered into China
Manufacturing 63.6 Real estate 13.1 Leasing and business services 6.7 Transport, storage and post 3.1 Wholesale and retail trades 2.8 Production and supply of electricity, gas and water 2.0 Information transmission, computer services and software 1.7
Hotels and catering services 1.3 Construction 1.1 Agriculture, forestry, animal husbandry and fishery 1.0 Scientific research, technical service 0.8 Services to households and other services 0.8 Mining 0.7 Financial intermediation 0.5 Culture, sports and entertainment 0.4 Management of water conservancy, environment and public facilities 0.3
Source: Author, National Bureau of Statistics of China (2007)
32 According to the Ministry of Commerce of China, nearly 24 million Chinese are work-
ing in foreign enterprises, contributing with more than 10% of the country's total urban employment (www.service.china.org.cn).

Andrés López / Daniela Ramos
DIE − UNAM / CECHIMEX 130
According to the Economist Intelligence Unit (EIU / CPII 2006), although China remains open to foreign investors, in recent years there is some saturation of FDI that is affecting various industries and could also reduce flows in the coming years. The reason for this change is found, according to the work above, in the intense price competition and the increased value of raw materials, which has cut profit margins in some sectors. Another factor that may also have an impact is the (expected) alignment of the corporate tax rate faced by domestic companies with respect to foreign firms (in early years the former have been systematically higher than the latter).33
In this respect, the OECD (2007) mentions that, although China is still at the top of the list of preferred locations for FDI flows, other developing countries are becoming increasingly attractive to foreign investors, a sub-ject to which we will return later in this section.34
Beyond these considerations, there is almost unanimous agreement in the specialized literature that FDI will continue flowing into China, partly because there are important sectors of the economy – especially in services – which are going through a process of opening to FDI as a result of WTO accession.
By contrast, Chinese investment abroad is still relatively weak when com-pared to its presence in trade flows35, although it has grown rapidly in recent years and spread to a wider range of activities and countries, partly as a result of the government support that some domestic companies are receiving in order to become internationalized. Therefore, in general there
33 Foreign companies operating in China are taxed at a rate of 15%, while local firms pay
33% (EIU 2006). 34 Inasmuch as labor costs in other countries - such as India or Vietnam, which have also
embarked on a process of openness to FDI - are lower than in Chinese coastal areas, they might be able to divert part of the FDI directed to cheap-labor-intensive sectors now going to China.
35 It is necessary to mention some issues related to FDI statistics. According to The Eco-nomist Intelligence Unit, while Chinese FDI abroad is much less than the FDI received by that country, the first of these figures is undoubtedly much higher than official statis-tics indicate. According to this source, the reason for this would be that some govern-ment agencies – such as the Chinese Ministry of Commerce – have historically underes-timated the outflows of FDI because they include only those investments that have been conducted with official approval.
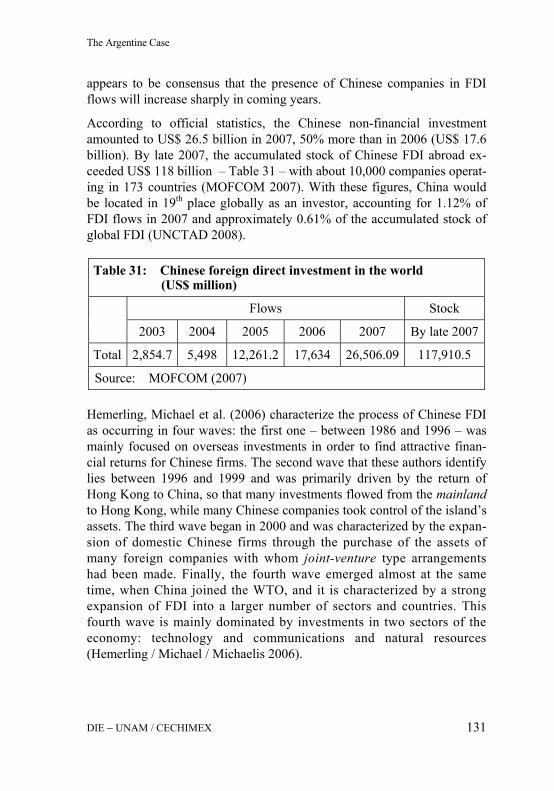
The Argentine Case
DIE − UNAM / CECHIMEX 131
appears to be consensus that the presence of Chinese companies in FDI flows will increase sharply in coming years.
According to official statistics, the Chinese non-financial investment amounted to US$ 26.5 billion in 2007, 50% more than in 2006 (US$ 17.6 billion). By late 2007, the accumulated stock of Chinese FDI abroad ex-ceeded US$ 118 billion – Table 31 – with about 10,000 companies operat-ing in 173 countries (MOFCOM 2007). With these figures, China would be located in 19th place globally as an investor, accounting for 1.12% of FDI flows in 2007 and approximately 0.61% of the accumulated stock of global FDI (UNCTAD 2008).
Table 31: Chinese foreign direct investment in the world (US$ million)
Flows Stock
2003 2004 2005 2006 2007 By late 2007
Total 2,854.7 5,498 12,261.2 17,634 26,506.09 117,910.5
Source: MOFCOM (2007)
Hemerling, Michael et al. (2006) characterize the process of Chinese FDI as occurring in four waves: the first one – between 1986 and 1996 – was mainly focused on overseas investments in order to find attractive finan-cial returns for Chinese firms. The second wave that these authors identify lies between 1996 and 1999 and was primarily driven by the return of Hong Kong to China, so that many investments flowed from the mainland to Hong Kong, while many Chinese companies took control of the island’s assets. The third wave began in 2000 and was characterized by the expan-sion of domestic Chinese firms through the purchase of the assets of many foreign companies with whom joint-venture type arrangements had been made. Finally, the fourth wave emerged almost at the same time, when China joined the WTO, and it is characterized by a strong expansion of FDI into a larger number of sectors and countries. This fourth wave is mainly dominated by investments in two sectors of the economy: technology and communications and natural resources (Hemerling / Michael / Michaelis 2006).
Andrés López / Daniela Ramos
DIE − UNAM / CECHIMEX 132
This last wave is particularly relevant for Argentina because many Chinese companies have expressed interest in investing in the country following the logic of the search for natural resources. But more generally, this wave of Chinese investment has two remarkable features: the emergence of a new generation of successful Chinese companies in the domestic market that want to become global players36, and the strong support of the Chi-nese government, which has a national interest in expanding business abroad and has attempted to create "champions" for this purpose (Hemerling / Michael / Michaelis 2006). Indeed, since the Quinquennial Plan 2001−2005, the government encourages FDI in order to reduce de-pendence on the domestic market and, at the same time, build a global reputation for Chinese industry (the so-called "going global strategy"). In addition, this strategy also gives China access to the ownership of certain natural resources and commodities, such as oil or other metals (EIU / CPII 2006).
Finally, China's hunger for expansion has been strengthened by the interest of some TNCs in reviewing their investment strategies and eliminating unprofitable units, all of which have stimulated the process of M&As. In this regard, according to EIU / CPII (2006), the M&As operations in which China was involved increased from US$ 1.3 billion in 2004 to US$ 4 billion in 2005.
The assumption that Chinese FDI abroad will continue to increase is re-flected, for example, in recent surveys conducted by McKinsey & Com-pany (2008), where three out of five executives of the surveyed Chinese companies said that their long-term goal is to turn the company into a global competitor. In this way, the main obstacle faced by China, accord-ing to these executives, is the lack of skills and talents in the field of man-agement, as can be seen in the following graph.
36 These companies have advantages because of the scale of the Chinese market, the
innovative capabilities that many of them have evolved over recent years and the ex-perience gained working in joint-ventures with multinational companies established in China.
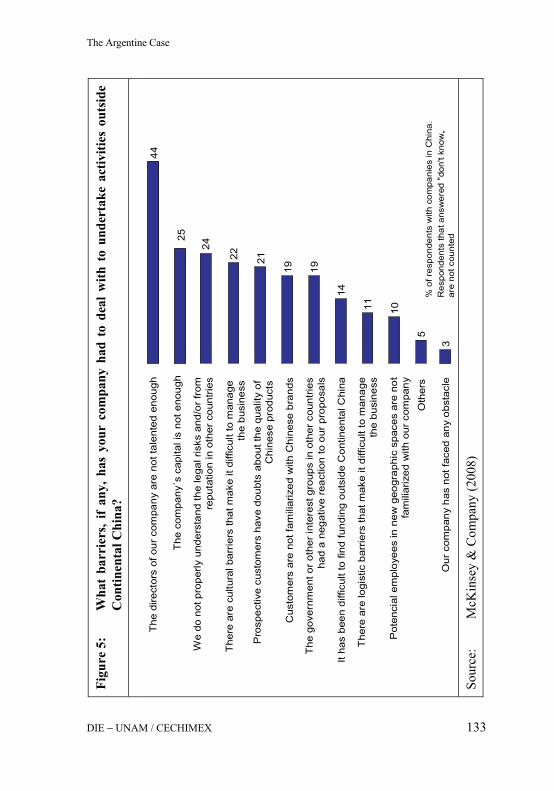
Figu
re 5
: W
hat
barr
iers
, if
any,
has
you
r co
mpa
ny h
ad t
o de
al w
ith t
o un
dert
ake
activ
ities
out
side
C
ontin
enta
l Chi
na?
Sour
ce:
McK
inse
y &
Com
pany
(200
8)
The
re a
re c
ultu
ralb
arrie
rs th
at m
ake
itdi
fficu
ltto
man
age
the
busi
ness
Pro
spec
tive
cust
omer
sha
vedo
ubts
abou
tthe
qua
lity
of
Chi
nese
pro
duct
s
Res
pond
ents
that
ans
wer
ed"d
on't
know
„ar
e no
t cou
nted
44
25
24
22 21
19 19
14
11 10
5
3
The
dire
ctor
sof
our
com
pany
are
not t
alen
ted
enou
gh
The
com
pany
´sca
pita
lis
not e
noug
h
We
do n
ot p
rope
rlyun
ders
tand
the
lega
l ris
ks a
nd/o
r fro
m
repu
tatio
nin
oth
erco
untri
es
Cus
tom
ers
are
not f
amili
ariz
edw
ith C
hine
se b
rand
s
The
gov
ernm
ento
r oth
erin
tere
stgr
oups
in o
ther
coun
trie
sha
da
nega
tive
reac
tion
to o
urpr
opos
als
Itha
s be
endi
fficu
ltto
find
fund
ing
outs
ide
Con
tinen
tal C
hina
The
re a
re lo
gist
icba
rrie
rs th
at m
ake
itdi
fficu
ltto
man
age
the
busi
ness
Pot
enci
alem
ploy
ees
in n
ew g
eogr
aphi
csp
aces
are
not
fam
iliar
ized
with
our
com
pany
Oth
ers
Our
com
pany
has
not f
aced
any
obst
acle
% o
f res
pond
ents
with
com
pani
esin
Chi
na.
The Argentine Case
DIE − UNAM / CECHIMEX 133

Andrés López / Daniela Ramos
DIE − UNAM / CECHIMEX 134
Chinese companies interested in investing abroad have found a number of problems in host countries. In some cases, this was due to the fact that many companies have a low technological level, which could lead to a low level of competitive advantages abroad. In addition, many companies lack the experience to work abroad. Some companies have found problems with the domestic legislation of host countries (OECD 2007). Further-more, as mentioned by some authors, the fact that the main investors are companies with State participation is also a negative factor, as there are no clear mechanisms for monitoring such investments.
Likewise, companies investing abroad need to learn how to do business according to local conditions. In this sense, the Chinese government and Chinese TNCs are trying more and more to understand and implement internationally recognized standards for doing business (Responsible Busi-ness Conduct) and to better integrate their operations to the host countries’ economies (OECD 2007).
As previously mentioned, the interest of China in investing abroad is now focused on certain sectors which are considered strategic. In Table 32 it can be seen that the bulk of Chinese FDI in recent years was concentrated in mining, retail and wholesale, business services and manufacturing.
In this context of expansion of Chinese FDI, the interest in Latin America seems to have increased in recent years, although the continent’s share in China’s outward FDI is still low (Table 33). According to Cesarín (2007), this growth reflects a particular interest in China for closer ties with the region to strengthen its influence in relation to the US.37
According to data provided by Ancochea (2007), during the first quarter of 2006 the bulk of Chinese FDI that was directed to Latin America went to the sectors of copper, oil, steel and transportation. However, as seen be-low, FDI flows that have entered into Argentina are still low compared with the weight that China has in the field of trade.
It must also be said that some specialists consider China has some features that differentiate it from other investors. For example, Beijing enthusiasti-cally supports trade agreements with developing countries, while Western
37 In the same sense, Malik (2006) mentions that China is taking advantage of the historic
rivalry that has always existed between US and Latin America.

The Argentine Case
DIE − UNAM / CECHIMEX 135
Table 32: Destination of Chinese foreign direct investment, 2004−2007 (% of total)
Sector 2004−2007 2004 2005 2006 2007
Agriculture, forestry, hus-bandry and fishing 2.0 5.3 0.9 0.9 1.0
Mining 25.5 32.7 13.7 40.3 15.3
Manufacturing 11.2 13.7 18.6 4.3 8.0
Power and other utilities 0.7 1.4 0.1 0.6 0.6
Construction 0.7 0.9 0.7 0.2 1.2
Transport, warehousing and postal service 10.4 15.1 4.7 6.5 15.3
IT 0.5 0.6 0.1 0.2 1.1
Wholesale and retailing 15.8 14.5 18.4 5.3 24.9
Residential and catering trade 0.0 0 0.1 0.0 0.0
Finance 5.7 nc nc 16.7 6.3
Real state 1.5 0.2 0.9 1.8 3.4
Leasing and business services 24.1 13.6 40.3 21.4 21.2
Science research, service and geo-survey 1.0 0.3 1.1 1.3 1.1
Residential services and other services 0.7 1.6 0.5 0.5 0.3
Total 100 100 100 100 100
Source: MOFCOM (2007)
companies are often constrained in doing business due to issues related to human rights, the existence of repressive policies or of unacceptable labor standards, etc. in host countries. Furthermore, Chinese State enterprises, using credit lines given by the government, are much less limited by rent-seeking considerations and are certainly backed by the government's strat-egy to establish a foothold in countries with strategic resources for future Chinese growth (Malik 2006).

Andrés López / Daniela Ramos
DIE − UNAM / CECHIMEX 136
Table 33: Destination of Chinese foreign direct investment (% share)
Flows StockRegion/Country
2003 2004 2005 2006 2007 2007
Asia 52.72 54.82 36.57 43.46 62.60 67.18
Africa 2.62 5.77 3.19 2.95 5.94 3.78
Europe 5.08 2.86 3.23 3.39 5.81 3.78
Latin America 36.37 32.06 52.74 48.03 18.50 20.95
Latin America without Cayman and Virgin Is. 0.77 1.66 0.63 0.56 1.60 1.07
Argentina 0.04 0.02 0 0.04 0.52 0.13
Brazil 0.23 0.12 0.12 0.06 0.19 0.16
Cayman Is. and Virgin Is. 35.6 30.4 52.11 47.47 16.89 19.88
Chile 0.01 0.01 0.01 0.04 0.01 0.05
Cuba 0.05 -- 0.01 0.17 0.02 0.06
Mexico 0 0.49 0.03 -- 0.06 0.13
Venezuela 0.22 0.08 0.06 0.1 0.26 0.12
North America 2.02 2.3 2.62 1.46 4.25 2.75
Oceania 1.19 2.19 1.65 0.72 2.91 1.55
Total 100 100 100 100 100 100
Source: Author, based on MOFCOM (2007)
To summarize, there appears to be general consensus on the fact that one of the main objectives of Chinese FDI in Latin America (and in other continents like Africa) has been, and still is, to ensure basic supplies such as natural resources. In line with this type of "resource-seeking" invest-ment, Jenkins and Dussel Peters (2006) highlight the particular interest of China in the sectors of oil and mining, to which we add the basic infra-structure sector related to the provision of those resources. The case of "market-seeking" investments seems to be much more limited and, clearly,
The Argentine Case
DIE − UNAM / CECHIMEX 137
it is not a major driver of Chinese investment in Argentina, although it may be more influential in the case of Brazil, given the size of its market. However, other considerations – such as reducing transportation costs and tariff or legal barriers – could also play an important role in this process.
In the case of Argentina, it is clear that the country is an attractive invest-ment location in the areas of mining, oil and fishing, as well as in certain sectors such as basic infrastructure due to Chinese interest in controlling certain communications networks, energy and transport to guarantee the supply and commercialization of these natural resources. However, despite this interest, as far as we know there have been few projects that have actually materialized up until now. One possible explanation for this in-volves several arguments. First, it is likely that there is a shortage of in-formation on Argentina in China (business practices, legal rules, banking, etc.), something that Chinese businessmen who come to the country usu-ally complain about. Also, Argentina is seen as a risky country. The ex-treme volatility experienced by the macroeconomic variables in recent years has raised serious questions about institutional stability, economic performance and legal certainty in the future. Furthermore, according to some interviewed informants, doubts about policy changes ranged from trade rules – such as trade tariffs – to the tax burden, the banking system, investor protection laws, etc. (all significant differences from a case such as Chile38 for example). In this sense, people consulted for this research agreed that the Chinese government is reluctant to engage in long-term or high risk investments in our country unless they include some form of state guarantee (and possibly subsidies).
Finally, it is not quite clear what Argentina’s strategy towards China is, in both trade and investment. While there seems to be an interest in attracting investment into the country, there is no deliberate policy for doing so, which contrasts with the actions undertaken by other regional economies such as Chile, Brazil and Venezuela, where governments are explicitly encouraging Chinese investment in some strategic sectors.
In the case of Chinese investment in Argentina, unfortunately we have no official statistics. The best available information comes from the investment database of the Center of Production Studies (CEP) although
38 In August 2006, China and Chile signed a free trade agreement.

Andrés López / Daniela Ramos
DIE − UNAM / CECHIMEX 138
investment database includes not only effectively made investments, but also the announced projects that have not yet been executued. Ac-cording to this source, Chinese investment projects in Argentina during the 1998-2007 period amounted to US$ 764 million, but as far as we know most of them have not materialized yet. Nevertheless, it is clear that the announced investments have increased sharply since 2002, something which shows, at least, a growing interest of China in estab-lishing companies in the country. More than two thirds of the total announced investments belong to the trade sector, mostly supermarket chains, followed by construction (9.4%), automotive industry (8.3%) and mining (4.5%) (see Table 34).
Investment projects registered in the database correspond to investment advertisements appearing in newspapers, or surveys that are provided directly by the companies. Investments include expansions, greenfields and mergers and acquisitions.
Table 34: Chinese FDI in Argentina (announced projects) 1998−2007 (US$ million)
Agriculture and fishing 1.5
Food and drink 18.4
Automotive and autoparts 63.4
Trade 517.3
Construction 71.7
Electronics and appliances 28.9
Hotels and restaurants 10
Research and development (R&D) 1
Mining 34.4
Oil and gas 13.4
Other services 4
Total 764.1
Source: CEP’s investment database

The Argentine Case
DIE − UNAM / CECHIMEX 139
According to the Chinese Consulate for the Promotion of International Trade (CCPIT) there were approximately 30 Chinese companies in Argen-tina in 2003, with a total investment of US$ 25 million. The same source indicates that Argentina has about 279 investment projects in China, which totaled about US$ 70 million (People's Daily 2007). In any case, we are not able, from these figures, to distinguish between projects involving productive FDI and those solely for the establishment of commercial of-fices abroad.
Next, we present a survey of major investment projects by Chinese enter-prises in Argentina. As we shall see, the majority of these initiatives have not yet been carried out.
Investments made
• Two Chinese electronic firms have been installed in Tierra del Fuego – an import tax-free zone – forming joint ventures with local compa-nies to assemble TV sets, air conditioners and other electronic de-vices. One of these firms, TLC, plans to assemble plasma TV sets as a second activity in the country. The reason these companies invested in Argentina was to reduce transport costs by assembling locally the parts and components the firms produce in China, taking advantage of the import tax-free regime that exists in this province. Products are mainly sold in Argentina.
• Three fishing companies have been installed in Argentina since 1997 in the city of Mar del Plata, one of the most important fishing ports in the country. The core business of the firms is the capture, processing and export of fish and seafood to China and other markets, particu-larly Europe. It must be said that the level of local value-added is very low, since the companies process the seafood outside the country.
• Since 2004, two Chinese companies have been operating the iron mine of Sierra Grande, the largest subterranean iron ore mine in South America located in the province of Rio Negro. The first company op-erating the mine was Leng Cheng Mining, which invested US$ 20 million to reopen the mine (which had been closed for more than 10 years) and paid a US$ 6.5 million cannon to operate the mine. In 2006, 70% of the mine was sold to China Metallurgical Group Corpo-ration (MCC). As might be expected, the company’s project is export-oriented (Comini 2007).
Andrés López / Daniela Ramos
DIE − UNAM / CECHIMEX 140
• The Chinese company Huawei has been in Argentina since 1999. This is a company dedicated to the sale of telephone equipment that has re-cently installed a shared service center in the country that is globally responsible for the company’s Chinese-Spanish translations. The company has over 150 employees.
• Two Chinese telephone companies have been established recently to retail telecommunication equipment, imported entirely from China.
• Chinese CDC Software acquired 10% of the Argentine subsidiary of CMT Latin America. This was the first Chinese investment in the software sector in Argentina (Comini 2007).
• There are more than 3,500 Chinese supermarkets operating in Argen-tina. Most belong to Chinese immigrants from the province of Fu-jien39 who came in the last ten years attracted by better living condi-tions. Supermarkets have strong purchasing power because they pay cash and form pools of buyers (CASRECH 2007). According to CEP’s investment database, during the last five years China invested more than US$ 400 million in this sector.
• A local company, Servimagnus SA, and Chinese Growing Shanghai Dredging – the largest dredging company in the world – signed an agreement to dredge rivers and harbors at the port of Buenos Aires City. The Chinese company will contribute with know-how and tech-nology through Harbor Engineering Co.
• There is a maritime company that was established during the 1990s, which rents containers for ship cargo. Another company, Bactssa, has operated part of the Buenos Aires Port since 1994 (CEP Investment Database).
• China has some other businesses in Argentina related to transport material, railway material, locomotives and wagons, but these have been sporadic commercial operations up until now. Furthermore, ac-cording to the Sino-Argentine Chamber of Commerce and Industry, during 2004 some investments were made in the telecommunications area in the city of Calafate, Santa Cruz.
39 The province of Fujien is known as “the Sicily of China” due to the presumed existence
of businesses associated or controlled by the Mafia.

The Argentine Case
DIE − UNAM / CECHIMEX 141
Investment announcements
• Sanhe Hopefull Grain and Oil Co Ltd., a Chinese oil company, aims to operate – in association with the local holding SOCMA – the rail-way company Belgrano Cargas SA, which is responsible for trans-porting a considerable amount of the soybean produced in Argentina to the ports. Both companies participated in the public bidding process and will be working on the due diligence for the next six months. The agreement with the government includes a public subsidy equal to the wages of the company’s 1,500 employees and an additional monthly amount of US$ 7 million. This venture also includes the lorry drivers and railway unions.
• The Chinese automotive company Chery announced its plan to install a plant to assemble automobiles (with a production capacity of 25,000 vehicles per year) for the Mercosur market in Uruguay by 2007, as well as its intention to expand its production to Argentina in the fu-ture. This investment is a joint venture with the local group SOCMA, formerly the manufacturer of FIAT in Argentina. With this agreement, Chery will become the first Chinese car manufacturer to produce abroad.40
• A Chinese state-owned mining enterprise intends to operate a deposit of iron ore in the Patagonia region and there is an aim to invest in an oil exploration project through an agreement between Enarsa (Argen-tina’s state-owned energy company) and China-Sonangol Interna-tional Holding.
• The China Metallurgical Group Corporation (MCC) presented the best offer in the bidding process for the acquisition of two new power plants in the province of Buenos Aires. The firm’s proposal was around US$ 217 million. This company owns the iron ore mine of Si-erra Grande (Comini 2006).
• According to press information, the main Chinese motorcycle export-ers to Latin America, Loncin Group, Lifan and Zongshen, plan to in-stall – in association with local companies – some plants in Latin America, in order to reduce transport costs, communications problems and bureaucracy and legal impediments (CRI 2007).
40 According to press releases the company has other similar projects in Russia, Egypt,
Iran, Malaysia and Indonesia.
Andrés López / Daniela Ramos
DIE − UNAM / CECHIMEX 142
• In the same sector, the Chinese company Maverick is planning to install a plant to assemble motorcycles in San Juan through a joint venture with the local firm Di Bella, importer and representative of Maverick cycles in Argentina since 1998. The estimated investment is around US$ 4 million and the project includes the production of three different motorcycle models and a four-wheel cycle (La Nación, 27 Aug. 2007).
• A Chinese automotive company, National Automobile Industries, announced in 2007 its intention to install an assembly plant in Men-doza to produce commercial vehicles. According to press information, other areas of Chinese interest in the province are solar energy, rail-way machinery and finances.
• In March 2007, two Chinese companies, CETC International and CEIC, presented an offer in the bidding process for the acquisition of four 3-D radars to be used for air traffic control (Xinhuanet 2007).
• In 2007 the province of Santa Cruz opened a bidding process for the construction of a coal thermal power station in Río Turbio, with an es-timated investment of US$ 500 million over almost four years. Two of the six groups participating in this competitive bidding include Chinese companies, one of them is a joint venture between the local IECSA, a SOCMA Group-owned company, and Guodian; and the other group is integrated by the China National Machinery & Equip-ment Corporation. This firm is also aiming to participate in the con-struction of an electric power station in Bahia Blanca (Clarín, 7 Apr. 2007).
• Oliva (2005) mentions other projects that were announced during the last decade: the interest of Chinese companies in investing in the meat industry, a joint venture between Chinese and local capitals to build a tobacco company and the announcement of construction of a grain port in Santa Fe. As far as we know, none of these projects have been implemented yet.
• According to Blázquez-Lidoy / Rodríguez / Santiso (2006), China is committed to investing in the construction of a highway from Argen-tina to Chile in order to facilitate the transportation of raw material.
• A consortium formed by two Argentine companies – Oxipetrol and Petroterra – and JHP from China, presented an offer for prospecting

The Argentine Case
DIE − UNAM / CECHIMEX 143
and operating a hydrocarbon area in the province of Salta (La Nación, 10 July 2006).
• According to the Sino-Argentine Chamber of Commerce and Indus-try, a Chinese firm is analyzing an investment in the electrification of a metropolitan railway line.
• The Confucius Institute is planning to open an office in Argentina.
• Sanhe Hopefull Grain and Oil Company visited the northern province of Jujuy to evaluate possible investment areas of interest, in particular related to the mining sector. As mentioned above, this company aims to operate the Belgrano Cargas railway (Comini 2007).
• The China Communication Construction Group (CCCG) showed interest in participating in the hydroelectric project of Portezuelo in the province of Mendoza. The project would begin at the end of 2007 and would take more than five years to come into operation (Comini 2007).
2.2 Argentine FDI in China According to the National Bureau of Statistics of China, Argentine FDI in China reached nearly US$ 95 million during the period 1997-2005. The investment accelerated towards 2000 and had a peak in 2004 with over US$ 30 million. According to the same source, FDI was US$ 6.86 million in 2006 (Figure 5).
As mentioned above, a number of companies established in the country have begun to outsource some of their production in China. This policy is due, in some instances, to market research (or what might be called mar-ket-seeking FDI), while in other’s the reason lies primarily in the pursuit of efficiency gains or the capture of certain assets that are considered stra-tegic by the company. Beyond the motivations, several enterprises have tried to establish affiliates in China, although, presumably, there are few cases of manufacturing plants; and up to now the opening of trade repre-sentations is much more numerous. Among the firms that have been estab-lished in China, we can mention the following:
• The chemical company Atanor, formerly an Argentine company and today controlled by DA International, spent US$ 23 million to build a
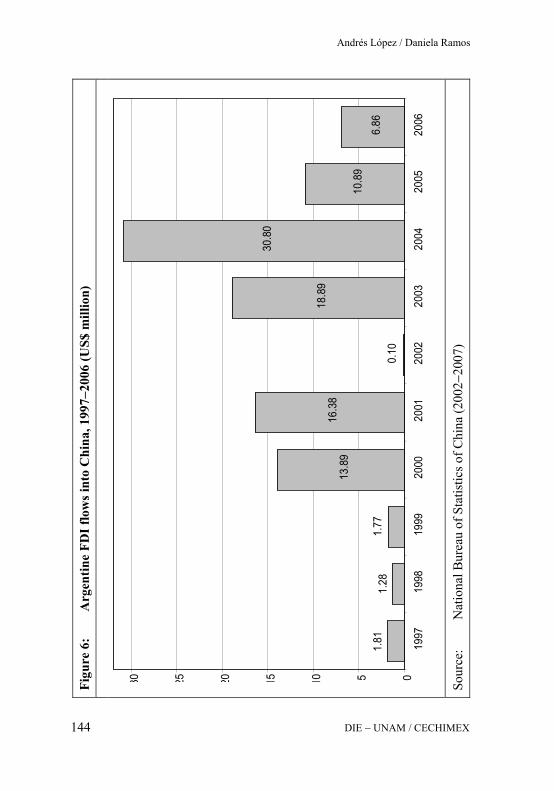
Figu
re 6
: A
rgen
tine
FDI f
low
s int
o C
hina
, 199
7−20
06 (U
S$ m
illio
n)
Sour
ce:
Nat
iona
l Bur
eau
of S
tatis
tics o
f Chi
na (2
002−
2007
)
1.81
1.28
1.77
13.8
916
.38
18.8
9
30.8
0
10.8
96.
860.
10051015202530
1997
1998
1999
2000
2001
2002
2003
2004
2005
2006
Andrés López / Daniela Ramos
DIE − UNAM / CECHIMEX 144

The Argentine Case
DIE − UNAM / CECHIMEX 145
large-scale chemical plant for the production of glyphosate in the province of Anhui, by means of an agreement with the Chinese Anhui Huaxing Chemical Industry Company. The total amount of the project is estimated at US$ 45 million. If this project is carried out it will be the largest investment from an Argentinean company in China and will employ more than 300 people. The next step of the project in-cludes the construction of a second herbicide production plant. The new company, named Anhui Xingnor Chemical, will be managed by a Chinese engineer trained in Atanor.
• The holding PGC (Pescarmona Group) bought the multinational com-pany GE Hydro (General Electric Hydro) in 2007. Through this ac-quisition, IMPSA will become the third world producer of hydroelec-tric turbines and will enter China, where GE Hydro has one of its big-gest production plants. This plant, located in the city of Hangzhou, has the most sophisticated standards of quality and technology in its class.41 PGC is an Argentine multinational company with a presence in business areas such as hydroelectric power generation and equip-ment, port systems, automobile parts, and control systems among oth-ers.
• The Argentine multinational Tenaris is building a local manufacturing facility of premium connections and couplings in Qingdao, China. The estimated annual production capacity of the plant is around 50,000 tons. Tenaris has been supplying seamless products for the Chinese market since 1990 and in 2003 established a service yard at Tanggu to provide supply chain and pipe management services to cus-tomers.
• The wine industry was one of the first sectors to invest on China. In 2003, a vineyard named San Huberto was established in Beijing to produce wine through an agreement with a Chinese company. Prior to
41 This company has been doing business with Asia in the hydroelectric turbine and gan-
try-crane sectors. The firm produces in Mendoza, Argentina and exports its products to Malaysia, where they are assembled and finished and then exported as an Asiatic prod-uct, which means they can obtain financing from the Asian Development Bank. The company lost the opportunity to sell turbines for the Three Gorges hydroelectric dam due to lack of financing (Argentina is not member of the Asian Development Bank).

Andrés López / Daniela Ramos
DIE − UNAM / CECHIMEX 146
this, in 2002, Norton vineyard built a winery to produce wine for the local market.42
• The holding SOCMA plans to settle in China with several real estate projects. One of these is the construction of a commercial centre in Beijing with a shopping mall and commercial offices. The objective of this project is to develop a kind of Argentine Centre in China simi-lar to those that other countries have recently built in China (e.g. the German Center) (La Nación, 21 Apr. 2007).
• A similar project is led by another Argentine holding, Eurnekian Group, which is analyzing the possibilities of setting up an office cen-ter in Shanghai to be used by technological firms (La Nación, 21 Apr. 2007). In addition, the firm is negotiating some other business related to genetics and biogenetics (e.g. the sale of genetically modified bo-vine embryos).
• The multinational food company Arcor has installed a sales office in China but has no production in that country. The company is facing problems with property rights in the Chinese market, particularly due to the counterfeiting of its products.
• The holding Bulgheroni, dedicated to oil businesses in Argentina, is aiming to close a deal in China to transport gas from Turkmenistan to Europe (Clarín, 6 May 2007).
2.3 China's impact on the integration of Argentina into global value chains
We have already seen that Argentine-Chinese bilateral investments have, up to now, been limited. This section briefly examines the issue of invest-ments from another angle: does Argentina compete directly with China in attracting investment from third countries?
Some recent studies have shown that China's rise, on average, has not affected the FDI received by Latin American countries so far (García-
42 The Chandon winery intended to penetrate the Chinese wine market but met with poor
results. Apparently the high quality niche is occupied by other countries, amongst them Chile (which has been working hard to improve the quality of its wines and to increase the scale of production in recent years), Spain and Portugal.
The Argentine Case
DIE − UNAM / CECHIMEX 147
Herrero / Santabarbara 2007; Eichengreen / Tong 2005). In the case of Argentina this is explained if one analyzes the type of FDI entering into the country from the 90s onwards, as seen below.
To address the issue, from our point of view it is necessary to differentiate FDI according to its objectives and the sectors in which it operates. A first category pertains to FDI in manufacturing industry. In the case of Argen-tina, the available evidence suggests that the bulk of investment came with the aim of taking advantage of the domestic market (Chudnovsky; López 2006). While in some sectors, efficiency-seeking FDI – in which multina-tional corporations seek to specialize its diverse subsidiaries with the ob-jective of generating gains in competitiveness through intra-corporation exchange – was also important, it was basically limited to the Mercado Común del Sur (MERCOSUR) area.
In other words, the FDI received by Argentina has been weakly integrated into global value chains shaped in recent decades mainly due to the boost of the big TNCs that dominate global markets in a large number of manu-facturing activities. This is related to the fact that the search for lower labor costs has not been a significant factor in attracting FDI to the indus-trial sector in the country, as well as the evidence which indicates that FDI has not been directed to labor-intensive sectors (Chudnovsky / López 2006).
This pattern contrasts sharply with that of FDI received by China. Al-though market-seeking FDI has also been important in this case, cost re-duction has been a significant motive as well, attracting investments to carry out certain stages of the manufacturing production processes – un-derstood in the broadest sense, from the design to marketing of respective goods – in which the availability of labor is critical for competitiveness.43
In fact, the FDI received by Argentina also contrasts, at this point, with that received in Mexico and the Caribbean Basin, where investments were mainly efficiency-seeking on a similar basis to the above mentioned case for China. In contrast, FDI in Argentina was relatively poorly articulated with GVC or internationally integrated systems of production. In contrast,
43 According to Gaulier / Lemoine / Ünal-Kesenci (2005) European and American FDI in
China is more linked to the aim of exploiting the country’s domestic market, while that of Asian origin is more associated with cost factors and to export objectives.
Andrés López / Daniela Ramos
DIE − UNAM / CECHIMEX 148
its dominant logic was national/regional. From this point of view, it seems natural to find that China has not diverted investment from Argentina.
If now we analyze the bulk of FDI in service sectors in the case of Argen-tina (which corresponds to privatized public services, banking and trade), competition between the two countries is not expected either, as motiva-tion has been almost solely centered around domestic markets in these cases.
In terms of FDI channeled to natural-resource intensive sectors – signifi-cant in Argentina in oil and mining, and in certain branches linked to the agricultural/agroindustrial complex – rather than competition, we could expect to some extent that China might have promoted increased FDI in Argentina in view of the need to seek resources to export to China. The available evidence does not allow us to evaluate the extent to which this effect may have been significant in practice, although one could certainly expect its importance to grow in the future, if recent trends continue.
Finally, there are a number of service activities, the importance of which has been growing in recent years pari passu their increased tradeability on an international scale, where certain competition with China may emerge. We refer to services associated with software and computing, but also to others in which Information and Communication Technologies (ICTs) facilitate the remote supply of different service activities (accounting, human resource management, finance, architecture and engineering de-sign, medicine, etc.). Here, truly global value chains have been created, and forecasts indicate that the international market will continue growing at very high rates in the coming years44, as has been happening recently.45 See López / Ramos / Torre (2008).
In principle, we may think that since these services can be entirely, or almost entirely, supplied long-distance, via the use of ICTs, all the inves-tors can virtually choose any location to export the service from, provided those locations have the required conditions to carry out said activity effi-
44 The offshoring of business services (BPO) alone was estimated at US$ 28 billion in
2008, according to a report from NASSCOM and Everest Research Institute (2008). That figure could triple by 2012 according to the same source.
45 Available estimates indicate that world service exports of around 1.5 billion dollars in 2000 increased to 2.4 billion dollars in 2005.
The Argentine Case
DIE − UNAM / CECHIMEX 149
ciently (which usually implies, among other factors, the availability of human resources with a certain level of skills at competitive costs, as well as physical infrastructure and appropriate technology).
In other words, while it is not usual to find Argentina competing directly with China in attracting investment in manufacturing, traditional services or natural resources, this may occur with greater intensity in the case of this type of export-oriented services. This possibility, of course, is not merely theoretical. Almost all international consultants who produce re-ports and analyses on the outsourcing and offshoring of service activities (McKinsey, AT. Kearney, Gartner, KPMG) develop comparative rankings in which they contrast the advantages and disadvantages of a large number of developing nations aiming to attract investment in these areas.46
Note also that these investments are much more mobile than those associ-ated with manufacturing, traditional services or natural resources, as indi-cated by the following quote:
“Companies running Shared Services Centres (SSCs)47 should regularly re-evaluate their location decisions. Therefore, it appears likely that pre-ferred off-shoring locations will change if relative cost advantages of ex-isting off-shore locations diminish and companies can achieve additional cost reductions by moving their SSCs to new, even cheaper locations.” (KPMG 2007, 4)
China – like India – has vast reserves of human resources48, making it an attractive location for businesses which require large amounts of labor. While this might suggest that the country focuses its service export activi-ties on segments of lower-complexity (where labor costs are the determi-
46 In one of these rankings, prepared by A.T. Kearney in 2007 taking into account factors
such as costs, human resources, business environment and others, China appeared in 2nd place, behind India, in contrast to Argentina that was in 23rd place.
47 Shared service centers are specialized units that work in the context of a particular transnational corporation dedicated to providing a range of services - accounting, finan-cial, human resources, information technology, customer relations, logistics, data man-agement, stock control and shopping, among others - to the corporation as a whole or for specific areas of the same company.
48 Just to mention one example, it is estimated that there were over 400 thousand engineer-ing graduates in China during 2005 (Wadhwa et al. 2007), although some of these re-sources have less training than their counterparts in countries such as Argentina.
Andrés López / Daniela Ramos
DIE − UNAM / CECHIMEX 150
nants of competitiveness), in fact the magnitude of human resources at its disposal, together with the existence of deliberate policies aimed at the development of local capabilities, also allow it to move forward in areas of greater complexity. Just to cite one example, China leads the ranking of preferred countries for offshoring R & D activities within the developing world, according to United Nations Conference on Trade and Develop-ment (UNCTAD) data (and it is third world-wide, after the US and Brit-ain). Argentina, like the rest of Latin America, practically does not appear in this ranking.
Therefore, China does pose a challenge for Argentina in this case, as well as for other countries that aspire to compete in these markets. Clearly, Argentina can not compete with China – or India, the main exporter in this type of services – based on labor costs, or in activities which require large amounts of human resources. At the moment, the potential attraction fac-tors of the country – in addition to the level of qualification of its human resources, a factor that is appreciated by foreign firms – lie in aspects such as time zone (which is relatively aligned with those of the United States and not many hours behind Western Europe, allowing a good control of suppliers by the companies of developed countries that have their services offshored), as well as on aspects related to the cultural proximity with developed countries vis-à-vis the nations of Asia. However, these advan-tages may be insufficient to position the country as an attractive location for FDI, not only in quantitative but also qualitative terms; i.e., to attract more investments that may be channeled in the country towards the devel-opment of high value-added activities.
Indeed, the challenge for Argentina in this area is not much different from the case of FDI in the manufacturing sector. In both cases it is a matter of achieving better insertion in the respective GVCs, which does not mean competing on the basis of labor costs, but offering differing assets and capabilities that allow the country to locate itself, in a stable way, in those chains (beyond the wage level), and obtain larger spillovers from the re-spective investments.

The Argentine Case
DIE − UNAM / CECHIMEX 151
Conclusions
China has become a key trading partner for Argentina; at present it is the country’s second destination for exports and the third source of imports. This position is the result of the rapid growth of bilateral trade flows, which were very low just two decades ago.
Nowadays China is a key partner not only for Argentina, but also for a large number of countries, both developed and developing. In other words, there is no evidence to suggest that Argentina became particularly signifi-cant for Chinese foreign trade – beyond a slight increase of the Argentine participation in Chinese imports – and the growing importance of bilateral trade is part of similar general trends observed elsewhere.
From the point of view of Argentina, however, trade with China has had considerable effects. Regarding exports, it is not apparently the case that China's emergence has had a direct impact on their growth, but mainly an indirect effect via price increases. In other words, Argentina’s exports to China are highly concentrated in the soybean complex and, to a much smaller extent, in a small group of primary and natural-resource intensive products, which are commodities that Argentina may also sell to other destinations. The positive effect of China, then, is primarily a result of the impact of Chinese demand on the prices of these commodities (and, by the way, it generates a benefit in terms of raising taxes on exports; almost 20% of withholding taxes originated directly from exports to China, but the total impact is probably greater due to the price effect).
However, Argentina is not taking advantage of the opportunities offered by China in other markets. Needless to say Argentina can not compete in China – and indeed in any other market – in low-skill labor-intensive ac-tivities. But Argentina could export goods to China in which the differen-tiation, the design or the availability of certain capabilities are an impor-tant competitive factor. Clearly, this is not easy insofar as the weak pres-ence of such assets is a more general problem of Argentina’s export pat-tern, and considering that exporting to China involves overcoming cul-tural, geographic and regulatory barriers which are certainly greater than those existing in other destinations.
In any case, it is important to emphasize the fact that opportunities exist. Note that only 5% of Argentine exports to China are manufactured goods,

Andrés López / Daniela Ramos
DIE − UNAM / CECHIMEX 152
not dependent on agricultural raw materials, while total Chinese imports rise to almost 80%.
Moreover, even within the group of primary exports, the articles Argentina sells to China have a low presence of the already mentioned "soft com-modities" (Kaplinsky 2006), i.e. products where, although the natural resource availability is key, differentiation is introduced and there are therefore barriers to entry, making competition go beyond price. As the author indicates, while per capita income in China continues to grow, it is expected that opportunities to sell differentiated products (primary and industrial) will grow strongly, and Argentina should be prepared to seize those opportunities.
The limited diversification of exports to China is replicated at the firm level. Just 20 companies account for almost 90% of sales to China, while at the level of Argentine total trade the proportion is 50%. In other words, up to now, there are very few Argentine companies which have been able to make significant inroads in the Chinese market.
If we now turn to imports coming from China, besides their great dyna-mism, their composition clearly shows the progressive enlargement of the areas in which China has become a major worldwide supplier. In just 10 years, Chinese imports went from being mainly consumer goods (60% of purchases in 1995) to having capital goods as its main item (more than 30% in 2007). This is evidence of the increased competitiveness of China in a range of industries where, while it still has the advantage of cheap labor, the mastery of certain technologies is also required.
On one hand, China has reduced the price of imports for Argentina as long as it remains a cheaper supplier than other trade partners; i.e., the positive effects of China on Argentinean terms of trade are present in imports as well as exports. However, there is also evidence to suggest that trade with China has been, on average, a destroyer of employment. This result is not surprising if one takes into account that: i) China has been gaining weight in Argentina’s imports at the expense of other countries and domestic production (especially in labor-intensive industries); ii) Argentine exports to China are concentrated in sectors with relatively little labor-intensity. Although the exercise from which this affirmation arises is a first approach that only considers the direct effects of trade with China; it is a warning of

The Argentine Case
DIE − UNAM / CECHIMEX 153
the more general problem of Argentina’s pattern of specialization and its employment content.
Moreover the trade surplus with China has tended to evaporate dramati-cally, after several years of significant positive balances. Although primar-ily motivated by sectoral pressures, the authorities’ reactions against the strong growth of Chinese imports has been, up to now, directed to protec-tionist measures, both commercial and technical.
In contrast with events at the trade front, relations between Argentina and China in terms of investment are very small so far. Argentine investments in China are marginal, and while Argentina presents investment opportuni-ties in areas of Chinese interest (access to natural resources and exploita-tion of the potential domestic market), a limited number of projects have materialized so far. At present we are a long way from the US$ 20 billion of Chinese investment in the country expected a few years ago.
Meanwhile, although Argentina does not usually compete with China in terms of attracting FDI from third countries in manufactures or natural resources (and it is even possible to expect a positive effect in terms of attracting Chinese FDI to Argentina with the aim of exporting natural resource intensive goods), a more direct competition exists in tradable services. International markets for these services have been growing at very rapid rates, and this is largely the result of offshoring processes led by TNCs that dominate these markets.
Given that investments in services are more footloose than in the case of manufacturing or natural resources, and exports are less dependent on geographical distance, in many cases these countries virtually compete against the rest of the world for the attraction of FDI. China is a formida-ble competitor in this context, since it relies on vast amounts of labor that enable the country to develop not only low value-added activities, but also others with greater technological complexity, including R&D activities.
Moreover, it is expected that China (like other East Asian countries in the past) will continue to climb up the industrial and services global value chains towards activities in which labor costs would not be the only impor-tant factor. In this context, the question that Argentina faces, as along with many other countries, is: what is its place in a world where the expansion of the Chinese development process seems inevitable?
Andrés López / Daniela Ramos
DIE − UNAM / CECHIMEX 154
The answer to this question is in fact beyond issues specifically related to trade with China, as it raises the question of the Argentine specialization pattern and the need to reduce its degree of "commoditization”, for macro-economic and structural reasons as well.
This paper has not addressed the first of these issues, but certainly an im-portant part of the recent dynamism of several Latin American countries, including Argentina, is associated with the increased demand from China and India for food and raw materials. This fact is welcome, but as experi-ence teaches us, growth processes that are heavily dependent on external circumstances which can be reversed are subject to strong fluctuations and crises. The current crisis clearly shows the perils involved in said strategy. Accordingly, the sustainability of the growth process requires reducing this dependency through the diversification of the export pattern.
From the structural point of view, there are issues that have to do with the negative impact on domestic production and employment arising from Chinese competition, as well as with the missed opportunities to export higher value-added goods to China.
In the first case, it is clearly necessary to move from a "defensive" protec-tionist approach to an "offensive" one, seeking to convert the affected industries into niches where competition with China is less intense. In the second, we need policies that attempt to find segments in which Argentina may compete, based on differentiation or specific skills, in the manufactur-ing and services global value chains. In the future, then, the public policy agenda should probably pay more attention to these issues in order to improve the cost-benefit balance of trade with China and increase the degree of sustainability of the development prospects of Argentina in a world which is much more competitive than at any other time in the mod-ern era.
The Argentine Case
DIE − UNAM / CECHIMEX 155
Bibliography
abeceb.com (2007): Informe Económico Semanal, Buenos Aires, 19 Jan. 2007 Ancochea, D. S. (2007): El impacto de China en América Latina: ¿oportunidad o
amenaza? Málaga: Observatorio de la Economía y la Sociedad de China 1 Blázquez-Lidoy, J. / J. Rodríguez / J. Santiso (2006): ¿Ángel o demonio? Los
efectos del comercio chino en los países de América Latina, in: Revista de la CEPAL 90, 17–43
Bloch, H. / D. Sapsford (2000): Whither the terms of trade? An elaboration of the Prebisch-Singer hypothesis, in: Cambridge Journal of Economics 24, 461–481
Cardozo, G. (2007): China y Argentina en la política bilateral, 1989–2006, in: Observatorio de la Economía y la Sociedad de China 1
CASRECH (Cámara de Autoservicios y Supermercados de Residentes Chinos) (2007): Autoservicios chinos: planes de cambio, in CASRECH 10, 74–75
CEP (Centro de Estudios para Producción) (2006): Comercio bilateral Argentina-China 2005, Buenos Aires
Cesarín, S. (2007): China se avecina: el Ying y el Yang de una potencia emergente, Buenos Aires: Capital Intelectual
Chantasasawat, B. et al. (2004): FDI flows to Latin America, East and Southeast Asia and China: substitutes or complements?: presentation at the Latin Amer-ica/Caribbean and Asia/Pacific Economics and Business Association (LAEBA) Annual Conference: The Emergence of China: Challenges and Opportunities for Latin America and Asia, 3–4 December, Beijing
Chudnovsky, D. / A. López (2006): Inversión extranjera directa y desarrollo: la experiencia del MERCOSUR, in: J. Berlinski et al. (ed.), 15 Años del Mercosur: comercio, macroeconomía e inversiones extranjeras, Montevideo: Red Mercosur Investigaciones Económicas
Clarin. Archives (2007): online: www.clarin.com.ar Comini, N. (2006): Síntesis de actualidad económica y empresarial Argentina-Asia
Pacífico, in: Boletín electrónico / Observatorio Iberoamericano de Asia-Pacífico 1, 1−6
− (2007): Síntesis de actualidad económia y empresarial Argentina-Asia Pacífico, in: Bolétin electrónico / Observatorio Iberoamericano de Asia-Pacífico 4, 1−9
CRI (China Radio International) (2007): online: www.crionline.com Dougherly, S. (2008): Making sense of innovation and growth, Paris: Organisation
for Economic Cooperation and Development, (OECD Observer 264/265)

Andrés López / Daniela Ramos
DIE − UNAM / CECHIMEX 156
Eichengreen, B. / H. Tong (2005): Is China's FDI coming at the expense of other countries?, Tokyo: National Bureau of Economic Research (NBER Working Paper 11335)
EIU (Economist Intelligence Unit) / CPII ( Columbia Program on International Investment) (2006): World investment prospects to 2010: boom or backlash?, New York
Facchini G. et al. (2007): Substitutability and protectionism: Latin America's trade policy and imports from China and India, Kiel: Christian-Albrechts-University (Economics working paper 2007−08)
Galperín, C. / G. Girado / E. Rodrίguez Diez (2004): Implications of China´s emergence in the global economy for Latin America: the case of Argentina, Washington, DC: Inter-American Development Bank
García-Herrero, A. / D. Santabarbara (2007): Does China have an impact on foreign direct investment to Latin America?, in: China Economic Review 18 (3), 266–286
Gatto, F. (2007): Exportaciones PYMES post-crisis: elementos para la discusión de los objetivos de las políticas públicas, Buenos Aires, in: Desarrollo PYME 1, 40–51
Gaulier, G. / F. Lemoine / D. Ünal-Kesenci (2005): China's integration in East Asia: production sharing FDI & High-Tech Trade, Paris: CEPII
Hemerling, J. / D. Michael / H. Michaelis (2006): China's global challengers: the strategic implications of Chinese outbound M&A, Boston, Mass.: Boston Consulting Group
Hexter, J. / J. R. Woetzel (2007): Bringing best practice to China, in: The McKinsey Quarterly, Nov. 2007
Jenkins, R. / E. Dussel Peters (2006): The impact of China on Latin America and the Caribbean, Brighton: DFID China Office
Jenkins, R. / K. Sen (2006): International trade and manufacturing employment in the South: four country case-studies, in: Oxford Development Studies 34 (3), 299–322
Kaplinsky, R. (2006): Revisiting the revisited terms of trade: will China make a difference?, in: World Development 34 (6), 981–995
KPMG (2007): Managing performance through shared services centers: white paper, Zurich: KPMG, Institut für Accounting, Controlling und Auditing of University St. Gallen
La Nación (s. a.): Archives; online: www.lanacion.com.ar López, A. / D. Ramos / I. Torre (2008): Las exportaciones de servicios de Amércia
Latina y su integración en las cadenas globales de valor, Santiago de Chile: Comisión Económica para América Latina y el Caribe, mimeo

The Argentine Case
DIE − UNAM / CECHIMEX 157
Malik, M. (2006): China´s growing involvement in Latin America, Chicago, Ill.: Power and Interest News Record
McKinsey & Company (2008): Competition from China: two McKinsey Surveys, in: The Mc Kinsey Quarterly, May 2008
Mesquita Moreira, M. (2006): Fear for China: is there a future for manufacturing in Latin America?, Washington, DC: INTAL-ITD (Occasional Paper 36)
MOFCOM (Ministerio de Comercio de la República Popular) (2007): Statistical Bulletin of China’s outward foreign direct investment, Beijing
NASSCOM / Everest Research Institute (2008): Roadmap 2012: capitalizing on the expanding BPO Landscape, s. l.
National Bureau of Statistics of China (2002–2007): Chinese Statistical Year-books, Beijing
OECD (Organisation for Economic Cooperation and Development) (2007): Made in China: is the game changing? Paris (Ask the economists)
Oliva, C. (2005): Inversiones en América Latina: la inserción regional de China: China y América Latina, in: S. Cesarin / C. Moneta (ed.), China y América Latina: nuevos enfoques sobre cooperación y desarrollo: ¿una segunda ruta de la seda?, Buenos Aires: BID-INTAL
People´s Daily (2007): online: http://english.peopledaily.com.cn/data/organs/npc. shtml
Pitsilis, E. / J. Woetzel / J. Wong (2004): Checking China's vital signs, in: McKinsey Quarterly, Dec. 2004
Rebizo, M. M. / A. Ibañez (2005): Protección de la industria sojera en la República China, Buenos Aires: Instituto para las Negociaciones Agrícolas Internacionales
Rozemberg, R. (2006): La relación comercial y de inversiones Argentina-China, Buenos Aires, mimeo
Santiso, J. (2006): El triángulo China, España y América Latina, in: Perspectivas 27 UNCTAD (United Nations Conference on Trade and Development (2003–2008):
World Investment Reports, Geneva Wadhwa, V. et al. (2007): Where the engineers are, Durham, NC: Duke University,
The Global Engineering and Entrepreneurship Xinhuanet (2007): online: http://www.spanish.xinhuanet.com/spanish/2007-03/21/
content_404092.htm


The Brazilian Case
Daniel Saslavsky / Ricardo Rozemberg

The Brazilian Case
DIE − UNAM / CECHIMEX 161
Contents
Introduction 165
1 Trade links between China and Brazil 165
1.1 Brazilian exports to China 170
1.2 Brazilian imports from China 183
2 Effects of trade with China 189
2.1 Terms of trade 189
2.2 Employment effects 191
2.3 Government revenue 196
3 Competition in third markets 198
4 Trade barriers and other trade costs 201
4.1 Antidumping and safeguard measures adopted by Brazil 201
4.2 Import licensing 205
4.3 Bilateral agreements on other trade-restricting measures 206
4.4 Transport costs 208
5 FDI flows between Brazil and China 212
5.1 China and FDI inflows in Brazil 212
5.2 Brazilian investments in China 220
Conclusions 223
Bibliography 225

Daniel Saslavsky / Ricardo Rozemberg
162 DIE − UNAM / CECHIMEX
Figures
Figure 1: Brazil’s trade balance with China (000 US$) 167
Figure 2: Distance to the „market“ exports basket 183
Figure 3: Brazilian terms of trade and price indexes 190
Figure 4: Brazilian antidumping and other measures adopted against China 202
Figure 5: Share of total AD investigations against China, initiated by Brazil: 1995–2007 203
Figure 6: Freight costs (adjusted for distance and weight) 209
Figure 7: Freight cost adjusted by distance (adjusted by km) 210
Figure 8: Freight costs between China and Brazil: Soybeans and iron, 2004–2008 211
Figure 9: FDI inflows to emerging economies, world 1970–2007 213
Tables
Table 1: Growth rates of Brazilian exports and imports by destination, 1975–2007 168
Table 2: China as a trading partner for Brazil 169
Table 3: China’s contribution to Brazil’s total export growth 170
Table 4: Brazilian exporting companies to China 171
Table 5: Brazil’s exports: Composition by sector 173
Table 6: Bilateral trade by category (US$million), 1997–2006 175
Table 7: Brazil’s top exports to the world by product, 2001–2006 176
Table 8: Brazil’s top exports to China by product, 2001–2006 177
Table 9: Top products exported to China by share in overall exports (2006) 178
The Brazilian Case
DIE − UNAM / CECHIMEX 163
Table 10: Selected top Brazilian exporters to China, 2007 181
Table 11: Brazil’s imports from the world and China by economic use of goods 184
Table 12: China’s contribution to Brazil’s total import growth 185
Table 13: China’s share in Brazil’s imports by sector and economic use of goods 186
Table 14: Brazil’s top imports from the world by product, 2001–2006 187
Table 15: Brazil’s top imports from China by product, 2001–2006 188
Table 16: Impact of trade with China on Brazilian employment, 1998–2005 193
Table 17: Competition with China in third markets: EU-27, 2001–2007 (%) 199
Table 18: Competition with China in third markets: USA, 2001–2007 (%) 200
Table 19: Distribution of AD investigations against China by sector (% of total) 204
Table 20: Brazil – Total FDI inflows by investor country (US$ million), 1990–2008 214
Table 21: Chinese investment project announcements in Brazil, 2004–2007 218
Table 22: Non metal-industry investment announcements in Brazil, by sector and type of investment, 2004–2007 220
Table 23: Brazilian outward FDI stock, 2001–2006 221


The Brazilian Case
DIE − UNAM / CECHIMEX 165
The Brazilian Case
Daniel Saslavsky / Ricardo Rozemberg
Introduction
Since the emergence of China as a major player in world trade and in-vestment, there is much interest in how its irruption would impact on the developing economies. As part of that interest, this chapter focuses on the impact of China’s emergence on Brazilian trade and investment flows.
The chapter is divided into six sections. The first section describes the trade links between both economies, in order to measure the growing im-portance of China for Brazilian exports and imports. The second section focuses on the impact of China on Brazilian terms of trade and job crea-tion. The third section applies a constant market share methodology in order to examine the degree of competition between Brazilian and Chinese goods in third markets. The fourth section focuses on trade costs stemming from bilateral flows and the adoption of other restrictive measures – such as antidumping or safeguards – that affect free flows of trade. In this chap-ter, we also provide an estimation of trade costs using tariff line data for freight payments. In addition, we include a brief description of all bilateral agreements and trade-restricting measures that have been adopted. The fifth section includes a description of bilateral FDI flows and announced investment projects in both countries. The final section presents the con-clusions.
1 Trade links between China and Brazil The emergence of China as a global player has been one of the most sali-ent economic features of the last 25 years. Starting with a steep reform process in 1978, China gradually opened up to trade and investment flows, and has experienced unprecedented growth rates since then. Among other things, China’s accession to the World Trade Organization (WTO) in 2001 reinforced that process, by locking in binding agreements with fellow members and opening further to international trade and foreign invest-ment.
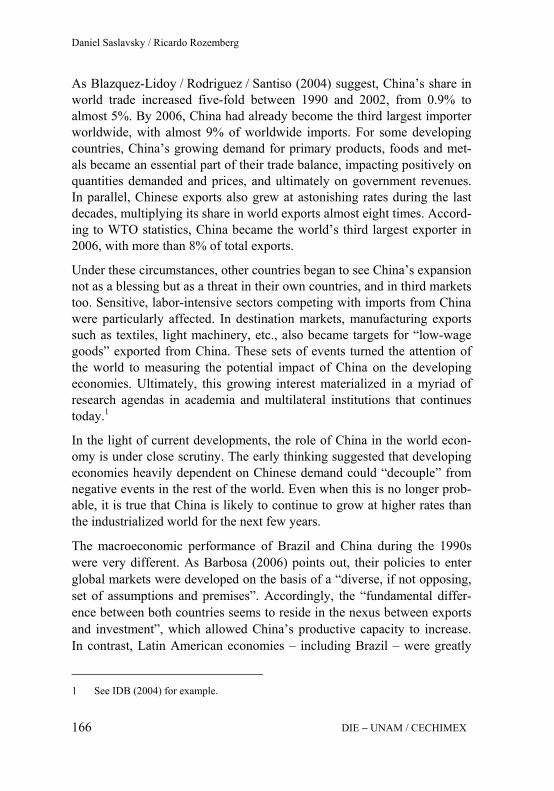
Daniel Saslavsky / Ricardo Rozemberg
DIE − UNAM / CECHIMEX 166
As Blazquez-Lidoy / Rodriguez / Santiso (2004) suggest, China’s share in world trade increased five-fold between 1990 and 2002, from 0.9% to almost 5%. By 2006, China had already become the third largest importer worldwide, with almost 9% of worldwide imports. For some developing countries, China’s growing demand for primary products, foods and met-als became an essential part of their trade balance, impacting positively on quantities demanded and prices, and ultimately on government revenues. In parallel, Chinese exports also grew at astonishing rates during the last decades, multiplying its share in world exports almost eight times. Accord-ing to WTO statistics, China became the world’s third largest exporter in 2006, with more than 8% of total exports.
Under these circumstances, other countries began to see China’s expansion not as a blessing but as a threat in their own countries, and in third markets too. Sensitive, labor-intensive sectors competing with imports from China were particularly affected. In destination markets, manufacturing exports such as textiles, light machinery, etc., also became targets for “low-wage goods” exported from China. These sets of events turned the attention of the world to measuring the potential impact of China on the developing economies. Ultimately, this growing interest materialized in a myriad of research agendas in academia and multilateral institutions that continues today.1
In the light of current developments, the role of China in the world econ-omy is under close scrutiny. The early thinking suggested that developing economies heavily dependent on Chinese demand could “decouple” from negative events in the rest of the world. Even when this is no longer prob-able, it is true that China is likely to continue to grow at higher rates than the industrialized world for the next few years.
The macroeconomic performance of Brazil and China during the 1990s were very different. As Barbosa (2006) points out, their policies to enter global markets were developed on the basis of a “diverse, if not opposing, set of assumptions and premises”. Accordingly, the “fundamental differ-ence between both countries seems to reside in the nexus between exports and investment”, which allowed China’s productive capacity to increase. In contrast, Latin American economies – including Brazil – were greatly
1 See IDB (2004) for example.

The Brazilian Case
DIE − UNAM / CECHIMEX 167
affected by exchange rate volatility and sudden stops in capital inflows during the period, impacting negatively on economic growth.
Historically, trade links between China and Latin American countries have been rather weak. However, during the last twenty years, Brazilian exports to China rose from less than US$1,000 million in 1985 to more than US$10,000 million in 2007. In the same period, imports increased from barely US$500 million to over US$12,000 million.
As shown in Figure 1, China’s recent surge in international markets had a great impact on Brazil’s external sector. Trade between both countries was limited until the mid-1990s when exports to China remained under US$1,000 million. After that, Brazilian exports to the Asian country began to expand considerably, reaching almost US$2,000 million in 2001. A path-breaking trend emerged in the last six years, causing external sales to the Chinese market to increase more than four-fold to over US$10,000 mil-lion.
Figure 1: Brazil’s trade balance with China (000 US$)
Source: Based on COMTRADE data
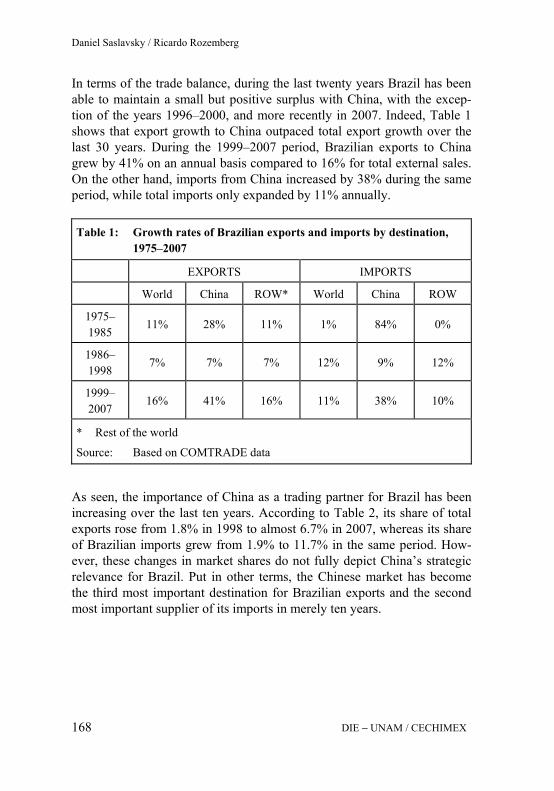
Daniel Saslavsky / Ricardo Rozemberg
DIE − UNAM / CECHIMEX 168
In terms of the trade balance, during the last twenty years Brazil has been able to maintain a small but positive surplus with China, with the excep-tion of the years 1996–2000, and more recently in 2007. Indeed, Table 1 shows that export growth to China outpaced total export growth over the last 30 years. During the 1999–2007 period, Brazilian exports to China grew by 41% on an annual basis compared to 16% for total external sales. On the other hand, imports from China increased by 38% during the same period, while total imports only expanded by 11% annually.
Table 1: Growth rates of Brazilian exports and imports by destination, 1975–2007
EXPORTS IMPORTS
World China ROW* World China ROW
1975–1985
11% 28% 11% 1% 84% 0%
1986–1998
7% 7% 7% 12% 9% 12%
1999–2007
16% 41% 16% 11% 38% 10%
* Rest of the world
Source: Based on COMTRADE data
As seen, the importance of China as a trading partner for Brazil has been increasing over the last ten years. According to Table 2, its share of total exports rose from 1.8% in 1998 to almost 6.7% in 2007, whereas its share of Brazilian imports grew from 1.9% to 11.7% in the same period. How-ever, these changes in market shares do not fully depict China’s strategic relevance for Brazil. Put in other terms, the Chinese market has become the third most important destination for Brazilian exports and the second most important supplier of its imports in merely ten years.

The Brazilian Case
DIE − UNAM / CECHIMEX 169
Table 2: China as a trading partner for Brazil
Exports to China Imports from China
Share of total exports
Position as destination (ranking)
Share of total imports
Position as supplier (ranking)
1998 1.8% 14 1.9% 12
1999 1.4% 15 1.9% 14
2000 2.0% 12 2.2% 11
2001 3.3% 6 2.4% 9
2002 4.2% 4 3.4% 7
2003 6.2% 3 4.7% 5
2004 5.7% 4 6.3% 4
2005 5.8% 3 7.8% 4
2006 6.1% 3 9.6% 3
2007 6.7% 3 11.7% 2
Source: Based on COMTRADE data
China’s growing importance in total trade flows was not an isolated phe-nomenon in an increasingly globalized economy. In turn, the last ten years witnessed an outstanding expansion of world trade and Foreign Direct Investment (FDI) flows. As shown, during the 1999–2007 period, Brazil-ian exports to the world increased by 237%, or by US$112,000 million. Accounting for China’s contribution to the growth of Brazilian exports between 1999 and 2007, we conclude that almost 10%, or US$10,000 million, of this increase comes from the Asian partner’s expansion.
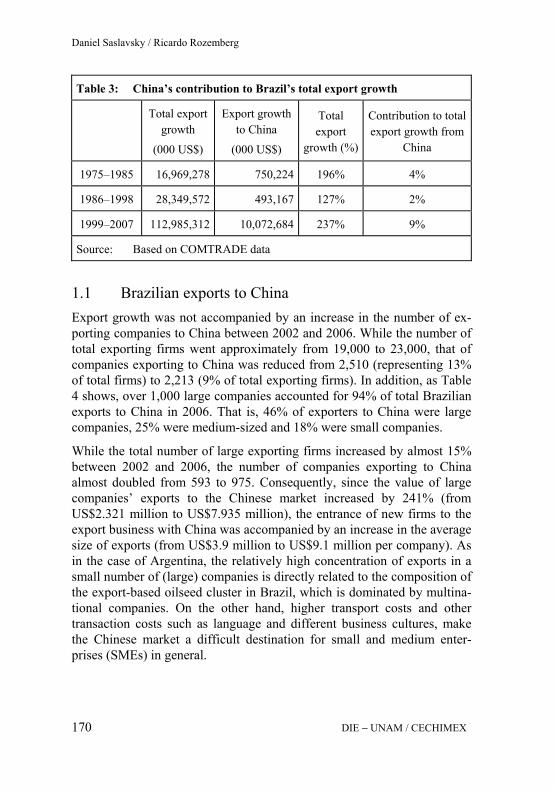
Daniel Saslavsky / Ricardo Rozemberg
DIE − UNAM / CECHIMEX 170
Table 3: China’s contribution to Brazil’s total export growth
Total export
growth
(000 US$)
Export growth to China
(000 US$)
Total export
growth (%)
Contribution to total export growth from
China
1975–1985 16,969,278 750,224 196% 4%
1986–1998 28,349,572 493,167 127% 2%
1999–2007 112,985,312 10,072,684 237% 9%
Source: Based on COMTRADE data
1.1 Brazilian exports to China Export growth was not accompanied by an increase in the number of ex-porting companies to China between 2002 and 2006. While the number of total exporting firms went approximately from 19,000 to 23,000, that of companies exporting to China was reduced from 2,510 (representing 13% of total firms) to 2,213 (9% of total exporting firms). In addition, as Table 4 shows, over 1,000 large companies accounted for 94% of total Brazilian exports to China in 2006. That is, 46% of exporters to China were large companies, 25% were medium-sized and 18% were small companies.
While the total number of large exporting firms increased by almost 15% between 2002 and 2006, the number of companies exporting to China almost doubled from 593 to 975. Consequently, since the value of large companies’ exports to the Chinese market increased by 241% (from US$2.321 million to US$7.935 million), the entrance of new firms to the export business with China was accompanied by an increase in the average size of exports (from US$3.9 million to US$9.1 million per company). As in the case of Argentina, the relatively high concentration of exports in a small number of (large) companies is directly related to the composition of the export-based oilseed cluster in Brazil, which is dominated by multina-tional companies. On the other hand, higher transport costs and other transaction costs such as language and different business cultures, make the Chinese market a difficult destination for small and medium enter-prises (SMEs) in general.
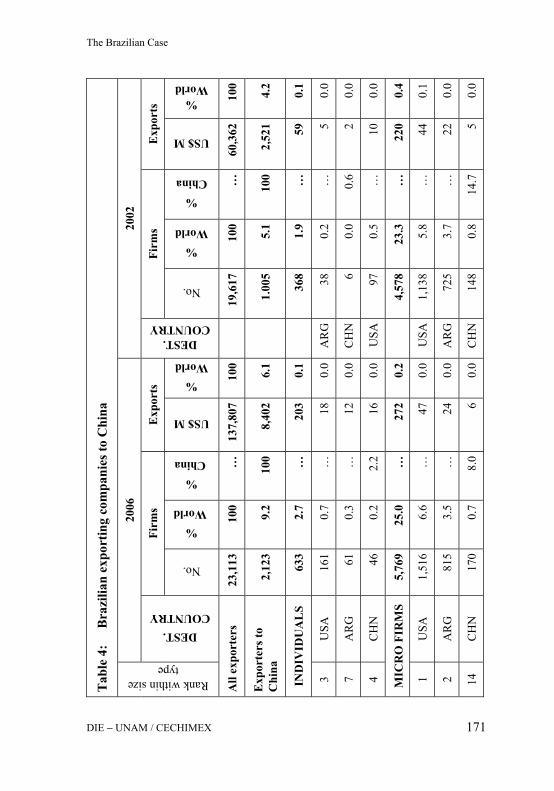
Tab
le 4
:
Bra
zilia
n ex
port
ing
com
pani
es to
Chi
na
2006
20
02
Firm
s E
xpor
ts
Firm
s E
xpor
ts
Rank within size type
DEST. COUNTRY
No.
% World
% China
US$ M
% World
DEST. COUNTRY
No.
% World
% China
US$ M
% World
All
expo
rter
s 23
,113
10
0 …
13
7,80
710
019
,617
100
…
60,3
62
100
Exp
orte
rs to
C
hina
2,
123
9.2
100
8,40
26.
11.
005
5.1
100
2,52
1 4.
2
IND
IVID
UA
LS
633
2.7
…
203
0.1
368
1.9
…
59
0.1
3 U
SA
161
0.7
…
180.
0A
RG
380.
2…
5
0.0
7 A
RG
61
0.
3 …
12
0.0
CH
N6
0.0
0.6
2 0.
0
4 C
HN
46
0.
2 2.
2 16
0.0
USA
970.
5…
10
0.
0
MIC
RO
FIR
MS
5,76
9 25
.0
…
272
0.2
4,57
823
.3…
22
0 0.
4
1 U
SA
1,51
6 6.
6 …
47
0.0
USA
1,13
85.
8…
44
0.
1
2 A
RG
81
5 3.
5 …
24
0.0
AR
G72
53.
7…
22
0.
0
14
CH
N
170
0.7
8.0
60.
0C
HN
148
0.8
14.7
5
0.0
The Brazilian Case
DIE − UNAM / CECHIMEX 171

Tab
le 4
(con
t.):
B
razi
lian
expo
rtin
g co
mpa
nies
to C
hina
SMA
LL
FIR
MS
6,02
3 26
.1
…
2,11
51.
54,
836
24.7
…
1,16
6 1.
9
1 U
SA
1,88
5 8.
2 …
47
10.
3U
SA1,
399
7.1
…
280
0.5
2 A
RG
1,
429
6.2
…
162
0.1
AR
G66
23.
4…
49
0.
1
3 C
HN
38
8 1.
7 18
.3
980.
1C
HN
258
1.3
25.6
37
0.
1
MED
IUM
FIR
MS
5,90
8 25
.6
…
9,25
46.
75,
695
29.0
…
4,65
5 7.
7
1 U
SA
2,24
4 9.
7 …
2,
208
1.6
USA
1,96
510
.0…
1,
213
2.0
2 A
RG
2,
137
9.2
…
848
0.6
AR
G1,
340
6.8
…
284
0.5
5 C
HN
54
4 2.
4 25
.6
347
0.3
CH
N39
82.
039
.6
156
0.3
LA
RG
E F
IRM
S 4,
780
20.7
…
12
5,96
391
.44,
140
21.1
…
54,3
14
90.0
1 U
SA
2,39
1 10
.3
…
21,7
8115
.8U
SA2,
038
10.4
…
13,8
13
22.9
2 A
RG
2,
142
9.3
…
10,6
927.
8C
HN
593
3.0
…
2,32
1 3.
8
3 C
HN
97
5 4.
2 45
.9
7,93
55.
8A
RG
1,70
08.
759
.0
1,99
3 3.
3
Not
e:
Mic
rofir
ms
are
thos
e w
ith a
t mos
t 10
(5) e
mpl
oyee
s an
d a
max
imum
of
400
(200
) tho
usan
d U
S$ w
orth
of
expo
rts f
or m
anuf
actu
ring
(com
mer
ce a
nd s
ervi
ces)
sec
tor.
Smal
l firm
s ha
ve a
t mos
t 11–
40 (6
–30)
em
ploy
ees
and
a m
axim
um o
f US$
3.5
(1.5
) mill
ion
wor
th o
f ex
ports
for m
anuf
actu
ring
(com
mer
ce a
nd se
rvic
es).
Med
ium
firm
s hav
e at
mos
t 41–
200
(31–
80) e
mpl
oyee
s and
a m
axim
um o
f US$
20
(7)
mill
ion
wor
th o
f ex
ports
for
man
ufac
turin
g (c
omm
erce
and
ser
vice
s). L
arge
firm
s ha
ve m
ore
than
200
(80
) em
ploy
ees
and
mor
e th
an U
S$ 2
0 (7
) mill
ion
wor
th o
f exp
orts
for m
anuf
actu
ring
(com
mer
ce a
nd se
rvic
es).
http
://w
ww
.des
envo
lvim
ento
.gov
.br/a
rqui
vos/
dwnl
_119
7919
311.
Sour
ce:
Bas
ed o
n SE
CEX
dat
a
Daniel Saslavsky / Ricardo Rozemberg
DIE − UNAM / CECHIMEX 172

Tab
le 5
: B
razi
l’s e
xpor
ts: C
ompo
sitio
n by
sect
or
Wor
ld
Chi
na
2000
20
07
2000
20
07
U
S$ m
il-lio
n
%
US$
m
illio
n %
U
S$ M
%
Sh
are
in
sect
or
US$
M
%
Shar
e in
Se
ctor
Food
and
bev
er-
ages
10
,167
18
%
34,5
99
22%
37
7 35
%
4%
3,25
1 30
%
9%
Indu
stria
l sup
-pl
ies
22,8
17
41%
63
,809
40
%
575
53%
3%
6,
212
58%
10
%
Fuel
s 86
6 2%
13
,199
8%
36
3%
4%
84
0 8%
6%
Cap
ital g
oods
5,
733
10%
15
,768
10
%
42
4%
1%
230
2%
1%
Tran
spor
t equ
ip-
men
t and
par
ts 10
,116
18
%
22,8
71
14%
50
5%
0%
19
3 2%
1%
Oth
er c
onsu
mp-
tion
good
s 4,
344
8%
6,96
5 4%
4
0%
0%
12
0%
0%
Oth
er g
oods
1,
076
2%
3,43
8 2%
0
0%
0%
10
0%
0%
Tota
l 55
,119
10
0%
160,
649
100%
1,
085
100%
2%
10
,749
10
0%
7%
Sour
ce:
Bas
ed o
n C
OM
TRA
DE
data
The Brazilian Case
DIE − UNAM / CECHIMEX 173

Daniel Saslavsky / Ricardo Rozemberg
DIE − UNAM / CECHIMEX 174
However, is Brazil as important to China as China is to Brazil? In contrast to the strategic importance of the Chinese market for the Brazilian econ-omy, Brazil is not a significant partner for China. According to our own calculations based on UN COMTRADE, exports to Brazil represent less than 1% of total Chinese exports since the late 1980s, while Brazil’s share of Chinese imports only exceeded that value in recent years.2
In terms of Brazil’s exports by sector to China, two main features arise: first, they are based on natural resources and raw materials, particularly in the metal mining, food and fuel sectors. Second, as mentioned, they are concentrated in a few products with a low level of processing. As seen in Table 5, Brazil’s export bias towards natural resource-based products is even greater in the case of China: while the shares of food and industrial supplies in Brazil’s exports to the world add up to 22% and 40% in 2007, those percentages rise to 30% and 58% for exports directed towards China.
It is noteworthy that the Sino-Brazilian bilateral trade resembles a North-South type of trade pattern, even though some still regard China as a Southern country. According to the bilateral trade balance shown in Table 6, Brazil was able to overturn its trade deficit with China, thanks to metals and other inedible crude material exports that increased from US$318 million in 1997 to US$5,681 million in 2006. From another perspective, manufactured goods and machinery imports from China also grew at out-standing rates, from US$138 million and US$382 million to US$1,037 million and US$4,337 million respectively. Indeed, this huge import surge in manufactures is the main culprit in Brazil’s negative trade balance by sector with the Asian country. Consequently, the bilateral trade pattern between these two countries is as much a “North-South” type as that with any other industrialized economy.
More recently, a relatively small basket of products has greatly contributed to the growth of Brazilian exports during the 2001–2006 period, when total exports increased from US$57,000 million to US$135,000 million. As seen in Table 7, a large increase in exports was explained by oil (from US$720 million to US$6,900 million), soybeans (from US$2,725 million to US$5.663 million) and iron ore (from US$1,916 million to US$5,750 million). These products are part of the top five list of goods exported to
2 See Puga (2004) for a more detailed explanation.
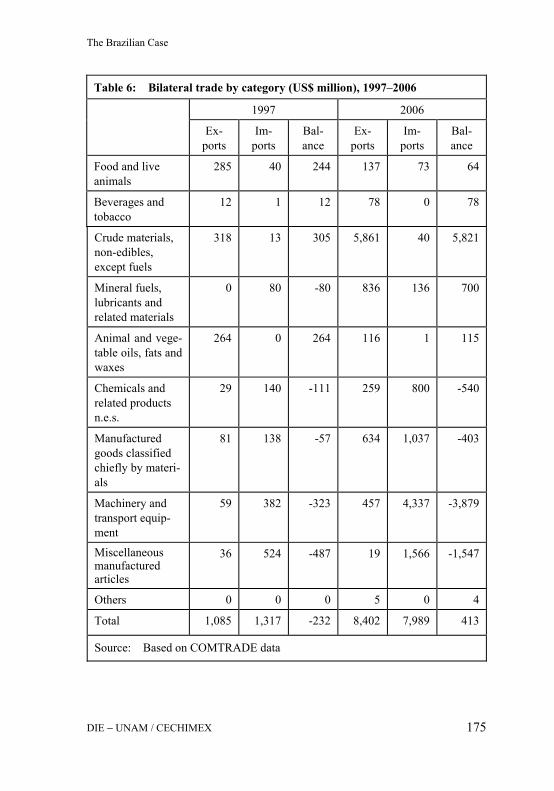
The Brazilian Case
DIE − UNAM / CECHIMEX 175
Table 6: Bilateral trade by category (US$ million), 1997–2006
1997 2006
Ex-ports
Im-ports
Bal-ance
Ex-ports
Im-ports
Bal-ance
Food and live animals
285 40 244 137 73 64
Beverages and tobacco
12 1 12 78 0 78
Crude materials, non-edibles, except fuels
318 13 305 5,861 40 5,821
Mineral fuels, lubricants and related materials
0 80 -80 836 136 700
Animal and vege-table oils, fats and waxes
264 0 264 116 1 115
Chemicals and related products n.e.s.
29 140 -111 259 800 -540
Manufactured goods classified chiefly by materi-als
81 138 -57 634 1,037 -403
Machinery and transport equip-ment
59 382 -323 457 4,337 -3,879
Miscellaneous manufactured articles
36 524 -487 19 1,566 -1,547
Others 0 0 0 5 0 4
Total 1,085 1,317 -232 8,402 7,989 413
Source: Based on COMTRADE data

Daniel Saslavsky / Ricardo Rozemberg
DIE − UNAM / CECHIMEX 176
Table 7: Brazil’s top exports to the world by product, 2001–2006
2001 2006 Prod-uct SITC
Description Exports (000 US$)
Prod-uct SITC
Description Exports (000 US$)
7923 Airplanes & other aircraft 2,808,453 3330 Crude oil 6,894,527
2222 Soybeans 2,725,507 2815
Iron ores & concentrates, not agglomer-ated
5,750,495
08131 Oilcake & other solid residues of oil from soybeans
2,065,192 2222 Soybeans 5,663,424
7812 Motor vehicles for the transport of persons, n.e.s.
1,951,380 7812
Motor vehicles for the transport of persons, n.e.s.
4,597,283
2815 Iron ores & con-centrates, not agglomerated
1,916,898 06111
Cane sugar, raw, in solid form, not con-taining added flavor-ing/coloring matter
3,935,802
Total top five 11,467,430
Total top five 26,841,531
Total exports 57,098,433
Total exports 135,188,344
As % of total 20%
As % of total 20%
Source: Based on COMTRADE data
the world which accounted for almost 20% of total exports between 2001 and 2006. However, other important products are present too in this export basket; these are automobiles, oilcakes and residues from soybeans, and sugar cane.

The Brazilian Case
DIE − UNAM / CECHIMEX 177
On the other hand, as Paiva Abreu (2004) suggests, Brazilian exports to China have traditionally been concentrated in a few commodities, such as soybeans, soybean oil, wood pulp, iron ores and iron ore pellets. Accord-ing to Table 8, soybeans and iron ores are the top traded products with China between 2001 and 2006. In this period, iron ore exports increased almost eight-fold, from US$340 million to US$2.141 million; whereas soybean exports rose from US$537 million to US$2.431 million.
Table 8: Brazil’s top exports to China by product, 2001–2006
2001 2006 Prod-uct
SITC Description Exports
(000 US$)
Prod-uct
SITC Description
Exports (000 US$)
2222 Soybeans 537,663 2222 Soybeans 2,431,569
2815 Iron ores & con-centrates, not agglomerated
340,139 2815
Iron ores & concentrates, not agglomer-ated
2,141,645
S2816 Iron ore agglomer-ates (sinters, pellets, briquettes, etc.)
142,493 3330 Crude oil 835,846
25152
Chemical wood pulp, soda/sulfate, bleached, non-coniferous
122,464 2816
Iron ore ag-glomerates (sinters, pellets, briquettes, etc.)
487,812
7812 Motor vehicles for the transport of persons, n.e.s.
81,604 25152
Chemical wood pulp, soda/sul-fate, bleached, non-coniferous
347,783
Total top five 1,224,363
Total top five 6,244,655
Total exports to China 1,901,333
Total exports to China 8,397,178
As % of total 64%
As % of total 74%
Source: Based on COMTRADE data

Daniel Saslavsky / Ricardo Rozemberg
DIE − UNAM / CECHIMEX 178
Finally, comparing Brazilian export concentration to China vis-à-vis the world’s, it is quite clear that the ten leading products have a much larger share in exports to the Chinese market than they do in total exports. That is, between 70% and 80% of sales to China are concentrated in ten prod-ucts, while those of total exports add up to 30%.
Table 9 identifies the top products exported to the Chinese market, show-ing their share in total Brazilian sales abroad. As we can see, China repre-sents 43% and 37% of total Brazilian exports of soybeans and iron ores, respectively. As we have seen in Table 7, these products are extremely important for Brazilian exports (ranked second and third among the lead-ing products exported to the World in 2006). This demonstrates conclu-sively that Chinese import demand for primary goods is central to Brazil-ian foreign sales.
Table 9: Top products exported to China by share in overall exports (2006)
SITC Selected products Chi
na
(US$
‘000
)
Wor
ld
(US$
‘000
)
Shar
e of
Chi
na in
B
razi
l’s o
vera
ll ex
ports
(%)
2222 Soybeans 2,431,569 5,663,424 42.9%
2815 Iron ores & concentrates, not ag-glomerated 2,141,645 5,750,495 37.2%
3330 Crude oil 835,846 6,894,527 12.1%
2816 Iron ore agglomerates (sinters, pel-lets, briquettes, etc.) 487,812 3,198,375 15.3%
25152 Chemical wood pulp, soda/sulfate, bleached, non-coniferous 347,783 2,428,551 14.3%
61143 Hides & skins not further prepared in wet state 212,318 654,056 32.5%
2484
Wood of non-coniferous species detailed in heading 247.5, sawn/chipped lengthwise, sliced/peeled, whether/not planed, sanded/end-jointed, of a thickness exceeding 6 mm
154,269 571,094 27.0%

The Brazilian Case
DIE − UNAM / CECHIMEX 179
Table 9 (cont.): Top products exported to China by share in overall exports (2006)
61144 Hides & skins not further prepared in dry state 140,980 995,136 14.2%
42111 Soybean oil, crude, whether/not degummed 113,120 828,702 13.7%
67159 Ferro-alloys, n.e.s. 97,969 590,920 16.6%
71322
Reciprocating internal combustion piston engines for propelling vehicles of division 78, group 722 & headings 744.14, 744.15 & 891.11 of a cylin-der capacity exceeding 1,000 cc
89,068 599,395 14.9%
1212 Tobacco, wholly/partly stemmed/stripped 77,511 1,580,625 4.9%
27313
Granite, porphyry, basalt, sandstone & other monumental/building stone, n.e.s., whether/not roughly trimmed/merely cut, by saw-ing/othw., into blocks/slabs of a rectangular (including square) shape
74,661 200,283 37.3%
57111 Polyethylene having a specific grav-ity of < 0.94 62,999 536,807 11.7%
6111 Cane sugar, raw, in solid form, not containing added flavoring/coloring matter
54,792 3,935,802 1.4%
591 Orange juice 43,663 1,468,748 3.0%
2831 Copper ores & concentrates 34,187 519,968 6.6%
2513 Chemical wood pulp, dissolving grades
32,589 49,915 65.3%
2852 Alumina (aluminum oxide), other than artificial corundum 32,367 1,087,972 3.0%
67121 n/a pig-iron containing by weight 0.5%/less of phosphorus 31,017 1,637,332 1.9%
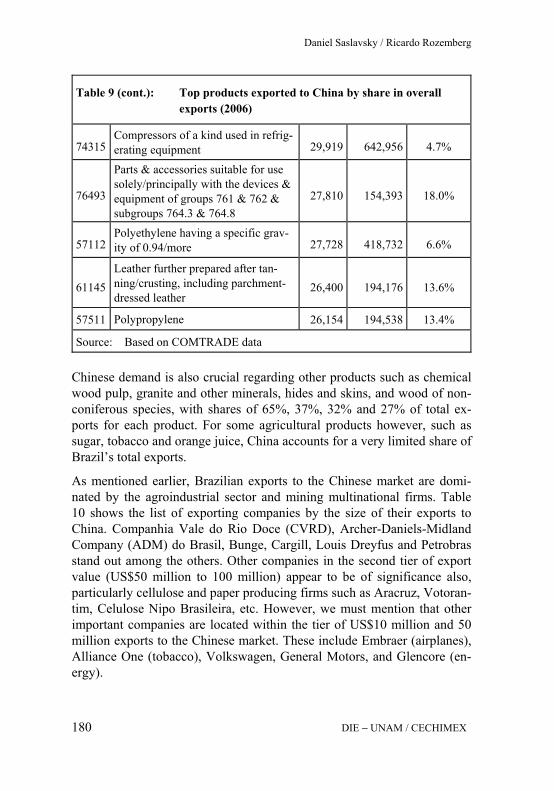
Daniel Saslavsky / Ricardo Rozemberg
DIE − UNAM / CECHIMEX 180
Table 9 (cont.): Top products exported to China by share in overall exports (2006)
74315 Compressors of a kind used in refrig-erating equipment 29,919 642,956 4.7%
76493
Parts & accessories suitable for use solely/principally with the devices & equipment of groups 761 & 762 & subgroups 764.3 & 764.8
27,810 154,393 18.0%
57112 Polyethylene having a specific grav-ity of 0.94/more 27,728 418,732 6.6%
61145 Leather further prepared after tan-ning/crusting, including parchment-dressed leather
26,400 194,176 13.6%
57511 Polypropylene 26,154 194,538 13.4%
Source: Based on COMTRADE data
Chinese demand is also crucial regarding other products such as chemical wood pulp, granite and other minerals, hides and skins, and wood of non-coniferous species, with shares of 65%, 37%, 32% and 27% of total ex-ports for each product. For some agricultural products however, such as sugar, tobacco and orange juice, China accounts for a very limited share of Brazil’s total exports.
As mentioned earlier, Brazilian exports to the Chinese market are domi-nated by the agroindustrial sector and mining multinational firms. Table 10 shows the list of exporting companies by the size of their exports to China. Companhia Vale do Rio Doce (CVRD), Archer-Daniels-Midland Company (ADM) do Brasil, Bunge, Cargill, Louis Dreyfus and Petrobras stand out among the others. Other companies in the second tier of export value (US$50 million to 100 million) appear to be of significance also, particularly cellulose and paper producing firms such as Aracruz, Votoran-tim, Celulose Nipo Brasileira, etc. However, we must mention that other important companies are located within the tier of US$10 million and 50 million exports to the Chinese market. These include Embraer (airplanes), Alliance One (tobacco), Volkswagen, General Motors, and Glencore (en-ergy).

The Brazilian Case
DIE − UNAM / CECHIMEX 181
Table 10: Selected top Brazilian exporters to China, 2007
More than US$100 million US$50–100 million
Companhia Vale do Rio Doce Aracruz Celulose SA
ADM do Brasil Ltda Votorantim Celulose e Papel AS
Samarco Mineracao SA Amaggi Exportacao e Importacao Ltda
Bunge Alimentos SA Celulose Nipo Brasileira SA Cenibra
Caraiba Metais SA Cia de Fomento Mineral e Participacoes CFM
Cargill Agricola S A Coamo Agroindustrial Cooperativa
Companhia Brasileira de Metalurgia e Mineracao Sementes Selecta Ltda
Bianchini sa Industria Comercio e Agricultura Souza Cruz SA
Louis Dreyfus Commodities Brasil SA Suzano Papel e Celulose AS
Mineracoes Brasileiras Reunidas SA MBR
Nacional Minerios SA
Petroleo Brasileiro SA Petrobras
Source: Based on MDIC data
Finally, in order to consider the effects of Sino-Brazilian trade patterns on the Brazilian production structure, we adopt here an approximation to the “market export basket” concept from Hausmann and Klinger (2006). Basi-cally, we weight the average “distance” between two products (that is, how easy it is for a country to export a particular good given that it already exports the other product), with Brazilian revealed comparative advan-tages.3 If the weighted distance decreases, the country is becoming more
3 See Hausmann / Klinger (2006) and Parks et al. (2007) for a detailed survey of this
methodology. In order to understand this concept, we must introduce some basic con-cepts. In the first place, we obtained the proximity matrix, which consists of the proba-
Daniel Saslavsky / Ricardo Rozemberg
DIE − UNAM / CECHIMEX 182
competitive and/or moving towards a zone where products are more “in-terconnected”. This is particularly true for the industrialized and more capital- and technology-intensive goods often exported by developed economies. As Guerson / Parks / Parra Torrado (2007) argue: “The intui-tion behind the distance measure is that it reflects the degree in which a good exported by (a country) is in close proximity to the world’s export basket, making it easier for firms to adopt new products and export them. Hence, under this framework, the probability of exporting a good in the future depends on how close is a good to the current country’s export basket.” Looking at Figure 2, we can see that Brazil is moving closer to the world’s export basket, since the average distance between 1998 and 2006 is declin-ing (series called RCA Weighted Distance). As a counterfactual exercise, we calculated this distance again by weighting the proximity matrix with the bilateral Brazil-China complementarity index (series called Bilateral Trade Weighted Distance), indicating which goods match the Brazilian revealed comparative advantage in exports, and Chinese import patterns.4
Consequently, this indicator is a rough measure of what would happen with Brazilian distance to the world’s export market if it became competi-tive only in those exports that complement China’s imports structure. As we can see, if Brazil gradually adopted this export basket, the distance to the world’s export basket would rise; a worse-off situation. A probable explanation for this is that since the Complementarity Index reinforces the North-South pattern, Brazil becomes now almost solely an exporter of raw materials and primary goods, therefore increasing its distance to the mar-ket export basket which is also made up of capital and technology inten-sive goods.
bility of exporting the good k given that the good j is exported, and vice versa. Since both conditional probabilities are not the same, the authors take the lesser of the two. This proximity or probability is an intuitive notion of how “close” products are in the product space. That is, when probabilities are high, this indicates that it is easier for one country to export a particular good given that it exports another one. Since this probabi-lity was calculated using all bilateral exports for all exporting countries, we consider this proximity as the average for the market.
4 See Balassa (1965).

The Brazilian Case
DIE − UNAM / CECHIMEX 183
Figure 2: Distance to the „market“ exports basket
Note: Dotted lines represent one standard deviation from the mean.
Source: Own calculations based on COMTRADE data and Rodrik’s website ‘Product Space and the Wealth of Nations’
1.2 Brazilian imports from China The composition of Brazilian imports from China clearly departs from the popular belief that China is only an exporter of low quality consumer goods. Between 1998 and 2007, total imports increased by over 50%, from roughly US$60,000 million to over US$90,000 million. As Table 11 shows, Brazil currently imports industrial supplies (31% of total imports), capital goods (28%), fuels (19%), transport equipment and parts (12%), other consumption goods (6%) and food and beverages (4%).

Daniel Saslavsky / Ricardo Rozemberg
DIE − UNAM / CECHIMEX 184
Table 11: Brazil’s imports from the world and China by economic use of goods
2007 2001 1998
US$
million % US$
million % US$
million %
WORLD
Food and beverages 3,815 4% 2,969 5% 5,430 9%
Industrial supplies 28,473 31% 16,570 30% 17,980 30%
Fuels 16,949 19% 7,607 14% 5,549 9%
Capital goods 25,756 28% 18,367 33% 18,685 31%
Transport equipment and parts 10,813 12% 7,179 13% 9,255 15%
Other consumption goods 5,511 6% 2,850 5% 3,881 6%
Other goods 25 0% 61 0% 12 0%
Total 91,343 100% 55,602 100% 60,793 100%
CHINA
Food and beverages 54 1% 12 1% 25 2%
Industrial supplies 1,886 24% 348 26% 256 23%
Fuels 132 2% 122 9% 101 9%
Capital goods 4,354 54% 552 42% 298 26%
Transport equipment and parts 378 5% 30 2% 21 2%
Other consumption goods 1,185 15% 263 20% 433 38%
Other goods 0 0% - 0% - 0%
Total 7,989 100% 1,328 100% 1,134 100%
Source: Based on COMTRADE data
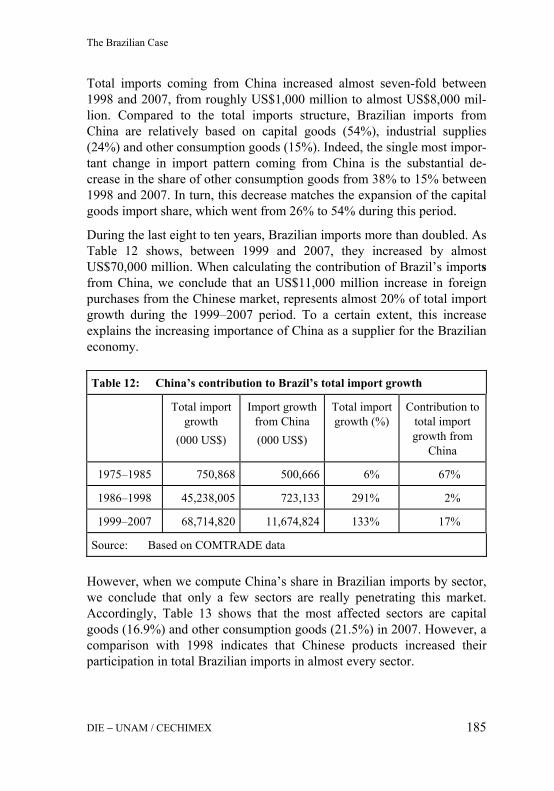
The Brazilian Case
DIE − UNAM / CECHIMEX 185
Total imports coming from China increased almost seven-fold between 1998 and 2007, from roughly US$1,000 million to almost US$8,000 mil-lion. Compared to the total imports structure, Brazilian imports from China are relatively based on capital goods (54%), industrial supplies (24%) and other consumption goods (15%). Indeed, the single most impor-tant change in import pattern coming from China is the substantial de-crease in the share of other consumption goods from 38% to 15% between 1998 and 2007. In turn, this decrease matches the expansion of the capital goods import share, which went from 26% to 54% during this period. During the last eight to ten years, Brazilian imports more than doubled. As Table 12 shows, between 1999 and 2007, they increased by almost US$70,000 million. When calculating the contribution of Brazil’s imports from China, we conclude that an US$11,000 million increase in foreign purchases from the Chinese market, represents almost 20% of total import growth during the 1999–2007 period. To a certain extent, this increase explains the increasing importance of China as a supplier for the Brazilian economy.
Table 12: China’s contribution to Brazil’s total import growth
Total import growth
(000 US$)
Import growth from China (000 US$)
Total import growth (%)
Contribution to total import growth from
China
1975–1985 750,868 500,666 6% 67%
1986–1998 45,238,005 723,133 291% 2%
1999–2007 68,714,820 11,674,824 133% 17%
Source: Based on COMTRADE data
However, when we compute China’s share in Brazilian imports by sector, we conclude that only a few sectors are really penetrating this market. Accordingly, Table 13 shows that the most affected sectors are capital goods (16.9%) and other consumption goods (21.5%) in 2007. However, a comparison with 1998 indicates that Chinese products increased their participation in total Brazilian imports in almost every sector.

Daniel Saslavsky / Ricardo Rozemberg
DIE − UNAM / CECHIMEX 186
Table 13: China’s share in Brazil’s imports by sector and economic use of goods
2007 2001 1998
% % %
Food and beverages 1.4% 0.4% 0.5%
Industrial supplies 6.6% 2.1% 1.4%
Fuels 0.8% 1.6% 1.8%
Capital goods 16.9% 3.0% 1.6%
Transport equipment and parts 3.5% 0.4% 0.2%
Other consumption goods 21.5% 9.2% 11.2%
Other goods 1.0% 0.0% 0.0%
Total 8.7% 2.4% 1.9%
Source: Based on COMTRADE data
In terms of the composition of the Brazilian import basket, a reduced number of goods explained a great deal regarding import growth in the period 2001–2006. During that period, total imports increased from US$55,000 million to US$91,000 million. As seen in Table 14, a large increase in imports was explained by oil (from US$3.194 million to US$9.063 million), petroleum oils (from US$2.905 million to US$4.294 million), and processors, controllers and memories (from US$1.401 mil-lion to US$2.847 million). These products are part of the top five imported goods from the world, which accounted for almost 20% of total imports between 2001 and 2006. Other important products are present too in this basket, such as motor vehicles and parts, and parts and accessories for audio, video and communications.

The Brazilian Case
DIE − UNAM / CECHIMEX 187
On the other hand, imports from China have been traditionally concen-trated in a small number of capital intensive goods such as parts and ac-cessories for calculating machines, lamps, parts and accessories for audio, video and telecommunications; and more recently, microprocessors and memories, toys, instruments and transmission devices (see Table 15).
Table 14: Brazil’s top imports from the world by product, 2001–2006
2001 2006
Product SITC
Description Imports (US$
million)
Product SITC
Description Imports (US$
million)
3330 Crude oil 3,194 3330 Crude oil 9,063
3340 Petroleum oils 2,905 3340 Petroleum oils 4,294
7843 Motor vehi-cle parts and accessories
1,502 7764 Processors, con-trollers, memo-ries
2,847
7812 Motor vehi-cles 1,402 7843
Motor vehicle parts and acces-sories
2,492
7764 Processors, controllers, memories
1,401 7649
Parts and acces-sories for audio, video and com-munications
2,412
Total top 5 10,404 Total top 5 21,108
Total imports 55,599 Total imports 91,340
As % of total 19% As % of total 23%
Source: Based on COMTRADE data
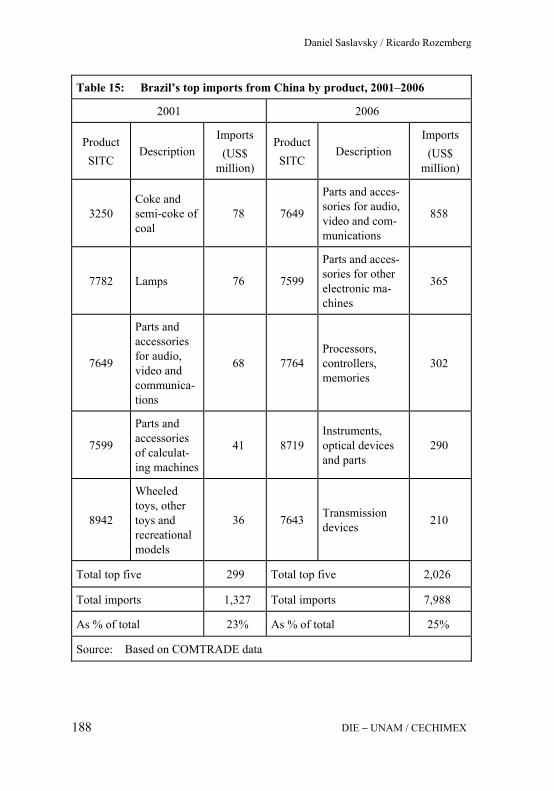
Daniel Saslavsky / Ricardo Rozemberg
DIE − UNAM / CECHIMEX 188
Table 15: Brazil’s top imports from China by product, 2001–2006
2001 2006
Product SITC
Description Imports (US$
million)
Product SITC
Description Imports (US$
million)
3250 Coke and semi-coke of coal
78 7649
Parts and acces-sories for audio, video and com-munications
858
7782 Lamps 76 7599
Parts and acces-sories for other electronic ma-chines
365
7649
Parts and accessories for audio, video and communica-tions
68 7764 Processors, controllers, memories
302
7599
Parts and accessories of calculat-ing machines
41 8719 Instruments, optical devices and parts
290
8942
Wheeled toys, other toys and recreational models
36 7643 Transmission devices 210
Total top five 299 Total top five 2,026
Total imports 1,327 Total imports 7,988
As % of total 23% As % of total 25%
Source: Based on COMTRADE data

The Brazilian Case
DIE − UNAM / CECHIMEX 189
2 Effects of trade with China
2.1 Terms of trade
According to Deutsche Bank Research (2006), China’s fast rising demand for commodities, spurred by industrialization and higher living standards had a significant impact on world commodity markets and prices as well as on the resource-rich regions of the world like Latin America. Chinese commodity imports have multiplied by 20 over the past two decades. However, commodity imports did not outgrow overall import demand, remaining at about one-third of total imports. According to the same study, crude oil, metal ores and plastic materials lead the list of China’s top ten commodity imports. Together, these commodities account for roughly 40% of commodity imports and 15% of total imports. Finally, China is the world’s leading importer of plastic materials, metal ores, oil seeds, textile fibers and pulp and paper.
Brazil is the number one exporter of iron ore world wide and the third largest supplier of the metal for China. Thus, Brazil and other Latin American countries (mostly Peru) supply more than a quarter of China’s total iron ore imports. Since the late 1990s, soybean production in Brazil posted strong growth, in part driven by China’s increasing demand. Again, as Deutsche Bank Research (2006) notes, between 1999 and 2004, China’s soybean imports from Argentina and Brazil showed a ten-fold increase (accounting for more than 50% of China’s total imports).
In addition, China’s growing meat consumption is of great importance for Brazil. Being the second largest producers of meat, beef and veal, China’s meat imports already add up to 11% of total purchases abroad. Finally, the above-mentioned study stresses that China is also the world’s leading importer of pulp and paper, with Brazil accounting for 8% of Chinese imports. Again, when looking at the terms of trade, one must bear in mind the bilateral pattern of trade that closely resembles the so-called North-South type, where the Southern country (in this case Brazil) exports pri-mary goods and raw materials and the Northern country exports manufac-tures of different technologies.
After reviewing China’s importance for Brazil as a consumer of commodi-ties, we turn to Figure 3 to describe the effects of growing Chinese de-mand on the Brazilian terms of trade. We do so by examining terms of

Daniel Saslavsky / Ricardo Rozemberg
DIE − UNAM / CECHIMEX 190
trade vis-à-vis China, where a clear pattern of improvement appears from 2001 onwards. In a longer-term perspective, whereas import prices from China show a consistent negative trend throughout the 1985–2007 period export prices do not follow suit. In contrast, there appear to be three marked stages in the effects of terms of trade, mainly determined by ex-port prices: the first stage from 1985 to 1995; the second, from 1995 to 2001; and finally, from 2001 until 2007.
As quantities from China rose almost three-fold between 2001 and 2007, it is quite clear that bilateral terms of trade were not only influenced by higher prices but also by real traded volumes with China.5 According to the Brazilian Foreign Trade Studies Foundation (FUNCEX), export prices to China almost doubled from 2001 to 2007, while import prices only
5 Available at http://www.funcex.com.br/basesbd/down_base.asp?tp=4&arq_pdf= meto-
dologia _2.pdf
Figure 3: Brazilian terms of trade and price indexes
Source: Based on FUNCEX data
The Brazilian Case
DIE − UNAM / CECHIMEX 191
increased by 19%, resulting in a 52% rise in bilateral terms of trade. Con-sequently, price increases in the major products exported to China may not be reflected in the change in Brazil’s global terms of trade of only 6% between 2001 and 2007, due to a lower increase in the prices of products exported to the US and Argentina (11% and -10%, respectively). Apart from this, it is quite clear that in the case of some particular commodities, price increases – such as in the case of iron ores, which rose from 28 to US$83 per ton – did have a substantial effect on bilateral terms of trade, among other things.
Finally, one must consider that commodity prices have greatly suffered in 2008, as a consequence of the financial turmoil in the US and other indus-trialized economies. In general terms, soft commodities and metals – of particular significance for Brazilian exports – have declined by over 40% from their peak in 2007.
2.2 Employment effects In order to measure the employment effects of trade with China, we follow Lopez and Ramos (Chapter 3, page 65−157), who in turn use Jenkins / Sen (2006) methodology. In a nutshell, they put forward a Chenery-type growth accounting methodology where changes in production can be de-composed in subsequent changes in domestic demand and trade flows.6 We only reproduce here the final equation, which is calibrated using two different points in time, in this case 1998 and 2005.7
As in Lopez and Ramos (2008), we also disentangle trade effects on em-ployment according to trading partners, in this case China and the rest of the world (ROW).
6 Other more recent methodologies depart from the classical optimization problem of the
firm, introducing trade as part of the trade facilitation program, and obtain a labor de-mand equation where trade is an independent variable. For the Latin-American case see Fajnzylber / Maloney (2005) and Castro / Olarreaga / Saslavsky(2006).
7 As in the previous authors’ work, this methodology is limited in a number of aspects. First, it assumes that productivity changes are independent from changes in other vari-ables (including trade). Second, only direct effects on employment are calculated. Third, we do not account for other effects of trade with China, as in the terms of trade.
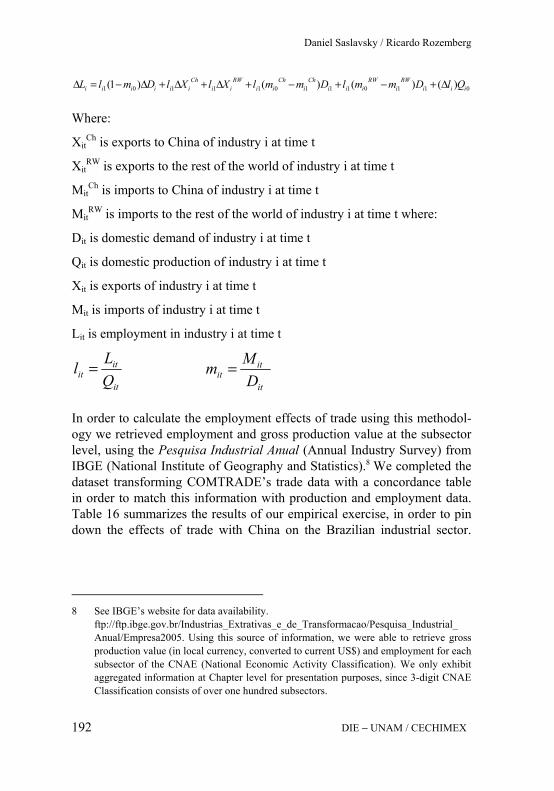
Daniel Saslavsky / Ricardo Rozemberg
DIE − UNAM / CECHIMEX 192
Where:
XitCh is exports to China of industry i at time t
XitRW is exports to the rest of the world of industry i at time t
MitCh is imports to China of industry i at time t
MitRW is imports to the rest of the world of industry i at time t where:
Dit is domestic demand of industry i at time t
Qit is domestic production of industry i at time t
Xit is exports of industry i at time t
Mit is imports of industry i at time t
Lit is employment in industry i at time t
In order to calculate the employment effects of trade using this methodol-ogy we retrieved employment and gross production value at the subsector level, using the Pesquisa Industrial Anual (Annual Industry Survey) from IBGE (National Institute of Geography and Statistics).8 We completed the dataset transforming COMTRADE’s trade data with a concordance table in order to match this information with production and employment data. Table 16 summarizes the results of our empirical exercise, in order to pin down the effects of trade with China on the Brazilian industrial sector.
8 See IBGE’s website for data availability.
ftp://ftp.ibge.gov.br/Industrias_Extrativas_e_de_Transformacao/Pesquisa_Industrial_ Anual/Empresa2005. Using this source of information, we were able to retrieve gross production value (in local currency, converted to current US$) and employment for each subsector of the CNAE (National Economic Activity Classification). We only exhibit aggregated information at Chapter level for presentation purposes, since 3-digit CNAE Classification consists of over one hundred subsectors.
0110111011101 )()()()1( iiiRW
iRW
iiiCh
iCh
iiRW
iiCh
iiiiii QlDmmlDmmlXlXlDmlL Δ+−+−+Δ+Δ+Δ−=Δ
it
itit Q
Ll =it
itit D
Mm =

Tab
le 1
6:
Im
pact
of t
rade
with
Chi
na o
n B
razi
lian
empl
oym
ent,
1998
−200
5 CNAE
Des
crip
tion
Change in Employ-
ment
Domestic Demand
Total trade with China
Exports to China
Imports from China
Exports to ROW
Imports from ROW
Productiv-ity
10
Min
eral
coa
l ext
ract
ion
1,51
3 3,
464
-382
0
-382
1
-1,1
71
-2,0
30
11
Oil
and
gas e
xtra
ctio
n 20
,185
1,
530
1,50
9 1,
508
0 10
,915
5,
928
4,14
9
13
Met
allic
min
eral
extra
ction
14
,349
11
,483
5,
790
5,83
1 -4
1 8,
257
-1,4
16
-5,7
11
14
Non
met
allic
min
eral
ex
tract
ion
8,78
9 3,
479
2,11
4 2,
121
-7
7,75
9 2,
313
-10,
106
15
Food
and
bev
erag
es
374,
838
109,
220
1,54
3 1,
757
-214
23
4,97
3 15
,042
13
,847
16
Toba
cco
-1,1
88
7,29
3 0
0 0
-3,1
81
235
-4,2
77
17
Text
iles
29,3
23
5,21
1 -6
,768
72
9 -7
,498
18
,319
-4
,808
18
,185
18
App
arel
94
,082
-6
,048
-5
,581
41
-5
,623
8,
067
4,38
9 95
,702
19
Leat
her a
nd fo
otw
ear
129,
142
23,5
10
551
6,34
4 -5
,792
49
,221
3,
270
40,2
60
20
Woo
d pr
oduc
ts
34,4
92
9,09
5 5,
572
5,61
8 -4
7 57
,859
1,
039
-25,
632
21
Cel
lulo
se a
nd p
aper
23
,519
29
,562
1,
238
1,34
0 -1
02
7,16
4 3,
929
-16,
000
22
Editi
ng, p
rintin
g -5
,830
-1
5,02
4 -6
3 9
-71
1,55
6 2,
229
5,62
9
The Brazilian Case
DIE − UNAM / CECHIMEX 193
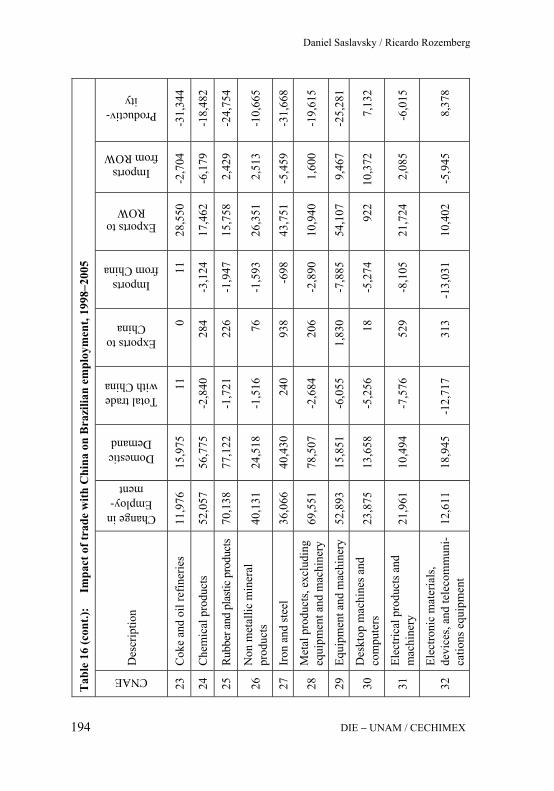
Tab
le 1
6 (c
ont.)
:
Impa
ct o
f tra
de w
ith C
hina
on
Bra
zilia
n em
ploy
men
t, 19
98−2
005
CNAE
Des
crip
tion
Change in Employ-
ment
Domestic Demand
Total trade with China
Exports to China
Imports from China
Exports to ROW
Imports from ROW
Productiv-ity
23
Cok
e an
d oi
l ref
iner
ies
11,9
76
15,9
75
11
0 11
28
,550
-2
,704
-3
1,34
4
24
Che
mic
al p
rodu
cts
52,0
57
56,7
75
-2,8
40
284
-3,1
24
17,4
62
-6,1
79
-18,
482
25
Rubb
er an
d pl
astic
pro
duct
s 70
,138
77
,122
-1
,721
22
6 -1
,947
15
,758
2,
429
-24,
754
26
Non
met
allic
min
eral
pr
oduc
ts
40,1
31
24,5
18
-1,5
16
76
-1,5
93
26,3
51
2,51
3 -1
0,66
5
27
Iron
and
stee
l 36
,066
40
,430
24
0 93
8 -6
98
43,7
51
-5,4
59
-31,
668
28
Met
al p
rodu
cts,
excl
udin
g eq
uipm
ent a
nd m
achi
nery
69
,551
78
,507
-2
,684
20
6 -2
,890
10
,940
1,
600
-19,
615
29
Equi
pmen
t and
mac
hine
ry
52,8
93
15,8
51
-6,0
55
1,83
0 -7
,885
54
,107
9,
467
-25,
281
30
Des
ktop
mac
hine
s and
co
mpu
ters
23
,875
13
,658
-5
,256
18
-5
,274
92
2 10
,372
7,
132
31
Elec
trica
l pro
duct
s and
m
achi
nery
21
,961
10
,494
-7
,576
52
9 -8
,105
21
,724
2,
085
-6,0
15
32
Elec
troni
c m
ater
ials
, de
vice
s, an
d te
leco
mm
uni-
catio
ns e
quip
men
t 12
,611
18
,945
-1
2,71
7 31
3 -1
3,03
1 10
,402
-5
,945
8,
378
Daniel Saslavsky / Ricardo Rozemberg
DIE − UNAM / CECHIMEX 194
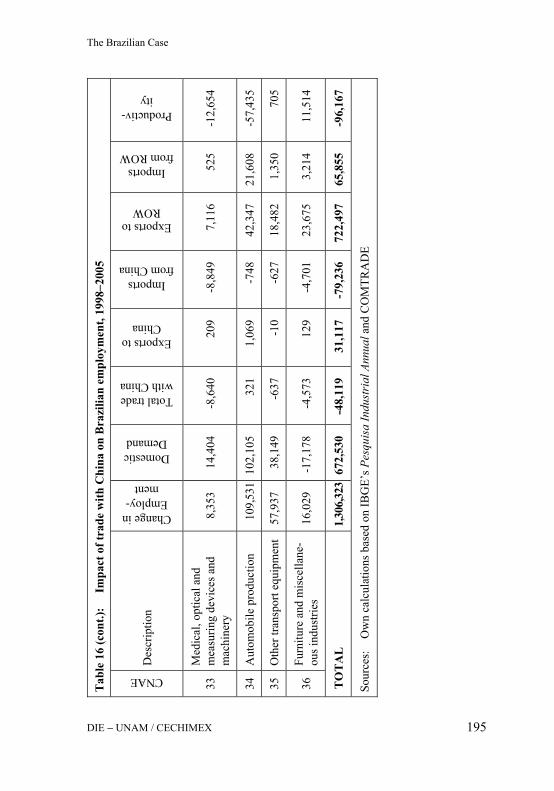
Tab
le 1
6 (c
ont.)
:
Impa
ct o
f tra
de w
ith C
hina
on
Bra
zilia
n em
ploy
men
t, 19
98−2
005
CNAE
Des
crip
tion
Change in Employ-
ment
Domestic Demand
Total trade with China
Exports to China
Imports from China
Exports to ROW
Imports from ROW
Productiv-ity
33
Med
ical
, opt
ical
and
m
easu
ring
devi
ces a
nd
mac
hine
ry
8,35
3 14
,404
-8
,640
20
9 -8
,849
7,
116
525
-12,
654
34
Aut
omob
ile p
rodu
ctio
n 10
9,53
1 10
2,10
5 32
1 1,
069
-748
42
,347
21
,608
-5
7,43
5
35
Oth
er tr
ansp
ort e
quip
men
t 57
,937
38
,149
-6
37
-10
-627
18
,482
1,
350
705
36
Furn
iture
and
mis
cella
ne-
ous i
ndus
tries
16
,029
-1
7,17
8 -4
,573
12
9 -4
,701
23
,675
3,
214
11,5
14
TO
TA
L
1,30
6,32
3 67
2,53
0 -4
8,11
9 31
,117
-7
9,23
6 72
2,49
7 65
,855
-9
6,16
7
Sour
ces:
O
wn
calc
ulat
ions
bas
ed o
n IB
GE’
s Pes
quis
a In
dust
rial
Ann
ual a
nd C
OM
TRA
DE
The Brazilian Case
DIE − UNAM / CECHIMEX 195

Daniel Saslavsky / Ricardo Rozemberg
DIE − UNAM / CECHIMEX 196
According to IBGE, the bulk of the industrial sector created over a million jobs between 1998 and 2006. We can further categorize this change into three main effects: domestic demand effects, trade effects, and productiv-ity effects. Our estimations suggest that, in overall terms, 52% of job crea-tion came from the increase in domestic demand; almost 57% came from trade; and there was a 3% decrease as a consequence of productivity gains. However, when we disentangle the effects of trade of China from those of the rest of the world, our figures indicate that trade with China is responsi-ble for a 4% loss in Brazilian jobs: while exports created a 2.5% increase in employment, import growth caused a 6.1% decline in jobs for the indus-trial sector as a whole.
2.3 Government revenue According to Brazilian official statistics, trade tax revenue in Brazil adds up to 12 to 17 billion Reais (US$ 6–9 billion), or 6% of total tax revenue.9 Unlike Argentina, which depends heavily on export taxes, Brazilian trade taxes rely almost exclusively on imports.10 As of 2004, export taxes have been levied on a small array of products: cashew nuts, tobacco, cigars, leather, paper for cigars, cylinders for cigar filters, and arms. Indeed, reve-nue from export taxes is almost negligible, accounting for less than 1% of total trade tax revenue.
Basically, import tax revenue in Brazil consists of tariff duties and a fed-eral value-added import tax of 8.2% of the Cost, Insurance, Freight (CIF) import value in 2007. In addition, Brazilian states apply Value Added Tax (ICMS), a value-added tax on good and services. This tax is levied on both intrastate and interstate transactions and is assessed on every transfer or movement of merchandise. In general, rates are set at 17%–18% for im-ports, although preferential rates may be applied to products from certain states. Some products, such as foodstuffs, semi-manufactures, and equip-
9 http://www9.senado.gov.br/portal/page/portal/orcamento_senado/LOA/Execucao
EDFS?p_ano=2008 Receita Administrada (total tax revenue) excludes Social Security and other revenue
from public sources. When including those income sources, trade tax revenues only rep-resent between 2–3% of the total.
10 During the period 2003–2007, trade taxes in Argentina added up to 9% of total revenue, but almost 6% correspond to export taxes or retenciones, and only 3% to import duties.

The Brazilian Case
DIE − UNAM / CECHIMEX 197
ment and commodities for the Manaus Free Trade Zone are exempt, as well as locally produced machinery. Even though ICMS is an important tax, totaling revenues of almost 190 billion Reais in 2007 and 2008 (al-most 15% of total revenue), it is not possible to disaggregate how much is accounted for by imports.
According to the WTO’s Trade Policy Review, Brazilian tariff exceptions to MERCOSUR’s Common External Tariff (CET) can be obtained through the ex tarifário mechanism, a temporary reduction of import duties on capital goods, informatics and telecommunications goods and their parts, where there is no domestic production of those goods. This transitory mechanism was extended several times and is currently set to expire in December 2009 or June 2010, when no import duties will be charged for almost all goods of NCM (MERCOSUR’s version of the Harmonized System) chapters 84, 85 and 90.11 Furthermore, imports into the Manaus Free Trade Zone are exempt from the IPI, as are agricultural and food items, mineral products, fuels, chemicals, pharmaceuticals, fertilizers, hides and skins, rough wood, printed matter, and textiles and clothing.
Since Brazilian imports from China are mostly capital goods and industrial supplies from the electronics cluster – almost 60% in NCM Chapters 84, 85 and 90 – it is rather difficult to estimate trade revenue generated by imports which originated from China. In fact, technological firms like Alcatel, Hewlett-Packard, LG, Motorola, Nokia, Phillips, Samsung, and Sony stand out among the central importing companies from China, each with US$50 million or more worth of imports. Even when it is not possible to know how much these firms use the ex tarifário mechanism to import capital and intermediate goods, a considerable number of them do benefit from the tax exemptions granted in the Manaus Free Trade Zone, a very important industrial cluster near the Amazon.
According to the Receita Federal (the ministry in charge of tax revenue) almost 30% of imports from China were granted tariff-free market access to Brazil during 2002. Roughly, 20% is explained by the Manaus Free Trade Zone tax treatment, and the remaining 10% is due to other tariff
11 http://www.mdic.gov.br/sitio/interna/interna.php?area=5&menu=1851
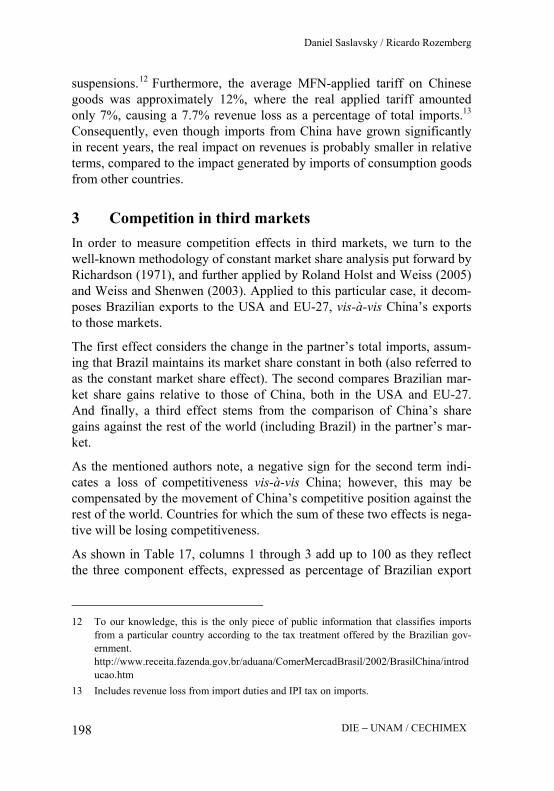
Daniel Saslavsky / Ricardo Rozemberg
DIE − UNAM / CECHIMEX 198
suspensions.12 Furthermore, the average MFN-applied tariff on Chinese goods was approximately 12%, where the real applied tariff amounted only 7%, causing a 7.7% revenue loss as a percentage of total imports.13 Consequently, even though imports from China have grown significantly in recent years, the real impact on revenues is probably smaller in relative terms, compared to the impact generated by imports of consumption goods from other countries.
3 Competition in third markets In order to measure competition effects in third markets, we turn to the well-known methodology of constant market share analysis put forward by Richardson (1971), and further applied by Roland Holst and Weiss (2005) and Weiss and Shenwen (2003). Applied to this particular case, it decom-poses Brazilian exports to the USA and EU-27, vis-à-vis China’s exports to those markets.
The first effect considers the change in the partner’s total imports, assum-ing that Brazil maintains its market share constant in both (also referred to as the constant market share effect). The second compares Brazilian mar-ket share gains relative to those of China, both in the USA and EU-27. And finally, a third effect stems from the comparison of China’s share gains against the rest of the world (including Brazil) in the partner’s mar-ket.
As the mentioned authors note, a negative sign for the second term indi-cates a loss of competitiveness vis-à-vis China; however, this may be compensated by the movement of China’s competitive position against the rest of the world. Countries for which the sum of these two effects is nega-tive will be losing competitiveness.
As shown in Table 17, columns 1 through 3 add up to 100 as they reflect the three component effects, expressed as percentage of Brazilian export
12 To our knowledge, this is the only piece of public information that classifies imports
from a particular country according to the tax treatment offered by the Brazilian gov-ernment.
http://www.receita.fazenda.gov.br/aduana/ComerMercadBrasil/2002/BrasilChina/introducao.htm
13 Includes revenue loss from import duties and IPI tax on imports.

The Brazilian Case
DIE − UNAM / CECHIMEX 199
change to the EU-27. As can be seen, while all constant market share ef-fects are positive, competitiveness effects are not. In fact, except for fuel exports, Brazilian goods have lost competitiveness vis-à-vis Chinese prod-ucts in the EU-27. Nonetheless, Brazilian goods show a modest increase in overall competitiveness in the European continent, as the last column indicates. In aggregate terms, 75% of export growth to the EU-27 is due to increases in demand, and almost 23% to competitiveness improvements.
Table 17: Competition with China in third markets: EU-27, 2001–2007 (%)
(1) (2) (3) (2) + (3)
% Change
in Brazil-
ian exports to EU-
27
Con-stant
market share effect
Brazil’s market share-gains
relative to China
China’s market
share gains relative to the ROW
China’s total com-
petitiveness effect
Food and beverages
116.1 92.2 -66.4 74.2 7.8
Industrial supplies
185.4 76.9 -124.0 147.0 23.1
Fuels 888.1 24.4 96.3 -20.7 75.6
Capital goods 168.2 50.0 -157.6 207.6 50.0
Transport equipment
91.8 93.3 -259.0 265.7 6.7
Consumption goods
153.6 82.7 -67.8 85.1 17.3
Other goods 149.7 25.1 -349.3 424.3 74.9
Total 160.7 76.5 -113.0 136.6 23.5
Source: Own calculations based on UN COMTRADE data

Daniel Saslavsky / Ricardo Rozemberg
DIE − UNAM / CECHIMEX 200
Now we turn to Table 18, where we compute the competitive position of Brazil against China in the US market. The most noteworthy result is that, apart from the export of fuels and other consumption goods, Brazilian products have lost relative market share in the US against Chinese imports. The rest of the table shows that Brazilian exports experienced significant competitiveness losses, especially in capital goods, transport equipment, and other goods. In aggregate terms, while overall competitiveness of Brazilian exports to the US increased, this effect only accounts for 10% of the change.
Table 18: Competition with China in third markets: USA, 2001–2007 (%)
(1) (2) (3) (2) + (3)
% Change in Bra-zilian
exports to USA
Con-stant
market share effect
Brazil’s market share gains
relative to China
China’s market share gains relative to the ROW (including
Brazil)
China’s total com-
petitiveness effect
Food and bever-ages 135.4 51.8 -92.5 140.7 48.2
Industrial sup-plies 124.9 60.3 -94.9 134.6 39.7
Fuels 306.3 61.5 81.2 -42.6 38.5
Capital goods 34.9 160.2 -844.1 783.9 -60.2
Transport equipment 7.0 460.3 -4,730.0 4,369.7 -360.3
Other consump-tion Goods -4.7 -1,431.9 3,020.3 -1,488.4 1,531.9
Other goods 1.9 1,452.3 -11,606.2 10,253.9 -1,352.3
Total 78.2 90.7 -169.7 179.0 9.3
Source: Own calculations based on UN COMTRADE data

The Brazilian Case
DIE − UNAM / CECHIMEX 201
Indeed, this is consistent with Chami Batista (2006). Using a similar methodology, this author finds that China accounted for 37% of Brazil’s competitiveness losses in 1992–2004, a period in which Brazil was the fourth largest overall winner of competitiveness. In terms of products, the author points out that main losses included leather footwear, iron and steel products, air conditioning, plywood, data processing equipment and parts, wood furniture, and brakes.
4 Trade barriers and other trade costs According to the Swedish National Board of Trade (2005) (henceforth SNBT), the rapid liberalization of trade during the early 1990s, aggres-sively lowering historically high tariffs, led to an increase of imports. Brazil bound its tariff lines in the Uruguay Round from 0%–55% for agri-cultural goods, and from 0–35% for manufactured goods. Brazil’s main protection instrument is its tariffs, whose structure is set by the MERCOSUR Common External Tariff (CET). For most tariff lines, Brazil has bound the rates higher than the applied rates, where some still exceed bound levels. A number of sectors including sugar, automobiles and parts, capital goods, informatics, and telecommunication goods were temporarily excluded from the CET. However, the average applied Most Favored Nation (MFN) tariff is 12.6% for agricultural and 13.9% for manufactured goods. More importantly, half of all tariff lines carry rates ranging from 14−21%, and 9% still show rates higher than 21%, mostly affecting dairy products, beverages and spirits, tobacco, textiles, and machinery.
4.1 Antidumping and safeguard measures adopted by Brazil
As the SNBT points out, the overvaluation of the Real that occurred dur-ing the second half of the 1990s and the across-the-board tariff reduction created further incentives for imports. This in turn caused a chain reaction from Brazilian industrialists in favor of using trade remedies. Finally this led to the creation of a trained federal bureaucracy empowered to investi-gate the occurrence of dumped and subsidized imports into Brazil. By means of Federal Act no. 9019 of March 1995, the administrative proce-dure for antidumping investigations was created, defining the due authori-ties to conduct investigations on dumping and subsidies.

Daniel Saslavsky / Ricardo Rozemberg
DIE − UNAM / CECHIMEX 202
In spite of this, Brazil’s first antidumping (AD) measure was taken in 1988. Since then AD has become Brazil’s major instrument used for pro-tection of domestic industries. In fact, Figure 4 highlights the number of measures taken by Brazil against imports since 1988, with antidumping measures the most significant in quantity (146 out of 155), followed by subsidies (9) and safeguards (5). In fact, according to the Ministry of For-eign Trade’s (SECEX) Trade Defense Bureau (DECOM in Portuguese) almost 25% of all applied measures were against China, followed by the US and India, with 9% and 6.5% respectively.
As Figure 4 shows, trade measures against Chinese products peaked in 1998, 2001 and 2007. According to Paiva Abreu (2005), it is hard to sup-port the idea that protectionist measures taken by the Brazilian authorities were targeting specific Chinese products compared to those of other ori-gins. In fact, before the adoption of measures in 2003 affected imports were very small, even compared to the total value of imports from China at the time. Therefore, past Brazilian antidumping measures have only affected a small number of Chinese manufactured products of limited significance.
Figure 4: Brazilian antidumping and other measures adopted against China
Source: Based on DECOM / SECEX 2007 Memoir
0 2 4 6 8
10 12 14 16 18 20
1988 1989 1990 1991 1992 1993 1994 1995 1996 1997 1998 1999 2000 2001 2002 2003 2004 2005 2006 2007
SafeguardsSubsidies Antidumping

The Brazilian Case
DIE − UNAM / CECHIMEX 203
A more recent development in bilateral relations, however, related to the multilateral system, is the diplomatic Market Economy Status (MES) granted by Brazil to China (along with 20 other countries) in November 2004. If incorporated to the Brazilian legal body, MES would recognize “normal value” as the price of the good in the exporter’s domestic market, a measure of particular importance in antidumping investigations. A non-MES, in contrast, allows the country imposing the remedy to take as nor-mal value the price of that good in a third country market economy. Con-sequently, if prices are distorted because of state regulation in China, dumping margins (that is the margin between the actual prices of exports and the normal value) will be much harder to demonstrate under China’s MES.
More recently, as Facchini et al. (2007) mention, requests for protection have become more common among LAC countries, and governments have chosen trade remedies such as antidumping and safeguard rules and other instruments (standards and technical regulations, non tariff barriers). In Figure 5 we can see the surge in Antidumping (AD) investigations against
Figure 5: Share of total AD investigations against China, initiated by Brazil: 1995–2007
Source: Based on CNI China Observatory
0
10
20
30
40
50
60
70
80
90
100
1995 1996 1997 1998 1999 2000 2001 2002 2003 2004 2005 2006 2007 2008
% of world total % of total AD investigations in Brazil

Daniel Saslavsky / Ricardo Rozemberg
DIE − UNAM / CECHIMEX 204
China in recent years. Although difficult to contrast with Paiva Abreu’s (2005) initial assessment of the absence of discretionary AD policies against Chinese goods, it is quite clear that in relative terms, this country has a greater practice of initiating trade remedy investigations against China than it does against the rest of the world. Fundamentally, while the share of China in total AD investigations does not exceed 20%, remedies applied to Chinese goods in Brazil reached almost 90%, and 70% during 2008. In relation to the previous paragraph, Table 19 shows the sector composition of AD remedies adopted by Brazil between 1995 and 2008. Basically, the bulk of investigations lies in opti-cal, medical products, music instruments (33%), followed by chemicals (21%), machinery (15.2%) and metals (15.2%). Clearly, this mimics the pattern of bilateral trade and Revealed Comparative Advantage (RCA) in both countries. As China exports capital intensive goods, and Brazil ex-ports primary goods, foods and raw materials, a higher concentration of AD investigations in the capital intensive sectors is expected, as turns out to be the case in the data on adopted measures.
Table 19: Distribution of AD investigations against China by sector (% of total)
Sector Brazil World
Optical, medical products, music instruments 33.3 9.7
Chemical products and plastics 21.2 28.1
Metals, stones and precious metals 15.2 22.8
Machinery, electronics and vehicles 15.2 13.6
Leather, skins, textiles, apparel and footwear 6.1 11.7
Animals, vegetables, foods and beverages 3.3 2.5
Woods, paper and cellulose 3 3.8
Cement, ceramics and glass 3 5.6
Mineral products 0 2.2
Total 100 100
Source: Based on CNI China Observatory

The Brazilian Case
DIE − UNAM / CECHIMEX 205
Finally, as Paiva Abreu (2005) notes, safeguards have affected Brazilian imports of toys since 1996. The import of toys increased very rapidly in 1994−-95 to reach US$139.6 million in 1995, of which China had a 54% share. In 2002, when the CET plus safeguard was 30%, total toy imports declined to US$33.4 million. Since the Brazilian toy industry applied safeguards against foreign toy manufacturers, including China, for ten years after the corresponding phasing-out period, Brazil’s only recourse would be to establish parameters for negotiations of a restraint on Chinese toy imports into Brazil.
4.2 Import licensing Brazilian administrative procedures for imports are broadly divided into three categories: imports exempted from licenses, imports under non-automatic licensing, and imports under automatic licensing. As a general rule, Brazilian imports are exempt from licensing, the only requirement for importers being to present the appropriate customs documentation, de-claracao de importacao, to initiate due administrative processes. Besides this general rule, other imports are exempted from licensing, such as those using the temporary admission regime, other suspensions of tariff duties (ex tarifário), industrialized goods, and other related regimes.14
On the other hand, non-automatic licensing is imposed under a number of treatments such as tariff quotas for specific products, imports to free trade zones, duty free or export processing zones for goods subject to similarity assessments and/or subject to trade restrictive measures imposed by the Brazilian authorities (medidas de defesa comercial) and those under scru-tiny for possible fraud, etc.15
As of August 2008, only 6% of all tariff lines are subject to non-automatic licensing (632 products).16 Roughly 50% are linked to a price revision
14 Portaria SECEX N. 27, November 27, 2008. Section 3, Article 8. 15 See Portaria SECEX N. 27, November 27, 2008. Section 3, Article 8. However, accord-
ing to the WTO's Trade Policy Review, Brazil imposes import licenses to approxima-tely one third of all tariff lines, roughly 3500 products at the 8-digit level.
16 Here we only consider those import licenses which are administered exclusively by DECEX/SECEX, the Brazilian Trade Authority on these matters. The rest of the licen-ces are subject to control by a large number of agencies, whose main focus is the indus-trial, environmental and health security of imports. Some of these agencies are the Na-

Daniel Saslavsky / Ricardo Rozemberg
DIE − UNAM / CECHIMEX 206
mechanism, applied beforehand to a list of sensitive products, where a number of inquiries are made to eliminate possible fraud and dumping. Another 25% of the remaining licenses are subject to technical regulations control, where the importers are forced to present special documentation issued by Brazilian quality control organizations. This is the case for toys and tires, among others.
A remaining 10% of all licenses are applied to trade restrictive measures already in place. For example, when countervailing duties are applied to a number of imported Chinese products, the Brazilian authorities request importers to submit proper documentation to ensure the origin of those products and to avoid triangulation. Finally, the rest of the licenses are applied in the case of textile imports from China and for the administration of tariff quotas.
4.3 Bilateral agreements on other trade-restricting measures
In October 2005, Brazil introduced new regulations to curtail the flow of Chinese-made textiles/clothing and other goods into the country. For tex-tiles, there is a specific safeguard decree (5558/2005) that allows a suspen-sion of imports for a maximum period of 200 days, applied until Decem-ber 2008, while the restrictive procedure for all other sectors may be en-forced until December 2013.
For sectors other than textiles, transitory safeguards of up to 200 days could be in place in those cases where a delay in taking effective measures could entail irreparable damage. Decree 5556/2005 also allows the possi-bility of applying safeguards in the case of demonstrated trade diversion, that is, when adopted measures against China by another WTO member threaten to increase Chinese exports to the Brazilian market, or effectively do so.
tional Electric Energy Agency (ANEEL); National Department of Mineral Production; National Institute of Metrology, Normalization and Industrial Quality (INMETRO); Su-perintendency of the Manaus Free Trade Zone (SUFRAMA); National Petroleum Agency (ANP); Brazilian Health Surveillance Agency (ANVISA); Brazilian Institute of the Environment and Renewable Natural Resources; Ministry of Agriculture, Livestock and Food Supply; and the Ministry of Science and Technology.
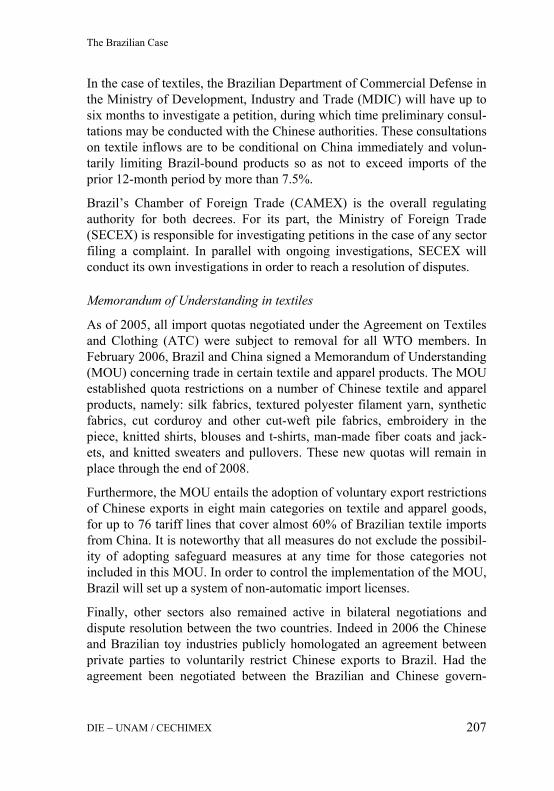
The Brazilian Case
DIE − UNAM / CECHIMEX 207
In the case of textiles, the Brazilian Department of Commercial Defense in the Ministry of Development, Industry and Trade (MDIC) will have up to six months to investigate a petition, during which time preliminary consul-tations may be conducted with the Chinese authorities. These consultations on textile inflows are to be conditional on China immediately and volun-tarily limiting Brazil-bound products so as not to exceed imports of the prior 12-month period by more than 7.5%.
Brazil’s Chamber of Foreign Trade (CAMEX) is the overall regulating authority for both decrees. For its part, the Ministry of Foreign Trade (SECEX) is responsible for investigating petitions in the case of any sector filing a complaint. In parallel with ongoing investigations, SECEX will conduct its own investigations in order to reach a resolution of disputes.
Memorandum of Understanding in textiles
As of 2005, all import quotas negotiated under the Agreement on Textiles and Clothing (ATC) were subject to removal for all WTO members. In February 2006, Brazil and China signed a Memorandum of Understanding (MOU) concerning trade in certain textile and apparel products. The MOU established quota restrictions on a number of Chinese textile and apparel products, namely: silk fabrics, textured polyester filament yarn, synthetic fabrics, cut corduroy and other cut-weft pile fabrics, embroidery in the piece, knitted shirts, blouses and t-shirts, man-made fiber coats and jack-ets, and knitted sweaters and pullovers. These new quotas will remain in place through the end of 2008.
Furthermore, the MOU entails the adoption of voluntary export restrictions of Chinese exports in eight main categories on textile and apparel goods, for up to 76 tariff lines that cover almost 60% of Brazilian textile imports from China. It is noteworthy that all measures do not exclude the possibil-ity of adopting safeguard measures at any time for those categories not included in this MOU. In order to control the implementation of the MOU, Brazil will set up a system of non-automatic import licenses.
Finally, other sectors also remained active in bilateral negotiations and dispute resolution between the two countries. Indeed in 2006 the Chinese and Brazilian toy industries publicly homologated an agreement between private parties to voluntarily restrict Chinese exports to Brazil. Had the agreement been negotiated between the Brazilian and Chinese govern-

Daniel Saslavsky / Ricardo Rozemberg
DIE − UNAM / CECHIMEX 208
ments, it would have amounted to a quantitative restriction in the form of a voluntary export restraint, which are generally prohibited under the Gen-eral Agreement on Tariffs and Trade (GATT) rules.
4.4 Transport costs It is not easy to measure the full extent of trade costs in Sino-Brazilian trade, since available sources of information are very scarce. In order to bypass this problem, we calculated a series of indicators using Argentin-ean import trade data as a proxy for our estimations, so we must take all results stemming from this analysis with proper caution.17
Our main assumption is that transport costs to Brazil or Argentina should not differ too much in relative terms vis-à-vis third countries. In order to solve all potential comparability problems we concentrated our estimations on relative measures for sectors where Brazilian and Argentinean imports from China are similar (as in the case of capital goods and parts). For this case we used two main indicators: transport costs as a share of FOB value for imports, and a measure of distance-adjusted freight costs per ton.
As we can see, Figure 6 exhibits freight costs as a percentage of free on board (FOB) value by origin of imports. Chinese cargo appears to be the most expensive amongst all trading partners for manufactured goods, with almost 15%, vis-à-vis Spain (over 10%). In contrast, in the case of ma-chinery and transport equipment almost all Asian countries show higher trade costs than those of China, as in the case of Korea and Taiwan, and Australia and Netherlands for other non-Asian suppliers.
17 Official (MDIC) and Private (Nosis) sources of Brazilian trade statistic do not allow, as
in the case of Argentina, to describe the freight costs at the most disaggregated meas-ures of trade. The freight cost declared by the importer does not account for logistic costs associated with Customs’ inefficiencies and specific port operation delays or other related problems. This leads us to better proxy trade costs from China for the Brazilian case.
In fact, since CIF values (FOB+freight+insurance) constitute the taxable amount for the importer, it is likely that more expensive freights – from more distant locations – are underreported by importers. The figures here constitute an average of air, land and sea transportation.

The Brazilian Case
DIE − UNAM / CECHIMEX 209
Figure 6: Freight costs (adjusted for distance and weight)
Source: Based on Argentine Customs Information
Another way of measuring trade costs is to compute freights per ton of imported cargo, adjusting this ratio according to distance. This is an im-perfect way of including the consideration of freight rates, as distance is a part of the final transportation cost. As in any other product, supply and demand also govern the price of freights, where a particular origin may be closer but more expensive due to shipping availability, frequency or other infrastructure limitations.
As Figure 7 shows, it is quite clear that adjusting for distance and weight, trade costs from China are the lowest. However, it may not necessarily be the case that commercial freight rates between China and Brazil are the least expensive, since they ultimately depend on the actual excess demand of international transport cargo between the two destinations. Conclu-sively, Chinese imported goods have a lower value per ton relative to other suppliers, as in the case of Japan and USA, which export goods of higher
CH
INA
CH
INA
AU
STR
ALI
A
AU
STR
ALI
A
US
A
US
A
KO
RE
A
KO
RE
A
TAIW
AN
TAIW
AN
GE
RM
AN
Y
GE
RM
AN
Y
SP
AIN
SP
AIN
NE
THE
RLA
ND
S
NE
THE
RLA
ND
S
0%
2%
4%
6%
8%
10%
12%
14%
16%
18%
20%
Manufactured goods classified chiefly bymaterial
Machinery and transport equipment

Daniel Saslavsky / Ricardo Rozemberg
DIE − UNAM / CECHIMEX 210
technological content, and greater in volume relative to their weight.18
However, the mentioned figures do not account for changes in freight costs over time. As Figure 8 shows, the substantial expansion of agricul-tural and iron ore exports (two of the most important commodities for Brazil) was accompanied by a nominal increase of 50% in sea and land transport freight rates for soybeans, and close to 75% for iron ores be-
18 Freight companies charge the maximum formula where weight and volumetric weights
of cargo are computed, and according to the type of container and points of origin and destination.
Figure 7: Freight cost adjusted by distance (adjusted by km)
Source: Based on Argentine Customs Information
JAPA
N
JAPA
N
NET
HER
LAN
DS
NET
HER
LAN
DS
GER
MAN
Y
GER
MAN
Y
SIN
GAP
OR
E
SIN
GAP
OR
E
AUST
RAL
IA
AUST
RAL
IA
SPAI
N SPAI
N
KOR
E A
KOR
EA
TAIW
AN
TAIW
AN
CH
INA
CH
INA
USA
USA
0.0
0.5
1.0
1.5
2.0
2.5
3.0
3.5
Manufactured goods classif ied chiefly bymaterial
Machinery and transport equipment
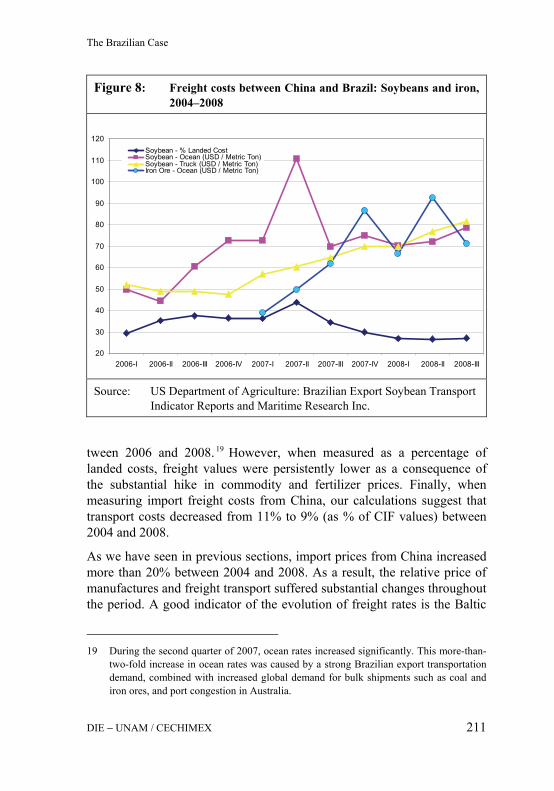
The Brazilian Case
DIE − UNAM / CECHIMEX 211
tween 2006 and 2008. 19 However, when measured as a percentage of landed costs, freight values were persistently lower as a consequence of the substantial hike in commodity and fertilizer prices. Finally, when measuring import freight costs from China, our calculations suggest that transport costs decreased from 11% to 9% (as % of CIF values) between 2004 and 2008.
As we have seen in previous sections, import prices from China increased more than 20% between 2004 and 2008. As a result, the relative price of manufactures and freight transport suffered substantial changes throughout the period. A good indicator of the evolution of freight rates is the Baltic
19 During the second quarter of 2007, ocean rates increased significantly. This more-than-
two-fold increase in ocean rates was caused by a strong Brazilian export transportation demand, combined with increased global demand for bulk shipments such as coal and iron ores, and port congestion in Australia.
Figure 8: Freight costs between China and Brazil: Soybeans and iron, 2004–2008
Source: US Department of Agriculture: Brazilian Export Soybean Transport Indicator Reports and Maritime Research Inc.
20
30
40
50
60
70
80
90
100
110
120
2006-I 2006-II 2006-III 2006-IV 2007-I 2007-II 2007-III 2007-IV 2008-I 2008-II 2008-III
Soybean - % Landed CostSoybean - Ocean (USD / Metric Ton)Soybean - Truck (USD / Metric Ton)Iron Ore - Ocean (USD / Metric Ton)

Daniel Saslavsky / Ricardo Rozemberg
DIE − UNAM / CECHIMEX 212
Dry Index (BDI), a traded index that proxies for the cost of booking cargo of various sizes to move raw materials across various ocean routes. The BDI can be interpreted as the equilibrium price of shipping raw materials, determined by the supply of cargo ships and the demand for transporting raw materials by ship, and also sensitive to changes in the price of oil.
Between 2004 and 2008, the BDI suffered massive corrections due to the increase in oil and commodity prices. However, the sharp slowdown in the worldwide industrial production growth rate in late 2008 and the conse-quent decline in oil prices contributed to a huge decline in the BDI from 11600 to roughly 700 points, the lowest in 20 years.
5 FDI flows between Brazil and China
5.1 China and FDI inflows in Brazil
Over the last 40 years, developing countries became an increasingly im-portant destination for FDI. As reported by United Nations Conference on Trade and Development (UNCTAD), in 2007 almost 30% of total direct investment flows were directed towards the developing world. As Figure 9 shows, between 1970 and the early 1980s Brazil was able to attract over 15% of FDI flows directed towards the developing markets, and 8% be-tween 1985 and 2007. In contrast, China’s foreign direct investment since the 1980s amounts to almost 35% of developing country inflows.
In the last years, Brazil has attracted FDI at a remarkable pace. Between 1994 and 2001, inflows increased by over 100%; and between 2001 and 2007, by almost 55%. Regarding the way in which direct investment in-flows are distributed by country of origin, almost 65% of flows are con-centrated in ten partners, all of them industrialized economies.20 As Table 20 clearly exhibits, the United States and the Netherlands are the most important investor countries for Brazil, with more than 20% of flows be-tween 2001 and 2007. Other important countries are Spain (8%), France (6%) and Germany (4.6%).
20 Except for Cayman Islands’ flows that serve the purpose of an offshore platform for
FDI, thanks to tax incentives provided to investing firms.
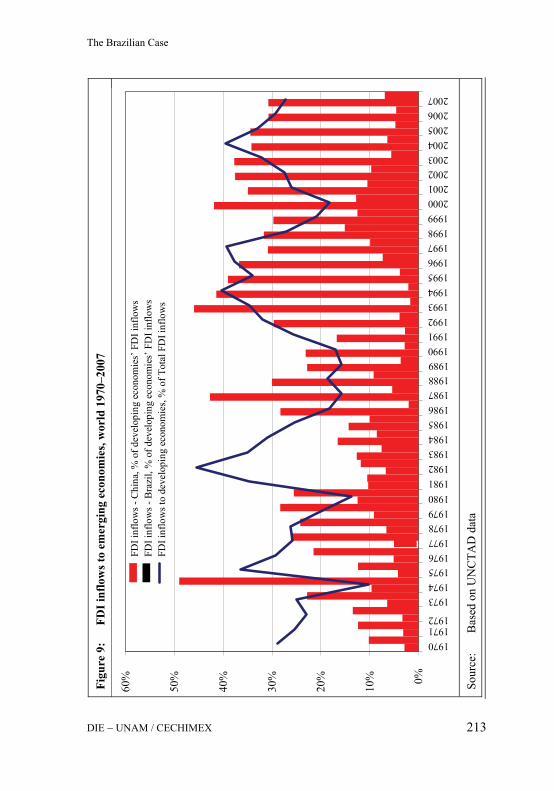
Figu
re 9
: FD
I inf
low
s to
emer
ging
eco
nom
ies,
wor
ld 1
970–
2007
Sour
ce:
Bas
ed o
n U
NC
TAD
dat
a 0%
10%
20%
30%
40%
50%
60%
1970 1971
1973
1975 1976 1977 1978 1979 1980 1981 1982 1983 1984 1985 1986 1987 1988 1989 1990 1991 1992 1993 1994 1995 1996 1997 1998 1999 2000 2001 2002 2003 2004 2005 2006 2007
FDI i
nflo
ws -
Chi
na, %
of d
evel
opin
g ec
onom
ies’
FD
I inf
low
sFD
I inf
low
s - B
razi
l, %
of d
evel
opin
g ec
onom
ies’
FD
I inf
low
sFD
I inf
low
s to
deve
lopi
ng e
cono
mie
s, %
of T
otal
FD
I inf
low
s
1974
1972
The Brazilian Case
DIE − UNAM / CECHIMEX 213

Tab
le 2
0:
Bra
zil –
Tot
al F
DI i
nflo
ws b
y in
vest
or c
ount
ry (U
S$ m
illio
n), 1
990–
2008
Cou
ntry
19
90
1994
20
01
2005
20
06
2007
20
08*
Tota
l FD
I inf
low
s 1,
008.
0 9,
026.
0 21
,041
.7
21,5
21.6
22
,231
.3
33,7
04.6
28
,881
.4
Top
10 c
ount
ries
654.
7 5,
179.
117
,405
.515
,466
.415
,757
.623
,504
.1
18,8
52.3
Chi
na
0.1
0.0
12.3
3.7
4.1
24.3
31
.5
Hon
g K
ong
1.7
2.1
0.0
48.1
1.
3 13
.6
23.5
Mac
ao
0.0
0.0
0.0
0.0
0.1
0.0
1.1
Shar
es: T
op 1
0 co
untri
es
USA
13
.2%
40
.7%
21.2
%21
.6%
19.9
%17
.9%
17
.9%
Net
herla
nds
-25.
0%
0.8%
9.0%
14.9
%15
.7%
24.1
%
10.7
%
Spai
n 1.
3%
0.1%
8.3%
5.0%
8.9%
6.4%
9.
3%
Cay
man
Isla
nds
2.6%
4.
7%13
.1%
5.7%
6.8%
4.8%
4.
8%
Fran
ce
9.2%
3.
5%9.
1%6.
8%3.
3%3.
6%
5.7%
Ger
man
y 14
.9%
4.
5%5.
0%5.
9%3.
8%5.
2%
2.6%
Japa
n 13
.2%
0.
9%2.
1%6.
7%5.
8%1.
4%
4.4%
Portu
gal
0.2%
2.
1%3.
9%3.
6%2.
9%1.
4%
3.2%
Daniel Saslavsky / Ricardo Rozemberg
DIE − UNAM / CECHIMEX 214

Tab
le 2
0 (c
ont.)
: B
razi
l – T
otal
FD
I inf
low
s by
inve
stor
cou
ntry
(US$
mill
ion)
, 199
0–20
08
Cou
ntry
19
90
1994
20
01
2005
20
06
2007
20
08*
Shar
es: T
op 1
0 co
untri
es (c
ont.)
Can
ada
39.3
%
0.4%
8.0%
1.6%
1.4%
2.4%
4.
8%
Switz
erla
nd
-4.0
%
-0.5
2.9%
0.2%
2.3%
2.5%
1.
8%
Tota
l top
ten
65.0
%
57.4
%82
.7%
71.9
%70
.9%
69.7
%
65.3
%
Chi
na
0.0%
0.
0%0.
1%0.
0%0.
0%0.
1%
0.1%
Hon
g K
ong
0.2%
0.
0%0.
0%0.
2%0.
0%0.
0%
0.1%
Mac
ao
0.0%
0.
0%0.
0%0.
0%0.
0%0.
0%
0.0%
* Ja
nuar
y–Se
ptem
ber
Sour
ce:
C
entra
l Ban
k of
Bra
zil
The Brazilian Case
DIE − UNAM / CECHIMEX 215

Daniel Saslavsky / Ricardo Rozemberg
DIE − UNAM / CECHIMEX 216
As we can see, according to the Brazilian Central Bank (BCB), China’s participation as an investor in Brazil has been, and still is, marginal or almost negligible. However, this number is probably underestimated ac-cording to the MDIC, given the fact that Chinese firms also invest through indirect routes coming from Hong Kong, Macao and tax havens in which Chinese companies are located (MDIC 2006).
In fact, when comparing with Chinese official statistics, we find sizeable discrepancies. According to China’s Statistical Bulletin, FDI outflows to Brazil totaled US$15 million and 10 million in 2005 and 2006, compared to the US$3.7 million and US$4.1 million reported by the BCB. In spite of this, 2007 and the first three quarters of 2008 have shown a marked in-crease of Chinese FDI compared to previous years (of US$24 million and US$31 million, respectively) but this is still small in relative value.
If we look at total FDI inflows by sector, services and manufacturing ac-count for the bulk of direct investment flows coming from overseas. A 54% share in services is mainly explained by the telecommunications sector (15%), electricity, gas and water (8%), and financial services (7%), among others. On the other hand, manufacturing accounts for 38% of total inflows, mainly coming from the food and beverages sector (9%), chemi-cal products (6%), vehicles (5%), and metal industries (3%). Finally, agri-cultural and mineral extraction industries add up to 7% of the total FDI inflows between 2001 and 2006.
Furthermore, when looking at Chinese FDI inflows by sector, 37% is di-rected to fertilizers and agrochemicals, 14% to iron products, 14% to beer and malts, and 4% to wholesale and retail. Finally, other registered in-vestments were destined for management consulting services (2%) and oil and gas (2%), among others.
Another source of FDI information can be found in the National Invest-ment Registry (NRI) which states that the stock of announced investment projects by Chinese firms would total US$7.300 million between 2005 and 2007.21 Accordingly, Table 21 shows the announced projects as published by the NRI, where the joint venture between Vale do Rio Doce (CVRD), Arcelor and Baosteel adds up to US$5.500 million, or 75% of the total projects by Chinese firms. Strikingly, due to the negative effects of the
21 http://investimentos.desenvolvimento.gov.br

The Brazilian Case
DIE − UNAM / CECHIMEX 217
recent financial crisis, both companies announced the suspension of the plant’s construction, and the liquidation of the joint venture between CVRD and Baosteel.22
However, when we look at Chinese FDI in Brazil, we find that almost 90% of non-metal industries investment is directed to the electronics sec-tor, 3% to telecommunications, and 2% to electrical appliances and motor-cycles. Indeed, the bulk of the projects seems to be greenfield investments, with 74% of the total.
Out of this percentage, 95% is from the electronics sector and 4% from transport machinery (see Table 22). In contrast, 16% of announced proj-ects are expansions to previous investments, mainly explained by the elec-tronics sector (75%) and telecommunications (21%). Modernization in-vestments only accounted for 10% of announced investments, and were directed towards projects in the electronic (75%) and electrical machinery (25%) sectors. Since NRI data does not follow the balance of payments methodology used to estimate FDI inflows, these figures should be taken cautiously, and as an indicative measure of private sector activity.
22 http://www.tradingmarkets.com/.site/news/Stock%20News/2196808/
Since all investment announcements are provided by the National Registry of Invest-ments (NRI), and updated on a regular basis, it is extremely difficult to truly and inde-pendently assess whether investments were actually made or not up until today. Furthermore, this task is even more burdensome as the amount of investment is rather low for most project announcements.
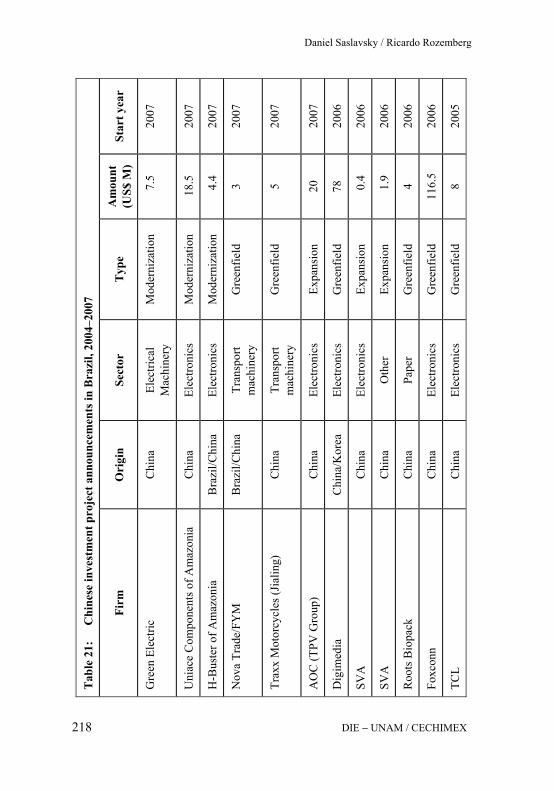
Tab
le 2
1:
Chi
nese
inve
stm
ent p
roje
ct a
nnou
ncem
ents
in B
razi
l, 20
04–2
007
Firm
O
rigi
n Se
ctor
T
ype
Am
ount
(U
S$ M
) St
art y
ear
Gre
en E
lect
ric
Chi
na
Elec
trica
l M
achi
nery
M
oder
niza
tion
7.5
20
07
Uni
ace
Com
pone
nts o
f Am
azon
ia
Chi
na
Elec
troni
cs
Mod
erni
zatio
n 18
.5
2007
H-B
uste
r of A
maz
onia
B
razi
l/Chi
na
Elec
troni
cs
Mod
erni
zatio
n 4
.4
2007
Nov
a Tr
ade/
FYM
B
razi
l/Chi
na
Tran
spor
t m
achi
nery
G
reen
field
3
2007
Trax
x M
otor
cycl
es (J
ialin
g)
Chi
na
Tran
spor
t m
achi
nery
G
reen
field
5
2007
AO
C (T
PV G
roup
) C
hina
El
ectro
nics
Ex
pans
ion
20
2007
Dig
imed
ia
Chi
na/K
orea
El
ectro
nics
G
reen
field
78
20
06
SVA
C
hina
El
ectro
nics
Ex
pans
ion
0.4
20
06
SVA
C
hina
O
ther
Ex
pans
ion
1.9
20
06
Roo
ts B
iopa
ck
Chi
na
Pape
r G
reen
field
4
2006
Foxc
onn
Chi
na
Elec
troni
cs
Gre
enfie
ld
116.
5 20
06
TCL
Chi
na
Elec
troni
cs
Gre
enfie
ld
8 20
05
Daniel Saslavsky / Ricardo Rozemberg
DIE − UNAM / CECHIMEX 218

Tab
le 2
1 (c
ont.)
: C
hine
se in
vest
men
t pro
ject
ann
ounc
emen
ts in
Bra
zil,
2004
–200
7
Firm
O
rigi
n Se
ctor
T
ype
Am
ount
(U
S$ M
) St
art y
ear
AO
C (T
PV G
roup
) C
hina
El
ectro
nics
Ex
pans
ion
8 20
05
TPV
C
hina
El
ectro
nics
Ex
pans
ion
2 20
05
Gig
abyt
e Te
chno
logi
es
Chi
na
Elec
troni
cs
Expa
nsio
n 6
2004
BV
Ste
el W
orks
(joi
nt v
entu
re:
Com
panh
ia V
ale
do R
io
Doc
e/B
aost
eel/A
rcel
or)*
Bra
zil
Chi
na
Luxe
mbo
urg
Met
al in
dust
ries
Gre
enfie
ld
5,50
0 20
04
AO
C (T
PV G
roup
) C
hina
El
ectro
nics
G
reen
field
3.
4 20
04
SVA
C
hina
El
ectro
nics
G
reen
field
9.
9 20
04
ZTE
Chi
na
Tele
-co
mm
unic
atio
ns
Expa
nsio
n 10
20
04
Com
panh
ia V
ale
do R
io D
oce
/ C
halc
o*
Bra
zil/C
hina
M
etal
indu
strie
s G
reen
field
/ ex
pans
ion
1,50
0 20
04
* A
s of M
arch
200
9, th
is jo
int v
entu
re is
susp
ende
d.
Sour
ce:
MD
IC N
atio
nal I
nves
tmen
t Reg
istry
The Brazilian Case
DIE − UNAM / CECHIMEX 219

Daniel Saslavsky / Ricardo Rozemberg
DIE − UNAM / CECHIMEX 220
Table 22: Non metal-industry investment announcements in Brazil, by sector and type of investment, 2004–2007
Type Sector % Total % of Type Electronics 12% 75% Other 1% 4%
Expansion
Telecommunications 3% 21% Total expansion 16% 100%
Electronics 70% 95% Transport machinery 3% 4%
Greenfield
Paper 1% 2% Total greenfield 74% 100%
Electrical machinery 2% 25% Modernization Electronics 7% 75%
Total modernization 10% 100% Source: MDIC National Investment Registry
5.2 Brazilian investments in China In Table 23 we present Brazilian outward FDI stocks by destination coun-try. Tax havens such as Cayman and the British Virgin Islands are by far the most important destinations for investment flows. Other important destination countries are Denmark (7.6% of average stocks in 2001–2006), Spain (4.8%), United States (4.6%), MERCOSUR partners Uruguay and Argentina (3.6% and 3% respectively) and the Netherlands (2.4%). As we can see, even though Brazilian FDI stocks in China increased six-fold between 2001 and 2006 from US$15 million to US$93 million, these numbers are still insignificant in the Brazilian economy as a whole. On average, China received much less than 1% of Brazilian direct investments abroad.
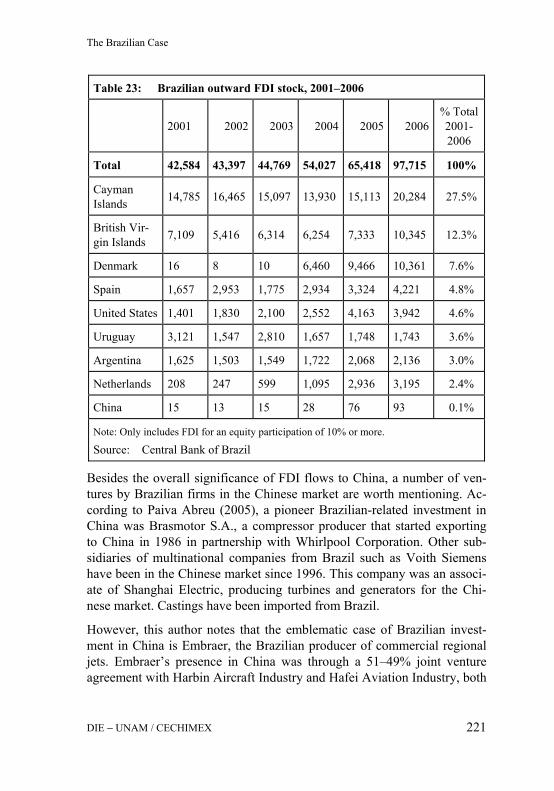
The Brazilian Case
DIE − UNAM / CECHIMEX 221
Table 23: Brazilian outward FDI stock, 2001–2006
2001 2002 2003 2004 2005 2006
% Total 2001- 2006
Total 42,584 43,397 44,769 54,027 65,418 97,715 100%
Cayman Islands 14,785 16,465 15,097 13,930 15,113 20,284 27.5%
British Vir-gin Islands 7,109 5,416 6,314 6,254 7,333 10,345 12.3%
Denmark 16 8 10 6,460 9,466 10,361 7.6%
Spain 1,657 2,953 1,775 2,934 3,324 4,221 4.8%
United States 1,401 1,830 2,100 2,552 4,163 3,942 4.6%
Uruguay 3,121 1,547 2,810 1,657 1,748 1,743 3.6%
Argentina 1,625 1,503 1,549 1,722 2,068 2,136 3.0%
Netherlands 208 247 599 1,095 2,936 3,195 2.4%
China 15 13 15 28 76 93 0.1%
Note: Only includes FDI for an equity participation of 10% or more.
Source: Central Bank of Brazil
Besides the overall significance of FDI flows to China, a number of ven-tures by Brazilian firms in the Chinese market are worth mentioning. Ac-cording to Paiva Abreu (2005), a pioneer Brazilian-related investment in China was Brasmotor S.A., a compressor producer that started exporting to China in 1986 in partnership with Whirlpool Corporation. Other sub-sidiaries of multinational companies from Brazil such as Voith Siemens have been in the Chinese market since 1996. This company was an associ-ate of Shanghai Electric, producing turbines and generators for the Chi-nese market. Castings have been imported from Brazil.
However, this author notes that the emblematic case of Brazilian invest-ment in China is Embraer, the Brazilian producer of commercial regional jets. Embraer’s presence in China was through a 51–49% joint venture agreement with Harbin Aircraft Industry and Hafei Aviation Industry, both
Daniel Saslavsky / Ricardo Rozemberg
DIE − UNAM / CECHIMEX 222
controlled by China Aviation Industry Corporation. A US$50 million investment plan involved the production of Embraer RJ145, a regional jet for 50 passengers in Heilogjang province, in Northern China. The first Chinese RJ-145 had its first test flight in December 2003.
Another interesting case is that of WEG, a Brazilian firm that invested US$18 million to set up a production plant of LV and HV three-phase electric motors used largely in the steel, mining, chemical and petro-chemical industries and also in pump and compressor manufactures. WEG Nantong Electric Motor Manufacturing is located in an Economical De-velopment Zone of Jiangsu Province, 155 miles from Shanghai.
Furthermore, a number of Brazilian firms have established their operations abroad by investing in plants, businesses and commercial offices in China. According to the Economic Development Ministry (Desenvolvimento), the following companies have a presence in the Asian country:
— Marcopolo, the manufacturer of vehicle parts and buses, is already installed in China with an industrial plant located in the city of Wusi, near Shanghai;
— Politec Global IT Services is a leading Brazilian IT Services provider, founded in 1970 with over US$300 million in revenues and more than 5000 employees;
— Sadia, the leading Brazilian meat processor with over US$3000 mil-lion worth of exports in poultry;
— Arezzo, a maker of women’s shoes, has invested in a number of retail shops in the Shanghai area;
— Cooxupé, one of the largest coffee-growing cooperatives in the world, has established a series of coffee shops in China;
— Gerdau, the Brazilian-based multinational steelmaker has established a commercial office in China;
— Suzano, the leading paper and cellulose producer has established a commercial office in China;
— Banco do Brasil and Petrobras, a national bank and the flagship state-controlled oil and gas company also has commercial offices in China.

The Brazilian Case
DIE − UNAM / CECHIMEX 223
Conclusions
For some developing economies, China’s growing demand for raw materi-als, foods and fuels has been a key driver of exports, growth and, to a lesser extent, job creation. This remarkable expansion was also accompa-nied in between 2001−2002 and 2008 by an exceptional upward cycle in the world economy since the previous major economic crises took place in the US and in middle-income countries such as Argentina. For countries such as Brazil the improvement in trade was a major factor behind eco-nomic growth.
It is unquestionable that China has become a major partner for Brazil, both as a supplier and as a destination for its exports. However, when examin-ing the pattern of trade we find that exports are severely concentrated in traditional products such as soybeans and more recently oil and iron ores. That is, the bulk of bilateral flows can be depicted as those of a North-South type, or even more so as bilateral flows with any developed econ-omy. In addition, the presence of large multinational companies explains the bulk of Brazilian exports.
The growing importance of China as a trading partner can also be under-stood as an issue of relative prices. As China became increasingly com-petitive as an exporter of capital goods and industrial supplies and, to a lesser extent, other consumption goods, its export bundle slowly followed a secular trend of falling manufacturing prices. Even when imported goods from China recovered from this trend in 2003, the huge demand for natural resource-based goods, and increasing commodity prices in which Brazil specializes, explain why Brazilian terms of trade expanded with such strength.
However, in overall terms the impact of Chinese growth on Brazilian industrial employment has been limited to a number of traditional, capital-intensive and resource-based sectors. Other economic activities have been, according to our estimations, challenged by Chinese exports. Furthermore, competition in third markets with Chinese goods has been particularly negative in the US and EU-27.
As Chinese imports have increased, trade restricting measures have been adopted by the Brazilian authorities. In particular, and, as seems to be the case not only for Brazil, antidumping cases have increased substantially,

Daniel Saslavsky / Ricardo Rozemberg
DIE − UNAM / CECHIMEX 224
while safeguards appear to have been adopted only as a “last resort”. As supported by our estimations, the most protected sectors were those that suffered from higher employment losses, such as optical and measuring instruments, electric material, electronic devices, textiles, etc. However, not all measures were in fact unilateral, since some degree of bilateral consensus has been reached in textiles and toys, particularly in the latter where private parties finally came to an understanding. On the other hand, recent developments in the international arena leave a worrisome perspec-tive for the future. As the world economy faces a steep slowdown, protec-tionist fears arise, potentially restricting Chinese exports that compete with labor–intensive domestic manufactures.
Finally, Chinese participation as an investor in the Brazilian economy is of little significance. The only sizeable investment announcements have been, in fact, enormously concentrated in the mining sector, thanks to a joint venture of Companhia Vale do Rio Doce with Chalco and Baosteel/ Arcelor. The vulnerability of the mining sector to the price drop in iron ore has resulted in the suspension of this joint venture, a markedly negative development for this industry. However, a positive sign of the presence of Brazilian companies in China is found in Embraer, the Brazilian airplane flagship company, along with other ventures in electrical machines and vehicles and their parts.
The Brazilian Case
DIE − UNAM / CECHIMEX 225
Bibliography
Balassa, B. (1965): Trade liberalisation and revealed comparative advantage, in: The Manchester School 33 (2), 99–123
Blázquez-Lidoy, J. / J. Rodríguez / J. Santiso (2006): ¿Ángel o demonio? Los efectos del comercio chino en los países de América Latina, in: Revista de la CEPAL 90, 17–43
Castro, L. / M. Olarreaga / D. Saslavsky (2006): The impact of trade with China and India on Argentina’s manufacturing employment, Washington, DC: World Bank (Policy Research Working paper 4153)
Chami Batista, J. (2006): Competition between Brazil and other exporting coun-tries in the U.S. import market: a new extension of constant-market-shares analysis, s. l., mimeo
Deutsche Bank Research (2006): China’s commodity hunger: implications for Africa and Latin America; online: http://www.dbresearch.com/PROD/ DBR_INTERNET_DE-PROD/PROD0000000000199956.pdf
Facchini, G. et al. (2007): Substitutability and Protectionism: Latin America’s trade policy and imports from China and India, Washington, DC: World Bank (Policy Research Working Paper Series 4188)
Fajnzylber, P. / W. F. Maloney (2005): Labor demand and trade reform in Latin America, in: Journal of International Economics 66 (2), 423–446
Freitas Barbosa, A. / R. Camargo (2006): Economic relations between Brazil and China: a difficult partnership, Sao Paulo: Friedrich Ebert Foundation (Brief-ing Paper)
Guerson, A. / J. Park / M. Parra Torrado (2007): Export structure and growth: a detailed analysis for Argentina, Washington, DC: World Bank (Policy Re-search Working Paper 4237)
Hausmann, R. / B. Klinger (2006): Structural transformation and patterns of com-parative advantage in the product space, Cambridge, Mass.: Harvard Univer-sity, Kennedy School of Government (Working Paper)
IDB (Inter-American Development Bank) (2004): The emergence of China: oppor-tunities and challenges for Latin America and the Caribbean, Washington DC: IDB Research Department
Jenkins, R. / K. Sen (2006): International trade and manufacturing employment in the South: four country case studies, in: Oxford Development Studies 34 (3), 299−322
MDIC (Ministry of Development, Industry and Trade of Brazil) (2006): Opportuni-ties for Chinese investments; online: desenvolvimento.gov.br/agenda china/in-dex.php/sitio/inicial

Daniel Saslavsky / Ricardo Rozemberg
DIE − UNAM / CECHIMEX 226
− (2007): Relatorio DECOM (Defesa Comrcial); online: http://www.mdic.gov. br/arquivos/ dwnl_1221598012.pdf
Paiva Abreu, M. (2005): China’s emergence in the global economy and Brazil, Rio de Janeiro: Pontifíca Universidade Católica do Rio de Janeiro, Departamento de Economía (Texto para Discussao 491)
Puga, F. (2004): O comércio Brasil-China: situacao atual epotencialidades de crescimento, Rio de Janeiro: BNDES (Textos para Discussao 104)
Richardson, J. D. (1971): Constant-market-shares analysis of export growth, in: Journal of International Economics 1 (2), 227-239
Roland-Holst, D. / J. Weiss (2005): People’s Republic of China and its neighbours: evidence on regional trade and investment effects, in: Asia Pacific Economic Literature 19 (2), 18–35
SNBT (Swedish National Board of Trade) (2005): The use of antidumping in Bra-zil, China, India and South Africa: rules, trends and causes, Stockholm (Re-port)
Weiss, J. / G Shanwen (2004): People’s Republic of China’s export threat to ASEAN: competition in the US and Japanese markets, Tokyo: Asian Devel-opment Bank Institute (Discussion Paper 2)

The Chilean Case
Jonathan R. Barton


The Chilean Case
DIE − UNAM / CECHIMEX 229
Contents
Introduction 231
1 Chile-China FDI flows 236
2 The Chilean production and export structure 239
3 The 2006 Free Trade Agreement (FTA) 242
4 Methodology 245
5 Chilean exports to China 247
6 Chilean imports from China 261
7 The impact of contemporary Chile-China trade 271
Bibliography 275
Figures
Figure 1: Chinese foreign investment in Chile by sector, 1975−2005 (accumulated, US$’000) 238
Figure 2: Chilean exports to China (US$; SITC Rev 3) 249
Figure 3: Chilean exports of fruit, nuts, excl. nut oils (Rev 3: 057, US$) 255 Figure 4: Chilean exports of pulp and waste paper (Rev 3: 251, US$) 255

The Chilean Case
DIE − UNAM / CECHIMEX 230
Figure 5: Chilean exports of animal feedstuffs (Rev 3: 081, US$) 256
Figure 6: Chilean exports of fish (fresh, frozen, chilled) (Rev 3: 034, US$) 256
Figure 7: Principal Chilean exports to China, 1990−2005 (US$) 257
Figure 8: Principal Chilean exports to Hong Kong, 1990−2006 (US$) 258
Figure 9: Principal Chilean exporting firms to China, 2002−2005 (US$) 260
Figure 10: Chilean imports from China (US$; SITC Rev 3) 262
Figure 11: Principal exporters to Chile (2002−2008) 264
Figure 12: Trend in Chilean imports from China, 1997–2007 (US$ million CIF) 265
Figure 13: Principal Chinese exports to Chile (1990−2005) 266
Figure 14: Principal Hong Kong exports to Chile (1990−2006) 268
Tables
Table 1: Actual FDI in China by origin (US$10,000) 237
Table 2: Leading Chilean exporting firms to China 240
Table 3: Shares of leading Chilean exports to China (as % of all exports to China; US$, SITC Rev 3) 250
Table 4: Relative importance of regional exports 252
Table 5: Chilean exports to China, 1997–2007 (US$ ‘000 FOB) 253
Table 6: Chilean imports from China, 1997−2007 (US$ ‘000 CIF) 264
The Chilean Case
DIE − UNAM / CECHIMEX 231
The Chilean Case
Jonathan R. Barton
Introduction
Chile has been one of the frontrunners in terms of economic globalization since the mid-1970s. International economic policy has been one of open-ing up the Chilean market and reducing tariffs and capital movement re-strictions. At the same time, it has targeted export-oriented development as the key to national development, turning the clock back on the Chilean development model to the pre-1940s period prior to Import Substituting Industrialization (ISI) when it was one of the most open international economies.
During the 1990s, the rise of the Pacific Rim economies through the Asia-Pacific Economic Cooperation (APEC), and the ability to cement bilateral agreements, led to increased Chilean attention to countries to the east, denting slightly the traditional bonds with the United States of America (USA) and Europe. The policy of “open regionalism” pursued by the Concertación governments in Chile since 1990 have contributed to this situation, seeking new commercial opportunities wherever possible for the export-oriented economy (Boletín Asia Pacífico 2006).
In the Asia Pacific Region, Chile has now consolidated agreements with not only China, but also Korea, Brunei Darussalam and New Zealand since 2004; Vietnam is now likely to be the next target for commercial talks (Revista Capital 2007a), once negotiations with India have been consolidated. This reveals that the APEC model has had its benefits for diverse countries in the Asia Pacific zone, with not only the traditional economic dimensions now being discussed at APEC meetings, but also now the challenges resulting from the fruits of closer cooperation: corrup-tion; energy; cultural exchanges; human security, etc. With 60% of world production and trade associated with this block, the attraction of being an active partner has had a strong impact on Chilean international economic policy (Gutiérrez 2007).
The precise targets for the Asia Pacific region set out in the Declaration of Bogor (1994) are those of freeing up trade and investment (2010 for de-
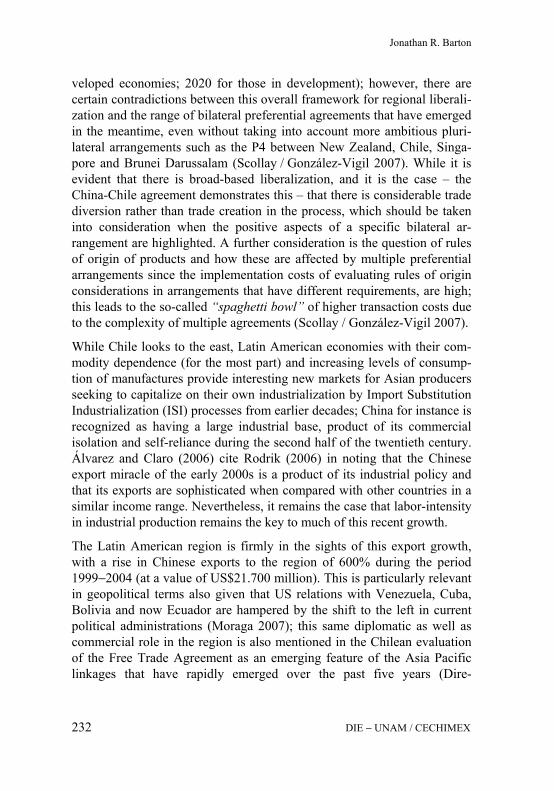
Jonathan R. Barton
DIE − UNAM / CECHIMEX 232
veloped economies; 2020 for those in development); however, there are certain contradictions between this overall framework for regional liberali-zation and the range of bilateral preferential agreements that have emerged in the meantime, even without taking into account more ambitious pluri-lateral arrangements such as the P4 between New Zealand, Chile, Singa-pore and Brunei Darussalam (Scollay / González-Vigil 2007). While it is evident that there is broad-based liberalization, and it is the case – the China-Chile agreement demonstrates this – that there is considerable trade diversion rather than trade creation in the process, which should be taken into consideration when the positive aspects of a specific bilateral ar-rangement are highlighted. A further consideration is the question of rules of origin of products and how these are affected by multiple preferential arrangements since the implementation costs of evaluating rules of origin considerations in arrangements that have different requirements, are high; this leads to the so-called “spaghetti bowl” of higher transaction costs due to the complexity of multiple agreements (Scollay / González-Vigil 2007).
While Chile looks to the east, Latin American economies with their com-modity dependence (for the most part) and increasing levels of consump-tion of manufactures provide interesting new markets for Asian producers seeking to capitalize on their own industrialization by Import Substitution Industrialization (ISI) processes from earlier decades; China for instance is recognized as having a large industrial base, product of its commercial isolation and self-reliance during the second half of the twentieth century. Álvarez and Claro (2006) cite Rodrik (2006) in noting that the Chinese export miracle of the early 2000s is a product of its industrial policy and that its exports are sophisticated when compared with other countries in a similar income range. Nevertheless, it remains the case that labor-intensity in industrial production remains the key to much of this recent growth.
The Latin American region is firmly in the sights of this export growth, with a rise in Chinese exports to the region of 600% during the period 1999−2004 (at a value of US$21.700 million). This is particularly relevant in geopolitical terms also given that US relations with Venezuela, Cuba, Bolivia and now Ecuador are hampered by the shift to the left in current political administrations (Moraga 2007); this same diplomatic as well as commercial role in the region is also mentioned in the Chilean evaluation of the Free Trade Agreement as an emerging feature of the Asia Pacific linkages that have rapidly emerged over the past five years (Dire-
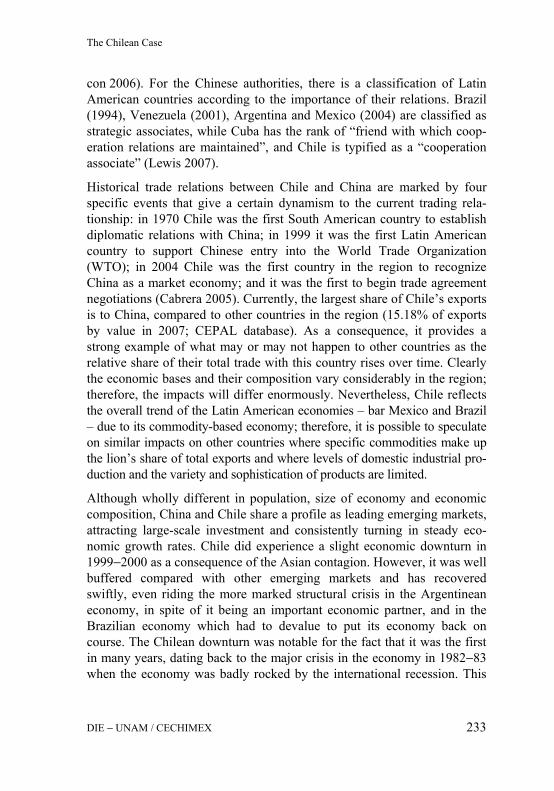
The Chilean Case
DIE − UNAM / CECHIMEX 233
con 2006). For the Chinese authorities, there is a classification of Latin American countries according to the importance of their relations. Brazil (1994), Venezuela (2001), Argentina and Mexico (2004) are classified as strategic associates, while Cuba has the rank of “friend with which coop-eration relations are maintained”, and Chile is typified as a “cooperation associate” (Lewis 2007).
Historical trade relations between Chile and China are marked by four specific events that give a certain dynamism to the current trading rela-tionship: in 1970 Chile was the first South American country to establish diplomatic relations with China; in 1999 it was the first Latin American country to support Chinese entry into the World Trade Organization (WTO); in 2004 Chile was the first country in the region to recognize China as a market economy; and it was the first to begin trade agreement negotiations (Cabrera 2005). Currently, the largest share of Chile’s exports is to China, compared to other countries in the region (15.18% of exports by value in 2007; CEPAL database). As a consequence, it provides a strong example of what may or may not happen to other countries as the relative share of their total trade with this country rises over time. Clearly the economic bases and their composition vary considerably in the region; therefore, the impacts will differ enormously. Nevertheless, Chile reflects the overall trend of the Latin American economies – bar Mexico and Brazil – due to its commodity-based economy; therefore, it is possible to speculate on similar impacts on other countries where specific commodities make up the lion’s share of total exports and where levels of domestic industrial pro-duction and the variety and sophistication of products are limited.
Although wholly different in population, size of economy and economic composition, China and Chile share a profile as leading emerging markets, attracting large-scale investment and consistently turning in steady eco-nomic growth rates. Chile did experience a slight economic downturn in 1999−2000 as a consequence of the Asian contagion. However, it was well buffered compared with other emerging markets and has recovered swiftly, even riding the more marked structural crisis in the Argentinean economy, in spite of it being an important economic partner, and in the Brazilian economy which had to devalue to put its economy back on course. The Chilean downturn was notable for the fact that it was the first in many years, dating back to the major crisis in the economy in 1982−83 when the economy was badly rocked by the international recession. This
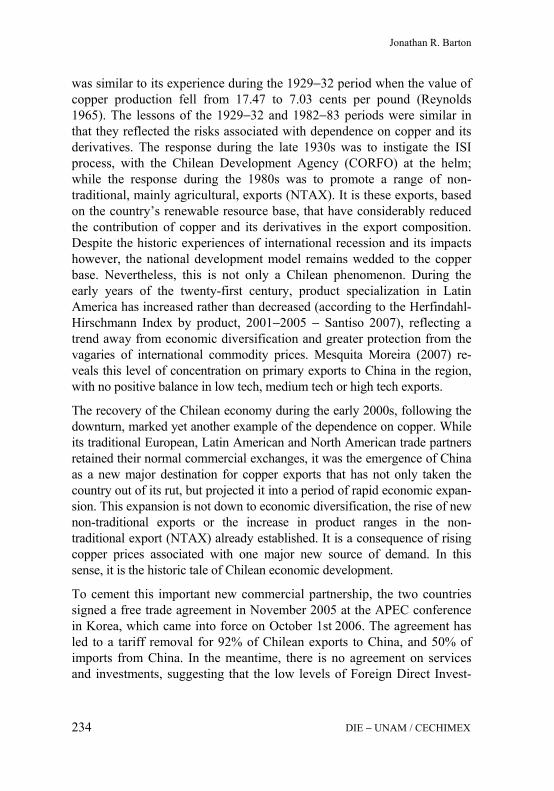
Jonathan R. Barton
DIE − UNAM / CECHIMEX 234
was similar to its experience during the 1929−32 period when the value of copper production fell from 17.47 to 7.03 cents per pound (Reynolds 1965). The lessons of the 1929−32 and 1982−83 periods were similar in that they reflected the risks associated with dependence on copper and its derivatives. The response during the late 1930s was to instigate the ISI process, with the Chilean Development Agency (CORFO) at the helm; while the response during the 1980s was to promote a range of non-traditional, mainly agricultural, exports (NTAX). It is these exports, based on the country’s renewable resource base, that have considerably reduced the contribution of copper and its derivatives in the export composition. Despite the historic experiences of international recession and its impacts however, the national development model remains wedded to the copper base. Nevertheless, this is not only a Chilean phenomenon. During the early years of the twenty-first century, product specialization in Latin America has increased rather than decreased (according to the Herfindahl-Hirschmann Index by product, 2001−2005 − Santiso 2007), reflecting a trend away from economic diversification and greater protection from the vagaries of international commodity prices. Mesquita Moreira (2007) re-veals this level of concentration on primary exports to China in the region, with no positive balance in low tech, medium tech or high tech exports.
The recovery of the Chilean economy during the early 2000s, following the downturn, marked yet another example of the dependence on copper. While its traditional European, Latin American and North American trade partners retained their normal commercial exchanges, it was the emergence of China as a new major destination for copper exports that has not only taken the country out of its rut, but projected it into a period of rapid economic expan-sion. This expansion is not down to economic diversification, the rise of new non-traditional exports or the increase in product ranges in the non-traditional export (NTAX) already established. It is a consequence of rising copper prices associated with one major new source of demand. In this sense, it is the historic tale of Chilean economic development.
To cement this important new commercial partnership, the two countries signed a free trade agreement in November 2005 at the APEC conference in Korea, which came into force on October 1st 2006. The agreement has led to a tariff removal for 92% of Chilean exports to China, and 50% of imports from China. In the meantime, there is no agreement on services and investments, suggesting that the low levels of Foreign Direct Invest-

The Chilean Case
DIE − UNAM / CECHIMEX 235
ment (FDI) exchange will remain in the near future (Ministry of Foreign Affairs of Chile 2007)1.
If and when services and investments are discussed, there are clearly sig-nificant opportunities for the Chilean economy to promote the country as a platform for Chinese commercial activities in the region. Although Chi-nese FDI remains low at present, any increase in this investment will re-quire regional headquarters and it is this that Chile, and Santiago in par-ticular, has sought to provide over the last decade due to its stable political and economic environment. During the administration of Ricardo Lagos (2000−2006) the strategy of Chile – País Plataforma (in regional terms) – was central to international commercial relations strategy. This strategy has been carried over into the Bachelet presidency, as noted by Artaza (2007, 59):
“There are positive signs in the speeches of the Minister of Foreign Af-fairs: on December 21st [2006] he assured us of a ‘distinctive mark’ on the foreign policy of President Michelle Bachelet to ‘turn towards Pa-cific Asia with all the energies of this government...he assured us that the concept of ‘Chile, bridging country’ between Pacific Asia and South America ‘already has a structural reality’, with significant advances in the ‘ambitious plan to convert Chile into the commercial nexus between South America and Asia Pacific.”
The free trade agreement has provided clarity regarding the opportunities and threats facing both countries. Taking short and medium-term consid-erations into account, it would appear that the opportunities for both coun-tries outweigh the threats due to the lack of overlap in the two countries’ trading structures. If anything, the potential threat facing Chile is in terms of the major role that Chinese copper demand has on the current Chilean economic situation. Nevertheless, copper dependence with China will be little different from copper dependence with the US during the twentieth century, or nitrate dependence with Britain during the nineteenth century. It is relevant to note that 2006 marked a significant downturn in Chinese demand for copper, with Chilean refined copper exports to China falling 32% year on year. Due to high international copper prices, China fell back on its reserves and sought to increase domestic production in two new mines (Ministry of Foreign Affairs of Chile 2007). With such significance
1 Since this was written, Chile and China have signed a supplementary agreement on
services and begun negotiations on investment.

Jonathan R. Barton
DIE − UNAM / CECHIMEX 236
placed on the Chinese market, this type of instability has potentially sig-nificant repercussions for the Chilean economy.
In terms of the Chilean economic structure and the threat from Chinese imports, the major threats are faced by sectors that have been struggling over the past decades such as garments and footwear. In the mid-1990s they faced stiff competition from other Latin American producers due to the tariff re-ductions in the context of Mercado Común del Sur (MERCOSUR) (as an associate member) and other bilateral and multilateral initiatives, such as the trade agreements with Mexico (since 1999) and the Central American bloc (since 2002). Nevertheless, it is in the field of electronics that Chinese ex-ports to Chile are strongest and where mutual benefits will accrue; for ex-ample, China currently manufactures half of world DVD players, 30% of computers and mobiles phones (Guardia 2007).
1 Chile-China FDI flows
Beyond the exchange of goods and services, it may be expected that the trade agreement will cement further confidence for establishing FDI in both directions. Currently, the flow of Chilean FDI remains concentrated in Latin America, in neighboring countries in particular. However, the scale and diversity of outward investment has gained rapidly during the past five years, seeking to build on the economic successes in the country and take advantage of opportunities in the region as bilateral and multilateral agree-ments have given greater security to investments. Total Chilean FDI during the 1990−2006 period has favored Argentina in particular (38%), followed by Brazil 17%, Peru 14%, and Colombia 12% (Direcon 2007).
There have been a number of investments in China since 1990, covering a diversity of sectors. In 2003, an estimated 51 Chilean projects in the country had been approved, totaling US$51.60 million of contracted investment. Among the firms involved are Molymet, Cerámicas Indus-triales, Compañía Sudamericana de Vapores and offices of the Bank of Chile and BCI (Ministry of Foreign Affairs PRC 2007; Moraga 2007). Recent Chilean FDI flows to China have been falling however. In global terms, China has been generating most investment for its manufacturing sector, totaling 70.4% of total FDI in 2006 (National Bureau of Statistics of China, s. a.).

The Chilean Case
DIE − UNAM / CECHIMEX 237
Table 1: Actual FDI in China by origin (US$10,000)
2002 2003 2004 2005
Chile 1,189 801 339 636
Latin America* (% from Chile)
754,979 0.16 %
690,657 0.12 %
904,353 0.03 %
1,129,333 0.1 %
Total FDI (% from Chile)
5,274,286 0.02 %
5,350,467 0.01 %
6,062,998 0.005 %
6,032,459 0.01 %
* Much of this regional investment is generated from tax havens such as the Cayman Islands and the Virgin Islands, etc.
Source: National Bureau of Statistics of China (s. a.)
It is not only in flows of goods and services that China’s recent growth has impacted world trade, but also in FDI as it has become an increasingly attractive option for international capital: US$ 440,000 million of FDI has flowed into the country between 1979−2002, initially into specially desig-nated zones, but now more widespread. During the early 2000s, China has absorbed 50% of all new FDI into Asia, and 30% of that flowing into developing economies (Guardia 2007).
Chinese FDI to Chile remains small. Between 1974−2006, only US$84,046,000 Chinese FDI entered the country; of this total, 46% is concentrated in the forestry sector, with 51% destined for financial ser-vices (Foreign Investment Committee 2007). Perhaps most striking is that no new FDI has been registered since 1999, with most of the total reported being invested in the early 1990s (1993−95) (almost a third between 1974−89, during the dictatorship; this may relate to Taiwanese capital). In terms of the investment in financial services, the figures refer to trading companies in particular, such as CITICFOR Chile S.A. and INTERSHANG SMIEC S.A. aimed at promoting Chinese imports of ma-chinery and electronics in particular, which make up 50% of total Chinese exports to Chile (Banco Central de Chile 2004; Ministry of Foreign Af-fairs PRC 2007).
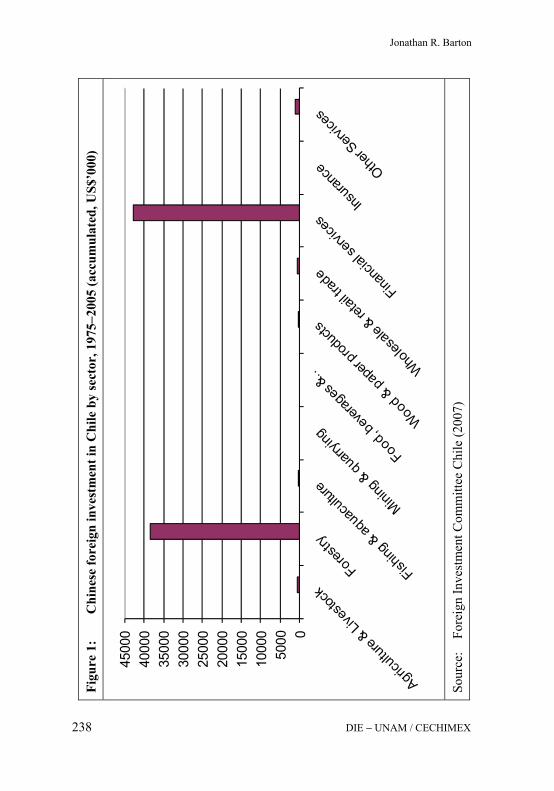
Figu
re 1
: C
hine
se fo
reig
n in
vest
men
t in
Chi
le b
y se
ctor
, 197
5−20
05 (a
ccum
ulat
ed, U
S$’0
00)
Sour
ce:
For
eign
Inve
stm
ent C
omm
ittee
Chi
le (2
007)
050
0010
000
1500
020
000
2500
030
000
3500
040
000
4500
0
Jonathan R. Barton
DIE − UNAM / CECHIMEX 238

The Chilean Case
DIE − UNAM / CECHIMEX 239
2 The Chilean production and export structure
The impacts of the strengthening of the Chile-China trade relationship are not difficult to assess given the lack of economic diversification in the Chilean economy. Unlike Mexico and Brazil, for instance, which both have strong manufacturing sectors which may compete with Chinese products in their own, and in third, markets, Chile remains highly undiver-sified in terms of its production and export structure.
Copper retains the role that it has consolidated since the collapse of nitrate exports from the 1920s. Copper and its derivatives are central to the na-tional economic structure and to its export profile, particularly when total values are taken into consideration. Although over 40% of total export values are generated by copper products, this is a decrease from previous decades. It was from the mid-1970s that alternative products entered the export structure, such as forestry products, fruit and wine, and salmon. Nevertheless, the copper sector remains vibrant. The most successful non-metal export is fisheries with an average of approximately 6% of export share since 2000 (CEPAL 2006). The most striking development of recent years is the rising importance of molybdenum. This product is found alongside copper deposits and it now accounts for more exports than any other single non-traditional product (2005, as ores and concentrates of titanium, vanadium, molybdenum, etc.).
The success of the copper sector has given rise to new concerns over de-pendence in recent years, and the need to invest in innovation to remain competitive into the future, especially in view of the limits of non-renewable reserves and the constant threat of a copper substitute (as with nitrates in the First World War); as copper prices rise, the threat of substi-tution also rises. In the case of copper, there is also the impact of the dis-covery of new reserves, which has been reported by China; the Chilean Ministry of Foreign Affairs expects these finds to affect the world copper market (Ministry of Foreign Affairs of Chile 2007). In 2005, legislation determining a royalty on copper production has generated a fund for inno-vation and competition, to invest in research and development in particular (although the criteria for the distribution of these funds remain conten-tious, especially for the regions where copper production takes place: the Regions of Atacama and Antofagasta).

Jonathan R. Barton
DIE − UNAM / CECHIMEX 240
Copper dependence goes hand in hand in Chilean economic history with the role of the state in this sector. For most of the two hundred years of Chilean independence and its dependence on mining, the private sector (essentially foreign capital) dominated production. However, from the early 1970s when copper was nationalized (with support across Congress) and the firm was created in 1976, CODELCO has been the leading firm in the sector. Despite the intensity of economic liberalization experienced in Chile since the mid-1970s, CODELCO has escaped privatization. Under the dictatorship it remained in state hands due to a legal provision whereby 10% of its earnings were transferred to the military budget; this situation remains due to complications in changing the constitution that established it. The importance of CODELCO to the Chilean economy is pivotal, there-fore the agreement signed in 2005 by CODELCO and the Chinese firm MinMetals is also central in terms of Chile-China commercial relations.
Table 2: Leading Chilean exporting firms to China
2005 2004 2003 2002
Chilean exporting firms $US (fob) Corporación Nacional Del Cobre De Chile, Codelco-Chile
1,446,679,850 1,046,225,727 480,514,561 390,496,436
Minera Escondida Ltda. 586,481,096 238,966,816 118,517,098 51,726,774
Minera Los Pelambres 278,660,701 71,892,092 23,427,867 20,601,894Empresa Nacional De Minería - Enami 270,673,336 347,504,452 186,269,303 157,033,311
Celulosa Arauco Y Constitución 266,956,554 249,488,640 150,698,095 161,548,326
Compañía Contractual Minera Candelaria 195,734,680 192,452,543 66,965,659 38,599,121
Compañía Minera Doña Inés De Collahuasi Scm
162,450,934 160,002,014 77,521,201 16,062,100
Minera Quebrada Blanca S.A. 140,847,346 94,698,402 29,182,323
Minera Cerro Colorado Ltda. 100,715,806 66,224,059

The Chilean Case
DIE − UNAM / CECHIMEX 241
Table 2 (cont.): Leading Chilean exporting firms to China
2005 2004 2003 2002
Chilean exporting firms $US (fob)
Compañía Minera Disputada De Las Condes Ltda.
90,162,414 62,319,140 54,194,140
Cmpc Celulosa S.A. 70,457,826 72,646,130 49,161,027 35,126,080Falconbridge Limited - Unidad De Negocios 65,951,853 51,233,652 16,064,183
Minera Michilla S.A. 56,407,719 47,307,137
Compañía Minera Carmen De Andacollo 39,656,633 35,616,433 26,437,205
Corpesca S.A. 39,125,016 26,344,765Anglo American Chile Ltda 56,543,112 31,655,690 22,584,952
Minera El Tesoro 37,375,951Compañía Minera Zaldívar 39,603,035
Minera Cerro Dominador S.A. 15,343,175
Compañía Minera Del Pacífico 13,906,482
Compañía Minera Huasco S.A. 13,843,712
Som Nitratos S.A. 12,804,758
Source: Based on Prochile (2007)
This agreement is a strategic partnership that ensures the supply of copper to China through an arrangement whereby the two firms established a new jointly-owned company based on US$110 million capital investment each. The joint venture guarantees a price for copper flows of 55,750 mt/yr from CODELCO to MinMetals. The new joint venture company is registered in the tax haven of Bermuda since 2006 as the firm Copper Partners Invest-ment Company Ltd (CuPIC) which unites Codelco’s preexisting Bermuda-based firm – Codelco International Ltd – and the MinMetals subsidiary

Jonathan R. Barton
DIE − UNAM / CECHIMEX 242
Album Enterprises Ltd. Given the nature of this firm’s registration, the investment associated with this venture does not appear as inward FDI of Chile or China, therefore overall Chilean copper inward FDI is underesti-mated (though legally precise). Additionally, MinMetals has the option of becoming involved in production also, through the Gaby mining project; the agreement gave them the opportunity to buy into the project up to 49% (CODELCO 2007).
This type of long-range strategic partnership reflects the importance of the China-Chile trade agreement, and the centrality of copper to the relation-ship. As an important raw material for China’s electronics and other manu-facturing sectors, the ability to guarantee not only supply but also price over time through a joint venture of this nature provides stability for both partners.
3 The 2006 Free Trade Agreement (FTA)
Clearly, trade with such a large potential market as China implies both positive and negative impacts. It is precisely these impacts that a Chilean government study sought to uncover in a 2004 report (Gobierno de Chile 2004). Its findings are summarized as follows:
For Chinese imports:
− Based on a 6% reduction in tariffs on Chinese imports (from 6% to 0%), it was estimated that there would be a 3% increase in Chinese imports, including both trade creation and trade diversion.
− Chilean global imports would increase by 0.7% as a consequence of lowering tariffs to Chinese imports.
− Agricultural imports would rise 7% but this figure remains low due to low levels of imports in this category. Any increase would likely be trade diversion rather than trade creation.
− Mining imports from China, in non-ferrous metals, would rise by 10% due to Chilean demand, mainly through trade creation.
− 99.6% of import growth from this source would be in industrial prod-ucts (US$167 million), mainly machinery and equipment, and elec-

The Chilean Case
DIE − UNAM / CECHIMEX 243
tronic products. Two-thirds of the growth would be trade creation, with a third of trade diversion.
− Apart from machinery and electronics, imports from China in the textile and apparel sub-sector would grow 10% to US$51 million (two-thirds trade creation, one-third trade diversion). Within this sub-sector, textiles lead the way, followed by confection and garments, and last of all footwear.
− Lastly, imports by the sector incorporating rubber, plastics, basic chemicals and prepared chemical products would grow by US$17 mil-lion, principally through trade creation.
For Chilean Exports:
− Exports of agricultural products would grow by 28%, mainly in fruit products (70% of the sectoral gain).
− Mining would account for only 4% of total export increases, due to a low tariff prior to the agreement.
− Foodstuff and beverage exports would grow to account for 79% of total industrial export expansion, followed by chemicals and processed wood products.
These evaluations were carried out using econometric techniques; how-ever, it is still too early to undertake an assessment of the actual impacts due to the fact that the agreement has only been up and running for less than a year. The government report concluded that the agreement would benefit the Chilean economy significantly and that it would balance out certain distortions created by agreements with the EU, the US and Korea.
Due to the outward orientation of the Chilean economy since the colonial period, and particularly strongly since the mid-1970s, it now displays clear advantages in a range of factor inputs compared with other countries in the region. In the edited work by Santiso (2007), when Chile is compared with Colombia, Peru, Brazil, Argentina, Ecuador, Venezuela and Mexico, it outperforms all of them in terms of competitiveness, transport, electricity and water as factors in production and trade. With competitiveness in these factors having been cast as a priority since the late 1970s, considerable importance has been placed on these elements in international economic policy and public and private finance has been destined to associated in-

Jonathan R. Barton
DIE − UNAM / CECHIMEX 244
frastructure improvements. In the Free Trade Agreement (FTA) this road, air and port infrastructure, as well as the customs and telecommunications improvements, are regarded as essential for the trade platform that has been established (Direcon 2006).
The principal benefits of the FTA, as outlined in the Chilean government assessment of the agreement (Direcon 2006), are summarized as follows:
− China became Chile’s second trading partner in 2005 due to total values of commercial exchange of US$6,988 million. To consolidate this relationship, Chilean trade would be favored over its competitors with preferential access to the market and clarity in rules pertaining to this trade.
− It is perceived that the current concentration on copper and cellulose exports will be favored less by the agreement than agricultural, live-stock, forestry and fisheries products. Therefore, although copper and other minerals will benefit, it will be other products that are most fa-vored by the tariff reduction: horticultural products; fish oils; chicken; pork; plums; frozen prawns; fresh peaches and nectarines; cheeses; cherries; canned peaches; and tomato paste. Fresh and frozen salmon, grapes and apples will benefit with a gradual reduction over a ten year period due to potential conflicts with national fisheries and fruit pro-duction.
− Chile was able to exclude 152 sensitive products from the agreement. These are principally agricultural products subject to price banding (wheat, flour and sugar), and some textiles and garments, metallurgi-cal and major appliances.
− Chilean consumers will benefit most from tariff reductions on ma-chinery, computers, printers, cars, mobile phones, and DVDs, among other electronic goods.
Perhaps the most interesting point that is made is the one relating to im-proved income and employment opportunities as a result of the agreement; which will – according to the agreement report by Direcon (2006) – con-tribute to more available income for the population. This is specified in slightly more detail (via a General Equilibrium Model) in terms of an increase in Chile’s gross domestic product (GDP) by 1.4% and an increase of an estimated 34,509 jobs (of which 28,778 are manual).

The Chilean Case
DIE − UNAM / CECHIMEX 245
4 Methodology
To establish trends in the commercial relationship, the first step was to obtain trade data for the years 1990 to 2005. During the dictatorship and up to 1990, there were no commercial relations between the countries; therefore, 1990 is a suitable starting date for the analysis of the evolution of the relationship. However, the entry of China into the WTO in 2001 and the resurgence of the Chilean economy from the early 1990s reflect a key turning point and the consolidation of a major trading relationship, both in terms of values and in terms of market shares relative to other trade partners.
The data employed for the graphics that follow are derived from the National Customs Service (www.aduana.cl), in particular the section Estadísticas de Comercio Exterior, ESTACOMEX (Free Trade Statis-tics). The tables relate to exports listed by product and expressed in dol-lars (FOB). The tables relating to imports by product are expressed in dollars (Tax Identification Code CIF). The codes for the items are those of the Chilean Customs Tariff which corresponds to the Harmonized System for the Designation and Codification of Goods.
In terms of exports, and bearing in mind that the number of products varied from 16 in 1990 to 291 in 2005, it was necessary to select the key export products. Products that reached a value of over US$ 1 million on average each year between 1990−2001 were selected. To complement the data for these selected products for the years 2002−2005, it was nec-essary to unify customs tariffs codes2, for example in the case of fish meal:
23012010 Flour, dust and “pellets”, of fish and crustaceans, mollusks and other aquatic invertebrates, unsuitable for human con sumption
23012011 Idem, with a protein content less than 66% by weight (stan- dard)
2 From 2000, Chilean customs system codes were modified, with the subdivision of the last
two digits principally. Also, other products were divided according to their last digits, and with less frequency with respect to their last four digits or last digit.

Jonathan R. Barton
DIE − UNAM / CECHIMEX 246
23012012 Idem, with a protein content equal or more than 66% by weight but less than 68% by weight (prime)
23012013 Idem, with a protein content over 68% by weight (super prime)
The series for each product had to be updated from 2002 by recalculating each for the sixteen years, giving the data for the 20 principal Chilean export products to China for the period 1990−2005.
In the case of imports, the procedure was more complex due to the sheer volume of data and the changes in the customs tariff codes from 2002. Firstly, the number of imported products varied from 1035 in 1990 to 3995 in 2005. This required a first filter in order to select the items that registered an annual value of over US$1 million. However, the results were numerous so this filter was doubled to US$2 million. To comple-ment the series for 2002−05 for each of the products required similar efforts as those for exports, in order to unify customs tariff codes, for example:
The product 64029900 corresponds to “other footwear with sole and upper of rubber or plastic” and had a subdivision in its last two digits (00). Therefore, from 2002−06, this item was found broken down into:
6402.9911 with base with length less than 24 cm
6402.9912 for men, with base with length equal or less than 24 cm
6402.9913 for women, with base with length equal or less than 24 cm
Others:
6402.9991 with base with length over 24 cm
6402.9992 for men, with base with length over 24 cm
6402.9993 for women, with base with length over 24 cm
As with exports, it was necessary to complete the series for each product over the 16 years (including those with figures less than two million dol-lars), to obtain 137 principal imports. To rationalize this list, the products that were more consistently represented each year among these imports were prioritized, leading to a list of 107.

The Chilean Case
DIE − UNAM / CECHIMEX 247
In terms of principal exporting firms and the principal exporters to Chile, data was generated from the Prochile website (www.prochile.cl), in par-ticular the section “Estadísticas de Comercio Exterior”. These data are only available for the period 2002−07; therefore the role of key firms be-tween 1990−2001 is unclear. However, it is likely that most of the firms were central to exporting activities during the 1990s. From these data, the central role of CODELCO is self-evident, with China becoming the fourth source of Chilean imports during the 2002−05 period.
5 Chilean exports to China
Despite the renewal of commercial relations from 1990, there is a clear surge in exports to China from 2000. This may well relate to China’s entry into the WTO in 2001 and the political situation relating to Chile’s other major trading partner: the USA (which may have led to a preference for US trade and fewer overtures towards China during the previous decade). During the 1990s, Chilean commercial policy was oriented towards increasing liberalization and cementing commercial relations through diverse agreements that enabled tariff reductions to proceed in advance of the more generalized, and complex General Agreement on Tariffs and Trade (GATT), then WTO trade rounds. Particularly important for Chile was the US market which had been vital for the country since the demise of the relationship with various European countries due to the exigencies of the World Wars (Barton 2000). From the early 1990s, Chile sought fast track entry into the North American Free Trade Agreement (NAFTA) but this was delayed repeatedly in the US Congress. It was not until the 2000s that the agreement would become consolidated, but as a bilateral agreement rather than in connection with NAFTA. By this time, Chile had already signed bilateral agreements with both Mexico and Canada. Pressure on the USA was increased by the fact that the EU was competing with the US notion of the Free Trade Area of the Americas (e.g. at the first EU-Latin American and Caribbean Summit in June 1999), attempting to encourage greater trade between the EU and Latin American countries.
Chilean commercial policy was effective in playing off these major blocs and was successful in signing an agreement with the US which
Jonathan R. Barton
DIE − UNAM / CECHIMEX 248
came into force in 2004, and one with the EU (an association agree-ment) which was initiated during the previous year. Since this time however, the strength of the production and trading power of the Asia Pacific bloc has created ideas of a Free Trade Area of the Asia Pacific (FTAAP) rather than merely the Americas. This was discussed at the APEC members meeting in Vietnam in 2006 and it would potentially mean the creation of a bloc that would dwarf both NAFTA and the EU. China is one of the members however it was more reticent about the concept, since it prefers to create bilateral agreements with other Asian countries for political as well as economic reasons, and would be op-posed to Taiwanese membership of such a bloc (Bergsten 2007; Tang / Wilhelmy / Fajardo 2007).
Despite the size of the US and EU markets, it has been China that has provided the greatest impetus to the Chilean economy over the last five years. Due to the relatively low starting point, the growth rates in the trading relationship have been dramatic. The current trend of Chilean exports instigated since 1999 remains strong, with particularly signifi-cant increases over the last two years (see Table 5). Much of the Chil-ean economy’s current buoyancy is due to this particular market de-mand. It is not only Chile that is benefiting from this strong demand however; China now provides 50% of the total principal metals de-mand (aluminum, copper and steel). This demand has led to China displacing Argentina to become the second most important commercial partner, and third only to the USA and Japan in total exports (Ministry of Foreign Affairs of Chile 2007). In terms of this Chilean export pro-file, the factor of Hong Kong as a separate reporting country is negli-gible given that, although copper cathodes are exported to Hong Kong they have not increased to any considerable degree over time (see Fig-ure 8). This suggests that Hong Kong is not a re-exporting country for Chilean copper exports into China itself, hence has little impact on overall trade data; although Hong Kong does re-export a large percent-age of its refined copper to China, it receives far more as imports from China for its own electronics equipment manufactures and exports. The data reveals that Hong Kong’s import profile from Chile is strongly influenced by non-traditional Chilean exports which compete with copper, thus revealing the relatively low copper values involved.

Figu
re 2
: C
hile
an e
xpor
ts to
Chi
na (U
S$; S
ITC
Rev
3)
Sour
ce:
Bas
ed o
n U
N C
omtra
de (2
007)
0
500,
000,
000
1,00
0,00
0,00
0
1,50
0,00
0,00
0
2,00
0,00
0,00
0
2,50
0,00
0,00
0
3,00
0,00
0,00
0
28.M
ETA
LLIF
ER
OU
S O
RE
,SC
RA
P
68.N
ON
-FE
RR
OU
S M
ETA
LS
25.P
ULP
AN
D W
AS
TE P
AP
ER
08.A
NIM
AL
FEE
D S
TUFF
The Chilean Case
DIE − UNAM / CECHIMEX 249

Jonathan R. Barton
DIE − UNAM / CECHIMEX 250
Table 3: Shares of leading Chilean exports to China* (as % of all exports to China; US$, SITC Rev 3)
2000 2001 2002 2003 2004 2005 2006 2007 Copper ores and concentrates (2831)
30.3 26.5 15.1 20.9 25.3 33.0 44.3 31.0
Copper anodes and alloys (6821)
42.4 31.3 46.4 49.4 53.0 43.0 35.0 50.9
Chemical wood pulp, bleached (2515)
10.5 17.3 11.8 8.2 8.4 6.5 6.7 6.5
Fish meal (0814) 2.6 5.5 7.3 5.0 2.8 3.8 3.5 2.0
Chemical wood pulp, unbleached (2514)
5.0 5.6 4.2 3.1 1.7 1.2 0.9 0.5
* Leading export shares to Hong Kong are copper anodes and alloys - 6821 (18.8% 2006; 39.2% 2004; 31.6% 2002); Fresh or dried grapes - 0575 (22.0% 2006; 15.6% 2004; 23.4% 2002); Fresh or dried fruit - 0579 (15.5% 2006; 9.5% 2004; 10.5% 2002). Total exports of copper anodes and alloys to Hong Kong total, by value (2006), 1.8% of all similar exports to China.
Source: Based on UN Comtrade (2008)
The products exported to China are those associated with Chile’s more traditional export profile. In particular, it is copper cathodes and copper mineral and concentrates (for processing in China) that dominate (see Figure 7); mining exports to China as a whole rose 1.605% between 1996−2005 (Direcon 2006). These products are not necessarily for domes-tic consumption in China. The Chilean Ministry of Foreign Affairs (2007) estimates that 90% of metal imports are processed in the country and ex-ported again in machinery and electronic goods. It would appear that this value-added processing is a sound strategic orientation, whereby lower labor and environmental costs facilitate better returns from this processing phase. For example, in the confection of garments for the US market, a Haitian worker receives US$16 a week against a Chinese worker who
The Chilean Case
DIE − UNAM / CECHIMEX 251
receives US$15, while in the Mexican maquilas, competition from Chi-nese workers earning 0.72 cents an hour has led to a loss of 500 of 3,700 maquiladoras (since Mexican labor is valued at 2.96 Dollars an hour) (Guardia 2007).
It is also important to note that China has traditionally maintained rela-tively high tariffs on more processed natural resource products, e.g. in forestry, fisheries and mining, leading to limited opportunities for adding value in Chile and still being able to export freely (Gobierno de Chile 2004). It is precisely this selective opening up of its market over time, and the gradual nature of this opening, that appears to have provided the coun-try with several opportunities (Direcon 2006; Stiglitz 2003), regardless of the risk involved with such a rapid growth rate (in terms of currency valuation, overheating, etc. remain a challenge). With entry into the WTO there has been a slow erosion of these barriers to more processed goods although the pace of tariff reductions means that these sectors may still be protected for several years to come (Guardia 2007).
The only non-metal products that rank among the principal products are fish meal and cellulose. These are regarded as among the more traditional exports (prior to the mid-1980s), and are based on intensive use of renew-able resources. The only major difference in terms of the national impact generated by these three product groups (copper and derivatives, fish meal and cellulose), which constitute 97% of total exports to China (Direcon 2006), are that the latter two are generated mostly in the centre-south re-gions of the country (the Regions of Bio-Bio, Araucania, and Los Lagos) while copper is mined principally in the north. The geographical concen-tration of the effects of production and trade with China can be seen in the following table.
It is the mining companies that are dominant among firms in Chile export-ing to China (see Table 2 and Figure 9). This reflects a pattern not only of the Chinese market but for all exports. Of the 22 firms that lead in exports to China, only three are not mining firms; these relate to cellulose (Arauco, and CMPC) and fish meal (CORPESCA) exports. Small and medium size exporting firms (PYMEX) make up 42% of all exporting firms by number, but participate in only 1% of the value of the trade (Direcon 2006). In terms of the overall export profile of the Chilean economy, these major firms are also dominant in their sectors, and their presence regarding the shift of sales to China from the early 1990s should be no surprise.

Jonathan R. Barton
DIE − UNAM / CECHIMEX 252
CODELCO and Minera Escondida (owned by the Australian company BHP Billiton) have been most aggressive in directing sales to China, but all the major mining companies have followed a similar pattern. Despite this concentrated dominance of Chilean exports to China however, it should be noted that the number of firms involved has risen from 28 in 1993 to 393 in 2003 (Banco Central de Chile 2004).
Table 4: Relative importance of regional exports
Region Regional share / Total exports
Regional share / Total exports (Chile to China)
% Regional exports to China
I 6.0 11.2 21.2
II 29.8 37.8 14.4
III 5.0 8.9 20.4
IV 4.8 8.1 19.0
V 10.0 14.5 16.4
VI 9.6 6.1 7.2
VII 2.5 1.4 6.5
VIII 10.0 8.4 9.6
IX 0.8 1.3 18.5
X 5.4 0.8 1.7
XII 0.8 0.3 3.6
XII 2.3 0.6 2.9
Metropoli-tan region 12.5 0.8 0.7
Source: Direcon (2006)
A major impact of the heightened demand for copper in the Chinese mar-ket has been a rapid strengthening of copper prices between 2004 and 2006: from 140 to 300 US cents/lb. Jaramillo and Selaive (2006) suggest that the role of speculators in this price shift is relevant but that it explains shorter term fluctuations rather than longer term influences (based on weekly price change analysis, 1992−2006); the alternative, and more likely, factor is the role of China and its copper demand. This boom in
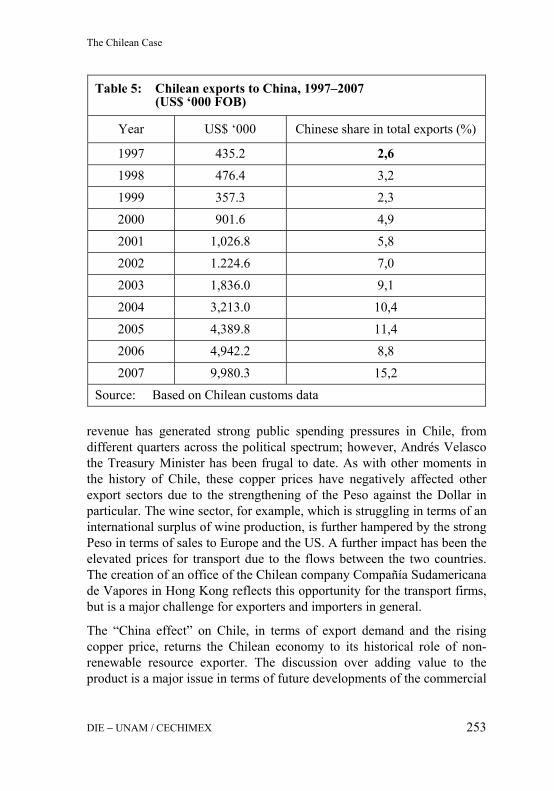
The Chilean Case
DIE − UNAM / CECHIMEX 253
Table 5: Chilean exports to China, 1997–2007 (US$ ‘000 FOB)
Year US$ ‘000 Chinese share in total exports (%)
1997 435.2 2,6
1998 476.4 3,2
1999 357.3 2,3
2000 901.6 4,9
2001 1,026.8 5,8
2002 1.224.6 7,0
2003 1,836.0 9,1
2004 3,213.0 10,4
2005 4,389.8 11,4
2006 4,942.2 8,8
2007 9,980.3 15,2
Source: Based on Chilean customs data
revenue has generated strong public spending pressures in Chile, from different quarters across the political spectrum; however, Andrés Velasco the Treasury Minister has been frugal to date. As with other moments in the history of Chile, these copper prices have negatively affected other export sectors due to the strengthening of the Peso against the Dollar in particular. The wine sector, for example, which is struggling in terms of an international surplus of wine production, is further hampered by the strong Peso in terms of sales to Europe and the US. A further impact has been the elevated prices for transport due to the flows between the two countries. The creation of an office of the Chilean company Compañía Sudamericana de Vapores in Hong Kong reflects this opportunity for the transport firms, but is a major challenge for exporters and importers in general.
The “China effect” on Chile, in terms of export demand and the rising copper price, returns the Chilean economy to its historical role of non-renewable resource exporter. The discussion over adding value to the product is a major issue in terms of future developments of the commercial
Jonathan R. Barton
DIE − UNAM / CECHIMEX 254
relationship. Clearly it is to Chile’s advantage to process as much copper as possible prior to export. However, there is also the possibility of CODELCO setting up refining facilities in China in the future, through the joint venture with MinMetals. These arrangements are not yet consoli-dated, however, the different options for adding value to the metal remain important in terms of the development of the relationship.
The trade agreement initiated in 2006 does not benefit the copper trade as much as other sectors due to the relative lack of copper supply opportuni-ties around the world; China has been particularly active in establishing strong links with African countries – other important sources of copper – which may also have encouraged the consolidation of a joint venture agreement. Chinese copper demand and rising prices were a phenomenon prior to the agreement. Nevertheless, the synchronization between the signing of the Codelco-MinMetals joint venture and the overall trade agreement is relevant. It provides Chile with guaranteed sales, and it pro-vides China with a secure price in spite of what happens in the metals exchange.
Perhaps of greater relevance in terms of the commercial agreement is the opening up of the Chinese market to fruits, wine, salmon and other goods. Percentage increases (2005−06) in certain non-traditional exports are re-corded as follows: salmon and trout 120% (from a low starting point, see Figure 6); wines 102%; plums 44%; cherries 43%; apples 37%; grapes 23% (ProChile 2008). Some traditional products, such as fish meal and forestry products, have also risen in recent years (see Figures 4 and 5). In return, the Chilean electronics market becomes more accessible to Chinese goods (for example, to compete with Korean goods benefiting from the Chile-Korean free trade agreement operating from 2004). To date, much of the entry of non-traditional agricultural exports into China has been beset by instability, whereby Chinese imports have not been sustained year on year; this has been the case for grapes, apples, cherries and plums for in-stance (Banco Central 2004). Despite this situation however, there is opti-mism that this market will be suitable for the new generation of higher value agricultural exports such as berries, cheeses, olive oil, etc. In broad terms, and comparing the Chinese market with Korea and Japan, it can be seen that three-digit export categories reveal trends that do not show that, over the longer term, the signs for all non-traditional export growth are favorable. Whereas there is no evidence of obstacles to Chilean exports in Chinese market relative to Korea and Japan in most sectors, in the case of

The Chilean Case
DIE − UNAM / CECHIMEX 255
fruit there would appear to be a strong contraction in recent years follow-ing a marked rise in 2002 (see Figure 3); this does not reflect the optimism for this sector according to the Chilean government report of 2004 (Go-bierno de Chile 2004); however, there is recognition that there will be a gradual reduction of tariffs in fruit over a ten year period, so increases can be expected over the longer term.
Figure 3: Chilean exports of fruit, nuts, excl. nut oils (Rev 3: 057, US$)
Source: Based on UN comtrade (2007)
Figure 4: Chilean exports of pulp and waste paper (Rev 3: 251, US$)
Source: Based on UN comtrade (2007)
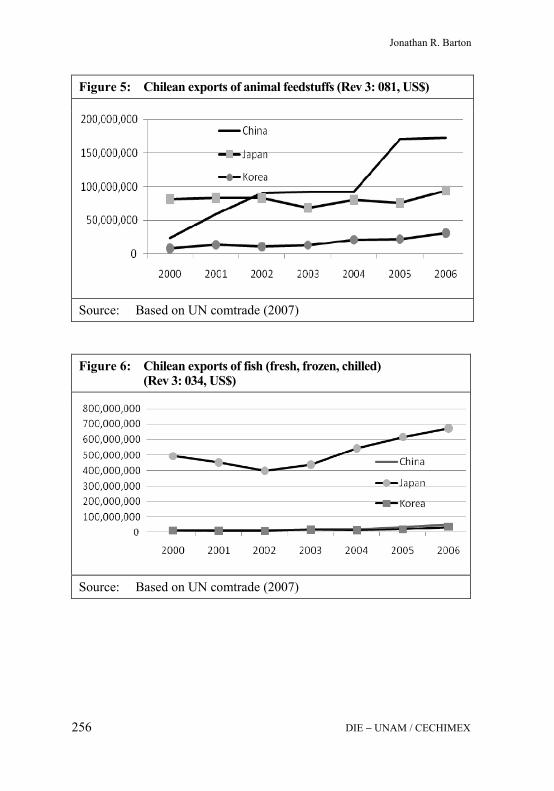
Jonathan R. Barton
DIE − UNAM / CECHIMEX 256
Figure 5: Chilean exports of animal feedstuffs (Rev 3: 081, US$)
Source: Based on UN comtrade (2007)
Figure 6: Chilean exports of fish (fresh, frozen, chilled) (Rev 3: 034, US$)
Source: Based on UN comtrade (2007)

Figu
re 7
: Pr
inci
pal C
hile
an e
xpor
ts to
Chi
na, 1
990−
2005
(US$
)
Sour
ce:
Bas
ed o
n C
hile
an c
usto
ms d
ata
The Chilean Case
DIE − UNAM / CECHIMEX 257

Figu
re 8
: Pr
inci
pal C
hile
an e
xpor
ts to
Hon
g K
ong,
199
0−20
06 (U
S$)
Sour
ce:
Bas
ed o
n C
hile
an c
usto
ms d
ata
-
20.0
00.0
00
40.0
00.0
00
60.0
00.0
00
80.0
00.0
00
100.0
00.0
00
120.0
00.0
00
140.0
00.0
00
2.60
1.91
83.
478.
608
5.88
8.39
62.
185.
255
2.26
0.42
51.
445.
866
1.01
4.54
81.
190.
439
Oth
er r
efin
ed c
oppe
r pr
oduc
ts74
0319
00
182.
672
2.05
9.12
898
1.17
638
3.96
323
4.43
513
0.19
044
.933
87.7
8231
.687
Win
es22
0421
10
51.1
421.
101.
541.
748.
364
767.
414
5 97
.200
2.68
2.40
1.96
7.43
23.
208.
789
1.96
0.41
9F
resh
app
lies
8081
000
162.
022
5.19
6.76
07.
316.
049
4.58
1.79
06.
576.
933
6.04
8.94
44.
630.
090
4.91
8.28
21.
969.
410
Mol
lusc
san
d ot
her
seaf
ood
1605
9090
288.
355
89.1
291.
760
Fre
sh c
herr
ies
8092
000
546.
030
5.40
1.36
33.
734.
733
1.50
5.48
696
5.54
453
9.34
11.
125.
957
676.
520
154.
909
Fre
sh p
lum
s80
9401
0
64.3
97.7
8682
.203
.346
27.5
40.2
8025
.467
.537
49.2
31.7
3837
.009
.985
121.
374.
657
27.7
98.3
3011
.441
.450
Cat
hode
s an
d ca
thod
e se
ctio
ns, o
f co
pper
7403
1100
2.94
7.77
240
.912
.774
34.2
63.2
0523
.559
.736
13.7
98.4
7412
.613
.015
13.9
54.8
869.
586.
398
4.48
3.12
2G
rape
s80
6100
0
1998
1997
1996
1995
1994
1993
1992
1991
1990
Jonathan R. Barton
DIE − UNAM / CECHIMEX 258

Figu
re 8
(con
t.):
Prin
cipa
l Chi
lean
exp
orts
to H
ong
Kon
g, 1
990−
2006
(US$
)
So
urce
: B
ased
on
Chi
lean
cus
tom
s dat
a
-
20.0
00.0
00
40.0
00.0
00
60.0
00.0
00
80.0
00.0
00
100.000.000
120.000.000
140.000.000
5.6
14.1
49
32
1.4
86
4.8
00.8
80
3.6
16.1
09
3.1
94.2
74
Oth
er r
efin
ed c
opper
pro
duct
s7
403
190
0
2.3
06.0
10
1.8
28.7
19
1.3
25.5
64
1.0
34.3
19
1.0
15.6
05
1.6
45.7
38
1.5
25.6
53
938
.178
Win
es2
204
211
0
5.9
73.6
54
4.4
16.5
10
6.6
08.2
37
4.0
74.4
85
99
7.0
47
1.1
82.2
48
34
1.5
95
3.3
00.7
48
Fre
sh a
ppl
ies
80
810
00
6.2
51.6
60
5.0
59.6
76
6.9
16.1
77
5.1
23.9
14
26
5.9
30
1.7
23.8
94
3.5
72.4
54
1.1
28.8
31
Mol
lusc
san
d ot
her
sea
food
1605
909
0
6.6
28.7
54
5.6
16.3
73
2.4
01.2
60
4.3
11.2
96
77
6.9
90
264
.425
62
2.6
57
438
.698
Fre
sh c
her
ries
80
920
00
8.0
22.4
73
5.7
29.5
81
6.7
33.2
20
3.5
28.5
62
1.8
81.2
09
3.9
72.2
22
2.0
35.8
08
5.5
66.4
12
Fre
sh p
lum
s80
940
10
20.1
77.8
66
35.5
97
.176
83
.397
.961
38.3
86.0
32
11
.643.0
26
12.2
16
.063
15.8
65.9
64
16
.145
.299
Cat
hod
es a
nd c
ath
ode
sect
ions,
of
cop
per
7403
110
0
24.9
80.2
63
24.0
95
.229
24
.476
.208
15.3
47.4
74
5.0
50.3
66
20.9
64
.964
26.4
66.4
60
22
.201
.717
Gra
pes
80
610
00
20
06
2005
20
04
2003
200
220
01
2000
199
9
The Chilean Case
DIE − UNAM / CECHIMEX 259
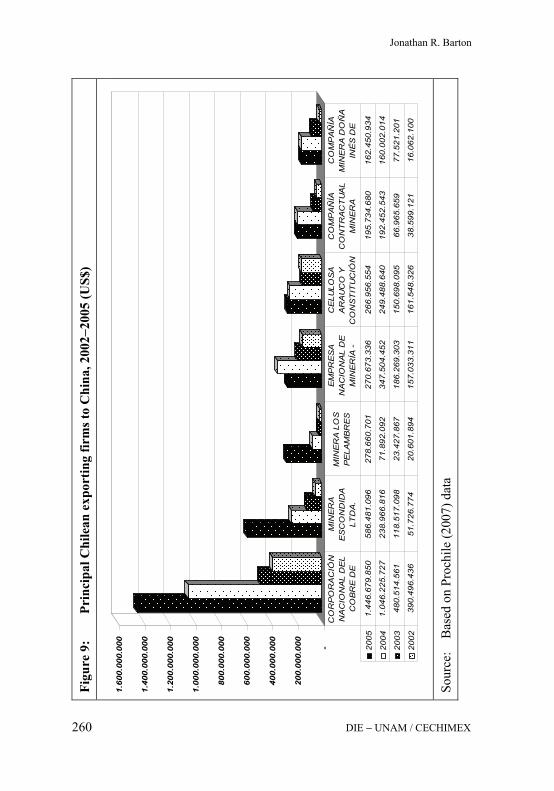
-
200.000.000
400.000.000
600.000.000
800.000.000
1.000.000.000
1.200.000.000
1.400.000.000
1.600.000.000
2005
1.4
46.6
79.8
50
586
.481
.096
2
78.6
60.7
01
270
.673
.336
2
66.9
56.5
54
195
.734
.680
1
62.4
50.9
34
2004
1.0
46.2
25.7
27
238
.966
.816
7
1.89
2.09
2 3
47.5
04.4
52
249
.488
.640
1
92.4
52.5
43
160
.002
.014
2003
480
.514
.561
1
18.5
17.0
98
23.
427.
867
186
.269
.303
1
50.6
98.0
95
66.
965.
659
77.
521.
201
2002
390
.496
.436
5
1.72
6.77
4 2
0.60
1.89
4 1
57.0
33.3
11
161
.548
.326
3
8.59
9.12
1 1
6.06
2.10
0
CO
RP
OR
AC
IÓN
N
AC
ION
AL
DE
L C
OB
RE
DE
MIN
ER
A
ES
CO
ND
IDA
LT
DA
.
MIN
ER
A L
OS
P
ELA
MB
RE
S
EM
PR
ES
A
NA
CIO
NA
L D
E
MIN
ER
ÍA -
CE
LULO
SA
A
RA
UC
O Y
C
ON
ST
ITU
CIÓ
N
CO
MP
AÑ
ÍA
CO
NT
RA
CT
UA
L M
INE
RA
CO
MP
AÑ
ÍA
MIN
ER
A D
OÑ
A
INÉ
S D
E
Figu
re 9
: Pr
inci
pal C
hile
an e
xpor
ting
firm
s to
Chi
na, 2
002−
2005
(US$
)
Sour
ce:
Bas
ed o
n Pr
ochi
le (2
007)
dat
a
Jonathan R. Barton
DIE − UNAM / CECHIMEX 260
The Chilean Case
DIE − UNAM / CECHIMEX 261
6 Chilean imports from China
The Chinese export boom during the early years of the twenty-first cen-tury, following WTO entry in particular, has had a marked effect on inter-national trade generally. The labor-intensity of production and its low cost base, relatively low labor and environmental protection, the availability of a range of inputs priced by state authorities rather than the market, and a strong state hand in the export promotion strategy have all played a role in instigating this shift. More specifically, one can highlight the large avail-able state credits with low interest rates, strong state support for R+D, and the selective application of intellectual property rights (Mesquita 2007). This state support for the export surge provides a contrast with the other major economic players in the global economy.
Export growth has been the driver of the national economy and for twenty years the economy has been growing at 9% a year, despite two world recessions, the Tequila crisis, the Asia contagion, the Russian default, and the Argentinean financial crisis. Although the US economy still drives the world economy with its 30% of global gross domestic product, the posi-tion of China currently with 5% poses the greatest potential transformation during the next decade, as it has done since 2001 (Valente 2007).
China has sought to benefit not only from low price exports but also the volumes of these exports that can be generated through economies of scale. In this sense, there is a concern about flooding international markets, also the valuation of the Yuan which is regarded as considerably under-valued thus favoring cheaper exports, and a general overheating of the economy; the steady devaluation of the Yuan against the dollar during the last two decades of the century led to Chinese exports selling at up to 80% less than developed economy competitors (Guardia 2007). In broad terms, there is a 15.6% annual growth in quantity penetration of exports with the rest of the world, due to a 0.8% price change influence, a 10.7% quality improvement impact, and a 3.6% change induced by an increased variety of products (according to calculations by Álvarez and Claro 2006). In other words, it is not merely the case that China is only able to capitalize on its labor base. Indeed, Álvarez and Claro (2006) note that much of the productivity advantages exhibited by Chinese firms relate to firms that have been established in the country with foreign capital, which outperform

Figu
re 1
0:
Chi
lean
impo
rts f
rom
Chi
na (U
S$; S
ITC
Rev
3)
Sour
ce:
Bas
ed o
n U
N C
omtra
de (2
007)
0
100,
000,
000
200,
000,
000
300,
000,
000
400,
000,
000
500,
000,
000
600,
000,
000
700,
000,
000
800,
000,
000
1997
1998
1999
2000
2001
2002
2003
2004
2005
2006
64.C
LOTH
ING
AN
D A
CC
ES
SO
RIE
S
65.T
EX
TILE
YA
RN
,FA
BR
IC,E
TC.
76.T
ELE
CO
MM
.SO
UN
D E
QU
IP
ETC
89.M
ISC
MA
NU
FCTR
D G
OO
DS
N
ES
85.F
OO
TWE
AR
Jonathan R. Barton
DIE − UNAM / CECHIMEX 262

The Chilean Case
DIE − UNAM / CECHIMEX 263
domestic firms and contribute significantly to output and export perform-ance; these foreign capital firms are also important in generating more varieties of products, another factor in the improved performance of the export sector. Although not in the case of Chile, the rising productivity within Chinese exports puts it at a significant advantage when compared with manufactured products in particular in other Latin American coun-tries (López-Córdova et al. 2006).
The traditional trading partners of Chile during the last decades of the twentieth century have been the US, Argentina and Brazil. However, China’s exports to Chile are rapidly bringing it into contention with these regional trading powers (see Figure 11). Similar to the significant jump in Chilean exports to China from 2001, the same has happened with imports from China, doubling in value between 2003 and 2005. Chinese presence in Chile’s importing profile has been consistent since the early 1990s, and during this decade the trade balance was in China’s favor; it is only since 2002 that the balance has swung the other way due to high copper prices and rising volumes. In 1990, China accounted for only 0.8% of total Chil-ean imports whereas by 2005 this had risen to 8.5%, reflecting an annual growth rate of 16.9% (Álvarez / Claro 2006).
The Asian contagion downturn in the late 1990s can be seen in the data, with a subsequent and rapid recovery that starts a long period of growth in imports. Although the curve is not as dramatic as the Chilean export curve, it is substantial nevertheless, reflecting the increased demand for goods in Chile as a result of the confidence in the economy, rising consumer credit opportunities, and the attraction of electronic goods in particular following the widespread consolidation of a range of major appliances in most Chil-ean homes during the 1980s and 1990s. In this sense, Chinese exports are well placed to serve the boom in communications and electronic goods. Furthermore, there is no real domestic base for the production of these goods due to the curtailing of the ISI model prior to specializing in hi-tech goods, in contrast to the Korean and Brazilian ISI experiences. Taken as a whole, China now supplies 33% of all Chilean imported consumer goods (Ministry of Foreign Affairs of Chile 2007).
The greatest impacts of the commercial exchange relate to the garments and footwear sectors. Although electronics, such as portable and non-portable computers and televisions (with brands such as TCL, Thomson,

Jonathan R. Barton
DIE − UNAM / CECHIMEX 264
Figure 11: Principal exporters to Chile (2002−2008)
Source: Based on Prochile (2007) data
Table 6: Chilean imports from China, 1997−2007 (US$ ‘000 CIF)
Year US$ ‘000 Chinese share in imports (%)
1997 659.1 3.6
1998 751.0 4.4
1999 658.6 4.7
2000 949.6 5.8
2001 1,012.9 6.2
2002 1,101.5 7.1
2003 1,288.8 7.4
2004 1,845.6 8.3
2005 2,538.6 8.5
2006 3,486.3 10.0
2007 4,881.5 11.4
Source: Based on Chilean customs data

The Chilean Case
DIE − UNAM / CECHIMEX 265
Figure 12: Trend in Chilean imports from China, 1997–2007 (US$ million CIF)
Source: Based on Chilean customs data
RCA and Schneider), do not compete with traditional production sectors, this is not the case with garments and footwear. Whereas Chinese toys have been strong in the Chilean and other international markets since the early 1990s, it is the garments and footwear sectors where recent competi-tive growth has been most marked. These sectors are also significant in Hong Kong exports to Chile, although slightly differentiated in that bras-sieres are the most important garment exported, followed by other gar-ments that are similar to those exported from China, such as cotton T-shirts and denim trousers. Whereas China dominates in terms of computer exports to Chile, Hong Kong is also slightly differentiated in the hi-tech market with its emphasis on televisions and mobile phones (see Figures 13 and 14).
As with many other Latin American countries, the production of clothing and footwear during the twentieth century was regarded as core to basic manufacturing, and therefore to economic development. These sectors have been slowly eroded in Chile by trade agreements with other countries where economies of scale and access to cheaper raw materials (leather, wool, cotton) have made competition difficult to sustain; the next major Chilean trade agreement will be with India, with further pressures on cot-ton goods production for example. In terms of total world exports of dif-
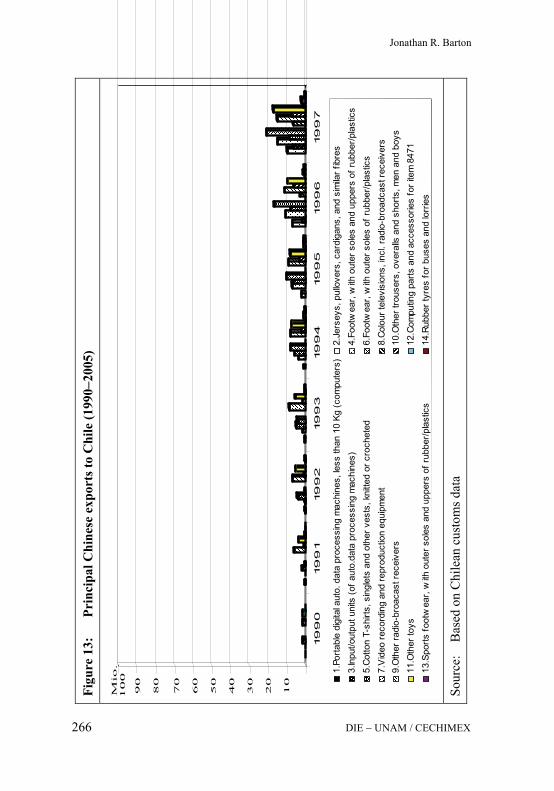
Figu
re 1
3:
Prin
cipa
l Chi
nese
exp
orts
to C
hile
(199
0−20
05)
Sour
ce:
Bas
ed o
n C
hile
an c
usto
ms d
ata
1.Po
rtabl
e di
gita
l aut
o. d
ata
proc
essi
ng m
achi
nes,
less
than
10
Kg (c
ompu
ters
)2.
Jers
eys,
pul
love
rs, c
ardi
gans
, and
sim
ilar f
ibre
s3.
Inpu
t/out
put u
nits
(of a
uto.
data
pro
cess
ing
mac
hine
s)4.
Foot
wea
r, w
ith o
uter
sol
es a
nd u
pper
s of
rubb
er/p
last
ics
5.Co
tton
T-sh
irts,
sin
glet
s an
d ot
her v
ests
, kni
tted
or c
roch
eted
6.Fo
otw
ear,
with
out
er s
oles
of r
ubbe
r/pla
stic
s7.
Vid
eo re
cord
ing
and
repr
oduc
tion
equi
pmen
t8.
Colo
ur te
levi
sion
s, in
cl. r
adio
-bro
adca
st re
ceiv
ers
9.O
ther
radi
o-br
oaca
st re
ceiv
ers
10.O
ther
trou
sers
, ove
ralls
and
sho
rts, m
en a
nd b
oys
11.O
ther
toys
12.C
ompu
ting
parts
and
acc
esso
ries
for i
tem
847
113
.Spo
rts fo
otw
ear,
with
out
er s
oles
and
upp
ers
of ru
bber
/pla
stic
s14
.Rub
ber t
yres
for b
uses
and
lorr
ies
19
90
19
91
19
92
19
93
19
94
19
95
19
96
19
97
10
20
30
40
50
60
70
80
90
10
0M
io.
Jonathan R. Barton
DIE − UNAM / CECHIMEX 266

Figu
re 1
3 (c
ont.)
: Pr
inci
pal C
hine
se e
xpor
ts to
Chi
le (1
990−
2006
)
Sour
ce:
Bas
ed o
n C
hile
an c
usto
ms d
ata
1.Po
rtabl
e di
gita
l aut
o. d
ata
proc
essi
ng m
achi
nes,
less
than
10
Kg (c
ompu
ters
)2.
Jers
eys,
pul
love
rs, c
ardi
gans
, and
sim
ilar f
ibre
s3.
Inpu
t/out
put u
nits
(of a
uto.
data
pro
cess
ing
mac
hine
s)4.
Foot
wea
r, w
ith o
uter
sol
es a
nd u
pper
s of
rubb
er/p
last
ics
5.Co
tton
T-sh
irts,
sin
glet
s an
d ot
her v
ests
, kni
tted
or c
roch
eted
6.Fo
otw
ear,
with
out
er s
oles
of r
ubbe
r/pla
stic
s7.
Vid
eo re
cord
ing
and
repr
oduc
tion
equi
pmen
t8.
Colo
ur te
levi
sion
s, in
cl. r
adio
-bro
adca
st re
ceiv
ers
9.O
ther
radi
o-br
oaca
st re
ceiv
ers
10.O
ther
trou
sers
, ove
ralls
and
sho
rts, m
en a
nd b
oys
11.O
ther
toys
12.C
ompu
ting
parts
and
acc
esso
ries
for i
tem
847
113
.Spo
rts fo
otw
ear,
with
out
er s
oles
and
upp
ers
of ru
bber
/pla
stic
s14
.Rub
ber t
yres
for b
uses
and
lorr
ies
19
98
19
99
20
00
20
01
20
02
20
03
20
04
20
05
10
20
30
40
50
60
70
80
90
10
0M
io.
The Chilean Case
DIE − UNAM / CECHIMEX 267
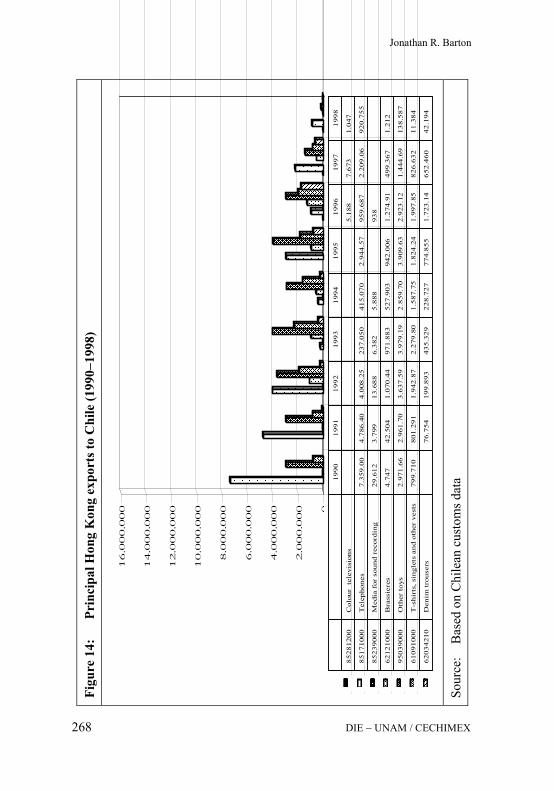
Figu
re 1
4:
Prin
cipa
l Hon
g K
ong
expo
rts t
o C
hile
(199
0−19
98)
Sour
ce:
Bas
ed o
n C
hile
an c
usto
ms d
ata
0
2.0
00.0
00
4.0
00.0
00
6.0
00.0
00
8.0
00.0
00
10.0
00.0
00
12.0
00.0
00
14.0
00.0
00
16.0
00.0
00
42.1
9465
2.46
01.
723.
1477
4.85
522
8.72
743
5.32
919
9.89
376
.754
Den
im t
rous
ers
6203
4210
11.3
8482
6.63
21.
997.
851.
824.
241.
587.
752.
279.
80
1.94
2.87
80
1.29
179
9.71
0T
-shi
rts,
sin
glet
s an
d ot
her
vest
s61
0910
00
138.
587
1.44
4.69
2.92
3.12
3.90
9.63
2.85
9.70
3.97
9.19
3.63
7.59
2.
961.
702.
971.
66O
ther
toy
s95
0390
00
1.21
249
9.36
71.
274.
9194
2.00
652
7.90
397
1.88
31.
070.
44
42.5
044.
747
Bra
ssie
res
6212
1000
938
5.88
86.
382
13.6
883.
799
29.6
12M
edia
for
sou
nd r
ecor
ding
8523
9000
920.
755
2.20
9.06
95
9.68
72.
944.
57
415.
070
237.
050
4.00
8.25
4.78
6.40
7.35
9.00
Tel
epho
nes
8517
1000
1.04
77.
673
5.18
8C
olou
rte
levi
sion
s85
2812
00
1998
1997
1996
1995
1994
1993
1992
1991
1990
Jonathan R. Barton
DIE − UNAM / CECHIMEX 268

Figu
re 1
4 (c
ont.)
: Pr
inci
pal H
ong
Kon
g ex
port
s to
Chi
le (1
990−
2006
)
Sour
ce:
Bas
ed o
n C
hile
an c
usto
ms d
ata
0
2.0
00.0
00
4.0
00.0
00
6.0
00.0
00
8.0
00.0
00
10.0
00.0
00
12.0
00.0
00
14.0
00.0
00
16.0
00.0
00
1.73
3.75
1.04
9.09
493.
466
383.
176
736.
181
399.
166
862.
936
458.
059
Den
im tr
ouse
rs62
0342
10
1.77
3.47
596.
826
505.
071
1.20
1.54
1.61
5.23
1.30
8.78
876.
258
328.
835
T-s
hirt
s, s
ingl
ets
and
othe
r ve
sts
6109
1000
1.87
7.89
1.22
0.75
1.37
0.92
1.71
9.99
1.12
8.81
862
7.05
373
3.70
685
6.00
2O
ther
toy
s95
0390
00
2.36
9.06
1.24
1.27
11.
512.
7299
0.67
71.
046.
8973
4.40
6B
rass
iere
s62
1210
00
3.27
1.0
1.65
9.87
2.04
4.64
291.
729
316
Med
ia f
or s
ound
rec
ordi
ng85
2390
00
9.57
0.63
8.67
9.11
1.17
4.98
185
7.23
697
3.15
384
9.15
977
.220
424.
006
Tel
epho
nes
8517
1000
14.3
86.8
2.15
8.47
2.67
2.92
2.95
9.23
2.62
850
21.
707.
2226
3.01
2C
olou
rte
levi
sion
s85
2812
00
2006
2005
2004
2003
2002
2001
2000
1999
The Chilean Case
DIE − UNAM / CECHIMEX 269

Jonathan R. Barton
DIE − UNAM / CECHIMEX 270
ferent products, China holds a significant share of these consumer manu-factures (2002): 25% in synthetic fiber sweaters; 21% of leather upper shoes; 21% of computer accessories; and 41% of electronic goods (Banco Central de Chile 2004). Competition with Chinese labor costs has made it difficult for these sectors in many Latin American countries. In this sense, Chile is not unlike its neighbors.
The impact on the garments sector appears to be the most dramatic, espe-cially in terms of knitted goods (synthetic fibers), see Barton (s. a.). While, during the period 2000−2004, several products competed evenly among Chinese imports, with footwear being the most prominent among these, it is knitted goods that have surged since 2003. This surge is not to the extent of computers with their high per unit value but, nevertheless, knitted items have doubled in value in this latter period, putting pressure on Chilean production of similar products.
For footwear, computer accessories, radios and sound equipment, syn-thetic fiber sweaters, trousers and shorts, China is now the principal sup-plier for the Chilean market. In the case of synthetic fiber sweaters, Chi-nese imports accounted for 80% of the total in 2002, and this has since risen, reducing the market shares of Spanish and Italian sweaters in the process (Banco Central de Chile 2004). This strength in the garment and apparel sectors is echoed elsewhere in the world due to the ending of the Textiles and Garments Agreement which had established quotas for differ-ent countries. In the case of the US, the American Textile Manufacturers Institute estimates that 154,500 jobs may be lost as a consequence, with US$10,000 million of lost revenue (Arellano 2005).
In the case of footwear (with leather uppers), China registered 63% of total Chilean imports, with Brazil second with 16% (in 1990, China had no share of this market); over time, it is Brazil that has suffered most from this trend. In radios and sound equipment, the 2002 share was 61% (fol-lowed by Mexico 9%, and Malaysia 8%), with other Asian countries most negatively affected (Banco Central de Chile 2004). It would appear that China is now beginning to compete in the computer market as it has done to date with these other sectors. The most affected will be the US; how-ever, it is not unreasonable to expect the same in this sector, especially in the mass market, due to the labor cost advantages in Chinese production.

The Chilean Case
DIE − UNAM / CECHIMEX 271
7 The impact of contemporary Chile-China trade
The rise of Chile and China as significant emerging market actors (of differing scales and reach) has given each a strong role in the increas-ingly globalized world economy. For Chile, this has been the case since the export-oriented growth model put in place in the 1970s, and with increased vigor since the mid-1980s, whereas China’s role has been strengthened in particular by its entry into the WTO in 2001; five years on from its incorporation into the WTO, Chinese international trade has tripled (Ministry of Foreign Affairs of Chile 2007). The tim-ing of this entry into the global trading mechanism coincides with Chile’s emergence from a post-Asian contagion downturn, and since 2001 their trading relationship has generated major increases in both exports and imports.
China is undoubtedly the leading influence in changes in interna-tional trade patterns since its entry into the WTO. However, it is not only in labor-intensive products that it has been able to generate ex-port increases. Álvarez and Claro (2006) clearly identify various factors that have contributed to increases in market share around the world. In this sense, China reflects broader patterns of Chilean inser-tion into global markets rather than a specific trend based on bilateral relations necessarily. Nevertheless, there are obvious differences in each import market as a result of internal economic compositions and vulnerability to the specific products that have generated most of the export growth: machinery and electronics, and also other products that have been able to dominate in their specific branches, e.g. syn-thetic fiber sweaters in the Chilean case. Álvarez and Claro (2006) also note the important role that product varieties and their quality have had in this growth. This suggests that the phenomenon is not merely a case of a devalued Yuan and low factor production costs in China, but also significant changes in the products on offer that have led to large “willingness to pay” margins among rest of the world consumers; it would appear that the role of foreign capital firms in China is highly relevant in this regard.
Despite the opportunities for trade creation in various product lines, it is the case that most of the growth in trade emanating from the rela-
Jonathan R. Barton
DIE − UNAM / CECHIMEX 272
tionship is associated with the diversion of existing patterns. This can be entered into in more detail for specific products, as mentioned above regarding displacement of traditional sources by certain Chinese exports to Chile. Nevertheless, if both countries continue to increase their trade with other countries, not only this partner, the effects of trade diversion should be less significant (Direcon 2006). In the mean-time, the high Chinese demand for a range of international commodi-ties leads to pressures on prices rather than an absolute lack of particu-lar products in the market.
In the Chilean case, China has presented a major source of demand for copper while Chile provides a market for both electronic goods as well as basic manufactures, especially synthetic sweaters and foot-wear. The implications of these trade flows are largely positive for both parties. The boom in copper prices that has accompanied Chi-nese demand has generated large capital account surpluses for the Chilean government, leading to the 2005 CODELCO-MinMetals joint venture that guarantees a longer-term relationship of stable prices, potential joint mining projects and potential value added processing in China. It is early yet to determine how this relationship will pan out in the medium-term, but it would appear that a foothold in the Chinese market through the deal, plus the opportunities for Chilean non-traditional exports with China’s growing middle class via the free trade agreement will create new demands for Chile’s non-metals export-oriented sectors.
The principal losers in the relationship are those traditional sectors in Chile oriented towards domestic production. Garments and footwear in particular are under pressure from spiraling imports from China. Al-though import competition has been part and parcel of the signing of free trade and other forms of commercial agreements over the past decade, the scale of Chinese exports in these sectors poses a challenge of different proportions. Not only is this the case for Chile, but it is the case for the EU, as seen in challenges to garment import volumes into the EU in 2006. The principal issue at stake is that many of the firms involved in these sectors in Chile are not among the largest Chilean firms. The largest are those oriented towards export markets and based on exploitation of the country’s natural resource base; their names appear on the list of leading exporters to China. As small and medium

The Chilean Case
DIE − UNAM / CECHIMEX 273
sized firms that are relatively labor intensive, the negative effects on employment may well be significant during the period 2000−2010 (see Barton s. a.).
Any losses in these domestic-oriented firms are unlikely to be off-set by the export-oriented sectors (copper, forestry, fisheries), which are increasingly capital-intensive in their operations and base any growth on labor-intensity through subcontracting arrangements that provide little labor security. New legislation on subcontracting entered into force in January 2007, and it seeks to remedy this trend in flexibilizing the labor force; however, it is unlikely that it will impact upon the structural unemployment situation. Despite the positive national eco-nomic trends registered over the last twenty years, unemployment rates have remained relatively stable. Following the economic downturn that led to an unemployment rate of almost 9% at the end of 1999, it has hovered at around 8% since 2001 (INE 2006).
Compared with other Latin American countries that have developed manufacturing sectors that contribute a significant share of products to the domestic market and to exports, Chile has a relative lack of eco-nomic diversification in manufacturing. This situation suggests that the impact of trade with China is unlikely to be as significant as with other economies in the region, particularly Brazil and Mexico. Since Chile bases its exports on copper and its derivatives, also molybdenum, there is little competition from China in third markets. Perhaps the area of fruit, such as apples, or in fish products, there may be increased chal-lenges in third markets. In the case of Chinese access to the Chilean market however, there is clear displacement of a range of other coun-tries in different sectors: Brazil in footwear and the US in computer products for example. In terms of the Chinese market and Chilean displacement of other producers, the concentration on copper products and the rising Chinese market for a range of other products suggests that little or no displacement is likely to take place in the short- and medium-terms.
Rather than focusing on the smaller-scale effects that will be generated by this growing trade relationship, the macroeconomic picture is where one may question the current trend in Chilean political economy. It is neither new nor creative to discuss the dilemma of the Chilean eco-

Jonathan R. Barton
DIE − UNAM / CECHIMEX 274
nomic structure and the dependence of its export profile on a reduced number of natural resource-based products; however, the challenges posed by it remain relevant to longer-term national development.
Latin America is characterized by this model, in spite of Brazil and Mexico having diversified away from this through increased manufac-turing, in the case of aircraft and other products in Brazil, and the ma-quilas in Mexico. Nevertheless, most of the other Latin American countries remain wedded to their resource bases, as they have done since the colonial period (Barton 2006a). As with Chile, there is less monocultural activity than during the first half of the twentieth century, for example, with a large number of commodities making up the export profile, but even new products such as soya, in Argentina and Brazil, and salmon in Chile (Barton 2006b), rely on the natural resource base and the ability to sustain its productivity over time.
Chinese demand for copper, cellulose and fish meal results in Chile returning to its resource base to sustain its development model. The opportunities for increasing output and taking advantage of high prices in copper in particular mean that the non-renewable resource base will be exhausted more swiftly, while renewable resources such as agricul-tural soils and optimal aquaculture sites may be stressed further. This current boom is no different from other historical booms based on natural resource exports, but the same risks apply, as witnessed in Chile in the early 1930s and early 1980s. Export dependency and reli-ance on a small number of major export products leads to risks from changing commodity prices, the development of new products that may compete with the existing ones or seek to displace them, and a lack of protection for diverse sectors that cater for the domestic market as a consequence of international economic policy decisions.

The Chilean Case
DIE − UNAM / CECHIMEX 275
Bibliography
Álvarez, R. / Claro, S. (2006): The China phenomenon: price, quality or variety, Santiago de Chile: Chilean Central Bank (Working Paper 411) Arellano, R. (2005): China: transformación económica, competitividad y posibles
implicaciones para México, in: Comercio Exterior: Revista de Análisis Económico y Social 55 (8), 702−713
Artaza, M. (2007): Chile y Asia hoy: una mirada critica, in: Estudios Inter-nacionales 39 (156), 53−63
ADB (Asian Development Bank) (2007): Key Development Indicators, Manila Banco Central de Chile (2004): Indicadores de comercio exterior, Santiago de
Chile (primer trimestre de 2004) Barton, J. R. (2000): Struggling against decline: British business in Chile,
1919−33, in: Journal of Latin American Studies 32 (1), 235−264 − (2006a): Sustainable fisheries management in the resource periphery: the cases
of Chile and New Zealand, in: Asia Pacific Viewpoint 47 (3), 366−380 − (2006b): Eco-dependency in Latin America, in: Singapore Journal of Tropical
Geography 27 (2), 134−149 − (s. a.): The impact of China’s global expansion on Chile: the copper and textile
value chain, Bonn: Deutsches Institut für Entwicklungspolitik (Discussion Paper), forthcoming
Bergsten, F. (2007): Toward a free trade area of the Asia Pacific, in: Revista de Estudios Internacionales 34 (156), 159−162
Boletin Asia Pacífico (2006): Canciller Foxley expone sobre políticas Asia Pacifico, no. 2
Cabrera, P. (2005): Chile y China: reflexiones para una agenda integral, Beijing CEPAL (Comisión Económica para America Latina y el Caribe) (2006): Statistical
Yearbook for Latin America and the Caribbean 2006, Santiago de Chile CEPAL (Comisión Económica para America Latina y el Caribe) / BADECEL
(Banco de datos Estadísticos de Commercio Exterior): Economic database; online: http://websie.eclac.cl/badecel/default.asp
CODELCO (Corporacion Nacional del Cobre de Chile) (2007): Convenio Codelco–MinMetals; online: http://www.codelco.com/ prensa/presentaciones /pdf/Mimmetals-Codelco.pdf (accessed: 3 June 2007)
Direcon (Dirección General de Relaciones Económicas Internacionales) (2006): Tratado de libre comercio Chile−China, Santiago de Chile
− (2007): Inversiones en el exterior: exportación de capitales desde Chile; online: http://www.direcon.cl/index.php?accion=inversiones_exterior_02b (accessed: 1 June 2007)

Jonathan R. Barton
DIE − UNAM / CECHIMEX 276
Foreign Investment Committee Chile (2007): FDI statistics; online: http://www. foreigninvestment.cl/index/fdi_statistics. asp?id_seccion=2 (accessed 21 May 2007)
Gobierno de Chile (2004): Joint feasibility study on a free trade agreement be-tween Chile and China, Santiago de Chile
Guardia, A. (2007): China en la globalización, in: Revista de Estudios Internacionales 35 (146), 59−79
Gutiérrez, H. (2007): APEC 2004: Viejas y nuevas dinámicas de apertura económica transpacífica, in: Revista de Estudios Internacionales 36 (144), 31−50
INE (Instituto Nacional de Estadísticas de Chile) (2006): Compendio estadístico 2005, Santiago de Chile
Jaramillo, P. / J. Selaive (2006): Actividad especulativa y el precio del cobre, Chile: Banco Central de Chile (Working Paper 384)
Lewis, P. M. (2007): La presencia de China en América Latina: un tema controvertido, in: Revista de Estudios Internacionales 34 (156), 27−53
López-Córdova, E. et al. (2006): Competing with the dragon: Latin American and Chinese exports to the US market, in: J. Santiso (ed.), The visible hand of China in Latin America, Paris: OECD Development Centre
Mesquita Moreira, M. (2007): El surgimiento de China: oportunidades y desafíos para América Latina y el Caribe: presentation at the seminario Banco Central de Chile: los efectos de China en América Latina
Ministry of Foreign Affairs of Chile (2007): Evaluación de las relaciones comerciales Chile: Estados Unidos después de tres años de entrada en Vigencia del TLC, Santiago de Chile
Ministry of Foreign Affairs of the People’s Republic of China (2007): Bilateral relations; online: http://chinaconsulate.khb.ru/eng/wjb/zzjg/ldmzs/gjlb/3478/-default.htm (accessed: 29 May 2007)
Moraga, J. (2007): El despertar de China e India: mirando al oriente, in: Revista Capital 4 May 2007
National Bureau of Statistics of China (s. a.): China Statistical Yearbook; online: http://www.stats.gov.cn/tjsj/ndsj/2006/indexeh.htm (accessed 7 Jan. 2008)
ProChile / Departamento Desarrollo Estratégico (2007): Análisis de las exportaciones Chilenas 2006, Santiago de Chile
− (2008): Comercio exterior Chile-República Popular China, Santiago de Chile Revista Capital (2007a): Entre dragones y jaguares, 4 May 2007 − (2007b): Tecnología China, 4 May 2007

The Chilean Case
DIE − UNAM / CECHIMEX 277
Reynolds, C. W. (1965): Development problems on an export economy: the case of Chile and copper, in: M. Mamalakis / C. W. Reynolds (eds.), Essays on the Chilean economy, Homewood, Ill.: Richard D. Irwin
Santiso, J. (ed.) (2007): The visible hand of China in Latin America, Paris: OECD Development Centre
Scollay, R. / F. González-Vigil (2007): Los acuerdos comerciales regionales en el Asia-Pacífico cara a los objetivos de APEC, in: Revista de Estudios Internacionales 36 (144), 7−29
Stiglitz, J. (2003): Globalization and its discontents, 1. ed., New York, NY: Norton Tang, P. S. / M. Wilhelmy / L. M. Fajardo (2007): El sudeste Asiático: estructura y
cambio de sus relaciones internacionales, in: Revista de Estudios Inter-nacionales 34 (156), 9−65
Valente, J. R. (2007): Y no era solo China, in: Revista Capital 4 May 2007


The Mexican Case
Enrique Dussel Peters


The Mexican Case
DIE − UNAM / CECHIMEX 281
Contents
Introduction 285 1 Growth, employment and trade patterns in Mexico 286
1.1 Growth and production 286
1.2 Employment 290
1.3 Trade 292
2 A brief review of the literature on the relationship between Mexico and China 295
3 Bilateral economic relationship and existing bilateral institutions 297
3.1 Bilateral economic relationship 297
3.2 Existing bilateral institutions 323
4 The trade relationship between China and Mexico in the US Market 325
4.1 Mexico and China in the US market 326
4.2 Export-Similarity Index (ESI) of Chinese and Mexican exports to the US (1990−2006) 332
4.3 A shift-and-share analysis of Chinese and Mexican exports to the US (1990−2006) 338
4.4 Unit value of Mexican exports to the US and the net barter terms of trade 350
5 Effects of China’s trade on Mexico’s manufacturing employment 366
6 Conclusions and policy proposals 374
Bibliography 381
Annex: Mexico and China: Export-Similarity Index (ESI) of China and Mexico at the chapter level for specific periods (1990−2006) 387

Enrique Dussel Peters
DIE − UNAM / CECHIMEX 282
Figures
Figure 1: Economically active population and insured employment (in thousands) (1994−2008) 291
Figure 2: Exports of goods and services / GDP (1980−2005) 293
Figure 3: Structure of exports by program (1993−2006) (share over total exports) 294
Figure 4: China and Mexico: Differences in trade statistics (1995−2007) 298
Figure 5: Mexican imports from China and Hong Kong by type (1995−2006) (percentage over total) 322
Figure 6: United States: Total imports from selected countries (1990−2007/09) 327
Figure 7: Export-Similarity Index (ESI) for Mexico and China in the US (1990−2006) 337
Figure 8: Unit value of US-imports for 10-digit items in which China’s share increased by more than 14% during 1990−2006 364
Figure 9: NBTT of the US in manufacturing: Total, China and Mexico 365
Tables
Table 1: Average annual growth rate of GDP per capita in selected countries (1960−2007) 287
Table 2: GDP by selected sectors of Mexico’s economy (1988−2008) (share over total GDP) 289
Table 3: Foreign direct investment between China and Mexico (up to 2007) 299
Table 4: Mexico: Main trading partners (1993−2006) 305
Table 5: Mexico: Trade by chapters with United States and China (1993−2006; AAGR 1995−2007) 311

The Mexican Case
DIE − UNAM / CECHIMEX 283
Table 6a: Mexico: 20 leading 4-digit items exported to China and Hong Kong (2006) 317
Table 6b: Mexico: 20 leading 4-digit items imported to China and Hong Kong (2006) 320
Table 7: United States: Imports from China and Mexico (1990−2006; AAGR 1990−2006) 328
Table 8: United States: Export Similarity Index (ESI) for different countries and levels of disaggregation 334
Table 9: United States: Imports from Mexico and China based on real performance vs. calculations based on highest achieved share (1990−2006) 339
Table 10: Shift-and-share analysis: Imports to the United States 1990−2006 346
Table 11: Representativity of data according to specific used criteria (share over respective total) 352
Table 12: US imports: Unitary prices (1991−2006) 355
Table 13: Unitary values of US imports: Trends according to different sets of imports 360
Table 14: Dependent variable: Employment 371


The Mexican Case
DIE − UNAM / CECHIMEX 285
The Mexican Case
Enrique Dussel Peters
Introduction1
The People’s Republic of China – hereafter referred to as China – has shown remarkable growth in recent decades from a socioeconomic and territorial perspective. In addition to achieving economic growth and bringing down poverty, Chinese socio-economic dynamism has been in-strumental in the rise in international commodity and energy prices, new regional and international political and military alignments, and the inter-national financial system financing the United States (US) fiscal deficit, among other issues. Thus, China’s entry into the world market, along with various reforms implemented in the country since the end of the seventies and again during the 1990s, has gone beyond mere economic and trade-related changes.
China’s rapid integration into the world market, since the reforms of the late 1970s, and particularly since the 1990s, has not only affected industri-alized countries. In Africa, Asia and Latin America substantial socioeco-nomic changes have taken place and some of them are associated with China’s dynamism. The objective of this paper is to study China’s socio-economic relationship with Mexico, and particularly its more recent ef-fects on Mexico’s production structure, trade specialization and structure and levels of employment. In the specific case of trade, both domestic and third markets are considered, including foreign direct investments (FDI) between both countries.
As a result this chapter is divided into six sections. The first section briefly analyzes the main growth, employment and trade patterns of Mexico. The
1 Document prepared for the ESRC-funded project “The Impacts of China’s Global
Expansion on Latin America” coordinated by Professor Rhys Jenkins. I am very grate-ful to Iván Gutiérrez Bravo, who assisted mainly with the statistical work and the com-pilation of various data. Luis Daniel Torres González and Lucio Castro also supported the chapters on terms of trade and the effects of China’s impact on Mexico’s manufac-turing employment. This report is the sole responsibility of the author.

Enrique Dussel Peters
DIE − UNAM / CECHIMEX 286
second provides a review of the literature on Mexico’s economic relation-ship with China, focusing on trade and investment analysis. The third examines the economic relationship between these countries in terms of bilateral investments and the main trade patterns between both countries. The fourth section looks at competition between Mexico and China in the US market and presents calculations regarding export-similarity indices between both countries in the US market and shift-and-share analysis of both countries’ exports to the US. The fifth section estimates the effects of China’s trade on Mexico’s manufacturing employment. Finally, the sixth section concludes with a summary of the main issues and presents policy proposals.
1 Growth, employment and trade patterns in Mexico This section briefly analyzes some of the main structures that have emerged in Mexico’s social economy, particularly with respect to its growth, employment and trade. It presents a simple outline of each of these issues, in order to help understand Mexico’s socioeconomic relation-ship with China.
1.1 Growth and production In the last 20 years, since the liberalization strategy was implemented in 1988, Mexico has had significant difficulties in achieving growth in terms of Gross Domestic Product (GDP) and GDP per capita. Although Mexico increased by more than 3% in both variables between 1940 and 1980, its performance has been much more disappointing since 1988 (see Table 1). Two points stand out: a) the growth of Mexico’s GDP per capita repre-sented only close to 1/4 if comparing the periods 1960−1980 with 1980−2007, and b) the GDP per capita performance of China and East Asia and the Pacific for 1980−2007 were 10 and 7.8 times higher than Mexico’s, respectively. Even if we consider the more recent period 2001−2007, China’s GDP per capita performance was 5.4 times higher than Mexico’s.

The Mexican Case
DIE − UNAM / CECHIMEX 287
Table 1: Average annual growth rate of GDP per capita in selected countries (1960−2007)
1960−1980 1980−2007 1990−2000 1990−2007 2001−2007
East Asia and Pacific 3.4 6.8 7.1 7.4 8.3
Argentina 1.8 0.8 3.3 3.1 4.3
Brazil 4.6 0.6 0.1 1.3 2.2
China 2.9 8.7 9.3 9.4 9.8
Latin America 2.9 0.8 1.6 1.8 2.6
Mexico 3.5 0.9 1.8 1.6 1.8
Source: Author, based on World Bank (2007)
What are the reasons for Mexico’s disappointing performance? At least five different reasons have been discussed recently:2
1. From the perspective of the public sector, since 2000 the failure to deepen the liberalization process in sectors such as petrochemicals, electricity, the pension system and the overall reforms of the public sector (PEF 2007; Sojo 2005) have been the main cause of the slow growth process. Deepening the liberalization process since 1988 – in sectors such as petrochemicals, electricity, labor rights and foreign direct investments – would allow for better socioeconomic results.
2. In spite of Mexico’s overall deregulation and opening in terms of trade and respective import tariffs, foreign direct investment, labor and an overall decreasing presence of the public sector (since the end of the 1980s), Mexico has created significant monopolistic structures in sectors such as telecommunications and the financial sector, which have prevented a convergence with other industrial-ized countries (IMF 2006; World Bank 2007).
2 It is interesting that even former Presidents such as Salinas de Gortari have publicly
acknowledged the limitations of trade openness (Salinas 2004).
Enrique Dussel Peters
DIE − UNAM / CECHIMEX 288
3. Mexico’s GDP and GDP per capita growth performances have been below its historical and potential levels as a result of low investment growth. Mexico’s exports have not led to increased investments, par-ticularly in terms of technological development, productivity spill-overs and human capital formation. Large income disparities have deepened this problem (Moreno-Brid et al. 2004; Ros 2007).
4. Mexico’s growth engine since the late 1980s, the export-oriented manufacturing sector, has been the cause of Mexico’s increasing po-larization process and the lack of linkages and growth: growth has been limited to an extremely small group of firms, households, branches, sectors and territories in Mexico and has lacked an overall “learning process” for the rest of the social economy (Dussel Peters 2000). In addition, the export-oriented sectors and North American Free Trade Agreement (NAFTA) have been challenged since 2001 by Asia and in particular by China in terms of system competitive-ness, i.e. macroeconomic stability in Mexico has not resulted – at least so far – in a systemic competitiveness process at the micro, meso and macro levels, bringing into question even the more suc-cessful segments of Mexico’s economy that have become incorpo-rated with the US (Dussel Peters 2007b).
5. Additionally, Mexico’s macroeconomy shows two important fea-tures: the lack of financing for the private sector and particularly for firms,3 and a continuous overvaluation of the exchange rate. Accord-ing to official calculations, the real exchange rate (based on a basket of foreign currencies and in which 1990=100) was overvalued by almost 25% in mid-2007, and similarly during most of the 1990-2007 period, with the exception of the devaluation of 1994-1995 (Dussel Peters 2009).4 In contrast with Mexico’s systematic over-valuation, countries such as China present a systematic undervalua-tion of around 10% at least (World Bank 2007).
3 In 2007 financing from commercial banks to private firms relative to GDP accounted
for only 20% of the ratio in 1995. 4 Strictly in terms of real exchange rates the topic becomes much more complex for
Mexico when comparing the performance with China and its undervaluation, in spite of its recent appreciation of the Yuan since 2005-2006.

The Mexican Case
DIE − UNAM / CECHIMEX 289
In addition to this lack of growth, seen from the beginning of the liber-alization strategy, Mexico’s social economy has gone through substan-tial changes. As shown in Table 2, the productive sector (which in-cludes agriculture, mining and manufacturing) is going through a sig-nificant crisis: its share of total GDP fell from 34.7% in 1988 to 23.8% in 2008. This drastic process has had a particularly deep impact in manufacturing, which over the same period saw its share of total GDP decline by almost 6%. This process contradicted the initial expecta-tions of NAFTA regarding closing the gap between Mexico and the United States in terms of GDP, employment, productivity and wages, particularly in Mexico’s manufacturing sector.
Table 2: GDP by selected sectors of Mexico’s economy (1988−2008) (share over total GDP)
Agricul-
ture Mining Manufac-turing
Commerce and restau-
rants Financial services
Communal, social and personal services
1988 7.90 2.95 23.86 25.35 9.7 17.01
1994 5.97 1.33 18.71 21.05 16.15 23.75
2000 4.17 1.41 20.31 21.36 12.14 24.38
2001 4.15 1.38 19.56 20.68 12.17 26.17
2002 3.94 1.35 18.62 20.02 13.40 26.97
2003 3.89 1.32 17.97 20.34 13.19 27.66
2004 3.91 1.45 18.04 20.80 12.98 26.76
2005 3.83 1.50 17.79 21.16 13.10 26.60
2006 3.87 1.57 18.04 21.18 12.95 25.97
2007 3.81 1.59 18.01 20.06 13.23 26.89
2008 4.07 1.61 18.10 20.99 12.98 26.12
Source: Author, based on information from INEGI (2009)
Enrique Dussel Peters
DIE − UNAM / CECHIMEX 290
1.2 Employment Parallel to weak GDP growth, the performance in employment as of the end of the 1980s was similarly disappointing. Four topics are important here: understanding why Mexico’s open unemployment rate is so low compared with other nations; the relevance of Mexico’s growing Eco-nomically Active Population (EAP); the lack of formal employment gen-eration; and recent trends in the quality of generated employment (Berg et al. 2006; Dussel Peters 2009). First, in 2008 Mexico’s open unemployment rate reached its highest levels since the 1990s, with levels slightly above 4%. In Mexico, open unemploy-ment rate (as used in Organisation for Economic Co-operation and Devel-opment [OECD] countries) is defined as the percentage of the EAP that has not worked for more than an hour a week during the last two months and that is still searching for a job. Under Mexico’s socioeconomic conditions without any unemployment benefit system this definition is not useful. It is rather surprising to find any unemployment at all according to this definition. Second, until mid-2009 Mexico’s economy experienced great difficulty in generating formal employment: in the period from 1991−2009 it generated an average of less than 305,000 jobs annually whereas the EAP increased by around 1 million; i.e. there was formal employment for 38% of the annual growth of the EAP, and the rest was not necessarily unemployed (as defined by the open unemployment rate), but rather had to either search for a job in the informal sector or migrate to the US (see Figure 1). These tendencies reflect the massive challenges of Mexico’s social econ-omy and in particular the ones that have risen since the late 1980s when the economy faced problems in growth. Third, although formal employment (i.e. employment registered with the Mexican Institute of Social Security – IMSS) has grown by over 5% since 2005, most of this employment has been generated in construction and services, while the productive sector (agriculture, mining and manufactur-ing) is still below the absolute employment levels of 2000. The fall of employment in the productive sector has been drastic: in manufacturing employment alone, it fell by more than 1 million between 2000 and March of 2009, accounting for 25% of manufacturing employment. Fourth, the quality of the created formal employment has deteriorated substantially in several respects since the 1980s. On one hand, real mini-mum wages in 2008 represented less than 30% of their 1980 level, i.e.

Figu
re 1
: E
cono
mic
ally
act
ive
popu
latio
n an
d in
sure
d em
ploy
men
t (in
thou
sand
s) (1
994−
2008
)
Sour
ce:
Aut
hor,
base
d on
info
rmat
ion
from
PEF
(200
8) a
nd IM
SS
05.0
0010
.000
15.00
020
.000
25.00
030
.000
35.00
040
.000
45.00
050
.000
1994
1995
1996
1997
1998
1999
2000
2001
2002
2003
2004
2005
2006
2007
2008
EAP
Insure
d emp
loyme
nt
The Mexican Case
DIE − UNAM / CECHIMEX 291
Enrique Dussel Peters
DIE − UNAM / CECHIMEX 292
there has been a real wage loss for this segment of the labor market of around 70%, while manufacturing decreased 15% in this period. In addi-tion, formally generated employment with IMSS insurance has changed substantially: while formal generation has increased since 2000, most new employment has been temporary. That is, up until the late 1990s less than 10% of total employment was temporary, while from 2004 onwards 53% of new employment registered under IMSS was temporary; i.e., the quality of new employment has worsened significantly.
1.3 Trade At least three issues are relevant to understanding Mexico’s foreign trade: its increasing significance in Mexico’s economy in terms of the strategy implemented as of the late 1980s; the increasing concentration of Mex-ico’s trade and exports in terms of firms, branches, sectors and territories; and, finally, the role of temporary imports used in exports from Mexico’s most dynamic growth sectors. Figure 2 reflects the growing importance of exports as the main engine of growth of the Mexican economy since the 1980s. As in other countries and regions, exports of goods and services have increased substantially as a share of GDP from around 10% to levels above 30% since 2000. From this perspective, the growth of exports is significant for Mexico’s social econ-omy. As discussed in the next section, the concentration of exports to the United States (US) plays a substantial role in the context of NAFTA, im-plemented since 1994. Secondly, Mexico’s exports are highly concentrated in terms of the firms, branches, sectors and territories involved. It has been shown (Dussel Pe-ters 2000) that around 3,500 firms, or 0.01% of all firms, account for more than 94% of Mexican exports, while representing less than 6% of Mex-ico’s formal employment. In addition, the five main chapters of Mexican exports in 2006 – autoparts, electronics, automobiles, oil, and optical in-struments and equipment – accounted for 73% of total exports (see the following section). Third, it is worth mentioning that Mexico has specialized in industries that depend on Temporary Imports to be Exported (TIEs), which accounted for 76% of total exports in 1993-2006, and in the oil industry, which accounted for another 15% in the same period. Both processes are characterized by being low value-added with little integration into the rest of the economy.
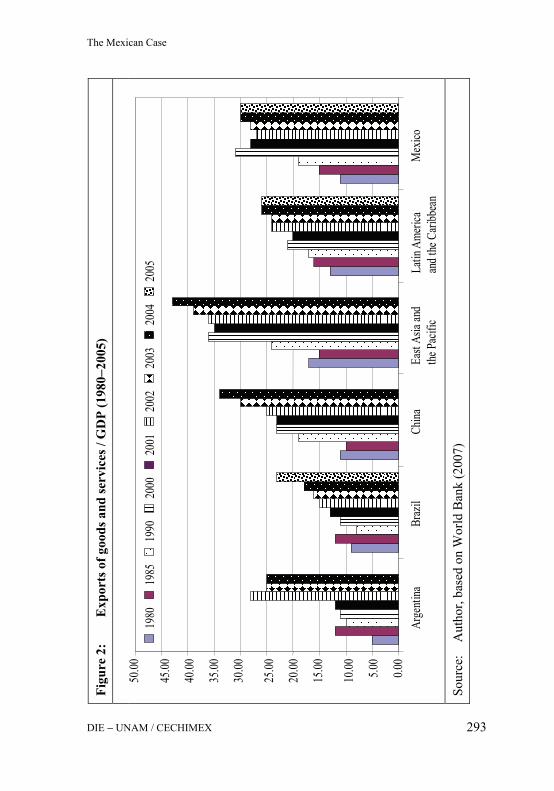
Figu
re 2
: E
xpor
ts o
f goo
ds a
nd se
rvic
es /
GD
P (1
980−
2005
)
Sour
ce:
Aut
hor,
base
d on
Wor
ld B
ank
(200
7)
0.00
5.00
10.00
15.00
20.00
25.00
30.00
35.00
40.00
45.00
50.00
Arge
ntina
Braz
ilCh
inaEa
st As
iaan
d the
Pac
ific
Latin
Ameri
caan
d the
Cari
bbea
nM
exico
1980
1985
1990
2000
2001
2002
2003
2004
2005
The Mexican Case
DIE − UNAM / CECHIMEX 293

Figu
re 3
: St
ruct
ure
of e
xpor
ts b
y pr
ogra
m (1
993−
2006
) (sh
are
over
tota
l exp
orts
)
Sour
ce:
Aut
hor,
base
d on
info
rmat
ion
from
Ban
com
ext (
2008
)
0%20%
40%
60%
80%
100%
1993
1994
1995
1996
1997
1998
1999
2000
2001
2002
2003
2004
2005
2006
Rest
Oil
Temp
orary
impo
rts
Enrique Dussel Peters
DIE − UNAM / CECHIMEX 294
The Mexican Case
DIE − UNAM / CECHIMEX 295
2 A brief review of the literature on the relationship between Mexico and China
Studies on the socioeconomic and trade relations between China and Mex-ico are still fairly new in Mexico, in contrast with the extensive existing bibliography on the bilateral relationship between China and the US, or the US and Mexico. In Mexico there are two main types of studies and periods on the subject:
• Before 2003, when the subject received minimal attention, most of the studies were carried out by trade negotiators (De la Calle 2002) or were of a very general nature, for the most part “explaining” China in Mexico (Cornejo 1985; González Garcia 2003)5 and from a more historical, sociological and diplomatic perspective.
• Since 2004, a number of more in-depth studies have been carried out on the bilateral relationship with China, from several angles: o More detailed statistical information has become available on
foreign direct investment (SE 2005). Although it is still very early, in 2005 there were 339 companies registered with Chinese capital, which represented 1.1% of foreign companies in Mexico. In addition, Chinese FDI between 1999 and 2005 was 41 million dollars, or 1.2% of the foreign direct investment (FDI) of Asian countries: 52.7% was concentrated in manufacturing and 24.4% in services.6 There are currently no estimates on the employment generated by this activity.
o With a few exceptions in various sectors (CANAINTEX 2007; CNIV 2007), Mexico’s private sector has generated little com-prehensive data on the economic effects of China on Mexico.7
5 Research by authors such as Eugenio Anguiano, Flora Botton and Romer Cornejo, of
the Centro de Estudios de Asia y África of the Colegio de México has been significant. Other authors such as Gómez Izquierdo (1992) have also discussed the historical di-mensions of Chinese population in Mexico. The contribution of Watkins (2002) is no-table, presenting a timely commercial study of competition between China and Mexico in the US market.
6 FDI-data until 2008 has not changed substantially, i.e. Chinese FDI in Mexico accumu-lated US$73 million for 1999−2008 (http://www.economia.gob.mx/?P=2261).
7 An interesting exception is the work of Luna Martínez (2003), who tried to highlight potential possibilities and threats in the bilateral relationship in the US market and in particular sectors.
Enrique Dussel Peters
DIE − UNAM / CECHIMEX 296
o International organizations such as the Economic Commission for Latin America and the Caribbean (ECLAC) 2004 and the Inter-American Development Bank (IDB) 2005 – as well as several academic studies – have presented initial, more detailed analyses of the economic effects of China on Latin America and, to a smaller degree, on Mexico. In general terms, both studies exam-ine data on bilateral trade. Just as in other general studies of the textile/clothing manufacturing chain, based on the Global Trade Analysis Project (GTAP), Mexico is the most affected country, and the one with the greatest loss in the US market, ever since China’s trade expansion, because it has a similar export structure to China (Domínguez 2006; López / Micco / Molina 2005).8
o More recently, several studies (Pescador / Castañeda 2004; Cornejo 2005; Dussel Peters 2005a, 2005b, 2007; Correa / Gon-zález 2006; Oropeza 2006; Villarreal / Villeda 2006; Cárdenas / Dussel Peters 2007; Feenstra / Kee 2007; Trápaga / Dussel 2007) have begun to analyze the bilateral relationship in greater detail, including bilateral sectoral research, such as on the tex-tile/clothing manufacturing chain and the electronic sector. In the latter, Mexico lost more than 45,000 jobs between 2001 and 2003; US$3.2 billion in exports; and US$500 million in FDI to Asia, and particularly to China (Dussel Peters 2005a). These studies have started to analyze business opportunities in China. Faced with the significant increase in its imports, Mexico’s com-petitiveness with respect to China and the ensuing consequences have been negative, both in the Mexican domestic market and in the US market. These studies calculate significant shifts in Mexi-can production.9
8 A number of publications of Sanjaya Lall (including Lall / Weiss 2005) have been very
fruitful in pointing out the competition between Latin America and China at the secto-rial level.
9 The broader analysis of Garza Limón is clear in this respect: “…we arrived late on the scene and are doing badly in the Chinese market…we cannot continue to have…defensive or restrictive policies with China, nor continue to make accusations of disloyal trade and human rights violations merely a pretext to justify inefficiency.” (Garza 2005, 29).

The Mexican Case
DIE − UNAM / CECHIMEX 297
Despite the growing recent literature, the level of analysis and detailed knowledge about the impact of China on Mexico has so far been relatively limited, particularly considering that China became Mexico’s second trade partner in 2003. Until the end of 2007, with the exception of the Center for Chinese-Mexican Studies (CECHIMEX) at the National Autonomous Uni-versity of Mexico (UNAM), no single institution in the public, private or academic sectors has specialized in the socioeconomic analysis of China in Mexico. Thus, on the whole it has been extremely difficult to get beyond the discussion of “opportunities and threats” and “doing business in China”.
3 Bilateral economic relationship and existing bilateral institutions
The first part of this section examines the economic relationship between both countries in terms of bilateral investments and the main trade patterns. The second part outlines the main bilateral institutions and projects related to trade.
3.1 Bilateral economic relationship Some of the difficulties which account for the lack of analysis and knowl-edge of the bilateral relationship arise from problems in trade and invest-ment statistics. In the case of investments for example, cumulative Chinese FDI in Mexico came to US$73 million during 1999−2008 according to the official statistics of the Ministry of the Economy, while our own research places it around 10 times higher. In trade statistics there are differences of 277% between Chinese exports to Mexico and Mexican imports from China in 2006 (Figure 4). In spite of the efforts of bilateral institutions (see section 3.2.) these issues remained unresolved at the end of 2007. As a result, it is important to bear in mind the respective data sources in the case of trade, whether Mexican (Bancomext 2008) or Chinese (CCS 2008).
Table 3 shows bilateral FDI. Taking into account important statistical limitations, the table shows at least two interesting patterns. To begin with, China’s accumulated FDI in Mexico is substantially higher than Mexico’s in China up to 2007, with a ratio of around 7:1; from a Mexican perspec-tive China’s FDI is still relatively small and accounts for less than 0.4% of
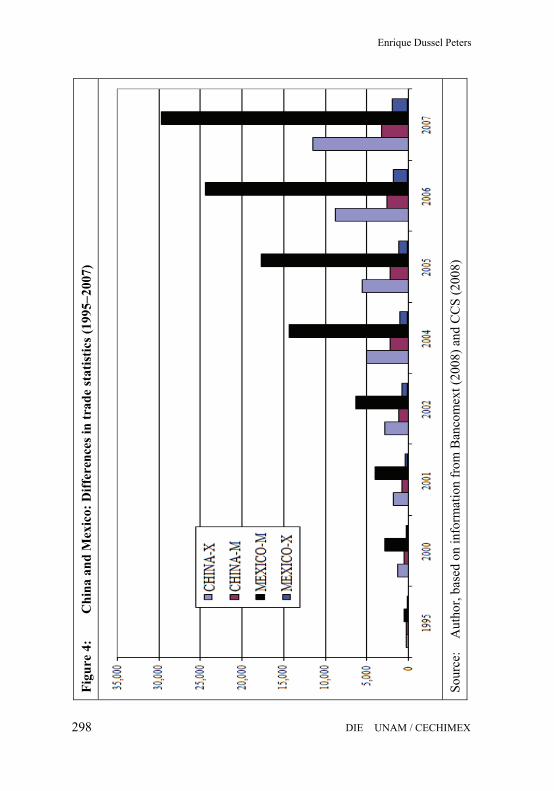
Figu
re 4
: C
hina
and
Mex
ico:
Diff
eren
ces i
n tr
ade
stat
istic
s (19
95−2
007)
Sour
ce:
Aut
hor,
base
d on
info
rmat
ion
from
Ban
com
ext (
2008
) and
CC
S (2
008)
Enrique Dussel Peters
DIE UNAM / CECHIMEX 298

The Mexican Case
DIE − UNAM / CECHIMEX 299
Table 3: Foreign direct investment between China and Mexico (up to 2007)
FDI (in US$ M) Activity
FDI by Chinese firms in Mexicoa
Data from the Ministry of the Economy b 63
Additional information up to 2007:
Giant Motors 18 Automobiles, trucks
Sinatex 96 Textiles, garments
ZX and Chamco Auto* 400 Automobiles, trucks
Konka 10 Televisions
TCL (acquisition of Thomson) 100 Televisions and
others
Other Approx. 35
Total 722
FDI by Mexican firms in Chinaa
Gruma 100 Food
Bimbo 11.30 Food
Other Approx. 2
Total 113
a In some cases investments will be implemented in the next years b Accumulated up to the first semester of 2007 for the period from 1999−2007 * This investment was announced at the beginning of 2007, but will apparently
not take place Source: Author, based on information from SE (2007) and own infor-
mation from press.

Enrique Dussel Peters
DIE − UNAM / CECHIMEX 300
Mexico’s total FDI during 1994−2007.10 In addition, bilateral FDI shows an interesting specialization pattern: while China’s investments in Mexico have focused on manufacturing and increasingly on the automobile auto part and electronic chains, Mexico’s FDI is almost exclusively concentrated on food, led by Grupo Maseca (GRUMA) and Bimbo (Dussel Peters 2007).
Bearing in mind the problems of trade data (Dussel Peters 2005b); what are the main trade patterns between Mexico and China, both bilaterally and in the US?
Based on Mexican statistics, China has become Mexico’s second trading partner since 200311 after the United States.12 Table 4 shows some of the general characteristics of bilateral trade: • Broadly speaking, the 1993−2006 period can be divided into two
sub-periods: a) 1993−2000, in which total Mexican exports in-creased at an average annual growth rate (AAGR) of 19.3% and, b) 2000-2006, with an AAGR of only 7%.
• Mexico’s trade structure reflects a high degree of concentration, especially of exports. Since 2000, Mexican exports to the US repre-sented more than 88% of the total, i.e. for Mexico exports to the NAFTA-region (Canada and the US) are predominant. No other des-tination accounts for more than 2% of Mexican exports.
• With the exception of Aruba, Mexican exports to China were the most dynamic during 1995−2006, with an AAGR of 41.5%; i.e. China has become an increasingly significant export-market and was the 6th largest in 2006. This performance, however, changes signifi-cantly if we consider Hong Kong and China as one entity: the AAGR falls to 12.5% for 1995−2006, as exports to Hong Kong in 1995 already accounted for more than US$500 million, while ex-ports to China were less than US$40 million.13
10 Until mid-2007 the investment of ZX and Chamco Auto was still being discussed in the
news. However, by November 2007, this investment had been postponed indefinitely. Independently of the specific investment, China’s FDI is still much greater than Mex-ico’s in China.
11 In 2006 trade with China represented 9.5% of Mexico’s total imports and 0.7% of its exports, comprising 5.2% of Mexico’s total trade.
12 On the other hand, based on Chinese statistics Mexico was China’s 22nd and 35th trading partner in 2004 in terms of exports and imports, respectively.
13 The topic requires more detailed analysis in the future, but it stands out that Mexican exports to Hong Kong have fallen continuously, with an AAGR of -8.4%. During the
The Mexican Case
DIE − UNAM / CECHIMEX 301
• Mexican imports from China have been even more dynamic, with an AAGR of 41.9% during 1995-2006; if we include Hong Kong, im-ports account for an AAGR of 38.8%. Mexican imports, however, show a very different structure from exports: since the implementa-tion of NAFTA in 1994 the share of imports from the US has de-clined substantially, accounting for 50.92% in 2006, while imports from Asia, and particularly China, Japan, Korea, Taiwan and Malay-sia have increased and substituted US imports, accounting together for around 30% of Mexican imports in 2006 (Dussel Peters 2007a).
• In 2006 the ratio of Mexican imports from China relative to Mexican exports to China was 15:1 and China was the country with which Mexico had the largest trade deficit (of more than US$22 billion).
• Mexico’s trade structure (see Table 4) reflects a high degree of inte-gration with the US economy. The US is the only trading partner with which Mexico has a trade surplus, which increased from US$3 billion in 1993 to more than US$80 billion in 2006. Thus, the US market is of major importance to Mexico, not only as its main trad-ing partner but also as it is the main and only major trading partner with which it achieves a surplus.
Table 5 allows for a deeper understanding of bilateral trade between Mex-ico and China for 1993−2006, with the following points in particular:14
• Mexico’s exports are highly concentrated in a small group of chap-ters with the top five accounting for 72.47% of total exports and 59.30% of imports in 2006. This concentration is even higher in the case of Mexican exports to the US, the main engine of growth of Mexico’s economy since the end of the 1980s.
• Generally, Mexican exports show a strong similarity with those of China, since electronics and autoparts are the largest and fastest grow-ing chapters of the Harmonized Tariff System (HTS) in both coun-
period exports to Hong Kong have not played an important role and have been shipped directly to China (and not through Hong Kong).
14 Tables 4 and 5 present trade statistics for Hong Kong and China as well as for China alone. Mexico’s trade with Hong Kong plays a minor role – 0.12% and 1.25% of Mexi-can exports and imports in 2006, respectively – but will require a more detailed analysis in the future, in particular for understanding the final destination of Mexican exports and the effective source of these imports to Mexico. Trade with Hong Kong, however, does not change bilateral and disaggregated trade patterns between China and Mexico.
Enrique Dussel Peters
DIE − UNAM / CECHIMEX 302
tries. Both chapters accounted for more than 35% of Mexican exports in 2006. The main differences in exports between the countries, how-ever, are that Mexico exports automobiles – accounting for 15.77% of total Mexican exports (or US$39.5 billion) – while these accounted for only 2.31% of China’s exports (or US$22.4 billion) in 2006.
• Mexico’s trade structure is, rather surprisingly, relatively similar to China’s, i.e. it imports and exports in similar chapters: it exports electronics, autoparts, automobiles and oil, and imports within the same chapters.15
• It is important to emphasize that Mexico has had a trade deficit with China in primary products (chapters 1−25 of the HTS) since 1995 despite China’s high demand in these chapters. Thus, it is important to understand these trade patterns and Mexico’s overall limitations in exporting agricultural and agroindustrial goods to China.
• Table 5 illustrates the main features of bilateral trade between China and Mexico. There is an increasing diversification of Mexican exports to China (at the chapter level): while electronics, autoparts and auto-mobiles accounted for more than 60% of Mexican exports until 2004 (Dussel Peters 2005a), Mexican exports to China have since shifted substantially. In 2006 the main export chapter was copper, and exports from the autoparts-automobile commodity chain only accounted for 35.70%.16 Thus, Mexico’s exports to China show an increasing Latin Americanization, i.e. raw materials have been the most dynamic chap-ters to be exported to China in the most recent years.
• Mexican exports – as well as Chinese – depend heavily on imported inputs being re-exported. As discussed in the last section: in the case of total exports, 75% of Mexican exports depended on these pro-grams during 2001−2006; in the case of exports to China, they fell from 95.5% in 1999 to 39.5% in 2006.
15 The topic refers to the issue of intraindustry trade. Mexico accounted for an intraindus-
try trade coefficient with the US of above 50% until the end of the 1990s and presented a tendency to fall since then, while the same coefficient was below 5% with China (León / Dussel 2006).
16 This is the only case in which Hong Kong’s trade makes a difference, i.e. autoparts would still be Mexico’s main export chapter to Hong Kong and China in 2006 (ahead of copper) (see Table 5).
The Mexican Case
DIE − UNAM / CECHIMEX 303
Tables 6a and 6b delve into the specific trade between Hong Kong and China and Mexico (and are based on Mexico’s statistics). Three issues are significant in this respect.
First is the dramatic growth of Mexican copper exports (in very different forms from waste and scrap to refined copper and copper mattes, among others), considering that these began in 2005−2006. Similarly exports of aluminum, iron ores and cotton, among other raw materials, are becoming the main export products to China and Hong Kong and explain the sudden growth in the share of the 20 main 4-digit items that Mexico exports to Hong Kong and China, increasing their share of total Mexican exports from 51% in 2004 to 76% in 2006. Within these 20 main 4-digit items, those related to raw materials increased from US$104 million in 2004 to US$744 in 2006 and accounted for 37.76% of total Mexican exports to Hong Kong and China.17
Second, the detailed 4-digit analysis shows that bilateral trade is extremely dynamic, with growth rates above 1,000% during 2004−2006 in several cases; total exports and imports increased by 161% and 68% respectively in these two years.
Third, Table 6b permits a greater understanding of Mexican imports from China and Hong Kong for the main 4-digit items: most of them are closely related to the electronics (telecommunications and PCs) chains, irrespec-tive of their specific position within chapters of the Harmonized Tariff System: data processing machines and their parts and components (several items under 8471 and 8473, but also 8542, 8534, 9013 and 8541), televi-sion parts and radios and video equipment (items 8529, 8504, 8518, 8544, 8521 and 8414). Toys and autoparts also account for an increasing share of Mexico’s imports from China and include some of the most dynamic 4-digit imports from China.18 The topic will be discussed in detail for the
17 From this perspective, Mexican exports to China seem to be in a transition from manu-
facturing to raw materials and are currently relatively diversified, both in terms of the wide variety of products exported and also very probably in terms of firms. However, it has not been possible to link exports at the 4 and 6-digit level with the corresponding firms in Mexico.
18 The autoparts-automobile chain will probably be one of the most important chains for future competition and cooperation between China and Mexico, both in the domestic and US markets, although little analysis has been carried out so far on the subject. For an initial analysis, see Dussel Peters (2007b) and Alvarez Medina (2007).

Enrique Dussel Peters
DIE − UNAM / CECHIMEX 304
electronics sector in Jalisco (Dussel Peters s. a). In addition, Figure 5 shows that Mexican imports from China and Hong Kong are not only growing but are also changing their structure: the share of definitive im-ports (i.e. those for consumption in Mexico according to their tariff treat-ment) has fallen from 55.4% in 1995 to levels below 40% since 2004. Thus, these imports are increasingly being used for exports.19
In addition to the previously mentioned sectoral studies of the bilateral relationship – in particular in the electronics and yarn-textile-garment chains – two issues have been of concern: a) the increasing illegal import of Chinese goods and, b) the “triangulation” of Chinese goods.
The private sector has been publicly outspoken regarding the first topic: in the yarn-textile-garment chain, for example, trade associations estimate that up to 65% of domestic consumption is illegally imported, particularly from China (CANAINTEX 2007; Zaga 2007).20 Another form of illegal trade, known as “technical smuggling”, refers to the possibility of defin-ing goods under the wrong HTS 6 or 8-digit label, such as classifying new clothes as used, for example.21
Massive “triangulation” of Chinese goods through US ports, mainly through Long Beach, is also increasingly acknowledged by US public institutions (USGAO 2004). This is when Chinese goods enter the US as temporary imports and are exported to Mexico, now with the label “made in USA”. It has not been possible to quantify the dimension of this kind of irregular trade.
19 Current trade data does not allow for a more in depth analysis, i.e. to investigate
whether these imports substitute those from other countries, particularly the United States; and furthermore, whether, these imports are caused by intrafirm decisions or by interfirm competition. The next chapter elucidates some of these topics for the specific case of electronics (Dussel Peters s. a.).
20 Other goods such as steel and watering cans are also discussed as being imported ille-gally on a massive scale. In the latter case it is estimated that 80% are imported illegally (Reforma, July 23, 2007)
21 There is little detailed information on the matter. The Ministry of the Economy, how-ever, established that imports of rags and used cloths increased from 6,500 to 17,500 tons during 2003−2005 (Reforma, January 6, 2006)

Tab
le 4
:
Mex
ico:
Mai
n tr
adin
g pa
rtne
rs (1
993−
2006
) E
xpor
ts: $
US
mill
ions
1993
19
95
2000
20
04
2005
20
06
1995
−200
61
Uni
ted
Stat
es
42.8
51
66.2
73
147.
686
167.
455
183.
437
212.
285
--
2 C
anad
a 1.
569
1.98
7 3.
353
2.79
6 4.
232
5.18
3 --
3
Spai
n 91
8 79
7 1.
520
2.01
6 2.
880
3.28
0 --
4
Ger
man
y 43
0 51
5 1.
544
1.92
6 2.
290
2.97
5 --
5
Col
ombi
a 23
9 45
3 46
2 62
5 1.
545
2.13
3 --
Chi
na a
nd H
ong
Kon
g 14
0 54
1 39
1 75
4 1.
326
1.97
1
6 C
hina
45
37
20
4 47
4 1.
134
1.69
0 --
7
Japa
n 68
6 97
9 93
1 55
3 1.
476
1.60
4 --
8
Aru
ba
18
31
15
1.37
4 1.
447
1.46
9 --
9
Hol
land
19
3 17
7 43
9 55
9 80
1 1.
334
--
10
Bra
zil
292
800
517
574
890
1.14
8 --
11
G
uate
mal
a 20
4 31
0 53
5 60
2 86
4 93
5 --
12
U
nite
d K
ing
and
Irel
and
202
481
870
775
1.18
6 92
7 --
13
In
dia
10
25
60
454
522
671
--
14
Switz
erla
nd
141
608
553
780
117
95
--
15
Dut
ch A
ntill
es
32
59
871
11
11
31
--
Su
btot
al
47.9
69
74.0
75
159.
949
181.
729
204.
159
237.
733
--
R
est
3.86
3 5.
465
6.50
6 7.
472
9.83
5 12
.728
--
Tota
l 51
.832
79
.541
16
6.45
5 18
9.20
0 21
3.99
5 25
0.46
1 --
The Mexican Case
DIE − UNAM / CECHIMEX 305
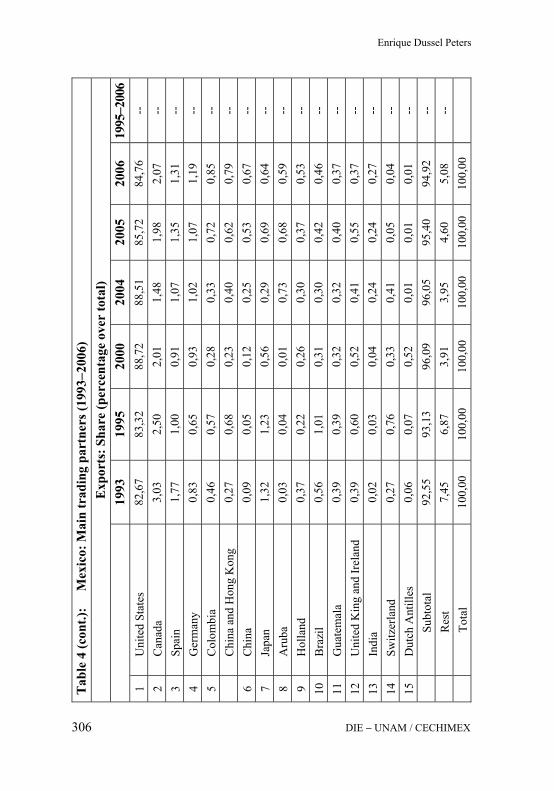
Tab
le 4
(con
t.):
M
exic
o: M
ain
trad
ing
part
ners
(199
3−20
06)
Exp
orts
: Sha
re (p
erce
ntag
e ov
er to
tal)
19
93
1995
20
00
2004
20
05
2006
19
95−2
006
1 U
nite
d St
ates
82
,67
83,3
2 88
,72
88,5
1 85
,72
84,7
6 --
2
Can
ada
3,03
2,
50
2,01
1,
48
1,98
2,
07
--
3 Sp
ain
1,77
1,
00
0,91
1,
07
1,35
1,
31
--
4 G
erm
any
0,83
0,
65
0,93
1,
02
1,07
1,
19
--
5 C
olom
bia
0,46
0,
57
0,28
0,
33
0,72
0,
85
--
C
hina
and
Hon
g K
ong
0,27
0,
68
0,23
0,
40
0,62
0,
79
--
6 C
hina
0,
09
0,05
0,
12
0,25
0,
53
0,67
--
7
Japa
n 1,
32
1,23
0,
56
0,29
0,
69
0,64
--
8
Aru
ba
0,03
0,
04
0,01
0,
73
0,68
0,
59
--
9 H
olla
nd
0,37
0,
22
0,26
0,
30
0,37
0,
53
--
10
Bra
zil
0,56
1,
01
0,31
0,
30
0,42
0,
46
--
11
Gua
tem
ala
0,39
0,
39
0,32
0,
32
0,40
0,
37
--
12
Uni
ted
Kin
g an
d Ir
elan
d 0,
39
0,60
0,
52
0,41
0,
55
0,37
--
13
In
dia
0,02
0,
03
0,04
0,
24
0,24
0,
27
--
14
Switz
erla
nd
0,27
0,
76
0,33
0,
41
0,05
0,
04
--
15
Dut
ch A
ntill
es
0,06
0,
07
0,52
0,
01
0,01
0,
01
--
Su
btot
al
92,5
5 93
,13
96,0
9 96
,05
95,4
0 94
,92
--
R
est
7,45
6,
87
3,91
3,
95
4,60
5,
08
--
To
tal
100,
00
100,
00
100,
00
100,
00
100,
00
100,
00
Enrique Dussel Peters
DIE − UNAM / CECHIMEX 306

Tab
le 4
(con
t.):
M
exic
o: M
ain
trad
ing
part
ners
(199
3−20
06)
Exp
orts
: Gro
wth
rat
e
1993
19
95
2000
20
04
2005
20
06
1995
−200
61
Uni
ted
Stat
es
--
24,4
17
,4
3,2
9,5
15,7
11
,2
2 C
anad
a --
12
,6
11,0
-4
,4
51,4
22
,5
9,1
3 Sp
ain
--
-6,8
13
,8
7,3
42,8
13
,9
13,7
4
Ger
man
y --
9,
4 24
,5
5,7
18,9
29
,9
17,3
5
Col
ombi
a --
37
,8
0,4
7,8
147,
4 38
,1
15,1
Chi
na a
nd H
ong
Kon
g --
96
,3
-6,3
17
,9
75,8
48
,7
12,5
6
Chi
na
--
-9,1
40
,6
23,5
13
9,1
49,0
41
,5
7 Ja
pan
--
19,4
-1
,0
-12,
2 16
6,8
8,7
4,6
8 A
ruba
--
33
,4
-13,
2 20
7,0
5,3
1,5
41,9
9
Hol
land
--
-4
,3
19,9
6,
2 43
,3
66,5
20
,1
10
Bra
zil
--
65,5
-8
,4
2,6
54,9
29
,1
3,3
11
Gua
tem
ala
--
23,4
11
,5
3,0
43,6
8,
3 10
,6
12
Uni
ted
Kin
g an
d Ir
elan
d --
54
,4
12,6
-2
,8
53,1
-2
1,9
6,1
13
Indi
a --
61
,6
18,9
66
,1
14,8
28
,7
34,8
14
Sw
itzer
land
--
10
7,7
-1,9
9,
0 -8
5,0
-19,
0 -1
5,5
15
Dut
ch A
ntill
es
--
35,6
71
,3
-66,
5 4,
1 17
6,9
-5,6
Subt
otal
--
24
,3
16,6
3,
2 12
,3
16,4
11
,2
R
est
--
18,9
3,
5 3,
5 31
,6
29,4
8,
0
Tota
l --
23
,9
15,9
3,
3 13
,1
17,0
11
,0
The Mexican Case
DIE − UNAM / CECHIMEX 307
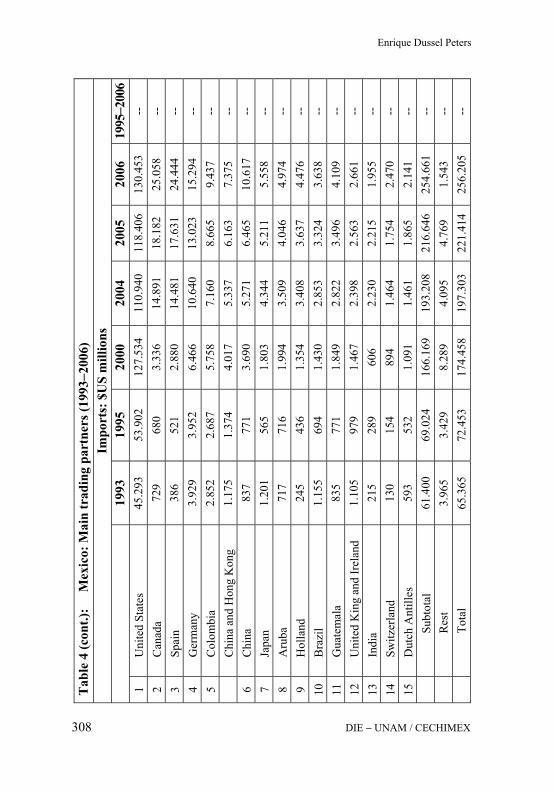
Tab
le 4
(con
t.):
M
exic
o: M
ain
trad
ing
part
ners
(199
3−20
06)
Impo
rts:
$U
S m
illio
ns
19
93
1995
20
00
2004
20
05
2006
19
95−2
006
1 U
nite
d St
ates
45
.293
53
.902
12
7.53
4 11
0.94
0 11
8.40
6 13
0.45
3 --
2
Can
ada
729
680
3.33
6 14
.891
18
.182
25
.058
--
3
Spai
n 38
6 52
1 2.
880
14.4
81
17.6
31
24.4
44
--
4 G
erm
any
3.92
9 3.
952
6.46
6 10
.640
13
.023
15
.294
--
5
Col
ombi
a 2.
852
2.68
7 5.
758
7.16
0 8.
665
9.43
7 --
Chi
na a
nd H
ong
Kon
g 1.
175
1.37
4 4.
017
5.33
7 6.
163
7.37
5 --
6
Chi
na
837
771
3.69
0 5.
271
6.46
5 10
.617
--
7
Japa
n 1.
201
565
1.80
3 4.
344
5.21
1 5.
558
--
8 A
ruba
71
7 71
6 1.
994
3.50
9 4.
046
4.97
4 --
9
Hol
land
24
5 43
6 1.
354
3.40
8 3.
637
4.47
6 --
10
B
razi
l 1.
155
694
1.43
0 2.
853
3.32
4 3.
638
--
11
Gua
tem
ala
835
771
1.84
9 2.
822
3.49
6 4.
109
--
12
Uni
ted
Kin
g an
d Ir
elan
d 1.
105
979
1.46
7 2.
398
2.56
3 2.
661
--
13
Indi
a 21
5 28
9 60
6 2.
230
2.21
5 1.
955
--
14
Switz
erla
nd
130
154
894
1.46
4 1.
754
2.47
0 --
15
D
utch
Ant
illes
59
3 53
2 1.
091
1.46
1 1.
865
2.14
1 --
Subt
otal
61
.400
69
.024
16
6.16
9 19
3.20
8 21
6.64
6 25
4.66
1 --
Res
t 3.
965
3.42
9 8.
289
4.09
5 4.
769
1.54
3 --
Tota
l 65
.365
72
.453
17
4.45
8 19
7.30
3 22
1.41
4 25
6.20
5 --
Enrique Dussel Peters
DIE − UNAM / CECHIMEX 308
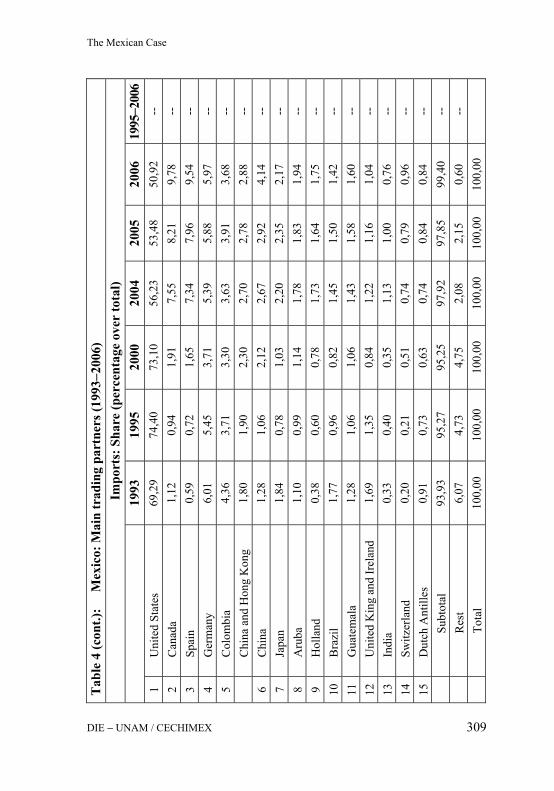
Tab
le 4
(con
t.):
M
exic
o: M
ain
trad
ing
part
ners
(199
3−20
06)
Impo
rts:
Sha
re (p
erce
ntag
e ov
er to
tal)
19
93
1995
20
00
2004
20
05
2006
19
95−2
006
1 U
nite
d St
ates
69
,29
74,4
0 73
,10
56,2
3 53
,48
50,9
2 --
2
Can
ada
1,12
0,
94
1,91
7,
55
8,21
9,
78
--
3 Sp
ain
0,59
0,
72
1,65
7,
34
7,96
9,
54
--
4 G
erm
any
6,01
5,
45
3,71
5,
39
5,88
5,
97
--
5 C
olom
bia
4,36
3,
71
3,30
3,
63
3,91
3,
68
--
C
hina
and
Hon
g K
ong
1,80
1,
90
2,30
2,
70
2,78
2,
88
--
6 C
hina
1,
28
1,06
2,
12
2,67
2,
92
4,14
--
7
Japa
n 1,
84
0,78
1,
03
2,20
2,
35
2,17
--
8
Aru
ba
1,10
0,
99
1,14
1,
78
1,83
1,
94
--
9 H
olla
nd
0,38
0,
60
0,78
1,
73
1,64
1,
75
--
10
Bra
zil
1,77
0,
96
0,82
1,
45
1,50
1,
42
--
11
Gua
tem
ala
1,28
1,
06
1,06
1,
43
1,58
1,
60
--
12
Uni
ted
Kin
g an
d Ir
elan
d 1,
69
1,35
0,
84
1,22
1,
16
1,04
--
13
In
dia
0,33
0,
40
0,35
1,
13
1,00
0,
76
--
14
Switz
erla
nd
0,20
0,
21
0,51
0,
74
0,79
0,
96
--
15
Dut
ch A
ntill
es
0,91
0,
73
0,63
0,
74
0,84
0,
84
--
Su
btot
al
93,9
3 95
,27
95,2
5 97
,92
97,8
5 99
,40
--
R
est
6,07
4,
73
4,75
2,
08
2,15
0,
60
--
To
tal
100,
00
100,
00
100,
00
100,
00
100,
00
100,
00
The Mexican Case
DIE − UNAM / CECHIMEX 309
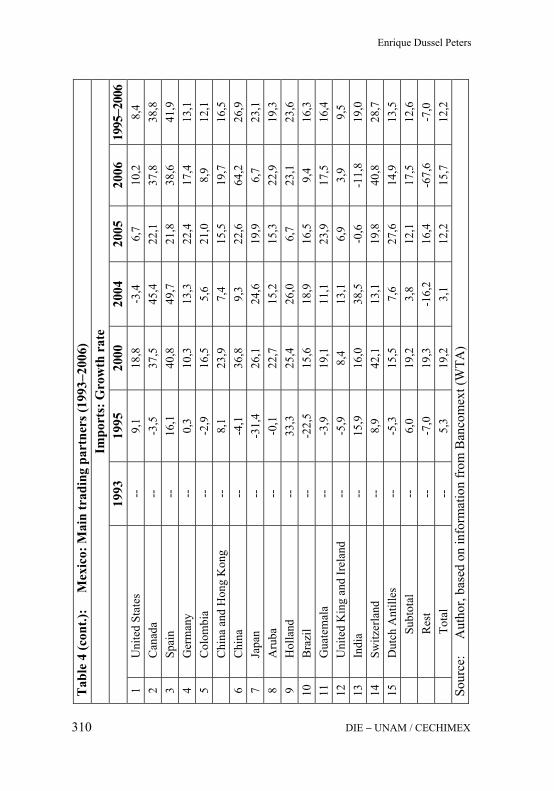
Tab
le 4
(con
t.):
M
exic
o: M
ain
trad
ing
part
ners
(199
3−20
06)
Impo
rts:
Gro
wth
rat
e
1993
19
95
2000
20
04
2005
20
06
1995
−200
61
Uni
ted
Stat
es
--
9,1
18,8
-3
,4
6,7
10,2
8,
4 2
Can
ada
--
-3,5
37
,5
45,4
22
,1
37,8
38
,8
3 Sp
ain
--
16,1
40
,8
49,7
21
,8
38,6
41
,9
4 G
erm
any
--
0,3
10,3
13
,3
22,4
17
,4
13,1
5
Col
ombi
a --
-2
,9
16,5
5,
6 21
,0
8,9
12,1
Chi
na a
nd H
ong
Kon
g --
8,
1 23
,9
7,4
15,5
19
,7
16,5
6
Chi
na
--
-4,1
36
,8
9,3
22,6
64
,2
26,9
7
Japa
n --
-3
1,4
26,1
24
,6
19,9
6,
7 23
,1
8 A
ruba
--
-0
,1
22,7
15
,2
15,3
22
,9
19,3
9
Hol
land
--
33
,3
25,4
26
,0
6,7
23,1
23
,6
10
Bra
zil
--
-22,
5 15
,6
18,9
16
,5
9,4
16,3
11
G
uate
mal
a --
-3
,9
19,1
11
,1
23,9
17
,5
16,4
12
U
nite
d K
ing
and
Irel
and
--
-5,9
8,
4 13
,1
6,9
3,9
9,5
13
Indi
a --
15
,9
16,0
38
,5
-0,6
-1
1,8
19,0
14
Sw
itzer
land
--
8,
9 42
,1
13,1
19
,8
40,8
28
,7
15
Dut
ch A
ntill
es
--
-5,3
15
,5
7,6
27,6
14
,9
13,5
Subt
otal
--
6,
0 19
,2
3,8
12,1
17
,5
12,6
Res
t --
-7
,0
19,3
-1
6,2
16,4
-6
7,6
-7,0
Tota
l --
5,
3 19
,2
3,1
12,2
15
,7
12,2
So
urce
:
Aut
hor,
base
d on
info
rmat
ion
from
Ban
com
ext (
WTA
)
Enrique Dussel Peters
DIE − UNAM / CECHIMEX 310

T
able
5:
M
exic
o: T
rade
by
chap
ters
with
Uni
ted
Stat
es a
nd C
hina
(199
3−20
06; A
AG
R 1
995−
2007
)
Exp
orts
19
93
1995
20
00
2004
20
05
2006
A
AG
R
1995
−200
7 Sh
are
2007
US$
mill
ions
Tota
l exp
orts
51
.832
79
.541
16
6.45
5 18
9.20
0 21
3.99
5 25
0.46
1 11
,0
100,
00
M
ain
5 ch
apte
rs
34.2
87
50.9
78
118.
402
134.
390
152.
432
181.
512
12,2
72
,47
R
est
17.5
45
28.5
63
48.0
53
54.8
11
61.5
62
68.9
49
8,3
27,5
3
85
Elec
troni
cs
13.7
78
20.3
15
47.5
21
46.8
50
51.7
82
61.7
05
10,6
24
,64
87
Aut
omob
iles
7.05
1 12
.223
28
.158
28
.574
32
.149
39
.495
11
,3
15,7
7
27
Oil
7.22
9 8.
203
16.0
73
23.5
15
31.9
89
38.9
89
15,2
15
,57
84
Aut
opar
ts
5.08
0 8.
807
22.2
01
29.2
28
28.8
55
32.6
60
12,7
13
,04
90
Opt
ical
equ
ipm
ent a
nd
inst
rum
ents
1.
149
1.43
1 4.
449
6.22
3 7.
656
8.66
4 17
,8
3,46
Exp
orts
to th
e U
nite
d St
ates
Tota
l 42
.851
66
.273
14
7.68
6 16
7.45
5 18
3.43
7 21
2.28
5 11
,2
100,
00
M
ain
5 ch
apte
rs
28.7
40
44.7
65
107.
564
122.
468
133.
992
157.
898
12,1
74
,38
R
est
14.1
10
21.5
08
40.1
21
44.9
87
49.4
45
54.3
87
8,8
25,6
2
The Mexican Case
DIE − UNAM / CECHIMEX 311
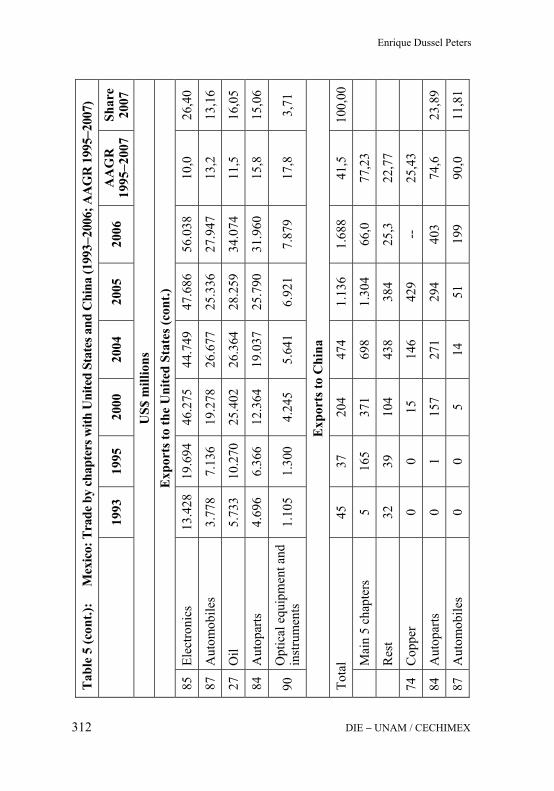
T
able
5 (c
ont.)
:
Mex
ico:
Tra
de b
y ch
apte
rs w
ith U
nite
d St
ates
and
Chi
na (1
993−
2006
; AA
GR
199
5−20
07)
19
93
1995
20
00
2004
20
05
2006
A
AG
R
1995
−200
7 Sh
are
2007
U
S$ m
illio
ns
Exp
orts
to th
e U
nite
d St
ates
(con
t.)
85
Elec
troni
cs
13.4
28
19.6
94
46.2
75
44.7
49
47.6
86
56.0
38
10,0
26
,40
87
Aut
omob
iles
3.77
8 7.
136
19.2
78
26.6
77
25.3
36
27.9
47
13,2
13
,16
27
Oil
5.73
3 10
.270
25
.402
26
.364
28
.259
34
.074
11
,5
16,0
5
84
Aut
opar
ts
4.69
6 6.
366
12.3
64
19.0
37
25.7
90
31.9
60
15,8
15
,06
90
Opt
ical
equ
ipm
ent a
nd
inst
rum
ents
1.
105
1.30
0 4.
245
5.64
1 6.
921
7.87
9 17
,8
3,71
Exp
orts
to C
hina
Tota
l 45
37
20
4 47
4 1.
136
1.68
8 41
,5
100,
00
M
ain
5 ch
apte
rs
5 16
5 37
1 69
8 1.
304
66,0
77
,23
R
est
32
39
104
438
384
25,3
22
,77
74
Cop
per
0 0
15
146
429
--
25,4
3
84
Aut
opar
ts
0 1
157
271
294
403
74,6
23
,89
87
Aut
omob
iles
0 0
5 14
51
19
9 90
,0
11,8
1
Enrique Dussel Peters
DIE − UNAM / CECHIMEX 312
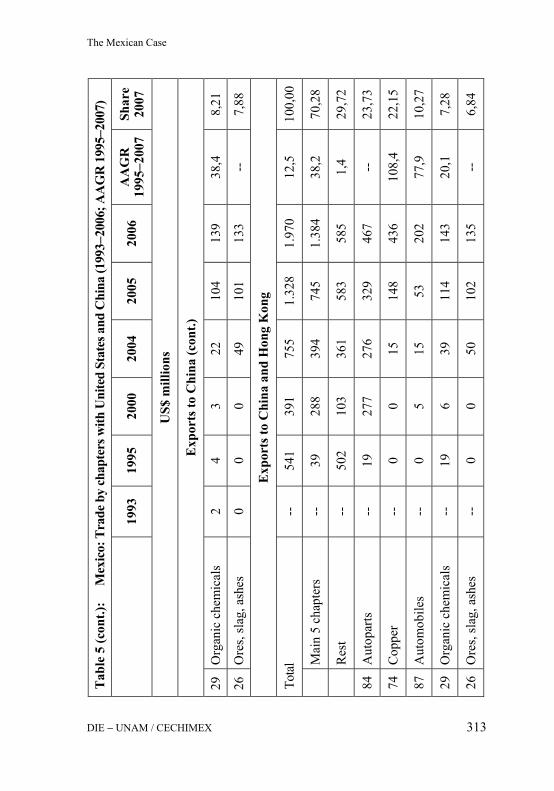
Tab
le 5
(con
t.):
M
exic
o: T
rade
by
chap
ters
with
Uni
ted
Stat
es a
nd C
hina
(199
3−20
06; A
AG
R 1
995−
2007
)
19
93
1995
20
00
2004
20
05
2006
A
AG
R
1995
−200
7 Sh
are
2007
US$
mill
ions
Exp
orts
to C
hina
(con
t.)
29
Org
anic
che
mic
als
2 4
3 22
10
4 13
9 38
,4
8,21
26
Ore
s, sl
ag, a
shes
0
0 0
49
101
133
--
7,88
Exp
orts
to C
hina
and
Hon
g K
ong
Tota
l --
54
1 39
1 75
5 1.
328
1.97
0 12
,5
100,
00
M
ain
5 ch
apte
rs
--
39
288
394
745
1.38
4 38
,2
70,2
8
R
est
--
502
103
361
583
585
1,4
29,7
2
84
Aut
opar
ts
--
19
277
276
329
467
--
23,7
3
74
Cop
per
--
0 0
15
148
436
108,
4 22
,15
87
Aut
omob
iles
--
0 5
15
53
202
77,9
10
,27
29
Org
anic
che
mic
als
--
19
6 39
11
4 14
3 20
,1
7,28
26
Ore
s, sl
ag, a
shes
--
0
0 50
10
2 13
5 --
6,
84
The Mexican Case
DIE − UNAM / CECHIMEX 313
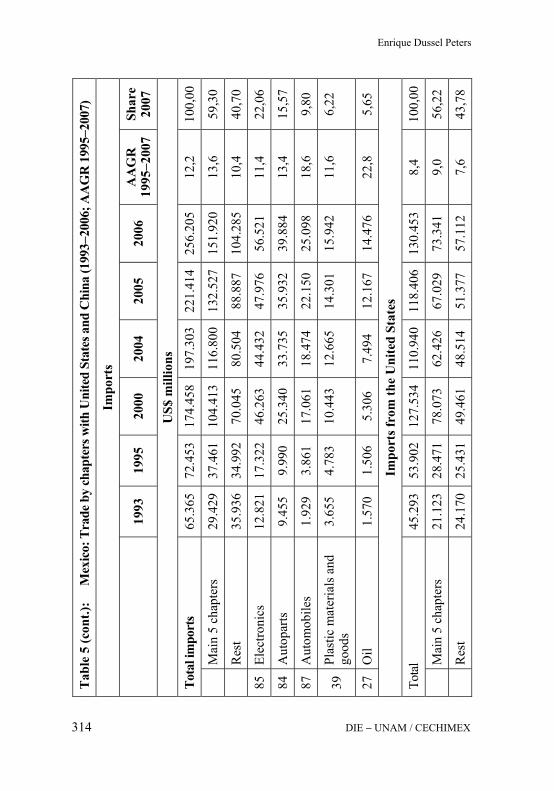
Tab
le 5
(con
t.):
M
exic
o: T
rade
by
chap
ters
with
Uni
ted
Stat
es a
nd C
hina
(199
3−20
06; A
AG
R 1
995−
2007
)
Impo
rts
19
93
1995
20
00
2004
20
05
2006
A
AG
R
1995
−200
7 Sh
are
2007
US$
mill
ions
Tota
l im
port
s 65
.365
72
.453
17
4.45
8 19
7.30
3 22
1.41
4 25
6.20
5 12
,2
100,
00
Mai
n 5
chap
ters
29
.429
37
.461
10
4.41
3 11
6.80
0 13
2.52
7 15
1.92
0 13
,6
59,3
0
Res
t 35
.936
34
.992
70
.045
80
.504
88
.887
10
4.28
5 10
,4
40,7
0
85
Elec
troni
cs
12.8
21
17.3
22
46.2
63
44.4
32
47.9
76
56.5
21
11,4
22
,06
84
Aut
opar
ts
9.45
5 9.
990
25.3
40
33.7
35
35.9
32
39.8
84
13,4
15
,57
87
Aut
omob
iles
1.92
9 3.
861
17.0
61
18.4
74
22.1
50
25.0
98
18,6
9,
80
39
Plas
tic m
ater
ials
and
go
ods
3.65
5 4.
783
10.4
43
12.6
65
14.3
01
15.9
42
11,6
6,
22
27
Oil
1.57
0 1.
506
5.30
6 7.
494
12.1
67
14.4
76
22,8
5,
65
Impo
rts f
rom
the
Uni
ted
Stat
es
Tota
l 45
.293
53
.902
12
7.53
4 11
0.94
0 11
8.40
6 13
0.45
3 8,
4 10
0,00
M
ain
5 ch
apte
rs
21.1
23
28.4
71
78.0
73
62.4
26
67.0
29
73.3
41
9,0
56,2
2
R
est
24.1
70
25.4
31
49.4
61
48.5
14
51.3
77
57.1
12
7,6
43,7
8
Enrique Dussel Peters
DIE − UNAM / CECHIMEX 314
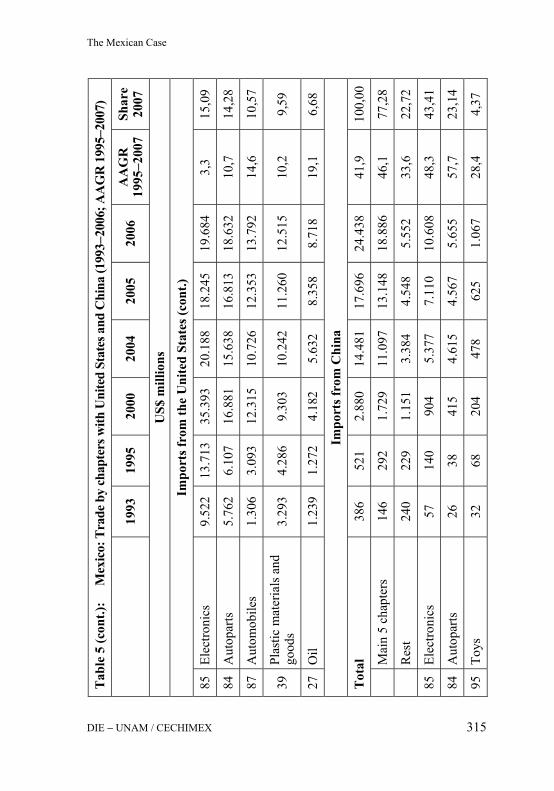
Tab
le 5
(con
t.):
M
exic
o: T
rade
by
chap
ters
with
Uni
ted
Stat
es a
nd C
hina
(199
3−20
06; A
AG
R 1
995−
2007
)
19
93
1995
20
00
2004
20
05
2006
A
AG
R
1995
−200
7 Sh
are
2007
US$
mill
ions
Impo
rts f
rom
the
Uni
ted
Stat
es (c
ont.)
85
Elec
troni
cs
9.52
2 13
.713
35
.393
20
.188
18
.245
19
.684
3,
3 15
,09
84
Aut
opar
ts
5.76
2 6.
107
16.8
81
15.6
38
16.8
13
18.6
32
10,7
14
,28
87
Aut
omob
iles
1.30
6 3.
093
12.3
15
10.7
26
12.3
53
13.7
92
14,6
10
,57
39
Plas
tic m
ater
ials
and
go
ods
3.29
3 4.
286
9.30
3 10
.242
11
.260
12
.515
10
,2
9,59
27
Oil
1.23
9 1.
272
4.18
2 5.
632
8.35
8 8.
718
19,1
6,
68
Impo
rts f
rom
Chi
na
Tot
al
386
521
2.88
0 14
.481
17
.696
24
.438
41
,9
100,
00
M
ain
5 ch
apte
rs
146
292
1.72
9 11
.097
13
.148
18
.886
46
,1
77,2
8
R
est
240
229
1.15
1 3.
384
4.54
8 5.
552
33,6
22
,72
85
Elec
troni
cs
57
140
904
5.37
7 7.
110
10.6
08
48,3
43
,41
84
Aut
opar
ts
26
38
415
4.61
5 4.
567
5.65
5 57
,7
23,1
4
95
Toys
32
68
20
4 47
8 62
5 1.
067
28,4
4,
37
The Mexican Case
DIE − UNAM / CECHIMEX 315
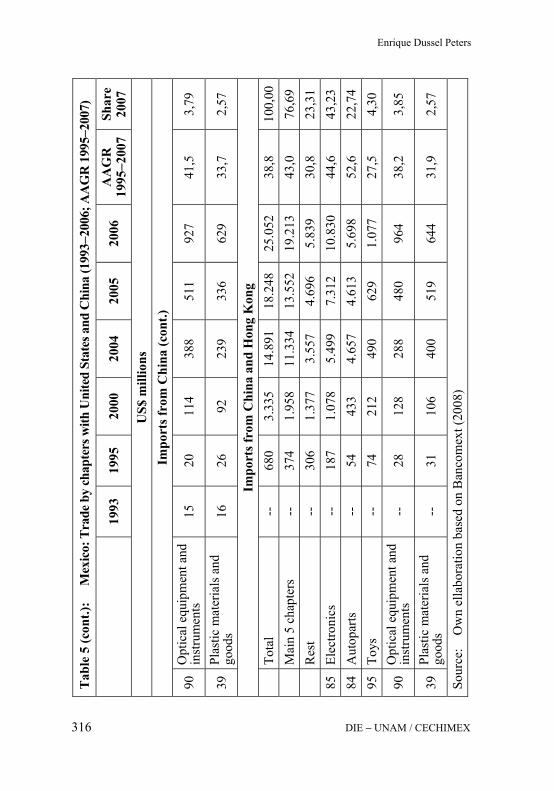
Tab
le 5
(con
t.):
M
exic
o: T
rade
by
chap
ters
with
Uni
ted
Stat
es a
nd C
hina
(199
3−20
06; A
AG
R 1
995−
2007
)
19
93
1995
20
00
2004
20
05
2006
A
AG
R
1995
−200
7 Sh
are
2007
U
S$ m
illio
ns
Impo
rts f
rom
Chi
na (c
ont.)
90
Opt
ical
equ
ipm
ent a
nd
inst
rum
ents
15
20
11
4 38
8 51
1 92
7 41
,5
3,79
39
Plas
tic m
ater
ials
and
go
ods
16
26
92
239
336
629
33,7
2,
57
Impo
rts f
rom
Chi
na a
nd H
ong
Kon
g
Tota
l --
68
0 3.
335
14.8
91
18.2
48
25.0
52
38,8
10
0,00
Mai
n 5
chap
ters
--
37
4 1.
958
11.3
34
13.5
52
19.2
13
43,0
76
,69
R
est
--
306
1.37
7 3.
557
4.69
6 5.
839
30,8
23
,31
85
Elec
troni
cs
--
187
1.07
8 5.
499
7.31
2 10
.830
44
,6
43,2
3 84
A
utop
arts
--
54
43
3 4.
657
4.61
3 5.
698
52,6
22
,74
95
Toys
--
74
21
2 49
0 62
9 1.
077
27,5
4,
30
90
Opt
ical
equ
ipm
ent a
nd
inst
rum
ents
--
28
12
8 28
8 48
0 96
4 38
,2
3,85
39
Plas
tic m
ater
ials
and
go
ods
--
31
106
400
519
644
31,9
2,
57
Sour
ce:
Ow
n el
labo
ratio
n ba
sed
on B
anco
mex
t (20
08)
Enrique Dussel Peters
DIE − UNAM / CECHIMEX 316

Tab
le 6
a:
Mex
ico:
20
lead
ing
4-di
git i
tem
s exp
orte
d to
Chi
na a
nd H
ong
Kon
g (2
006)
2004
20
06
2004
20
06
US$
mill
ions
Sh
are
over
tota
l G
row
th r
ate
1 84
73
Parts
etc
for t
ypew
riter
s & o
ther
of
fice
mac
hine
s 21
0 30
0 27
.82
15.2
3 42
.9
2 74
04
Cop
per w
aste
and
scra
p 0
293
0.03
14
.87
117,
961.
0
3 87
08
Parts
& a
cces
s for
mot
or v
ehic
les
(Hea
d 87
01-8
705)
14
15
1 1.
91
7.68
95
1.4
4 29
33
Het
eroc
yclic
com
p, N
it H
eter
o-A
tom
s onl
y 17
10
9 2.
19
5.51
55
6.7
5 74
03
Ref
ined
cop
per &
allo
ys (n
o m
ast
allo
y) u
nwro
ught
6
94
0.85
4.
78
1,36
7.1
6 84
71
Aut
omat
ic d
ata
proc
ess m
achi
nes;
M
agn
read
er e
tc.
2 92
0.
27
4.68
4,
367.
6
7 26
03
Cop
per o
res a
nd c
once
ntra
tes
49
64
6.46
3.
26
31.7
8 39
15
Was
te, p
airin
gs an
d sc
rap,
of p
lasti
cs
7 59
0.
94
2.95
71
6.7
9 87
03
Mot
or c
ars &
veh
icle
s for
tran
spor
t-in
g pe
rson
s 0
51
0.00
2.
57
708,
527.
2
The Mexican Case
DIE − UNAM / CECHIMEX 317
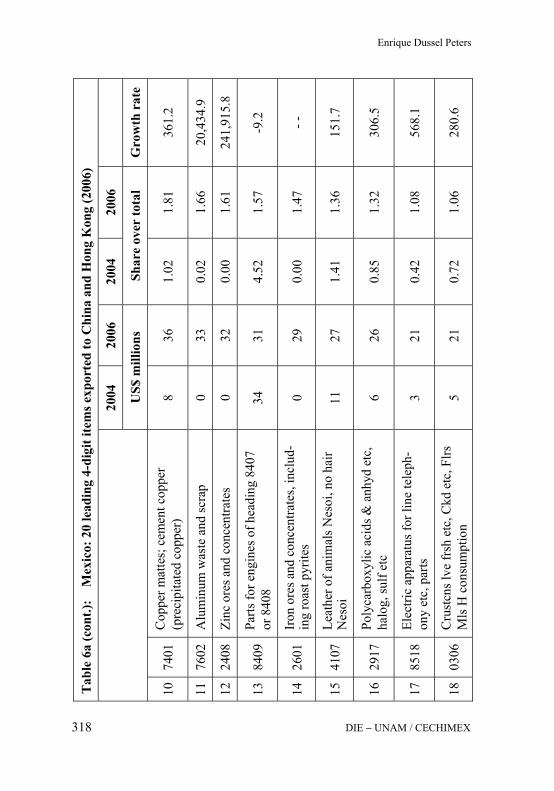
Tab
le 6
a (c
ont.)
: M
exic
o: 2
0 le
adin
g 4-
digi
t ite
ms e
xpor
ted
to C
hina
and
Hon
g K
ong
(200
6)
2004
20
06
2004
20
06
US$
mill
ions
Sh
are
over
tota
l G
row
th r
ate
10
7401
C
oppe
r mat
tes;
cem
ent c
oppe
r (p
reci
pita
ted
copp
er)
8 36
1.
02
1.81
36
1.2
11
7602
A
lum
inum
was
te a
nd sc
rap
0 33
0.
02
1.66
20
,434
.9
12
2408
Zi
nc o
res a
nd c
once
ntra
tes
0 32
0.
00
1.61
24
1,91
5.8
13
8409
Pa
rts fo
r eng
ines
of h
eadi
ng 8
407
or 8
408
34
31
4.52
1.
57
-9.2
14
2601
Ir
on o
res a
nd c
once
ntra
tes,
incl
ud-
ing
roas
t pyr
ites
0 29
0.
00
1.47
- -
15
4107
Le
athe
r of a
nim
als N
esoi
, no
hair
Nes
oi
11
27
1.41
1.
36
151.
7
16
2917
Po
lyca
rbox
ylic
aci
ds &
anh
yd e
tc,
halo
g, su
lf et
c 6
26
0.85
1.
32
306.
5
17
8518
El
ectri
c ap
para
tus f
or li
ne te
leph
-on
y et
c, p
arts
3
21
0.42
1.
08
568.
1
18
0306
C
rust
cns l
ve fr
sh e
tc, C
kd e
tc, F
lrs
Mls
H c
onsu
mpt
ion
5 21
0.
72
1.06
28
0.6
Enrique Dussel Peters
DIE − UNAM / CECHIMEX 318

Tab
le 6
a (c
ont.)
: M
exic
o: 2
0 le
adin
g 4-
digi
t ite
ms e
xpor
ted
to C
hina
and
Hon
g K
ong
(200
6)
2004
20
06
2004
20
06
US$
mill
ions
Sh
are
over
tota
l G
row
th r
ate
19
5201
C
otto
n, n
ot c
arde
d or
com
bed
4 17
0.
55
0.87
31
0.2
20
7220
F1
-R1
stai
nles
s ste
el p
rodu
cts,
unde
r 600
mm
wid
e 7
15
0.97
0.
75
102.
2
20 m
ain
4-di
git i
tem
s 38
5 1,
499
50.9
7 76
.09
289.
7
Res
t 37
0 47
1 49
.03
23.9
1 27
.3
Tot
al e
xpor
ts
755
1,97
0 10
0 10
0 16
1.1
Sour
ce:
A
utho
r, ba
sed
on in
form
atio
n fr
om B
anco
mex
t (20
08)
The Mexican Case
DIE − UNAM / CECHIMEX 319

Tab
le 6
b:
Mex
ico:
20
lead
ing
4-di
git i
tem
s im
port
ed to
Chi
na a
nd H
ong
Kon
g (2
006)
2004
20
06
2004
20
06
US$
mill
ions
Sh
are
over
tota
l G
row
th ra
te
1 84
71
Aut
omat
ic d
ata
proc
ess m
achi
nes;
mag
n re
ader
etc
. 2,
419
2,55
5 16
.24
10.2
0 5.
6
2 85
29
Parts
for t
elev
isio
n, ra
dio
and
radi
o ap
para
tus
878
2,52
0 5.
9.0
10.0
6 18
6.9
3 84
73
Parts
for t
ypew
riter
s & o
ther
off
ice
mac
hine
s 1,
654
1,86
6 11
.11
7.45
12
.8
4 75
258
Tran
s app
ar fo
r rad
iote
le et
c; TV
cam
era &
rec
247
1,08
8 1.
66
4.34
34
0.0
5 75
42
Elec
troni
c in
tegr
ated
circ
uits
& m
icro
asse
m-
bly
pts
765
1,06
2 5.
14
4.24
38
.8
6 75
24
Elec
tran
s, sta
tic c
onv
& in
duct
, adp
pw
r sup
p, p
t 55
8 80
1 3.
75
3.20
43
.5
7 75
34
Prin
ted
circ
uits
32
7 64
0 2.
20
2.56
95
.8
8 90
13
Liqu
id c
ryst
al d
evic
es N
esoi
; las
ers;
opt
app
l; pt
92
55
3 0.
62
2.21
50
2.3
9 85
17
Elec
tric a
ppar
atus
for l
ine t
elep
hony
etc p
arts
22
0 55
0 1.
48
2.20
15
0.2
10
9802
Ex
pts c
harit
y N
esoi
; Im
pts r
etur
n ar
ticle
s, ad
vanc
ed
365
537
2.45
2.
14
47.3
11
9504
A
rticl
es fo
r arc
ade,
tabl
e or
par
lor g
ames
, pt
61
490
0.41
1.
95
698.
5
12
8518
M
icro
phon
es; l
ouds
peak
ers;
soun
d am
plifi
er
etc,
pt
249
462
1.67
1.
84
85.7
Enrique Dussel Peters
DIE − UNAM / CECHIMEX 320
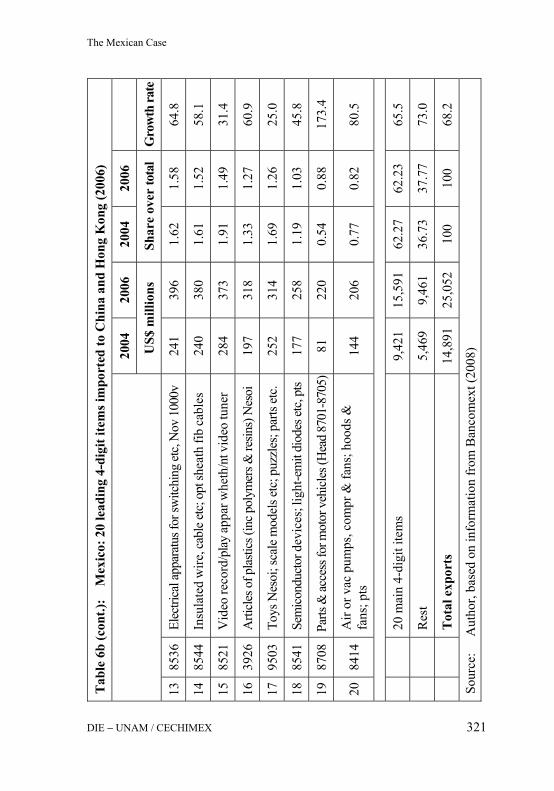
Tab
le 6
b (c
ont.)
: M
exic
o: 2
0 le
adin
g 4-
digi
t ite
ms i
mpo
rted
to C
hina
and
Hon
g K
ong
(200
6)
2004
20
06
2004
20
06
US$
mill
ions
Sh
are
over
tota
l G
row
th ra
te
13
8536
El
ectri
cal a
ppar
atus
for s
witc
hing
etc,
Nov
100
0v
241
396
1.62
1.
58
64.8
14
8544
In
sula
ted
wire
, cab
le et
c; o
pt sh
eath
fib
cabl
es
240
380
1.61
1.
52
58.1
15
8521
V
ideo
reco
rd/p
lay
appa
r whe
th/n
t vid
eo tu
ner
284
373
1.91
1.
49
31.4
16
3926
A
rticl
es o
f pla
stics
(inc
pol
ymer
s & re
sins)
Nes
oi
197
318
1.33
1.
27
60.9
17
9503
To
ys N
esoi
; sca
le m
odel
s etc
; puz
zles
; par
ts et
c. 25
2 31
4 1.
69
1.26
25
.0
18
8541
Se
mic
ondu
ctor d
evic
es; l
ight
-em
it di
odes
etc,
pts
177
258
1.19
1.
03
45.8
19
8708
Pa
rts &
acce
ss fo
r mot
or v
ehic
les (
Hea
d 87
01-8
705)
81
220
0.54
0.
88
173.
4
20
8414
A
ir or
vac
pum
ps, c
ompr
& fa
ns; h
oods
&
fans
; pts
14
4 20
6 0.
77
0.82
80
.5
20
mai
n 4-
digi
t ite
ms
9,42
1 15
,591
62
.27
62.2
3 65
.5
Res
t 5,
469
9,46
1 36
.73
37.7
7 73
.0
Tot
al e
xpor
ts
14,8
91
25,0
52
100
100
68.2
Sour
ce:
A
utho
r, ba
sed
on in
form
atio
n fr
om B
anco
mex
t (20
08)
The Mexican Case
DIE − UNAM / CECHIMEX 321

Figu
re 5
: M
exic
an im
port
s fro
m C
hina
and
Hon
g K
ong
by ty
pe (1
995−
2006
) (pe
rcen
tage
ove
r to
tal)
Sour
ce:
Aut
hor,
base
d on
info
rmat
ion
from
Ban
com
ext (
2008
)
0%10%
20%
30%
40%
50%
60%
70%
80%
90%
100%
1995
1996
1997
1998
1999
2000
2001
2002
2003
2004
2005
2006
Temp
orary
Defin
itive
Enrique Dussel Peters
DIE − UNAM / CECHIMEX 322

The Mexican Case
DIE − UNAM / CECHIMEX 323
3.2 Existing bilateral institutions Even though Mexico initiated diplomatic relations with the People’s Re-public of China in February of 1972 and with China in 1899, its relation-ship with China after its period of reforms at the end of the seventies, despite several high-level visits (Gómez / Palacio 2005), was not formally through the Bilateral Commission. As a result, in September of 2004 both governments established a High Level Group / Grupo de Alto Nivel (GAN) on a broad number of bilateral topics, including trade and invest-ment; GAN held its first meeting in January of 2005.22 During the group’s first meeting, various subgroups were created, including the Subgroup on Statistical Cooperation, the Subgroup on the Status Recognition of the Market Economy in China and the Subgroup on Industrial Policy Material. Similarly, various agreements were signed to avoid double taxation (Sep-tember 2005), for maritime transport (January 2005), and to combat illegal trade and for cooperation between Bancomext and Eximbank of China (September 14th 2004), with the intention of opening reciprocal lines of credit of up to 300 million dollars to promote bilateral trade. Since then, some progress has been made in the bilateral trade of specific products, such as table grapes and avocados, among others (GAN 2005; Anguiano 2007; Villalobos 2007). Both institutions – the Bilateral Commission and GAN – have however so far lacked overall results on short, medium and long term issues; the lack of high-level support and leadership in both countries has been one of the main shortcomings of these institutions.
A second significant initiative connected to the bilateral relationship with China is recent activities carried out by the National Foreign Trade Bank (Bancomext in Spanish), which was renamed “Pro-México” in 2007 and operates under the Ministry of the Economy. Bancomext has made a seri-ous effort, considering the budget granted to it by the federal government, to establish points of contact in China (Shanghai, Beijing, Guangzhou and Hong Kong) after a few offices were closed in earlier years. One of Ban-comext’s current priorities is attaining in depth knowledge of the Chinese market and identifying products for which there could be significant Chi-
22 By the end of 2006, agreements had been reached on sanitary and phystosanitary meas-
ures for Chinese exports to Mexico of various agricultural products and the import of others from Mexico, working groups were created and an Agreement on the Reciprocal Promotion and Protection of Investments (APPRI in Spanish) was negotiated to con-solidate bilateral investments (Villalobos 2007).

DIE − UNAM / CECHIMEX 324
nese demand. These efforts will be carried out via trade promotion such as trade missions, campaigns for special products, participation in interna-tional fairs, reciprocal visits between buyers and investors and the Pro-gram to Boost Exports to the Chinese Market, which had funding of 25 million pesos in 2005.23 There has not been an evaluation of the program so far, although resources and personnel clearly fall short of expectations.
Finally, the government of the state of Michoacán and the Mexican Asso-ciation of Economic Secretaries (AMSDE in Spanish), with support from the Federal Ministry of the Economy, initiated the China-Mexico Business Scholarship Program in 2005. This initiative, supported since 2006 by the Center for Chinese-Mexican Studies of the National Autonomous Univer-sity of Mexico, represents the first long-term activity to allow for a deeper socioeconomic understanding of the bilateral relationship, as well as lan-guage training (AMSDE 2007). There has not been an evaluation of the program yet, as the first projects were being implemented in 2007.
Finally, it is important to understand that the bilateral relationship has been under increasing strain in the last years, particularly from the point of view of trade. On the one hand, Mexico was the last country to negotiate bilater-ally for China’s accession to the World Trade Organization (WTO) in De-cember of 2001; as part of this accord, both countries agreed that Mexico could keep anti-dumping measures for more than 1300 tariff lines covering products such as textiles, clothing, footwear, organic chemicals, toys and pencils, among others (Dussel Peters 2005a). These measures would only be subject to the provisions of the WTO Agreement on December 12th, 2007 (Dussel Peters 2007b; Dussel Peters 2007a). In addition, both the United States (on 2 February, 2007) and Mexico (on 26 February, 2007) requested a WTO Panel challenging China’s incentive programs for policies such as research & development (R&D), trade and industry, among others.24 Finally, Mexico is one of the few countries in Latin America that has not granted market economy status to China in the context of the WTO.
23 The program helps companies – especially small ones – obtain access to their products
in areas such as information services, consultancy, supply promotion, international fairs and agendas in Mexico, in most cases covering 50% of costs (Casas 2005). About two years ago Bancomext offered various specialized courses to businessmen who wanted to invest in China under the slogan, “How to Do Business in China”.
24 In March 2007 China eliminated one of the subsidy programs and implemented a new income tax providing tax breaks for qualifying firms. Additional consultations were held in June 2007. Panel proceedings in that dispute are underway.
The Mexican Case
DIE − UNAM / CECHIMEX 325
Part of this increasing tension is reflected in the lack of GAN results since 2004 on topics such as statistics, the recognition of China as a market economy, and illegal trade and tourism, among others. In the short run, until the first quarter of 2008, at least two scenarios are imaginable: a) one in which increasing trade disputes in the framework of the WTO and in bilateral institutions and in which China challenges the anti-dumping measures implemented by Mexico since 2001, while Mexico continues – together with the US – challenging China’s wide range of instruments and incentives for firms, trade and production; and b) one in which China does not challenge Mexico’s anti-dumping measures, because most of these items are already being imported, either illegally or through the discussed “triangulation”, while Mexico engages in more effective and results-oriented bilateral negotiations, instead of a confrontation within multilat-eral institutions such as the WTO.
4 The Trade Relationship between China and Mexico in the US Market
If we acknowledge the existing analysis of the trade relationship between China and Mexico in the US market,25 what have been the main recent developments? The first part of this section provides an overview of the evolution of Mexico’s and China’s positions in the US market. This is taken further in the second part which analyzes the Export-Similarity In-dex of China and Mexico’s exports to the US at an aggregate and disag-gregated level to understand, through this methodology, the extent to which the two countries compete in the US market. The third part presents a simple “shift-and-share” analysis of Mexico and China’s exports to the US market for several particular sectors. The last part analyzes trends in the unit values of Mexican exports to the US in an attempt to identify the impact of Chinese competition on prices as well as the share of Mexico in the US market.
25 See for example: Cárdenas (2006); Dussel Peters (2007b); Zaga (2007); Oropeza
(2006); Watkins (2007).
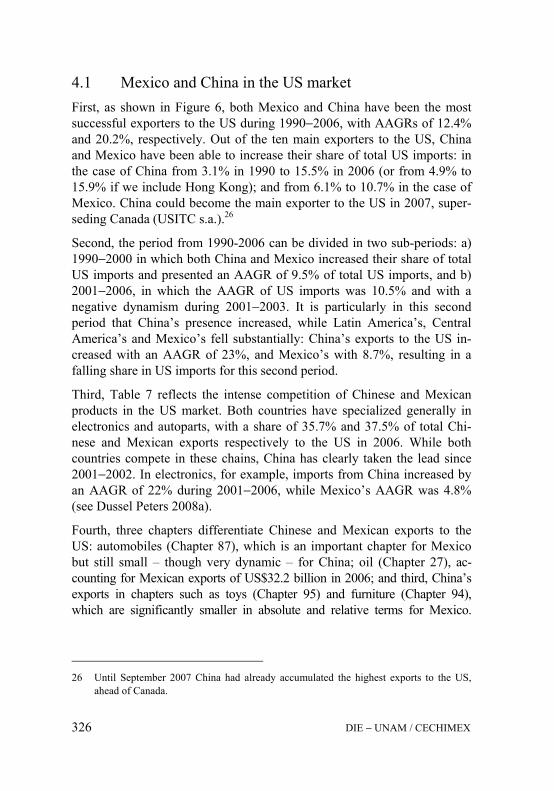
DIE − UNAM / CECHIMEX 326
4.1 Mexico and China in the US market First, as shown in Figure 6, both Mexico and China have been the most successful exporters to the US during 1990−2006, with AAGRs of 12.4% and 20.2%, respectively. Out of the ten main exporters to the US, China and Mexico have been able to increase their share of total US imports: in the case of China from 3.1% in 1990 to 15.5% in 2006 (or from 4.9% to 15.9% if we include Hong Kong); and from 6.1% to 10.7% in the case of Mexico. China could become the main exporter to the US in 2007, super-seding Canada (USITC s.a.).26
Second, the period from 1990-2006 can be divided in two sub-periods: a) 1990−2000 in which both China and Mexico increased their share of total US imports and presented an AAGR of 9.5% of total US imports, and b) 2001−2006, in which the AAGR of US imports was 10.5% and with a negative dynamism during 2001−2003. It is particularly in this second period that China’s presence increased, while Latin America’s, Central America’s and Mexico’s fell substantially: China’s exports to the US in-creased with an AAGR of 23%, and Mexico’s with 8.7%, resulting in a falling share in US imports for this second period.
Third, Table 7 reflects the intense competition of Chinese and Mexican products in the US market. Both countries have specialized generally in electronics and autoparts, with a share of 35.7% and 37.5% of total Chi-nese and Mexican exports respectively to the US in 2006. While both countries compete in these chains, China has clearly taken the lead since 2001−2002. In electronics, for example, imports from China increased by an AAGR of 22% during 2001−2006, while Mexico’s AAGR was 4.8% (see Dussel Peters 2008a).
Fourth, three chapters differentiate Chinese and Mexican exports to the US: automobiles (Chapter 87), which is an important chapter for Mexico but still small – though very dynamic – for China; oil (Chapter 27), ac-counting for Mexican exports of US$32.2 billion in 2006; and third, China’s exports in chapters such as toys (Chapter 95) and furniture (Chapter 94), which are significantly smaller in absolute and relative terms for Mexico.
26 Until September 2007 China had already accumulated the highest exports to the US,
ahead of Canada.
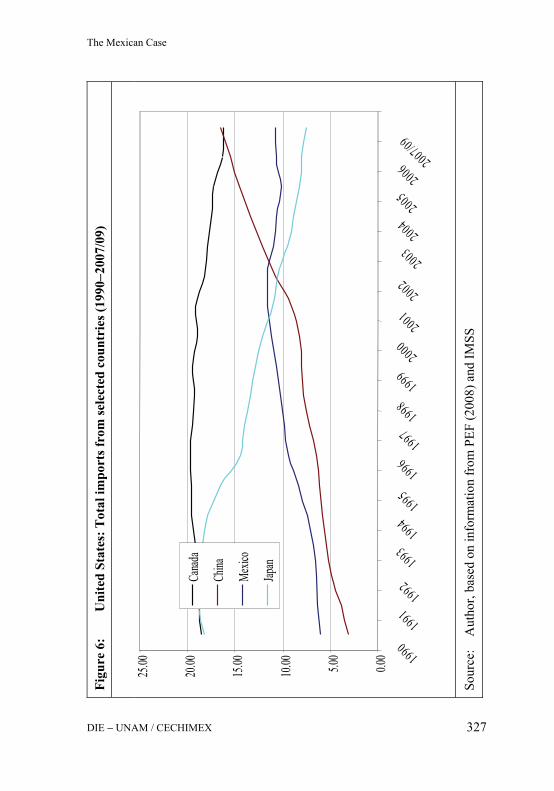
Figu
re 6
: U
nite
d St
ates
: Tot
al im
port
s fro
m se
lect
ed c
ount
ries
(199
0−20
07/0
9)
Sour
ce:
Aut
hor,
base
d on
info
rmat
ion
from
PEF
(200
8) a
nd IM
SS
0.00
5.00
10.00
15.00
20.00
25.00
199019911992
19931994199519961997
199819992000200120022003
200420052006 2007/09
Canad
a
China
Mexic
o
Japan
The Mexican Case
DIE − UNAM / CECHIMEX 327

Tab
le 7
: U
nite
d St
ates
: Im
port
s fro
m C
hina
and
Mex
ico
(199
0−20
06)
1990
19
95
2000
20
02
2004
20
05
US$
mill
ions
Tot
al im
port
s 49
2,97
8 74
3,50
5 1,
216,
887
1,16
3,54
8 1,
460,
160
1,66
2,38
0
5
Mai
n C
hapt
ers
275,
667
420,
163
698,
501
635,
346
813,
075
947,
392
R
est
217,
311
323,
342
518,
386
528,
202
647,
086
714,
988
84
Aut
opar
ts
66,5
30
122,
600
180,
908
161,
872
199,
054
221,
345
27
Oil
63,8
67
58,4
93
131,
020
116,
067
194,
368
271,
717
87
Aut
omob
iles
73,8
57
102,
329
163,
854
170,
516
191,
614
201,
178
85
Elec
troni
cs
58,1
38
114,
190
186,
099
152,
087
183,
725
206,
446
90
Opt
ical
equ
ipm
ent
& in
stru
men
ts
13,2
74
22,5
51
36,6
20
34,8
05
44,3
13
46,7
06
From
Chi
na
15,2
00
45,5
55
100,
063
125,
168
196,
160
242,
638
5
Mai
n C
hapt
ers
6,27
4 25
,534
61
,748
79
,209
12
6,75
6 15
4,19
6
R
est
8,92
6 20
,021
38
,315
45
,959
69
,403
88
,442
84
Aut
opar
ts
472
3,62
4 13
,406
20
,215
43
,783
52
,598
Enrique Dussel Peters
DIE − UNAM / CECHIMEX 328
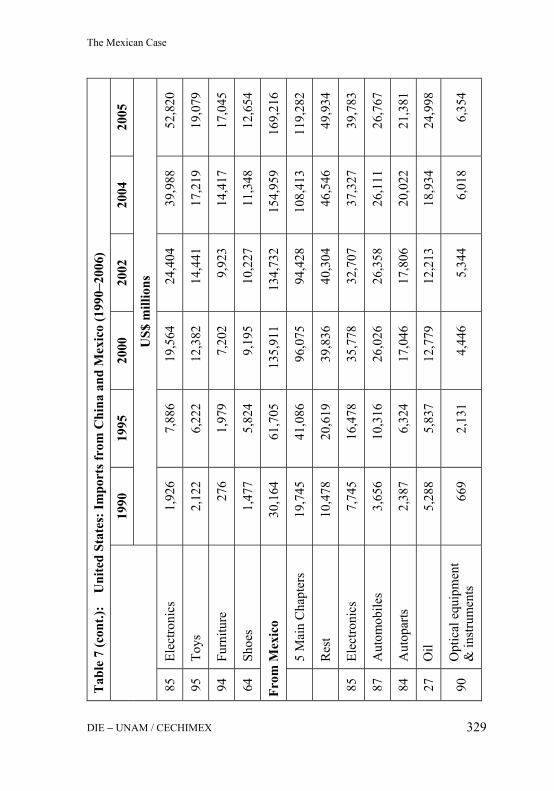
Tab
le 7
(con
t.):
Uni
ted
Stat
es: I
mpo
rts f
rom
Chi
na a
nd M
exic
o (1
990−
2006
)
1990
19
95
2000
20
02
2004
20
05
US$
mill
ions
85
Elec
troni
cs
1,92
6 7,
886
19,5
64
24,4
04
39,9
88
52,8
20
95
Toys
2,
122
6,22
2 12
,382
14
,441
17
,219
19
,079
94
Furn
iture
27
6 1,
979
7,20
2 9,
923
14,4
17
17,0
45
64
Shoe
s 1,
477
5,82
4 9,
195
10,2
27
11,3
48
12,6
54
From
Mex
ico
30,1
64
61,7
05
135,
911
134,
732
154,
959
169,
216
5
Mai
n C
hapt
ers
19,7
45
41,0
86
96,0
75
94,4
28
108,
413
119,
282
R
est
10,4
78
20,6
19
39,8
36
40,3
04
46,5
46
49,9
34
85
Elec
troni
cs
7,74
5 16
,478
35
,778
32
,707
37
,327
39
,783
87
Aut
omob
iles
3,65
6 10
,316
26
,026
26
,358
26
,111
26
,767
84
Aut
opar
ts
2,38
7 6,
324
17,0
46
17,8
06
20,0
22
21,3
81
27
Oil
5,28
8 5,
837
12,7
79
12,2
13
18,9
34
24,9
98
90
Opt
ical
equ
ipm
ent
& in
stru
men
ts
669
2,13
1 4,
446
5,34
4 6,
018
6,35
4
The Mexican Case
DIE − UNAM / CECHIMEX 329
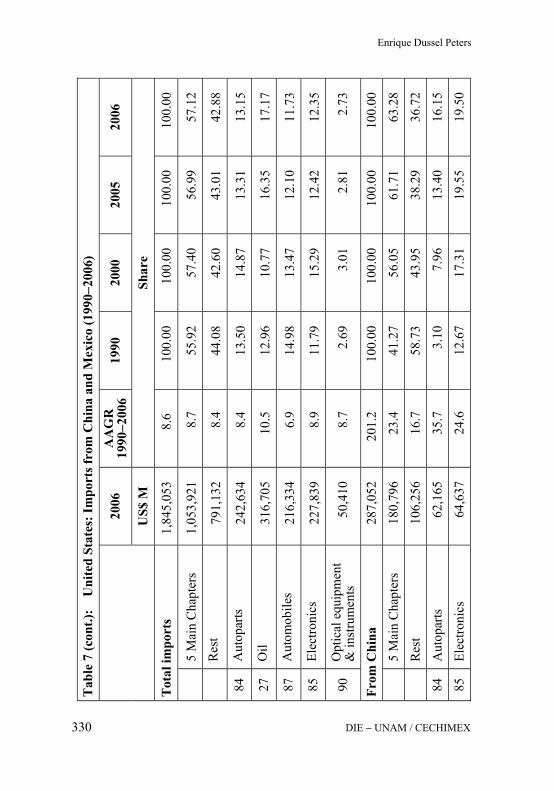
T
able
7 (c
ont.)
: U
nite
d St
ates
: Im
port
s fro
m C
hina
and
Mex
ico
(199
0−20
06)
2006
A
AG
R
1990
−200
6 19
90
2000
20
05
2006
US$
M
Shar
e
Tot
al im
port
s 1,
845,
053
8.6
100.
00
100.
00
100.
00
100.
00
5
Mai
n C
hapt
ers
1,05
3,92
1 8.
7 55
.92
57.4
0 56
.99
57.1
2
R
est
791,
132
8.4
44.0
8 42
.60
43.0
1 42
.88
84
Aut
opar
ts
242,
634
8.4
13.5
0 14
.87
13.3
1 13
.15
27
Oil
316,
705
10.5
12
.96
10.7
7 16
.35
17.1
7
87
Aut
omob
iles
216,
334
6.9
14.9
8 13
.47
12.1
0 11
.73
85
Elec
troni
cs
227,
839
8.9
11.7
9 15
.29
12.4
2 12
.35
90
Opt
ical
equ
ipm
ent
& in
stru
men
ts
50,4
10
8.7
2.69
3.
01
2.81
2.
73
From
Chi
na
287,
052
201.
2 10
0.00
10
0.00
10
0.00
10
0.00
5
Mai
n C
hapt
ers
180,
796
23.4
41
.27
56.0
5 61
.71
63.2
8
R
est
106,
256
16.7
58
.73
43.9
5 38
.29
36.7
2
84
Aut
opar
ts
62,1
65
35.7
3.
10
7.96
13
.40
16.1
5
85
Elec
troni
cs
64,6
37
24.6
12
.67
17.3
1 19
.55
19.5
0
Enrique Dussel Peters
DIE − UNAM / CECHIMEX 330

Tab
le 7
(con
t.):
Uni
ted
Stat
es: I
mpo
rts f
rom
Chi
na a
nd M
exic
o (1
990−
2006
)
2006
A
AG
R
1990
−200
6 19
90
2000
20
05
2006
US$
M
Shar
e
95
Toys
20
,848
15
.3
13.9
6 13
.66
12.3
7 11
.54
94
Furn
iture
19
,351
30
.4
1.82
4.
34
7.20
7.
93
64
Shoe
s 13
,795
15
.0
9.72
12
.78
9.19
8.
17
From
Mex
ico
197,
056
12.4
10
0.00
10
0.00
10
0.00
10
0.00
5
Mai
n C
hapt
ers
142,
953
13.2
65
.46
66.5
9 70
.69
70.0
9
R
est
54,1
02
10.8
34
.54
33.4
1 29
.31
29.9
1
85
Elec
troni
cs
47,3
35
12.0
25
.68
26.7
1 26
.32
24.2
8
87
Aut
omob
iles
33,2
32
14.8
12
.12
16.7
2 19
.15
19.5
6
84
Aut
opar
ts
23,4
42
15.3
7.
91
10.2
5 12
.54
13.2
2
27
Oil
32,1
61
11.9
17
.53
9.46
9.
40
9.06
90
Opt
ical
equ
ipm
ent
& in
stru
men
ts
6,78
3 15
.6
2.22
3.
45
3.27
3.
97
Sour
ce:
A
utho
r, ba
sed
on in
form
atio
n fr
om U
SITC
(s. a
.)
The Mexican Case
DIE − UNAM / CECHIMEX 331
Enrique Dussel Peters
DIE − UNAM / CECHIMEX 332
The issue of the costs of transportation from Mexico and China to the US market is also of great importance and has received little attention so far. In general, it is believed that geographical proximity remains a significant comparative advantage in comparison with China. Recent analysis (Dussel Peters 2008b), however, suggests that while transport costs are much lower for Mexico than for China – 6.26% and 1.14% of the value of im-ported goods from China and Mexico respectively, in 2006 – Mexico is using the most expensive mode of transportation, i.e. 83% of Mexican exports enter the US through buses and trucks. In terms of the cost of transport in relation to the distance covered this mode of transport is the most expensive. Thus, and this was shown concretely in several case stud-ies, while transportation is expensive from Mexico, its main attraction is the possibility of supplying the US market quickly, almost in “real time” under the heading of quick replenishment. This still poses a barrier for exports from Asia and China.
4.2 Export-Similarity Index (ESI) of Chinese and Mexican exports to the US (1990−2006)
The Export-Similarity Index (ESI) is a rather simple methodology used to compare the trade structure of two countries and establish the similarities in the shares of different products in the total exports of a country. The ESI for two countries i and j is defined as:
ESIij= sum [min(Xci,Xcj) * 100], where
Xci = share of exports of good c in total exports of country i.
The coefficient varies between 1, when the composition of exports in both countries is absolutely similar, and 0, when there is no similarity at all. The ESI can be calculated for different levels of disaggregation and the results will also depend on the level of disaggregation, as with calculations on intraindustry trade (Finger / Kreinin 1979). 27 The main results of the ESI are presented in Table 8, highlighting that:
27 As previously discussed, the ESI accounts for the similarity between both export struc-
tures to the United States in specific sectors. The ESI could also be discussed in more detail – at the 10-digit HTS level – and would probably lead to more specific results in the future. Chapter 27, oil, for example, refers to hundreds of specific oil-related prod-ucts with different levels of value-added, technology and degree of transformation.

The Mexican Case
DIE − UNAM / CECHIMEX 333
• Rather surprisingly the ESI between Mexico and China and Brazil and China in the US market is not that different of either 2 digits or 10 digits. This runs against several of the formerly discussed regional analyses, as Mexico is usually seen as a loser and Brazil a winner in their relationships with China. In both cases – Brazil and Mexico – the ESI with China increased significantly between 1990 and 2006.
• The ESI between China and Mexico in the computers, peripherals and parts sector is very high and rather homogeneous for 1990−2006, reflecting a high degree of similarity between both countries regarding their exports in the US market.
• At the chapters or 2-digit HTS level it is interesting to highlight that the coefficient has increased between Mexico and China for all 5 main chapters exported by Mexico, and in particular in elec-tronics, autoparts and optical equipment and instruments, while the index is rather high – but remains constant – for the period. From this perspective, the ESI reinforces the previously discussed con-clusion that Mexico and China compete in the US market – so far – in electronics, optical equipment and instruments and autoparts, while competition in automobiles is so far low.
Finally, Figure 7 calculates the ESI for China and Mexico for a number of important Mexican chapters, i.e. at a 2-digit HTS level, for specific periods and attempting to go beyond annual changes. With the excep-tion of oil, in all the rest of the considered chapters the ESI increases significantly from 1990−2000 to 2001−2006 and at relatively high levels.
Thus, the ESI in some cases can lead to misleading results, for example in the case of chapter 27 in which China and Mexico apparently account for a rather high ESI, while their exports and export-specialization are very different.

Tab
le 8
: U
nite
d St
ates
: Exp
ort S
imila
rity
Inde
x (E
SI)
for
diff
eren
t cou
ntri
es a
nd le
vels
of d
isag
greg
atio
n
19
90
1991
19
92
1993
19
94
1995
19
96
1997
19
98
Mex
ico-
Chi
na, t
otal
com
mod
ities
2 di
gits
of t
he H
TS
38.7
9 40
.46
40.7
4 41
.13
46.0
0 50
.57
51.8
1 53
.34
56.2
4 10
dig
its o
f the
HTS
15
.96
14.2
7 13
.74
12.5
3 12
.65
13.3
3 14
.59
15.7
0 16
.27
Bra
zil-C
hina
, tot
al c
omm
oditi
es
2 di
gits
of t
he H
TS
34.4
8 38
.75
38.4
7 40
.07
39.8
0 40
.67
40.7
3 42
.81
41.5
4
10 d
igits
of t
he H
TS
8.25
9.
53
11.2
4 10
.74
10.6
9 10
.75
9.84
9.
47
9.83
Mex
ico-
Chi
na in
com
pute
rs, p
erip
hera
ls a
nd p
arts
Tota
l (10
9 co
mm
oditi
es)
20.6
4 60
.55
50.7
5 34
.35
69.3
3 79
.74
31.6
4 34
.49
42.6
9
25 m
ain
Mex
ican
com
mod
ities
(a
ccor
ding
to sh
are o
f 200
6)
0.00
10
0.00
0.
00
100.
00
73.1
6 82
.52
15.5
9 18
.68
23.8
7
25 m
ain
Mex
ican
com
mod
i-tie
s (ac
cord
ing
to sh
are
of
1990
−200
6)
0.00
10
0.00
0.
00
100.
00
71.1
1 81
.83
37.1
2 39
.65
49.5
5
25 m
ain
Chin
ese c
omm
oditi
es
(acc
ordi
ng to
shar
e of 2
006)
0.
00
0.00
0.
00
0.00
71
.11
83.9
9 32
.02
34.3
4 43
.29
25 m
ain
Chi
nese
com
mod
i-tie
s (ac
cord
ing
to sh
are
of
1990
−200
6)
0.00
0.
00
0.00
0.
00
73.1
6 84
.72
31.1
9 34
.14
43.9
7
Enrique Dussel Peters
DIE − UNAM / CECHIMEX 334
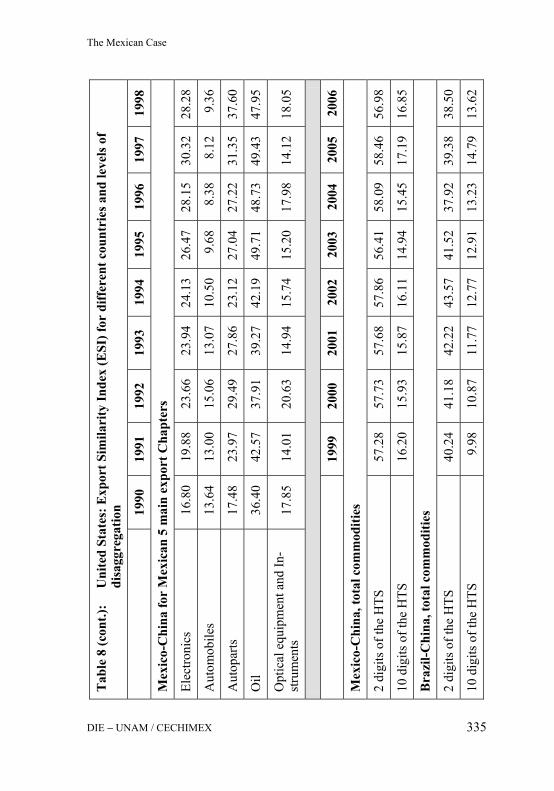
Tab
le 8
(con
t.):
U
nite
d St
ates
: Exp
ort S
imila
rity
Inde
x (E
SI) f
or d
iffer
ent c
ount
ries
and
leve
ls o
f di
sagg
rega
tion
19
90
1991
19
92
1993
19
94
1995
19
96
1997
19
98
Mex
ico-
Chi
na fo
r M
exic
an 5
mai
n ex
port
Cha
pter
s
Elec
troni
cs
16.8
0 19
.88
23.6
6 23
.94
24.1
3 26
.47
28.1
5 30
.32
28.2
8
Aut
omob
iles
13.6
4 13
.00
15.0
6 13
.07
10.5
0 9.
68
8.38
8.
12
9.36
Aut
opar
ts
17.4
8 23
.97
29.4
9 27
.86
23.1
2 27
.04
27.2
2 31
.35
37.6
0
Oil
36.4
0 42
.57
37.9
1 39
.27
42.1
9 49
.71
48.7
3 49
.43
47.9
5
Opt
ical
equ
ipm
ent a
nd In
-st
rum
ents
17
.85
14.0
1 20
.63
14.9
4 15
.74
15.2
0 17
.98
14.1
2 18
.05
1999
20
00
2001
20
02
2003
20
04
2005
20
06
Mex
ico-
Chi
na, t
otal
com
mod
ities
2 di
gits
of t
he H
TS
57.2
8 57
.73
57.6
8 57
.86
56.4
1 58
.09
58.4
6 56
.98
10 d
igits
of t
he H
TS
16.2
0 15
.93
15.8
7 16
.11
14.9
4 15
.45
17.1
9 16
.85
Bra
zil-C
hina
, tot
al c
omm
oditi
es
2 di
gits
of t
he H
TS
40.2
4 41
.18
42.2
2 43
.57
41.5
2 37
.92
39.3
8 38
.50
10 d
igits
of t
he H
TS
9.98
10
.87
11.7
7 12
.77
12.9
1 13
.23
14.7
9 13
.62
The Mexican Case
DIE − UNAM / CECHIMEX 335
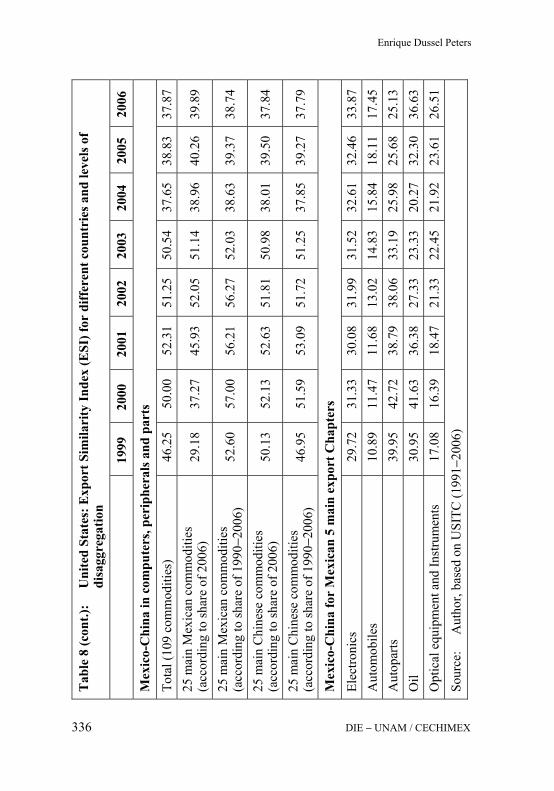
Tab
le 8
(con
t.):
U
nite
d St
ates
: Exp
ort S
imila
rity
Inde
x (E
SI) f
or d
iffer
ent c
ount
ries
and
leve
ls o
f di
sagg
rega
tion
19
99
2000
20
01
2002
20
03
2004
20
05
2006
Mex
ico-
Chi
na in
com
pute
rs, p
erip
hera
ls a
nd p
arts
Tota
l (10
9 co
mm
oditi
es)
46.2
5 50
.00
52.3
1 51
.25
50.5
4 37
.65
38.8
3 37
.87
25 m
ain
Mex
ican
com
mod
ities
(a
ccor
ding
to sh
are
of 2
006)
29
.18
37.2
7 45
.93
52.0
5 51
.14
38.9
6 40
.26
39.8
9
25 m
ain
Mex
ican
com
mod
ities
(a
ccor
ding
to sh
are
of 1
990−
2006
) 52
.60
57.0
0 56
.21
56.2
7 52
.03
38.6
3 39
.37
38.7
4
25 m
ain
Chi
nese
com
mod
ities
(a
ccor
ding
to sh
are
of 2
006)
50
.13
52.1
3 52
.63
51.8
1 50
.98
38.0
1 39
.50
37.8
4
25 m
ain
Chi
nese
com
mod
ities
(a
ccor
ding
to sh
are
of 1
990−
2006
) 46
.95
51.5
9 53
.09
51.7
2 51
.25
37.8
5 39
.27
37.7
9
Mex
ico-
Chi
na fo
r M
exic
an 5
mai
n ex
port
Cha
pter
s
Elec
troni
cs
29.7
2 31
.33
30.0
8 31
.99
31.5
2 32
.61
32.4
6 33
.87
Aut
omob
iles
10.8
9 11
.47
11.6
8 13
.02
14.8
3 15
.84
18.1
1 17
.45
Aut
opar
ts
39.9
5 42
.72
38.7
9 38
.06
33.1
9 25
.98
25.6
8 25
.13
Oil
30.9
5 41
.63
36.3
8 27
.33
23.3
3 20
.27
32.3
0 36
.63
Opt
ical
equ
ipm
ent a
nd In
stru
men
ts
17.0
8 16
.39
18.4
7 21
.33
22.4
5 21
.92
23.6
1 26
.51
Sour
ce:
A
utho
r, ba
sed
on U
SITC
(199
1−20
06)
Enrique Dussel Peters
DIE − UNAM / CECHIMEX 336
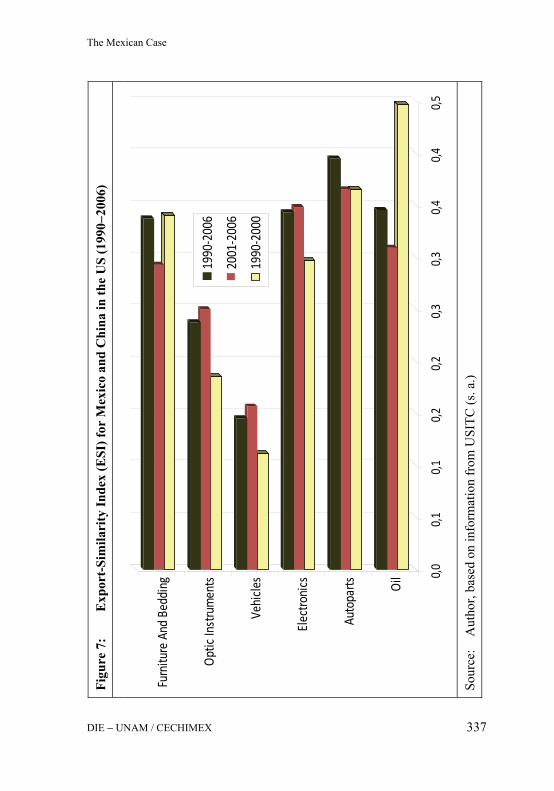
Fi
gure
7:
Exp
ort-
Sim
ilari
ty In
dex
(ESI
) for
Mex
ico
and
Chi
na in
the
US
(199
0−20
06)
Sour
ce:
Aut
hor,
base
d on
info
rmat
ion
from
USI
TC (s
. a.)
0,0
0,1
0,1
0,2
0,2
0,3
0,3
0,4
0,4
0,5
Oil
Auto
parts
Elec
troni
cs
Vehi
cles
Opt
ic In
stru
men
ts
Furn
iture
And
Bed
ding
1990
-200
6
2001
-200
6
1990
-200
0
The Mexican Case
DIE − UNAM / CECHIMEX 337
Enrique Dussel Peters
DIE − UNAM / CECHIMEX 338
4.3 A shift-and-share analysis of Chinese and Mexican exports to the US (1990−2006)
The shift-and-share analysis has been widely used in the last decades to examine differences in variables such as trade, employment and productiv-ity (Richardson 1978). In general it has proved to be a useful descriptive tool for isolating trends in respective performances. The goal in this sec-tion is to compare China and Mexico’s export performance – at an aggre-gate level, but also for electronics in general and specifically for PCs – according to its highest share in total US imports. As a result, this brief analysis will focus on the shift effect – i.e. based on changes in the share of total exports and said changes measured in absolute US dollar terms – among both countries.28 From this perspective, this analysis does not in-clude a causal and dynamic analysis and does not identify the reasons for these changes, but rather presents the extent of the changes that have taken place. The previous section highlighted the increasing presence of China in US imports during the period from 1990−2006. Table 9 calculates changes in China and Mexico’s exports to the US considering their respective maxi-mum share in total US imports, and keeping the rest of exports to the US constant. This exercise is performed for total imports, electronics and PCs. In all three sectors considered (total imports and those in electronics and in PCs) China increased its share in total US imports dramatically: the share of China’s exports to the US increased by a factor greater than 5 for the period, accounting for 15.6% in 2006, and the dynamism has been even more impressive in electronics and PCs, increasing its share of US imports in the latter from 0.02% to 47.9% between 1990 and 2006. In this context, Mexico’s integration with the US market has also been positive but, as dis-cussed earlier, this was primarily during 1990−2001/2002, and its share has fallen since then for total imports, electronics and PCs. In the case of the latter, for example, the share has fallen from 14.3% in 2001 to 7.9% in 2006. The results presented in Table 9 are also significant from several perspectives. On the one hand they show that Mexico’s export performance in the US was highly positive until 2001, but has fallen since then, i.e. in 2006 Mexican ex-ports represented 92% of exports achieved through its highest share of 2001.
28 For a more detailed analysis, see Dussel Peters (2007b).

Tab
le 9
:
Uni
ted
Stat
es: I
mpo
rts f
rom
Mex
ico
and
Chi
na b
ased
on
real
per
form
ance
vs.
calc
ulat
ions
ba
sed
on h
ighe
st a
chie
ved
shar
e (1
990−
2006
)a
19
90
1991
19
92
1993
19
94
1995
Tot
al im
port
s
Chi
na-to
tal (
mill
ion
US$
) 15
,120
.00
18,8
55.0
0 25
,514
.00
31,4
25.0
0 38
,592
.00
45,3
70.0
0
Mex
ico-
tota
l (m
illio
n U
S$)
29,5
06.0
0 30
,445
.00
33,9
35.0
0 38
,668
.00
48,6
05.0
0 61
,721
.00
Chi
na (s
hare
ove
r tot
al)
3.08
3.
90
4.86
5.
47
5.86
6.
13
Mex
ico
(sha
re o
ver t
otal
) 6.
01
6.29
6.
46
6.73
7.
39
8.34
Mex
ico-
tota
l (ba
sed
on a
m
axim
um sh
are
of 2
001)
(mil-
lion
US$
) 57
,043
.00
56,1
62.0
0 60
,967
.00
66,7
42.0
0 76
,380
.00
85,8
75.0
0
Chi
na (b
ased
on
a m
axim
um
shar
e of
200
6) (m
illio
n U
S$)
76,4
50.0
0 75
,270
.00
81,7
10.0
0 89
,449
.00
102,
367.
00
115,
091.
00
Tot
al im
port
s in
elec
tron
ics
Chi
na-to
tal i
mpo
rts in
ele
ctro
n-ic
s (m
illio
n U
S$)
489.
00
646.
00
964.
00
1,37
8.00
3,
089.
00
4,55
6.00
Mex
ico-
tota
l im
ports
in e
lec-
troni
cs (m
illio
n U
S$)
14,7
21.0
0 1,
632.
00
2,10
1.00
2,
464.
00
5,66
2.00
6,
462.
00
The Mexican Case
DIE − UNAM / CECHIMEX 339
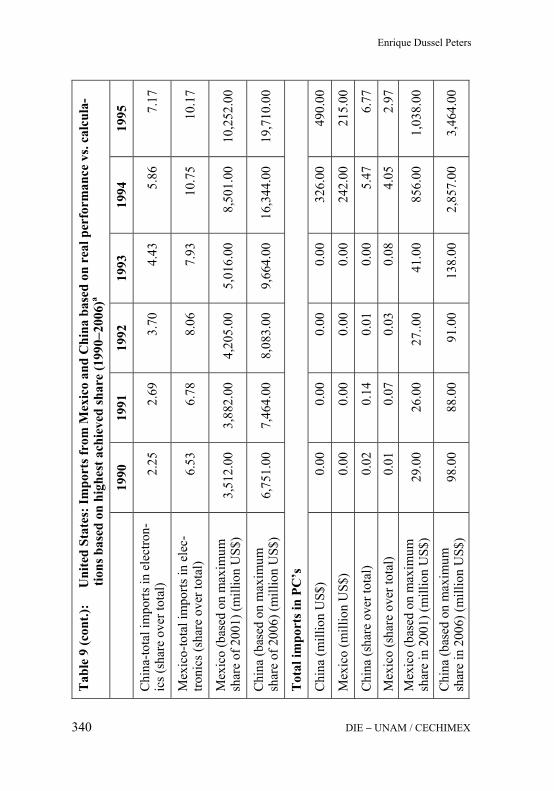
Tab
le 9
(con
t.):
U
nite
d St
ates
: Im
port
s fro
m M
exic
o an
d C
hina
bas
ed o
n re
al p
erfo
rman
ce v
s. ca
lcul
a-tio
ns b
ased
on
high
est a
chie
ved
shar
e (1
990−
2006
)a
19
90
1991
19
92
1993
19
94
1995
Chi
na-to
tal i
mpo
rts in
ele
ctro
n-ic
s (sh
are
over
tota
l) 2.
25
2.69
3.
70
4.43
5.
86
7.17
Mex
ico-
tota
l im
ports
in e
lec-
troni
cs (s
hare
ove
r tot
al)
6.53
6.
78
8.06
7.
93
10.7
5 10
.17
Mex
ico
(bas
ed o
n m
axim
um
shar
e of
200
1) (m
illio
n U
S$)
3,51
2.00
3,
882.
00
4,20
5.00
5,
016.
00
8,50
1.00
10
,252
.00
Chi
na (b
ased
on
max
imum
sh
are
of 2
006)
(mill
ion
US$
) 6,
751.
00
7,46
4.00
8,
083.
00
9,66
4.00
16
,344
.00
19,7
10.0
0
Tot
al im
port
s in
PC’s
Chi
na (m
illio
n U
S$)
0.00
0.
00
0.00
0.
00
326.
00
490.
00
Mex
ico
(mill
ion
US$
) 0.
00
0.00
0.
00
0.00
24
2.00
21
5.00
Chi
na (s
hare
ove
r tot
al)
0.02
0.
14
0.01
0.
00
5.47
6.
77
Mex
ico
(sha
re o
ver t
otal
) 0.
01
0.07
0.
03
0.08
4.
05
2.97
M
exic
o (b
ased
on
max
imum
sh
are
in 2
001)
(mill
ion
US$
) 29
.00
26.0
0 27
..00
41.0
0 85
6.00
1,
038.
00
Chi
na (b
ased
on
max
imum
sh
are
in 2
006)
(mill
ion
US$
) 98
.00
88.0
0 91
.00
138.
00
2,85
7.00
3,
464.
00
Enrique Dussel Peters
DIE − UNAM / CECHIMEX 340

T
able
9 (c
ont.)
:
Uni
ted
Stat
es: I
mpo
rts f
rom
Mex
ico
and
Chi
na b
ased
on
real
per
form
ance
vs.
calc
ula-
tions
bas
ed o
n hi
ghes
t ach
ieve
d sh
are
(199
0−20
06)a
19
96
1997
19
98
1999
20
00
2001
Tot
al im
port
s
Chi
na-to
tal (
mill
ion
US$
) 51
,209
.00
61,9
96.0
0 70
,815
.00
81,5
22.0
0 99
,581
.00
102,
069.
00
Mex
ico-
tota
l (m
illio
n U
S$)
74,1
79.0
0 85
,005
.00
93,0
17.0
0 10
9,01
8.00
13
4,73
4.00
13
0,50
9.00
Chi
na (s
hare
ove
r tot
al)
6.48
7.
19
7.80
8.
01
8.26
9.
01
Mex
ico
(sha
re o
ver t
otal
) 9.
38
9.86
10
.25
10.7
1 11
.18
11.5
2
Mex
ico-
tota
l (ba
sed
on a
m
axim
um sh
are
of 2
001)
(m
illio
n U
S$)
91,7
74.0
0 10
0,12
8.00
10
5,37
8.00
11
8,12
4.00
13
9,94
0.00
13
1,49
9.00
Chin
a (ba
sed
on a
max
imum
sh
are o
f 200
6) (m
illio
n U
S$)
122,
997.
00
134,
194.
00
141,
230.
00
158,
313.
00
187,
551.
00
176,
238.
00
Tot
al im
port
s in
elec
tron
ics
Chi
na-to
tal i
mpo
rts in
el
ectro
nics
(mill
ion
US$
) 9,
421.
00
12,9
66.0
0 16
,446
.00
19,7
11.0
0 25
,961
.00
27,2
26.0
0
Mex
ico-
tota
l im
ports
in
elec
troni
cs (m
illio
n U
S$)
12,9
58.0
0 17
,391
.00
23,1
52.0
0 27
,258
.00
35,0
92.0
0 36
,962
.00
The Mexican Case
DIE − UNAM / CECHIMEX 341

Tab
le 9
(con
t.):
U
nite
d St
ates
: Im
port
s fro
m M
exic
o an
d C
hina
bas
ed o
n re
al p
erfo
rman
ce v
s. ca
lcul
a-tio
ns b
ased
on
high
est a
chie
ved
shar
e (1
990−
2006
)a
19
96
1997
19
98
1999
20
00
2001
Chin
a-to
tal i
mpo
rts in
elec
-tro
nics
(sha
re o
ver t
otal
) 6.
51
7.70
9.
07
9.66
10
.34
11.8
9
Mex
ico-
tota
l im
ports
in
elec
troni
cs (s
hare
ove
r tot
al)
8.96
10
.33
12.7
7 13
.36
13.9
7 16
.14
Mex
ico
(bas
ed o
n m
axim
um
shar
e of 2
001)
(mill
ion
US$
) 23
,340
.00
27,1
60.0
0 29
,269
.00
32,9
36.0
0 40
,535
.00
36,9
69.0
0
Chin
a (ba
sed
on m
axim
um
shar
e of 2
006)
(mill
ion
US$
) 44
,872
.00
52,2
16.0
0 56
,272
.00
63,3
21.0
0 77
,931
.00
71,0
75.0
0
Tot
al im
port
s in
PC’s
Chi
na (m
illio
n U
S$)
2,30
9.00
3,
355.
00
4,40
4.00
5,
971.
00
8,25
6.00
8,
173.
00
Mex
ico
(mill
ion
US$
) 2,
117.
00
3,45
5.00
4,
012.
00
5,49
3.00
6,
869.
00
8,46
6.00
Chi
na (s
hare
ove
r tot
al)
4.84
6.
02
8.01
9.
74
12.0
5 13
.84
Mex
ico
(sha
re o
ver t
otal
) 4.
44
6.20
7.
29
8.96
10
.02
14.3
4
Mex
ico
(bas
ed o
n m
axim
um
shar
e in
2001
) (m
illio
n U
S$)
6,84
4.00
7,
996.
00
7,88
9.00
8,
787.
00
9,82
8.00
8,
468.
00
Chin
a (ba
sed
on m
axim
um
shar
e in
2006
) (m
illio
n U
S$)
22,8
48.0
0 26
,692
.00
26,3
37.0
0 29
,334
.00
32,8
09.0
0 28
,267
.00
Enrique Dussel Peters
DIE − UNAM / CECHIMEX 342
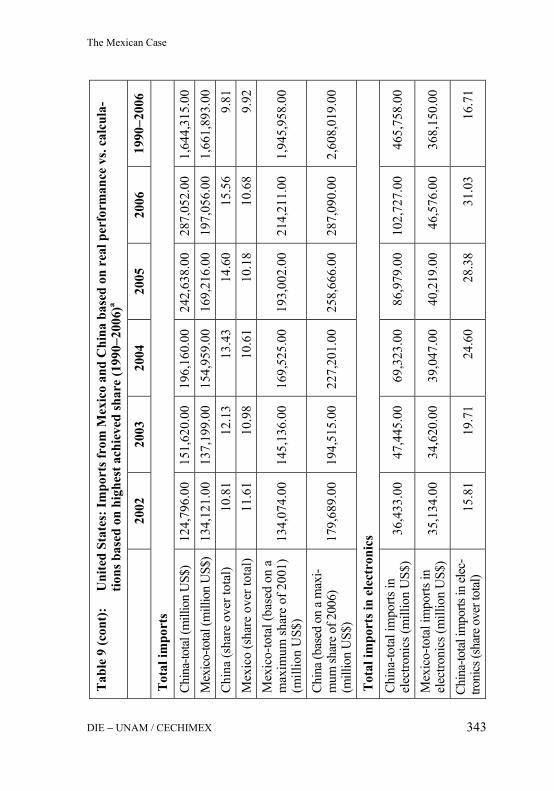
T
able
9 (c
ont)
:
Uni
ted
Stat
es: I
mpo
rts f
rom
Mex
ico
and
Chi
na b
ased
on
real
per
form
ance
vs.
calc
ula-
tions
bas
ed o
n hi
ghes
t ach
ieve
d sh
are
(199
0−20
06)a
20
02
2003
20
04
2005
20
06
1990
−200
6
Tot
al im
port
s
Chin
a-to
tal (
mill
ion
US$
) 12
4,79
6.00
15
1,62
0.00
19
6,16
0.00
24
2,63
8.00
28
7,05
2.00
1,
644,
315.
00
Mex
ico-
tota
l (m
illio
n U
S$)
134,
121.
00
137,
199.
00
154,
959.
00
169,
216.
00
197,
056.
00
1,66
1,89
3.00
C
hina
(sha
re o
ver t
otal
) 10
.81
12.1
3 13
.43
14.6
0 15
.56
9.81
M
exic
o (s
hare
ove
r tot
al)
11.6
1 10
.98
10.6
1 10
.18
10.6
8 9.
92
Mex
ico-
tota
l (ba
sed
on a
m
axim
um sh
are
of 2
001)
(m
illio
n U
S$)
134,
074.
00
145,
136.
00
169,
525.
00
193,
002.
00
214,
211.
00
1,94
5,95
8.00
Chin
a (ba
sed
on a
max
i-m
um sh
are o
f 200
6)
(mill
ion
US$
) 17
9,68
9.00
19
4,51
5.00
22
7,20
1.00
25
8,66
6.00
28
7,09
0.00
2,
608,
019.
00
Tot
al im
port
s in
elec
tron
ics
Chin
a-to
tal i
mpo
rts in
el
ectro
nics
(mill
ion
US$
) 36
,433
.00
47,4
45.0
0 69
,323
.00
86,9
79.0
0 10
2,72
7.00
46
5,75
8.00
Mex
ico-
tota
l im
ports
in
elec
troni
cs (m
illio
n U
S$)
35,1
34.0
0 34
,620
.00
39,0
47.0
0 40
,219
.00
46,5
76.0
0 36
8,15
0.00
Chin
a-to
tal i
mpo
rts in
elec
-tro
nics
(sha
re o
ver t
otal
) 15
.81
19.7
1 24
.60
28.3
8 31
.03
16.7
1
The Mexican Case
DIE − UNAM / CECHIMEX 343

Tab
le 9
(con
t):
U
nite
d St
ates
: Im
port
s fro
m M
exic
o an
d C
hina
bas
ed o
n re
al p
erfo
rman
ce v
s. ca
lcul
a-tio
ns b
ased
on
high
est a
chie
ved
shar
e (1
990−
2006
)a
20
02
2003
20
04
2005
20
06
1990
−200
6
Mex
ico-
tota
l im
ports
in
elec
troni
cs (s
hare
ove
r tot
al)
15.2
5 14
.38
13.8
6 13
.12
14.0
7 13
.20
Mex
ico (b
ased
on
max
imum
sh
are o
f 200
1) (m
illio
n U
S$)
37,1
91.0
0 38
,851
.00
45,4
80.0
0 49
,462
.00
53,4
37.0
0 44
9,99
8.00
Chin
a (ba
sed
on m
axim
um
shar
e of 2
006)
(mill
ion
US$
) 71
,502
.00
74,6
94.0
0 87
,438
95
,093
.00
102,
736.
00
865,
146.
00
Tot
al im
port
s in
PC’s
Chi
na (m
illio
n U
S$)
11,9
47.0
0 18
,653
.00
29,4
86.0
0 35
,465
.00
40,0
20.0
0 16
8,85
6.00
Mex
ico
(mill
ion
US$
) 7,
906.
00
6,95
6.00
7,
375.
00
6,73
2.00
6,
576.
00
66,4
14.0
0
Chi
na (s
hare
ove
r tot
al)
19.1
7 29
.14
39.9
1 46
.36
47.8
7 23
.34
Mex
ico
(sha
re o
ver t
otal
) 12
.68
10.8
7 9.
98
8.61
7.
87
9.18
Mex
ico (b
ased
on
max
imum
sh
are i
n 20
01) (
mill
ion
US$
) 8.
937
9,18
1.00
10
,594
.00
11,2
12.0
0 11
,989
.00
103,
744.
00
Chin
a (ba
sed
on m
axim
um
shar
e in
2006
) (m
illio
n U
S$)
29,8
34.0
0 30
,647
.00
35,3
67.0
0 37
,427
.00
40,0
22.0
0 34
6,31
8.00
a T
he c
alcu
latio
ns fo
r Mex
ico
and
Chi
na c
onsi
der t
he h
ighe
st sh
are
over
tota
l US-
impo
rts a
chie
ved
durin
g 19
90−2
006
Sour
ce:
A
utho
r, ba
sed
on in
form
atio
n fr
om U
SITC
Enrique Dussel Peters
DIE − UNAM / CECHIMEX 344

The Mexican Case
DIE − UNAM / CECHIMEX 345
In contrast, China accounted for its highest share of total US imports in 2006 as a result of increasing exports to the US since 1990. On the other hand, Table 8 also shows that for the case of specific chains or segments there has been a substantial fall in Mexico’s share of total US imports: in electronics, for example, which accounted for 25% of total Mexican ex-ports to the US, the level in 2006 was 18% below its potential share of 2001. In the case of PCs, the fall in Mexico’s share represented more than 45% of its actual exports in 2006. In all three cases China achieved its highest share in 2006.
From this perspective, while it is true that Mexico has lost its share in total US imports, as previously discussed, it is also true that it has recovered slightly since 2004 and that in 2006 aggregate exports are not significantly below their highest share of 2001. On the other hand, specific chains and segments such as PCs have suffered substantially as a result of a dramatic share loss.
Table 10 shows the results of the shift-and-share analysis in greater detail, highlighting specifically that29:
• The global demand effect (GDE), which reflects the calculated results if growth were similar in all sectors of the considered countries, shows that Mexico and China did benefit substantially during 1990−2000 and that actual exports to the US increased far more than could be accounted for by the GDE. The situation, however, changes for the 2001−2006 period, as previously mentioned. The GDE esti-mates were calculated in two forms: a) with the growth rate for 1990-2006 and, b) with the growth rate for 2001−2006. The results are con-trasting: in the case of Mexico, for example, in the first case estimated exports to the US were only 56.23% of actual exports, while estimated exports – calculated using the growth rate for 2001-2006 – were much higher than actual exports (107.9%),. This shows that the GDE ac-counts for significant benefits in Mexico’s exports to the US in the first period (1990−2000), but a strong fall in the second.30
29 For a detailed explanation of the shift-and-share analysis, also widely used by ECLAC
in its MAGIC-software, see: Buitelaar (1997) and Dussel Peters (2001). 30 As already discussed, Mexico’s difficulty in integrating to the US is a result of a falling
demand for imports in the US as well as Mexico’s problems increasing exports to the US.
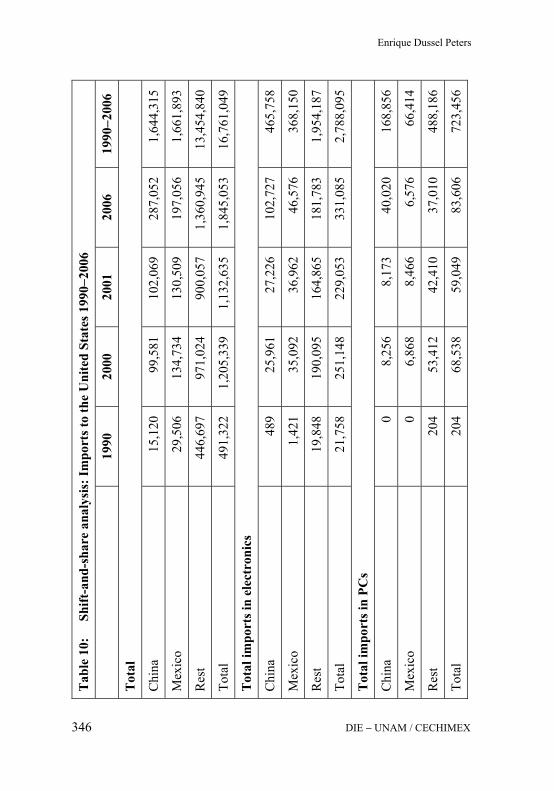
Tab
le 1
0:
Shi
ft-a
nd-s
hare
ana
lysi
s: Im
port
s to
the
Uni
ted
Stat
es 1
990−
2006
19
90
2000
20
01
2006
19
90−2
006
Tot
al
Chi
na
15,1
20
99,5
81
102,
069
287,
052
1,64
4,31
5
Mex
ico
29,5
06
134,
734
130,
509
197,
056
1,66
1,89
3
Res
t 44
6,69
7 97
1,02
4 90
0,05
7 1,
360,
945
13,4
54,8
40
Tota
l 49
1,32
2 1,
205,
339
1,13
2,63
5 1,
845,
053
16,7
61,0
49
Tot
al im
port
s in
elec
tron
ics
Chi
na
489
25,9
61
27,2
26
102,
727
465,
758
Mex
ico
1,42
1 35
,092
36
,962
46
,576
36
8,15
0
Res
t 19
,848
19
0,09
5 16
4,86
5 18
1,78
3 1,
954,
187
Tota
l 21
,758
25
1,14
8 22
9,05
3 33
1,08
5 2,
788,
095
Tot
al im
port
s in
PCs
Chi
na
0 8,
256
8,17
3 40
,020
16
8,85
6
Mex
ico
0 6,
868
8,46
6 6,
576
66,4
14
Res
t 20
4 53
,412
42
,410
37
,010
48
8,18
6
Tota
l 20
4 68
,538
59
,049
83
,606
72
3,45
6
Enrique Dussel Peters
DIE − UNAM / CECHIMEX 346

Tab
le 1
0 (c
ont.)
:
Shift
-and
-sha
re a
naly
sis:
Impo
rts t
o th
e U
nite
d St
ates
199
0−20
06
19
90
2000
20
01
2006
19
90−2
006
Tot
al im
port
s in
non-
elec
tron
ics
Chi
na
14,6
31
73,6
20
74,8
43
184,
326
1,17
8,55
7 M
exic
o 28
,085
99
,643
93
,547
15
0,48
0 1,
293,
743
Res
t 42
6,84
9 78
0,92
9 73
5,19
2 1,
179,
162
11,5
00,6
54
Tota
l 46
9,56
5 95
4,19
1 90
3,58
2 1,
513,
968
13,9
72,9
54
Tot
al im
port
s in
non-
PCs
Chi
na
15,1
20
91,3
24
93,8
97
247,
033
1,47
5,45
9 M
exic
o 29
,506
12
7,86
5 12
2,04
3 19
0,48
0 1,
595,
480
Res
t 44
6,49
3 91
7,61
2 85
7,64
7 1,
323,
935
12,9
66,6
54
Tota
l 49
1,11
9 1,
136,
801
1,07
3,58
7 1,
761,
447
16,0
37,5
93
Glo
bal d
eman
d ef
fect
E
stim
ated
D
iffer
ence
with
real
impo
rts (
real
= 1
00)
Tot
al im
port
s 20
00 a
2006
a 20
06b
2000
a 20
06a
2006
b
Chi
na
37,0
93
56,7
79
166,
270
37.2
5 19
.78
57.9
2 M
exic
o 72
,386
11
0,80
3 21
2,59
8 53
.72
56.2
3 10
7.89
The Mexican Case
DIE − UNAM / CECHIMEX 347

Tab
le 1
0 (c
ont.)
:
Shift
-and
-sha
re a
naly
sis:
Impo
rts t
o th
e U
nite
d St
ates
199
0−20
06
E
stim
ated
D
iffer
ence
with
real
impo
rts (
real
= 1
00)
Tot
al im
port
s 20
00 a
2006
a 20
06b
2000
a 20
06a
2006
b R
est
1,09
5,86
1 1,
677,
471
1,46
6,18
5 11
2.86
12
3.26
10
7.73
To
tal
1,20
5,33
9 1,
845,
053
1,84
5,05
3 10
0.00
10
0.00
10
0.00
Stru
ctur
al d
eman
d ef
fect
Tot
al im
port
s in
Ele
ctro
nics
c T
otal
20
00a
2006
a 20
06b
C
hina
-1
,716
-2
,164
-1
,515
Mex
ico
1,08
5 1,
369
-2,4
32
R
est
631
795
3,94
7
Tota
l 0
0 0
Ele
ctro
nics
N
on-e
lect
roni
cs
20
00a
2006
a 20
06b
2000
a 20
06a
2006
b C
hina
4,
446
5,60
6 -4
,997
-6
,162
-7
,770
3,
482
Mex
ico
12,9
14
16,2
84
-6,7
84
-11,
829
-14,
916
4,35
2 R
est
180,
410
227,
487
-30,
260
-179
,779
-2
26,6
92
34,2
06
Tota
l 19
7,77
0 24
9,37
8 -4
2,04
1 -1
97,7
70
-249
,378
42
,041
Enrique Dussel Peters
DIE − UNAM / CECHIMEX 348

Tab
le 1
0 (c
ont.)
:
Shift
-and
-sha
re a
naly
sis:
Impo
rts t
o th
e U
nite
d St
ates
199
0−20
06
Stru
ctur
al d
eman
d ef
fect
(con
t.)
Tot
al im
port
s in
PCsc
Tot
al
20
00a
2006
a 20
06b
Chi
na
-2,0
82
-2,5
35
-641
Mex
ico
-4,0
79
-4,9
67
-374
Res
t 6,
161
7,50
2 1,
015
Tota
l 0
0 0
PC
s N
on-P
Cs
20
00a
2006
a 20
06b
2000
a 20
06a
2006
b
Chi
na
12
15
-1,7
42
-2,0
95
-2,5
50
1,10
1
Mex
ico
9 10
-1
,804
-4
,088
-4
,977
1,
431
Res
t 68
,017
82
,816
-9
,038
-6
1,85
6 -7
5,31
4 10
,053
Tota
l 68
,038
82
,841
-1
2,58
4 -6
8,03
8 -8
2,84
1 12
,584
a B
ased
on
the
tota
l im
ports
gro
wth
rate
of t
he U
S fo
r 199
0-20
06, b
ase
year
199
0.
b B
ased
on
the
tota
l im
ports
gro
wth
rate
of t
he U
S fo
r 200
1-20
06, b
ase
year
200
1.
c C
onsi
derin
g tw
o se
ctor
s, el
ectro
nics
and
non
-ele
ctro
nics
(for
the
rest
of t
he re
spec
tive
impo
rts).
Sour
ce:
Aut
hor,
base
d on
info
rmat
ion
from
USI
TC
The Mexican Case
DIE − UNAM / CECHIMEX 349

Enrique Dussel Peters
DIE − UNAM / CECHIMEX 350
On the other hand, the GDE shows that China’s exports to the US were, in both cases, well beyond the estimated exports and in 2006 accounted for 19.78% and 57.92%, respectively. Thus, while Mexico showed a performance below global demand for total US imports, China was far above this effect for the period 2001−2006.
• The structural demand effect (SDE) – which reflects the benefits of a country specializing in products, such as electronics and PCs in this case – accounts for massive benefits for Mexico and China for spe-cializing in electronics and PCs during 1990−2006, as well as for the exports from the rest of the world to the US. The situation changes, however, when estimating the SDE for 2006 and when considering the growth rates for 2001−2006; both China and Mexico present mas-sive losses according to this estimation.
4.4 Unit value of Mexican exports to the US and the net barter terms of trade
The literature on the statistical debate on the terms of trade (TT) tradition-ally involved the analysis of the net barter terms of trade (NBTT) between primary products and manufactured goods (Diakosavvas / Scandizzo 1991; Sarkar 2001; Ocampo / Parra 2003; Torres 2006). However, interest in this topic broadened in three ways: a) considering all goods and not only pri-mary-manufacturing, b) the direction of trade, i.e. the origin and destina-tion of the goods considered, and c) classifications of goods according to different degrees of innovation and technology (Sarkar / Singer 1991; Berge / Crowe 1997; Maizels 2000).
Given the trade structure of Mexico, what has happened to the NBTT, bearing in mind the potential effects of China’s penetration of the US market on Mexico (Kaplinsky 2006)? The section will include an analysis of China’s and Mexico’s trends in NBTT in the US market and presents the basis for future more detailed work.31
31 A previous detailed analysis with Chinese and Mexican customs data at the 6-digit level
proved not to be useful for this analysis, particularly as a result of difficulties in calcu-lating the unit value as a result of short time series and changes in the unit of imports (such as in Mexico before and after 2003).

The Mexican Case
DIE − UNAM / CECHIMEX 351
In the work of León and Soto (1995), which evaluated the NBTT of the majority of Latin American countries with ECLAC data, they found that for the period 1928−1993 there was no statistically significant tendency for Mexico. For US manufacturing, Maizels (2000) found that for the first half of the 1980s a significant improvement was seen in the NBTT with developing countries, while the relationship with industrialized countries was trendless. In the case of the latter countries the NBTT turned negative until 1997.
In the case of China, Zheng / Zhao (2002) estimated a 13% deterioration of total trade in 1993−2000 (not including oil). For the case of trade with the US, China suffered a fall of 23% and 24% for all goods and manufac-turing, respectively.
Below we will analyze the unit values of imports and NBTT for Mexico and China in the US, based on US statistics.32 We will include total US trade with Mexico and China by way of the Harmonized Tariff System (HTS) at 10-digits. According to our literature review, only 5-digit level analysis – in accordance with the Standard International Trade Classifica-tion (SITC) – has been done so far; and there has been no NBTT analysis for exports and imports for 1990−2006.33
A few technical topics are helpful in understanding the results:
1. Although several hundred 10-digit items were eliminated in order to calculate the unit values and to eliminate outliers, representativity was still very high: for total US imports, for example, 10-digit items used accounted for 82%, 74% and 78% of total US imports and of imports from China and Mexico, respectively during 1990-2006 (see Table 11).
32 Given the scope of this analysis, we will not include a detailed description of the con-
struction of indices, its selection (Paasche, Laspeyres, Fisher, etc.), its specificity (sim-ple or chained) and the base year, as well as the selection of the goods to be included in the index (either full series or specific criteria for considering only a group of com-modities). The chained Laspeyres Index was used for calculating the NBTT, consider-ing that chaining will reduce the spread between the indices, i.e. in terms of the amount of price change that has occurred between the two periods under consideration.
33 Kaplinsky and Santos-Paulino (2005, 2006) use the information from EUROSTAT for the European Union based on the Harmonized Tariff System at the 8-digit level, but only for its import prices.
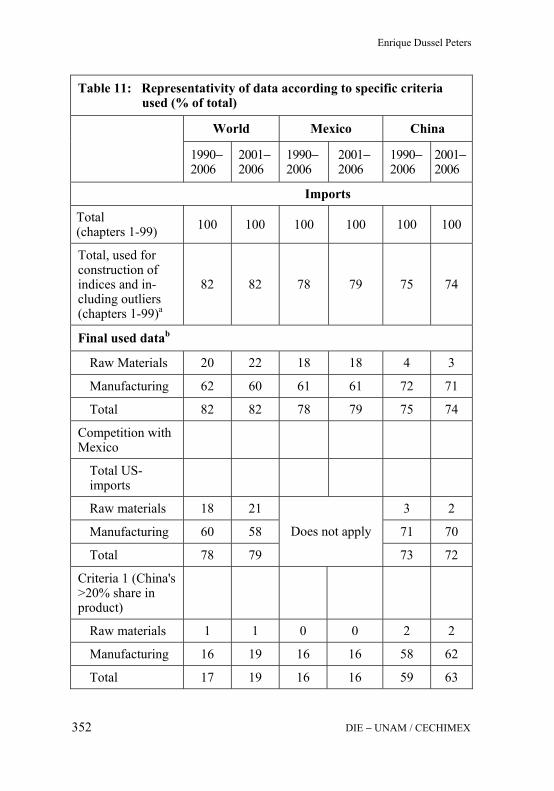
Enrique Dussel Peters
DIE − UNAM / CECHIMEX 352
Table 11: Representativity of data according to specific criteria used (% of total)
World Mexico China
1990−2006
2001−2006
1990−2006
2001− 2006
1990−2006
2001−2006
Imports
Total (chapters 1-99) 100 100 100 100 100 100
Total, used for construction of indices and in-cluding outliers (chapters 1-99)a
82 82 78 79 75 74
Final used datab
Raw Materials 20 22 18 18 4 3
Manufacturing 62 60 61 61 72 71
Total 82 82 78 79 75 74
Competition with Mexico
Total US-imports
Raw materials 18 21 3 2
Manufacturing 60 58 71 70
Total 78 79
Does not apply
73 72
Criteria 1 (China's >20% share in product)
Raw materials 1 1 0 0 2 2
Manufacturing 16 19 16 16 58 62
Total 17 19 16 16 59 63

The Mexican Case
DIE − UNAM / CECHIMEX 353
Table 11 (cont.): Representativity of data according to specific criteria used (% of total)
World Mexico China 1990−
2006 2001−2006
1990−2006
2001− 2006
1990−2006
2001−2006
Criteria 2 (China's >14% share in growth of product)
Raw materials 1 1 1 1 1 1
Manufacturing 24 27 29 32 26 33
Total 25 28 30 32 27 33
Exports
Total exports 100 100 100 100 100 100
Total, used for construction of indices and in-cluding outliers
77 73 68 69 77 81
Without represen-tative atypical unitary prices
74 72 66 68 76 80
a Here we incorporated all the data for 10-digit items that include quantities and values. b Several items were eliminated given their high volatility and their effects on the respec-
tive index; their weight on total trade is very small and is not significant.
Source: Author, based on information from USITC (s. a.)
2. Bearing in mind the goal of this section; to analyze the possible ef-fects of Chinese exports on Mexican exports – in this case to the US market, which accounted for 84% of total Mexican exports during 2000−2007 – 21 indices were calculated: 12 for total US imports from China and 9 for Mexican imports. a. The following indices were calculated for imports: i. Total US
imports for chapters 1-29 (a proxy for primary products) and 30-99 (a proxy for manufactured commodities) of the HTS; ii. A se-lection of total and Chinese imports based on Mexican exports to

Enrique Dussel Peters
DIE − UNAM / CECHIMEX 354
US in order to detail China’s competition with Mexican exports in the US market thus eliminating China’s exports to the US that do not compete with Mexico. This new universe of US imports was also disaggregated into total imports, for primary and manu-facturing goods; iii. In addition, and based on the former universe of goods from China and total US imports that compete with Mexican exports, two groups of products were calculated based on the following criteria: I. Those in which the share of China at the 10-digit level is above 20% of total US imports for the period 2001−2006; and II. Those in which the growth of its share over total US imports during 2001−2006 was above China’s total growth share of 14%. That is, in this group of items the share in-creased substantially and above the impressive growth of the share of China during 2001−2006. For both groups the division into total, primary and manufacturing goods was also calculated.
What are the main results of the calculations? They can be divided under two headings: the tendencies in unit values of US imports during 1990-2006 and tendencies in NBTT for the same period. In all cases 2001 was defined as the base year for the calculations, given the prior analysis show-ing that China has entered the US market on a massive scale since 2001, with a significant impact on other exporters, including Mexico.
The tendencies in unit values of imports during 1990−2006 do reflect interesting differences. On the one hand, while manufacturing unit values only increased slightly since 2001, they rose sharply for raw materials, reaching 125% in 2006. Considering that Chinese exports to the US (and in general) concentrate exclusively on manufacturing, Chinese unit values only increased slightly, while the differences are substantial for Mexico: unit values for exports of raw materials to the US increased by 36.3% in 2006, and only by 2.7% for manufacturing. These tendencies are also true when only considering the unit values for Mexican exports and those that compete with Chinese and total imports from the US (see Table 12).
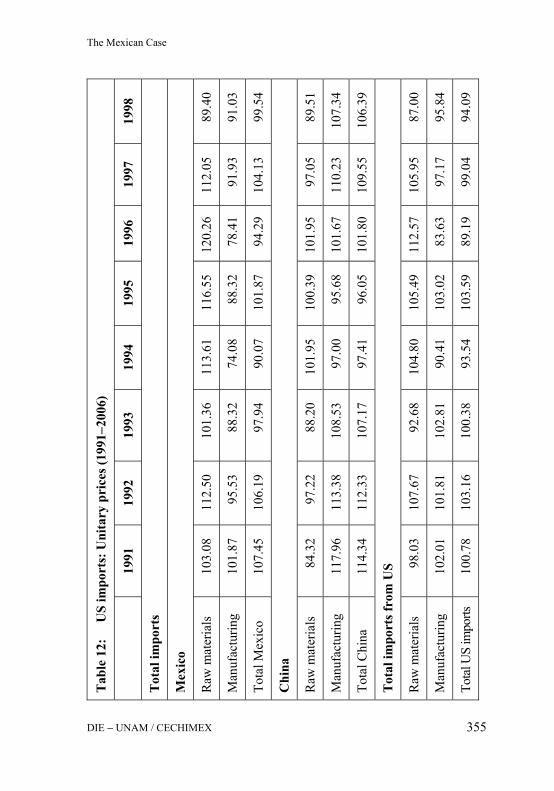
Tab
le 1
2:
US
impo
rts:
Uni
tary
pri
ces (
1991
−200
6)
19
91
1992
19
93
1994
19
95
1996
19
97
1998
Tot
al im
port
s
Mex
ico
Raw
mat
eria
ls
103.
08
112.
50
101.
36
113.
61
116.
55
120.
26
112.
05
89.4
0
Man
ufac
turin
g 10
1.87
95
.53
88.3
2 74
.08
88.3
2 78
.41
91.9
3 91
.03
Tota
l Mex
ico
107.
45
106.
19
97.9
4 90
.07
101.
87
94.2
9 10
4.13
99
.54
Chi
na
Raw
mat
eria
ls
84.3
2 97
.22
88.2
0 10
1.95
10
0.39
10
1.95
97
.05
89.5
1
Man
ufac
turin
g 11
7.96
11
3.38
10
8.53
97
.00
95.6
8 10
1.67
11
0.23
10
7.34
Tota
l Chi
na
114.
34
112.
33
107.
17
97.4
1 96
.05
101.
80
109.
55
106.
39
Tot
al im
port
s fro
m U
S
Raw
mat
eria
ls
98.0
3 10
7.67
92
.68
104.
80
105.
49
112.
57
105.
95
87.0
0
Man
ufac
turin
g 10
2.01
10
1.81
10
2.81
90
.41
103.
02
83.6
3 97
.17
95.8
4
Tota
l US
impo
rts
100.
78
103.
16
100.
38
93.5
4 10
3.59
89
.19
99.0
4 94
.09
The Mexican Case
DIE − UNAM / CECHIMEX 355

Tab
le 1
2 (c
ont.)
:
US
impo
rts:
Uni
tary
pri
ces (
1991
−200
6)
19
91
1992
19
93
1994
19
95
1996
19
97
1998
Impo
rts o
nly
acco
rdin
g to
Mex
ican
exp
orts
to th
e U
S
Mex
ico
Raw
mat
eria
ls
103.
08
112.
50
101.
36
113.
62
116.
55
120.
23
112.
04
89.4
7
Man
ufac
turin
g 10
1.88
95
.54
88.3
3 74
.21
88.3
3 78
.41
91.9
3 91
.03
Tota
l Mex
ico
107.
45
106.
19
97.9
4 90
.17
110.
36
116.
99
106.
59
122.
44
Chi
na
Raw
mat
eria
ls
84.8
5 99
.55
90.2
3 10
3.44
11
0.59
10
4.63
97
.34
89.4
8
Man
ufac
turin
g 11
9.00
11
2.88
10
9.80
98
.45
100.
55
102.
17
110.
35
107.
51
Tota
l Chi
na
115.
43
112.
19
108.
63
98.8
6 10
1.13
10
2.38
10
9.82
10
6.73
Tota
l im
port
s fro
m U
S
Raw
mat
eria
ls
97.4
6 10
3.75
92
.26
102.
16
106.
96
111.
74
102.
32
84.1
3
Man
ufac
turin
g 10
0.39
10
1.33
10
2.75
89
.92
103.
18
84.9
3 96
.87
95.6
7
Tota
l US
impo
rts
99.4
9 10
1.83
10
0.31
92
.50
103.
98
89.8
9 97
.99
93.4
6
Enrique Dussel Peters
DIE − UNAM / CECHIMEX 356

Tab
le 1
2 (c
ont.)
:
US
impo
rts:
Uni
tary
pri
ces (
1991
−200
6)
19
99
2000
20
01
2002
20
03
2004
20
05
2006
Tot
al im
port
s
Mex
ico
Raw
mat
eria
ls
133.
60
154.
55
100.
00
103.
41
129.
55
135.
29
138.
37
136.
26
Man
ufac
turin
g 94
.63
97.0
3 10
0.00
90
.17
95.1
2 93
.88
96.1
5 10
2.68
Tota
l Mex
ico
93.8
1 10
4.12
10
0.00
11
0.31
11
5.46
11
0.31
11
3.65
11
9.11
Chi
na
Raw
mat
eria
ls
95.7
7 10
1.28
10
0.00
83
.98
102.
16
108.
89
121.
01
103.
90
Man
ufac
turin
g 10
8.62
11
0.94
10
0.00
10
2.51
11
0.32
11
6.99
11
0.70
11
3.35
Tota
l Chi
na
107.
98
110.
45
100.
00
101.
60
109.
91
116.
58
111.
18
112.
87
Tot
al im
port
s fro
m U
S
Raw
mat
eria
ls
118.
31
140.
84
100.
00
68.1
9 11
8.90
12
2.12
13
5.86
12
4.88
Man
ufac
turin
g 98
.44
104.
93
100.
00
91.5
6 10
2.68
10
6.36
10
3.26
10
5.87
Tota
l US
impo
rts
102.
07
111.
68
100.
00
86.2
5 10
6.25
11
0.15
11
1.54
11
1.14
The Mexican Case
DIE − UNAM / CECHIMEX 357
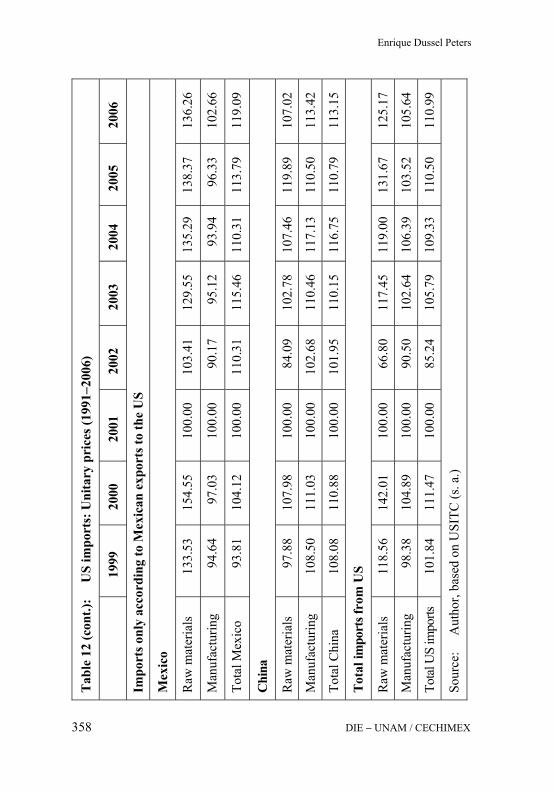
Tab
le 1
2 (c
ont.)
:
US
impo
rts:
Uni
tary
pri
ces (
1991
−200
6)
19
99
2000
20
01
2002
20
03
2004
20
05
2006
Impo
rts o
nly
acco
rdin
g to
Mex
ican
exp
orts
to th
e U
S
Mex
ico
Raw
mat
eria
ls
133.
53
154.
55
100.
00
103.
41
129.
55
135.
29
138.
37
136.
26
Man
ufac
turin
g 94
.64
97.0
3 10
0.00
90
.17
95.1
2 93
.94
96.3
3 10
2.66
Tota
l Mex
ico
93.8
1 10
4.12
10
0.00
11
0.31
11
5.46
11
0.31
11
3.79
11
9.09
Chi
na
Raw
mat
eria
ls
97.8
8 10
7.98
10
0.00
84
.09
102.
78
107.
46
119.
89
107.
02
Man
ufac
turin
g 10
8.50
11
1.03
10
0.00
10
2.68
11
0.46
11
7.13
11
0.50
11
3.42
Tota
l Chi
na
108.
08
110.
88
100.
00
101.
95
110.
15
116.
75
110.
79
113.
15
Tot
al im
port
s fro
m U
S
Raw
mat
eria
ls
118.
56
142.
01
100.
00
66.8
0 11
7.45
11
9.00
13
1.67
12
5.17
Man
ufac
turin
g 98
.38
104.
89
100.
00
90.5
0 10
2.64
10
6.39
10
3.52
10
5.64
Tota
l US
impo
rts
101.
84
111.
47
100.
00
85.2
4 10
5.79
10
9.33
11
0.50
11
0.99
Sour
ce:
A
utho
r, ba
sed
on U
SITC
(s. a
.)
Enrique Dussel Peters
DIE − UNAM / CECHIMEX 358

The Mexican Case
DIE − UNAM / CECHIMEX 359
More detailed analysis, however, shows a different picture: Table 13 indicates that using the earlier specified criteria – i.e. criteria 1 defined by all 10-digit items in which China presents a share above 20% of all respective imports in 2006, and criteria 2, in which China’s share in-creased by more than 14% during 2001−2006. Two patterns arise: a) under criteria 1 Mexico’s unit values benefit in manufacturing – reach-ing 119% in 2006, and do much better than China; b) under criteria 2 – i.e. all those 10-digit items in which China’s share increased by more than 14% during 2001−2006 – Mexico’s unit values show a particu-larly bad performance as of 2001 and account for 98% in 2006, for manufacturing. This differentiated performance is relevant, as it shows that unit values have performed well since 2001 in items in which China already has a big share (over 20%); while the unit values in those where China is still increasing its share and competing are falling significantly. In Mexico’s case the difference in performance between both groups of export-items is very significant and accounts for competi-tion of Chinese and Mexican products in the US market (see Figure 8).34
Tendencies for Net Barter Terms of Trade (NBTT) also show impor-tant differentiated trends for total trade, Mexico, and China, during 1990-2006. In general, both data sets – i.e. for total trade and only for those goods traded between Mexico and the US – display a similar tendency: Mexico’s NBTT in manufacturing have moved in favor of the US and against Mexico by 19% for 2001−2006, while they fell by 1% for Chinese manufacturing imports (see also Figure 9).
As a result, the United States has benefited substantially from competi-tion between China and other countries, including Mexico. Thus, NBTT have benefited the US since 2001 with China’s massive exports to the US. One of the main losing parties of this process has been Mex-ico, with significant losses in NBTT in Mexico’s main export item: manufacturing.
34 The results for unitary values of total US imports also reflect important differences
between trends in raw materials and in manufacturing, i.e. an improvement in unitary prices for raw materials imports since 2003. This would favor a more detailed discus-sion on the topic, such as suggested by Kaplinsky (2006).
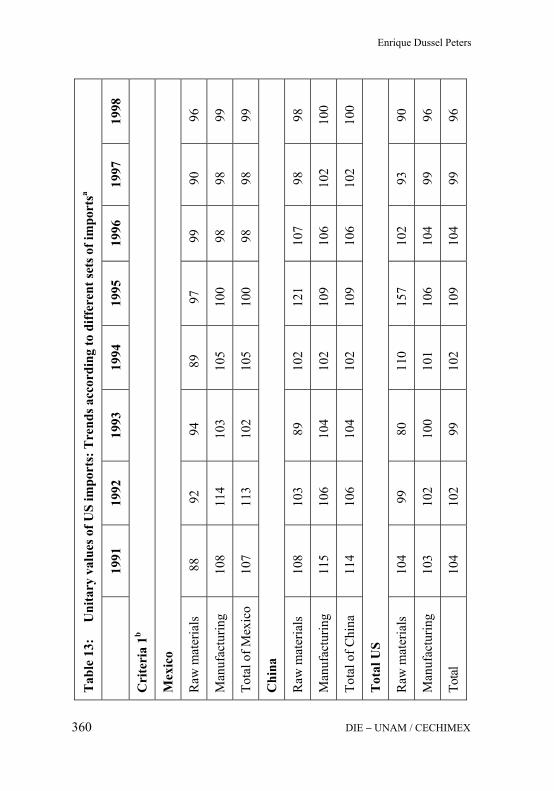
Tab
le 1
3:
Uni
tary
val
ues o
f US
impo
rts:
Tre
nds a
ccor
ding
to d
iffer
ent s
ets o
f im
port
sa
19
91
1992
19
93
1994
19
95
1996
19
97
1998
Cri
teri
a 1b
Mex
ico
Raw
mat
eria
ls
88
92
94
89
97
99
90
96
Man
ufac
turin
g 10
8 11
4 10
3 10
5 10
0 98
98
99
Tota
l of M
exic
o 10
7 11
3 10
2 10
5 10
0 98
98
99
Chi
na
Raw
mat
eria
ls
108
103
89
102
121
107
98
98
Man
ufac
turin
g 11
5 10
6 10
4 10
2 10
9 10
6 10
2 10
0
Tota
l of C
hina
11
4 10
6 10
4 10
2 10
9 10
6 10
2 10
0
Tot
al U
S
Raw
mat
eria
ls
104
99
80
110
157
102
93
90
Man
ufac
turin
g 10
3 10
2 10
0 10
1 10
6 10
4 99
96
Tota
l 10
4 10
2 99
10
2 10
9 10
4 99
96
Enrique Dussel Peters
DIE − UNAM / CECHIMEX 360

Tab
le 1
3 (c
ont.)
:
Uni
tary
val
ues o
f US
impo
rts:
Tre
nds a
ccor
ding
to d
iffer
ent s
ets o
f im
port
sa
19
91
1992
19
93
1994
19
95
1996
19
97
1998
Cri
teri
a 2c
Mex
ico
Raw
mat
eria
ls
105
102
78
96
102
98
111
92
Man
ufac
turin
g 10
1 10
1 94
94
93
90
94
89
Tota
l of M
exic
o 10
1 10
0 92
94
93
90
94
89
Chi
na
Raw
mat
eria
ls
115
92
93
98
119
97
105
93
Man
ufac
turin
g 12
2 10
6 11
1 10
1 11
5 10
9 10
5 10
7
Tota
l of C
hina
12
2 10
5 11
0 10
1 11
5 10
9 10
5 10
7
Tota
l US
Raw
mat
eria
ls
105
93
79
98
131
95
91
90
Man
ufac
turin
g 10
5 10
2 10
8 10
1 10
7 10
5 99
95
Tota
l 10
5 10
1 10
6 10
1 10
8 10
4 98
94
The Mexican Case
DIE − UNAM / CECHIMEX 361

Tab
le 1
3 (c
ont.)
:
Uni
tary
val
ues o
f US
impo
rts:
Tre
nds a
ccor
ding
to d
iffer
ent s
ets o
f im
port
sa
19
99
2000
20
01
2002
20
03
2004
20
05
2006
Cri
teri
a 1b
Mex
ico
Raw
mat
eria
ls
89
96
100
101
100
99
108
110
Man
ufac
turin
g 10
1 10
3 10
0 94
10
0 97
10
6 11
9
Tota
l of M
exic
o 10
1 10
3 10
0 95
99
97
10
6 11
9
Chi
na
Raw
mat
eria
ls
97
108
100
100
109
117
118
109
Man
ufac
turin
g 98
10
1 10
0 98
10
1 10
7 10
2 10
5
Tota
l of C
hina
98
10
1 10
0 98
10
2 10
7 10
2 10
5
Tot
al U
S
Raw
mat
eria
ls
94
91
100
86
98
101
104
100
Man
ufac
turin
g 96
10
1 10
0 95
99
10
3 10
0 10
4
Tota
l 96
10
0 10
0 94
99
10
3 10
0 10
4
Enrique Dussel Peters
DIE − UNAM / CECHIMEX 362

Tab
le 1
3 (c
ont.)
:
Uni
tary
val
ues o
f US
impo
rts:
Tre
nds a
ccor
ding
to d
iffer
ent s
ets o
f im
port
sa
19
99
2000
20
01
2002
20
03
2004
20
05
2006
Cri
teri
a 2c
Mex
ico
Raw
mat
eria
ls
100
99
100
104
103
97
105
107
Man
ufac
turin
g 94
93
10
0 88
91
88
94
98
Tota
l of M
exic
o 94
93
10
0 88
92
88
94
98
Chi
na
Raw
mat
eria
ls
95
115
100
100
96
105
115
101
Man
ufac
turin
g 97
10
5 10
0 99
98
10
7 94
10
0
Tota
l of C
hina
97
10
5 10
0 99
98
10
7 94
10
0 To
tal U
S R
aw m
ater
ials
10
0 91
10
0 85
92
94
96
95
Man
ufac
turin
g 96
10
1 10
0 96
99
10
3 10
1 10
2
Tota
l 96
10
1 10
0 95
99
10
2 10
1 10
1 a
In a
ll ca
ses,
on M
exic
an it
em im
ports
def
ine
the
set o
f im
porte
d ite
ms,
also
for C
hine
se a
nd to
tal i
mpo
rts
b R
efer
s to
all 1
0-di
git i
tem
s in
whi
ch C
hina
has
a sh
are
on to
tal U
S-im
ports
abo
ve 2
0%
c R
efer
s to
all 1
0-di
git i
tem
s in
whi
ch C
hina
’s sh
are
incr
ease
d by
mor
e th
an 1
4% d
urin
g 20
01−2
006
Sour
ce:
A
utho
r, ba
sed
on in
form
atio
n fr
om U
SITC
(s. a
.)
The Mexican Case
DIE − UNAM / CECHIMEX 363
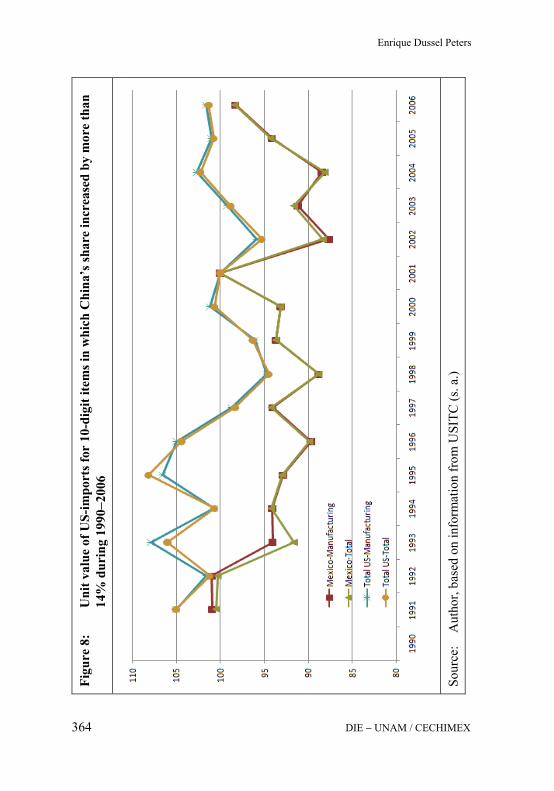
Figu
re 8
: U
nit v
alue
of U
S-im
port
s for
10-
digi
t ite
ms i
n w
hich
Chi
na’s
shar
e in
crea
sed
by m
ore
than
14
% d
urin
g 19
90−2
006
Sour
ce:
Aut
hor,
base
d on
info
rmat
ion
from
USI
TC (s
. a.)
Enrique Dussel Peters
DIE − UNAM / CECHIMEX 364

Figu
re 9
: N
BT
T o
f the
US
in m
anuf
actu
ring
: Tot
al, C
hina
and
Mex
ico
Sour
ce:
Aut
hor,
base
d on
info
rmat
ion
from
USI
TC (s
. a.)
The Mexican Case
DIE − UNAM / CECHIMEX 365

Enrique Dussel Peters
DIE − UNAM / CECHIMEX 366
5 Effects of China’s trade on Mexico’s manufacturing employment
This section deepens some of the existing analysis of the bilateral relation-ship between Mexico and China, particularly in terms of trade and the effects of China’s increasing presence in Mexico on its manufacturing employment. Topics analyzed previously, particularly Mexico’s poor employment record in manufacturing and the increased penetration of the domestic market by Chinese imports, are relevant for this section.
In the case of Argentina, Castro, Olarreaga and Saslavsky (2007) found that a 1% increase in imports generates a 0.07% decrease in manufacturing employment. Imports from China only explain between 0.1% and 0.2% of the fall of manufacturing employment resulting from total imports. In the case of Brazil, the effect on employment is twice as high.
From this perspective, what is the effect of imports on Mexico’s manufac-turing employment, and in particular as a result of imports from China?35 To estimate the impact of changes in import penetration on labor demand, we follow Greenway / Hine / Wright (1998) and assume a Cobb-Douglas production function across industry and time. From a firm’s optimization conditions we can establish a base model whose dependent variable is labor demand, explained by its own lagged labor demand, wages and pro-duction (or capital stock). In addition, international trade variables explain labor demand: import penetration (understood as total imports over apparent consumption) and imported inputs used for production (which could be understood as com-plementary to employment). As an option, the interaction between import penetration and the share of total US imports from Mexico is also consid-ered. Finally, several time and sector dummies were included in order to control for heterogeneity. Ordinary Least Squares (OLS), Instrumental Variables (IV) and General-ized Method of Moment (GMM) estimations were pursued to correct for potential biases in the respective estimations (Arellano / Bond 1991). These methods allowed for bias corrections in the estimations. The first, caused by joint determination, is the endogeneity of an independent vari-able and the dependent variable. The second can occur as a result of inertia
35 For a full discussion see Castro, Olarreaga and Saslavsky (2007).

The Mexican Case
DIE − UNAM / CECHIMEX 367
of some aggregated variables such as employment, whose magnitude can be explained by its prior, lagged behavior, causing serial correlation. GMM is usually used in the case of both problems, as it lacks the biases which arise in the estimates in the context of these problems.
Variables for Mexico’s manufacturing sector and its 49 branches were obtained for the 1994−2003 period from the Instituto Nacional de Estadística, Geografía e Información (INEGI). All variables are expressed in nominal terms and were transformed to US$; in the case of imports and exports they were additionally deflated by Mexico’s inflation. In the case of the variables expressed in current pesos (wages, production and im-ported inputs), these variables were also deflated by Mexico’s inflation. In some other cases INEGI’s data was obtained on a monthly basis and they had to be annualized. In all cases, the information is exclusively for Mex-ico’s manufacturing sector, not including maquiladoras. Trade variables – the only exception – were obtained from Comtrade.
The methodology and model used for estimating the effects of Mexico’s trade with China on its manufacturing sector is similar to the one used by Castro, Olarreaga and Saslavsky (2007), i.e. following Greenway / Hine / Wright (1998). We start from a Cobb-Douglas production function for a representative firm i in time t:
βαγititit lkAq = (1)
where q is gross real production, k is capital stock and l units of labor utilized, and where α and β are the share of each factor used in produc-tion. Firms demand labor and capital until the marginal benefit of labor is equal to the cost of labor (w) and the marginal benefit of capital is equal to the interest rate (c). Deriving the first order conditions for l in (1), we obtain the following expression:
itititit wqpl /β= (2) where p is the price of the good i and w is the wage. Replacing (1) in (2) and rearranging the equation yields the following expression:

Enrique Dussel Peters
DIE − UNAM / CECHIMEX 368
ititit wlAkpl ⎥⎦
⎤⎢⎣
⎡= βαβ
( )( )β
αβ−
⎭⎬⎫
⎩⎨⎧
=11
itAk itit wl
(3)
From the first order conditions of l, it follows that,
ititit wlq =β
itit wllAk =βαβ
thus, the derived labor demand for the industry i in time t can be written as:
(4)
Taking logarithms and rearranging equation (4), we obtain the derived labor demand for the firm and thus industry i:
ititit wKl lnlnln 210 ααα ++= (5)
In view that the technical efficiency of production increases over time and that the rate of technological adoption and increases in x-efficiency is correlated with trade changes, we assume that parameter A in the produc-tion function varies in the following way:
( ) 210 λλλitit
Tit XMeA i=
, 0,, 210 ⟩λλλ (6)
where T is a time trend, M is a measure of import penetration, and X is a measure of export penetration. This implies that labor demand for industry i in time t is:

The Mexican Case
DIE − UNAM / CECHIMEX 369
βαα −= 101
εαααααα ++++++= TXMwKl ititititit 543210 lnlnlnlnln
(7)
with:
ββα −= 1ln0
βα −−= 112 βλα −= 113 βλα −= 124 βλα −= 105
This implies that labor demand is a function of changes in industry capital, wages, import penetration and export penetration. Formally:
( )XMwKLL ,,,* = (8)
Additionally we used equation (7) of lagged employment in logarithms as an explanatory variable. This and the wage variable were introduced with respective lags in order to control for endogeneity bias. A similar methodology can be found in Fajnzylber and Maloney (2000).
The main results for manufacturing employment show that (see Table 14):
• The “base model” presents the expected sign in almost all cases, although the statistical significance is sensitive to the technique for estimation and to the inclusion (or not) of fixed effects by in-dustry through dummy variables.
• The lagged employment variable is always significant at the 1% level and positive; although the magnitude of the coefficient de-pends on the inclusion (or not) of the industry dummy. In cases with the dummy variable, the coefficient varies from 0.39 to 0.58. When the dummy is not included, the coefficient is close to 1.

Enrique Dussel Peters
DIE − UNAM / CECHIMEX 370
• The hourly wage is always negative, although not always signifi-cant, especially in the case of GMM estimations where a higher efficiency of estimations is expected. The inclusion of the dummy variable for the industry is also sensible (the coefficient is close to –0.2).
• Production is positively associated with different degrees of sig-nificance, with the exception of the last two GMM models. o When trade variables are included, it is more difficult to de-
tect a trade pattern. First, import penetration is not always significant (only in regressions 1, 4, 5, 9 and 10) and the sign is not always as expected, i.e. negative.
o Imported inputs are never significant and the sign and coeffi-cient also vary substantially.
o On the other hand, the interaction of import penetration with the share of imports from the United States (not including maquiladoras) is always positive, and significant in 7 out of the 9 regressions. This interaction captures the non-linear ef-fects of a variable that accounts jointly for the penetration of imports from the world and the share of imports from the US.
o In the cases in which time and industry dummies were included, as well as import penetration, both variables have the expected sign and are significant (regressions 1, 4 and 5); i.e. under ce-teris paribus conditions, the growth of total import penetration has a negative effect on employment of -0.06 and -0.08%.
o Equations 1, 4 and 5 control for total penetration and imported inputs; when trade penetration of industrial goods from the US increases (or its share over total), labor demand in Mexico ranges between 0.07% and 0.09%.
o When we included China with a significant share of imports, we did not find definitive and significant results. Only in regression 3 did we find a weak and significant result with a negative rela-tionship between the share of imports from China and employ-ment in Mexico.

Tab
le 1
4:
Dep
ende
nt v
aria
ble:
Em
ploy
men
t -1
-2
-3
-4
-5
-6
OL
S O
LS
OL
S IV
IV
IV
0.
585*
0.
979*
0.
983*
0.
431*
0.
397*
0.
397*
(-
0.05
7)
(-0.
009)
(-
0.00
9)
(-0.
087)
(-
0.08
8)
(-0.
088)
-0
.237
* -0
.036
* -0
.037
* -0
.178
-0
.200
+ -0
.200
+
Empl
oym
ent (
-1)
(-0.
060)
(-
0.01
1)
(-0.
011)
(-
0.10
9)
(-0.
11)
(-0.
11)
0.25
9*
0.03
1*
0.02
7*
0.29
9*
0.29
8*
0.29
8*
Prod
uctio
n (-
0.02
9)
(-0.
009)
(-
0.00
9)
(-0.
041)
(-
0.04
1)
(-0.
041)
-0
.061
**
-0.0
06
0.00
10
-0.0
71*
-0.0
82*
0.01
4 To
tal i
mpo
rt pe
netra
tion
(-0.
025)
(-
0.01
) (-
0.00
9)
(-0.
025)
(-
0.02
9)
(-0.
018)
-0
.011
0.
001
0.00
1 -0
.015
-0
.012
-0
.012
To
tal i
mpo
rted
inpu
ts
(-0.
013)
(-
0.00
3)
(-0.
003)
(-
0.01
5)
(-0.
016)
(-
0.01
6)
0.07
8*
0.01
3+
0.00
8 0.
083*
0.
096*
Tota
l im
port
pene
tratio
n *
im
port
shar
e (-
0.02
4)
(-0.
007)
(-
0.00
6)
(-0.
023)
(-
0.02
5)
-0
.003
+
-0.0
04
-0.0
04
Shar
e of
impo
rts fr
om C
hina
(-
0.00
2)
(-
0.00
5)
(-0.
005)
0.
096*
Sh
are
of im
ports
from
USA
(-0.
025)
The Mexican Case
DIE − UNAM / CECHIMEX 371

Tab
le 1
4 (c
ont.)
:
Dep
ende
nt v
aria
ble:
Em
ploy
men
t -1
-2
-3
-4
-5
-6
OL
S O
LS
OL
S IV
IV
IV
0.
861+
-0
.216
* -0
.208
* 1.
634*
* 1.
983*
1.
983*
C
onst
ant
(-0.
519)
(-
0.05
7)
(-0.
057)
(-
0.68
2)
(-0.
715)
(-
0.71
5)
Obs
erva
tions
43
9 43
9 42
8 39
1 38
4 38
4
R-s
quar
ed
0.99
7 0.
994
0.99
4 0.
997
0.99
7 0.
997
Dum
mie
s Ti
me
&
sect
or
Tim
e Ti
me
Tim
e &
se
ctor
Ti
me
&
sect
or
Tim
e &
se
ctor
-7
-8
-9
-10
-11
-12
IV
IV
IV
G
MM
G
MM
G
MM
0.
984*
0.
985*
0.
985*
0.
963*
0.
955*
0.
955*
(-
0.01
) (-
0.01
) (-
0.01
) (-
0.05
4)
(-0.
064)
(-
0.06
4)
-0.0
23**
-0
.026
**
-0.0
26**
-0
.118
+ -0
.14
-0.1
4
Empl
oym
ent (
-1)
(-0.
011)
(-
0.01
1)
(-0.
011)
(-
0.06
7)
(-0.
10)
(-0.
10)
0.02
4**
0.02
4**
0.02
4**
0.06
8+
0.05
4 0.
054
Prod
uctio
n (-
0.01
0)
(-0.
010)
(-
0.01
0)
(-0.
034)
(-
0.03
9)
(-0.
039)
-0
.005
-0
.002
0.
008+
-0
.291
+ -0
.198
0.
017
Tota
l im
port
pene
tratio
n (-
0.01
0)
(-0.
010)
(-
0.00
4)
(-0.
154)
(-
0.13
) (-
0.03
2)
Enrique Dussel Peters
DIE − UNAM / CECHIMEX 372

Tab
le 1
4 (c
ont.)
:
Dep
ende
nt v
aria
ble:
Em
ploy
men
t -7
-8
-9
-1
0 -1
1 -1
2
IV
IV
IV
GM
M
GM
M
GM
M
0.00
1 0.
001
0.00
1 -0
.013
0.
002
0.00
2 To
tal i
mpo
rted
inpu
ts
(-0.
003)
(-
0.00
3)
(-0.
003)
(-
0.02
0)
(-0.
028)
(-
0.02
8)
0.01
2+
0.01
0.30
9**
0.21
5+
To
tal i
mpo
rt pe
netra
tion
* im
port
shar
e (-
0.00
7)
(-0.
007)
(-0.
143)
(-
0.11
)
-0
.003
-0
.003
-0.0
09
-0.0
09
Shar
e of
impo
rts fr
om C
hina
(-0.
002)
(-
0.00
2)
(-
0.01
6)
(-0.
016)
0.
01
0.21
5+
Shar
e of
impo
rts fr
om U
SA
-0.0
07
-0.1
1 -0
.126
**
-0.1
36**
-0
.136
**
0.02
0 0.
105
0.10
5 C
onst
ant
(-0.
061)
(-
0.06
3)
(-0.
063)
(-
0.38
6)
(-0.
414)
(-
0.41
4)
Obs
erva
tions
39
1 38
4 38
4 43
9 42
8 42
8 R
-squ
ared
0.
995
0.99
5 0.
995
D
umm
ies
Tim
e Ti
me
Tim
e Ti
me
Tim
e Ti
me
+ si
gnifi
cant
at 1
0%; *
* si
gnifi
cant
at 5
%; *
sign
ifica
nt a
t 1%
R
obus
t sta
ndar
d er
rors
in p
aren
thes
es
Sour
ce:
A
utho
r
The Mexican Case
DIE − UNAM / CECHIMEX 373
Enrique Dussel Peters
DIE − UNAM / CECHIMEX 374
6 Conclusions and policy proposals
The Mexican government implemented an export-oriented strategy in the late 1980s based on macroeconomic stabilization, expecting that proximity to the United States, import liberalization and cheap labor power would be sufficient to develop a country with 105 million inhabitants. Most of the variables performed in the expected direction; a significant export-orientation was achieved, macroeconomic stability in Mexico became a symbol for most of Latin America, and integration to the US market also allowed for significant growth in specific trade-related branches and sec-tors. From this perspective, most of the expected goals of the strategy were achieved.
On the other hand, both growth and development were only achieved in a limited way in the best of cases. Even when comparing export-industrialization to earlier decades of Import Substitution Industrialization (ISI) in Mexico the results were not positive. Performance in terms of growth, employment generation and wages, but also consumption, invest-ment, GDP per capita, technological development and absorption of ex-port-oriented products and processes, was disappointing; only some of these issues have been addressed in detail in this study. As discussed in the first section, many of these gaps were the result of processes and incen-tives inherent to export-orientation: specialization in exports through im-ports to be re-exported characterized Mexico’s engine of growth with few linkages, little employment generation and even fewer developments in R&D and technological spillovers. In addition, NAFTA allowed for an initial deepening of the regional integration process, but began to decline by the late 1990s: falling tariffs in the US and the practical abolition of tariffs in sectors such as electronics, as well as a massive shift of segments or production chains from the US to Asia and China, resulted in the need to either enhance the regional integration process through new mecha-nisms – a “NAFTA plus” – or face the slowly declining weight of NAFTA.
It is in this context that China’s fast and massive integration into the world market since the 1980s, but particularly since the 1990s, has played a considerable role in Latin America, and particularly in Mexico. In quanti-tative terms, China’s increasing role in terms of GDP, trade, upgrading and long-term growth and development, is significant for Latin America and

The Mexican Case
DIE − UNAM / CECHIMEX 375
the world market in general. However, China presents a great challenge for most of Latin America, and particularly for Mexico, from a more quali-tative perspective: for more than 25 years it has outperformed Mexico while following an ideologically and conceptually different development path. China’s GDP per capita growth during 1980-2006 was ten times higher than Mexico’s. China’s success, from this perspective, leads to a deep questioning of Latin America’s and Mexico’s export orientation and macroeconomic stability. Clearly, this is not only a matter of semantics and concepts. Up to now, China has continued to maintain massive public policies, in addition to substantial direct ownership and control over prop-erty, a fixed exchange rate, a planned economy and highly controlled mar-kets including trade, labor, services and capital, among others.
It is in this context that the bilateral relationship between both countries, while formally and diplomatically satisfactory, has become increasingly tense from an economic and trade perspective. Particularly for Mexico: China has become its second trading partner since 2003, while this rela-tionship is far important for China. Important FDI from China – in sectors such as yarn-textile-garment, electronics and more recently in autoparts-automobiles – present China as a “new unexpected neighbor” for Mexico. While these increases in trade and economic relations are indisputable, Chinese imports and competition in the US have been much more prob-lematic. From this perspective, it is possible that in the short term, the bilateral relationship worsens significantly as a result of trade disputes within the WTO. Other topics such as illegal imports, triangulation and poor statistics have increased the tension between both countries. The difficulties in this bilateral relationship also increase in the most important export market, United States. While exports have become increasingly significant for China, which has a relatively diversified export structure to the US, the EU, Asia and other nations; the US accounts for more than 85% of Mexican exports, i.e. it is the critical destination for Mexican ex-ports and its strategy.
As discussed in greater detail in section 4 of this study, China has in-creased exports to the US since the 1980s, particularly since 2001, displac-ing practically all other nations including Mexico. The Export-Similarity Index and chapter-level statistics show that Mexico and China’s main exports to the US, at least at the chapter-level, are relatively similar. Therefore, it is not expected that the fierce competition with (and dis-
Enrique Dussel Peters
DIE − UNAM / CECHIMEX 376
placement of) Mexico will change in the medium term. In addition, esti-mates of terms of trade based on US statistics show significant benefits for China and losses in Mexico during 1990−2006. It is expected that auto-parts and automobiles will be the next chains in which competition will increase in the next years.
Initial statistical analysis still presents considerable difficulties in measur-ing the impact of Mexico’s trade with China on Mexican employment. Preliminary results so far estimate negative, but statistically non-significant, effects for 1994−2003. While this kind of modeling still re-quires sizeable improvements, it is certain that in specific chains such as yarn-garment-textiles, the competition with Asian and Chinese legal and specifically illegal imports in Mexico’s domestic market has been signifi-cant and has effectively displaced Mexican production and employment. It is not difficult to understand that Mexico’s 15:1 trade relationship with China in 2006 – i.e. exporting 1 unit and importing 15 – has generated massive displacement in terms of production and employment; although an increasing proportion of China’s imports are also being used as inputs for exports (mainly to the US).
The initial findings regarding the unit value of US imports from China and Mexico, as well as the NBTT, also show that China is competing with Mexico in the US market through lower unit values, and that this is affect-ing Mexico’s NBTT in the US. The topic clearly requires further research, but apparently China has been successful in displacing Mexican exports through lower unit values and significantly affecting Mexico’s NBTT in manufacturing.
In terms of policy proposals a few issues stand out. On the one hand, there is the need to promote the potential of FDI in a development framework; i.e., FDI can clearly allow for development in terms of technology, em-ployment, wages, and overall learning processes, only if it is part of a larger socioeconomic strategy with specific instruments parallel to FDI flows. The lack of such instruments and overall perspective does not allow for integration of these processes in terms of territorial endogeneity. Spe-cifically for Mexico there have been no such policies to accompany FDI flows in terms of regional-sectoral policies regarding technological devel-opment, training, specific support of particular products and processes, etc. The most recent document of the new government, the National Develop-ment Plan for 2007−2012 (PEF 2007), clearly reflects this perspective:

The Mexican Case
DIE − UNAM / CECHIMEX 377
macroeconomic stabilization in terms of fiscal and monetary policy are the basis for competitiveness, while other issues such as trade, industrial, regional and sectoral policies have been left aside since the late 1980s. Specific instruments and costs in terms of programs and qualified person-nel are not considered within a framework of macroeconomic adjustment. Thus, the public sector at the municipal, regional and national level in Mexico should implement policies that allow for such an integration pro-cess.
The bilateral relationship between China and Mexico is currently in a phase where strategic long-term decisions are needed. The trade and eco-nomic dynamics between the two nations do not coincide with their politi-cal and diplomatic weight, or with the real and effective relationship that should exist between the two countries. Beyond debates on the “Chinese threat” it is essential that public, private and academic sectors seek to formalize the bilateral relationship with the People’s Republic of China and be capable of overcoming the current incongruent relationship. From a Mexican perspective, China is not only Mexico’s second trading partner, and an active competitor in the domestic and US markets, but also a socio-economic gate to the Pacific and the twenty-first century.
Why is normalizing the relationship with China relevant? There are multi-ple benefits. In addition to being Mexico’s second biggest trading partner and having a dynamism that exceeds that of Mexico’s other trading part-ners, three aspects stand out. First, it is essential that Mexico take advan-tage of the enormous demand for imports in China. They are a significant global exporter, and will soon become the main global exporter, and their imports show the same dynamics. However, Mexico has yet to take advan-tage of this opportunity. Secondly, regularizing the trade and economic relationship with Mexico would be important, in view of the possibility that imports from China and the establishment of Chinese companies in Mexico could increase the competitiveness of Mexican production. In several sectors, from agriculture to science and technology, China has products, processes and experiences that are relevant to Mexico. This opportunity should not be rejected by Mexico – which is currently replac-ing US imports with Asian imports, particularly from China – and should be actively benefited from instead. Third, China has undoubtedly replaced a substantial sector of Mexican production, both for the domestic market and exports, especially those oriented to the United States, and therefore it
Enrique Dussel Peters
DIE − UNAM / CECHIMEX 378
is imperative that preparation measures be taken in the short, medium, and long term. Since the nineties, China has become a “global player”; the potential for strategic and short, medium and long-term strategies shows great opportunities and the need to take action regarding the implied chal-lenges.
Mexico’s current relationship with its second biggest trading partner is irregular and requires short, medium, and long-term solutions such as compensatory quotas. The current debate over whether or not to accept China as a market economy, timely debates in the WTO, and numerous international forums, among many others, all lead to the conclusion that greater institutional measures are required to improve and deepen the bilateral relationship, at least in socio-economic terms.
Two measures can be taken in the next years to overcome the bilateral impasse:
1. The creation of an Assessment Board. We propose the creation of an Assessment Board of the Executive Office, the Senate, and the House of Deputies on China. Its objective would be to serve as a center of in-formation, analysis and proposals for the Executive Office, the Senate and the House of Deputies and would be made up of high level gov-ernment employees, businesspeople, Non-governmental Organiza-tions (NGOs), and associations, as well as by a large group of experts and academics that would allow proposals to be sustained in the bilat-eral relationship. Trade and economic aspects would be priorities, al-though it is also conceivable that other commissions would be created, on topics such as politics, culture, science, academics, sports, tourism, labor and migratory issues, sectorial and even “intersectoral” is-sues.36 The Board should work in the same capacity for the Bilateral Mexico-China Commission. The Executive Office, the Senate, and the House of Deputies ought to provide sufficient financing for the me-dium-term functioning of the Commission, while specific projects could be financed by academic institutions and the private sector.
36 The NAFTA Assessment Board was made up of 20 people, including the chancellors of
various universities, appointed by the Executive. This process without a doubt requires a greater opening to the integration of other segments of Mexican society.
The Mexican Case
DIE − UNAM / CECHIMEX 379
2. Strengthening of existing bilateral institutions. Today bilateral institu-tions – particularly the Bilateral Mexico-China Commission and its High-Level Group (GAL) – have pointed out significant topics, as discussed in the second section of this paper, but have lacked the po-litical support in both countries to solve important issues in the short, medium and long-term. In the meetings of the various bilateral institu-tions problematic issues such as illegal trade, industrial policy, R&D cooperation, tourism, visa problems and academic exchange, have al-ready been highlighted, among many others. These topics may be solved in the very near future with financial support and adequate per-sonnel.
These measures should be taken in the very short term in several cases. As discussed in the document, several issues will arise in the bilateral rela-tionship in the close future – particularly in the framework of the WTO – that can generate massive obstacles and tensions. The proposal of China’s President, in Mexico in 2005, to create a long-term strategic relationship is still open and needs to be realized; otherwise the bilateral relationship could easily head for major conflicts.

Enrique Dussel Peters
DIE − UNAM / CECHIMEX 380
Bibliography
Álvarez Medina, M. L. (2007): La industria automotriz China: posibilidades de competir con la industria automotriz en México, in: E. Dussel Peters / Y. Trápaga, China y México: implicaciones de una nueva relación, Mexico-City: La Jornada, Cechimex/UNAM, ITESM y Fundación Friedrich Ebert, 191–208
AMSDE (Asociación Mexicana de Secretarios de Desarrollo) (2007): Programa de Formación de Negocios China-México: AMSDE, Mexico City
Anguiano, R. (2007): Relaciones México-China en su perspectiva histórica, in: E. Dussel Peters / Y. Trápaga, China y México: implicaciones de una nueva relación, Mexico-City: Centro de Estudios China-México/UNAM, Fundación Friedrich Ebert, La Jornada e ITESM, 25–50
Arellano, M. / S. Bond (1991): Some tests of specification for panel data: Monte Carlo evidence and an application to employment equations, in: Review of Economic Studies 58 (2), 277–297
Bancomext (Banco Nacional de Comercio Exterior) (2008): World Trade Atlas, Mexico-City
Berg, J. / C. Ernst / P. Auer (eds.) (2006): Meeting the employment challenge: Argentina, Brazil and Mexico in the global economy, Boulder, Colo.: Lynne Rienner Publishers
Berge, K. / T. Crowe (1997): The terms of trade facing South Korea with respect to its trade with LDCs and DMEs, Oxford: Oxford University, Oxford Depart-ment of International Development (Queen Elizabeth House) (QEH Working Paper 12)
Buitelaar, R. (1997): La posición de los países pequeños en el mercado de las importaciones de los Estados Unidos: efectos del TLC y la devaluación Mexicana, Santiago de Chile: CEPAL (Desarrollo Productivo 39), 16–17
CANAINTEX (Cámara Nacional de la Industria Textil) (2007): Several documents; online: http://www.canaintex.org.mx
Cárdenas, H. L. (2006): Competencia entre México y China en la cadena hilo-textil-confección en el mercado de los Estados Unidos (1990–2005), Mexico-City: Tesis de Licenciatura de la Facultad de Economía/UNAM
Cárdenas, H. L. / E. Dussel Peters (2007): México y China en la cadena hilo-textil-confección en el mercado de Estados Unidos, in: Comercio Exterior 57 (7), 530–545
Casas, C. (2005): Estrategia de promoción con la República Popular China: ciclo de conferencias China-México, Facultad des Economía/UNAM, 16. Nov. 2005, Mexico-City
The Mexican Case
DIE − UNAM / CECHIMEX 381
Castro, L. / M. Olarreaga / D. Saslavsky (2007): The impact of trade with China and India on Argentina’s manufacturing employment, Washington, DC: World Bank (Policy Research Working Paper 4153)
CCS (China Custom Statistics) (s. a.): Commercial information: various years, Hong Kong
CNIV (Cámara Nacional de la Industria del Vestido) (2007): Several documents; online: http://www.cniv.org.mx
Cornejo, R. (1985): Las zonas económicas especiales en China, in: Estudios de Asia y África 20 (2), 444-469.
– (2005): México y la competitividad de China, in: S. Casarín / C. Moneta (eds.): China y América Latina, Buenos Aires: BID-INTAL, 235–268
Correa, M. I. / J. González García (2006): Perfiles recientes del desarrollo económico de China, Mexico-City: Universidad Nacional Autónoma de México, Universidad de Colima
De la Calle, L. (2002): China en la OMC: espejo para México, in: Foreign Affairs en Español 3, 152–161
De León, C. A. / Á. R. Loyola (2005): Índices de términos de intercambio en El Salvador: 1995–2004, San Salvador: Banco Central de Reserva de El Salvador (Documentos Ocasionales 2005-02)
Diakosavvas, D. / P. Scandizzo (1991): Trends in the terms of trade of primary commodities: 1900–1982: the controversy and its origins, in: Economic De-velopment and Cultural Change 39 (2), 231–264
Domínguez, J. (2006): China’s relations with Latin America: shared gains and asymmetric hopes, Washington, DC: Inter-American Dialogue (Working Pa-per)
Dussel Peters, E. (1999): La subcontratación como proceso de aprendizaje: el caso de la electrónica en Jalisco (México) en la década de los noventa, in: Desar-rollo Productivo 55, 1–69
– (2000): Polarizing Mexico: the impact of liberalization strategy, Boulder, Colo.: Lynne Rienner Publishers
– (2001): Un análisis de la competitividad de las exportaciones de prendas de vestir de Centroamérica utilizando los programas y la metodología CAN y MAGIC, Santiago de Chile: CEPAL (Estudios y Perspectivas 1), 1–57
– (2005a): Economic opportunities and challenges posed by China for Mexico and Central America, Bonn: Deutsches Institut für Entwicklungspolitik, (Studies 8)
– (2005b): El caso de las estadísticas comerciales entre China y México: para empezar a sobrellevar el desconocimiento bilateral, in: Economía Informa 335, 50–61
Enrique Dussel Peters
DIE − UNAM / CECHIMEX 382
– (ed.) (2007a): Monitor de la Manufactura Mexicana 3 (6); online: http://www.dusselpeters.com/monitor6.pdf
– (ed.) (2007b): Oportunidades en la relación económica y comercial entre China y México, Mexico-City: CEPAL, Cámara de Senadores, SRE, CECHIMEX-UNAM
– (ed.) (2008a): The Mexico-China economic relationship in electronics: a case study of the PC industry in Jalisco: part of the ESRC-funded project “The Impacts of China’s Global Expansion on Latin America”, Mexico-City: Centro de Estudios China-México/UNAM, mimeo
– (2008b): Los costos de transporte de las exportaciones Mexicanas, Washington, DC: Inter-American Development Bank, mimeo
– (ed.) (2009): Monitor de la Manufactura Mexicana 5 (7); online: http://www. dusselpeters.com/monitor6.pdf
Dussel Peters, E. (s. a.): The Mexico-China economic relationship in electronics: a case study of the PC industry in Jalisco, Bonn: Deutsches Institut für Entwicklungspolitik (Discussion Paper), forthcoming
Dussel Peters, E. / L. M. Galindo / E. Loría (eds.) (2003): Condiciones y efectos de la inversión extranjera directa y del proceso de integración regional en México: durante los noventa. una perspectiva macro: meso y micro, México-City: Facultad de Economía/UNAM, Inter-American Development Bank
ECLAC (Economic Commission for Latin America and the Caribbean) (2004): Oportunidades y retos económicos de China para Mexico y America Latina, Mexico-City (LC/MEX/L633)
– (2007): Anuario estadístico de América Latina y el Caribe 2006, Santiago de Chile
Fajnzylber, P. / W. F. Maloney (2000): Labor Demand and Trade Reform in Latin America, Washington, DC: World Bank (Policy Research Working Paper 2491)
Feenstra, R. / H. L. Kee (2007): Trade liberalisation and export variety: a compari-son of Mexico and China, in: The World Economy 30 (1), 5–21
Finger, M. / M. E. M. Kreinin (1979): A measure of export-similarity and its pos-sible uses, in: Economic Journal 89 (356), 905–912
GAN (Grupo de Alto Nivel China-México) (2005): Notas de la primera reunión del grupo de trabajo de alto nivel, 24 Jan. 2005
Garza, C. (2005): El ambiente de negocios en la República Popular China, in: Economía Informa (Mexico) 335, 24–30
Gómez Cavazos, I. (2005): Condiciones y potencial de las relaciones México-Republica Popular China, in: Economía Informa (Mexico) 335, 5–10
The Mexican Case
DIE − UNAM / CECHIMEX 383
Gómez Izquierdo J. J. (1992): El movimiento antichino en México (1871-1934), Mexico-City: Instituto Nacional de Antropología e Historia
González García, J. (2003): China: reforma económica y apertura externa: transformación, efectos y desfios: un enfoque neoinstitucional, Mexico City: Miguel Angel Porrúa, El Colegio de México and Cámara de Senadores
Greenaway, D. / R. C. Hine / P. Wright (1998): An empirical assessment of the impact of trade on employment in the United Kingdom, Nottingham: School of Economics, University of Nottingham, Center for Research on Globalisa-tion and Labour Markets
IDB (Inter-American Development Bank) (2005): The emergence of China: oppor-tunities and challenges for Latin America and the Caribbean, Washington, DC
IMF (International Monetary Fund) (2006): Mexico: selected issues, Washington, DC (Country Report 06/351)
INEGI (Instituto Nacional de Estadística, Geografía e Informática) (2007): Several documents; online: http://www.inegi.gob.mx/inegi/default.aspx
Kaplinsky, R. (2006): Revisiting revisited terms of trade: will China make a differ-ence? in: World Development 34 (6), 981–995
Kaplinsky, R. / A. U. Santos-Paulino (2005): Innovation and competitiveness: trends in unit prices in global trade, in: Oxford Development Studies 33 (3–4), 333–355
– (2006): A disaggregated analysis of EU imports: implications for the study of patterns of trade and technology, in: Cambridge Journal of Economics 30 (4), 587–611
Lall, S. / J. Weiss (2005): China’s competitive threat to Latin America: an analysis for 1990–2002, Oxford: Oxford University, Oxford Department of Interna-tional Development (Queen Elizabeth House) (QEH Working Paper 120)
León, A. / E. Dussel Peters (2006): El comercio intraindustrial de México: tendencias generales y con los Estados Unidos y China (1990–2004), Dallas, Tex.: Federal Reserve Bank of Dallas
León, J. / R. Soto (1995): Structural trends and long-run trends in commodity price, Washington, DC: World Bank (Policy Research Working Paper 1406), 1–35
López, E. / A. Micco / D. Molina (2005): How sensitive are Latin American exports to Chinese competition in the US-Market? mimeo
Luna Martinez S. A. (2003): Mexico-US integration and the export competition from China: presentation at University of Michigan Conference “US Eco-nomic Forecast and Consumer Outlook for 2004”, mimeo
Mahoney, M. et al. (2006): Spurring growth dynamics from services offshoring, New York: Schwartz Center for Economic Policy Analysis, New School for Social Research (Policy note), 1–11

Enrique Dussel Peters
DIE − UNAM / CECHIMEX 384
Maizels, A. (2000): The manufacturers terms of trade of developing countries with the United States: 1981–1997, Oxford: Oxford Department of International Development (Queen Elizabeth House) (QEH Working Paper 36)
Moreno-Brid, J. C. / E. Pérez / P. Ruiz (2004): El Consenso de Washington: aciertos, errores y omisiones, in: Perfiles Latinoamericanos 24, 149–168
Morgenstern, I. B. von / X. Xia (2006): China’s high-tech market: a race to the middle, in: The McKinsey Quarterly (September 2006)
Navarrete, J. E. (2007): China: la tercera inflexion: del crecimiento acelerado al desarrollo sustentable, Mexico-City: Universidad Nacional Autonóma de México
Ocampo, J. A. / M. A. Parra (2003): The terms of trade of commodities in the twentieth century, in: CEPAL Review 79, 7–35
Oropeza, A. (2006): China: entre el reto y la oportunidad, Mexico-City: Universidad Nacional Autonóma de México
PEF (Poder Ejecutivo Federal) (2007): Informe presidencial: anexo estadístico, Mexico-City
Pescador Castañeda, A. (2004): China, un nuevo reto para la política exterior Mexicana del siglo XXI, in: Instituto Matías Romero/SRE, Los retos para la política exterior de México en la actual coyuntura, Mexico-City: Instituto Matías Romero/SRE
Richardson, H. (1978): The state of regional economics: a survey article, in: Inter-national Regional Science Review 3 (1), 1–48
Ros, J. (2007): La desaceleración del crecimiento económico desde 1982, mimeo SE (Secretaría de Economía) (2005): Inversión de China en México, Mexico-City:
Plaza y Janés – (2004): Una agenda comercial para el largo plazo, in: Foreign Affairs en
Español 4 (1), 2–16 Sarkar, P. (2001): The North-South terms of trade debate: a re-examination, in:
Progress in Development Studies 1 (4), 309–327 Sarkar, P. / H. Singer (1991): Manufactured exports of developing countries and
their terms of trade since 1965, in: World Development 19 (4), 1617–1620 Sojo, E. (2005): De la alternancia al desarrollo: políticas públicas del gobierno del
cambio, Mexico-City: Fondo de Cultura Económica Torres, L. D. (2006): La hipótesis Prebisch-Singer y el debate estadístico de los
términos de intercambio, México-City: Tesis de Licenciatura de Facultad de Economía/UNAM
Trápaga, Y. / E. Dussel Peters (2007): China y México: implicaciones de una nueva relación, Mexico-City: La Jornada, ITESM,CECHIMEX-UNAM

The Mexican Case
DIE − UNAM / CECHIMEX 385
USGAO (United States General Accounting Office) (2004): U.S. customs and border protection faces challenges in addressing illegal textile transshipment, Washington, DC
USITC (United States International Trade Commission) (s. a.): Import and export data: several years, Washington, DC
Villalobos, A. (2007): La relación comercial China-México, in: E. Dussel Peters (ed.), Oportunidades en la relación económica y comercial entre China y México, Mexico-City: CEPAL, Cámara de Senadores, SRE, CECHIMEX-UNAM, 113–124
Villarreal, R. / R. Villeda (2006): El secreto de China: estrategia de competitividad, Mexico City: Ediciones Ruz
Watkins, R. (2002): Mexico versus China: factors affecting exports and investment competition, in: Industry, Trade and Technology Review, July, 11–26
– (2007): El reto de China para la manufactura Mexicana, in: E. Dussel Peters (ed.), Oportunidades en la relación económica y comercial entre China y México, Mexico-City: CEPAL, Cámara de Senadores, SRE, CECHIMEX-UNAM, 137–163
World Bank (2007): World Development Indicators 2008, Washington, DC Zaga, R. (2007). Oportunidades en la relación económica y comercial entre China
y México y su contexto Latinoamericano: la cadena fibra-textil-confección, in: E. Dussel Peters (ed.), Oportunidades en la relación económica y comercial entre China y México, Mexico-City: CEPAL, Cámara de Senadores, SRE, CECHIMEX-UNAM, 339–352
Zheng, Z. / Y. Zhao (2002): China’s terms of trade in manufactures, Geneva: UNCTAD (Discussion Papers 161)
Zhong, X. / X. Yang (2007): Science & technology policy reform and its impact on China’s national innovation system, in: Technology in Society 29 (3), 317–325


ANNEX

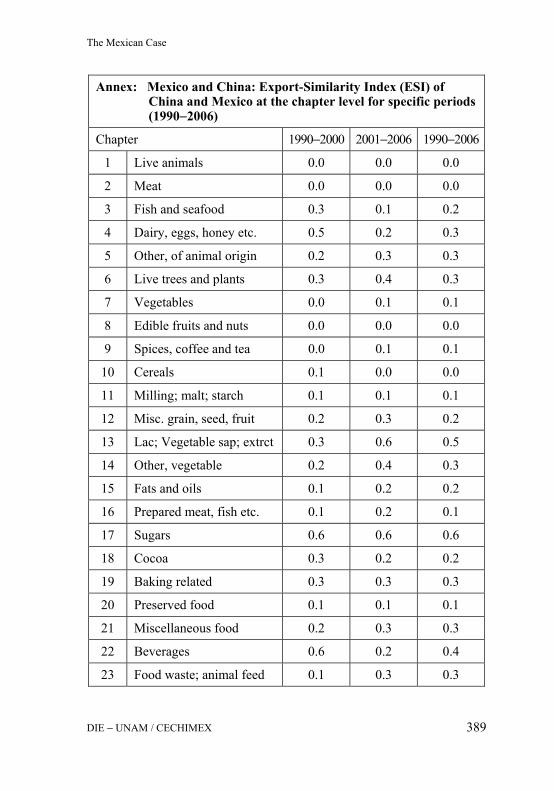
The Mexican Case
DIE − UNAM / CECHIMEX 389
Annex: Mexico and China: Export-Similarity Index (ESI) of China and Mexico at the chapter level for specific periods (1990−2006)
Chapter 1990−2000 2001−2006 1990−2006
1 Live animals 0.0 0.0 0.0
2 Meat 0.0 0.0 0.0
3 Fish and seafood 0.3 0.1 0.2
4 Dairy, eggs, honey etc. 0.5 0.2 0.3
5 Other, of animal origin 0.2 0.3 0.3
6 Live trees and plants 0.3 0.4 0.3
7 Vegetables 0.0 0.1 0.1
8 Edible fruits and nuts 0.0 0.0 0.0
9 Spices, coffee and tea 0.0 0.1 0.1
10 Cereals 0.1 0.0 0.0
11 Milling; malt; starch 0.1 0.1 0.1
12 Misc. grain, seed, fruit 0.2 0.3 0.2
13 Lac; Vegetable sap; extrct 0.3 0.6 0.5
14 Other, vegetable 0.2 0.4 0.3
15 Fats and oils 0.1 0.2 0.2
16 Prepared meat, fish etc. 0.1 0.2 0.1
17 Sugars 0.6 0.6 0.6
18 Cocoa 0.3 0.2 0.2
19 Baking related 0.3 0.3 0.3
20 Preserved food 0.1 0.1 0.1
21 Miscellaneous food 0.2 0.3 0.3
22 Beverages 0.6 0.2 0.4
23 Food waste; animal feed 0.1 0.3 0.3

Enrique Dussel Peters
DIE − UNAM / CECHIMEX 390
Annex (cont.): Mexico and China: Export-Similarity Index (ESI) of China and Mexico at the chapter level for spe-cific periods (1990−2006)
24 Tobacco 0.1 0.1 0.1
25 Salt; sulfur, earth, stone 0.2 0.3 0.3
26 Ores, slag, ash 0.1 0.0 0.1
27 Mineral fuel, oil, etc. 0.4 0.3 0.3
28 Inorg. Chem.; rare earth mt 0.1 0.2 0.1
29 Organic chemicals 0.1 0.1 0.1
30 Pharmaceutical products 0.1 0.1 0.1
31 Fertilizers 0.7 0.1 0.6
32 Tanning, dye, paint, putty 0.3 0.4 0.4
33 Perfume ind., cosmetic, etc. 0.4 0.4 0.4
34 Soap, wax, etc.; dental prep. 0.2 0.3 0.3
35 Albumens; mod starch; glue 0.4 0.5 0.5
36 Explosives 0.0 0.0 0.0
37 Photographic/Cinematogr. 0.2 0.4 0.3
38 Misc. chemical products 0.1 0.2 0.0
39 Plastic 0.4 0.4 0.4
40 Rubber 0.4 0.3 0.4
41 Hides and skins 0.2 0.1 0.1
42 Leather art; saddlry, bags 0.3 0.4 0.4
43 Fur skin and artificial fur 0.2 0.2 0.2
44 Wood 0.3 0.3 0.3
45 Cork 0.5 0.7 0.6
46 Straw, Esparto 0.4 0.3 0.4
47 Woodpulp etc. 0.0 0.0 0.1
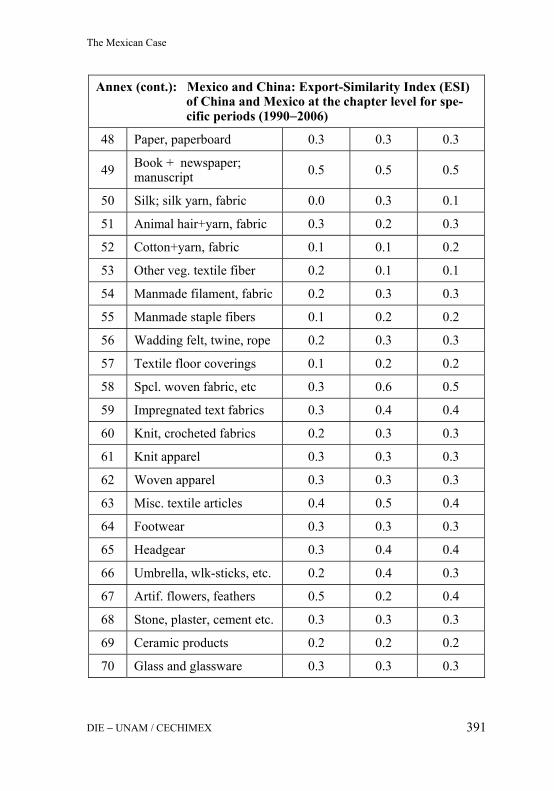
The Mexican Case
DIE − UNAM / CECHIMEX 391
Annex (cont.): Mexico and China: Export-Similarity Index (ESI) of China and Mexico at the chapter level for spe-cific periods (1990−2006)
48 Paper, paperboard 0.3 0.3 0.3
49 Book + newspaper; manuscript 0.5 0.5 0.5
50 Silk; silk yarn, fabric 0.0 0.3 0.1
51 Animal hair+yarn, fabric 0.3 0.2 0.3
52 Cotton+yarn, fabric 0.1 0.1 0.2
53 Other veg. textile fiber 0.2 0.1 0.1
54 Manmade filament, fabric 0.2 0.3 0.3
55 Manmade staple fibers 0.1 0.2 0.2
56 Wadding felt, twine, rope 0.2 0.3 0.3
57 Textile floor coverings 0.1 0.2 0.2
58 Spcl. woven fabric, etc 0.3 0.6 0.5
59 Impregnated text fabrics 0.3 0.4 0.4
60 Knit, crocheted fabrics 0.2 0.3 0.3
61 Knit apparel 0.3 0.3 0.3
62 Woven apparel 0.3 0.3 0.3
63 Misc. textile articles 0.4 0.5 0.4
64 Footwear 0.3 0.3 0.3
65 Headgear 0.3 0.4 0.4
66 Umbrella, wlk-sticks, etc. 0.2 0.4 0.3
67 Artif. flowers, feathers 0.5 0.2 0.4
68 Stone, plaster, cement etc. 0.3 0.3 0.3
69 Ceramic products 0.2 0.2 0.2
70 Glass and glassware 0.3 0.3 0.3

Enrique Dussel Peters
DIE − UNAM / CECHIMEX 392
Annex (cont.): Mexico and China: Export-Similarity Index (ESI) of China and Mexico at the chapter level for spe-cific periods (1990−2006)
71 Precious stones, metals 0.3 0.3 0.3
72 Iron and steel 0.2 0.2 0.3
73 Iron/steel products 0.3 0.3 0.3
74 Copper and articles thereof 0.1 0.3 0.3
75 Nickel and articles thereof 0.3 0.4 0.4
76 Aluminum 0.4 0.5 0.5
78 Lead 0.4 0.8 0.7
79 Zinc and articles thereof 0.6 0.3 0.4
80 Tin and articles thereof 0.8 0.3 0.7
81 Other base metals etc. 0.2 0.2 0.2
82 Tools, cutlry, of base mtls. 0.3 0.3 0.3
83 Misc. art. of base metal 0.3 0.3 0.3
84 Machinery 0.4 0.4 0.4
85 Electrical machinery 0.3 0.3 0.3
86 Railway; trf. sign eq. 0.4 0.5 0.5
87 Vehicles, not railway 0.1 0.2 0.1
88 Aircraft, spacecraft 0.1 0.4 0.3
89 Ships and boats 0.2 0.1 0.1
90 Optic, nt 8544; med. instr. 0.2 0.2 0.2
91 Clocks and watches 0.1 0.1 0.1
92 Musical instruments 0.2 0.4 0.3
93 Arms and ammunition 0.1 0.3 0.2
94 Furniture and bedding 0.3 0.3 0.3
95 Toys and sports equipment 0.4 0.5 0.5

The Mexican Case
DIE − UNAM / CECHIMEX 393
Annex (cont.): Mexico and China: Export-Similarity Index (ESI) of China and Mexico at the chapter level for spe-cific periods (1990−2006)
96 Miscellaneous manufact. 0.4 0.6 0.5
97 Art and antiques 0.3 0.4 0.3
98 Special Other 0.5 0.5 0.5
99 O Specl. Impr. Provisions 1.0 1.0 1.0
Source: Author, based on information from USITC (s. a.)


On the Authors
DIE − UNAM / CECHIMEX 395
On the Authors
Jonathan Barton is Senior Lecturer in the Institute of Urban and Re-gional Studies, Pontificia Universidad Católica de Chile and has been a consultant to UN ECLAC, UNCTAD, UNIDO and the UK Department for International Development. He also holds the positions of Senior Research Fellow in the School of Development Studies, University of East Anglia, and International Associate of the Victoria Institute for Links with Latin America (VILLA, Wellington). He received a BA (Hons) in Geography from the University of Wales, a Masters degree in Latin American Studies and a PhD in Economic History, both from the University of Liverpool. Current research interests lie in three fields. One of these is the praxis of urban and regional sustainability in terms of concepts and scenarios, stra-tegic planning, and monitoring and evaluation. Another is environmental governance. The third is trade and sustainable development with particular interest in the local impact of global networks and the role of regions in the ‘resource periphery’ in global processes. Publications relating to this field of trade and sustainable development include articles in The Geo-graphical Journal, Area, Tijdschrift voor Economische en Sociale Geografie, Asia Pacific Viewpoint, Singapore Journal of Tropical Geog-raphy and Comercio Exterior, and chapters in Jenkins et al. Industry and Environment in Latin America (London, 1999) and Jenkins et al. (2002) Environmental Regulation in the New Global Economy. He is on the edito-rial or advisory boards of the journals Environmental Policy and Govern-ance, Latin American Journal of Urban and Regional Studies (EURE), Asia Pacific Viewpoint, and International Development Planning Review.
Enrique Dussel Peters is Professor at the Graduate School of Economics, Universidad Nacional Autónoma de México (UNAM) since 1993. He acts as a consultant for several Mexican and international institutions. He earned his B.A. and M.A. in Political Science at the Free University of Berlin, and his Ph.D. in Economics at the University of Notre Dame. His topics of research include: economic development, political economy, industrial organization and trade theory, NAFTA and CAFTA, evolution of industrial, trade and regional patterns in Latin America and Mexico. He was Coordinator of the Area of Political Economy at the Graduate School of Economics, UNAM (2004-2008) and is now the Coordinator of the Center for Chinese-Mexican Studies at the National Autonomous Univer-

DIE − UNAM / CECHIMEX 396
sity of Mexico (since 2006). Publications include Polarizing Mexico: The Impact of Liberalization Strategy (Boulder/Colorado: Lynne Rienner Pub-lishers, 2000); with assistance from Liu Xue Dong. Economic Opportuni-ties and Challenges Posed by China for Mexico and Central America, German Development Institute (Bonn, 2005); with Yolanda Trápaga Delfín. China y México: implicaciones de una nueva relación (México, 2007); Oportunidades en la relación económica y comercial entre China y México (México, 2007); with Michael Mortimore, Luis Miguel Galindo Paliza and Eduardo Loría. Inversión extranjera directa en México: desem-peño y potencial (México, 2007) (http://www.economia.unam.mx/cechimex/), http://dusselpeters.com and [email protected]
Rhys Jenkins is Professor of Development Economics in the School of Development Studies, University of East Anglia in Norwich, England. His main area of interest is the dynamics of globalization and its impact on developing countries. He has directed research projects on globalization and poverty and on the effects of environmental regulation on the location of industry and has also written extensively on transnational corporations and issues of corporate social responsibility. He has more than thirty years of research experience in Latin America as well as having carried out research in East Asia and South Africa. He is the author of several books including Transnational Corporations and Industrial Transformation in Latin America, Transnational Corporations and the Latin American Automotive Industry and Transnational Corporations and Uneven Devel-opment and edited volumes on Industry and Environment in Latin America and Corporate Responsibility and Labour Rights. He has acted as a con-sultant for UNCTAD, UNIDO, UNRISD and the UK Department for International Development. He is currently directing a research project on The Impact of China’s Global Expansion on Latin America, funded by the ESRC’s World Economy and Finance Research Programme.
Andrés López holds a Ph.D. in Economics from the University of Buenos Aires and is Director of the Centro de Investigaciones para la Transforma-ción (CENIT). He is Full Professor of Development Economics at the University of Buenos Aires (UBA). He has been consultant for different international organizations such as UNCTAD, ECLAC, WIPO, UNDP, IADB and others. He is author of several studies on foreign investment, innovation and industrial economics.
On the Authors
DIE − UNAM / CECHIMEX 397
Daniela Ramos has a Masters in Economics from the Instituto Torcuato Di Tella (UTDT) and a Degree in Economics from the Universidad de Buenos Aires (UBA). She is principal researcher at the Centro de Investi-gaciones para la Transformación (CENIT) and Professor of Argentine Economic Structure at the University of Buenos Aires (UBA). She special-izes in trade and industrial economics and has authored several studies on foreign trade and investment.
Ricardo Rozemberg has a Bachelor’s degree in Economics from the University of Buenos Aires and a Masters in Economy and Public Policies, Universidad Di Tella. Since January 2007, he is the Strategy and Invest-ment Environment Manager of Argentina’s Investment Development Agency. Previously, he managed the Center of Production Studies of the Ministry of Economy, the Investment Agency of the Office of the Secre-tary of Industry, and the International Economy Center of the Ministry of Foreign Affairs. In the private sector, he worked as an external consultant to several national and international organizations (IDB, World Bank, OAS, ILO). He is the Professor of the World Markets Module of the Mas-ter’s Program in Business Management of Foreign Trade and Integration, School of Economy (University of Buenos Aires) and visiting Professor at the Master’s Program in International Businesses, University of Guayaquil, Ecuador. In addition, he lectures at the Institute of Interna-tional Commerce, Standard Bank Foundation. He is a member of the The-sis Examining Board at the following universities: General San Martín, Di Tella, San Andrés, CEMA and FLACSO. He is a member of the Academic Board of Fundación ExportAr. He has authored several works and studies on foreign trade, investment, international negotiations and MERCOSUR. He has been a speaker at several national, regional and international fo-rums. He has publications in Argentina, Brazil, Belgium, Mexico, Canada and the USA.
Daniel Saslavsky is Coordinator of the International Economics Pro-gramme at CIPPEC (Center for the Implementation of Public Policies Promoting Equity and Growth). As an economist specialized in interna-tional trade and development, he has worked for a number of International Organizations such as The World Bank, Inter-American Development Bank, Corporación Andina de Fomento (CAF) and UNDP.
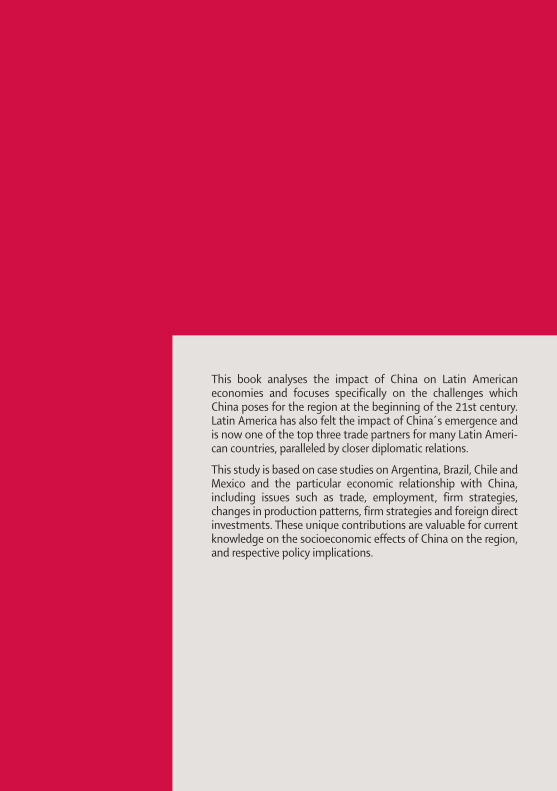
China and Latin America
Economic relations in the twenty-first century
Rhys Jenkins / Enrique Dussel Peters (Editors)
Studies49
This book analyses the impact of China on Latin Americaneconomies and focuses specifically on the challenges whichChina poses for the region at the beginning of the 21st century.Latin America has also felt the impact of China´s emergence andis now one of the top three trade partners for many Latin Ameri-can countries, paralleled by closer diplomatic relations.
This study is based on case studies on Argentina, Brazil, Chile andMexico and the particular economic relationship with China,including issues such as trade, employment, firm strategies,changes in production patterns, firm strategies and foreign directinvestments. These unique contributions are valuable for currentknowledge on the socioeconomic effects of China on the region,and respective policy implications.
ChinaandLatinAmerica
Econom
icrelationsinthetwenty-firstcentury
RhysJenkins/Enrique
DusselPeters(eds.)