Embed Size (px)
Citation preview

Durham Research Online
Deposited in DRO:
05 September 2013
Version of attached file:
Published Version
Peer-review status of attached file:
Peer-reviewed
Citation for published item:
Lehmer, B.D. and Brandt, W.N. and Alexander, D.M. and Bell, E.F. and Hornschemeier, A.E. and McIntosh,D.H. and Bauer, F.E. and Gilli, R. and Mainieri, V. and Schneider, D.P. and Silverman, J.D. and Steffen, A.T.and Tozzi, P. and Wolf, C. (2008) ’Tracing the mass-dependent star formation history of late-type galaxiesusing X-ray emission : results from the Chandra Deep Fields.’, Astrophysical journal., 681 (2). pp. 1163-1182.
Further information on publisher’s website:
http://dx.doi.org/10.1086/588459
Publisher’s copyright statement:
Credit: Lehmer, B.D. and Brandt, W.N. and Alexander, D.M. and Bell, E.F. and Hornschemeier, A.E. and McIntosh,D.H. and Bauer, F.E. and Gilli, R. and Mainieri, V. and Schneider, D.P. and Silverman, J.D. and Steffen, A.T. andTozzi, P. and Wolf, C., AA, 681, 1163-1182, 2008, reproduced with permission, ESO.
Use policy
The full-text may be used and/or reproduced, and given to third parties in any format or medium, without prior permission or charge, forpersonal research or study, educational, or not-for-profit purposes provided that:
• a full bibliographic reference is made to the original source
• a link is made to the metadata record in DRO
• the full-text is not changed in any way
The full-text must not be sold in any format or medium without the formal permission of the copyright holders.
Please consult the full DRO policy for further details.
Durham University Library, Stockton Road, Durham DH1 3LY, United KingdomTel : +44 (0)191 334 3042 — Fax : +44 (0)191 334 2971
http://dro.dur.ac.uk

TRACING THE MASS-DEPENDENT STAR FORMATION HISTORY OF LATE-TYPE GALAXIESUSING X-RAY EMISSION: RESULTS FROM THE CHANDRA DEEP FIELDS
B. D. Lehmer,1,2
W. N. Brandt,1D. M. Alexander,
2E. F. Bell,
3A. E. Hornschemeier,
4D. H. McIntosh,
5F. E. Bauer,
6
R. Gilli,7V. Mainieri,
8,9D. P. Schneider,
1J. D. Silverman,
9,10A. T. Steffen,
1P. Tozzi,
7and C. Wolf
11
Received 2007 December 3; accepted 2008 March 10
ABSTRACT
We report on the X-ray evolution over the last�9 Gyr of cosmic history (i.e., since z ¼ 1:4) of late-type galaxypopulations in the Chandra Deep FieldYNorth and Extended Chandra Deep FieldYSouth (CDF-N and E-CDF-S,respectively; jointly CDFs) survey fields. Our late-type galaxy sample consists of 2568 galaxies, which were iden-tified using rest-frame optical colors andHSTmorphologies. We utilized X-ray stacking analyses to investigate theX-ray emission from these galaxies, emphasizing the contributions from normal galaxies that are not dominatedby active galactic nuclei (AGNs). Over this redshift range, we find significant increases (factors of �5Y10) in theX-rayYtoYoptical mean luminosity ratio (LX/LB) and the X-rayYtoYstellar mass mean ratio (LX/M?) for galaxypopulations selected by LB andM?, respectively. When analyzing galaxy samples selected via SFR, we find that themean X-rayYtoYSFR ratio (LX/SFR) is consistent with being constant over the entire redshift range for galaxieswith SFR = 1Y100 M� yr�1, thus demonstrating that X-ray emission can be used as a robust indicator of star for-mation activity out to z � 1:4.We find that the star formation activity (as traced by X-ray luminosity) per unit stellarmass in a given redshift bin increases with decreasing stellar mass over the redshift range z = 0.2Y1, which isconsistent with previous studies of how star formation activity depends on stellar mass. Finally, we extend our X-rayanalyses to Lyman break galaxies at z � 3 and estimate that LX/LB at z � 3 is similar to its value at z ¼ 1:4.
Subject headinggs: cosmology: observations — galaxies: active — galaxies: general — galaxies: spiral —stars: formation — surveys — X-rays: galaxies — X-rays: general
Online material: machine-readable tables
1. INTRODUCTION
Investigations focusing on global changes in star formationactivity and stellar-mass build-up in field galaxies have providedsignificant insight into the physical evolution of galaxies and theirconstituent stellar populations. It has now been well establishedthat the global star formation rate density has declined by roughlyan order of magnitude since z � 1Y1:5 (e.g., Lilly et al. 1996;Madau et al. 1996; Steidel et al. 1999; Hopkins 2004; Perez-Gonzalez et al. 2005; Schiminovich et al. 2005; Colbert et al.2006). Recent investigations into the details of this evolutionhave shown that the star formation history of a given galaxy de-pends strongly on its stellar mass (e.g., Cowie et al. 1996; Juneauet al. 2005; Bundy et al. 2006; Noeske et al. 2007a, 2007b; Zheng
et al. 2007); the peak star formation epoch for the most massivegalaxies occurred earlier in cosmic history than it did for galaxieswith lower masses.
X-ray studies of normal late-type galaxies (i.e., those that arenot dominated by luminous active galactic nuclei [AGNs]) haveshown that X-ray emission provides a useful, relatively un-obscured measure of star formation activity (e.g., Bauer et al.2002a; Cohen 2003; Ranalli et al. 2003; Colbert et al. 2004;Grimm et al. 2003; Gilfanov et al. 2004a; Persic et al. 2004; Persic& Rephaeli 2007; however, see Barger et al. 2007). In normalgalaxies, X-ray emission originates from X-ray binaries, super-novae, supernova remnants, hot (�0.2Y1 keV) interstellar gas,andO stars (see, e.g., Fabbiano 1989, 2006 for reviews). SensitiveChandra and XMM-Newton studies of local late-type galaxieshave shown that high-mass X-ray binaries (HMXBs) and low-mass X-ray binaries (LMXBs) typically dominate the total non-nuclear X-ray power output (e.g., Zezas et al. 2002; Bauer et al.2003; Soria &Wu 2003; Swartz et al. 2003; Jenkins et al. 2005;Kilgard et al. 2005; however, see, e.g., Doane et al. 2004). Obser-vations indicate that the integrated X-ray emission from HMXBandLMXBpopulations trace galaxy star formation rate (SFR) andstellar mass (M?), respectively. For example, using Chandra ob-servations of 32 local galaxies, Colbert et al. (2004) found thatthe summed 0.3Y8 keV nonnuclear point-source emission from agiven galaxy (LXP) can be approximated as LXP � �M? + � SFR,where� and � are constants. Therefore, galaxies having relativelyhigh star formation rates per unit mass (specific star formationrates, SSFRs) generally have dominant X-ray point-source con-tributions from HMXBs (e.g., late-type star-forming galaxies),while thosewith relatively lowSSFRs have point-source emissionprimarily from LMXBs (e.g., massive early-type galaxies).
If the X-ray binary populations are similarly dominating thenormal-galaxy X-ray power output over a significant fraction of
A
1 Department of Astronomy and Astrophysics, 525 Davey Lab, PennsylvaniaState University, University Park, PA 16802.
2 Department of Physics, University of Durham, South Road, DurhamDH13LE, UK.
3 Max-Planck-Institut fur Astronomie, Konigstuhl 17, D-69117 Heidelberg,Germany.
4 Laboratory for X-Ray Astrophysics, NASA Goddard Space Flight Center,Code 662, Greenbelt, MD 20771.
5 Astronomy Department, University of Massachusetts, 710 North PleasantStreet, Amherst, MA 01007.
6 Columbia Astrophysics Laboratory, Columbia University, Pupin Laborato-ries, 550 West 120th Street, Room 1418, New York, NY 10027.
7 Istituto Nazionale di Astrofisica (INAF)YOsservatorio Astrofisico di Arcetri,Largo E. Fermi 5, 50125 Firenze, Italy.
8 European Southern Observatory, Karl-Schwarschild-Strasse 2, D-85748Garching, Germany.
9 Max-Planck-Institut fur extraterrestrische Physik, Giessenbachstrasse,D-85748 Garching bei Munchen, Germany.
10 Institute of Astronomy, Department of Physics, Eidgenossische Technische-Hochschule, ETH Zurich, CH-8093, Switzerland.
11 Department of Physics, University of Oxford, Keble Road, Oxford OX13RH, UK.
1163
The Astrophysical Journal, 681:1163Y1182, 2008 July 10
# 2008. The American Astronomical Society. All rights reserved. Printed in U.S.A.

cosmic time, then there should be a rapid increase in the globallyaveraged X-ray luminosity of normal star-forming galaxies withcosmic look-back time in response to the increasing global starformation rate density (e.g., Ghosh & White 2001). In this sce-nario, HMXBs trace the immediate star formation rate of a galaxyandLMXBs trace its star formation historywith a lag of a fewGyr.With the advent of deepChandra andXMM-Newton surveys (see,e.g., Brandt&Hasinger 2005 for a review), it has become possibleto study the X-ray properties of normal galaxies out to z k 1 andz � 0:3, respectively (see, e.g., Hornschemeier et al. 2000, 2003;Alexander et al. 2002; Georgakakis et al. 2007; Georgantopouloset al. 2005; Lehmer et al. 2006, 2007; Kim et al. 2006; Tzanavariset al. 2006; Rosa-Gonzalez et al. 2007). Evidence for a globalincrease in the X-ray activity with redshift for normal late-typegalaxies has since been mounting. Studies of the X-ray lumi-nosity functions of X-rayYdetected normal galaxies have foundthat L�X evolves as (1þ z)1:5Y3 over the redshift range z � 0Y1:4 (e.g., Norman et al. 2004; Ptak et al. 2007; Tzanavaris &Georgantopoulus 2008). In addition, X-ray stacking analyseshave enabled investigations of more representative opticallyselected galaxy populations over the majority of cosmic history(z � 0:1Y4; e.g., Brandt et al. 2001; Hornschemeier et al. 2002;Nandra et al. 2002; Georgakakis et al. 2003; Reddy & Steidel2004; Laird et al. 2005, 2006; Lehmer et al. 2005a). These studieshave found that the averageX-ray luminosities of normal late-typegalaxies increases with redshift out to z � 1:4Y3. For example,using a�1 Ms exposure of a subregion within the Chandra DeepFieldYNorth, Hornschemeier et al. (2002, hereafter H02) tenta-tively observed a factor of �2Y3 increase in LX/LB from z ¼ 0to 1.4 for L�B galaxies. Despite these promising initial constraints,the details of the X-ray evolution of normal late-type galaxy pop-ulations, including dependences on the physical properties ofgalaxies (e.g., optical luminosity, stellar mass, environment,and star formation rate), have remained unexplored.
In this paper, we aim to improve significantly on constraints forthe X-ray evolution of normal late-type galaxies (e.g., H02). Westudy for the first time how the X-ray properties of late-type fieldgalaxies evolve as a function of optical luminosity, stellar mass,and star formation rate over the redshift range of z ¼ 0Y1:4. Weconstruct late-type galaxy samples located in two of the mostwell-studied extragalactic X-ray survey fields, the�2Ms ChandraDeep FieldYNorth (CDF-N; Alexander et al. 2003) and theExtended Chandra Deep FieldYSouth (E-CDF-S), which is com-posed of the central �1 Ms Chandra Deep FieldYSouth (CDF-S;Giacconi et al. 2002) and four flanking �250 ks Chandra ob-servations (Lehmer et al. 2005b). These Chandra Deep Fields(CDFs) reach 0.5Y2 keV detection limits of �2.5 ; 10�17 ergscm�2 s�1 in the most sensitive regions and P3 ; 10�16 ergs cm�2
s�1 over the majority of the CDFs; these levels are sufficient todetect moderately powerful X-ray sources (L0:5Y2 keV k1041:5 ergss�1) at z ¼ 1:4 and z ¼ 0:6, respectively. Therefore, the CDFscomprise an unprecedented data set for effectively studying theX-ray emission and evolution of cosmologically distant normalgalaxies with minimal contamination from powerful AGNs.
The Galactic column densities are 1:3 ; 1020 cm�2 for theCDF-N (Lockman 2004) and 8:8 ; 1019 cm�2 for the E-CDF-S(Stark et al. 1992). All of the X-ray fluxes and luminosities quotedthroughout this paper have been corrected for Galactic absorption.Unless stated otherwise, we quote optical magnitudes based onthe AB magnitude system for HST photometry and the Vegamagnitude system everywhere else. In the X-ray band, we makeuse of three standard bandpasses: 0.5Y2 keV (soft band [SB]),2Y8 keV (hard band [HB]), and 0.5Y8 keV (full band [FB]).Throughout this paper, we make estimates of stellar mass and
star formation rates using a Kroupa (2001) initial mass function(IMF); when making comparisons between these estimates andthose quoted in other studies, we have adjusted all values to cor-respond to our adopted IMF.H0 = 70 km s�1 Mpc�1,�M ¼ 0:3,and�� = 0.7 are adopted throughout this paper (e.g., Spergel et al.2003), which imply a look-back time of 7.7 Gyr at z ¼ 1.
2. LATE-TYPE GALAXY SAMPLE SELECTION
We constructed an optically selected sample of late-type gal-axies within the CDFs to use for our subsequent analyses. Werestricted our galaxy selection to regions of the CDFs whereHubble Space Telescope (HST ) observations were available toallow the best possible morphological classifications. TheHSTobservations in the CDFs have been carried out via the Great Ob-servatoriesOriginsDeep Survey (GOODS;Giavalisco et al. 2004a)and Galaxy Evolution from Morphology and SEDs (GEMS;Rix et al. 2004; Caldwell et al. 2005) programs; these surveyscover �90% of the Chandra-observed regions of the CDFs withthe Advanced Camera for Surveys (ACS). In the GOODS andGEMS regions, photometry was available for four (B435, V606,i775, and z850) and two (V606 and z850) ACS passbands, respectively.
2.1. Galaxy Selection Footprint
We began building our sample by selecting all galaxies havingz850 < 23. This initial selection criterion was motivated by (1) theavailability of deep z850-band imaging over all of theCDFs, (2) thefact that the z850 emission probes mass-tracing rest-frame opticallight redward of the 4000 8 break for galaxies at z P 1, whichconstitutes the large majority of our sample, (3) the availabilityof reliable spectroscopic and photometric redshifts (see detailsbelow), and (4) the high multiwavelength detection fractionsfor these sources, which allow us to determine informative rest-frame spectral energy distributions (SEDs). In order to isolatemost effectively distant X-rayYdetected AGNs, we further re-stricted our sample to include only galaxies that were located inthe most sensitive areas of the CDFs where the Chandra point-spread function (PSF) was small. We therefore chose to includesources having optical positions that were within 6.00 of at leastone of the six Chandra aim points in the CDFs;12 the corre-sponding total areal footprint is �0.18 deg2. Futhermore, weremoved obvious Galactic stars that were identified via opti-cal spectral properties or the presence of obvious diffractionspikes in the z850-band images. Under these restrictions, wefound 6905 galaxies.
2.2. Redshifts
We cross-correlated our initial sample of 6905 galaxies withavailable spectroscopic and photometric redshift catalogs (e.g.,Barger et al. 2003; Le Fevre et al. 2004; Szokoly et al. 2004;Wirthet al. 2004; Wolf et al. 2004; Mobasher et al. 2004; Mignoli et al.2005; Vanzella et al. 2005, 2006; Grazian et al. 2006; Ravikumaret al. 2007; J. D. Silverman et al. 2008, in preparation). All gal-axies that did not have spectroscopic redshifts were located in theE-CDF-Swhere highly accurate (median �z/1þ z � 0:02 for gal-axies with z850 < 23) photometric redshifts were available viaCOMBO-17 (Classifying Objects by Medium-Band Observa-tions in 17 Filters; Wolf et al. 2004). In total, 6683 (�97%) of oursources had either spectroscopic or photometric redshifts. Vi-sual inspection of the 222 galaxies in the E-CDF-S without
12 For the CDF aim points, see Tables 1 and A1 of Alexander et al. (2003)for the �2 Ms CDF-N and �1 Ms CDF-S, respectively, as well as Table 1 ofLehmer et al. (2005b) for the �250 ks E-CDF-S.
LEHMER ET AL.1164 Vol. 681
redshifts indicated that these sources were mainly faint gal-axies near bright stars, as well as a handful of sources that weresubgalactic features within relatively nearby galaxies.
Whenever possible, we adopted spectroscopic redshifts asthe most accurate redshifts for our galaxies. Using the redshiftinformation, we filtered our sample to include only sources withz < 1:4 in the �2 Ms CDF-N, z < 1 in the �1 Ms CDF-S, andz < 0:6 in the �250 ks regions of the E-CDF-S; these redshiftlimits represent the largest distances at which we would expect toidentifymoderately luminous (L0:5Y2 keV k 1041:5 ergs s�1) AGNseffectively in each respective field. In total, 3259 galaxies re-mained after filtering our sample based on redshift properties.We used spectroscopic redshifts for 1351 (�41%) galaxies andphotometric redshifts for the remaining 1908 (�59%) galaxies.
2.3. Rest-Frame Color and Morphological Selection
The optical-color distribution for field galaxies has been shownto be bimodal, separating ‘‘red’’ and ‘‘blue’’ galaxy populations(e.g., Strateva et al. 2001; Hogg et al. 2002b; Blanton et al. 2003;Baldry et al. 2004). Studies of the color-magnitude relation fordistant galaxy populations have shown that this color bimodalityis observed to persist out to at least z � 1Y1:5 (see, e.g., Bell et al.2004a; Faber et al. 2007; Labbe et al. 2007), thus providing anexcellent quantifiable means for separating late-type and early-type galaxy populations. We therefore filtered our galaxy sampleto include only sources that had blue rest-frame optical colors, asexpected for late-type galaxies that contain young stellar pop-ulations. To estimate rest-frameU � V colors and absoluteU-,B-,and V-band magnitudes (MU ,MB, andMV , respectively) for eachof the 3259 galaxies in our sample, we utilized the availableoptical /near-IR data.
For the CDF-N, we used the U, B, V, R, I, z0, and HK 0 photo-metric catalogs from Capak et al. (2004), as well as Spitzer IRACimaging (3.6, 4.5, 5.8, and 8.0 �m; Fazio et al. 2004) from theGOODS (M. Dickinson et al., in preparation). For the E-CDF-S,we used (1) the 17-bandpass photometry available throughCOMBO-17, (2) J and Ks imaging from the ESO Imaging Sur-vey (Olsen et al. 2006), (3) J, H, and K from the MUSYC col-laboration (E. N. Taylor et al., in preparation; see alsoMoy et al.2003; Gawiser et al. 2006), and (4) Spitzer IRAC data from theGOODS and SIMPLE teams (M. Dickinson et al., in preparation;P. G. vanDokkum et al., in preparation). Using these data, we con-structed a rest-frame near-UVYtoYnear-IR SED for each galaxy.For these SEDs, the rest-frameU,B, andV filters are well sampledat all relevant redshifts, with the exception of sources at z k 0:7,where the wavelength range of the available data is sparse at rest-frame V band. For sources at z k 0:7, we linearly interpolated ourSED to cover the V filter. We convolved these SEDs with JohnsonU-,B-, and V-filter curves and computed rest-frame absolute mag-nitudes for each respective filter following equation (5) of Hogget al. (2002a). For sources in the E-CDF-S, these computed ab-solute magnitudes are consistent with those presented by Wolfet al. (2004).
In Figure 1 (small filled circles), we present rest-frame U � Vcolors versus MV for our galaxies in six redshift ranges. Forclarity, we also show inset histograms giving the distribution ofrest-frameU � V colors for each redshift interval. We utilized therest-frame U � V color to divide roughly populations of red andblue galaxies. Use of the rest-frame U � V color was motivatedby Bell et al. (2004a), who note that the U and V bandpass pairstraddle the 40008 break, which is particularly sensitive to ageand metallicity variations of galactic stellar populations. Thedashed lines in Figure 1 show the empirically determined redshift-dependent color divisions that separate blue and red galaxy
populations; we calculated these divisions following x 5 ofBell et al. (2004a):
(U � V )rest ¼ 1:15� 0:31z� 0:08(MV þ 20:7): ð1Þ
Galaxies having rest-frameU � V less than the values providedby equation (1) are often referred to as ‘‘blue cloud’’ galaxies,while those with rest-frame U � V greater than the division arecalled ‘‘red sequence’’ galaxies. The redshift dependence of theblue-cloud/red-sequence galaxy division is thought to be largelydue to the evolution of the mean age and dust content of the blue-cloud population, with a smaller contribution from changes inmetallicity. In total, we found 2502 blue-cloud galaxies and 757red-sequence galaxies.
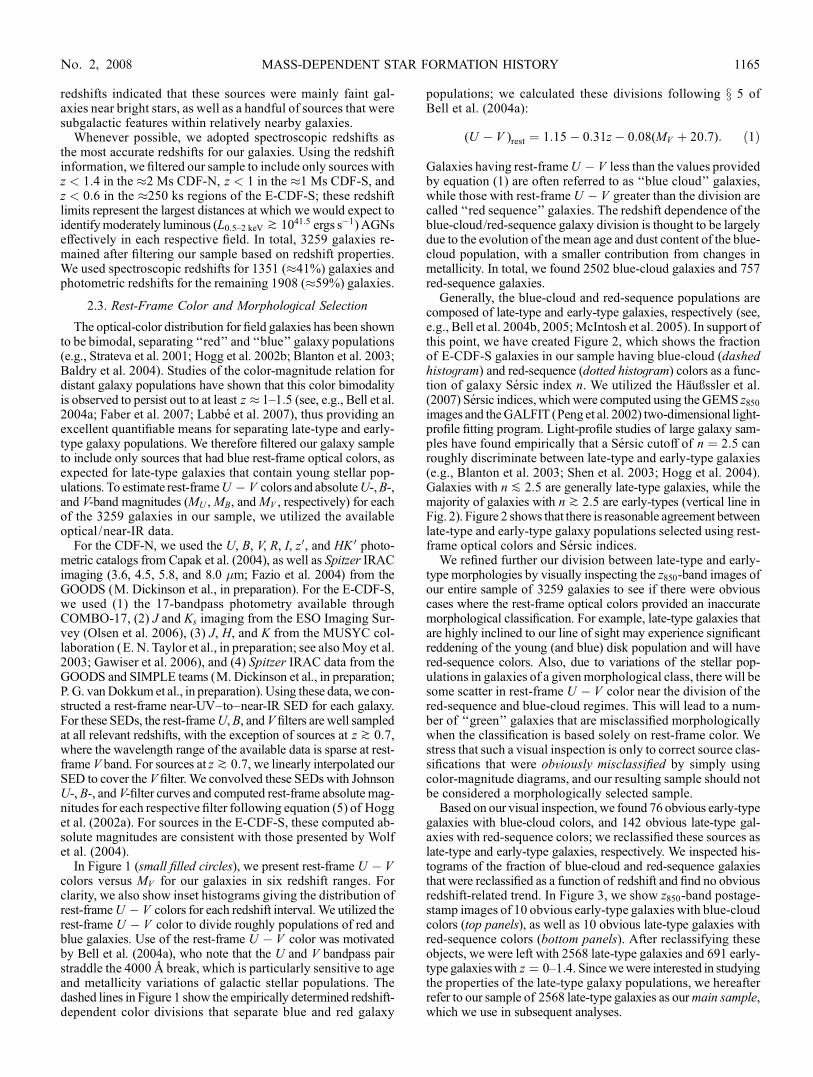
Generally, the blue-cloud and red-sequence populations arecomposed of late-type and early-type galaxies, respectively (see,e.g., Bell et al. 2004b, 2005;McIntosh et al. 2005). In support ofthis point, we have created Figure 2, which shows the fractionof E-CDF-S galaxies in our sample having blue-cloud (dashedhistogram) and red-sequence (dotted histogram) colors as a func-tion of galaxy Sersic index n. We utilized the Hau�ssler et al.(2007) Sersic indices, which were computed using the GEMS z850images and theGALFIT (Peng et al. 2002) two-dimensional light-profile fitting program. Light-profile studies of large galaxy sam-ples have found empirically that a Sersic cutoff of n ¼ 2:5 canroughly discriminate between late-type and early-type galaxies(e.g., Blanton et al. 2003; Shen et al. 2003; Hogg et al. 2004).Galaxies with n P 2:5 are generally late-type galaxies, while themajority of galaxies with n k 2:5 are early-types (vertical line inFig. 2). Figure 2 shows that there is reasonable agreement betweenlate-type and early-type galaxy populations selected using rest-frame optical colors and Sersic indices.
We refined further our division between late-type and early-type morphologies by visually inspecting the z850-band images ofour entire sample of 3259 galaxies to see if there were obviouscases where the rest-frame optical colors provided an inaccuratemorphological classification. For example, late-type galaxies thatare highly inclined to our line of sight may experience significantreddening of the young (and blue) disk population and will havered-sequence colors. Also, due to variations of the stellar pop-ulations in galaxies of a givenmorphological class, there will besome scatter in rest-frame U � V color near the division of thered-sequence and blue-cloud regimes. This will lead to a num-ber of ‘‘green’’ galaxies that are misclassified morphologicallywhen the classification is based solely on rest-frame color. Westress that such a visual inspection is only to correct source clas-sifications that were obviously misclassified by simply usingcolor-magnitude diagrams, and our resulting sample should notbe considered a morphologically selected sample.
Based on our visual inspection, we found 76 obvious early-typegalaxies with blue-cloud colors, and 142 obvious late-type gal-axies with red-sequence colors; we reclassified these sources aslate-type and early-type galaxies, respectively. We inspected his-tograms of the fraction of blue-cloud and red-sequence galaxiesthat were reclassified as a function of redshift and find no obviousredshift-related trend. In Figure 3, we show z850-band postage-stamp images of 10 obvious early-type galaxies with blue-cloudcolors (top panels), as well as 10 obvious late-type galaxies withred-sequence colors (bottom panels). After reclassifying theseobjects, we were left with 2568 late-type galaxies and 691 early-type galaxieswith z ¼ 0Y1:4. Sincewewere interested in studyingthe properties of the late-type galaxy populations, we hereafterrefer to our sample of 2568 late-type galaxies as ourmain sample,which we use in subsequent analyses.
MASS-DEPENDENT STAR FORMATION HISTORY 1165No. 2, 2008

3. PHYSICAL PROPERTIES AND REDSHIFTEVOLUTION OF LATE-TYPE GALAXIES
The primary goal of this study is to investigate the X-rayevolution of normal (i.e., non-AGN) late-type galaxies and todetermine how this evolution depends on three intrinsic physicalproperties: optical luminosity, stellar mass, and star formationrate. Below, we describe how we estimated each of these physicalproperties for the galaxies in our main sample. We note that thepopulations of late-type galaxies that we are investigating herehave been selected via their intrinsic physical properties, whichmay have changed significantly from the observed epoch to thepresent day. For example, it is expected that a significant fractionof the late-type galaxies in ourmain samplewill evolve into early-type galaxies via mergers or passive stellar evolution (e.g., Bellet al. 2007). Ideally, we would like to study the evolution of theX-ray properties of late-type galaxies while controlling for suchchanges in the physical nature of each galaxy. However, sincethe details of this evolution are highly complex and not wellunderstood for a given galaxy, such a task is beyond the scope ofthis paper.We therefore investigate the X-ray evolution of normal
Fig. 2.—Distribution of Sersic indices (n) for our initial sample of z = 0Y1galaxies in the E-CDF-S having blue-cloud (dashed histogram) and red-sequence(dotted histogram) colors. The solid vertical line indicates n ¼ 2:5, the empiricalcutoff between late-type (n P 2:5) and early-type galaxies (n k 2:5).
Fig. 1.—Rest-frame U � V color vs. absolute V-band magnitudeMV (color-magnitude diagrams) for the 3259 z � 0Y1.4 galaxies with z850 < 23 that were within6.00 of at least one CDF aim point. Each panel shows the color-magnitude relation for a given redshift bin (annotated in the upper left-hand corners). The dashed line ineach panel represents the estimated division between red ( largeU � V values) and blue (smallU � V values) galaxy populations, which was estimated using eq. (1) andthe median redshift of the galaxies in each bin. Open symbols highlight red-sequence and blue-cloud galaxies that were visually reclassified as late-type (open circles)and early-type (open squares) galaxies, respectively. The inset histogram in each panel shows the distribution of rest-frameU � V . The vertical dotted line in each insetplot indicates the estimated division between red and blue galaxy populations, which was calculated using eq. (1) and the median redshift andMV for galaxies in eachredshift bin (see x 2.3).
LEHMER ET AL.1166 Vol. 681

late-type galaxy populations in relation to their observed intrinsicphysical properties.
3.1. Optical Luminosity
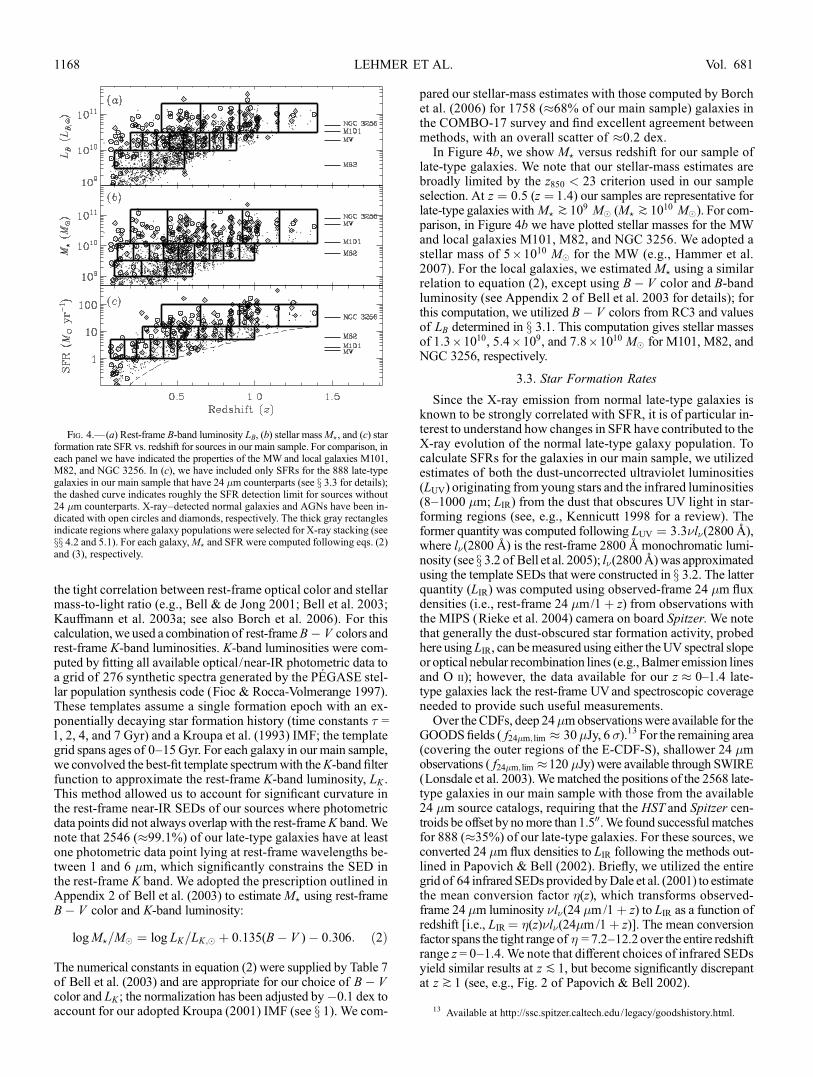
In order to study late-type galaxy samples selected using anobservable quantity, we made use of the B-band luminosity (LB).In x 2.3, we computed absolute B-band magnitudesMB for gal-axies in our main sample using photometrically derived SEDs.The B-band emission from a given late-type galaxy will be sig-nificantly influenced by large populations of old (k100 Myr)stars (measured by the stellar mass) as well as the younger andless-numerous massive stars that reside in low-obscuration star-forming regions (measured by the star formation rate). In Fig-ure 4a, we show LB (expressed in solar units; where LB;� ¼ 5:2 ;1032 ergs s�1) versus redshift for galaxies in our main sample. Theredshift-dependent selection limit of LB for our sample is set byour z850 < 23 criterion, and at z ¼ 0:5 (z ¼ 1:4) this limit cor-responds to roughly LB � 3 ; 109 LB;� (LB � 4 ; 1010 LB;�).
For comparison, in Figure 4a we have plotted the values of LBfor the Milky Way (MW) and local galaxies M101, M82, andNGC 3256. For the MW, we adopted LB ¼ 1:9 ; 1010 LB;� asthe approximate total disk-plus-bulge B-band luminosity (seeTable 15.2 of Gilmore et al. 1990). For the local galaxies, weutilized optical photometry from the Third Reference Catalogof Bright Galaxies (RC3; deVaucouleurs et al. 1991) and adopteddistances from the IRAS Revised Galaxy Sample (Sanders et al.2003), which gives distances of 6.7, 3.6, and 35.4 Mpc and im-plies corresponding B-band luminosities of 3:3 ; 1010, 3:8 ; 109,and 4:8 ; 1010 LB;� forM101,M82, andNGC 3256, respectively.
3.2. Stellar Mass
As discussed in x 1, the X-ray emission from LMXB pop-ulations scales with galaxy stellar mass. It is therefore useful toselect late-type galaxies via their stellar masses as a means forestimating the LMXB contribution to their X-ray emission. Toestimate the stellarmass (M?) of each of our galaxies, we exploited
Fig. 3.—HSTAdvanced Camera for Surveys (ACS) z850 example images of 10 blue-cloud galaxies that have obvious early-type morphologies (top panel ) and 10red-sequence galaxies that have obvious late-type morphologies (bottom panel ); these images demonstrate the aid of theHST coverage. Each postage-stamp image hasa physical size of 30 kpc ; 30 kpc, and in each image we indicate the source name (top), the rest-frameU � V color and redshift of the source (lower right), and a verticalbar of length 1.500 for scaling reference (lower left); sources harboring an X-rayYdetected AGN (see x 4.1) have been annotated with the label ‘‘AGN’’ in the lower right.
MASS-DEPENDENT STAR FORMATION HISTORY 1167No. 2, 2008
the tight correlation between rest-frame optical color and stellarmass-to-light ratio (e.g., Bell & de Jong 2001; Bell et al. 2003;Kauffmann et al. 2003a; see also Borch et al. 2006). For thiscalculation, we used a combination of rest-frameB� V colors andrest-frame K-band luminosities. K-band luminosities were com-puted by fitting all available optical/near-IR photometric data toa grid of 276 synthetic spectra generated by the PEGASE stel-lar population synthesis code (Fioc & Rocca-Volmerange 1997).These templates assume a single formation epoch with an ex-ponentially decaying star formation history (time constants � =1, 2, 4, and 7 Gyr) and a Kroupa et al. (1993) IMF; the templategrid spans ages of 0Y15 Gyr. For each galaxy in our main sample,we convolved the best-fit template spectrumwith theK-band filterfunction to approximate the rest-frame K-band luminosity, LK .This method allowed us to account for significant curvature inthe rest-frame near-IR SEDs of our sources where photometricdata points did not always overlap with the rest-frameK band.Wenote that 2546 (�99.1%) of our late-type galaxies have at leastone photometric data point lying at rest-frame wavelengths be-tween 1 and 6 �m, which significantly constrains the SED inthe rest-frame K band. We adopted the prescription outlined inAppendix 2 of Bell et al. (2003) to estimateM? using rest-frameB� V color and K-band luminosity:
logM?=M� ¼ log LK=LK;� þ 0:135(B� V )� 0:306: ð2Þ
The numerical constants in equation (2) were supplied by Table 7of Bell et al. (2003) and are appropriate for our choice of B� Vcolor and LK ; the normalization has been adjusted by�0.1 dex toaccount for our adopted Kroupa (2001) IMF (see x 1). We com-
pared our stellar-mass estimates with those computed by Borchet al. (2006) for 1758 (�68% of our main sample) galaxies inthe COMBO-17 survey and find excellent agreement betweenmethods, with an overall scatter of �0.2 dex.In Figure 4b, we show M? versus redshift for our sample of
late-type galaxies. We note that our stellar-mass estimates arebroadly limited by the z850 < 23 criterion used in our sampleselection. At z ¼ 0:5 (z ¼ 1:4) our samples are representative forlate-type galaxies with M? k109 M� (M? k 1010 M�). For com-parison, in Figure 4b we have plotted stellar masses for the MWand local galaxies M101, M82, and NGC 3256. We adopted astellar mass of 5 ; 1010 M� for the MW (e.g., Hammer et al.2007). For the local galaxies, we estimated M? using a similarrelation to equation (2), except using B� V color and B-bandluminosity (see Appendix 2 of Bell et al. 2003 for details); forthis computation, we utilized B� V colors from RC3 and valuesof LB determined in x 3.1. This computation gives stellar massesof 1:3 ; 1010, 5:4 ; 109, and 7:8 ; 1010 M� for M101, M82, andNGC 3256, respectively.
3.3. Star Formation Rates
Since the X-ray emission from normal late-type galaxies isknown to be strongly correlated with SFR, it is of particular in-terest to understand how changes in SFR have contributed to theX-ray evolution of the normal late-type galaxy population. Tocalculate SFRs for the galaxies in our main sample, we utilizedestimates of both the dust-uncorrected ultraviolet luminosities(LUV) originating from young stars and the infrared luminosities(8Y1000 �m; LIR) from the dust that obscures UV light in star-forming regions (see, e.g., Kennicutt 1998 for a review). Theformer quantity was computed following LUV ¼ 3:3�l�(28008),where l�(2800 8) is the rest-frame 2800 8 monochromatic lumi-nosity (see x 3.2 of Bell et al. 2005); l�(28008) was approximatedusing the template SEDs that were constructed in x 3.2. The latterquantity (LIR) was computed using observed-frame 24 �m fluxdensities (i.e., rest-frame 24 �m/1þ z) from observations withthe MIPS (Rieke et al. 2004) camera on board Spitzer. We notethat generally the dust-obscured star formation activity, probedhere using LIR, can bemeasured using either theUV spectral slopeor optical nebular recombination lines (e.g., Balmer emission linesand O ii); however, the data available for our z � 0Y1:4 late-type galaxies lack the rest-frame UVand spectroscopic coverageneeded to provide such useful measurements.Over the CDFs, deep 24�mobservationswere available for the
GOODSfields ( f24�m; lim � 30 �Jy, 6 �).13 For the remaining area(covering the outer regions of the E-CDF-S), shallower 24 �mobservations ( f24�m; lim �120 �Jy) were available through SWIRE(Lonsdale et al. 2003).Wematched the positions of the 2568 late-type galaxies in our main sample with those from the available24 �m source catalogs, requiring that the HST and Spitzer cen-troids be offset by nomore than 1.500.We found successful matchesfor 888 (�35%) of our late-type galaxies. For these sources, weconverted 24 �m flux densities to LIR following the methods out-lined in Papovich & Bell (2002). Briefly, we utilized the entiregrid of 64 infrared SEDs provided byDale et al. (2001) to estimatethe mean conversion factor �(z), which transforms observed-frame 24 �m luminosity �l�(24 �m/1þ z) to LIR as a function ofredshift [i.e., LIR ¼ �(z)�l�(24�m /1þ z)]. The mean conversionfactor spans the tight range of � = 7.2Y12.2 over the entire redshiftrange z = 0Y1.4. We note that different choices of infrared SEDsyield similar results at z P 1, but become significantly discrepantat z k 1 (see, e.g., Fig. 2 of Papovich & Bell 2002).
Fig. 4.—(a) Rest-frame B-band luminosity LB, (b) stellar massM?, and (c) starformation rate SFR vs. redshift for sources in our main sample. For comparison, ineach panel we have indicated the properties of the MW and local galaxies M101,M82, and NGC 3256. In (c), we have included only SFRs for the 888 late-typegalaxies in our main sample that have 24 �m counterparts (see x 3.3 for details);the dashed curve indicates roughly the SFR detection limit for sources without24 �m counterparts. X-rayYdetected normal galaxies and AGNs have been in-dicated with open circles and diamonds, respectively. The thick gray rectanglesindicate regions where galaxy populations were selected for X-ray stacking (seexx 4.2 and 5.1). For each galaxy,M? and SFR were computed following eqs. (2)and (3), respectively.
13 Available at http://ssc.spitzer.caltech.edu/ legacy/goodshistory.html.
LEHMER ET AL.1168 Vol. 681

Using our estimates of LUV and LIR, we calculated star forma-tion rates for galaxies in our sample using the following equation:
SFR(M� yr�1) ¼ 9:8 ; 10�11(LIR þ LUV); ð3Þ
where LIR and LUV are expressed in units of the solar bolometricluminosity (L� ¼ 3:9 ; 1033 ergs s�1). Equation (3) was adoptedfrom x 3.2 of Bell et al. (2005) and was derived using PEGASEstellar-population models, which assumed a 100 Myr old popu-lationwith constant SFR and aKroupa (2001) IMF (see Bell 2003for further details). We note that for the majority of our galaxiesLIR > LUV, and for sources with z � 0:5 and z > 0:5, the medianIR-to-UV ratio LIR /LUV = 2.8 and 7.1, respectively. Our z � 0:5galaxies havemedianLIR ¼ 1:1 ; 1010 L�, which is characteristicof objects that are found in the nearby D < 10 Mpc universe. Bycontrast, our z > 0:5 galaxies have median LIR ¼ 9:3 ; 1010 L�,similar to the local LIRG population found atD > 10 Mpc. In Fig-ure 4c, we show the distribution of SFRs for the 888 galaxies in ourmain sample that had 24 �m counterparts. We note that for sourcesin our main sample that were within the GOODS regions, wherethe 24 �m observations are most sensitive, the infrared detectionfraction drops from�100% for galaxies with z850 ¼ 20 � 0:2 to�20% for galaxies with z850 ¼ 22:8 � 0:2. This demonstrates thatour SFR completeness is limited primarily by the 24 �m sensitivitylimit and that our sample of z850 < 23 late-type galaxies is highlyrepresentative of galaxy populations above the apparent redshift-dependent SFR limit shown in Figure 4c (dashed curve). At z ¼0:5 (z ¼ 1:4), this limit corresponds to SFR� 1M� yr�1(SFR�15 M� yr�1). For comparison, in Figure 4c we have plotted theSFRs for theMWand local galaxiesM101,M82, and NGC 3256.The SFR of the MW was taken to be �2 M� yr�1 (McKee &Williams 1997), and the SFRs of the local galaxies were com-puted using equation (3). Values of l�(28008) were approximatedfrom SEDs available through the NASA/IPACExtragalactic Data-base (NED)14 and LIR was taken from the IRAS Revised BrightGalaxy Sample (Sanders et al. 2003). We find SFR = 2.5, 6.2, and32.2 M� yr�1 for M101, M82, and NGC 3256, respectively.
As a consistency check on our UV-plus-infrared SFR estimatesSFR(UV+IR), we calculated radio-derived SFRs using 1.4 GHzobservations, SFR(1.4 GHz), following equation (7) of Schmittet al. (2006), which we adjusted to be consistent with our adoptedKroupa (2001) IMF. We matched sources in our main sample to1.4 GHz catalogs, which were derived from observations usingthe VLA in the CDF-N (�30 �Jy; Richards et al. 1998) and theATCA in the E-CDF-S (�60 �Jy; Afonso et al. 2006; Roviloset al. 2007). Using a matching radius of 1.500, we found a total of54 radio sources coincident with our late-type galaxies. We foundthat 48 (�89%) of the radio-detected sources had 24 �m counter-parts, allowing for reasonable comparison between derived SFRs.For these sources we found reasonable agreement between SFRsderived from UV-plus-infrared and radio measurements, with amean ratio of SFR(1.4 GHz)/SFR(UV+IR) = 1.5� 1.0. A largenumber of late-type galaxies (840 sources) in our main samplewere detected in the 24 �m observations that were not detectedat 1.4 GHz. All but three of these sources had SFR(1.4 GHz)upper limits that were consistent with that expected from esti-mates of SFR(UV+IR) (see x 4.1 for further details).
4. ANALYSIS
4.1. X-RayYDetected Late-Type Galaxies and AGN Identification
We utilized the multiwavelength observations in the CDFs toobtain a census of the active galaxies in our main sample. We
began by matching the optical positions of our galaxies to theX-ray positions of point sources in the CDF catalogs of Alexanderet al. (2003)15 for the �2 Ms CDF-N and �1 Ms CDF-S andLehmer et al. (2005b)16 for the �250 ks E-CDF-S. For a suc-cessful match, we required that the optical and X-ray centroidsbe displaced by no more than 1.5 times the radius of the Chandrapositional error circles (80%Y90% confidence), which are pro-vided in each respective catalog. We note that for a small numberof the galaxies in our sample at z P 0:3, moderately luminous off-nuclear X-ray sources (e.g., ultraluminous X-ray sources [ULXs])that are intrinsically related to the galaxies may lie outside of ouradopted matching radius; we utilized the off-nuclear X-ray sourcecatalog of Lehmer et al. (2006) to identify such galaxies andassign X-ray properties (see details below).
TheChandra source catalogs were generated using wavdetect(Freeman et al. 2002) with false-positive probability thresholds of1 ; 10�7 and 1 ; 10�6 for the Alexander et al. (2003) and Lehmeret al. (2005b) point-source catalogs, respectively. However, asdemonstrated in x 3.4.2 of Alexander et al. (2003) and x 3.3.2 ofLehmer et al. (2005b), legitimate lower significanceX-ray sources,detected by running wavdetect at a false-positive probabilitythreshold of 1 ; 10�5, can be isolated bymatching with relativelybright optical sources; therefore, whenmatching our late-type gal-axies to X-rayYdetected sources, we utilized this technique. Thesky surface density for late-type galaxies in our main sampleranges from �23,000 deg�2 in the CDF-N to �8800 deg�2 inthe�250 ks E-CDF-S. The large difference between these sourcedensities is primarily due to differences in applied redshift cuts(see x 2.2). Given the fact that the positional uncertainties aregenerally small (P1.500) for sources within 6.00 of the Chandraaim points, as is the case for sources in our main sample, the cor-responding estimated number of spurious matches is small. Weestimate that when using wavdetect with a false-positive prob-ability threshold of 1 ; 10�5 to search for sources in threeChandrabandpasses (0.5Y2 keV, 2Y8 keV, and 0.5Y8 keV), we expect�1.8 spurious matches. When including the off-nuclear sourcesfrom Lehmer et al. (2006), we expect an additional �0.5 falsesources; this brings our total spurious matching estimate to�2.3 sources for our main sample.
Using the matching criteria above, we find that 225 late-typegalaxies are detected in at least one of the 0.5Y2 keV, 2Y8 keV, or0.5Y8 keV bandpasses. Out of these 225 galaxies, 12 are knownoff-nuclear X-ray sources from Lehmer et al. (2006). Since onlyone off-nuclear source is detected for each host galaxy, we assumethat the off-nuclear point-source dominates the total X-ray emissionfrom each host galaxy.We therefore adopted theX-ray propertiespresented in Table 1 of Lehmer et al. (2006) for each off-nuclearhost galaxy.
The unprecedented depths of the CDFs allow for the individualX-ray detection of luminous normal galaxies over the entire red-shift range of our main sample (z = 0Y1.4); however, the majorityof the X-rayYdetected sources in even the most sensitive regionsof the CDFs will be distant (z k 0:5) AGNs (e.g., Bauer et al.2004), whichwewant to separate fromour normal late-type galaxysample.We identified AGN candidates using four primary criteria,which utilize (1) X-ray hardness to identify luminous obscuredsources, (2) X-rayYtoYoptical flux ratios to identify additionalrelatively unobscured AGNs, (3) the X-rayYSFR correlation toidentify additional lower luminosity AGNs that are significantly
15 See http://www.astro.psu.edu/users/niel /hdf/hdf-chandra.html for the rele-vant source catalogs and data products for the �2 Ms CDF-N and�1 Ms CDF-S.
16 See http://www.astro.psu.edu/users/niel /ecdfs/ecdfs-chandra.html for therelevant source catalogs and data products for the �250 ks E-CDF-S.14 Available at http://nedwww.ipac.caltech.edu/.
MASS-DEPENDENT STAR FORMATION HISTORY 1169No. 2, 2008

influencing the total X-ray emission, and (4) the combination ofradio and infrared properties to identify additional Compton-thickAGNs and radio-loud AGNs. As a final check on our AGN iden-tifications we utilized optical spectroscopic information to iden-tify sources with obvious AGN signatures (see criterion 5 below).In the sections below we provide details of each criteria.
1. X-ray hardness.—One unique signature of moderately ob-scured (NH k1022 cm�2) AGN activity is a hard X-ray spectrum.For normal galaxies, the collective emission from X-ray binariesdominates the total 0.5Y8 keV power output. On average, thesesources have observed power-law X-ray SEDs with spectralslopes of �� 1.5Y1.7 for LMXBs (e.g., Church & Balucinska-Church 2001; Irwin et al. 2003) and � � 1Y2 for HMXBs andULXs (e.g., Sasaki et al. 2003; Liu & Mirabel 2005; Liu et al.2006); the presence of a significant hot interstellar gas componentwill steepen the resulting X-ray spectral slope (i.e., produce larger�eA). To identify obscured AGNs in our sample effectively, weflagged sources having effective photon indices of �eA P 1 asAGN candidates.We determined�eA using the 2Y8 keV to 0.5Y2 keV hardness ratio�2Y8 keV/�0:5Y2 keV, where� is the count ratefor each bandpass. A few sources have only 0.5Y8 keV detections.Since these sources were not detected in the 0.5Y2 keV bandpass,our most sensitive bandpass, there must be a significant contribu-tion from the 2Y8 keV bandpass such that �2Y8 keV/�0:5Y2 keV k1(�eA P 0:9). We therefore classified these sources as AGN can-didates. In Figure 5, we show the �2Y8 keV /�0:5Y2 keV hardnessratio versus the logarithm of the 0.5Y8 keV flux log f0:5Y8 keV forthe X-rayYdetected sources in our main sample. The shaded areahighlights the region corresponding to �eA P1. Sources that hadonly upper limits on �2Y8 keV/�0:5Y2 keV that lie in the shadedregion were not classified as AGN candidates, while those withlower limits on �2Y8 keV/�0:5Y2 keV that were in the shaded re-gion were flagged as likely AGNs. We note that occasionallyan X-rayYluminous ULX that is too close to the nucleus of itshost galaxy to be identified as off-nuclear may have �eA < 1and therefore be classified as an AGN candidate via this criterion;however, since only one identified off-nuclear X-ray source has�eA < 1 (open squares in Fig. 5; n.b., upper limits are not included),we do not expect such rare sources to significantly affect ourresults. Using criterion 1, we identified a total of 71 obscuredAGN candidates.
2. X-rayYtoYoptical flux ratio.—Detailed analyses of theX-ray spectra of luminous AGNs in the �1 Ms CDF-S showthat the intrinsic AGN power-law photon index is relatively steep,h�i ¼ 1:75 � 0:02 (e.g., Tozzi et al. 2006). Therefore, luminousAGNs having column densities of NH P 1022 cm�2 will oftenhave effective photon indices of �eA > 1 andwould not have beenclassified as potential AGNs by criterion 1. In order to identifyluminous AGNs with NH P 1022 cm�2, we utilized the X-rayYtoYoptical flux ratio ( f0:5Y8 keV /fR) as a discriminator of AGNactivity (e.g., Maccacaro et al. 1988; Hornschemeier et al. 2000;Bauer et al. 2004).We identified sources with log ( f0:5Y8 keV/fR) >�1 (see criterion 3 below for justification) as unobscured AGNcandidates. In Figure 6, we show the R-band magnitude versuslog f0:5Y8 keV for sources in our main sample; the shaded areashows the region where log ( f0:5Y8 keV /fR) > �1. Sources thatwere classified as AGN candidates via criterion 1 are denotedwith open symbols. In total, 43 X-rayYdetected sources satisfiedcriterion 2, and 16 of these sources were uniquely identifiedusing this criterion (i.e., not identified by criterion 1).3. X-rayYtoYSFR correlation.—Taken together, criteria 1
and 2 provide an effective means for identifying AGNs that areaffected by large absorption column densities (criterion 1) andthose that are notably X-ray overluminous for a given optical lu-minosity (criterion 2). However, these criteria will still miss mod-erately luminous unobscuredAGNs that have log ( f0:5Y8 keV/fR) <�1 (see, e.g., Peterson et al. 2006). Although an accurate clas-sification for all such sources is currently not possible, the situa-tion can be mitigated using the available multiwavelength data.We therefore exploited the correlation between X-ray luminosityLX and SFR (see x 1) to identify additional AGN candidates in ourmain sample that have significant X-ray excesses over what isexpected based on the LX-SFR correlation. In order to calculatethe rest-frame luminosity (LE1YE2
; whereE1 andE2 are the photon-energy lower and upper bounds, respectively) of a source havinga power-law SED, we used the following equation:
LE1YE2¼ 4d2LfE1YE2
(1þ z)��2; ð4Þ
where fE1YE2is the observed-frame emission in the E1YE2 band-
pass and dL is the luminosity distance. Using equation (4) andan adopted photon index of � ¼ 2, we calculated 0.5Y8 keV
Fig. 5.—Count-rate ratio in the 2Y8 keV to 0.5Y2 keV bandpasses (�2Y8 keV /�0:5Y2 keV) vs. the logarithm of the 0.5Y8 keV flux ( log f0:5Y8 keV) for X-rayYdetected sources in our main sample. Off-nuclear X-ray sources cataloged byLehmer et al. (2006) have been highlighted with open squares. The shaded regionrepresents sources with effective photon indices �eA P 1; we classified thesesources as AGN candidates (see x 4, criterion 1). For reference, we have plottedlines corresponding to �eff = 0.5, 1, and 2 (dashed lines).
Fig. 6.—R-band magnitude vs. log f0:5Y8 keV for X-rayYdetected sources inour main sample. Open circles represent sources that were classified as AGN can-didates by criterion 1 (see x 4.1 and Fig. 5), and filled circles represent all othersources; open squares have the same meaning as in Fig. 5. The shaded area repre-sents the region where log ( f0:5Y8 keV /fR) > �1; we classified sources in this regionas AGN candidates (see x 4.1, criterion 2). For reference, the dashed lines representlog ( f0:5Y8 keV /fR) ¼ �2, �1, and 1.
LEHMER ET AL.1170 Vol. 681

luminosities forX-rayYdetected sources in our sample. In Figure 7,we show the logarithm of the 0.5Y8 keV luminosity log L0:5Y8 keVversus SFR (computed following eq. [3]) for galaxies in our mainsample that had 24 �m counterparts (see x 3.3). Several estimatesof the LX-SFR correlation have been shown for reference (Baueret al. 2002a; Ranalli et al. 2003; Gilfanov et al. 2004a; Persic &Rephaeli 2007, hereafter PR07); these correlations have beencorrected for differences in X-ray bandpass and SED as well asadopted IMFs. Hereafter, we adopt the LX-SFR correlation fromPR07 for comparisons; however, the use of other LX-SFR cor-relationswould yield similar results and conclusions.Open squaresshow the locations of the galaxies hosting off-nuclear sources,which appear to be preferentially located near the LX-SFR cor-relation.Open circles indicate sources thatwere identified asAGNcandidates via criteria 1 and 2. Generally, these AGNs haveL0:5Y8 keV/SFR k 3 times that predicted by the PR07 LX-SFRcorrelation (thick dashed line), which corresponds to a factorof k2.5 times the rms scatter of the PR07 LX-SFR correlation.We therefore classified all sources in this regime (shaded region)as AGN candidates. We note that sources having only 0.5Y8 keVupper limits were not classified as AGNs. However, sources thatwere detected in the 0.5Y8 keV bandpass that had only upperlimits on the SFR were classified as AGN candidates if they werewithin the shaded region of Figure 7. Using this criterion, weidentified 101 potential AGNcandidates, of which 33were uniqueto criterion 3. For the 124 X-rayYdetected sources that were notclassified as AGNs, we found that 19 sources (�15%) had X-rayspectral properties indicative of AGNs (criterion 1) and only onesource (�0.8%) had an X-rayYtoYoptical flux ratio elevated incomparison to normal galaxies (criterion 2).
4. Infrared and radio properties.—In addition to the X-rayYdetected sources, we also expect there to be additional AGNsthat lie below the X-ray detection threshold that are not identifiedhere. In x 3.3, we noted using 48 sources that the SFRs derivedfrom the UV-plus-infrared emission are generally consistentwith those derived from radio (1.4 GHz) observations; however,there are a few sources that are significantly scattered (i.e., bymore than a factor of 5 times the intrinsic scatter) outside of the
SFR(UV+IR)-SFR(1.4 GHz) correlation. These sources haveeither (1) excess infrared emission due to reprocessed dust emis-sion from a highly obscured (NH k 1024 cm�2) moderately lumi-nous (intrinsic LX � 1042Y1043 ergs s�1) Compton-thick AGN(e.g., Daddi et al. 2007a, 2007b) or (2) an excess of radio emis-sion due to prominent radio-emitting jets (e.g., Snellen & Best2001). The reasonable agreement between SFR(UV+IR) andSFR(1.4 GHz) suggests that such AGNs are not prevalent in ourlate-type galaxy sample. Ideally we would also like to explorehow UV-corrected SFRs compare to the UV-plus-infrared SFRto search for potential Compton-thick AGNs following the ap-proach used by Daddi et al. (2007a, 2007b) for BzK galaxies atz k 2; however, since our galaxies generally lie at much lowerredshifts that the Daddi et al. (2007a, 2007b) sources, we areunable to constrain well UV spectral slopes with our availablephotometry, which would be required to make dust-correctionsto the observed UV SFRs (see x 3.3 for discussion). For oursample of 24 �mYdetected galaxies, we identified three radio-excess galaxies with SFR(1.4 GHz)/SFR(UV+IR) > 5 and threeIR-luminous galaxies with SFR(1.4 GHz)/SFR(UV+IR)< 1/5.Using these criteria we identified three new AGN candidates, tworadio luminous (J33146.6�275735 and J33244.3�275141) andone IR luminous (J33240.0�274214); one of these sources, theradio-luminous source J33244.3�275141, was detected in the0.5Y2 keV and 0.5Y8 keV bandpasses.
As an additional test, we utilized IRAC photometry (see x 2.3)to search for infrared power-law sources having near-IR spectralproperties characteristic of luminousAGNs (e.g., Alonso-Herreroet al. 2006; Donley et al. 2007). When searching for power-lawsources, we adopted the criteria discussed in Donley et al. (2007).We found that no sources in our sample satisfied these criteria,which is consistent with the finding that most IRAC power-lawsources reside at z k 1.
5. Optical spectroscopy.—As a final check on our AGNclassifications, we searched the optical spectroscopic catalogsavailable for CDF sources (e.g., Barger et al. 2003; Le Fevre et al.2004; Szokoly et al. 2004; Wirth et al. 2004; Vanzella et al. 2005,2006) to isolate additional luminousAGNs in our sample. In total,we found 15 galaxies in our main sample that were classified asAGNs via optical spectroscopy and all of these sources had beenidentified as AGN candidates by the previous criteria. We notethat the majority of the X-rayYdetected AGNs have moderateluminosities (intrinsic LX � 1041Y1043 ergs s�1) and thereforeoften have high-excitation AGN emission lines that are too faintwith respect to stellar emission to be identified via optical spec-troscopy (e.g., Moran et al. 2002). Therefore, it is not surprisingthat we do not find any additional AGNs using this criterion.
To summarize, in the X-ray band we have detected a total of225 (�9%) late-type galaxies out of the 2568 sources in our mainsample. Using the criteria presented above, we classified 121X-rayYdetected sources as AGN candidates (with an additionaltwo X-rayYundetected AGN candidates via criterion 4). The re-maining 104 X-ray-detected sources that we do not classify asAGN candidates are considered to be normal late-type galaxies,and we include these galaxies in subsequent X-ray stacking anal-yses (see details in x 5 below). Thus we use 2447 late-type gal-axies in our stacking analyses. In Figure 8, we show log L0:5Y8 keVversus redshift for X-rayYdetected sources in our main sample,and in Table 1 we summarize their properties. AGN candidatesare denoted with open circles and normal galaxies are plotted withfilled circles. We note that the above criteria are not completelysufficient to classify all X-rayYdetected sources that are trulyAGNs as AGN candidates (see, e.g., Peterson et al. 2006). Such
Fig. 7.—Logarithm of the 0.5Y8 keV luminosity L0:5Y8 keV vs. SFR for X-rayYdetected sources in our sample that have 24 �m counterparts. Open circles rep-resent sources that were classified as AGN candidates via criteria 1 and 2 (see x 4.1and Figs. 5 and 6), and filled circles represent all other sources; open squares havethe same meaning as in Fig. 5. We have shown the X-rayYSFR relations calibratedby Bauer et al. (2002b), Ranalli et al. (2003), Gilfanov et al. (2004a), and PR07;each respective curve has been annotated in the figure. The shaded area abovethe thick dashed line represents the region where L0:5Y8 keV is 3 times larger than itsvalue predicted by PR07; we classified 0.5Y8 keV detections that lie in this regionas AGN candidates (see x 4.1, criterion 3).
MASS-DEPENDENT STAR FORMATION HISTORY 1171No. 2, 2008

a misclassification is possible for low-luminosity AGNs that areonly detected in the more sensitive 0.5Y2 keV bandpass, whichhave 2Y8 keVemission too weak for an accurate classification.In x 5.2, we use the 2Y8 keV AGN fraction as a function ofX-ray luminosity to argue quantitatively that we do not expectmisclassified AGNs (detected only in the 0.5Y2 keV bandpass)and low-luminosityAGNs below theX-ray detection limit to havea serious impact on our results.
4.2. X-Ray Stacking Analyses of Normal Late-TypeGalaxy Populations
The majority of the normal late-type galaxies that make up ourmain sample were not detected individually in the X-ray band-pass. In order to study the meanX-ray properties of these sources,we implemented stacking analyses of galaxy populations selectedby their physical properties (see x 3).We divided our main sampleinto subsamples (to be used for stacking) of normal late-type gal-axies selected by both physical properties (i.e.,B-band luminosity,stellar mass, and star formation rate) and redshifts. In Figure 4,we have highlighted the divisions of our sample with thick gray
rectangles, and for normal late-type galaxies in each region, weused X-ray stacking analyses to constrain average properties.For each of the subsamples defined above,we performedX-ray
stacking in each of the three standard bandpasses (i.e., SB, HB,and FB; see x 1).We expect these bandpasses to sample effectivelypower-law X-ray emission originating from X-ray binaries (i.e.,HMXBs and LMXBs) with a minor contribution from hot inter-stellar gas in the SB for late-type galaxies at z P 0:5. In our anal-yses, we used data products presented in Alexander et al. (2003)for the �2 Ms CDF-N and �1 Ms CDF-S and Lehmer et al.(2005b) for the �250 ks E-CDF-S (see footnotes 15 and 16).Our stacking procedure itself was similar to that discussed in x 3of Steffen et al. (2007). This procedure differs from past stackinganalyses (e.g., Lehmer et al. 2007) in how the local X-ray back-ground of each stacked sample is determined, and produces resultsthat are in good agreement with the method discussed in x 2.2 ofLehmer et al. (2007). For completeness, we have outlined thisprocedure below.Using a circular aperture with radius Rap ¼ 1:500, we extracted
Chandra source-plus-background counts Si and exposure times Ti(in units of cm2 s) for each galaxy using images and exposuremaps, respectively. For a given source, we used only Chandrapointings with aim points (see footnote 12) that were offset fromthe source position by less than 6.00; hereafter, we refer to thismaximumoffset as the inclusion radius,Rincl.
17 Since theChandraPSF increases in size with off-axis angle and degrades the sensi-tivity for sources that are far off-axis, our choices of Rap andRincl have been chosen to give the maximal stacked signal withthe majority of the PSFs being sampled by our stacking aperture(see x 2.2 and Fig. 3 of Lehmer et al. 2007 for justification). Weestimate, based on stacked images of z� 0.1Y0.3 optically lumi-nous (LB > 2 ; 109 LB;�) late-type galaxies, that P10% of thenormal galaxyX-ray emission originates outside of our 1.500 radiusaperture (2.8Y6.7 kpc at z = 0.1Y0.3) for all stacked samples.For galaxies that were within 6.00 of more than one of the CDFaim points, we added source counts and exposure times from allappropriate images and exposure maps, respectively; however,there were very few sources in our main sample that met thiscriterion.Using background maps (see x 4.2 of Alexander et al. 2003
for the �2 Ms CDF-N and �1 Ms CDF-S and x 4 of Lehmeret al. 2005b for the �250 ks E-CDF-S) and exposure maps, we
Fig. 8.—Logarithm of the 0.5Y8 keV luminosity L0:5Y8 keV vs. redshift for the225 X-rayYdetected sources in our main sample. Open circles indicate all of theAGN candidates that were isolated using the four criteria outlined in x 4.1, andfilled circles represent potential normal galaxies; open squares have the samemeaning as in Fig. 5. The estimated 0.5Y8 keV detection limits for the �2 MsCDF-N, the�1Ms CDF-S, and the�250 ks E-CDF-S have been indicated withdotted, dashed, and dot-dashed curves, respectively.
TABLE 1
X-RayYDetected Late-Type Galaxies: Source Properties
Source Name
(J2000.0)
(1)
z850(mag)
(2)
z
(3)
LB( logLB,�)
(4)
M?
( logM�)
(5)
SFR
(M� yr�1)
(6)
Survey
(7)
E0.5Y8 keV
(ks)
(8)
f0.5Y8 keV
( log ergs cm�2 s�1)
(9)
J033132.81�280115.9 ................ 17.19 0.15p 10.39 10.49 <5.89 E-CDF-S 03 217 �15.06
J033132.84�280107.5................ 22.17 0.15p 8.85 8.44 0.23 E-CDF-S 03 217 �15.45
J033139.20�280222.3................ 17.06 0.25p 10.94 11.07 1.40 E-CDF-S 03 206 <�15.15
J033139.97�274157.0................ 20.14 0.47s 10.14 10.43 <19.93 E-CDF-S 02 226 �13.46
J033141.79�275635.2................ 19.58 0.51p 10.84 10.54 <13.17 E-CDF-S 03 239 �15.02
Notes.—Col. (1): Chandra source name. Col. (2): ACS z850-band magnitude. Col. (3): Redshift estimate. Superscripts ‘‘s’’ and ‘‘p’’ indicate spectroscopic andphotometric redshifts, respectively (see x 2 for details). Col. (4): Logarithm of the rest-frameB-band luminosity in units of LB;�. Col. (5): Logarithm of the stellar mass in unitsof M�. Col. (6): Star formation rate in units of M� yr�1. Col. (7): Survey field in which each source was identified. For E-CDF-S identifications, the associated field number(i.e., 01Y04) indicates the Chandra pointing within which the source was detected (see Lehmer et al. 2005b for details). Col. (8): Effective 0.5Y8 keVexposure time (inunits of ks). Cols. (9)Y(11): Logarithm of the 0.5Y8 keV, 0.5Y2 keV, and 2Y8 keV flux in units of ergs cm�2 s�1. Cols. (12)Y(14): Logarithm of the 0.5Y8 keV, 0.5Y2 keV,and 2Y8 keVrest-frame luminosity in units of ergs s�1. Col. (15): Effective photon index (�eA). Col. (16): Logarithm of the 0.5Y8.0 keV to R-band flux ratio. Col. (17): AGNcandidate (Y/N)? Col. (18): AGN selection criteria used (i.e., 1Y5; see x 4.1 for details). Table 1 is published in its entirety in the electronic edition of theAstrophysical Journal.A portion is shown here for guidance regarding its form and content.
17 Note that Rincl has the same meaning as it did in Lehmer et al. (2007).
LEHMER ET AL.1172 Vol. 681

measured local backgrounds Bi;local and exposure times Ti;localwithin a 30 pixel ; 30 pixel (�1500 ; 1500) square, centered oneach source with the 1.500 radius circle masked out. Here again, ifa source was within 6.00 of more than one of the CDF aim points,we summed the local backgrounds and exposure times. We esti-mated the expected number of background counts in each circularapertureBi by scaling the background counts within the square bythe relative exposure times of the circular aperture and the square(i.e., Bi ¼ Bi;local ; Ti /Ti;local). This approach is similar to scalingthe background counts in the square by the relative areas of thecircular aperture and the square; however, by using exposure times,we are able to account more accurately for spatial variations inpixel sensitivity due to chip gaps, bad pixels, and vignetting.Furthermore, comparisons between this method and the MonteCarlo method used in Lehmer et al. (2007) to compute Bi giveexcellent agreement and are most convergent for large numbersof Monte Carlo trials.
When stacking galaxy populations, we excluded sources thatwere (1) classified as AGN candidates (via the criteria outlined inx 4.1), (2) within 1000 of an unrelated source detected in the X-raycatalogs, (3) within the extent of extended X-ray sources (seeBauer et al. 2002b, x 3.4 of Giacconi et al. 2002, and x 6 ofLehmer et al. 2005b), and (4) located within 300 of another late-type galaxy in our main sample. We note that we include X-rayYdetected normal galaxies when stacking our samples, since we areinterested in the average properties of the normal late-type galaxypopulation. We tested the effects of including such sources bystacking samples both with and without X-rayYdetected sour-ces included, and find similar results for both cases. Typically,the X-rayYdetected sources contribute�10%Y30% of the countsin the total stacked signal. For each of the subsamples of normallate-type galaxies outlined in Figure 4 (gray rectangles), we de-termined stacked source-plus-background (S ¼
Pi Si) and back-
ground counts (B ¼P
i Bi) to determine net counts (S � B). Foreach stacked sample, we required that the signal-to-noise ratio[S/N � (S � B)/
ffiffiffiB
p; where jS � BjTB and B 20] be greater
than or equal to 3 (i.e., k99.9% confidence) for a detection. Forstacked samples without significant detections, 3 � upper limitswere placed on the source counts.
We converted the net counts obtained fromeach stacked sampleto absorption-corrected fluxes and rest-frame luminosities us-ing a power-law SED with � ¼ 2. Due to the fact that our 1.500
radius stacking aperture encircles only a fraction of the PSF18 forsources at relatively large off-axis angle, we calculated aperturecorrections i for each stacked source i. Since we are calculatingaverage X-ray counts from the summed emission ofmany sourcesof differing backgrounds and exposure times, we used a single,representative exposure-weighted aperture correction, . Thisfactor, which was determined for each stacked sample, was cal-culated as follows:
�P
i i ; TiT
; ð5Þ
where T ¼P
i Ti. The average aperture corrections () for sourcesin our main sample were�1.6, 1.8, and 1.7 for the SB, HB, andFB, respectively. Using our adopted SED, we estimated observedmean X-ray fluxes using the following equation:
fE1YE2¼ AE1YE2
S � B
T
� �; ð6Þ
where AE1YE2is a bandpass-dependent count-rateYtoYflux con-
version factor that incorporates both the X-ray SED informationas well as Galactic extinction using the column densities listedin x 1. ThesemeanX-ray fluxes were then converted to rest-frameluminosities following equation (4), assuming a photon index of� ¼ 2.
5. RESULTS
5.1. Stacking Results
Using the stacking analysis methods discussed in x 4.2, westacked the late-type galaxy samples presented in Figure 4 (stackedsamples are denoted with thick gray rectangles). These sampleswere selected using LB, M?, and SFR, which include 14, 17, and13 stacked samples (44 total), respectively. In Table 2, we tabulateour X-ray stacking results. We found significant (i.e., S/N k3)X-ray detections in the 0.5Y2 keV and 0.5Y8 keV bandpassesfor all stacked samples. In the 2Y8 keV bandpass, 15 out of the44 stacked samples were detected, and these samples generallyconstitute the most optically luminous and massive galaxies, aswell as those galaxies that are most actively forming stars.
In Figure 9, we show the effective photon index (�eA) versus thelogarithm of the X-rayYtoYoptical mean flux ratio (log f0:5Y8 keV/fR)for our 44 stacked samples ( filled symbols) that were selected viatheir observed properties. Effective photon indices were estimatedusing HB-to-SB count-rate ratios (i.e., �2Y8 keV /�0:5Y2 keV). All44 stacked samples have X-rayYtoYoptical flux ratios and X-rayspectral slopes consistent with normal galaxies (unshaded regionin Fig. 9), suggesting that these samples are not heavily contam-inated by an underlying population of AGNs.19We find a medianlogarithm of the X-rayYtoYoptical flux ratio of log f0:5Y8 keV/fR ¼�2:53 (vertical dotted line), and for samples that were detectedin both the HB and SB, the median effective photon index is�medianeA ¼ 1:47 (horizontal dotted line). These values are charac-
teristic of galaxies dominated by X-ray binary populations.In Figure 10, we show the logarithm of the ratio of the 0.5Y
8 keV luminosity (hereafter, LX) to each physical property (i.e.,log LX/LB, log LX/M?, and log LX/SFR) versus redshift for oursamples. Each relevant quantity for the MWand local galaxiesM101, M82, and NGC 3256 have been shown for comparison.We adopt 6:6 ; 1039 ergs s�1 as the approximateX-ray luminosityof theMW (Grimm et al. 2002). For the local galaxies, we utilizedthe X-ray luminosities from Shapley et al. (2001; hereafterS01) for M101 (LX ¼ 1:6 ; 1040 ergs s�1) and M82 (LX ¼ 4:6 ;1040 ergs s�1) and Lira et al. (2002) for NGC 3256 (LX ¼ 4:0 ;1041 ergs s�1). We have corrected the X-ray luminosities to beconsistent with our use of the 0.5Y8 keV bandpass and our choiceof � ¼ 2.
For the purpose of comparing our results to those for nearbylate-type galaxy populations, we made use of the S01 sample of183 normal local (D P100 Mpc) spiral and irregular galaxies.These galaxies were observed in the 0.2Y4 keV band using theEinstein IPC and HRI (Fabbiano et al. 1992) and AGNs, withluminousX-ray emission or spectral signatures indicative of AGNactivity, have been excised from the sample. To avoid the inclu-sion of early-type S0 galaxies, we chose to utilize 139 normallate-type galaxies from the S01 sample with morphological typesT > 2 (SaYIrr Hubble types).
19 We note that two of our samples have spectral slopes that are near our chosendivision between normal galaxies and AGNs (�eA � 1). These samples havelog LB ¼ 10Y10:5 and logM? ¼ 9:5Y10:1 and lie at z � 0:66, a redshift wherelarge-scale sheets of galaxies and AGNs have been isolated previously in theCDF-S (e.g., Gilli et al. 2003). These galaxies have spectral slopes that are eitherstatistically scattered toward �eA ¼ 1 (see characteristic error bar in Fig. 9) ormay have some nonnegligible contribution from heavily obscured AGNs.
18 At off-axis angles � � 30, our 1.500 radius circular aperture contains anencircled-energy fraction of �100%, 80%, and 100% for the SB, HB, and FB,respectively; however at � � 60, this fraction decreases to �30%, 25%, and25%, respectively.
MASS-DEPENDENT STAR FORMATION HISTORY 1173No. 2, 2008

The S01 sample covers ranges of LB and M? that are well-matched to our main sample and are representative of late-typegalaxies in the local universe. In order to compute mean X-rayluminosities for samples that were directly comparable with ourresults, we divided the S01 sample into the same intervals of LBand M? that were used for our main sample (see Figs. 4a and4b). Since several of the S01 galaxies had only X-ray upper limitsavailable, we computed mean X-ray luminosities and errors usingthe Kaplan-Meier estimator available through the AstronomySURVival Analysis software package (ASURV rev. 1.2; Isobe &
TABLE 2
Stacked Late-Type Normal Galaxies: Mean Properties
Net Source Counts (S � B) Signal-to-Noise Ratio
Selection Type
(1)
zmean
(2)
Ngal
(3)
Ndet
(4)
0.5Y8 keV
(5)
0.5Y2 keV
(6)
2Y8 keV
(7)
0.5Y8 keV
(8)
0.5Y2 keV
(9)
2Y8 keV
(10)
logLB/LB,� = 9.5Y10.0 ............... 0.23 � 0.06 120 9 213.3 158.7 54.9 8.6 9.6 3.0
0.46 � 0.06 363 1 176.7 152.6 25.3 4.8 6.8 0.9
logLB/LB,� = 10.0Y10.5 ............. 0.24 � 0.02 28 2 66.9 46.5 20.2 5.2 5.3 2.1
0.33 � 0.03 33 3 82.9 68.5 14.9 5.9 6.7 1.5
0.41 � 0.03 67 7 204.2 144.7 59.8 9.3 9.7 3.8
0.50 � 0.02 158 6 347.5 240.0 109.1 10.7 11.3 4.4
0.57 � 0.02 100 3 128.0 109.0 18.7 6.0 7.5 1.2
0.67 � 0.02 71 2 154.1 93.5 60.6 6.3 6.1 3.2
0.75 � 0.02 62 2 156.3 107.4 48.8 6.4 6.9 2.6
0.84 � 0.02 57 3 105.9 64.8 41.2 4.4 4.5 2.2
Notes.—Col. (1): Physical property (i.e., LB,M?, and SFR) used to select the stacked sample. Col. (2): Mean redshift (zmean) and 1 � standard deviation. Col. (3): Num-ber of galaxies stacked (Ngal). Col. (4): Number of X-rayYdetected normal galaxies stacked. Cols. (5)Y(7): Net source counts (S � B) for the 0.5Y8 keV, 0.5Y2 keV, and2Y8 keV bandpasses. Cols. (8)Y(10): Signal-to-noise ratio for the 0.5Y8 keV, 0.5Y2 keV, and 2Y8 keV bandpasses. Cols. (11)Y(13): Logarithm of the mean 0.5Y8 keV,0.5Y2 keV, and 2Y8 keV flux in units of ergs cm�2 s�1. Col. (14)Y(16): Fraction of the mean 0.5Y8 keV, 0.5Y2 keV, and 2Y8 keV flux originating from the X-rayYundetected galaxies. Cols. (17)Y(19): Logarithm of the mean 0.5Y8 keV, 0.5Y2 keV, and 2Y8 keV rest-frame luminosity. Col. (20): Mean effective photon index (�eA).Col. (21): Logarithm of the 0.5Y8.0 keV to R-band flux ratio. Cols. (22)Y(24): Mean values of LB,M?, and SFR for samples selected by LB,M?, and SFR, respectively.Cols. (25)Y(27): Logarithm of the ratios LX/LB (ergs s�1L�1
B;�), LX/M? (ergs s�1M�1
� ), and LX/SFR [ergs s�1 (M� yr�1)�1] for samples selected by LB, M?, and SFR,respectively. Cols. (28)Y(30): Estimated fraction of the mean 0.5Y8 keV, 0.5Y2 keV, and 2Y8 keV stacked emission originating from undetected AGNs. Table 2 ispublished in its entirety in the electronic edition of the Astrophysical Journal. A portion is shown here for guidance regarding its form and content.
Fig. 9.—Effective photon index (�eA) vs. the logarithm of the X-rayYtoYoptical flux ratio ( log f0:5Y8 keV /fR) for 44 stacked samples selected via observedproperties: LB ( filled circles),M? ( filled squares), and SFR ( filled triangles). Thecharacteristic mean error bar for each quantity is given in the lower right-handcorner. The median logarithm of the X-rayYtoYoptical flux ratio is indicated with avertical dotted line (log f0:5Y8 keV/fR ¼ �2:53). The median effective photon indexfor the samples that were detected in both the SB and HB is indicated with a hor-izontal dotted line (�median
eA ¼ 1:47). We note that all of the stacked samples withboth SB and HB detections have �eA > 1, consistent with normal galaxies. Forthe several stacked samples that have only SB detections, we have indicated lowerlimits on �eA. The shaded regions and corresponding boundaries (dashed lines)represent areas where X-rayYdetected sources were classified as AGN candidates(for details, see discussion of criteria 1 and 2 in x 4.1); note that additional criteriawere used to identify potential AGNs when generating our samples of normal late-type galaxies (see criteria 3Y5 in x 4.1).
Fig. 10.—Logarithm of (a) the X-rayYtoYB band mean luminosity ratio( log LX /LB), (b) the X-rayYtoYstellar mass mean ratio ( log LX/M?), and (c) theX-rayYtoYstar formation rate mean ratio (log LX/SFR) vs. redshift ( filled symbolsand curves) for stacked normal late-type galaxy samples selected by LB (Fig. 4a),M? ( Fig. 4b), and SFR (Fig. 4c), respectively. For comparison, in each panel wehave indicated the properties of the MW and local galaxies M101, M82, andNGC 3256. Quoted X-ray luminosities correspond to the 0.5Y8 keV bandpassand were calculated following the methods described in x 4.2, assuming a power-law SED with photon index of � ¼ 2. Symbols and curves correspond to uniqueranges of LB, M?, and SFR, which are annotated in each respective figure. Forreference, in (a) and (b) we have plotted the corresponding values of log LX /LBand log LX /M?, respectively, for normal late-type galaxies in the local universe(open symbols) using the S01 sample. In (b) we show the expected LMXB con-tribution based onGilfanov (2004; dashed line). Finally, in (c) we show the localLX-SFR relation and its dispersion (dashed line with shading) derived by PR07and corrected for our choice of IMF and � ¼ 2. We note that roughly all of ourdata points in (c) lie�0.1Y0.2 dex below the PR07 relation, which is likely dueto systematic differences in how LX and SFR were determined between studies.
LEHMER ET AL.1174 Vol. 681

Feigelson 1990; LaValley et al. 1992); the Kaplan-Meier esti-mator handles censored data sets appropriately. When computingthese mean X-ray luminosities, we filtered the S01 samples ap-propriately into distance intervals to avoid the Malmquist bias.In Figures 10a and 10b, we show the corresponding values oflog LX/LB and log LX/M?, respectively, for the S01 sample withopen symbols. By contrast, the SFRs of the local sample are gen-erally too low (P1Y10 M� yr�1) to provide a meaningful com-parison with our distant 24 �mYdetected sources. This is due tothe strong positive evolution of the star formation rate densitywithredshift (see x 1), whichmakes SFRs that are common for galaxiesin our sample (k1Y10 M� yr�1) comparatively rare at z ¼ 0.
From Figures 10a and 10b, it is apparent that there is significantpositive redshift evolution in log LX/LB and log LX/M? over theredshift range of z � 0Y1.4. For each of the six total selectionranges of LB and M?, the redshift progression of X-ray lumi-nosities is inconsistent with a constant at the >99.9% confidencelevel. For the most optically luminous [LB ¼ (3Y20) ; 1010 LB;�]and massive [M? ¼ (1Y20) ; 1010 M�] late-type galaxies at z ¼1:4, LX/LB, and LX/M? are measured to be larger than the localvalues of S01 by factors of 3:1 � 0:7 and 9:6 � 3:1, respectively.Such values are consistent with the�(1þ z)1:5Y3 evolution of L�Xfound for the normal late-type galaxy population, which has beenconstrained using largely the most optically luminous and mas-sive galaxies (Ptak et al. 2007; Tzanavaris & Georgantopoulos2008).
The above results confirm the increase in LX/LB with redshiftfound by H02. In past studies, LX/LB has been used as a proxyfor star formation activity (e.g., Ptak et al. 2001; H02; Lehmeret al. 2005a), despite the fact that LB is likely to be somewhatsensitive to SFR (see discussion in x 3.1). As discussed in x 1,LX has been shown to be strongly correlated with galaxy SFR.Correlation studies of spiral galaxies in the local universe havealso found strong correlations between LX and LB such thatLX / L1:5B (S01; Fabbiano & Shapley 2002). The nonlinear re-lationship between X-ray and B-band emission is thought to bedue to the increase in dust obscuration with star formation activity,which attenuates light from the B-band more effectively than itdoes in the X-ray band. Using our sample of 47 normal late-type galaxies with both X-ray and 24 �m detections, we foundthat LX/LB was positively correlated with the UV dust-extinctionmeasure (LIR + LUV)/LUV (Kendall’s � ¼ 0:44; k99.99% con-fidence level), thus providing support for this hypothesis. Fur-thermore, it has been shown that LX/LB is correlated withL60�m/L100�m, suggesting that more intense X-ray emission isassociated with hotter IR colors, which is indicative of intenseobscured star formation activity. Therefore, the increase in LX/LBwith redshift (see Fig. 10a) observed for our galaxies is likely dueto an increase in their star formation activity.
Upon comparing LB withM? and SFR for our galaxies, we findthat LB is well correlated with bothM? (Kendall’s � ¼ 0:69) andSFR (� ¼ 0:58); however, the scatter in the LB-M? relation issignificantly smaller than it is for the LB-SFR relation (�0.2 dexvs.�0.4 dex, respectively), implying that LB traces more effec-tively M? rather than SFR. It is therefore not surprising that wesee similar redshift evolution of LX/M? and LX/LB.
In Figure 10b, we show the estimated LMXB contribution tolog LX/M? (dashed line) based on Table 5 of Gilfanov (2004).This value is�5Y10 times lower than all mean values of LX/M?,suggesting that on average LMXBs play a fairly small role inthe X-ray emission from our stacked samples. Furthermore, late-type galaxies in the local universe with similar stellar masses areoften found to have HMXB emission that is �2Y10 times moreluminous than that expected from LMXBs (see open symbols in
Fig. 10b and Fig. 3 of Gilfanov et al. 2004b). For galaxy samplesselected via SFR, we find no evidence for significant evolution inlog LX/SFR (Fig. 10c). We note that if the majority of the X-rayflux from our stacked samples originated from X-rayYdetectedsources, then the AGN selection criteria 3 and 4 from x 4.1 maypotentially bias these results. However, we find that the morepopulous and unbiased X-rayYundetected source populationsdominate the stacked 0.5Y8 keV signals at the k80% level (seecol. [14] of Table 2). For each of the three ranges of SFR, log LX/SFR is consistent with a constant value and has a best-fit ratio oflog LX/SFR =39.87�0.07 (�2 ¼ 13:1 for 12 degrees of freedom).These results suggest that the contribution from LMXBs is smalland that the integrated X-ray emission from our late-type galaxiesis dominated by HMXBs. This implies that the evolution of ourlate-type galaxy samples is likely due to changes in star formationactivity.
Since the X-ray emission from our late-type galaxies is dom-inated by star formation processes, we note that ourM?-selectedstacking results provide a relatively unobscured measure of thestar formation activity per unit stellar mass (i.e., the SSFR; seeFig. 10b). We find that at z � 1 the X-ray emission per unitstellar mass is a factor of �2Y3 larger for galaxies with M? ¼(3Y10) ; 109 M� versus that observed for galaxies with M? ¼(1Y20) ; 1010 M�. At z � 1, we find that LX/M? is larger than itslocal value (S01) by factors of 6:4 � 2:2 and 5:8 � 1:6 for late-type galaxies with M? ¼ (3Y10) ; 109 M� and M? ¼ (1Y20) ;1010 M�, respectively. These results are broadly consistent withobserved differences in the mean SSFRs found by Zheng et al.(2007) for z � 1 galaxies of comparable stellar masses, and implythat the lower mass galaxies are undergoing more significant stel-lar mass growth over z � 0Y1 than more massive galaxies.
In order to quantify the dependences of the X-ray luminosityon redshift and physical properties, we performed multivariateparametric fitting to our stacked data. For each galaxy sampleselected via LB,M?, and SFR, we investigated the redshift evo-lution of the X-ray luminosity. For this analysis, we fit our datato a power-law parametric form:
log LX(fphys; z) ¼ Aþ B log fphys þ C log (1þ z); ð7Þ
where fphys is a place holder for each of the three physical prop-erties (LB,M?, and SFR) used for our sample selections, and A,B, and C are fitting constants. For each sample, we utilized ourX-ray stacking results, equation (7), and �2 fitting to estimatethe constants A, B, and C. For our adopted three-componentmodel, we constrained A, B, and C using 90% confidence errors(��2 ¼ 2:7). The S01 local data points were not used for thesefits due to differences in galaxy selection, instrument calibra-tion, and AGN identification.
In Table 3, we tabulate our constraints on �2, A, B, and C forthese fits.We find that this particular choice (i.e., eq. [7]) of param-eterization does not provide acceptable fits for galaxy samplesselected via LB andM?. However, for galaxy samples selected viaSFR, we find a good fit for this parameterization (�2 ¼ 9:72 for10 degrees of freedom).We constrain the evolution of log LX/SFRto be independent of or at most weakly dependent on redshift[ / (1þ z)0:32�0:88].
Based on radio observations of distant star-forming galaxieswith SFR � 3Y300M� yr�1 in the CDF-N and CDF-S, Bargeret al. (2007) reported that the X-ray upper limits for X-rayYundetected sources were below the level expected from theLX-SFR correlation, thus suggesting that the correlation maynot hold in the high-redshift universe. However, our stacking
MASS-DEPENDENT STAR FORMATION HISTORY 1175No. 2, 2008

results suggest that the LX-SFR correlation does in fact holdfor average galaxies with SFR = 1Y5 M� yr�1 (SFR = 15Y100 M� yr�1) out to z � 0:5 (z � 1:4).
For illustrative purposeswehave created Figure 11,which showslog SFR versus log LX for normal star-forming galaxies selectedfrom several different sources including X-rayYdetected galaxiesfrom our main sample ( filled gray circles and limits), stackedgalaxies from this study ( filled black symbols), local galaxiesfrom PR07 (open circles), local ultraluminous infrared galaxiesfrom PR07 (ULIRGs; open squares), and stacked z � 3 Lymanbreak galaxies (LBGs; stars; see x 6 for details). For all data usedin this plot, we have normalized SFRs appropriately to be con-sistent with our adopted Kroupa (2001) IMF and have adjustedX-ray luminosities to correspond to the 0.5Y8 keV band using a� ¼ 2 power-law SED. The best-fit LX-SFR correlations forlocal galaxies from PR07 (solid curve) and z = 0Y1.4 late-typegalaxies from this study (log LX/SFR = 39.87; dotted curve) havebeen shown for reference. For comparison, we have shown theSFRs for theMWand local galaxiesM101, M82, and NGC 3256.
5.2. AGN Contribution to Stacked Signals
In this section we estimate the contribution to our stackedsignals from contaminating AGNs that have X-ray luminositiesbelow our X-ray detection limit. This analysis is similar in natureto that in xx 3.1 and 3.2.2 of Lehmer et al. (2007), which wasperformed for early-type galaxies. We implement the observedcumulative AGN fraction fC: the fraction of galaxies harboringanAGNwith 2Y8 keV luminosity of L2Y8 keV or greater. Hereafter,we compute fC by taking the number of candidate AGNs in aparticular galaxy sample with a 2Y8 keV luminosity of L2Y8 keVor greater and dividing it by the number of galaxies in which wecould have detected an AGNwith luminosity L2Y8 keV. The latternumber is computed by considering the redshift of each galaxyand its corresponding sensitivity limit, as obtained from spa-tially varying sensitivity maps (see x 4.2 of Alexander et al. 2003and x 4 of Lehmer et al. 2005b); these sensitivity maps werecalibrated empirically using sources detected by wavdetect ata false-positive probability threshold of 1 ; 10�5.
The quantity fC is not only a function of L2Y8 keV, but is alsodependent on the selection of the galaxy sample considered: inour case redshift and the physical property fphys (i.e., LB, M?,and SFR) of the galaxy population may plausibly play a role infC . In our analyses, we assume that each of the respective depen-dencies (i.e., L2Y8 keV, z, and fphys) are independent of each other,such that fC / gL(L2Y8 keV) ; gz(z) ; gp( fphys), where gL, gz, andgp represents the functional dependence of the cumulative AGNfraction for each indicated variable L2Y8 keV, z, and fphys, re-spectively. We made use of the 2Y8 keV bandpass because of
its ability to probe relatively unattenuated X-ray emission in aregime of the X-ray spectrum where we expect there to beminimal emission from normal galaxies (see also criterion 1 ofx 4.1 for further details). In total 62 (�51%) of our 121 X-rayYdetected AGN candidates had 2Y8 keV detections; we usethese AGNs in our AGN fraction analyses.We began constructing fC by estimating the shape of
gL(L2Y8 keV) using late-type galaxies with z = 0Y1 and LB k 2 ;1010 LB;�, an optical luminosity regime where we have a rel-atively large number of sources and are sufficiently completeout to z ¼ 1 (see Fig. 4a). We split this sample into two subsetsabout z ¼ 0:6, to test whether there is substantial evolution in theshape and normalization of gL(L2Y8 keV) over this redshift range. InFigure 12, we show gL(L2Y8 keV) for galaxies in the redshift rangesz P 0:6 (zmedian ¼ 0:51; filled circles) and z = 0.6Y1 (zmedian ¼0:84; open triangles). From Figure 12, we see that the overallshape and normalization of gL(L2Y8 keV) for late-type galaxieswithLB k 2 ; 1010 LB;� is similar for galaxies at zmedian ¼ 0:51 andzmedian ¼ 0:84.We fit the shape of gL(L2Y8 keV) using least-squaresfitting of the 2Y8 keV luminosity dependent cumulative AGNfraction using all galaxies from z = 0 to 1with LB k 2 ; 1010 LB;�.For these fits, we found that the data were well fit by an expo-nential function, which we parameterized as log gL(L2Y8 keV) /a exp ½�b( log L2Y8 keV�39)2, where a and b are fitting constants.By construction, this function is only valid for log L2Y8 keV > 39,which is�1Y2 orders of magnitude less luminous than a typicalstacked X-ray luminosity of our late-type galaxy samples (seeTable 2 and Fig. 10). We find best-fit values of a ¼ �0:8 andb ¼ �0:05; in Figure 12 (thick black curve), we show our best-fit relation for gL(L2Y8 keV).
TABLE 3
Parametric Fitting Results for Stacked Samples
fphys(1)
�
(2)
�2
(3)
A
(4)
B
(5)
C
(6)
LB................. 11 25.37 31.34 � 1.23 0.85 � 0.13 2.91 � 0.61
M?................ 14 25.73 33.97 � 0.87 0.58 � 0.07 4.48 � 0.37
SFR ............. 10 9.72 39.91 � 0.06 0.89 � 0.11 0.32 � 0.88
Notes.—This table contains basic fitting parameters for �2 fits to our X-raystacking results. For each sample, selected by physical property fphys, we per-formed parametric fits for the mean 0.5Y8 keV luminosity LX following log LX ¼Aþ B log fphys þ C log (1þ z). Col. (1): Physical parameter fphys used in fittingour stacking results. Col. (2): Number of degrees of freedom used in each fit.Col. (3): Minimum �2 value for each fit. Cols. (4)Y(6): Best-fit values of A, B,and C with errors (90% confidence). For further details, see x 5.1.
Fig. 11.—Logarithm of the star formation rate log SFR vs. the logarithm ofthe X-ray luminosity ( log LX) for normal late-type galaxies. X-rayYdetectedsources from our main sample are indicated as small gray dots. Sources thatwere not detected in the 0.5Y8 keV bandpass but were detected in either the0.5Y2 keVor 2Y8 keV bandpasses are shown as upper limits. Results from ourX-ray stacking analyses of late-type galaxies selected via observed SFR are shownas large filled circles, squares, and triangles, which have the same meaning as inFig. 10c; z � 3 LBGs that were both uncorrected and corrected for AGN con-tamination have been shown plotted as a filled star and open star, respectively.For comparison, we show the local galaxy sample from PR07, which includesnormal late-type galaxies (open circles) and ultraluminous infrared galaxies(ULIRGs; open squares); the best-fit PR07 relation is shown as a solid curve.The SFRs for the MW and local galaxies M101, M82, and NGC 3256 are in-dicated (horizontal dashed lines).
LEHMER ET AL.1176 Vol. 681

We constrained further the redshift evolution of fC [i.e., theshape of gz(z)] by dividing our main late-type galaxy sample intofive nearly independent redshift bins (with z ¼ 0:1Y0:8) and cal-culating fC for fixed ranges of L2Y8 keV and fphys. In Figure 13, weshow gz(z) as a function of redshift for late-type galaxies withL2Y8 keV k 1041:5 ergs s�1 and LB k 1010 LB;�, the approximatecompleteness limit at z � 0:8 (see Fig. 4a). Using these data and�2 fitting [assuming a (1þ z)n dependence], we constrained theredshift evolution of gz(z) to be proportional to (1þ z)0:15�0:97;similar results were found for different ranges of L2Y8 keV andLB. This result differs from that observed for early-type galaxies,where the AGN fraction and meanAGN emission has been foundto evolve as �(1þ z)3 (e.g., Brand et al. 2005; Lehmer et al.2007).20 We therefore conclude that there is little redshift evo-lution in the late-type galaxyAGN fraction over the redshift rangez ¼ 0:1Y0:8, and hereafter we assume that gz(z) remains roughlyconstant out to z ¼ 1:4.
To constrain the overall dependence of fC on fphys [i.e.,gp( fphys)], we calculated the cumulative AGN fractions for late-type galaxy samples with fphys by holding the ranges of L2Y8 keVand z fixed and varying fphys. In Figure 14, we show gp( fphys)versus log LB (Fig. 14, left), logM? (Fig. 14, middle), andlog SFR (Fig. 14, right) for L2Y8 keV k 1041:5 ergs s�1 at z P 0:6(dashed curves) and z = 0.6Y1 (dotted curves). We calculatedgp( fphys) for intervals of fphys where we are approximately com-plete at z ¼ 0:6 (for the z P 0:6 interval) and z ¼ 1 (for thez = 0.6Y1 interval; see Fig. 4). For each sample, we again uti-lized least-squares fitting to approximate the fphys dependenceof gp( fphys). These fits were performed using all data over theredshift range z = 0Y1 assuming a functional dependence oflog gp( fphys) / c log fphys. In each panel of Figure 14, we showthe best-fit solutions for gp( fphys) with the gray lines. We find
that the AGN fraction is strongly dependent on LB (Fig. 14, left)and M? (Fig. 14, middle), such that more optically luminousand massive galaxies have larger AGN fractions; this result isconsistent with other studies of the AGN host galaxies (e.g.,Kauffmann et al. 2003b; Nandra et al. 2007; Silverman et al.2008). Also, the AGN fraction seems to be mildly dependenton the galaxy SFR; however, this is likely due to the fact thatthe SFR is larger on average for more massive galaxies.
Based on the above estimates of the shapes of gL(L2Y8 keV),gz(z), and gp( fphys), we approximated empirically fC for eachchoice of fphys following
log fC ¼ log g0 þ a exp ½�b( log L2Y8 keV � 39)2 þ c log fphys;
ð8Þ
where g0 represents the normalization of each relation based onthe value of fC at L2Y8 keV > 1041:5 ergs s�1 and LB ¼ 1010 LB;�,M? ¼ 1010 M�, and SFR = 2 M� yr�1, for galaxy samplesselected via LB,M?, and SFR, respectively. We note that only g0and c are dependent on our choice of fphys; we find for the set ofphysical parameters fphys = [LB,M?, SFR] that g0 = [6:1 ; 10�14,8:2 ; 10�8, 0.20] and c ¼ [1.2, 0.67, 0.66]. For reference, inFigure 12 we have shown curves of fC for LB ¼ 5 ; 109, 1010,and 1011 LB;� (dotted curves).
To estimate the AGN contamination expected for each of ourstacked samples presented in x 5.1, we followed closely theprocedure in x 3.2.2 of Lehmer et al. (2007). For completeness,we outline this procedure below.
For each stacked sample, we used equation (8) to computecumulative AGN fractions fC . In Figure 15a, we show fC fortwo of our LB-selected samples: z � 0:2 galaxies with LB ¼109:5Y1010 LB;� (dashed curve) and z � 1:3 galaxies withLB ¼ 1010:5Y1011.3 LB;� (solid curve). We then converted fC foreach sample to a differential AGN fraction fD (i.e., the 2Y8 keVluminosity dependent fraction of galaxies harboring AGNswithin discrete X-ray luminosity bins of width� log L2Y8 keV ¼0:5; see Fig. 15b). For each sample, we calculated the 2Y8 keVluminosity dependent fraction of galaxies that were below ourL2Y8 keV detection limit fB (Fig. 15c). We then multiplied fD andfB to estimate the 2Y8 keV luminosity dependent fraction ofgalaxies harboring an AGN that was undetected in the Chandraexposures fU (i.e., fU ¼ fD ; fB; see Fig. 15d ); these AGNswould not have been removed for our stacking analyses. Fi-nally, we approximated the total 2Y8 keVAGN contamination
Fig. 13.—Cumulative redshift-dependent AGN fraction gz(z) vs. redshift forlate-type galaxy samples with LB k1010 LB;� and L2Y8 keV k1041:5 ergs s�1.Wefind no significant evolution of gz(z) over the redshift range z � 0:1Y0:8.
Fig. 12.—Cumulative X-ray luminosity dependent AGN fraction gL(L2Y8 keV)vs.L2Y8 keV for late-type galaxieswith LB k 2 ; 1010 LB;� at z P 0:6 ( filled circles)and z� 0.6Y1 (open triangles). For reference, we have indicated the correspondingAGN fraction for Lyman break galaxies at z � 3 ( filled stars; see x 5 for furtherdetails). We have indicated the median X-ray detection limit for galaxies in eachredshift range (downward-pointing arrows along the x-axis). The solid curverepresents the best-fit relation for gL(L2Y8 keV), which was fit using all late-type gal-axies with z � 0Y1 and LB k 2 ; 1010 LB;� in our main sample. For reference, wehave shown the estimated AGN fraction for galaxies with LB � 5 ; 109, 1010, and1011 LB;� (dotted curves; see x 5.2 for further details).
20 We note that the lack of evolution of the AGN fraction does not neces-sarily imply that the optically luminous (i.e., LB k1010 LB;�) late-type galaxyAGN number density is constant over z � 0Y1. For example, L�B has been shownto fade by�1 mag since z � 1 (e.g., Lilly et al. 1995; Wolf et al. 2003; Faber et al.2007), suggesting that there are fewer optically luminous late-type galaxies in thelocal universe than at z ¼ 1.
MASS-DEPENDENT STAR FORMATION HISTORY 1177No. 2, 2008

L0:5Y2 keV(contam) of each stacked sample using the followingsummation:
L2Y8 keV(contam) ¼Xi
fU ;i ; L2Y8 keV;i; ð9Þ
where the summation is over all bins of � log L2Y8 keV ¼ 0:5 inthe range log L2Y8 keV = 39Y45. We converted each value ofL2Y8 keV(contam) to estimated values of L0:5Y8 keV(contam) andL0:5Y2 keV(contam) by assuming the contaminating AGN emis-sion roughly follows an X-ray SED described by a power law.In order to constrain the average photon index of the power law,we stacked all X-rayYdetected AGNs in our stacked samples with0.5Y8 keV luminosities below 1042 ergs s�1. For these AGNs, wefind a stacked effective photon index of �eA ¼ 0:97 � 0:03. Ifthe intrinsic value of the photon index is � ¼ 2, at the medianredshift of our main sample (zmedian ¼ 0:5), �eA � 1 correspondsto an intrinsic X-ray column density of NH � (1Y2) ;1022 cm�2.If we assume �eA ¼ 1 describes well the effective SED of theX-rayYundetected AGNs in our stacked sample, we find thatAGN contamination can account for �1%Y30% (median of�5%) of the 0.5Y8 keVemission from our stacked samples, sug-gesting that AGNs are not providing a significant contributionto our stacked results. We note that the X-ray SED used in thiscalculation has an important effect on the overall estimate of theAGN contamination. Since our estimates for contamination inthe 0.5Y8 keV and 0.5Y2 keV bandpasses decrease as �eA de-creases, the amount of contamination in our samples may beunderestimated if our choice of �eA is too flat; however, we findthat for conservative choices of �eA (i.e., �eA P 2) that are rep-resentative of even unobscured AGNs (for reference, see Fig. 5),the AGN contamination remains low (P40%) and has nomaterialeffect on our results.
It is also worth noting that if there exists a large population ofintrinsically luminous yet heavily obscured AGNs in our high-redshift galaxy samples that are X-rayYundetected in the CDFs,then our conclusions above could be somewhat different. If sucha population were present and had significant influence on ourstacked results, then we would expect to find stacked X-rayspectra that were relatively flat (�eA P 1); however, as discussedin x 5.1, we find that very few of our stacked samples could havesuch flat spectra in our stacked samples, suggesting that such apopulation, if present, does not have a strong effect on our results.
In Table 2 (cols. [25]Y[27]), we have provided the esti-mated fractional AGN contribution to each stacked sample [i.e.,LE1YE2
(contam)/LE1YE2] for the FB, SB, and HB using the tech-
nique described above and an assumed�eA ¼ 1.We find that theestimated AGN contamination is most significant for galaxysamples with large values of LB, M?, and SFR.
6. EXTENSION TO DISTANT LYMAN BREAK GALAXIES
As noted in x 1, the global star formation rate density has beenobserved to increase with redshift out to z� 1Y1.5. Investigationsof the most distant LBGs at z� 2Y7 show that the star formationdensity peaks around z � 1Y3 and gradually declines towardhigher redshifts (e.g., Steidel et al. 1999; Giavalisco 2002; Gia-valisco et al. 2004b; Bouwens et al. 2004, 2005; Dickinson et al.2004). To investigate whether the mean X-ray activity from nor-mal late-type galaxies follows a similar trend, we study the X-rayproperties of a sample of z ¼ 3:01 � 0:24 LBGs, which wereidentified asU-band ‘‘dropouts’’ through theGOODS project (seeLehmer et al. 2005a for details).We filtered the GOODS z � 3 LBG sample (Lee et al. 2006)
to include only LBGs that (1) were within the central �4.00 ofthe �2 Ms CDF-N and �1 Ms CDF-S, and (2) had rest-frameB-band luminosities that were similar to the most optically lu-minous [LB ¼ (3Y20) ; 1010 LB;�] z ¼ 0Y1:4 late-type galaxiesused in this study. B-band luminosities were calculated by ap-plying k-corrections to the z850-band flux (from GOODS), wherek-corrections were derived using an SED appropriate for LBGs(see x 2.2 of Lehmer et al. 2005a for details). We found that85 z � 3 LBGs from the Lehmer et al. (2005a) sample satisfiedthese two selection criteria.We identified three X-rayYdetected LBGs, which all had
L2Y8 keV k1043 ergs s�1. Due to their high X-ray luminosities,we classified these sources as obvious AGNs. After removingthese three X-rayYdetected AGNs from our z � 3 LBG sample,we performed X-ray stacking analyses as described in x 4.2. Wefound a significant (3.7 �) detection in the 0.5Y2 keV bandpass,which corresponds roughly to rest-frame 2Y8 keV emission. As-suming an intrinsic power-law X-ray spectrum with a photonindex of �¼ 2, we found a mean 0.5Y8 keV luminosity of LX ¼(4:9 � 1:4) ; 1041 ergs s�1 for our z � 3 LBGs, a value thatagrees well with previous studies (e.g., Lehmer et al. 2005a;Laird et al. 2006).
Fig. 14.—Cumulative AGN fraction gp( fphys) vs. LB (left), M? (middle), and SFR (right) for late-type galaxies with L2Y8 keV k1041:5 ergs s�1 at z < 0:6 (dashedcurves) and z ¼ 0:6Y1 (dotted curves). In each plot, we have indicated the best-fit relation (solid line), which is calculated using all galaxies with L2Y8 keV k1041:5 ergs s�1
and z < 0:6. The downward-pointing arrows indicate which values of fphys were chosen for computing g0 in eq. (8). For reference, the bin sizes of fphys used to com-pute each value of gp( fphys) and the typical errors of gp( fphys) have been indicated in the lower right-hand corner of each plot.
LEHMER ET AL.1178 Vol. 681

Since our LBGs reside in the high-redshift universe, AGNcontamination is expected to have a more significant effect onthese results than it did for our z = 0Y1.4 late-type galaxies. Themedian X-ray luminosity detection limit is �8 ; 1041 ergs s�1
and�1043 ergs s�1 for the 0.5Y2 keVand 2Y8 keV bandpasses,respectively. To estimate the AGN contamination, we followedthe approach outlined in x 5.2, which made use of the 2Y8 keVluminosity dependent AGN fraction ( fC). In Figure 12 ( filledstars), we show the X-ray luminosity dependent AGN fractiongL;LBG(L2Y8 keV) for z � 3 LBGs. We note that at L2Y8 keV k 1043
ergs s�1, the cumulative AGN fraction for z � 3 LBGs is afactor of �3Y4 times larger than that computed for our z = 0Y1late-type galaxy sample with similar optical luminosities. Usingthe functional form for fC presented in equation (8), but with a�3Y4 times larger normalization factor for z � 3 LBGs [i.e.,g0;LBGs � (3Y4)g0], we find that AGN emission may plausiblyaccount for �50%Y70% of the stacked 0.5Y2 keV counts.
In Figure 16, we show the X-rayYtoYB-band mean luminosityratio for LB ¼ (3Y20) ; 1010 LB;� star-forming galaxies (i.e., late-type galaxies and LBGs) as a function of the age of the universe.Together, these data span �85% of cosmic history (i.e., out toz � 3). As presented in x 5.1, LX/LB shows significant evolutionover the redshift range z = 0Y1.4, and after correcting for AGNcontamination, we find that LX/LB is similar for z � 3 LBGs andz ¼ 1:4 late-type galaxies. This result suggests that the non-AGNX-ray emission for the most luminous star-forming galaxies mayflatten near z � 1.4Y3, which has been predicted roughly fromsimulations of how the normal-galaxy X-ray emission is ex-pected to respond due to global changes in the star formationrate density (e.g., Ghosh & White 2001).
To test whether the LX-SFR correlation is similar for z � 3LBGs as we found for late-type galaxies at z = 0Y1.4, we ap-proximated absorption-corrected SFRs for the z � 3 LBGsusing UV-band emission. These SFRs were approximated fol-lowing SFR = 9:8 ; 10�11 LUV, where � 6 is the absorption-correction factor (see Giavalisco et al. 2004b). As described inx 3.3, we approximated the UV luminosity following LUV ¼3:3�l�(2800 8); however, here l�(2800 8) was derived usingour adopted LBG SED.We find that the mean SFR for opticallyluminous z � 3 LBGs is�60M� yr�1. After correcting the meanstacked X-ray luminosity for AGN contamination, we find anX-rayYtoYSFR ratio of log LX/SFR� 39.4Y39.6, which is sug-gestively lower than its value for z ¼ 0Y1:4 late-type galaxies(i.e., log LX/SFR = 39.87 � 0.04). We note, however, that theestimation of the mean SFR for these galaxies is based solely onthe 2800 8 emission and is therefore highly uncertain; furtherconstraints on themean infrared luminosity of these sourceswouldhelp considerably. For reference, in Figure 11 we have plottedlog SFR versus log LX for the z � 3 LBGs both uncorrected( filled star) and corrected (open star) for AGN contamination.
It is interesting to note that the AGN-corrected LBG sampleappears to have LX and SFR values similar to those of localULIRGs, which are relatively X-ray underluminous for theirderived SFRs. PR07 suggest that galaxies with SFRs that begin
Fig. 15.—(a) Cumulative AGN fraction (i.e., the fraction of galaxies harboringan AGNwith a 2Y8 keV luminosity of L2Y8 keV or greater), fC , vs. log L2Y8 keV fortwo of our stacked samples: z � 0:2 galaxies with LB ¼ 109:5Y1010 LB;� (dashedcurve) and z � 1:3 galaxieswith LB ¼ 1010:5Y1011.3LB;� (solid curve). Each curvewas computed following eq. (8). (b) Differential AGN fractions (i.e., the fractionof galaxies harboring an AGN in discrete bins of width � log L2Y8 keV ¼ 0:5),fD, vs. log L2Y8 keV. (c) Fraction of late-type galaxies for which we could nothave detected an AGN with a 2Y8 keV luminosity of L2Y8 keV, fB, vs. log L2Y8 keV.(d ) Fraction of galaxies harboring AGNs in our optically luminous faded samplesthat would remain undetected due to sensitivity limitations, fU ¼ fD ; fB, vs.log L2Y8 keV; these galaxies would not have been removed from our stackinganalyses.
Fig. 16.—Logarithm of the X-rayYtoYB bandmean luminosity ratio log LX/LBvs. the age of the universe (for our adopted cosmology, the current age of theuniverse is 13.47 Gyr) for star-forming galaxies with LB ¼ (3Y20) ; 1010 LB;�.For reference, redshift has been plotted along the top axis. We have included meanvalues of LX/LB for the S01 local sample of late-type galaxies (open circles), ourstacked samples at z � 0:5Y1:4 (large filled circles), and z � 3 LBGs that wereboth uncorrected ( filled star) and corrected (open star) for AGN contamination.At z � 0:1Y0:4, we have plotted LX/LB for individual late-type galaxies fromour main sample (small filled circles and upper limits); the mean values and errorsfor these galaxies, computed using ASURV, have been indicated.
MASS-DEPENDENT STAR FORMATION HISTORY 1179No. 2, 2008

to exceed k50Y100M� yr�1, similar to the ULIRGs, may haveX-ray properties that are completely dominated by HMXBs. Insuch systems, other X-rayYemitting populations that may nor-mally be significant in more quiescent galaxies (e.g., LMXBs,hot gas, supernovae and their remnants, etc.) would collectivelycontribute only a negligible fraction of the total X-ray emission,thus causing the overall galaxies to appear X-ray underluminouscompared with the LX-SFR correlation. We note, however, thatour results presented in x 5.1 suggest that HMXBs likely dominatethe X-ray emission from galaxies with SFRs much lower thanthose of ULIRGs. Another possibility is that as the absorptionwithin the most actively star-forming galaxies increases with SFR(see discussion in x 5.1), the X-ray emission from point-sourcepopulations may become significantly obscured. Deep X-rayobservations of local LIRGs and ULIRGs with Chandra andXMM-Newton have found significant X-ray absorption in theirpoint-source populations (see, e.g., Lira et al. 2002; Zezas et al.2002, 2003), thus providing some support for this possibility.Future investigations into the nature of the X-ray populations ofULIRGs could help resolve this issue.
7. SUMMARY AND FUTURE WORK
We have investigated the X-ray emission from 2568 normallate-type galaxies over the redshift range z = 0Y1.4 that liewithin the Chandra Deep Fields (CDFs). Our late-type galaxysample was constructed primarily using color-magnitude dia-grams, which incorporated rest-frame U � V color and abso-lute V-band magnitudes, to isolate blue late-type galaxies (seex 2 for details). In total, 225 (�9%) of our late-type galaxieswere detected individually in the X-ray band. Based on X-rayand optical spectral properties, X-rayYtoYoptical flux ratios, thecorrelation between X-ray luminosity and star formation rate,and comparisons between infrared and radio properties, we inferthat 121 (�53%) of the X-rayYdetected late-type galaxies aredominated byAGN emission. The remaining 104X-rayYdetectedgalaxies had X-ray and multiwavelength properties consistentwith those of normal late-type galaxies with X-ray emission dom-inated by X-ray binaries (HMXBs and LMXBs). To study theX-ray emission and evolution from large representative popula-tions of late-type galaxies (i.e., including the X-rayYundetectedsources), we utilized X-ray stacking analyses of galaxy pop-ulations with AGN candidates removed. We stacked normal-galaxy samples that were selected via their rest-frame B-bandluminosity (LB), stellar mass (M?), and star formation rate (SFR)in redshift bins (see x 5.1). Furthermore, we compared theseresults with those found for a sample of z � 3 LBGs fromLehmeret al. (2005a). In the points below,we summarize our key findings:
1. We obtained significant detections in the 0.5Y2 keV and0.5Y8 keV bandpasses for all of our stacked samples. We esti-mated that LMXBs and low-level AGNs provide only low-levelcontributions to the stacked X-ray emission from our samplesand that HMXBs constitute the dominant X-rayYemitting com-ponent. Therefore, for these galaxies the X-ray emission is tracingprimarily star formation activity. Normal late-type galaxy samplesselected via LB and M? show significant (at the >99.9% confi-dence level) evolution in their average X-ray properties from z ¼0 to 1.4. For the most optically luminous (LB � 5 ; 1010 LB;�)and massive (M? � 3 ; 1010 M�) late-type galaxies at z ¼ 1:4,LX/LB and LX/M? are measured to be larger than their local valuesby factors of �2Y4 and �7Y13, respectively.
2. We find that late-type galaxies of lower stellar mass gen-erally have larger X-rayYtoYstellar mass mean ratios (LX/M?)than their higher mass analogs. Over z � 0.2Y1, galaxies with
M? � 6 ; 109 M� are a factor of �2Y3 times more X-ray lumi-nous per unit stellar mass than galaxies withM? � 3 ; 1010 M�.3. We characterized the X-ray properties of 888 24 �mY
detected late-type galaxies in our sample. The 24�mdata allowedus to select galaxy samples selected via their SFRs. For thesesamples, we found that the X-ray luminosity is well predictedby a constant LX-to-SFR ratio, similar to the LX-SFR correlationreported by previous authors (e.g., PR07). This implies that theLX-SFR correlation holds out to at least z ¼ 0:5, 1, and 1.4 forgalaxies with SFR � 2, 10, and 50 M� yr�1, respectively, andsupports the idea that the strong X-ray evolution observed fornormal late-type galaxies selected via LB andM? is likely due tostrong changes in SFR.4. The X-ray properties of our most optically luminous [LB ¼
(3Y20) ; 1010 LB;�] late-type galaxies at z ¼ 1:4 are comparableto those for z � 3 LBGs with similar optical luminosities, onceX-rayYundetected AGN contamination in the LBG populationhas been accounted for. This suggests that there may plausiblybe a flattening in the LX/LB-z relation for optically luminous star-forming galaxies between z� 1.4 and 3.We estimate a mean SFRof �60M� yr�1 for these LBGs. We find that the observed meanX-ray luminosity is suggestively underluminous based on theLX-SFR correlation prediction; this result is similar to that foundfor local ULIRGs with comparable SFRs.
The above results can be improved greatly through (1) thestudy of late-type galaxy populations in other existing multi-wavelength extragalactic survey fields that contain Chandra ob-servations, (2) additional observations of the CDFs to even bettersensitivity levels than are currently available, and (3) observationswith future X-ray missions with imaging capabilities that arecomplementary to those of Chandra.The areal footprint of the CDF regions used in this study totals
�0.18 deg2 (see x 2.1 for details), which severely limits the num-ber of galaxies being studied at z P 0:2. The redshift range z =0Y0.2 spans�2.5 Gyr of cosmic look-back time, compared withthe�6.6Gyr over z= 0.2Y1.4 that we aremost effectively studyingabove. Several complementary deep and wide extragalactic Chan-dra survey fields that have recently been conducted or are in pro-gress can improve the present situation. Three such ideal surveyfields are the�200ksAll-wavelengthExtendedGroth Strip Interna-tional Survey (AEGIS; e.g., Nandra et al. 2005; Davis et al. 2007),the�50 ks Chandra Cosmic Evolution Survey (C-COSMOS; PI:M. Elvis; see also Scoville et al. 2007),21 and the�5 ks NOAODeep Wide-Field Survey (NDWFS; e.g., Murray et al. 2005).Our study shows that identifying and removing contaminating
AGNs is a crucial ingredient to studying the stacked X-ray prop-erties of normal-galaxy samples (see x 5.2). In order to avoid sig-nificant levels of AGN contamination in shallower wide-areaChandra surveys such as AEGIS, C-COSMOS, and NDWFS,X-ray studies of normal galaxy populations must be limitedto lower redshift intervals. If we require a detection limit ofL0:5Y2 keV ¼ 1041:5 ergs s�1 over regions of each survey wherethe Chandra sensitivity is optimal (i.e., P6.00 from the Chandraaim points), then we estimate that AEGIS, C-COSMOS, andNDWFS could effectively be used to study normal late-type
21 We note that the C-COSMOS observing strategy has been designed to haveseveral overlapping�50 ks ACIS-I exposures; in these regions, the total exposurewill reach �200 ks due to the overlapping exposures. However, the analysespresented in this paper utilize only high-qualityChandra imaging at off-axis anglesof P6.00 (see x 2.1 for additional justification), where there is very little overlap inthe C-COSMOS Chandra pointings. We therefore do not consider the overlappingregions of the C-COSMOS exposures in this discussion. For additional informationregarding C-COSMOS, see http://cfa-www.harvard.edu/hea/cos/C-COSMOS.html.
LEHMER ET AL.1180 Vol. 681

galaxy populations at redshifts less than �0.5, �0.25, and �0.1,respectively. When factoring in the areal coverage of these fields,we estimate that AEGIS andC-COSMOSwill contain�250Y350late-type galaxies with LB k 3 ; 109 LB;� at z = 0.1Y0.2 (i.e., afactor of �3 larger than the CDFs) and that AEGIS, C-COSMOS,and NDWFS taken together will have�100Y250 similar galaxiesat z P 0:1 (i.e., a factor of �22 times larger than the CDFs).Studying these galaxy populations would significantly improveconstraints on the X-ray properties of z P 0:2 late-type galaxies.
Deeper Chandra observations of the CDFs would provideadditional insight into the X-ray properties of the normal late-typegalaxy populations presented in this study and enable us to extendour analyses to higher redshifts. Typical galaxies in our samplehave mean X-ray luminosities of LX � 1039:5Y1040 ergs s�1. Inthe �2 Ms CDF-N, where our Chandra sensitivity is greatest,we expect that galaxies with LX � 1039:5 ergs s�1 should bedetectable out to z � 0:2. Out of the 11 late-type galaxies withLB k109 LB;� at z P 0:2, we find X-ray detections for 8 ofthem (�72%). Deeper Chandra observations over the CDFswill allow for the detection of such galaxies out to progressivelyhigher redshifts. For Chandra exposures of�5Ms and�10Ms,a source with LX � 1039:5 ergs s�1 should be detectable out toz � 0:3 and z � 0:4, respectively. If we pessimistically assumean X-ray detection fraction of�70%, we estimate that�30 and�50 normal galaxies would be detected individually for eachrespective deep exposure. The individual detection of these gal-axies would allow for improved constraints on both the X-rayluminosity functions of normal late-type galaxies at higher red-shifts and the low-luminosity AGN contributions to our stackedsignals. At higher redshifts, an �5 Ms and �10 Ms Chandraexposurewould enable us to effectively perform studies of normallate-type galaxies, similar to those presented in this paper, out toz � 2 and z � 2:5, respectively. Such a data set would provide,for the first time, a reliable constraint on the X-ray emission fromnormal star-forming galaxies near the peak of the global star for-mation rate density at z � 1.5Y3.
In addition to the improvement that additional Chandra ob-servations could provide, future X-ray missions such as XEUSandGeneration-X22 should enable new scientific investigationsof distant normal galaxies. XEUS will be able to place significantspectral constraints for sources with 0.5Y2 keV fluxes down to�10�17 ergs cm�2 s�1, a level fainter than many of the averagefluxes derived from our samples.Generation-X is planned to pro-vide imaging with �0.100 per resolution element and will easilyprobe to flux levels of �10�19 ergs cm�2 s�1 (LX � 5 ; 1038 ergss�1 at z ¼ 1). At these levels, the first detailed investigations ofthe evolution of the normal late-type galaxy X-ray luminosityfunction can be performed effectively out to z k1 without con-fusion problems due to the crowding of large numbers of sources.Furthermore, these observations will allow for new constraintsto be placed on the X-ray populations of all normal galaxies inthe observable universe that are offset by more than �0.8 kpcfrom their host-galaxy nuclei.
We thank Robin Ciardullo, Doug Cowen, Mike Eracleous,Caryl Gronwall, Bin Luo, BrendanMiller, TimRoberts, andOhadShemmer for useful suggestions,which have improved the qualityof this paper. We also thank the referee for carefully reviewingthe manuscript and providing detailed comments. We gratefullyacknowledge financial support from Chandra X-ray Center grantG04-5157A (B. D. L., W. N. B., A. T. S.), the Science andTechnology Facilities Council fellowship program (B. D. L.),the Royal Society (D. M. A.), the Emmy Noether Program of theDeutsche Forschungsgemeinscaft (E. F. B.), NASA LTSAgrant NAG5-13102 (D. H. M.), the Chandra Fellowship pro-gram (F. E. B.), and NSF grant AST 06-07634 (D. P. S.).
REFERENCES
Afonso, J., Mobasher, B., Koekemoer, A., Norris, R. P., & Cram, L. 2006, AJ,131, 1216
Alexander, D. M., Aussel, H., Bauer, F. E., Brandt, W. N., Hornschemeier, A. E.,Vignali, C., Garmire, G. P., & Schneider, D. P. 2002, ApJ, 568, L85
Alexander, D. M., et al. 2003, AJ, 126, 539Alonso-Herrero, A., et al. 2006, ApJ, 640, 167Baldry, I. K., Glazebrook, K., Brinkmann, J., Ivezic, Z., Lupton, R. H., Nichol,R. C., & Szalay, A. S. 2004, ApJ, 600, 681
Barger, A. J., Cowie, L. L., & Wang, W.-H. 2007, ApJ, 654, 764Barger, A. J., et al. 2003, AJ, 126, 632Bauer, F. E., Alexander, D. M., Brandt,W. N., Hornschemeier, A. E., Vignali, C.,Garmire, G. P., & Schneider, D. P. 2002a, AJ, 124, 2351
Bauer, F. E., Alexander, D. M., Brandt, W. N., Schneider, D. P., Treister, E.,Hornschemeier, A. E., & Garmire, G. P. 2004, AJ, 128, 2048
Bauer, F. E., Brandt, W. N., & Lehmer, B. 2003, AJ, 126, 2797Bauer, F. E., et al. 2002b, AJ, 123, 1163Bell, E. F. 2003, ApJ, 586, 794Bell, E. F., & de Jong, R. S. 2001, ApJ, 550, 212Bell, E. F., McIntosh, D. H., Katz, N., & Weinberg, M. D. 2003, ApJS, 149, 289Bell, E. F., Zheng, X. Z., Papovich, C., Borch, A., Wolf, C., &Meisenheimer, K.2007, ApJ, 663, 834
Bell, E. F., et al. 2004a, ApJ, 608, 752———. 2004b, ApJ, 600, L11———. 2005, ApJ, 625, 23Blanton, M. R., et al. 2003, ApJ, 594, 186Borch, A., et al. 2006, A&A, 453, 869Bouwens, R. J., Illingworth, G. D., Thompson, R. I., & Franx, M. 2005, ApJ,624, L5
Bouwens, R. J., et al. 2004, ApJ, 616, L79Brand, K., et al. 2005, ApJ, 626, 723Brandt, W. N., & Hasinger, G. 2005, ARA&A, 43, 827
Brandt, W. N., Hornschemeier, A. E., Schneider, D. P., Alexander, D. M.,Bauer, F. E., Garmire, G. P., & Vignali, C. 2001, ApJ, 558, L5
Bundy, K., et al. 2006, ApJ, 651, 120Caldwell, J. A. R., et al. 2005, ApJS, submitted (astro-ph/0510782)Capak, P., et al. 2004, AJ, 127, 180Church, M. J., & Balucinska-Church, M. 2001, A&A, 369, 915Cohen, J. G. 2003, ApJ, 598, 288Colbert, E. J.M., Heckman, T.M., Ptak, A. F., Strickland, D. K., &Weaver, K. A.2004, ApJ, 602, 231
Colbert, J. W., et al. 2006, ApJ, 648, 250Cowie, L. L., Songaila, A., Hu, E. M., & Cohen, J. G. 1996, AJ, 112, 839Daddi, E., et al. 2007a, ApJ, 670, 156———. 2007b, ApJ, 670, 173Dale, D. A., Helou, G., Contursi, A., Silbermann, N. A., & Kolhatkar, S. 2001,ApJ, 549, 215
Davis, M., et al. 2007, ApJ, 660, L1de Vaucouleurs, G., de Vaucouleurs, A., Corwin, H. G., Buta, R. J., Paturel, G., &Fouque, P. 1991, Third Reference Catalog of Bright Galaxies (Berlin: Springer)
Dickinson, M., et al. 2004, ApJ, 600, L99Doane, N. E., Sanders, W. T., Wilcots, E. M., & Juda, M. 2004, AJ, 128, 2712Donley, J. L., Rieke, G.H., Perez-Gonzalez, P. G., Rigby, J. R.,&Alonso-Herrero,A. 2007, ApJ, 660, 167
Fabbiano, G. 1989, ARA&A, 27, 87———. 2006, ARA&A, 44, 323Fabbiano, G., Kim, D.-W., & Trinchieri, G. 1992, ApJS, 80, 531Fabbiano, G., & Shapley, A. 2002, ApJ, 565, 908Faber, S. M., et al. 2007, ApJ, 665, 265Fazio, G. G., et al. 2004, ApJS, 154, 10Fioc, M., & Rocca-Volmerange, B. 1997, A&A, 326, 950Freeman, P. E., Kashyap, V., Rosner, R., & Lamb, D. Q. 2002, ApJS, 138, 185Gawiser, E., et al. 2006, ApJS, 162, 1
22 For additional information regarding the future X-raymissions XEUS andGeneration-X, see http://www.rssd.esa.int /XEUS/ and http://genx.cfa.harvard.edu, respectively.
MASS-DEPENDENT STAR FORMATION HISTORY 1181No. 2, 2008

Georgakakis, A., Georgantopoulos, I., Stewart, G. C., Shanks, T., & Boyle, B. J.2003, MNRAS, 344, 161
Georgakakis, A., Rowan-Robinson,M., Babbedge, T. S. R., &Georgantopoulos,I. 2007, MNRAS, 377, 203
Georgantopoulos, I., Georgakakis, A., & Koulouridis, E. 2005, MNRAS, 360,782
Ghosh, P., & White, N. E. 2001, ApJ, 559, L97Giacconi, R., et al. 2002, ApJS, 139, 369Giavalisco, M. 2002, ARA&A, 40, 579Giavalisco, M., et al. 2004a, ApJ, 600, L93———. 2004b, ApJ, 600, L103Gilfanov, M. 2004, MNRAS, 349, 146Gilfanov, M., Grimm, H.-J., & Sunyaev, R. 2004a, Nucl. Phys. B Proc. Suppl.,132, 369
———. 2004b, MNRAS, 347, L57Gilli, R., et al. 2003, ApJ, 592, 721Gilmore, G., King, I., & van der Kruit, P. 1990, The Milky Way as a Galaxy(Sausalito: University Science Books)
Grazian, A., et al. 2006, A&A, 449, 951Grimm, H.-J., Gilfanov, M., & Sunyaev, R. 2002, A&A, 391, 923———. MNRAS, 339, 793Hammer, F., Puech, M., Chemin, L., Flores, H., & Lehnert, M. D. 2007, ApJ,662, 322
Haussler, B., et al. 2007, ApJS, 172, 615Hogg, D. W., Baldry, I. K., Blanton, M. R., & Eisenstein, D. J. 2002a, preprint(astro-ph/0210394)
Hogg, D. W., et al. 2002b, AJ, 124, 646———. 2004, ApJ, 601, L29Hopkins, A. M. 2004, ApJ, 615, 209Hornschemeier, A. E., et al. 2000, ApJ, 541, 49———. 2002, ApJ, 568, 82 (H02)———. 2003, AJ, 126, 575Irwin, J. A., Athey, A. E., & Bregman, J. N. 2003, ApJ, 587, 356Isobe, T., & Feigelson, E. 1990, BAAS, 22, 917Jenkins, L. P., Roberts, T. P., Ward, M. J., & Zezas, A. 2005, MNRAS, 357, 109Juneau, S., et al. 2005, ApJ, 619, L135Kauffmann, G., et al. 2003a, MNRAS, 341, 54———. 2003b, MNRAS, 346, 1055Kennicutt, R. C., Jr. 1998, ARA&A, 36, 189Kilgard, R. E., et al. 2005, ApJS, 159, 214Kim, D.-W., et al. 2006, ApJ, 644, 829Kroupa, P. 2001, MNRAS, 322, 231Kroupa, P., Tout, C. A., & Gilmore, G. 1993, MNRAS, 262, 545Labbe, I., et al. 2007, ApJ, 665, 944Laird, E. S., Nandra, K., Adelberger, K. L., Steidel, C. C., & Reddy, N. A.2005, MNRAS, 359, 47
Laird, E. S., Nandra, K., Hobbs, A., & Steidel, C. C. 2006, MNRAS, 373, 217Lavalley, M., Isobe, T., & Feigelson, E. 1992, in ASP Conf. Ser. 25, AstronomicalData Analysis Software and Systems I, ed. D. M.Worrall, C. Biemesderfer, &J. Barnes (San Francisco: ASP), 245
Lee, K.-S., Giavalisco, M., Gnedin, O. Y., Somerville, R. S., Ferguson, H. C.,Dickinson, M., & Ouchi, M. 2006, ApJ, 642, 63
Le Fevre, O., et al. 2004, A&A, 428, 1043Lehmer, B. D., et al. 2005a, AJ, 129, 1———. 2005b, ApJS, 161, 21———. 2006, AJ, 131, 2394———. 2007, ApJ, 657, 681Lilly, S. J., Le Fevre, O., Hammer, F., & Crampton, D. 1996, ApJ, 460, L1Lilly, S. J., Tresse, L., Hammer, F., Crampton, D., & Le Fevre, O. 1995, ApJ,455, 108
Lira, P., Ward, M. J., Zezas, A., & Murray, S. S. 2002, MNRAS, 333, 709Liu, Q. Z., & Mirabel, I. F. 2005, A&A, 429, 1125Liu, Q. Z., van Paradijs, J., & van den Heuvel, E. P. J. 2006, A&A, 455, 1165Lockman, F. J. 2004, Soft X-Ray Emission from Clusters of Galaxies andRelated Phenomena, ed. R. Lieu (Dordrecht: Kluwer), 111
Lonsdale, C. J., et al. 2003, PASP, 115, 897Maccacaro, T., Gioia, I. M., Wolter, A., Zamorani, G., & Stocke, J. T. 1988,ApJ, 326, 680
Madau, P., Ferguson, H. C., Dickinson, M. E., Giavalisco, M., Steidel, C. C., &Fruchter, A. 1996, MNRAS, 283, 1388
McIntosh, D. H., et al. 2005, ApJ, 632, 191McKee, C. F., & Williams, J. P. 1997, ApJ, 476, 144Mignoli, M., et al. 2005, A&A, 437, 883
Mobasher, B., et al. 2004, ApJ, 600, L167Moran, E. C., Filippenko, A. V., & Chornock, R. 2002, ApJ, 579, L71Moy, E., Barmby, P., Rigopoulou, D., Huang, J.-S., Willner, S. P., & Fazio, G. G.2003, A&A, 403, 493
Murray, S. S., et al. 2005, ApJS, 161, 1Nandra, K., Mushotzky, R. F., Arnaud, K., Steidel, C. C., Adelberger, K. L.,Gardner, J. P., Teplitz, H. I., & Windhorst, R. A. 2002, ApJ, 576, 625
Nandra, K., et al. 2005, MNRAS, 356, 568———. 2007, ApJ, 660, L11Noeske, K. G., et al. 2007a, ApJ, 660, L43———. 2007b, ApJ, 660, L47Norman, C., et al. 2004, ApJ, 607, 721Olsen, L. F., et al. 2006, A&A, 456, 881Papovich, C., & Bell, E. F. 2002, ApJ, 579, L1Peng, C. Y., Ho, L. C., Impey, C. D., & Rix, H.-W. 2002, AJ, 124, 266Perez-Gonzalez, P. G., et al. 2005, ApJ, 630, 82Persic, M., & Rephaeli, Y. 2007, A&A, 463, 481 (PR07)Persic, M., Rephaeli, Y., Braito, V., Cappi, M., Della Ceca, R., Franceschini, A.,& Gruber, D. E. 2004, A&A, 419, 849
Peterson, K. C., Gallagher, S. C., Hornschemeier, A. E., Muno, M. P., & Bullard,E. C. 2006, AJ, 131, 133
Ptak, A., Griffiths, R., White, N., & Ghosh, P. 2001, ApJ, 559, L91Ptak, A., Mobasher, B., Hornschemeier, A., Bauer, F., & Norman, C. 2007,ApJ, 667, 826
Ranalli, P., Comastri, A., & Setti, G. 2003, A&A, 399, 39Ravikumar, C. D., et al. 2007, A&A, 465, 1099Reddy, N. A., & Steidel, C. C. 2004, ApJ, 603, L13Richards, E. A., Kellermann, K. I., Fomalont, E. B., Windhorst, R. A., &Partridge, R. B. 1998, AJ, 116, 1039
Rieke, G. H., et al. 2004, ApJS, 154, 25Rix, H., et al. 2004, ApJS, 152, 163Rosa-Gonzalez, D., Burgarella, D., Nandra, K., Kunth, D., Terlevich, E., &Terlevich, R. 2007, MNRAS, 379, 357
Rovilos, E., Georgakakis, A., Georgantopoulos, I., Afonso, J., Koekemoer, A. M.,Mobasher, B., & Goudis, C. 2007, A&A, 466, 119
Sanders, D. B., Mazzarella, J. M., Kim, D.-C., Surace, J. A., & Soifer, B. T.2003, AJ, 126, 1607
Sasaki, M., Pietsch, W., & Haberl, F. 2003, A&A, 403, 901Schiminovich, D., et al. 2005, ApJ, 619, L47Schmitt, H. R., Calzetti, D., Armus, L., Giavalisco, M., Heckman, T. M.,Kennicutt, R. C., Jr., Leitherer, C., & Meurer, G. R. 2006, ApJ, 643, 173
Scoville, N., et al. 2007, ApJS, 172, 1Shapley, A., Fabbiano, G., & Eskridge, P. B. 2001, ApJS, 137, 139 (S01)Shen, S., Mo, H. J., White, S. D. M., Blanton, M. R., Kauffmann, G., Voges, W.,Brinkmann, J., & Csabai, I. 2003, MNRAS, 343, 978
Silverman, J. D., et al. 2008, ApJ, 675, 1025Snellen, I. A. G., & Best, P. N. 2001, MNRAS, 328, 897Soria, R., & Wu, K. 2003, A&A, 410, 53Spergel, D. N., et al. 2003, ApJS, 148, 175Stark, A. A., Gammie, C. F., Wilson, R. W., Bally, J., Linke, R. A., Heiles, C.,& Hurwitz, M. 1992, ApJS, 79, 77
Steffen, A. T., Brandt, W. N., Alexander, D. M., Gallagher, S. C., & Lehmer, B. D.2007, ApJ, 667, L25
Steidel, C. C., Adelberger, K. L., Giavalisco, M., Dickinson, M., & Pettini, M.1999, ApJ, 519, 1
Strateva, I., et al. 2001, AJ, 122, 1861Swartz, D. A., Ghosh, K. K., McCollough, M. L., Pannuti, T. G., Tennant, A. F.,& Wu, K. 2003, ApJS, 144, 213
Szokoly, G. P., et al. 2004, ApJS, 155, 271Tozzi, P., et al. 2006, A&A, 451, 457Tzanavaris, P., & Georgantopoulos, I. 2008, A&A, in press (arXiv:0801.4381)Tzanavaris, P., Georgantopoulos, I., & Georgakakis, A. 2006, A&A, 454, 447Vanzella, E., et al. 2005, A&A, 434, 53———. 2006, A&A, 454, 423Wirth, G. D., et al. 2004, AJ, 127, 3121Wolf, C., Meisenheimer, K., Rix, H.-W., Borch, A., Dye, S., & Kleinheinrich,M. 2003, A&A, 401, 73
Wolf, C., et al. 2004, A&A, 421, 913Zezas, A., Fabbiano, G., Rots, A. H., & Murray, S. S. 2002, ApJS, 142, 239Zezas, A., Ward, M. J., & Murray, S. S. 2003, ApJ, 594, L31Zheng, X. Z., Bell, E. F., Papovich, C., Wolf, C., Meisenheimer, K., Rix, H.-W.,Rieke, G. H., & Somerville, R. 2007, ApJ, 661, L41
LEHMER ET AL.1182