Embed Size (px)
Citation preview

Dula Thoroughfare Stream and Wetland Restoration
EEP Project No. 65
2011 Monitoring Report: Year 5 of 5
Construction Completed: February 2007 Submission Date: April 2012
Submitted to: NCDENR-EEP
1652 Mail Service Center Raleigh, NC 27699-1652

Dula Thoroughfare Stream and April 2012 Wetland Restoration Monitoring Year 5 of 5 EEP Project No. 65
Table of Contents SECTION 1 – EXECUTIVE SUMMARY 1.1 Goals and Objectives .................................................................................. 1-1 1.2 Vegetation Assessment ............................................................................... 1-2 1.3 Stream Assessment .................................................................................... 1-3 1.4 Wetland Assessment ................................................................................... 1-4 1.5 Annual Monitoring Summary ....................................................................... 1-4 SECTION 2 – METHODOLOGY 2.1 Methodology ................................................................................................ 2-1 SECTION 3 – REFERENCES SECTION 4 – APPENDICES
List of Appendices
Appendix A – Project Vicinity Map and Background Tables
Figure 1 Project Vicinity Map and Directions Table 1 Project Restoration Components Table 2 Project Activity and Reporting History Table 3 Project Contacts Table Table 4 Project Attribute Table
Appendix B – Visual Assessment Data
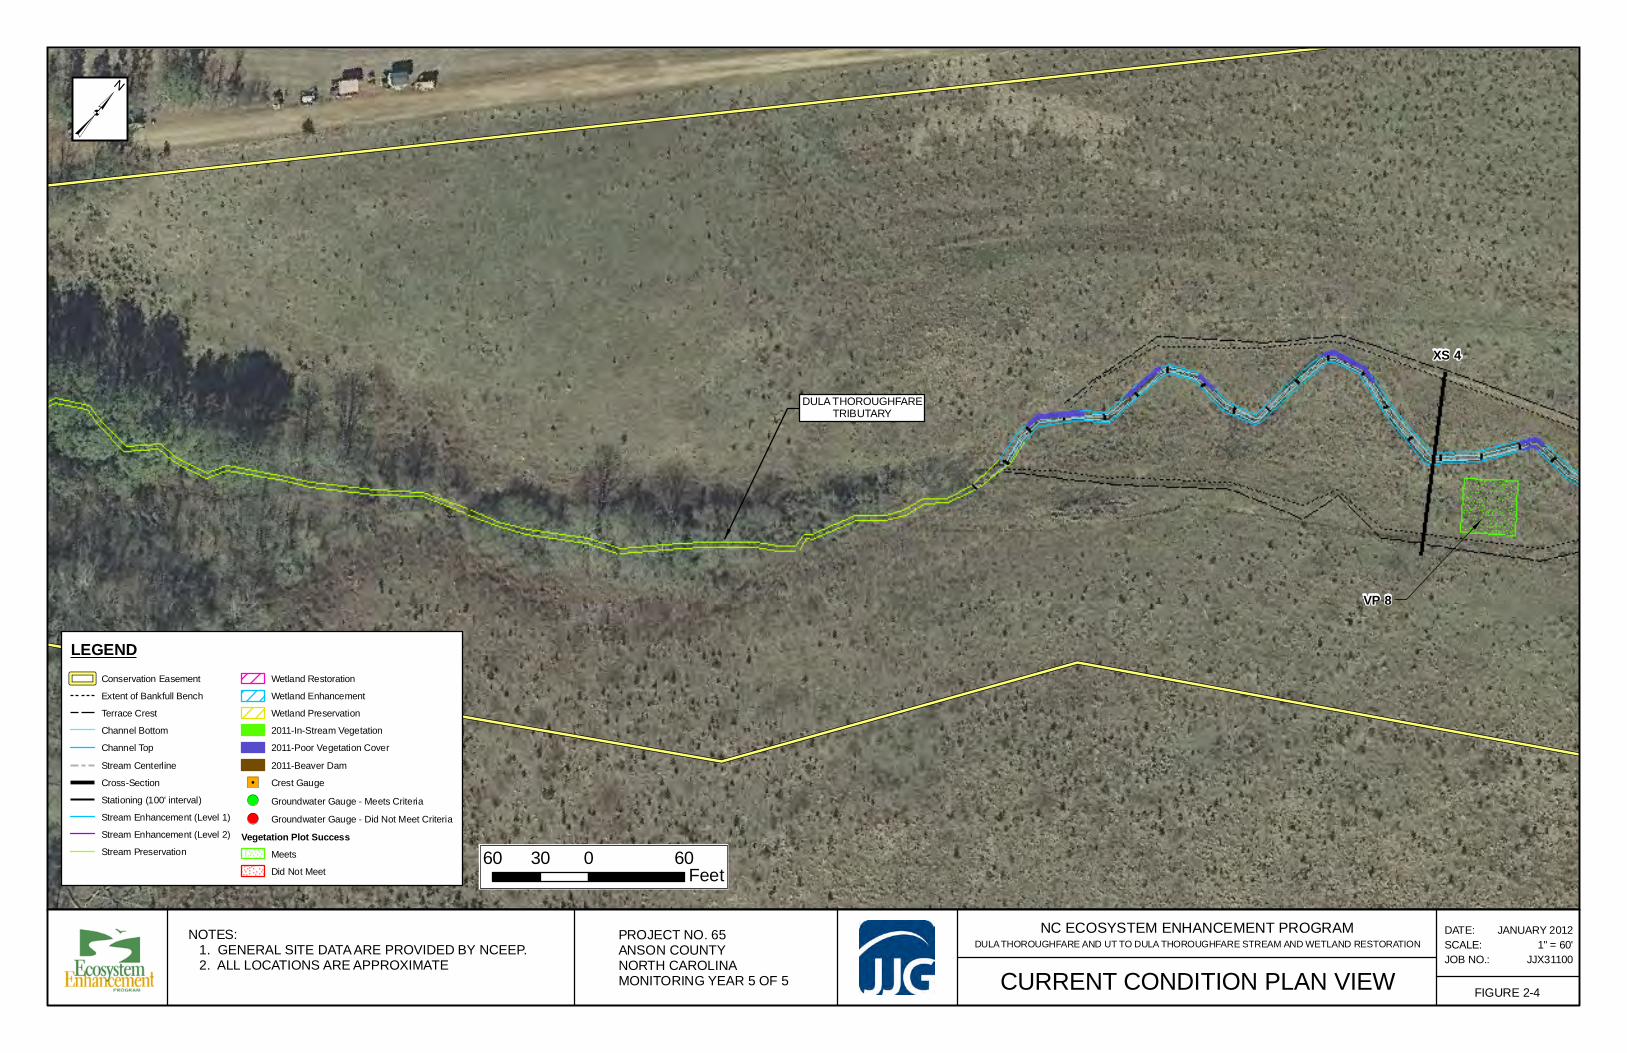
Figure 2 Current Condition Plan View (CPV) Table 5 Visual Stream Morphology Stability Assessment Table Table 6 Vegetation Condition Assessment Table Photos Stream Station Photos Photos Vegetation Plot Photos
Appendix C – Vegetation Plot Data
Table 7 Vegetation Plot Mitigation Success Summary Table Table 8 CVS Vegetation Metadata Table Table 9 CVS Stem Count Total and Planted by Plot and Species

Page ii Table of Contents
Dula Thoroughfare Stream and April 2012 Wetland Restoration Monitoring Year 5 of 5 EEP Project No. 65
Appendix D – Stream Survey Data
Figure 3a-d Cross-sections with annual overlays Figure 4 Longitudinal Profiles with Annual Overlays Figure 5a-d Pebble Count Plots with Annual Overlays Tables 10a,b Baseline – Stream Data Summary Tables Table 11a Monitoring – Cross-Section Morphology Data Table Table 11b Monitoring – Stream Reach Morphology Data Table
Appendix E – Hydrologic Data
Table 12 Verification of Bankfull Events Figure 6 Monthly Rainfall Data Figure 7a-c Precipitation and Water Level Plots Table 13 Wetland Hydrology Criteria Attainment

SECTION 1 EXECUTIVE SUMMARY
Page ii Table of Contents
Dula Thoroughfare Stream and April 2012 Wetland Restoration Monitoring Year 5 of 5 EEP Project No. 65
SECTION 1 EXECUTIVE SUMMARY
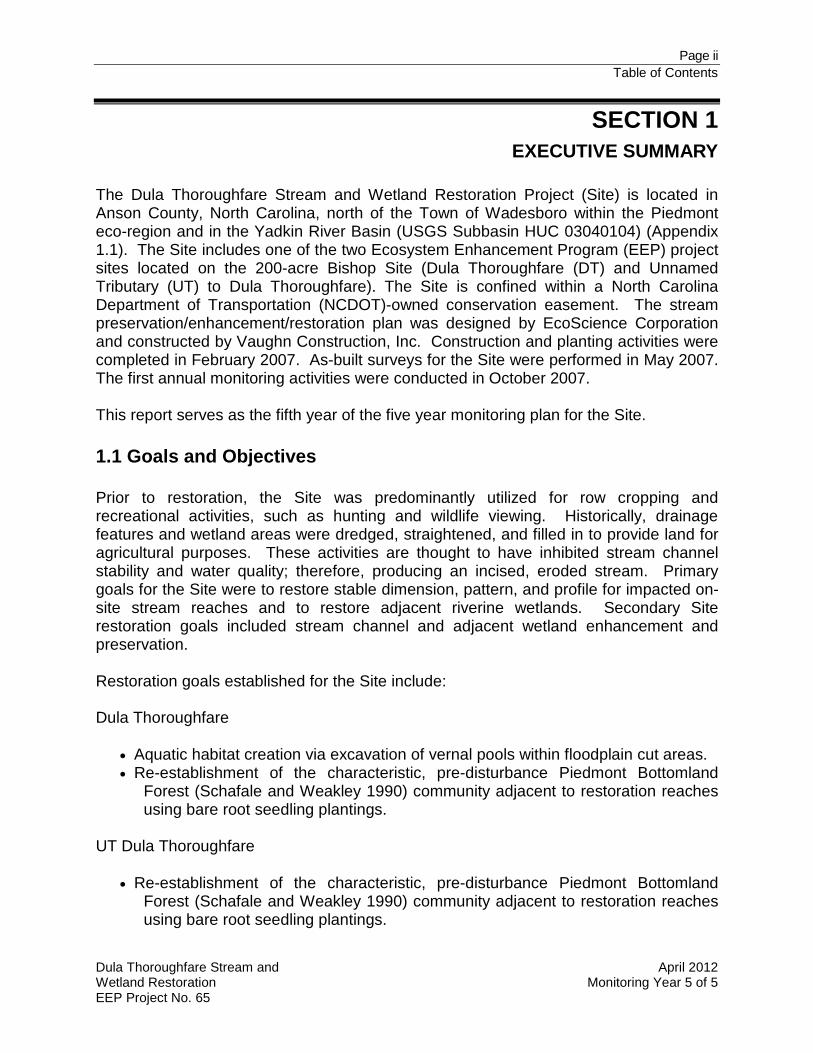
The Dula Thoroughfare Stream and Wetland Restoration Project (Site) is located in Anson County, North Carolina, north of the Town of Wadesboro within the Piedmont eco-region and in the Yadkin River Basin (USGS Subbasin HUC 03040104) (Appendix 1.1). The Site includes one of the two Ecosystem Enhancement Program (EEP) project sites located on the 200-acre Bishop Site (Dula Thoroughfare (DT) and Unnamed Tributary (UT) to Dula Thoroughfare). The Site is confined within a North Carolina Department of Transportation (NCDOT)-owned conservation easement. The stream preservation/enhancement/restoration plan was designed by EcoScience Corporation and constructed by Vaughn Construction, Inc. Construction and planting activities were completed in February 2007. As-built surveys for the Site were performed in May 2007. The first annual monitoring activities were conducted in October 2007.
This report serves as the fifth year of the five year monitoring plan for the Site. 1.1 Goals and Objectives Prior to restoration, the Site was predominantly utilized for row cropping and recreational activities, such as hunting and wildlife viewing. Historically, drainage features and wetland areas were dredged, straightened, and filled in to provide land for agricultural purposes. These activities are thought to have inhibited stream channel stability and water quality; therefore, producing an incised, eroded stream. Primary goals for the Site were to restore stable dimension, pattern, and profile for impacted on-site stream reaches and to restore adjacent riverine wetlands. Secondary Site restoration goals included stream channel and adjacent wetland enhancement and preservation. Restoration goals established for the Site include: Dula Thoroughfare • Aquatic habitat creation via excavation of vernal pools within floodplain cut areas. • Re-establishment of the characteristic, pre-disturbance Piedmont Bottomland
Forest (Schafale and Weakley 1990) community adjacent to restoration reaches using bare root seedling plantings.
UT Dula Thoroughfare • Re-establishment of the characteristic, pre-disturbance Piedmont Bottomland
Forest (Schafale and Weakley 1990) community adjacent to restoration reaches using bare root seedling plantings.

Page ii Table of Contents
Dula Thoroughfare Stream and April 2012 Wetland Restoration Monitoring Year 5 of 5 EEP Project No. 65
The project objectives include: Dula Thoroughfare • Priority II stream restoration via excavation of approximately 2,730 linear feet of a
designed E-type stream of Dula Thoroughfare (including an associated tributary), including adjacent floodplain excavation to achieve and entrenchment ratio characteristic of E-type streams.
• Restoration of approximately 3.1 acres of riverine wetlands adjacent to Dula Thoroughfare via floodplain excavation in previously identified hydric soil areas, thereby re-establishing jurisdictional wetland hydrology.
UT Dula Thoroughfare • Level I enhancement of approximately 1,871 linear feet of stream via backfill of
straightened and ditched portions of the existing watercourse, thereby re-establishing characteristic stream dimension and pattern by reintroducing flow into adjacent relic channel areas.
• Level II enhancement of approximately 480 linear feet of stream via riparian plantings adjacent to the UT to Dula Thoroughfare streambanks.
• Re-vegetation of open areas adjacent to the UT to Dula Thoroughfare via plantings of characteristic, pre-disturbance community types described by Schafale and Weakley (1990) using bare root seedling plantings.
The main reach of DT was restored by relocating approximately 2,730 lf of the existing channel and its tributary. DT (Reach 1) and its tributary (Reach 2) were designed as E-type streams by creating bankfull benches to re-establish floodplain connection. The UT to DT enhancement (Level 1) along Reach 3 was established via backfill of straightened and ditched portions of the existing watercourse, thereby re-establishing characteristic stream dimension and pattern by reintroducing flow into adjacent relic channel areas. Enhancement (Level 2) along Reach 4 was established through riparian plantings adjacent to the streambanks. The Site’s riparian areas were planted to improve habitat and stabilize streambanks via planting bare root seedlings to recreate pre-disturbance vegetative communities within their appropriate landscape contexts. Appendix 2 provides more detailed project activity, history, contact information, and watershed/site background information for this project. 1.2 Vegetation Assessment JJG conducted the 2011 (year 5 of 5) vegetation assessment and vegetation plot analysis in August 2011 per the 2006 CVS-EEP Level 2 protocol (Lee et al., 2006). The eight vegetation plots previously established in the design phase were selected randomly and represent the riparian buffer zone (DT has five vegetation plots and UT to DT has three vegetation plots). Vegetation monitoring success criteria, as stated in the 2007 mitigation plan, requires an average number of planted stems per acre exceeding

Page ii Table of Contents
Dula Thoroughfare Stream and April 2012 Wetland Restoration Monitoring Year 5 of 5 EEP Project No. 65
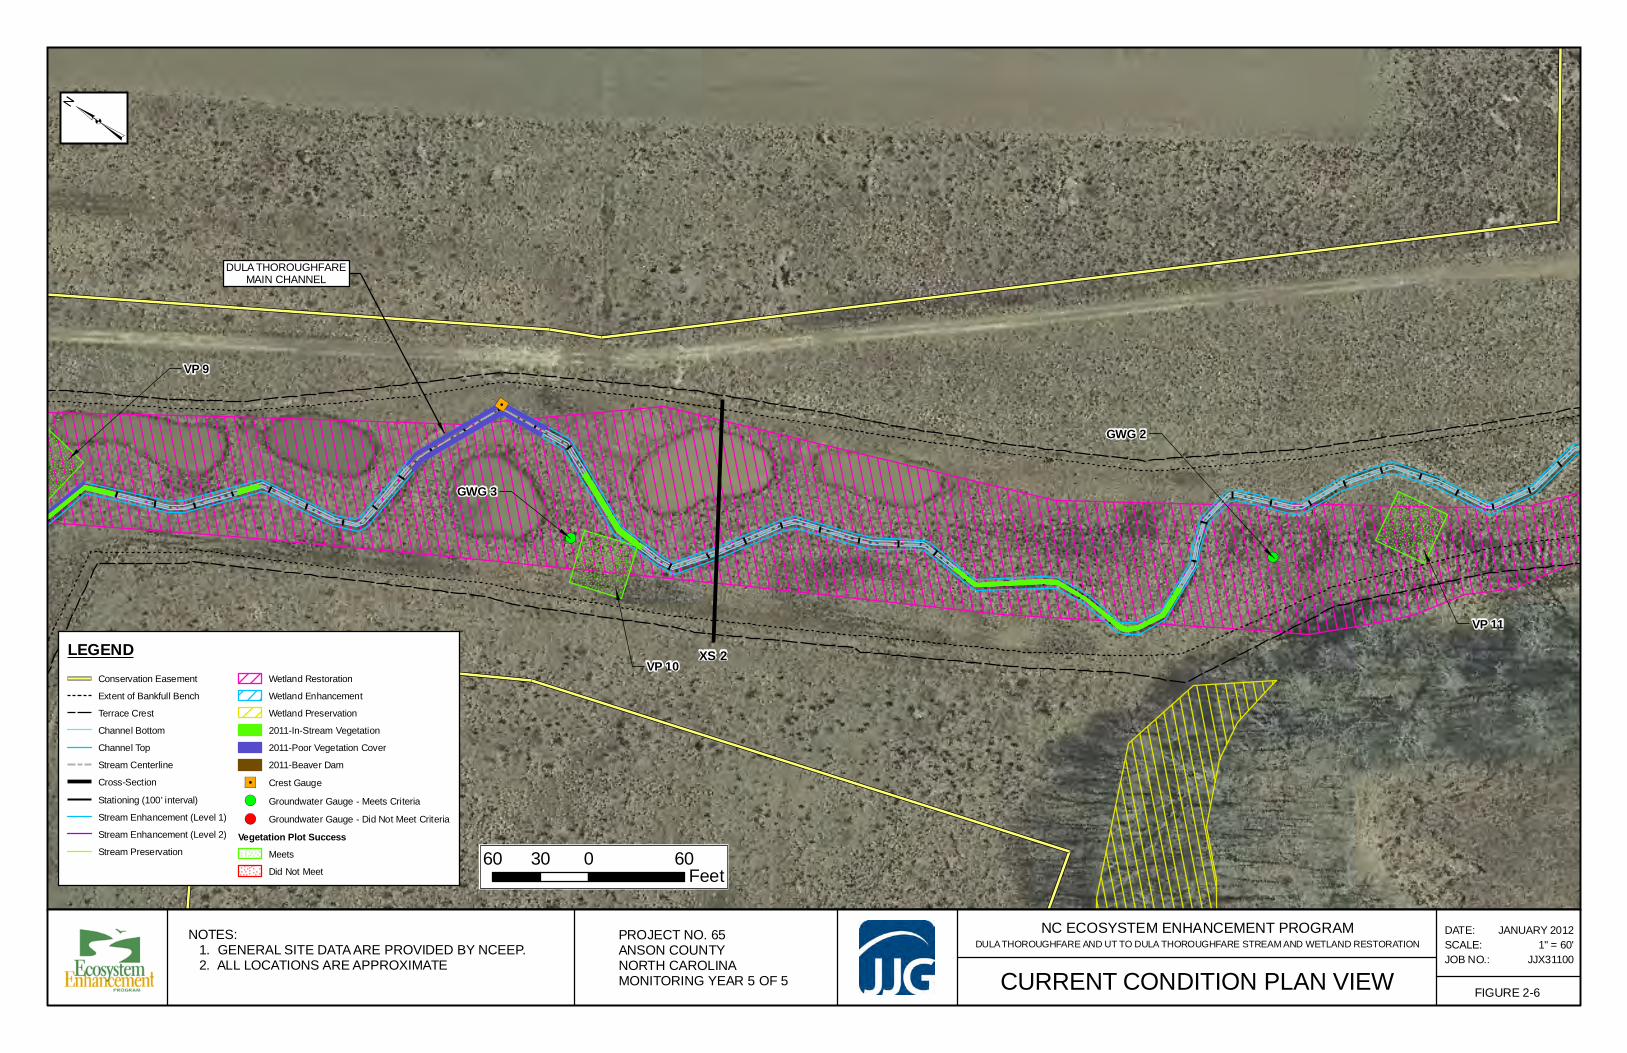
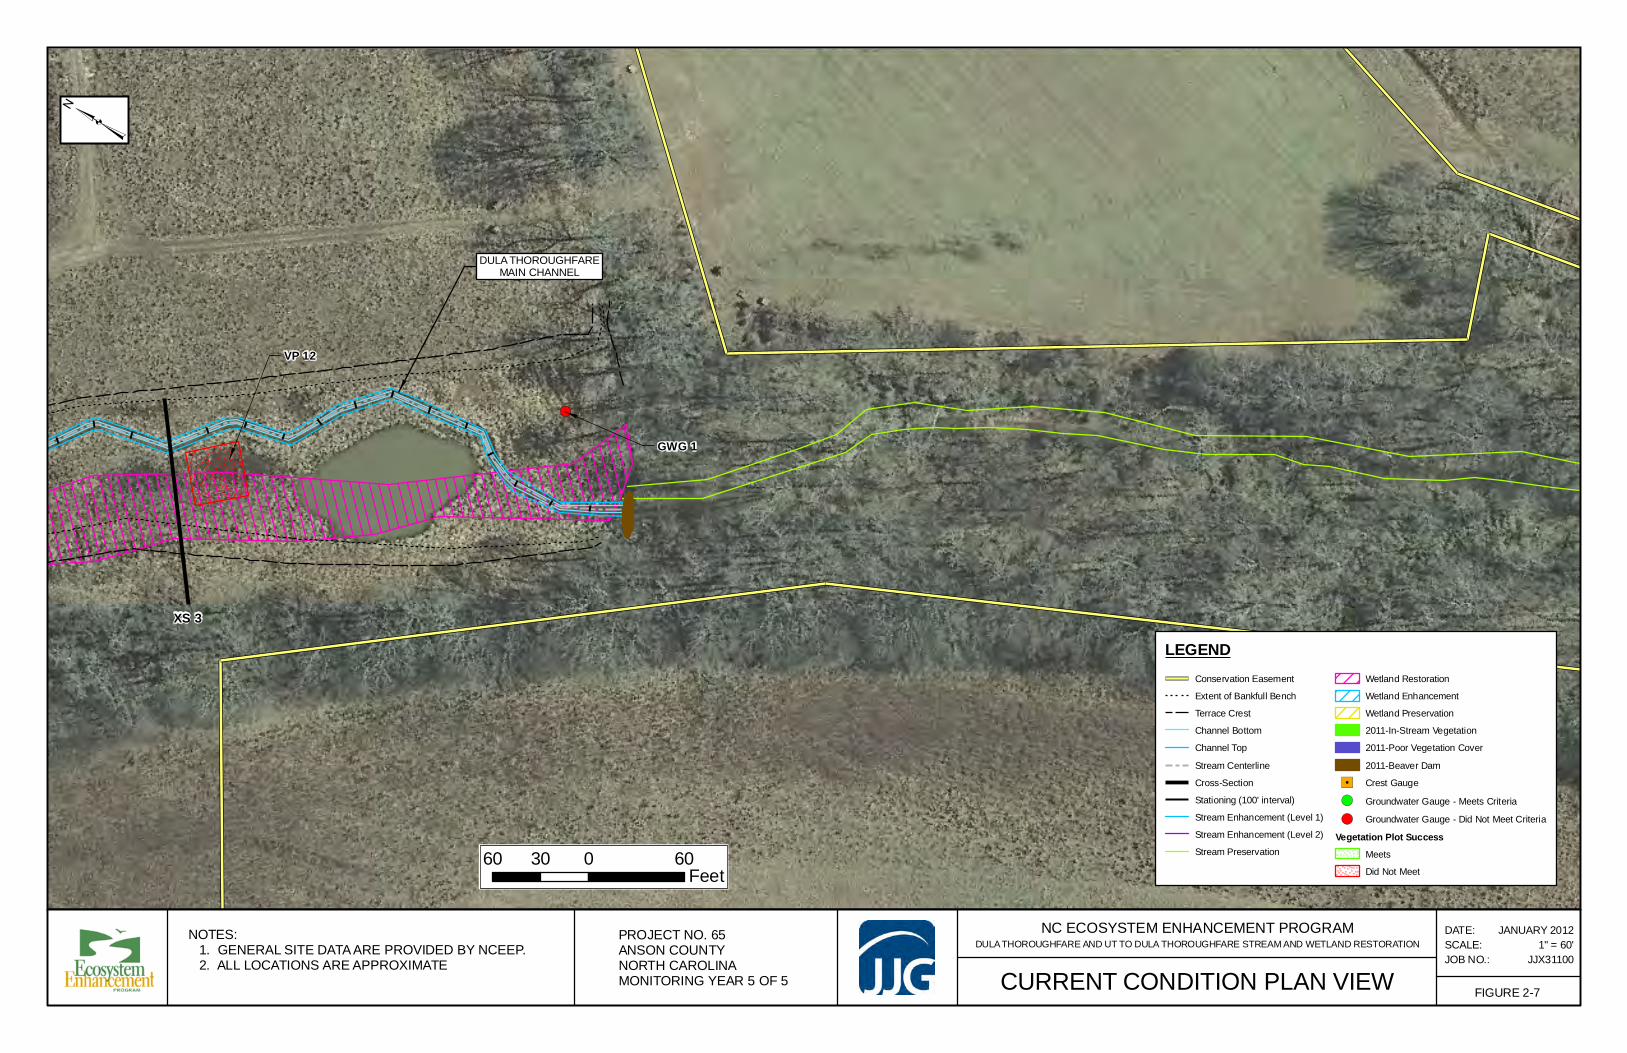
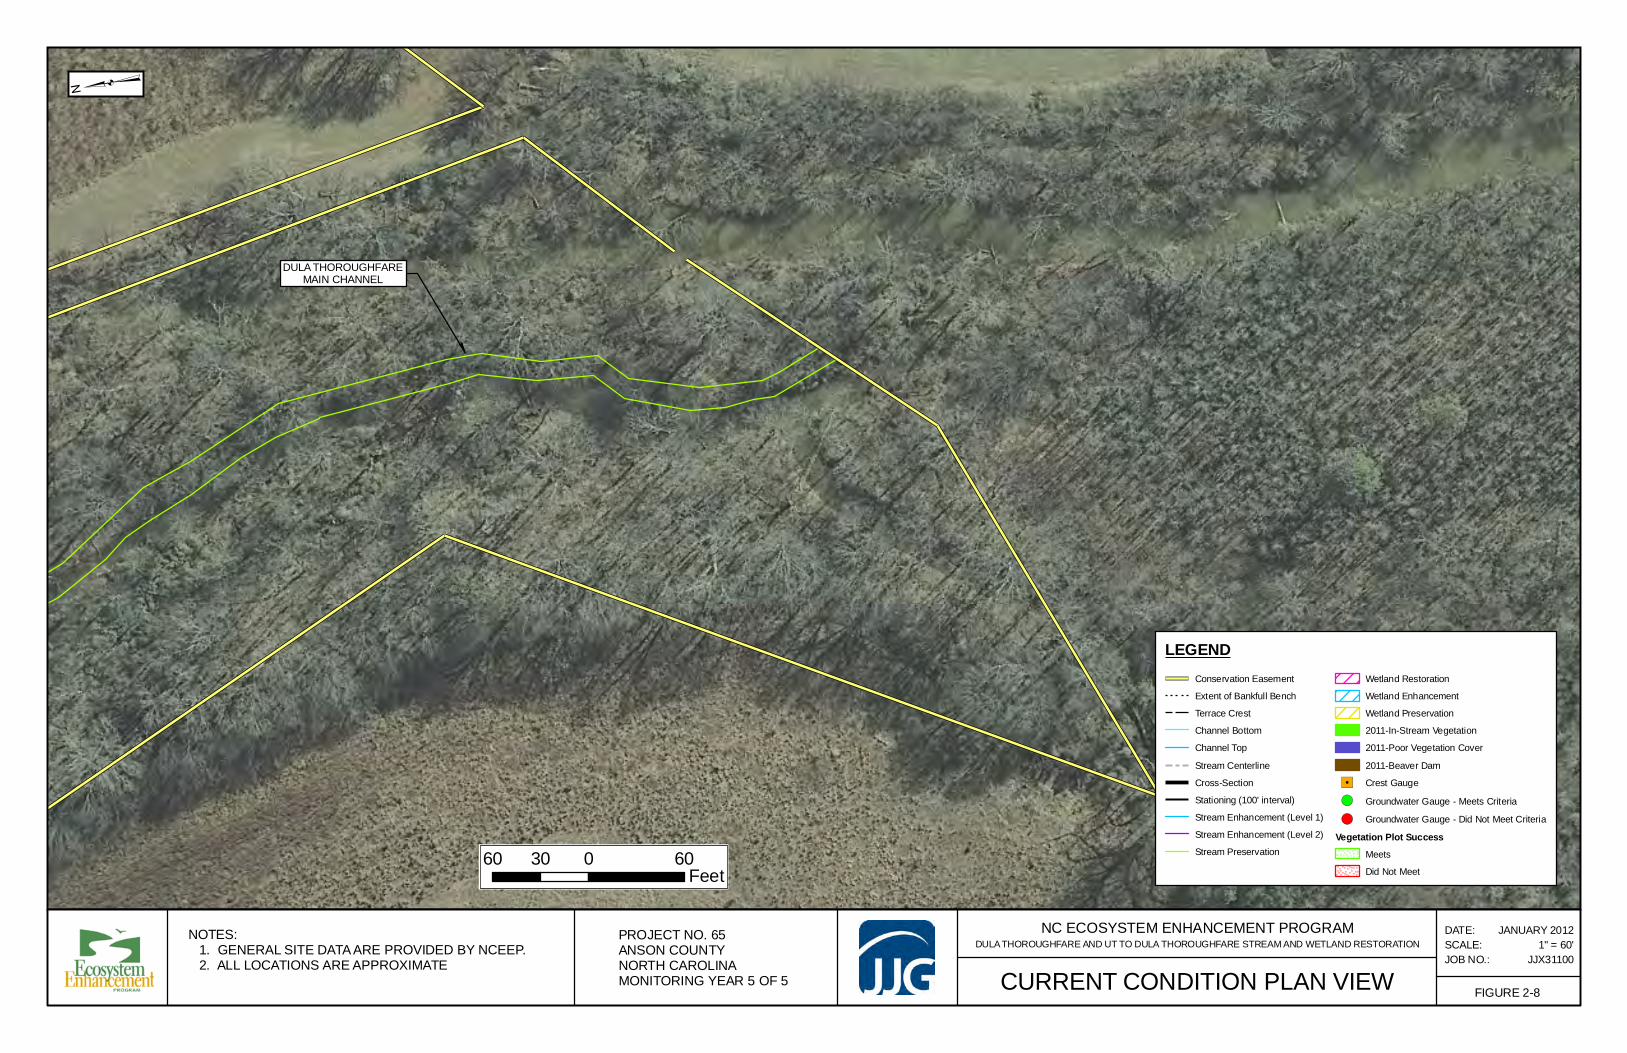
320 stems/acre after the third year of monitoring and 260 stems/acre after the fifth and final year of project monitoring. The 2011 vegetation monitoring results indicated that the main reach of DT has met the vegetation success criteria in four (Plots 8, 9, 10, and 11) of the five plots. Results for the UT to DT indicate that two (Plots 14 and 15) out of three did not meet the 2011 vegetation success criteria. Potential causes of unsuccessful establishment in Plot 12 were likely due to excessive inundation and flooding associated with the downstream beaver dam along DT. Woody vegetation growth observed in Plots 14 and 15 was limited due to competition with blackberry and other invasive species along UT to DT. Although five of eight plots met the vegetation success threshold, the results from plots 12, 14 and 15 did not substantially decrease the overall site’s average survivability estimate, having an average of 592 living woody stems per acre per plot. Monitoring data averaged from both sites recorded an average of 15 planted live stems per plot. Plots in DT and UT to DT that have met the success criteria had stem densities of approximately 802 and 364 planted stems per acre, respectively. The mean 802 stems per acre for DT is slightly below that of MY-1’s mean density of 842 stems per acre, but still vastly exceeds the required average of 260 stems per acre. The mean density of 243 stems per acre for UT to DT is considerably less than the MY-1 mean density of 310 stems per acre. UT to DT does not satisfy the requirement for a stem density of 260 stems per acre. In consideration of total mean density, both DT and UT to DT consist of elevated stem densities due to inclusion of naturally grown volunteer/recruit specimens within each plot. The difference in success between DT and UT to DT is likely due to shading and topographical differences between the planting areas. Additionally, the persistence of invasive species along UT to DT has likely contributed to lower stem densities and overall success. Please refer to Appendix 3 for more detailed information on the 2011 vegetation data. 1.3 Stream Assessment Results from the 2011 stream monitoring effort indicate the DT and UT to DT appear stable, but are experiencing unintended flow conditions. The entire restored stream length (main channel and its tributary) of DT was assessed from the project origination at the gravel road to the downstream end of the restoration project where the preservation reach begins. The UT to DT was assessed from the beginning of the project approximately 300 feet upstream from the first cross vane triplet to the downstream end of the restoration project where the preservation reach begins. Dula Thoroughfare-Main Channel Overall, the present stream dimensions along DT appear stable. The average bankfull width (5.8 ft) of the surveyed cross-sections is coincides with the proposed 6.0 ft. Cross-sectional area, entrenchment ratio, and width/depth ratio remain consistent with baseline parameter ranges and amongst each year. Each cross section maintained a

Page ii Table of Contents
Dula Thoroughfare Stream and April 2012 Wetland Restoration Monitoring Year 5 of 5 EEP Project No. 65
bank height ratio of 1.0, indicating connection with the flood prone area and no significant incision. A new right bank pin was installed in 2009 and 2010, but could not be located during MY5 monitoring, which resulted in slightly different cross-sectional surveys depending on the angle used across the channel. The average bankfull and water surface slopes for the 2011 monitoring year were calculated as 0.0014 ft/ft and 0.0014 ft/ft, respectively. Due to the lack of well defined bed features, riffle slopes were not calculated. Several areas along the channel still continue to exhibit increasing levels of in-stream vegetation growth. The substrate along the reach was dominated by silt deposition. The silt substrate was unconsolidated, which may have contributed to variations between yearly cross-sections and profiles as a firm surface for elevation capture was not always possible. The persistence of silt laden bed material is likely due to a combination of watershed particle contribution and the beaver dam impoundment effects. The dam was breached prior to MY 2011 stream monitoring, but the dam still appears to be a bottleneck and impediment for water flow as water pools before existing the restored channel. Dula Thoroughfare-Tributary Based on current monitoring data and the visual inspection, the channel appears to be functioning properly and maintaining stability. No erosion failure was observed along this reach. In-stream vegetation and poor streambank vegetation cover were observed and noted in the Current Condition Plan View (CCPV, Appendix B). The substrate along the entire reach was dominated by silt deposition. UT to Dula Thoroughfare All cross-vanes triplets appear to be stable and are not showing any signs of erosion or piping. Cross-section results calculated during MY 2011 monitoring indicate the channel has remained relatively stable throughout the monitoring period. Only slight changes in channel morphology are evident and can be attributed to natural variations. Both DT and UT to DT appear stable, but have experienced abnormal flow conditions over the past few monitoring years. As a result, in-stream vegetation has developed throughout the channels. Overall, the Site appears to be stable and could function as intended in normal flow conditions. A crest gauge is located on the main channel and its tributary of the DT site. At least one bankfull or greater event occurred within the DT restoration project in monitoring year 2011. Other indicators such as old wrack lines and staining were observed at the bankfull and greater elevations within the restoration site as well. 1.4 Wetland Assessment Three groundwater monitoring gauges were installed on the DT site by EcoScience. The monitoring gauges are programmed to download groundwater levels daily and were downloaded monthly in order to capture hydrological data during the growing season.

Page ii Table of Contents
Dula Thoroughfare Stream and April 2012 Wetland Restoration Monitoring Year 5 of 5 EEP Project No. 65
The target wetland hydrological success criterion is saturation or inundation for at least 12.5 percent of the growing season in the lower landscape (floodplain) positions. To achieve the above hydrologic success criterion, groundwater levels must be within 12-inches of the ground surface for 31 consecutive days, which is 12.5 percent of the March 15 to November 18 (249 days). All gauges on Site achieved the wetland success criterion of soil saturation within the upper 12 inches for the required minimum of 31 consecutive days, which is 12.5 percent of the growing season. There were no problem areas observed within the wetland restoration zones for the DT Site. Within the wetland zones, hydrophytic vegetation and hydrology indicators have developed. The planted woody stem species throughout the wetland areas are meeting the required success criteria; however, minimal woody stems were observed within plot 14. It is suspected that the planted stem rates may have been too low in this area to achieve success criteria. With the natural recruitment of woody vegetation, the planted riparian area could improve and exceed the vegetation success criteria by year five. Please refer to Appendix E for the wetland plots and a summary of wetland criteria attainment. 1.5 Annual Monitoring Summary Overall, the Site appears to be stable and has met stream and wetland mitigation goals for monitoring year 5. DT has met the vegetation success requirements, but UT to DT has not achieved the required mean planted stem density. The background information provided in this report is referenced from the mitigation plan and previous monitoring reports prepared by EcoScience (2007). Summary information/data related to the occurrence of items such as beaver or encroachment and statistics related to performance of various project and monitoring elements can be found in the tables and figures in the report appendices. Narrative background and supporting information formerly found in these reports can be found in the Baseline Monitoring Report (formerly Mitigation Plan) and in the Mitigation Plan (formerly the Restoration Plan) documents available on EEP’s website. All raw data supporting the tables and figures in the appendices is available from EEP upon request.

SECTION 2 METHODOLOGY
Dula Thoroughfare Stream and April 2012 Wetland Restoration Monitoring Year 5 of 5 EEP Project No. 65
SECTION 2 METHODOLOGY
3.1 Methodology Methods employed for this report were a combination of those established by standard regulatory guidance and procedures documents as well as previous monitoring reports completed by EcoScience. Survey data collected was performed via total station to establish the current longitudinal profile and cross-section elevations. Data recorded during this monitoring event were georeferenced using historically established positions to evaluate annual progress. Longitudinal stationing for the stream profile, cross-sectional surveys, and additional geomorphic assessments were performed following guidelines outlined in the Stream Channel Reference Sites: An Illustrated Guide to Field Techniques (Harrelson et al., 1994) and in the Stream Restoration a Natural Channel Design Handbook (Doll et al, 2003). Substrate analysis and particle size distribution were established using a modified Wolman pebble count (Rosgen 1996) at each cross-section location. Vegetation monitoring for Year 5 was performed based on the Carolina Vegetation Survey (CVS) Level 2 (Lee et al. 2006). Plot locations are consistent with previous years and plot sizes consist of eight 10m x 10m plots. The taxonomic standard for vegetation follows Flora of the Carolinas, Virginia, Georgia, and surrounding areas (Weakley, 2007). Precipitation data for the hydrographs was obtained from Weather Underground for the Albemarle, NC weather station (the nearest offering daily precipitation data) through the following URL (Data Period January 2011 through December 2011). http://www.wunderground.com/history/airport/KVUJ/2008/1/1/CustomHistory.html?dayend=14&monthend=10&yearend=2008&req_city=NA&req_state=NA&req_statename=NA

SECTION 3 REFERENCES
Dula Thoroughfare Stream and April 2012 Wetland Restoration Monitoring Year 5 of 5 EEP Project No. 65
SECTION 3 REFERENCES
Doll, B.A., Grabow, G.L., Hall, K.A., Halley, J., Harman, W.A., Jennings, G.D., and Wise, D.E., 2003. Stream Restoration A Natural Channel Design Handbook. EcoScience Corporation. 2007. Bishop Site Stream and Wetland Restoration 2007 Annual Monitoring Report (Year 1). Raleigh, NC. EcoScience Corporation. 2007. Mitigation Report (Bishop Site Stream and Wetland Restoration). Raleigh, NC. EcoScience Corporation. 200. Restoration Plan Report (Bishop Site Stream and Wetland Restoration). Raleigh, NC. Harrelson, Cheryl C; Rawlins, C.L.; Potyondy, John P. 1994. Stream Channel Reference Sites: An Illustrated Guide to Field Technique. Gen. Tech. Rep. RM-245. Fort Collins, CO: U.S. Department of Agriculture, Forest Service, Rocky Mountain Forest and Range Experiment Station. 61 p. Lee, Michael T., Peet, Robert K., Steven D., Wentworth, Thomas R. (2006). CVS-EEP Protocol for Recording Vegetation Version 4.0. Retrieved from http://www.nceep.net/business/monitoring/veg/datasheets.htm. Rosgen, D L. 1996. Applied River Morphology. Wildland Hydrology Books, Pagosa Springs, CO. Weakley, A.S. 2008. Flora of the Carolinas, Virginia, Georgia, Northern Florida, and Surrounding Areas (Draft April 2008). University of North Carolina at Chapel Hill: Chapel Hill, NC.

SECTION 4 APPENDICES
Appendix A – Project Vicinity Map and Background Tables Appendix B – Visual Assessment Data Appendix C – Vegetation Plot Data Appendix D – Stream Survey Data Appendix E – Hydrologic Data

Dula Thoroughfare Stream and April 2012 Wetland Restoration Monitoring Year 5 of 5 EEP Project No. 65
APPENDIX A PROJECT VICINITY MAP AND BACKGROUND
TABLES
Figure 1 Project Vicinity Map and Directions Table 1 Project Restoration Components Table 2 Project Activity and Reporting History Table 3 Project Contacts Table Table 4 Project Attribute Table

CARPENTER RD.
UT to Dula Thoroughfare
Tributary to Dula Thoroughfare
Dula Thoroughfare
³
Figure 1. Vicinity MapDula Thoroughfare and UT to Dula Thoroughfare Stream and Wetland
Restoration/EEP Project No. 65Anson County, NC
Monitoring Year 5 of 5Submittal Date: April 2012
USGS and Aerial Source: NCDOT GIS
2,000 0 2,0001,000Feet
Directions to the Site:The Site is located north of Wadesboro in Anson County, NC, just upstream of the confluence of the Rocky and Yadkin Rivers. From Charlotte, take US Highway 74 East to Wadesboro, then take US 52 north. Approximately 1.3 miles south of US 52’s crossing over the Rocky River, turn east onto Carpenter Road (a gravel road). Follow Carpenter Road to the east. Gated access points to the Site (one for Camp Branch, one for Dula Thoroughfare and UT to Dula Thoroughfare) abut Carpenter Road from the east.
LegendCounty BoundaryConservation Easement
Conservation EasementStream Restoration (Priority 2)Stream Enhancement (Level 1)Stream Enhancement (Level 2)Stream Preservation
Wetland RestorationWetland EnhancementWetland Preservation

Appendix A. Project Vicinity Map and Background TablesTable 1: Project Components and Mitigation CreditsDula Thoroughfare Stream and Wetland Restoration/EEP Project No. 65Monitoring Year 5 of 5
StreamRiparian Wetland
Non-riparian Wetland
BufferNitrogen Nutrient
Offset
Phosphorous Nutrient Offset
Type R, EI, EII, P R, WE, P N/ATotals 5,440.33 SMU 4.06 WMU N/A N/A N/A N/A
Reach 1-DT Main Channel
0+00 – 20+25 2,025 lf P2 Restoration 2,025 lf 1:1
Reach 2-DT Tributary 0+00 – 7+05 705 lf P2 Restoration 705 lf 1:1
Reach 3-UT to DT N/A* 1,871 lf N/AEnhancement
Level 11,871 lf 1.5:1
Reach 4-UT to DT N/A* 480 lf N/AEnhancement
Level 2480 lf 2.5:1
Stream Preservation ** N/A 6,355 lf N/A Preservation 6,355 lf 5:1
Riparian Wetland Restoration
N/A 3.1 ac N/A Restoration 3.1 ac 1:1Riparian Wetland Enhancement
N/A 0.9 ac N/AWetland
Enhancement0.9 ac 2:1
Riparian Wetland Preservation
N/A 2.3 ac N/A Preservation 2.3 ac 5:1
Riverine Non-Riverine
Restoration (R) 2,730 3.1 N/A N/A N/A N/A
Enhancement (E) 0.9 N/A N/A N/A N/A
Enahncement I (E) 1,871
Enhancement II (E) 480
Creation (C) N/A N/A N/A
Preservation (P) 6,355 2.3 N/A N/A N/A
HQ Preservation (P) N/A N/A N/A N/A N/A
Totals 11,436 6.3 N/A N/A N/A N/A
Element LocationN/A N/A
BMP Elements
Project Components
SMU = Stream Mitigation Unit; WMU = Wetland Mitigation Unit
Purpose/Function NotesN/AN/A
Mitigation Ratio
BMP ElementsBR = Bioretention Cell; SF = Sand Filter; SW = Stormwater Wetland; WDP = Wet Detention Pond; DDP - Dry Detention Pond; FS = Filter Strip; S = Grassed Swale; LS = Level Spreader; NI = Natural Infiltration Area; FB = Forested Buffer
Mitigation Credits
Project Component/Reach ID
Stationing (ft)Existing Footage/ Acreage
ApproachRestoration or
Restoration Equivalent
Restoration Footage or
Acres
Component Summations
Restoration LevelStream (linear
feet)Riparian Wetland (acres)
Non-riparian Wetland (acres)
Buffer (square feet)
Upland (acres)
Appendix A - Project Vicinity Map and Background TablesDula Thoroughfare Monitoring Report
Year 5 of 5
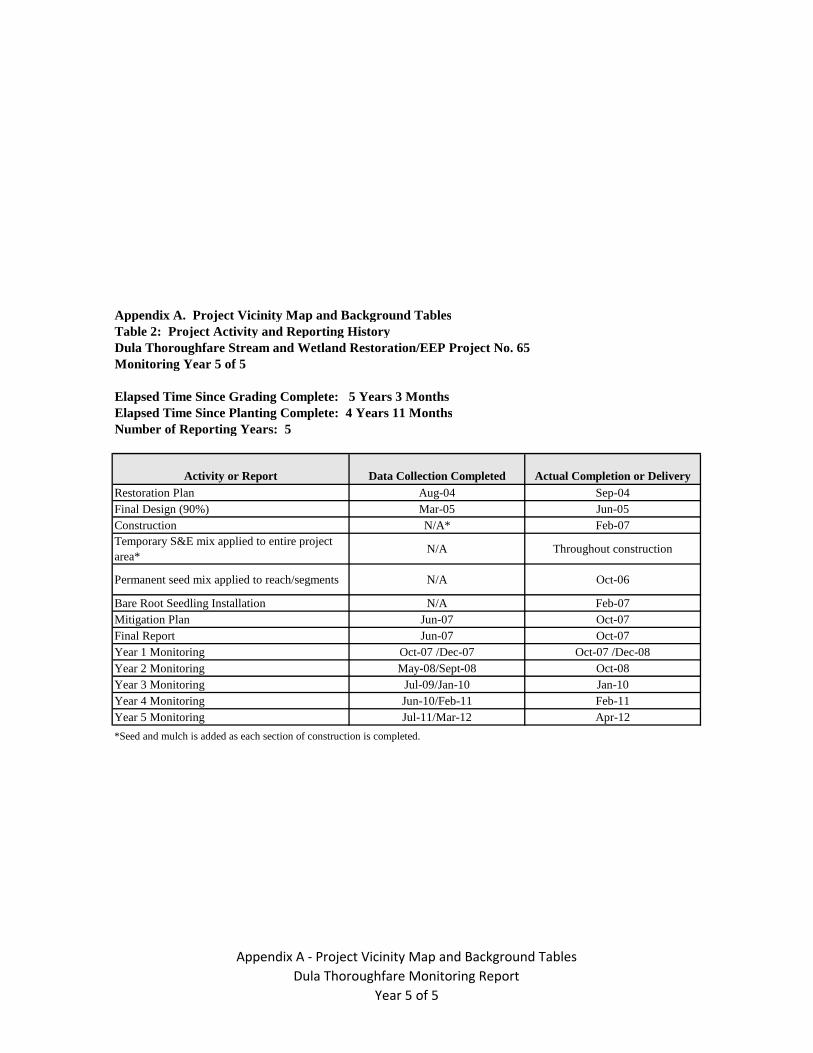
Appendix A. Project Vicinity Map and Background TablesTable 2: Project Activity and Reporting HistoryDula Thoroughfare Stream and Wetland Restoration/EEP Project No. 65Monitoring Year 5 of 5
Elapsed Time Since Grading Complete: 5 Years 3 MonthsElapsed Time Since Planting Complete: 4 Years 11 MonthsNumber of Reporting Years: 5
Activity or Report Data Collection Completed Actual Completion or DeliveryRestoration Plan Aug-04 Sep-04Final Design (90%) Mar-05 Jun-05Construction N/A* Feb-07Temporary S&E mix applied to entire project area*
N/A Throughout construction
Permanent seed mix applied to reach/segments N/A Oct-06
Bare Root Seedling Installation N/A Feb-07Mitigation Plan Jun-07 Oct-07Final Report Jun-07 Oct-07Year 1 Monitoring Oct-07 /Dec-07 Oct-07 /Dec-08Year 2 Monitoring May-08/Sept-08 Oct-08Year 3 Monitoring Jul-09/Jan-10 Jan-10Year 4 Monitoring Jun-10/Feb-11 Feb-11Year 5 Monitoring Jul-11/Mar-12 Apr-12
*Seed and mulch is added as each section of construction is completed.
Appendix A - Project Vicinity Map and Background TablesDula Thoroughfare Monitoring Report
Year 5 of 5
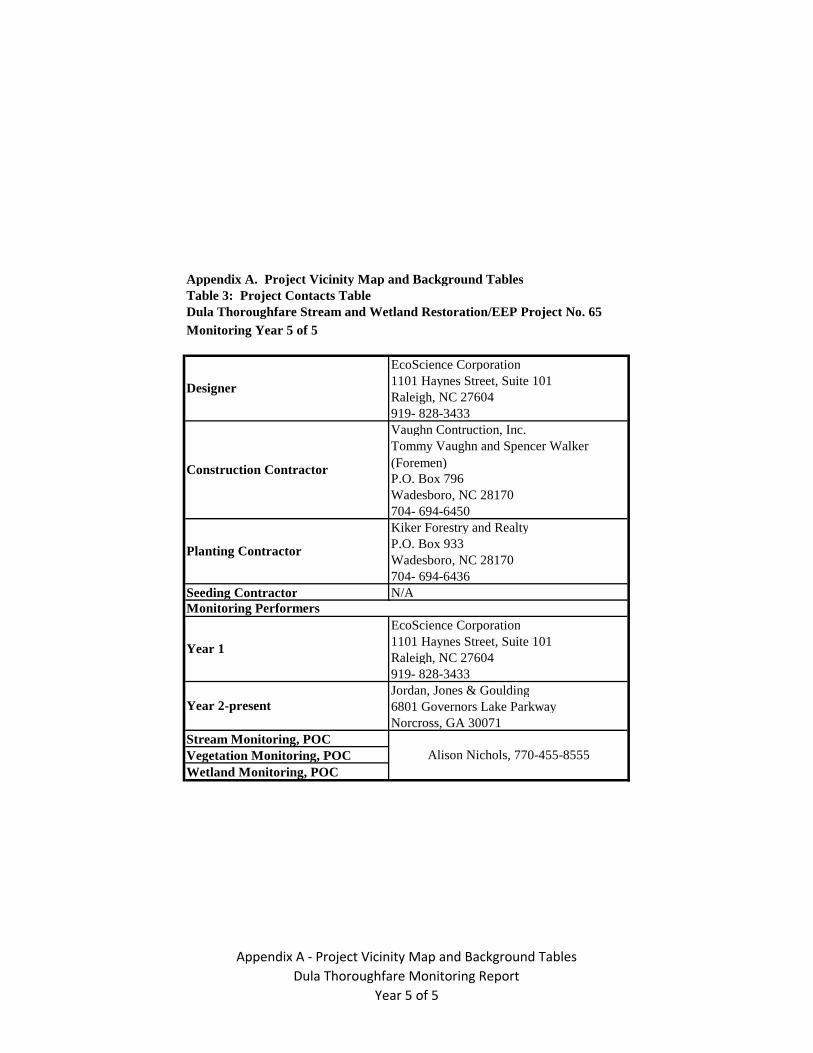
Appendix A. Project Vicinity Map and Background TablesTable 3: Project Contacts TableDula Thoroughfare Stream and Wetland Restoration/EEP Project No. 65Monitoring Year 5 of 5
EcoScience Corporation1101 Haynes Street, Suite 101Raleigh, NC 27604 919- 828-3433Vaughn Contruction, Inc. Tommy Vaughn and Spencer Walker (Foremen) P.O. Box 796 Wadesboro, NC 28170 704- 694-6450Kiker Forestry and RealtyP.O. Box 933 Wadesboro, NC 28170 704- 694-6436
Seeding Contractor N/A
EcoScience Corporation1101 Haynes Street, Suite 101Raleigh, NC 27604 919- 828-3433Jordan, Jones & Goulding6801 Governors Lake ParkwayNorcross, GA 30071
Stream Monitoring, POCVegetation Monitoring, POCWetland Monitoring, POC
Alison Nichols, 770-455-8555
Year 2-present
Designer
Construction Contractor
Planting Contractor
Monitoring Performers
Year 1
Appendix A - Project Vicinity Map and Background TablesDula Thoroughfare Monitoring Report
Year 5 of 5

Appendix A. Project Vicinity Map and Background TablesTable 4 Project Baseline Information and AttributesDula Thoroughfare Stream and Wetland Restoration/EEP Project No. 65Monitoring Year 5 of 5
Project NameProject CountyProject Area (acres)Project Coordinates
Physiographic RegionRiver BasinUSGS HUC for Project (8 digit)USGS HUC for Project (14 digit)DWQ Sub-basin Project Drainage Area (acres)Project Drainage Area Percentage of Impervious Area*CGIA Land Use Classification
Parameters Reach 1 Reach 2 Reach 3 Reach 4Length of reach (linear feet) 2,025 705 1,871 480Valley classification U U U UDrainage area (acres) U U U UNCDWQ stream identification score U U U UNCDWQ Water Quality Classification C C C CMorphological Description (stream type) Perennial Perennial Intermittent IntermittentEvolutionaly trend E5 to E/D5 E5 to E/D6 C5 to E5 C5 to E5
Underlying mapped soils
Drainage Class U U U USoil Hydric status N/A N/A N/A N/ASlope U U U UFEMA classification 100 year floodplain 100 year floodplain 100 year floodplain 100 year floodplainNative vegetation community bottomland hardwood bottomland hardwood bottomland hardwood bottomland hardwoodPercent composition of exotic invasive vegetation U U U U
Parameters Wetland 1 Wetland 2 Wetland 3 Wetland 4 Wetland 5Size of Wetland (acres) 2.18 2.29 0.48 0.37 0.082Wetland Type (non-riparian, riparian riverine or riparian non-riverine) Riparian riverine Riparian riverine Riparian riverine Riparian riverine Riparian riverineMapped Soil Series ShA, ToA ToA BaB, BaC BaC BaCDrainage class PFO1/PEM PFO1 PFO1 PFO1 PFO1Soil Hydric Status None None None None NoneSource of Hydrology Slope & Overbank Slope & Overbank Slope & Overbank Slope & Overbank Slope & OverbankHydrologic impairment N/A N/A N/A N/A N/ANative vegetation community bottomland hardwood bottomland hardwood bottomland hardwood bottomland hardwood bottomland hardwoodPercent composition of exotic invasive vegetation U U U U U
Regulation Applicable? Resolved?Waters of the United States - Section 404 Yes YesWaters of the United States - Section 401 No N/AEndangered Species Act Yes YesHistoric Preservation Act Yes YesCostal Zone Management Act (CZMA)/Costal Area No N/AFEMA Floodplain Compliance Yes UEssential Fisheries Habitat No N/A*At the time of project completion.
**Wetland mitigation was not included for this restoration project.
"N/A": items do not apply / "-": items are unavailable / "U": items are unknown
378< 1%
1.01.01.03
N/AN/A
Badin Channery Silt Loam (BaB, BaC) Badin-Goldston Complex (BgD) McQueen (MrB) Shellbluff (ShA) Tetotum (ToA) Chewacla (ChA)
Reach Summary Information
N/A
Regulatory Considerations
Wetland Summary Information**
Supporting DocumentationRestoration Plan
N/AFeasibility StudyFeasibility Study
Project Watershed Summary Information
Project InformationDula Thoroughfare Stream and Wetland Restoration (Bishop site)
Anson County, North Carolina148 acres (approx)
35º 9' 7.0" N 80º 5' 10.24" W
PiedmontYadkin
03040104 and 0304010503040104061050 and 03040105081060
03-07-10 and 03-07-14
Appendix A - Background TablesDula Thoroughfare Monitoring Document
Year 5 of 5
Dula Thoroughfare Stream and April 2012 Wetland Restoration Monitoring Year 5 of 5 EEP Project No. 65
APPENDIX B VISUAL ASSESSMENT DATA
Figure 2 Current Condition Plan View (C CPV) Table 5 Visual Stream Morphology Stability Assessment Table Table 6 Vegetation Condition Assessment Table Photos Stream Station Photos Photos Vegetation Plot Photos

!(
!(
!(
"/
ROCKY RIVER
CARP
ENT E
R RD
"
UNNAMED TRIBUTARY TODULA THOROUGHFARE
"
DULA THOROUGHFARETRIBUTARY
"
DULA THOROUGHFAREMAIN CHANNEL
8
39
1 7
6
2
5
4
11 13
10
14
1512
16
NC ECOSYSTEM ENHANCEMENT PROGRAMDULA THOROUGHFARE AND UT TO DULA THOROUGHFARE STREAM AND WETLAND RESTORATIONNOTES:
1. GENERAL SITE DATA ARE PROVIDED BY NCEEP. 2. ALL LOCATIONS ARE APPROXIMATE
PROJECT NO. 65ANSON COUNTYNORTH CAROLINAMONITORING YEAR 5 OF 5 CURRENT CONDITION PLAN VIEW
DATE:SCALE:JOB NO.:
JANUARY 20121" = 60'
JJX31100
FIGURE INDEX
³LEGEND
Detail MapConservation EasementExtent of Bankfull BenchTerrace CrestChannel BottomChannel TopStream CenterlineCross-SectionStationing (100' interval)Stream Enhancement (Level 1)Stream Enhancement (Level 2)Stream Preservation
Wetland RestorationWetland EnhancementWetland Preservation2011-In-Stream Vegetation2011-Poor Vegetation Cover2011-Beaver Dam
"/ Crest Gauge!( Groundwater Gauge - Meets Criteria
Vegetation Plot SuccessMeetsDid Not Meet
500 0 500 1,000250 Feet

"
DULA THOROUGHFARETRIBUTARY
NC ECOSYSTEM ENHANCEMENT PROGRAMDULA THOROUGHFARE AND UT TO DULA THOROUGHFARE STREAM AND WETLAND RESTORATIONNOTES:
1. GENERAL SITE DATA ARE PROVIDED BY NCEEP. 2. ALL LOCATIONS ARE APPROXIMATE
PROJECT NO. 65ANSON COUNTYNORTH CAROLINAMONITORING YEAR 5 OF 5 CURRENT CONDITION PLAN VIEW
DATE:SCALE:JOB NO.:
JANUARY 20121" = 60'
JJX31100
FIGURE 2-1
³
LEGENDConservation EasementExtent of Bankfull BenchTerrace CrestChannel BottomChannel TopStream CenterlineCross-SectionStationing (100' interval)Stream Enhancement (Level 1)Stream Enhancement (Level 2)Stream Preservation
Wetland RestorationWetland EnhancementWetland Preservation2011-In-Stream Vegetation2011-Poor Vegetation Cover2011-Beaver Dam
"/ Crest Gauge!( Groundwater Gauge - Meets Criteria!( Groundwater Gauge - Did Not Meet Criteria
Vegetation Plot SuccessMeetsDid Not Meet
60 0 6030Feet

"
DULA THOROUGHFARETRIBUTARY
"
DULA THOROUGHFARETRIBUTARY
"
DULA THOROUGHFARETRIBUTARY
NC ECOSYSTEM ENHANCEMENT PROGRAMDULA THOROUGHFARE AND UT TO DULA THOROUGHFARE STREAM AND WETLAND RESTORATIONNOTES:
1. GENERAL SITE DATA ARE PROVIDED BY NCEEP. 2. ALL LOCATIONS ARE APPROXIMATE
PROJECT NO. 65ANSON COUNTYNORTH CAROLINAMONITORING YEAR 5 OF 5 CURRENT CONDITION PLAN VIEW
DATE:SCALE:JOB NO.:
JANUARY 20121" = 60'
JJX31100
FIGURE 2-2
³
LEGENDConservation EasementExtent of Bankfull BenchTerrace CrestChannel BottomChannel TopStream CenterlineCross-SectionStationing (100' interval)Stream Enhancement (Level 1)Stream Enhancement (Level 2)Stream Preservation
Wetland RestorationWetland EnhancementWetland Preservation2011-In-Stream Vegetation2011-Poor Vegetation Cover2011-Beaver Dam
"/ Crest Gauge!( Groundwater Gauge - Meets Criteria!( Groundwater Gauge - Did Not Meet Criteria
Vegetation Plot SuccessMeetsDid Not Meet
60 0 6030Feet

"
DULA THOROUGHFARETRIBUTARY
"
DULA THOROUGHFARETRIBUTARY
NC ECOSYSTEM ENHANCEMENT PROGRAMDULA THOROUGHFARE AND UT TO DULA THOROUGHFARE STREAM AND WETLAND RESTORATIONNOTES:
1. GENERAL SITE DATA ARE PROVIDED BY NCEEP. 2. ALL LOCATIONS ARE APPROXIMATE
PROJECT NO. 65ANSON COUNTYNORTH CAROLINAMONITORING YEAR 5 OF 5 CURRENT CONDITION PLAN VIEW
DATE:SCALE:JOB NO.:
JANUARY 20121" = 60'
JJX31100
FIGURE 2-3
³
LEGENDConservation EasementExtent of Bankfull BenchTerrace CrestChannel BottomChannel TopStream CenterlineCross-SectionStationing (100' interval)Stream Enhancement (Level 1)Stream Enhancement (Level 2)Stream Preservation
Wetland RestorationWetland EnhancementWetland Preservation2011-In-Stream Vegetation2011-Poor Vegetation Cover2011-Beaver Dam
"/ Crest Gauge!( Groundwater Gauge - Meets Criteria!( Groundwater Gauge - Did Not Meet Criteria
Vegetation Plot SuccessMeetsDid Not Meet
60 0 6030Feet
"
VP 9
"
VP 9
"
VP 8
XS 4
XS 1
"
DULA THOROUGHFARETRIBUTARY
"
DULA THOROUGHFARETRIBUTARY
"
DULA THOROUGHFAREMAIN CHANNEL
"
DULA THOROUGHFARETRIBUTARY
NC ECOSYSTEM ENHANCEMENT PROGRAMDULA THOROUGHFARE AND UT TO DULA THOROUGHFARE STREAM AND WETLAND RESTORATIONNOTES:
1. GENERAL SITE DATA ARE PROVIDED BY NCEEP. 2. ALL LOCATIONS ARE APPROXIMATE
PROJECT NO. 65ANSON COUNTYNORTH CAROLINAMONITORING YEAR 5 OF 5 CURRENT CONDITION PLAN VIEW
DATE:SCALE:JOB NO.:
JANUARY 20121" = 60'
JJX31100
FIGURE 2-4
³
LEGENDConservation EasementExtent of Bankfull BenchTerrace CrestChannel BottomChannel TopStream CenterlineCross-SectionStationing (100' interval)Stream Enhancement (Level 1)Stream Enhancement (Level 2)Stream Preservation
Wetland RestorationWetland EnhancementWetland Preservation2011-In-Stream Vegetation2011-Poor Vegetation Cover2011-Beaver Dam
"/ Crest Gauge!( Groundwater Gauge - Meets Criteria!( Groundwater Gauge - Did Not Meet Criteria
Vegetation Plot SuccessMeetsDid Not Meet
60 0 6030Feet

"
VP 9
"
VP 9
"
VP 8
XS 4
"
GWG 3
XS 1
"
DULA THOROUGHFARETRIBUTARY
"
DULA THOROUGHFARETRIBUTARY
"
DULA THOROUGHFAREMAIN CHANNEL
"
DULA THOROUGHFAREMAIN CHANNEL
NC ECOSYSTEM ENHANCEMENT PROGRAMDULA THOROUGHFARE AND UT TO DULA THOROUGHFARE STREAM AND WETLAND RESTORATIONNOTES:
1. GENERAL SITE DATA ARE PROVIDED BY NCEEP. 2. ALL LOCATIONS ARE APPROXIMATE
PROJECT NO. 65ANSON COUNTYNORTH CAROLINAMONITORING YEAR 5 OF 5 CURRENT CONDITION PLAN VIEW
DATE:SCALE:JOB NO.:
JANUARY 20121" = 60'
JJX31100
FIGURE 2-5
³
LEGENDConservation EasementExtent of Bankfull BenchTerrace CrestChannel BottomChannel TopStream CenterlineCross-SectionStationing (100' interval)Stream Enhancement (Level 1)Stream Enhancement (Level 2)Stream Preservation
Wetland RestorationWetland EnhancementWetland Preservation2011-In-Stream Vegetation2011-Poor Vegetation Cover2011-Beaver Dam
"/ Crest Gauge!( Groundwater Gauge - Meets Criteria!( Groundwater Gauge - Did Not Meet Criteria
Vegetation Plot SuccessMeetsDid Not Meet
60 0 6030Feet
2+00
3+00 4+00
5+00 6+00
7+00
8+00
9+00
10+00 11+00
12+00
13+0
0
14+00
15+00 16+00
17+0018+0
019+00
5+00
6+00
7+00.4
7
!(
!(
!(
"/
"
VP 9
"
VP 9
"
VP 8
XS 4
"
GWG 3
"
VP 10
"
GWG 2
"
VP 11 XS 3
"
VP 12
"
GWG 1
XS 1
XS 2
"
DULA THOROUGHFARETRIBUTARY
"
DULA THOROUGHFAREMAIN CHANNEL
"
DULA THOROUGHFAREMAIN CHANNEL
"
DULA THOROUGHFAREMAIN CHANNEL
NC ECOSYSTEM ENHANCEMENT PROGRAMDULA THOROUGHFARE AND UT TO DULA THOROUGHFARE STREAM AND WETLAND RESTORATIONNOTES:
1. GENERAL SITE DATA ARE PROVIDED BY NCEEP. 2. ALL LOCATIONS ARE APPROXIMATE
PROJECT NO. 65ANSON COUNTYNORTH CAROLINAMONITORING YEAR 5 OF 5 CURRENT CONDITION PLAN VIEW
DATE:SCALE:JOB NO.:
JANUARY 20121" = 60'
JJX31100
FIGURE 2-6
³
LEGENDConservation EasementExtent of Bankfull BenchTerrace CrestChannel BottomChannel TopStream CenterlineCross-SectionStationing (100' interval)Stream Enhancement (Level 1)Stream Enhancement (Level 2)Stream Preservation
Wetland RestorationWetland EnhancementWetland Preservation2011-In-Stream Vegetation2011-Poor Vegetation Cover2011-Beaver Dam
"/ Crest Gauge!( Groundwater Gauge - Meets Criteria!( Groundwater Gauge - Did Not Meet Criteria
Vegetation Plot SuccessMeetsDid Not Meet
60 0 6030Feet
!(
!(
"
GWG 2
"
VP 11 XS 3
"
VP 12
"
GWG 1
"
DULA THOROUGHFAREMAIN CHANNEL
"
DULA THOROUGHFAREMAIN CHANNEL
NC ECOSYSTEM ENHANCEMENT PROGRAMDULA THOROUGHFARE AND UT TO DULA THOROUGHFARE STREAM AND WETLAND RESTORATIONNOTES:
1. GENERAL SITE DATA ARE PROVIDED BY NCEEP. 2. ALL LOCATIONS ARE APPROXIMATE
PROJECT NO. 65ANSON COUNTYNORTH CAROLINAMONITORING YEAR 5 OF 5 CURRENT CONDITION PLAN VIEW
DATE:SCALE:JOB NO.:
JANUARY 20121" = 60'
JJX31100
FIGURE 2-7
³
LEGENDConservation EasementExtent of Bankfull BenchTerrace CrestChannel BottomChannel TopStream CenterlineCross-SectionStationing (100' interval)Stream Enhancement (Level 1)Stream Enhancement (Level 2)Stream Preservation
Wetland RestorationWetland EnhancementWetland Preservation2011-In-Stream Vegetation2011-Poor Vegetation Cover2011-Beaver Dam
"/ Crest Gauge!( Groundwater Gauge - Meets Criteria!( Groundwater Gauge - Did Not Meet Criteria
Vegetation Plot SuccessMeetsDid Not Meet
60 0 6030Feet
"
DULA THOROUGHFAREMAIN CHANNEL
NC ECOSYSTEM ENHANCEMENT PROGRAMDULA THOROUGHFARE AND UT TO DULA THOROUGHFARE STREAM AND WETLAND RESTORATIONNOTES:
1. GENERAL SITE DATA ARE PROVIDED BY NCEEP. 2. ALL LOCATIONS ARE APPROXIMATE
PROJECT NO. 65ANSON COUNTYNORTH CAROLINAMONITORING YEAR 5 OF 5 CURRENT CONDITION PLAN VIEW
DATE:SCALE:JOB NO.:
JANUARY 20121" = 60'
JJX31100
FIGURE 2-8
³
LEGENDConservation EasementExtent of Bankfull BenchTerrace CrestChannel BottomChannel TopStream CenterlineCross-SectionStationing (100' interval)Stream Enhancement (Level 1)Stream Enhancement (Level 2)Stream Preservation
Wetland RestorationWetland EnhancementWetland Preservation2011-In-Stream Vegetation2011-Poor Vegetation Cover2011-Beaver Dam
"/ Crest Gauge!( Groundwater Gauge - Meets Criteria!( Groundwater Gauge - Did Not Meet Criteria
Vegetation Plot SuccessMeetsDid Not Meet
60 0 6030Feet

!(
"
GWG 3
"
VP 10
"
GWG 2
"
VP 11
XS 2
"
DULA THOROUGHFARETRIBUTARY
NC ECOSYSTEM ENHANCEMENT PROGRAMDULA THOROUGHFARE AND UT TO DULA THOROUGHFARE STREAM AND WETLAND RESTORATIONNOTES:
1. GENERAL SITE DATA ARE PROVIDED BY NCEEP. 2. ALL LOCATIONS ARE APPROXIMATE
PROJECT NO. 65ANSON COUNTYNORTH CAROLINAMONITORING YEAR 5 OF 5 CURRENT CONDITION PLAN VIEW
DATE:SCALE:JOB NO.:
JANUARY 20121" = 60'
JJX31100
FIGURE 2-9
³
LEGENDConservation EasementExtent of Bankfull BenchTerrace CrestChannel BottomChannel TopStream CenterlineCross-SectionStationing (100' interval)Stream Enhancement (Level 1)Stream Enhancement (Level 2)Stream Preservation
Wetland RestorationWetland EnhancementWetland Preservation2011-In-Stream Vegetation2011-Poor Vegetation Cover2011-Beaver Dam
"/ Crest Gauge!( Groundwater Gauge - Meets Criteria!( Groundwater Gauge - Did Not Meet Criteria
Vegetation Plot SuccessMeetsDid Not Meet
60 0 6030Feet

"
VP 11XS 3
"
VP 12
"
DULA THOROUGHFAREMAIN CHANNEL
NC ECOSYSTEM ENHANCEMENT PROGRAMDULA THOROUGHFARE AND UT TO DULA THOROUGHFARE STREAM AND WETLAND RESTORATIONNOTES:
1. GENERAL SITE DATA ARE PROVIDED BY NCEEP. 2. ALL LOCATIONS ARE APPROXIMATE
PROJECT NO. 65ANSON COUNTYNORTH CAROLINAMONITORING YEAR 5 OF 5 CURRENT CONDITION PLAN VIEW
DATE:SCALE:JOB NO.:
JANUARY 20121" = 60'
JJX31100
FIGURE 2-10
³
LEGENDConservation EasementExtent of Bankfull BenchTerrace CrestChannel BottomChannel TopStream CenterlineCross-SectionStationing (100' interval)Stream Enhancement (Level 1)Stream Enhancement (Level 2)Stream Preservation
Wetland RestorationWetland EnhancementWetland Preservation2011-In-Stream Vegetation2011-Poor Vegetation Cover2011-Beaver Dam
"/ Crest Gauge!( Groundwater Gauge - Meets Criteria!( Groundwater Gauge - Did Not Meet Criteria
Vegetation Plot SuccessMeetsDid Not Meet
60 0 6030Feet

"
VP 13
"
UNNAMED TRIBUTARY TODULA THOROUGHFARE
NC ECOSYSTEM ENHANCEMENT PROGRAMDULA THOROUGHFARE AND UT TO DULA THOROUGHFARE STREAM AND WETLAND RESTORATIONNOTES:
1. GENERAL SITE DATA ARE PROVIDED BY NCEEP. 2. ALL LOCATIONS ARE APPROXIMATE
PROJECT NO. 65ANSON COUNTYNORTH CAROLINAMONITORING YEAR 5 OF 5 CURRENT CONDITION PLAN VIEW
DATE:SCALE:JOB NO.:
JANUARY 20121" = 60'
JJX31100
FIGURE 2-11
³
LEGENDConservation EasementExtent of Bankfull BenchTerrace CrestChannel BottomChannel TopStream CenterlineCross-SectionStationing (100' interval)Stream Enhancement (Level 1)Stream Enhancement (Level 2)Stream Preservation
Wetland RestorationWetland EnhancementWetland Preservation2011-In-Stream Vegetation2011-Poor Vegetation Cover2011-Beaver Dam
"/ Crest Gauge!( Groundwater Gauge - Meets Criteria!( Groundwater Gauge - Did Not Meet Criteria
Vegetation Plot SuccessMeetsDid Not Meet
60 0 6030Feet

"
VP 13
XS 13
"
UNNAMED TRIBUTARY TODULA THOROUGHFARE
"
UNNAMED TRIBUTARY TODULA THOROUGHFARE
NC ECOSYSTEM ENHANCEMENT PROGRAMDULA THOROUGHFARE AND UT TO DULA THOROUGHFARE STREAM AND WETLAND RESTORATIONNOTES:
1. GENERAL SITE DATA ARE PROVIDED BY NCEEP. 2. ALL LOCATIONS ARE APPROXIMATE
PROJECT NO. 65ANSON COUNTYNORTH CAROLINAMONITORING YEAR 5 OF 5 CURRENT CONDITION PLAN VIEW
DATE:SCALE:JOB NO.:
JANUARY 20121" = 60'
JJX31100
FIGURE 2-12
³
LEGENDConservation EasementExtent of Bankfull BenchTerrace CrestChannel BottomChannel TopStream CenterlineCross-SectionStationing (100' interval)Stream Enhancement (Level 1)Stream Enhancement (Level 2)Stream Preservation
Wetland RestorationWetland EnhancementWetland Preservation2011-In-Stream Vegetation2011-Poor Vegetation Cover2011-Beaver Dam
"/ Crest Gauge!( Groundwater Gauge - Meets Criteria!( Groundwater Gauge - Did Not Meet Criteria
Vegetation Plot SuccessMeetsDid Not Meet
60 0 6030Feet

"
VP 14
XS 13
XS 14
"
UNNAMED TRIBUTARY TODULA THOROUGHFARE
NC ECOSYSTEM ENHANCEMENT PROGRAMDULA THOROUGHFARE AND UT TO DULA THOROUGHFARE STREAM AND WETLAND RESTORATIONNOTES:
1. GENERAL SITE DATA ARE PROVIDED BY NCEEP. 2. ALL LOCATIONS ARE APPROXIMATE
PROJECT NO. 65ANSON COUNTYNORTH CAROLINAMONITORING YEAR 5 OF 5 CURRENT CONDITION PLAN VIEW
DATE:SCALE:JOB NO.:
JANUARY 20121" = 60'
JJX31100
FIGURE 2-13
³
LEGENDConservation EasementExtent of Bankfull BenchTerrace CrestChannel BottomChannel TopStream CenterlineCross-SectionStationing (100' interval)Stream Enhancement (Level 1)Stream Enhancement (Level 2)Stream Preservation
Wetland RestorationWetland EnhancementWetland Preservation2011-In-Stream Vegetation2011-Poor Vegetation Cover2011-Beaver Dam
"/ Crest Gauge!( Groundwater Gauge - Meets Criteria!( Groundwater Gauge - Did Not Meet Criteria
Vegetation Plot SuccessMeetsDid Not Meet
60 0 6030Feet

"
VP 15
XS 15
"
UNNAMED TRIBUTARY TODULA THOROUGHFARE
NC ECOSYSTEM ENHANCEMENT PROGRAMDULA THOROUGHFARE AND UT TO DULA THOROUGHFARE STREAM AND WETLAND RESTORATIONNOTES:
1. GENERAL SITE DATA ARE PROVIDED BY NCEEP. 2. ALL LOCATIONS ARE APPROXIMATE
PROJECT NO. 65ANSON COUNTYNORTH CAROLINAMONITORING YEAR 5 OF 5 CURRENT CONDITION PLAN VIEW
DATE:SCALE:JOB NO.:
JANUARY 20121" = 60'
JJX31100
FIGURE 2-14
³
LEGENDConservation EasementExtent of Bankfull BenchTerrace CrestChannel BottomChannel TopStream CenterlineCross-SectionStationing (100' interval)Stream Enhancement (Level 1)Stream Enhancement (Level 2)Stream Preservation
Wetland RestorationWetland EnhancementWetland Preservation2011-In-Stream Vegetation2011-Poor Vegetation Cover2011-Beaver Dam
"/ Crest Gauge!( Groundwater Gauge - Meets Criteria!( Groundwater Gauge - Did Not Meet Criteria
Vegetation Plot SuccessMeetsDid Not Meet
60 0 6030Feet

"
UNNAMED TRIBUTARY TODULA THOROUGHFARE
NC ECOSYSTEM ENHANCEMENT PROGRAMDULA THOROUGHFARE AND UT TO DULA THOROUGHFARE STREAM AND WETLAND RESTORATIONNOTES:
1. GENERAL SITE DATA ARE PROVIDED BY NCEEP. 2. ALL LOCATIONS ARE APPROXIMATE
PROJECT NO. 65ANSON COUNTYNORTH CAROLINAMONITORING YEAR 5 OF 5 CURRENT CONDITION PLAN VIEW
DATE:SCALE:JOB NO.:
JANUARY 20121" = 60'
JJX31100
FIGURE 2-15
³
LEGENDConservation EasementExtent of Bankfull BenchTerrace CrestChannel BottomChannel TopStream CenterlineCross-SectionStationing (100' interval)Stream Enhancement (Level 1)Stream Enhancement (Level 2)Stream Preservation
Wetland RestorationWetland EnhancementWetland Preservation2011-In-Stream Vegetation2011-Poor Vegetation Cover2011-Beaver Dam
"/ Crest Gauge!( Groundwater Gauge - Meets Criteria!( Groundwater Gauge - Did Not Meet Criteria
Vegetation Plot SuccessMeetsDid Not Meet
60 0 6030Feet

"
UNNAMED TRIBUTARY TODULA THOROUGHFARE
NC ECOSYSTEM ENHANCEMENT PROGRAMDULA THOROUGHFARE AND UT TO DULA THOROUGHFARE STREAM AND WETLAND RESTORATIONNOTES:
1. GENERAL SITE DATA ARE PROVIDED BY NCEEP. 2. ALL LOCATIONS ARE APPROXIMATE
PROJECT NO. 65ANSON COUNTYNORTH CAROLINAMONITORING YEAR 5 OF 5 CURRENT CONDITION PLAN VIEW
DATE:SCALE:JOB NO.:
JANUARY 20121" = 60'
JJX31100
FIGURE 2-16
³
LEGENDConservation EasementExtent of Bankfull BenchTerrace CrestChannel BottomChannel TopStream CenterlineCross-SectionStationing (100' interval)Stream Enhancement (Level 1)Stream Enhancement (Level 2)Stream Preservation
Wetland RestorationWetland EnhancementWetland Preservation2011-In-Stream Vegetation2011-Poor Vegetation Cover2011-Beaver Dam
"/ Crest Gauge!( Groundwater Gauge - Meets Criteria!( Groundwater Gauge - Did Not Meet Criteria
Vegetation Plot SuccessMeetsDid Not Meet
60 0 6030Feet
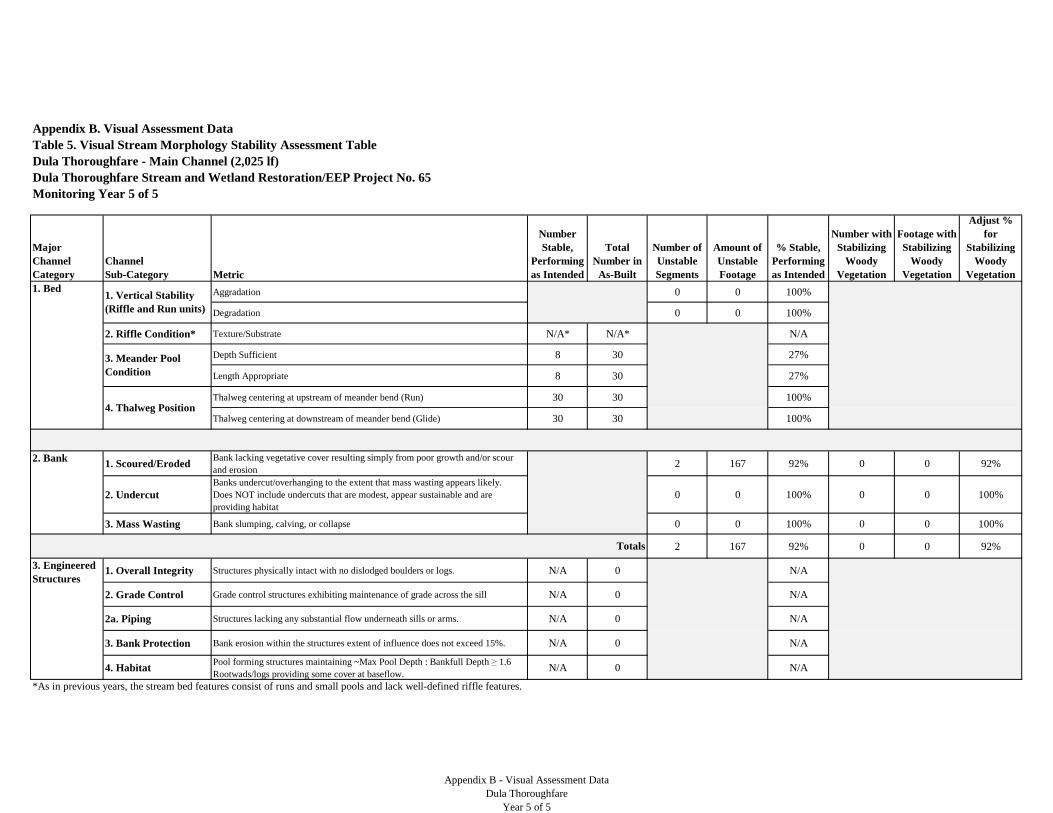
Appendix B. Visual Assessment DataTable 5. Visual Stream Morphology Stability Assessment TableDula Thoroughfare - Main Channel (2,025 lf)Dula Thoroughfare Stream and Wetland Restoration/EEP Project No. 65Monitoring Year 5 of 5
Major Channel Category
Channel Sub-Category Metric
Number Stable,
Performing as Intended
Total Number in
As-Built
Number of Unstable Segments
Amount of Unstable Footage
% Stable, Performing as Intended
Number with Stabilizing
Woody Vegetation
Footage with Stabilizing
Woody Vegetation
Adjust % for
Stabilizing Woody
Vegetation
Aggradation 0 0 100%
Degradation 0 0 100%
2. Riffle Condition* Texture/Substrate N/A* N/A* N/A
Depth Sufficient 8 30 27%
Length Appropriate 8 30 27%
Thalweg centering at upstream of meander bend (Run) 30 30 100%
Thalweg centering at downstream of meander bend (Glide) 30 30 100%
1. Scoured/ErodedBank lacking vegetative cover resulting simply from poor growth and/or scour and erosion
2 167 92% 0 0 92%
2. UndercutBanks undercut/overhanging to the extent that mass wasting appears likely. Does NOT include undercuts that are modest, appear sustainable and are providing habitat
0 0 100% 0 0 100%
3. Mass Wasting Bank slumping, calving, or collapse 0 0 100% 0 0 100%
2 167 92% 0 0 92%
1. Overall Integrity Structures physically intact with no dislodged boulders or logs. N/A 0 N/A
2. Grade Control Grade control structures exhibiting maintenance of grade across the sill N/A 0 N/A
2a. Piping Structures lacking any substantial flow underneath sills or arms. N/A 0 N/A
3. Bank Protection Bank erosion within the structures extent of influence does not exceed 15%. N/A 0 N/A
4. HabitatPool forming structures maintaining ~Max Pool Depth : Bankfull Depth ≥ 1.6 Rootwads/logs providing some cover at baseflow.
N/A 0 N/A
*As in previous years, the stream bed features consist of runs and small pools and lack well-defined riffle features.
Totals
2. Bank
1. Vertical Stability (Riffle and Run units)
3. Meander Pool Condition
4. Thalweg Position
1. Bed
3. Engineered Structures
Appendix B - Visual Assessment DataDula Thoroughfare
Year 5 of 5

Appendix B. Visual Assessment DataTable 5. Visual Stream Morphology Stability Assessment TableDula Thoroughfare - Tributary (705 lf)Dula Thoroughfare Stream and Wetland Restoration/EEP Project No. 65Monitoring Year 5 of 5
Major Channel Category
Channel Sub-Category Metric
Number Stable,
Performing as Intended
Total Number in
As-Built
Number of Unstable Segments
Amount of Unstable Footage
% Stable, Performing as Intended
Number with Stabilizing
Woody Vegetation
Footage with Stabilizing
Woody Vegetation
Adjust % for
Stabilizing Woody
Vegetation
Aggradation 0 0 100%
Degradation 0 0 100%
2. Riffle Condition* Texture/Substrate N/A 0 N/A
Depth Sufficient N/A 11 N/A
Length Appropriate 0 11 0%
Thalweg centering at upstream of meander bend (Run) 11 11 100%
Thalweg centering at downstream of meander bend (Glide) 11 11 100%
1. Scoured/ErodedBank lacking vegetative cover resulting simply from poor growth and/or scour and erosion
5 122 83% 0 0 83%
2. UndercutBanks undercut/overhanging to the extent that mass wasting appears likely. Does NOT include undercuts that are modest, appear sustainable and are providing habitat
0 0 100% 0 0 100%
3. Mass Wasting Bank slumping, calving, or collapse 0 0 100% 0 0 100%
5 122 83% 0 0 83%
1. Overall Integrity Structures physically intact with no dislodged boulders or logs. N/A 0 N/A
2. Grade Control Grade control structures exhibiting maintenance of grade across the sill N/A 0 N/A
2a. Piping Structures lacking any substantial flow underneath sills or arms. N/A 0 N/A
3. Bank Protection Bank erosion within the structures extent of influence does not exceed 15%. N/A 0 N/A
4. HabitatPool forming structures maintaining ~Max Pool Depth : Bankfull Depth ≥ 1.6 Rootwads/logs providing some cover at baseflow.
N/A 0 N/A
*The stream bed features consist mainly of runs and small pools.
2. Bank
Totals
3. Engineered Structures
1. Bed1. Vertical Stability (Riffle and Run units)
3. Meander Pool Condition
4. Thalweg Position
Appendix B - Visual Assessment DataDula Thoroughfare - Tributary
Year 5 of 5

Appendix B. Visual Assessment DataTable 5. Visual Stream Morphology Stability Assessment TableUT to Dula Thoroughfare (2,351 lf)Dula Thoroughfare Stream and Wetland Restoration/EEP Project No. 65Monitoring Year 5 of 5
Major Channel Category
Channel Sub-Category Metric
Number Stable,
Performing as Intended
Total Number in
As-Built
Number of Unstable Segments
Amount of Unstable Footage
% Stable, Performing as Intended
Number with Stabilizing
Woody Vegetation
Footage with Stabilizing
Woody Vegetation
Adjust % for
Stabilizing Woody
Vegetation
Aggradation 0 0 100%
Degradation 0 0 100%
2. Riffle Condition Texture/Substrate N/A 0 N/A
Depth Sufficient N/A 0 N/A
Length Appropriate N/A 0 N/A
Thalweg centering at upstream of meander bend (Run) N/A 0 N/A
Thalweg centering at downstream of meander bend (Glide) N/A 0 N/A
1. Scoured/ErodedBank lacking vegetative cover resulting simply from poor growth and/or scour and erosion
0 0 100% 0 0 100%
2. UndercutBanks undercut/overhanging to the extent that mass wasting appears likely. Does NOT include undercuts that are modest, appear sustainable and are providing habitat
0 0 100% 0 0 100%
3. Mass Wasting Bank slumping, calving, or collapse 0 0 100% 0 0 100%
0 0 100% 0 0 100%
1. Overall Integrity Structures physically intact with no dislodged boulders or logs. 3 3 100%
2. Grade Control Grade control structures exhibiting maintenance of grade across the sill N/A N/A N/A
2a. Piping Structures lacking any substantial flow underneath sills or arms. 3 3 100%
3. Bank Protection Bank erosion within the structures extent of influence does not exceed 15%. N/A N/A N/A
4. HabitatPool forming structures maintaining ~Max Pool Depth : Bankfull Depth ≥ 1.6 Rootwads/logs providing some cover at baseflow.
N/A N/A N/A
2. Bank
Totals
3. Engineered Structures
1. Bed1. Vertical Stability (Riffle and Run units)
3. Meander Pool Condition
4. Thalweg Position
Appendix B - Visual Assessment DataUT to Dula Thoroughfare
Year 5 of 5
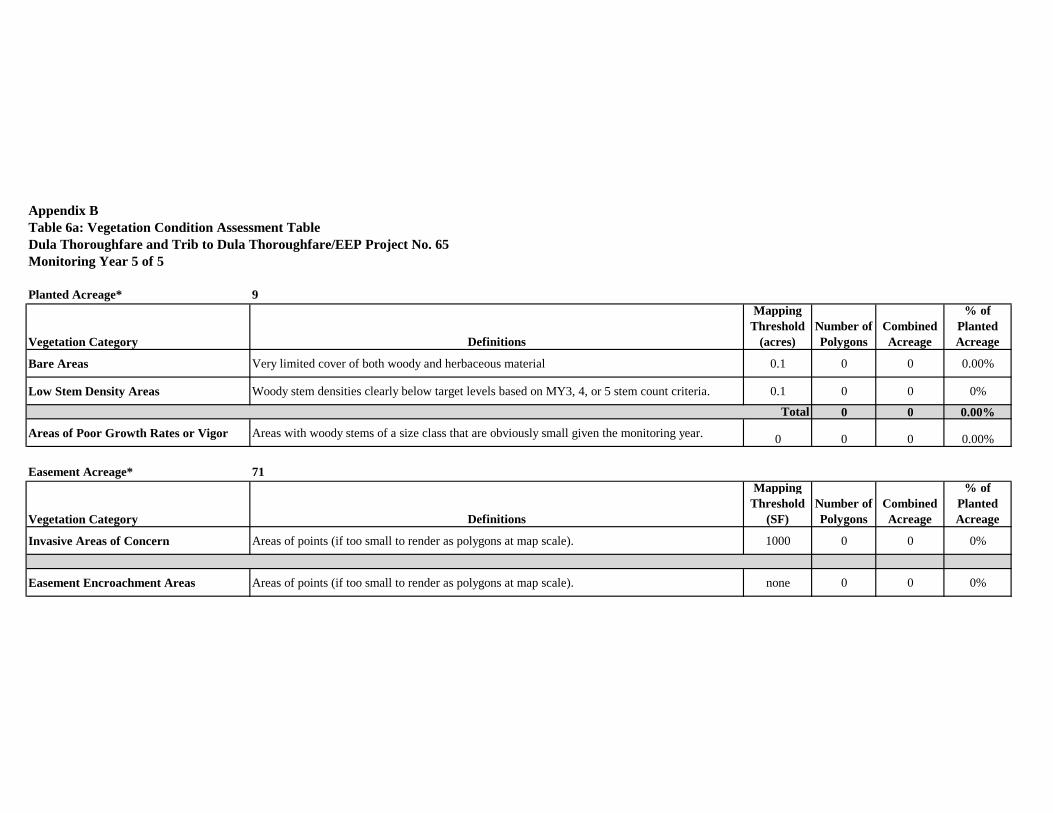
Appendix BTable 6a: Vegetation Condition Assessment TableDula Thoroughfare and Trib to Dula Thoroughfare/EEP Project No. 65Monitoring Year 5 of 5
Planted Acreage* 9
Vegetation Category Definitions
Mapping Threshold
(acres)Number of Polygons
Combined Acreage
% of Planted Acreage
Bare Areas Very limited cover of both woody and herbaceous material 0.1 0 0 0.00%
Low Stem Density Areas Woody stem densities clearly below target levels based on MY3, 4, or 5 stem count criteria. 0.1 0 0 0%
0 0 0.00%
Areas of Poor Growth Rates or Vigor Areas with woody stems of a size class that are obviously small given the monitoring year. 0 0 0 0.00%
Easement Acreage* 71
Vegetation Category Definitions
Mapping Threshold
(SF)Number of Polygons
Combined Acreage
% of Planted Acreage
Invasive Areas of Concern Areas of points (if too small to render as polygons at map scale). 1000 0 0 0%
Easement Encroachment Areas Areas of points (if too small to render as polygons at map scale). none 0 0 0%
Total

Appendix BTable 6: Vegetation Condition Assessment TableUT to Dula Thoroughfare/EEP Project No. 65Monitoring Year 5 of 5
Planted Acreage 17
Vegetation Category Definitions
Mapping Threshold
(acres)Number of Polygons
Combined Acreage
% of Planted Acreage
Bare Areas Very limited cover of both woody and herbaceous material 0.1 0 0 0.00%
Low Stem Density Areas Woody stem densities clearly below target levels based on MY3, 4, or 5 stem count criteria. 0.1 0 0 0.00%
0 0 0.00%
Areas of Poor Growth Rates or Vigor Areas with woody stems of a size class that are obviously small given the monitoring year. 0.05 1 0.05 0.29%
Easement Acreage 31
Vegetation Category Definitions
Mapping Threshold
(SF)Number of Polygons
Combined Acreage
% of Planted Acreage
Invasive Areas of Concern Areas of points (if too small to render as polygons at map scale). 1000 0 0 0%
Easement Encroachment Areas Areas of points (if too small to render as polygons at map scale). none 0 0 0%
Total

Vegetation Plot 8 (MY 1 - 4/2006)
Vegetation Plot 8 (MY 5 - 8/2011)
Prepared For: Prepared By:
Vegetation Plot 8 (MY 5 - 8/2011)
Appendix B – Visual Assessment DataVegetation Plot Photos
Dula Thoroughfare Stream and Wetland Restoration ProjectEEP Project No. 65
Monitoring Year 5 of 5April 2012

Vegetation Plot 9 (MY 1 - 4/2006)
Vegetation Plot 9 (MY 5 - 8/2011)
Prepared For: Prepared By:
Vegetation Plot 9 (MY 2 - 8/2011)
Appendix B – Visual Assessment DataVegetation Plot Photos
Dula Thoroughfare Stream and Wetland Restoration ProjectEEP Project No. 65
Monitoring Year 5 of 5April 2012

Vegetation Plot 10 (MY 1 - 4/2006)
Vegetation Plot 10 (MY 2 - 8/2011)
Prepared For: Prepared By:
Vegetation Plot 10 (MY 2 - 8/2011)
Appendix B – Visual Assessment DataVegetation Plot Photos
Dula Thoroughfare Stream and Wetland Restoration ProjectEEP Project No. 65
Monitoring Year 5 of 5April 2012

Vegetation Plot 11(MY 1 - 4/2006)
Vegetation Plot 11 (MY 5 - 8/2011)
Prepared For: Prepared By:
Vegetation Plot 11 (MY 5 - 8/2011)
Appendix B – Visual Assessment DataVegetation Plot Photos
Dula Thoroughfare Stream and Wetland Restoration ProjectEEP Project No. 65
Monitoring Year 5 of 5April 2012

Vegetation Plot 12 (MY 1 - 4/2006)
Vegetation Plot 12 (MY 5 - 8/2011)
Prepared For: Prepared By:
Vegetation Plot 12 (MY 5 - 8/2011)
Appendix B – Visual Assessment DataVegetation Plot Photos
Dula Thoroughfare Stream and Wetland Restoration ProjectEEP Project No. 65
Monitoring Year 5 of 5April 2012

Vegetation Plot 13 (MY 1 - 4/2006)
Vegetation Plot 13 (MY 5 - 8/2011)
Prepared For: Prepared By:
Vegetation Plot 13 (MY 5 - 8/2011)
Appendix B – Visual Assessment DataVegetation Plot Photos
Dula Thoroughfare Stream and Wetland Restoration ProjectEEP Project No. 65
Monitoring Year 5 of 5April 2012

Vegetation Plot 14 (MY 3 - 6/2009)
Vegetation Plot 14 (MY 5 - 8/2011)
Prepared For: Prepared By:
Vegetation Plot 14 (MY 5 - 8/2011)
Appendix B – Visual Assessment DataVegetation Plot Photos
Dula Thoroughfare Stream and Wetland Restoration ProjectEEP Project No. 65
Monitoring Year 5 of 5April 2012

Vegetation Plot 15 (MY 1 - 4/2006)
Vegetation Plot 15 (MY 5 - 8/2011)
Prepared For: Prepared By:
Vegetation Plot 15 (MY 5 - 8/2011)
Appendix B – Visual Assessment DataVegetation Plot Photos
Dula Thoroughfare Stream and Wetland Restoration ProjectEEP Project No. 65
Monitoring Year 5 of 5April 2012

Cross Section 1: View Upstream (MY 1 - 10/2006)
Cross Section 1: View Upstream (MY 5 - 7/2011)
Cross Section 1: View Upstream (MY 1 - 10/2006)
Cross Section 2: View Downstream (MY 5 - 7/2011)
Prepared For: Prepared By:Appendix B – Visual Assessment DataStream Station & Cross Section Photos
Dula Thoroughfare Stream and Wetland Restoration ProjectEEP Project No. 65
Monitoring Year 5 of 5April 2012

Cross Section 2: View Upstream (MY 1 - 10/2006)
Cross Section 2: View Upstream (MY 5 - 7/2011)
Cross Section 2: View Upstream (MY 1 - 10/2006)
Cross Section 2: View Downstream (MY 5 - 7/2011)
Prepared For: Prepared By:Appendix B – Visual Assessment DataStream Station & Cross Section Photos
Dula Thoroughfare Stream and Wetland Restoration ProjectEEP Project No. 65
Monitoring Year 5 of 5April 2012

Cross Section 3: View Upstream (MY 1 - 10/2006)
Cross Section 3: View Upstream (MY 5 - 7/2011)
Cross Section 3: View Upstream (MY 1 - 10/2006)
Cross Section 3: View Downstream (MY 5 - 7/2011)
Prepared For: Prepared By:Appendix B – Visual Assessment DataStream Station & Cross Section Photos
Dula Thoroughfare Stream and Wetland Restoration ProjectEEP Project No. 65
Monitoring Year 5 of 5April 2012

Cross Section 4: View Upstream (MY 1 - 10/2006)
Cross Section 4: View Upstream (MY 5 - 7/2011)
Cross Section 4: View Upstream (MY 1 - 10/2006)
Cross Section 4: View Downstream (MY 5 - 7/2011)
Prepared For: Prepared By:Appendix B – Visual Assessment DataStream Station & Cross Section Photos
Dula Thoroughfare Stream and Wetland Restoration ProjectEEP Project No. 65
Monitoring Year 5 of 5April 2012

Cross Section 13: View Upstream (MY 1 - 10/2006)
Cross Section 13: View Upstream (MY 5 - 7/2011)
Cross Section 13: View Upstream (MY 1 - 10/2006)
Cross Section 13: View Downstream (MY 5 - 7/2011)
Prepared For: Prepared By:Appendix B – Visual Assessment DataStream Station & Cross Section Photos
Dula Thoroughfare Stream and Wetland Restoration ProjectEEP Project No. 65
Monitoring Year 5 of 5April 2012

Cross Section 14: View Upstream (MY 1 - 10/2006)
Cross Section 14: View Upstream (MY 5 - 7/2011)
Cross Section 14: View Upstream (MY 1 - 10/2006)
Cross Section 14: View Downstream (MY 5 - 7/2011)
)Prepared For: Prepared By:Appendix B – Visual Assessment Data
Stream Station & Cross Section PhotosDula Thoroughfare Stream and Wetland Restoration Project
EEP Project No. 65Monitoring Year 5 of 5
April 2012
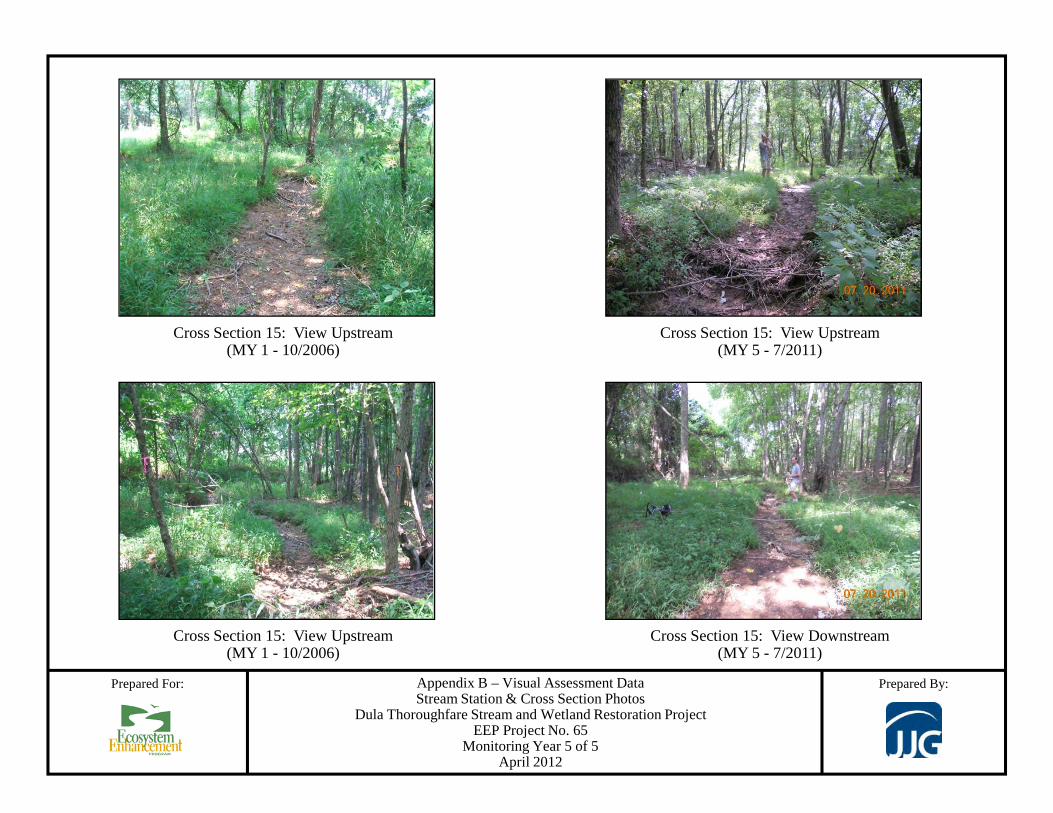
Cross Section 15: View Upstream (MY 1 - 10/2006)
Cross Section 15: View Upstream (MY 5 - 7/2011)
Cross Section 15: View Upstream (MY 1 - 10/2006)
Cross Section 15: View Downstream (MY 5 - 7/2011)
Prepared For: Prepared By:Appendix B – Visual Assessment DataStream Station & Cross Section Photos
Dula Thoroughfare Stream and Wetland Restoration ProjectEEP Project No. 65
Monitoring Year 5 of 5April 2012

Photo Point 1: View Upstream (MY 1 - 7/2006)
Photo Point 1: View Upstream (MY 5 - 7/2011)
Photo Point 1: View Downstream (MY 1 - 7/2006)
Photo Point 1: View Downstream(MY 5 - 7/2011)
Prepared For: Prepared By:Appendix B – Visual Assessment DataStream Station & Cross Section Photos
Dula Thoroughfare Stream and Wetland Restoration ProjectEEP Project No. 65
Monitoring Year 5 of 5April 2012

Photo Point 2: View Upstream (MY 1 - 7/2006)
Photo Point 2: View Upstream (MY 5 - 7/2011)
Photo Point 2: View Downstream (MY 1 - 7/2006)
Photo Point 2: View Downstream(MY 5 - 7/2011)
Prepared For: Prepared By:Appendix B – Visual Assessment DataStream Station & Cross Section Photos
Dula Thoroughfare Stream and Wetland Restoration ProjectEEP Project No. 65
Monitoring Year 5 of 5April 2012

Photo Point 3: View Upstream (MY 1 - 7/2006)
Photo Point 3: View Upstream (MY 5 - 7/2011)
Photo Point 3: View Downstream (MY 1 - 7/2006)
Photo Point 3: View Downstream(MY 5 - 7/2011)
Prepared For: Prepared By:Appendix B – Visual Assessment DataStream Station & Cross Section Photos
Dula Thoroughfare Stream and Wetland Restoration ProjectEEP Project No. 65
Monitoring Year 5 of 5April 2012

Photo Point 4: View Upstream (MY 1 - 7/2006)
Photo Point 4: View Upstream (MY 5 - 7/2011)
Photo Point 4: View Downstream (MY 1 - 7/2006)
Photo Point 4: View Downstream(MY 5 - 7/2011)
Prepared For: Prepared By:Appendix B – Visual Assessment DataStream Station & Cross Section Photos
Dula Thoroughfare Stream and Wetland Restoration ProjectEEP Project No. 65
Monitoring Year 5 of 5April 2012

Dula Thoroughfare Stream and April 2012 Wetland Restoration Monitoring Year 5 of 5 EEP Project No. 65
APPENDIX C VEGETATION PLOT DATA
Table 7 Vegetation Plot Mitigation Success Summary Table Table 8 CVS Vegetation Metadata Table Table 9 CVS Stem Count Total and Planted by Plat and Species

Appendix CTable 7 Vegetation Plot Mitigation Success
Vegetation Survival Threshold Met
(Y/N)Plot 8 YPlot 9 Y
Plot 10 YPlot 11 YPlot 12 NPlot 13 YPlot 14 NPlot 15 N
Dula Thoroughfare Stream and Wetland Restoration/EEP Project 65Dula Thoroughfare and UT Dula ThoroughfareMonitoring Year 5 of 5
Vegetation Plot ID

Appendix CTable 8: CVS Vegetation Metadata Table
Monitoring Year 5 of 5
Report Prepared ByDate Prepareddatabase namedatabase location
DESCRIPTION OF WORKSHEETS IN THIS DOCUMENT------------Metadata Description of database file, the report worksheets, and a summary of project(s) and project data.Proj, planted Each project is listed with its PLANTED stems per acre, for each year. This excludes live stakes.Proj, total stems Each project is listed with its TOTAL stems per acre, for each year. This includes live stakes, all planted stems, and all natural/volunteer stems.Plots List of plots surveyed with location and summary data (live stems, dead stems, missing, etc.).Vigor Frequency distribution of vigor classes for stems for all plots.Vigor by Spp Frequency distribution of vigor classes listed by species.Damage List of most frequent damage classes with number of occurrences and percent of total stems impacted by each.Damage by Spp Damage values tallied by type for each species.
Damage by Plot Damage values tallied by type for each plot.
Planted Stems by Plot and Spp A matrix of the count of PLANTED living stems of each species for each plot; dead and missing stems are excluded.ALL Stems by Plot and spp A matrix of the count of total living stems of each species (planted and natural volunteers combined) for each plot; dead and missing stems are excluded.
PROJECT SUMMARY-------------------------------------Project Code D05010S
project Name Bishop Site Stream and Wetland Restoration
Description Stream and wetland restoration/enhancement in Anson Countylength(ft)stream-to-edge width (ft)area (sq m)Required Plots (calculated)Sampled Plots
J:\JJX31100\M5-Field Monitoring Data\MY 2011\VEGETATION\Bishop Sites
88
Dula Thoroughfare Stream and Wetland Restoration/EEP Project 65Dula Thoroughfare and UT Dula Thoroughfare
Heath Caldwell9/7/2011 15:20Database1.mdb

Appendix CTable 9: CVS Stem Count Total and Planted by Plot and Species
P T P T P T P T P T P T P T P T P T P TAcer negundo box-elder T 3 N/A 1 N/A N/A N/A 1 N/A N/A N/A 1Acer rubrum red maple T N/A N/A N/A N/A N/A N/A N/A N/A N/A 0Baccharis hamilifolia groundsel tree S N/A N/A N/A N/A N/A N/A N/A N/A N/A 1Betula nigra river birch T 1 1 17 17 14 14 2 79 2 2 7 23 7 7 7 9 7 7 7 7Carya glabra pignut hickory T N/A N/A N/A N/A N/A N/A N/A N/A N/A N/ACarya ovata shagbark hickory T N/A N/A 1 1 1 1 1 1 1 1Celtis laevigata sugarberry T 1 1 1 1 1 1 1 1 1 1 1 1Cephalanthus occidentalis common buttonbush T 1 1 5 5 3 3 3 3 2 2 3 3 3 3 3 3 3 4Cornus amomum silky dogwood T 3 3 9 14 3 3 3 4 4 4 4 5 4 4 4 5Cornus florida flowering dogwood S N/A N/A 1 1 1 1 1 1 N/A N/ADiospyros virginiana common persimmon T N/A N/A N/A N/A N/A N/A N/A N/A N/A N/AFagus grandifolia American beech T N/A N/A N/A N/A N/A N/A N/A N/A N/A N/AFraxinus pennsylvanica green ash T 3 5 4 4 1 1 2 3 3 4 3 4 4 4 4Liquidambar styraciflua sweet gum T 3 N/A 1 N/A N/A N/A 1 N/A N/A N/A 3Nyssa biflora swamp tupelo T 1 1 1 1 1 1 1 1 1 1 1 1 1 1Pinus taeda loblolly pine T N/A N/A N/A N/A N/A N/A N/A N/A N/A 1Platanus occidentalis American sycamore T 1 1 5 5 1 1 3 3 3 3 3 3 3 3Quercus michauxii swamp chestnut oak T 2 2 1 1 1 1 1 1 1 1 1 1 1 1 1 1Quercus pagoda cherrybark oak T 2 4 1 3 1 1 1 1 1 2 1 1 1 1 1 1 1 2Quercus phellos willow oak T 2 4 2 2 2 2 1 1 2 2 2 2 2 2 2 2 2 2Quercus rubra Northern red oak T N/A N/A N/A N/A N/A N/A N/A N/A N/A 1Quercus sp. oak species T N/A N/A N/A N/A N/A 3 N/A N/A N/A N/AUlmus alata winged elm T 48 N/A 10 N/A N/A N/A N/A N/A N/A N/A 58Ulmus americana American elm T 3 4 1 1 1 1 1 2 2 2 3 2 2 2 8
8 9 8 8 9 9 4 6 3 5 11 13 7 7 7 8 12 12 12 1215 24 39 47 30 30 9 90 6 55 22 51 21 21 20 24 29 29 29 29607 972 1579 1903 1215 1215 364 3644 243 2227 802 1992 842 842 802 980 810 818 810 818
Type=Shrub or TreeP = PlantedT = Total
Dula Thoroughfare/EEP Project No. 65Monitoring Year 5 of 5
Species Common Name Type
Stems per Acre
Current Data (MY5-2011) Annual MeansMY2 - 2008 MY4 - 2010MY3 - 2009
Plot Area (acres) 0.0247Species Count
Stem Count
Current Mean MY1 - 2007Plot 8 Plot 9 Plot 10 Plot 11 Plot 12

Appendix CTable 9: CVS Stem Count Total and Planted by Plot and Species
Monitoring Year 5 of 5
P T P T P T P T P T P T P T P TAcer rubrum red maple T 2 N/A 1 N/A N/A N/A N/A N/A N/A N/A 17Carya glabra pignut hickory T N/A N/A N/A N/A N/A N/A N/A N/A N/A 1Celtis laevigata sugarberry T 2 2 1 1 4 4 2 3 3 3 2 2Cornus amomum silky dogwood T N/A N/A N/A N/A N/A 2 N/A N/A N/A N/ACornus florida flowering dogwood S 1 1 1 1 1 1 1 1 1 1 1 1 1 1Diospyros virginiana common persimmon T N/A N/A N/A N/A N/A N/A N/A N/A N/A 4Fagus grandifolia American beech T 1 1 1 3 2 4 1 3 1 1 1 1 1 1 1 2Liquidambar styraciflua sweet gum T 1 2 N/A 1 N/A N/A N/A 1 N/A N/A N/A 5Nyssa biflora swamp tupelo T N/A N/A 1 1 1 1 1 1 N/A N/APinus taeda loblolly pine T 22 3 11 N/A 12 N/A N/A N/A N/A N/A N/A N/A 11Quercus falcata southern red oak T 4 4 2 3 1 3 2 3 2 2 1 1 2 2 2 2Quercus phellos willow oak T 1 1 1 1 1 1 1 2 1 1 1 1Quercus rubra northern red oak T 2 2 1 1 4 4 4 4 4 4 4 4Rhus glabra smooth sumac S 7 N/A 2 N/A N/A N/A N/A N/A N/A N/A 3Taxodium distichum bald cypress T N/A N/A N/A N/A N/A N/A N/A N/A N/A 1
4 6 3 5 4 7 4 7 4 4 4 4 6 6 4 89 38 4 11 5 24 6 23 8 8 6 6 9 9 7 27
364 1538 162 445 202 972 243 985 310 310 243 256 283 283 243 1039Type=Shrub or TreeP = PlantedT = Total
MY1 - 2007 MY4 - 2010
Plot Area (acres)Species Count
Common Name TypePlot 13 MY2 - 2008Plot 15Plot 14
SpeciesCurrent Mean
UT to Dula Thoroughfare/EEP Project No. 65
MY2 - 2008
Stem Count
Stems per Acre
Current Data (MY5-2011) Annual Means
0.0247

Dula Thoroughfare Stream and April 2012 Wetland Restoration Monitoring Year 5 of 5 EEP Project No. 65
APPENDIX D STREAM SURVEY DATA
Figures 3a-3d Cross-sections with Annual Overlays Figure 4 Longitudinal Profiles with Annual Overlays Figures 5a-5d Pebble Count Plots with Annual Overlays Tables 10a,b Baseline – Stream Data Summary Tables Table 11a Monitoring – Cross-Section Morphology Data Table Table 11b Monitoring – Stream Reach Morphology Data Table

Appendix D. Stream Survey DataFigure 3a: Cross-Section Plots and Raw Data TablesDula Thoroughfare Stream and Wetland Restoration/EEP Project No. 65Dula Thoroughfare Main ChannelDula Thoroughfare Main ChannelMonitoring Year 5 of 5
Project Name Dula ThoroughfareEEP Project Number 65Cross-Section ID XS-1, Riffle, 1+93Survey Date 3/2012
996.84
4.94
6.49998.18120.18
Flood Prone Area Elevation (ft)Flood Prone Width (ft)
Bankfull Width (ft)
Survey Date 3/2012
SUMMARY DATABankfull Elevation (ft)
Bankfull Cross-Sectional Area (ft2)
120.180.761.348.54
18.521.00
Station Elevation Notes
Bank Height Ratio XS-1: View Upstream XS-1: View Downstream
Flood Prone Width (ft)Bankfull Mean Depth (ft)Bankfull Max Depth (ft)W/D RatioEntrenchment Ratio
Station Elevation Notes0.31 998.26 xs11.49 998.24 xs14.73 997.62 xs18.68 997.33 xs1
16.86 997.25 xs125.39 997.36 xs137.32 997.32 xs1 997.5
998
998.5
Dula Thoroughfare (Main Channel) - MY5Cross-Section 1 - Pool
37.32 997.32 xs148.32 997.24 xs156.18 997.22 xs162.02 997 xs164.91 997.2 xs166.66 997.1 xs167.18 996.74 xs167.6 996.48 xs1
996
996.5
997
997.5
Ele
vati
on (f
t-ar
bitr
ary)
67.6 996.48 xs168.42 995.8 xs169.57 995.69 xs169.72 995.5 xs169.77 995.54 xs170.69 995.69 xs171.79 996.03 xs172.44 996.53 xs172.88 996.64 xs1
995
995.5
0 20 40 60 80 100 120 140Station (ft)
MY1-2007 MY2-2008 MY3-2009 MY4-2010 MY5-2011 Bankfull Water Surface
72.88 996.64 xs173.59 996.86 xs174.58 997.26 xs1 Station Elevation Notes78.25 997.23 xs1 113.1 996.87 xs186.44 997.06 xs1 116.17 997 xs193.19 996.81 xs1 119.91 997.62 xs199.09 996.82 xs1 122.09 998.21 xs1107.85 996.77 xs1 125.02 998.26 xs1-rpb107.85 996.77 xs1 125.02 998.26 xs1-rpb

Appendix D. Stream Survey DataFigure 3b: Cross-Section Plots and Raw Data TablesDula Thoroughfare Stream and Wetland Restoration/EEP Project No. 65Dula Thoroughfare Main ChannelDula Thoroughfare Main ChannelMonitoring Year 5 of 5
Project Name Dula ThoroughfareEEP Project Number 65Cross-Section ID XS-2, Run, 10+21Survey Date 3/2012
996.224.817.44
999.24150.94
Flood Prone Area Elevation (ft)Flood Prone Width (ft)
Bankfull Width (ft)
Survey Date 3/2012
SUMMARY DATABankfull Elevation (ft)Bankfull Cross-Sectional Area (ft2)
150.940.653.02
11.4520.291.00
Station Elevation Notes
Bank Height Ratio XS-2: View Upstream XS-2: View Downstream
Flood Prone Width (ft)Bankfull Mean Depth (ft)Bankfull Max Depth (ft)W/D RatioEntrenchment Ratio
Station Elevation Notes0 999.35 xs2-lpt0 999.31 xs2-lpb
3.02 999.08 xs24.94 998.28 xs28.12 997.2 xs2
10.59 996.47 xs216.99 996.14 xs2
998
999
1000
arbi
trar
y)
Dula Thoroughfare (Main Channel) - MY5Cross-Section 2 - Run
16.99 996.14 xs221.92 995.94 xs223.43 995.71 xs223.89 994.94 xs227.51 993.69 xs236.75 993.38 xs246.98 993.2 xs256.86 993.2 xs2
994
995
996
997
Ele
vatio
n (f
t-ar
bitr
ary)
56.86 993.2 xs263.4 993.34 xs266.3 995.82 xs2
67.37 995.9 xs270.3 995.91 xs2
78.75 995.94 xs287.02 996.12 xs295.73 996.26 xs2
992
993
0 20 40 60 80 100 120 140 160 180Station (ft)
MY1-2007 MY2-2008 MY3-2009 MY4-2010 MY5-2011 Bankfull Water Surface
98.99 996.25 xs2 Station Elevation Notes Station Elevation Notes Station Elevation Notes100.5 995.88 xs2 105.1 995.61 xs2 126.65 996.07 xs2 146.75 996.73 xs2
100.53 996.03 xs2 105.42 995.97 xs2 131.72 996.07 xs2 150.14 997.19 xs2101.84 994.97 xs2 106.92 996.28 xs2 133.73 995.74 xs2 151.86 997.38 xs2-rpb101.99 995.47 xs2 107.53 996.39 xs2 135.8 995.88 xs2103.26 994.9 xs2 111.47 996.66 xs2 138.66 995.9 xs2104.3 995.05 xs2 115.79 996.48 xs2 140.28 996 xs2104.4 995.45 xs2 121.79 996.28 xs2 143.95 996.41 xs2104.4 995.45 xs2 121.79 996.28 xs2 143.95 996.41 xs2

Appendix D. Stream Survey DataFigure 3c: Cross-Section Plots and Raw Data TablesDula Thoroughfare Stream and Wetland Restoration/EEP Project No. 65Dula Thoroughfare Stream and Wetland Restoration/EEP Project No. 65Dula Thoroughfare Main ChannelMonitoring Year 5 of 5
Project Name Dula ThoroughfareEEP Project Number 65Cross-Section ID XS-3, Pool, 16+99
995.023.024.92
995.8847.07
Flood Prone Area Elevation (ft)Flood Prone Width (ft)
Bankfull Width (ft)
Cross-Section ID XS-3, Pool, 16+99Survey Date 3/2012
SUMMARY DATABankfull Elevation (ft)Bankfull Cross-Sectional Area (ft2)
47.070.610.868.079.571.00Bank Height Ratio XS-3: View Upstream XS-3: View Downstream
Flood Prone Width (ft)Bankfull Mean Depth (ft)Bankfull Max Depth (ft)W/D RatioEntrenchment Ratio
Station Elevation Notes0 996.71 xs3-lpb
1.41 996.72 xs32.55 996.35 xs33.44 995.81 xs35.92 995.45 xs37.56 995.01 xs38.96 995.01 xs3
999
1000
Dula Thoroughfare (Main Channel) - MY5Cross-Section 3 - Pool
The right cross-section pin was re-established in MY-2010
8.96 995.01 xs314.9 995.13 xs3
20.92 995.15 xs325.88 995.17 xs328.7 995.17 xs3
32.45 995.19 xs333.25 995.19 xs334.35 994.82 xs334.34 994.56 xs3
995
996
997
998
Ele
vatio
n (f
t-ar
bitr
ary)
34.34 994.56 xs334.62 994.16 xs335.24 994.77 xs335.39 994.16 xs335.33 994.18 xs337.01 994.16 xs337.96 994.76 xs338.08 994.77 xs338.11 994.77 xs3
993
994
0 20 40 60 80 100 120 140 160Station (ft)
MY1-10/2007 MY2-5/2008 MY3-1/2010 MY4-1/2011 MY5-3/2012 Bankfull Water Surface
38.11 994.77 xs338.72 995.2 xs338.97 995.2 xs341.6 994.99 xs3
44.43 994.99 xs350.39 994.96 xs3-rpb
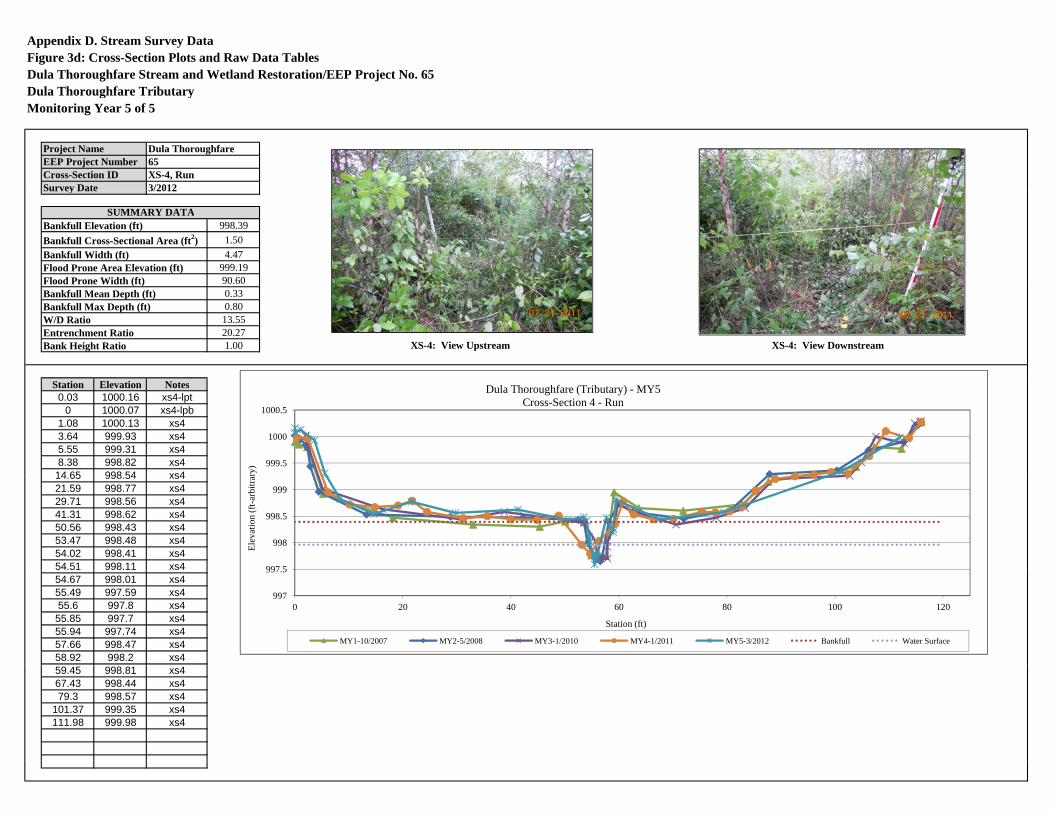
Appendix D. Stream Survey DataFigure 3d: Cross-Section Plots and Raw Data TablesDula Thoroughfare Stream and Wetland Restoration/EEP Project No. 65Dula Thoroughfare TributaryDula Thoroughfare TributaryMonitoring Year 5 of 5
3/2012Survey Date
Project Name Dula ThoroughfareEEP Project Number 65Cross-Section ID XS-4, Run
998.39
1.50
4.47999.1990.60
3/2012
SUMMARY DATABankfull Elevation (ft)
Bankfull Cross-Sectional Area (ft2)Bankfull Width (ft)
Survey Date
Flood Prone Area Elevation (ft)Flood Prone Width (ft) 90.60
0.330.80
13.5520.271.00
Station Elevation Notes
Bank Height Ratio XS-4: View Upstream XS-4: View Downstream
Flood Prone Width (ft)Bankfull Mean Depth (ft)Bankfull Max Depth (ft)W/D RatioEntrenchment Ratio
Station Elevation Notes0.03 1000.16 xs4-lpt
0 1000.07 xs4-lpb1.08 1000.13 xs43.64 999.93 xs45.55 999.31 xs48.38 998.82 xs414.65 998.54 xs4
999.5
1000
1000.5
arbi
trar
y)
Dula Thoroughfare (Tributary) - MY5Cross-Section 4 - Run
14.65 998.54 xs421.59 998.77 xs429.71 998.56 xs441.31 998.62 xs450.56 998.43 xs453.47 998.48 xs454.02 998.41 xs454.51 998.11 xs4 997.5
998
998.5
999
Ele
vati
on (f
t-ar
bitr
ary)
54.51 998.11 xs454.67 998.01 xs455.49 997.59 xs455.6 997.8 xs455.85 997.7 xs455.94 997.74 xs457.66 998.47 xs458.92 998.2 xs459.45 998.81 xs4
997
997.5
0 20 40 60 80 100 120
Station (ft)
MY1-10/2007 MY2-5/2008 MY3-1/2010 MY4-1/2011 MY5-3/2012 Bankfull Water Surface
59.45 998.81 xs467.43 998.44 xs479.3 998.57 xs4
101.37 999.35 xs4111.98 999.98 xs4

999
Figure 4 - Longitudinal Plot Dula Thoroughfare Stream and Wetland Restoration/EEP Project No. 65-Main Channel2011 Monitoring YearMY 5 of 5
998
999
996
997
arbi
trar
y)
994
995
Ele
vati
on (f
t-ar
bitr
ary)
993
994
9920 500 1000 1500 2000
Station (ft)
TW-10/2007 TW-5/2008 TW-1/2010 TW-1/2011 TW-3/2012 WS-3/2012 BKF-3/2012 Cross-Section

Figure 4 - Longitudinal PlotDula Thoroughfare Stream and Wetland Restoration/EEP Project No. 65-Tributary2011 Monitoring YearMY 5 of 5
1000
1001
MY 5 of 5
999
arbi
trar
y)
998
Ele
vati
on (f
t-ar
bitr
ary)
996
997Ele
vati
on (f
t
9950 100 200 300 400 500 600 700
Station (ft)Station (ft)
TW-10/2007 TW-5/2008 TW-1/2010 TW-1/2011 TW-3/2012 WS-3/2012 BKF-3/2012 Cross-Section

Appendix D. Stream Survey DataFigure 5a: Pebble Count Plots with Annual OverlaysDula Thoroughfare Stream and Wetland Restoration/EEP Project No. 65Dula Thoroughfare Stream and Wetland Restoration/EEP Project No. 65Dula Thoroughfare Main ChannelMonitoring Year 5 of 5
Project Name: Dula Thoroughfare-Main ChannelCross-Section: 1
Feature: PoolMY5-8/2011 Cumulative Percent
Description MaterialSize
(mm)Total # Item % Cum %
Silt/Clay silt/clay 0.062 100 100% 100%
MY5-8/2011
0.91
Cumulative Percent
Silt/Clay silt/clay 0.062 100 100% 100%very fine sand 0.125 0 0% 100%
fine sand 0.250 0 0% 100%medium sand 0.50 0 0% 100%Sand 0.6
0.70.80.9
Cumu
lative
Perce
nt (fin
er tha
n)
coarse sand 1.00 0 0% 100%very coarse sand 2.0 0 0% 100%very fine gravel 4.0 0 0% 100%
fine gravel 5.7 0 0% 100% 0.20.30.40.50.6
Cumu
lative
Perce
nt (fin
er tha
n)
fine gravel 5.7 0 0% 100%fine gravel 8.0 0 0% 100%
medium gravel 11.3 0 0% 100%medium gravel 16.0 0 0% 100%Gravel
00.10.2
Cumu
lative
Perce
nt (fin
er tha
n)
medium gravel 16.0 0 0% 100%course gravel 22.3 0 0% 100%course gravel 32.0 0 0% 100%
very coarse gravel 45 0 0% 100%
Gravel
Cumu
lative
Perce
nt (fin
er tha
n)
Particle Size (mm)MY1 (10/2007) MY2 (5/2008) MY3 (1/2010) MY4-2/2011 MY5-8/2011
very coarse gravel 64 0 0% 100%small cobble 90 0 0% 100%
medium cobble 128 0 0% 100%large cobble 180 0 0% 100%
Cobble Individual Class Percentlarge cobble 180 0 0% 100%
very large cobble 256 0 0% 100%small boulder 362 0 0% 100%small boulder 512 0 0% 100%
Cobble
Boulder 70%80%90%
100%
Indivi
dual
Class
Perce
nt
Individual Class Percent
small boulder 512 0 0% 100%medium boulder 1024 0 0% 100%
large boulder 2048 0 0% 100%Bedrock bedrock 40096 0 0% 100%
Boulder
TOTAL % of whole count40%50%60%70%
Indivi
dual
Class
Perce
nt
100 100% 100%
D50 0.03
TOTAL % of whole count
Summary Data0%
10%20%30%40%
Indivi
dual
Class
Perce
ntD50 0.03D84 0.05D95 0.060
0%
Particle Size (mm)MY1 (10/2007) MY2 (5/2008) MY3 (1/2010) MY4-2/2011 MY5-8/2011MY1 (10/2007) MY2 (5/2008) MY3 (1/2010) MY4-2/2011 MY5-8/2011
Appendix D - Stream Survey DataDula Thoroughfare
Year 5 of 5
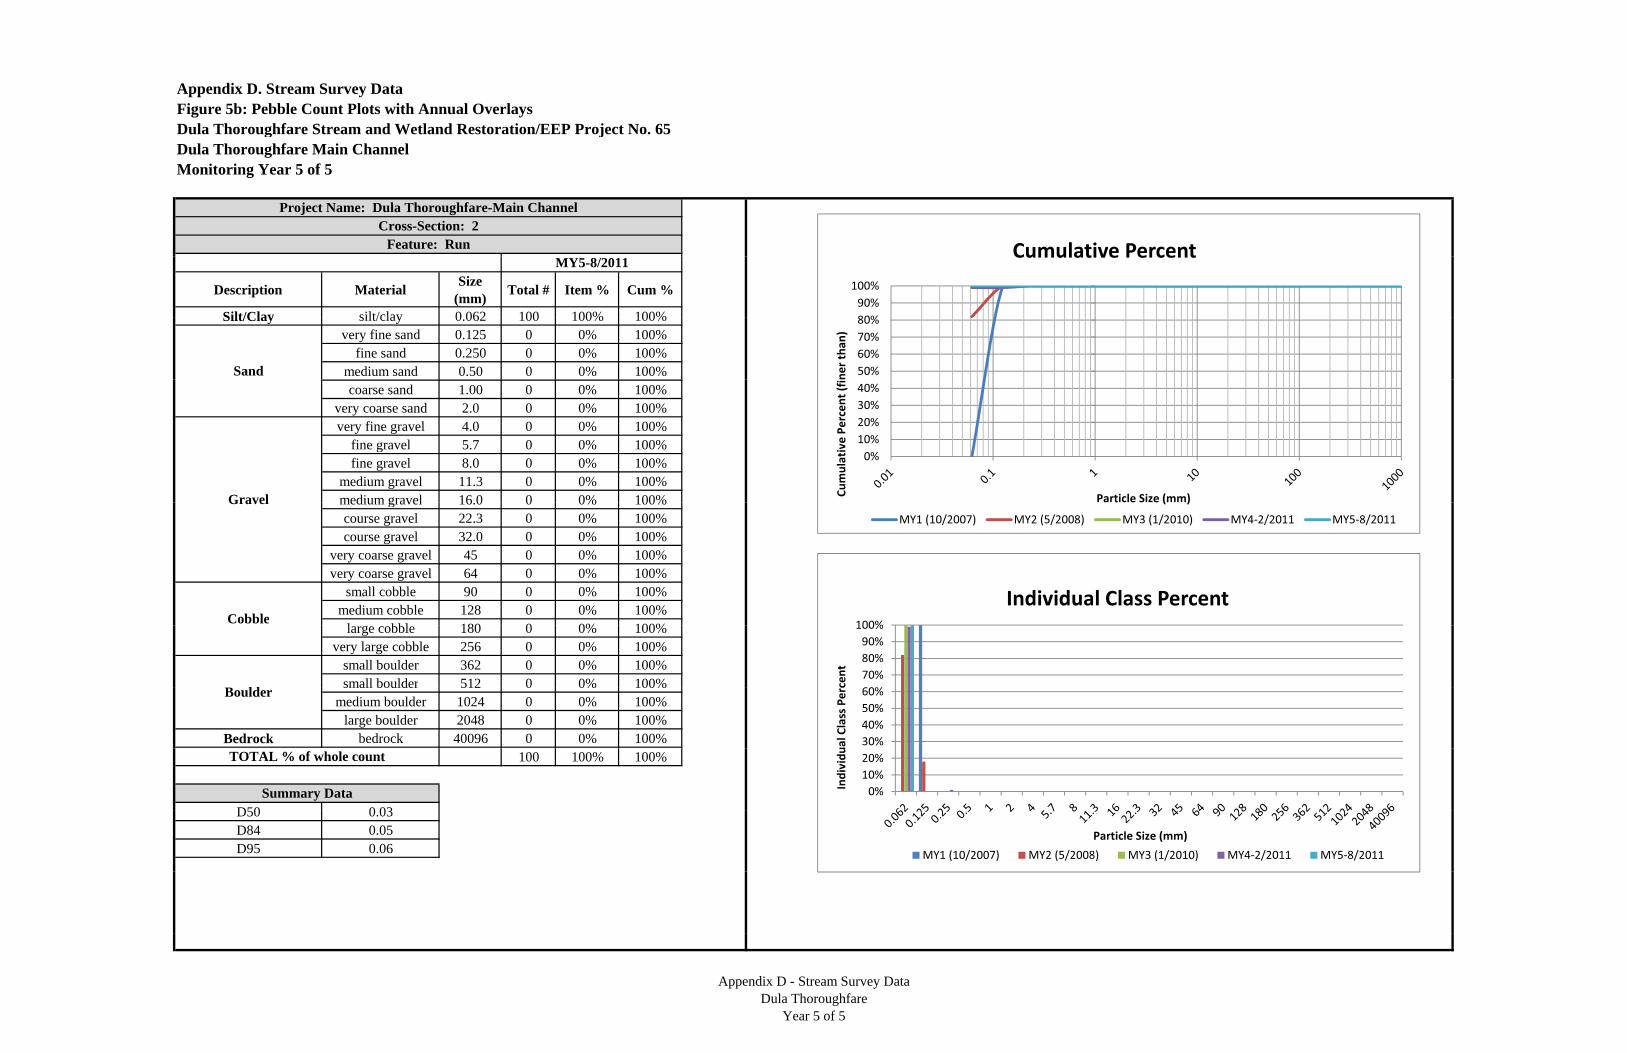
Appendix D. Stream Survey DataFigure 5b: Pebble Count Plots with Annual OverlaysDula Thoroughfare Stream and Wetland Restoration/EEP Project No. 65Dula Thoroughfare Stream and Wetland Restoration/EEP Project No. 65Dula Thoroughfare Main ChannelMonitoring Year 5 of 5
Project Name: Dula Thoroughfare-Main ChannelCross-Section: 2
Feature: RunMY5-8/2011
Cumulative PercentDescription Material
Size (mm)
Total # Item % Cum %
Silt/Clay silt/clay 0.062 100 100% 100%
MY5-8/2011
80%90%
100%
Cumulative Percent
Silt/Clay silt/clay 0.062 100 100% 100%very fine sand 0.125 0 0% 100%
fine sand 0.250 0 0% 100%medium sand 0.50 0 0% 100%Sand 50%
60%70%80%
Cumu
lative
Perce
nt (fin
er tha
n)
coarse sand 1.00 0 0% 100%very coarse sand 2.0 0 0% 100%very fine gravel 4.0 0 0% 100%
fine gravel 5.7 0 0% 100% 10%20%30%40%
Cumu
lative
Perce
nt (fin
er tha
n)
fine gravel 5.7 0 0% 100%fine gravel 8.0 0 0% 100%
medium gravel 11.3 0 0% 100%medium gravel 16.0 0 0% 100%Gravel
0%10%
Cumu
lative
Perce
nt (fin
er tha
n)
Particle Size (mm)medium gravel 16.0 0 0% 100%course gravel 22.3 0 0% 100%course gravel 32.0 0 0% 100%
very coarse gravel 45 0 0% 100%
Gravel Particle Size (mm)MY1 (10/2007) MY2 (5/2008) MY3 (1/2010) MY4-2/2011 MY5-8/2011
very coarse gravel 64 0 0% 100%small cobble 90 0 0% 100%
medium cobble 128 0 0% 100%large cobble 180 0 0% 100%
Cobble 100%Individual Class Percent
large cobble 180 0 0% 100%very large cobble 256 0 0% 100%
small boulder 362 0 0% 100%small boulder 512 0 0% 100%
Cobble
Boulder 60%70%80%90%
100%
Indivi
dual
Class
Perce
nt
small boulder 512 0 0% 100%medium boulder 1024 0 0% 100%
large boulder 2048 0 0% 100%Bedrock bedrock 40096 0 0% 100%
Boulder
TOTAL % of whole count30%40%50%60%
Indivi
dual
Class
Perce
nt
100 100% 100%
D50 0.03
TOTAL % of whole count
Summary Data 0%10%20%
Indivi
dual
Class
Perce
nt
D50 0.03D84 0.05D95 0.06
Particle Size (mm)MY1 (10/2007) MY2 (5/2008) MY3 (1/2010) MY4-2/2011 MY5-8/2011
Appendix D - Stream Survey DataDula Thoroughfare
Year 5 of 5

Appendix D. Stream Survey DataFigure 5c: Pebble Count Plots with Annual OverlaysDula Thoroughfare Stream and Wetland Restoration/EEP Project No. 65Dula Thoroughfare Stream and Wetland Restoration/EEP Project No. 65Dula Thoroughfare Main ChannelMonitoring Year 5 of 5
Project Name: Dula Thoroughfare-Main ChannelCross-Section: 3
Feature: PoolMY5-8/2011 Cumulative Percent
Description MaterialSize
(mm)Total # Item % Cum %
Silt/Clay silt/clay 0.062 100 100% 100%
MY5-8/2011
90%100%
Cumulative Percent
Silt/Clay silt/clay 0.062 100 100% 100%very fine sand 0.125 0 0% 100%
fine sand 0.250 0 0% 100%medium sand 0.50 0 0% 100%Sand
50%60%70%80%90%
Cumu
lative
Perce
nt (fin
er tha
n)
coarse sand 1.00 0 0% 100%very coarse sand 2.0 0 0% 100%very fine gravel 4.0 0 0% 100%
fine gravel 5.7 0 0% 100%20%30%40%50%
Cumu
lative
Perce
nt (fin
er tha
n)
fine gravel 5.7 0 0% 100%fine gravel 8.0 0 0% 100%
medium gravel 11.3 0 0% 100%medium gravel 16.0 0 0% 100%Gravel
0%10%20%
Cumu
lative
Perce
nt (fin
er tha
n)
medium gravel 16.0 0 0% 100%course gravel 22.3 0 0% 100%course gravel 32.0 0 0% 100%
very coarse gravel 45 0 0% 100%
Gravel Cumu
lative
Perce
nt (fin
er tha
n)
Particle Size (mm)MY1 (10/2007) MY2 (5/2008) MY4-2/2011 MY5-8/2011
very coarse gravel 64 0 0% 100%small cobble 90 0 0% 100%
medium cobble 128 0 0% 100%large cobble 180 0 0% 100%
CobbleIndividual Class Percent
large cobble 180 0 0% 100%very large cobble 256 0 0% 100%
small boulder 362 0 0% 100%small boulder 512 0 0% 100%
Cobble
Boulder 70%80%90%
100%
Indivi
dual
Class
Perce
ntsmall boulder 512 0 0% 100%medium boulder 1024 0 0% 100%
large boulder 2048 0 0% 100%Bedrock bedrock 40096 0 0% 100%
Boulder
TOTAL % of whole count 30%40%50%60%70%
Indivi
dual
Class
Perce
nt
100 100% 100%
D50 0.03
TOTAL % of whole count
Summary Data 0%10%20%30%
Indivi
dual
Class
Perce
ntD50 0.03D84 0.05D95 0.06
0%
Particle Size (mm)MY1 (10/2007) MY2 (5/2008) MY3 (1/2010) MY4-2/2011 MY5-8/2011MY1 (10/2007) MY2 (5/2008) MY3 (1/2010) MY4-2/2011 MY5-8/2011
Appendix D - Stream Survey DataDula Thoroughfare
Year 5 of 5

Appendix D. Stream Survey DataFigure 5d: Pebble Count Plots with Annual OverlaysDula Thoroughfare Stream and Wetland Restoration/EEP Project No. 65Dula Thoroughfare Stream and Wetland Restoration/EEP Project No. 65Dula Thoroughfare Main ChannelMonitoring Year 5 of 5
Project Name: Dula Thoroughfare-TributaryCross-Section: 4
Feature: RunMY5-8/2011 Cumulative Percent
Description MaterialSize
(mm)Total # Item % Cum %
Silt/Clay silt/clay 0.062 100 100% 100%
MY5-8/2011
80%90%
100%
Cumu
lative
Perce
nt (fin
er tha
n)
Cumulative Percent
Silt/Clay silt/clay 0.062 100 100% 100%very fine sand 0.125 0 0% 100%
fine sand 0.250 0 0% 100%medium sand 0.50 0 0% 100%Sand 50%
60%70%80%
Cumu
lative
Perce
nt (fin
er tha
n)
coarse sand 1.00 0 0% 100%very coarse sand 2.0 0 0% 100%very fine gravel 4.0 0 0% 100%
fine gravel 5.7 0 0% 100% 10%20%30%40%50%
Cumu
lative
Perce
nt (fin
er tha
n)
fine gravel 5.7 0 0% 100%fine gravel 8.0 0 0% 100%
medium gravel 11.3 0 0% 100%medium gravel 16.0 0 0% 100%Gravel
0%10%
Cumu
lative
Perce
nt (fin
er tha
n)
Particle Size (mm)medium gravel 16.0 0 0% 100%course gravel 22.3 0 0% 100%course gravel 32.0 0 0% 100%
very coarse gravel 45 0 0% 100%
Gravel Particle Size (mm)MY1 (10/2007) MY2 (5/2008) MY3 (1/2010) MY4-2/2011 MY5-8/2011
very coarse gravel 64 0 0% 100%small cobble 90 0 0% 100%
medium cobble 128 0 0% 100%large cobble 180 0 0% 100%
Cobble 100%
Individual Class Percentlarge cobble 180 0 0% 100%
very large cobble 256 0 0% 100%small boulder 362 0 0% 100%small boulder 512 0 0% 100%
Cobble
Boulder70%80%90%
100%
Indivi
dual
Class
Perce
ntsmall boulder 512 0 0% 100%medium boulder 1024 0 0% 100%
large boulder 2048 0 0% 100%Bedrock bedrock 40096 0 0% 100%
Boulder
TOTAL % of whole count30%40%50%60%
Indivi
dual
Class
Perce
nt
100 100% 100%
D50 0.03
TOTAL % of whole count
Summary Data 0%10%20%30%
Indivi
dual
Class
Perce
ntD50 0.03D84 0.05D95 0.1
Particle Size (mm)MY1 (10/2007) MY2 (5/2008) MY3 (1/2010) MY4-2/2011 MY5-8/2011
D50 was not calculated due to particle size.
Appendix D - Stream Survey DataDula Thoroughfare
Year 5 of 5

Dula Thoroughfare Stream and April 2012 Wetland Restoration Monitoring Year 5 of 5 EEP Project No. 65
APPENDIX E HYDROLOGIC DATA
Table 12 Verification of Bankfull Events Figure 6 Monthly Rainfall Data Figure 7a-c Precipitation and Water Level Plots Table 13 Wetland Hydrology Criteria Attainment

Appendix E. Hydrologic DataTable 12. Verification of Bankfull EventsDula Thoroughfare Stream and Wetland Restoration/EEP Project No. 65Monitoring Year 5 of 5
Date of Collection Date of Occurrence Method Photo # (if available)Crest Gauge
(Main Channel and Tributary)
Crest Gauge
(Main Channel and Tributary)
Crest Gauge
(Main Channel and Tributary)
Visual Observation(Main Channel and Tributary)
Crest Gauge
(Main Channel and Tributary)
Crest Gauge
(Main Channel and Tributary)
Crest Gauge
(Main Channel and Tributary)
Visual Observation
(Main Channel and Tributary)
Crest Gauge
(Main Channel and Tributary)
Visual Observation
(Main Channel and Tributary)
3/22/2012 Unknown N/A
3/22/2012 Unknown N/A
7/22/2011 Unknown N/A
N/AUnknown7/22/2011
4/19/2011 Unknown N/A
5/19/2011 Unknown N/A
12/2007 Unknown N/A
9/2007 Unknown N/A
6/2009 Unknown N/A
1/2011 Unknown N/A
Appendix E - Hydrologic DataDula Thoroughfare
Year 5 of 5
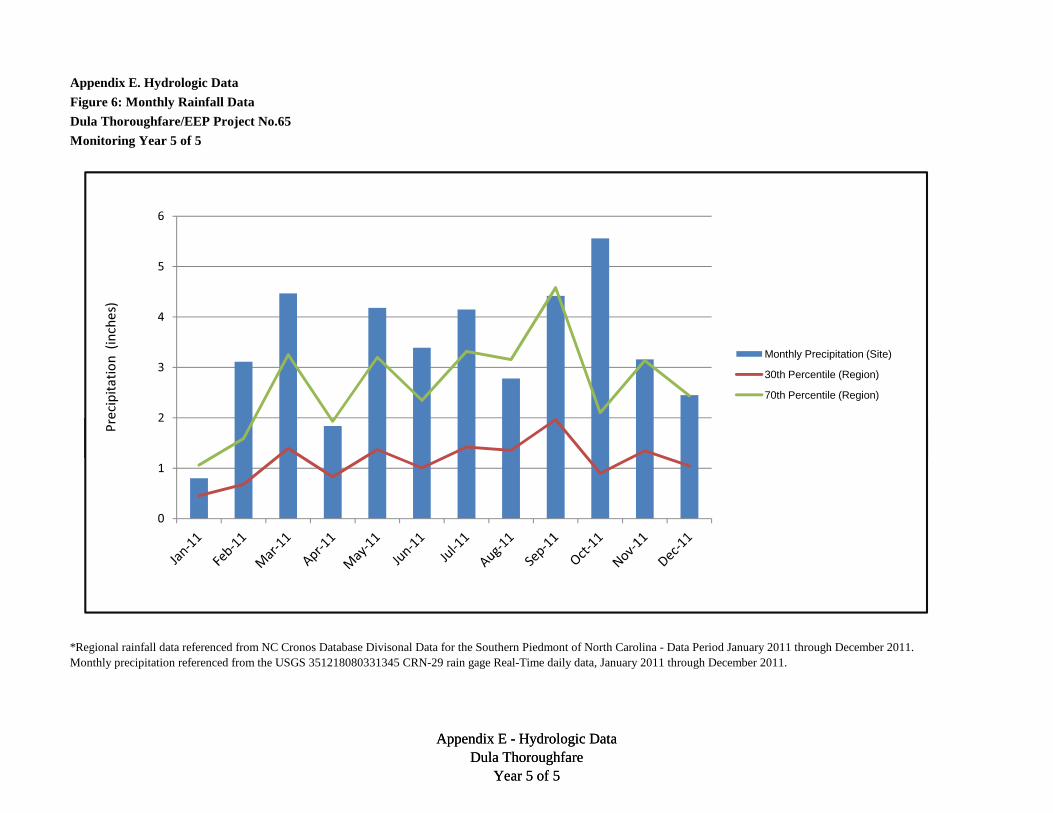
Appendix E. Hydrologic Data
Figure 6: Monthly Rainfall Data
Dula Thoroughfare/EEP Project No.65
Monitoring Year 5 of 5
2
3
4
5
6
Monthly Precipitation (Site)
30th Percentile (Region)
70th Percentile (Region)
Precip
itatio
n(in
ches)
Appendix E - Hydrologic DataDula Thoroughfare
Year 5 of 5
*Regional rainfall data referenced from NC Cronos Database Divisonal Data for the Southern Piedmont of North Carolina - Data Period January 2011 through December 2011. Monthly precipitation referenced from the USGS 351218080331345 CRN-29 rain gage Real-Time daily data, January 2011 through December 2011.
0
1
2Precip
itatio
n
Appendix E - Hydrologic DataDula Thoroughfare
Year 5 of 5

Figure 7a: Precipitation and Water Level Plots for GaugesDula Thoroughfare Stream and Wetland Restoration/EEP Project No. 65Monitoring Year 5 of 5
Growing Season: (March 15 - November 18)
0.8
1
1.2
1.4
1.6
1.8
2
-5
0
5
10
Precip
itatio
n Amo
unt (i
n)
Depth
to Gr
ound
water
(in)
Hydrology Monitoring - MY 5Groundwater Gauge 1
163 Consecutive Days
0
0.2
0.4
0.6
0.8
1
-20
-15
-10
-5
3/15
/201
1
3/29
/201
1
4/12
/201
1
4/26
/201
1
5/10
/201
1
5/24
/201
1
6/7/20
11
6/21
/201
1
7/5/20
11
7/19
/201
1
8/2/20
11
8/16
/201
1
8/30
/201
1
9/13
/201
1
9/27
/201
1
10/11/20
11
10/25/20
11
11/8/201
1
Precip
itatio
n Amo
unt (i
n)
Depth
to Gr
ound
water
(in)
Date
1m Daily Precipitation (in) Gauge Height Required Depth

Figure 7b: Precipitation and Water Level Plots for GaugesDula Thoroughfare Stream and Wetland Restoration/EEP Project No. 65Monitoring Year 5 of 5
Growing Season: (March 15 - November 18)
0.8
1
1.2
1.4
1.6
1.8
2
-20
-15
-10
-5
0
5
10
Precip
itatio
n Amo
unt (i
n)
Depth
to Gr
ound
water
(in)
Hydrology Monitoring - MY 5Groundwater Gauge 2
149 Consecutive Days
0
0.2
0.4
0.6
0.8
1
-40
-35
-30
-25
-20
-15
3/15
/201
1
3/29
/201
1
4/12
/201
1
4/26
/201
1
5/10
/201
1
5/24
/201
1
6/7/20
11
6/21
/201
1
7/5/20
11
7/19
/201
1
8/2/20
11
8/16
/201
1
8/30
/201
1
9/13
/201
1
9/27
/201
1
10/11/20
11
10/25/20
11
11/8/201
1
Precip
itatio
n Amo
unt (i
n)
Depth
to Gr
ound
water
(in)
Date
1m Daily Precipitation (in) Gauge Height Required Depth
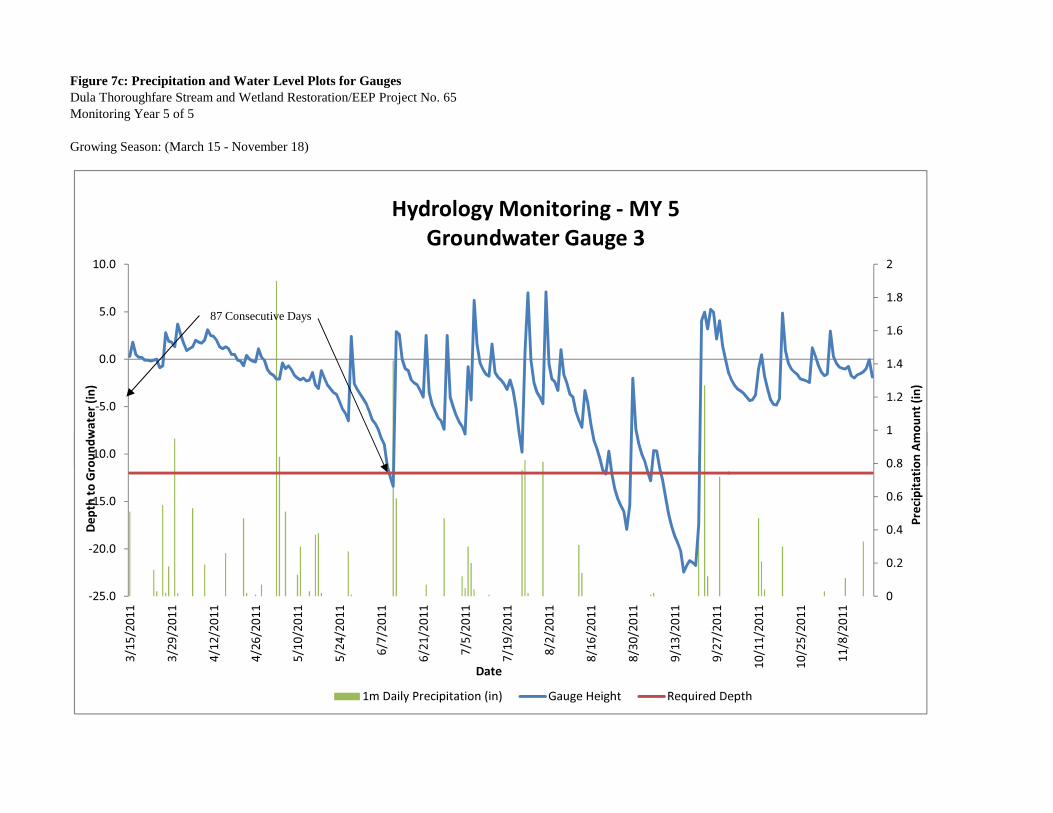
Figure 7c: Precipitation and Water Level Plots for GaugesDula Thoroughfare Stream and Wetland Restoration/EEP Project No. 65Monitoring Year 5 of 5
Growing Season: (March 15 - November 18)
0.8
1
1.2
1.4
1.6
1.8
2
-10.0
-5.0
0.0
5.0
10.0
Precip
itatio
n Amo
unt (i
n)
Depth
to Gr
ound
water
(in)
Hydrology Monitoring - MY 5Groundwater Gauge 3
87 Consecutive Days
0
0.2
0.4
0.6
0.8
1
-25.0
-20.0
-15.0
-10.0
3/15
/201
1
3/29
/201
1
4/12
/201
1
4/26
/201
1
5/10
/201
1
5/24
/201
1
6/7/20
11
6/21
/201
1
7/5/20
11
7/19
/201
1
8/2/20
11
8/16
/201
1
8/30
/201
1
9/13
/201
1
9/27
/201
1
10/11/20
11
10/25/20
11
11/8/201
1
Precip
itatio
n Amo
unt (i
n)
Depth
to Gr
ound
water
(in)
Date
1m Daily Precipitation (in) Gauge Height Required Depth
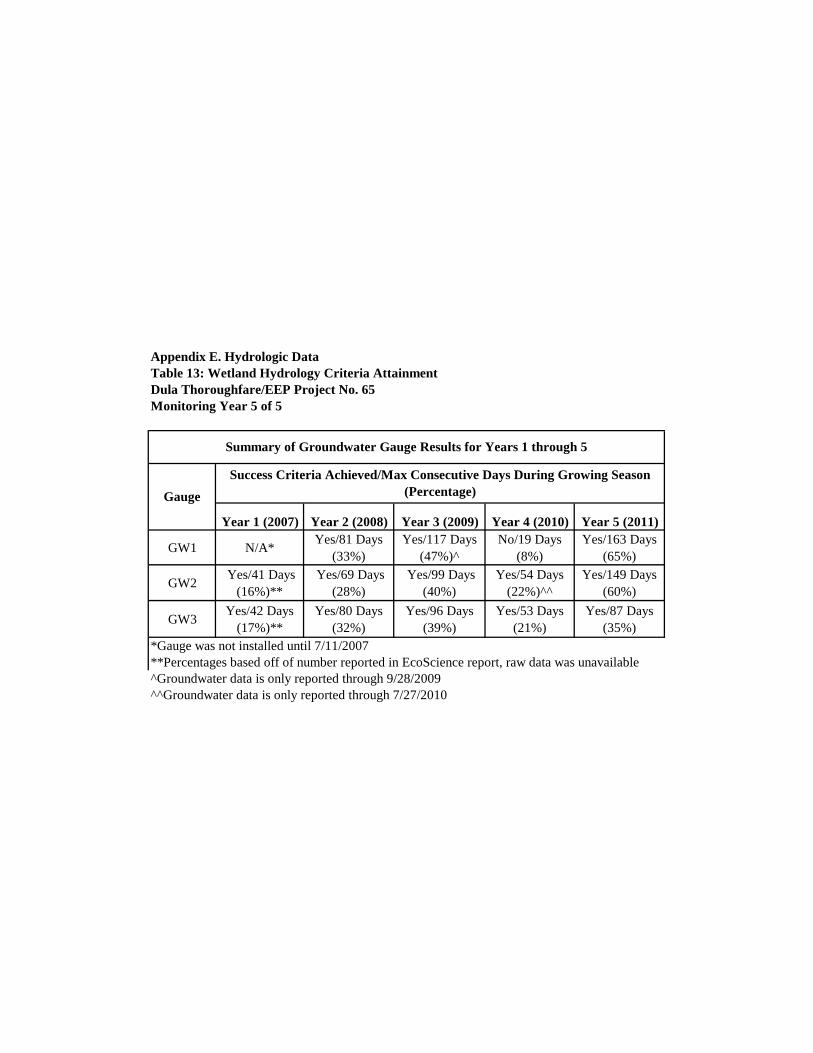
Appendix E. Hydrologic DataTable 13: Wetland Hydrology Criteria Attainment
Year 1 (2007) Year 2 (2008) Year 3 (2009) Year 4 (2010) Year 5 (2011)
GW1 N/A*Yes/81 Days
(33%)Yes/117 Days
(47%)^No/19 Days
(8%)Yes/163 Days
(65%)
GW2 Yes/41 Days
(16%)** Yes/69 Days
(28%) Yes/99 Days
(40%)Yes/54 Days
(22%)^^Yes/149 Days
(60%)
GW3Yes/42 Days
(17%)**Yes/80 Days
(32%)Yes/96 Days
(39%)Yes/53 Days
(21%)Yes/87 Days
(35%)*Gauge was not installed until 7/11/2007**Percentages based off of number reported in EcoScience report, raw data was unavailable^Groundwater data is only reported through 9/28/2009^^Groundwater data is only reported through 7/27/2010
Summary of Groundwater Gauge Results for Years 1 through 5
Gauge
Success Criteria Achieved/Max Consecutive Days During Growing Season (Percentage)
Dula Thoroughfare/EEP Project No. 65Monitoring Year 5 of 5