Embed Size (px)
Citation preview

Rebecca J. Dulin Senior Counsel
Duke Energy
1201 Main Street Capital Center Building
Suite 1180 Columbia, SC 29201
o: 803.988.7130 f: 803.988.7123
May 30, 2017 VIA ELECTRONIC FILING The Honorable Jocelyn G. Boyd Chief Clerk/Administrator Public Service Commission of South Carolina 101 Executive Center Drive, Suite 100 Columbia, South Carolina 29210
Re: Application Regarding the Acquisition of Progress Energy, Incorporated by Duke Energy Corporation and Merger of Progress Energy Carolinas, Incorporated and Duke Energy Carolinas, LLC
Docket No.: 2011-158-E Dear Mrs. Boyd: Pursuant to Regulatory Condition 5.7, enclosed for filing in the above referenced docket is the Annual Report of Affiliate Transactions for 2016 for Duke Energy Carolinas, LLC (“DEC”), Duke Energy Progress, LLC (“DEP”), and Piedmont Natural Gas, Inc. (“Piedmont”). This report excludes all activity associated with the joint dispatch agreement between DEC, DEP and Piedmont. If you have any questions, please do not hesitate to contact me.
Sincerely,
Rebecca J. Dulin
Enclosure cc: Parties of Record
f41) DUKE8 ENERGY,

Intr
This
Caro
Com
utility
agre
occu
not r
sche
supp
oper
servic
Nos.
Addi
inclu
Sub 9
These
of Co
oduction
combined
olinas, LLC (
mpany, Inc.
y. The Re
ement bet
urred for a
represent a
dules of Se
port service
rational func
ces include
E-2, Sub 109
Service C
Operatin
Inter-com
Operatin
itionally, ter
ded are se
998A and E-
Commod
Limited W
Nuclear S
e transactio
onduct.
2016 Ann
DEC), Duke
(Piedmont
eport exclu
ween DEC
accounting
an exchang
rvice Comp
es and con
ctions. Term
ed are set f
95A, E-7, Su
Company U
ng Compan
mpany Asse
ng Compan
rms of com
et forth in th
-7, Sub 986A
dity Transfer
Waiver of Co
Services Ag
ons are furth
ual Report
e Energy Pro
) summariz
udes all a
and DEP.
g purposes
ge of good
pany Charg
ntractor sup
ms of comp
orth in the
b 1100A an
tility Service
nies Service
et Transfer A
nies/Nonutili
pensation f
he following
A:
r Agreemen
ost-Based P
greement
her subject
t of Affiliat
ogress, LLC
zes the affil
activity asso
The report
only (Acco
s or service
ges to the A
pport to u
pensation fo
following se
nd G-9, Sub
e Agreemen
Agreement
greement
ty Compan
for transact
g service ag
nt
ricing Perta
to the cond
te Transac
C (DEP) and
iate transa
ociated w
t also ident
ounting Only
es. Service
Affiliates inc
utilities that
or transactio
ervice agre
682A:
nt
t
nies Service
tions involvi
greements f
aining to Rot
ditions of th
tions for D
d Piedmont
ctions relat
with the joi
tifies transac
y Transactio
s listed in t
lude financ
are labele
ons involving
eements file
Agreemen
ing goods a
filed in Doc
table Fleet
he North Ca
Duke Energ
Natural Ga
ted to eac
int dispatc
ctions whic
ons) and d
he summar
ce support,
ed as utilit
g goods an
ed in Docke
t
and service
cket Nos. E-2
Spares
arolina Cod
gy
as
ch
ch
ch
o
ry
IT
ty
d
et
es
2,
de
Duke Energy Carolinas, LLC, Docket No. E-7, Sub 1100A, Duke Energy Progress, LLC, Docket No. E-2, Sub 1095A and
Piedmont Natural Gas Company, Inc., Docket No.G-9, Sub 682A 2016 Annual Report of Affiliate Transactions
1 of 61
/%0 DUKEENERGY.

SummaryofSchedules
The following describes the schedules provided in the annual report.
Schedule 1 – Summary of Charges from Affiliates, excluding Accounting Only
Transactions
This schedule itemizes the total charges for goods and services from responsibility
centers of affiliates to operating units of DEC, DEP and Piedmont. This schedule
excludes Accounting Only Transactions. Comparison reports to the prior year filing
are included, as applicable.
Schedule 2 - Summary of Charges to Affiliates, excluding Accounting Only
Transactions
This schedule itemizes the total charges for goods and services from responsibility
centers of DEC, DEP and Piedmont to operating units of affiliates. This schedule
excludes Accounting Only Transactions. Comparison reports to the prior year filing
are included, as applicable.
Schedule 3 – Summary of Charges from Affiliates, Accounting Only Transactions
This schedule summarizes the total Accounting Only Transactions from responsibility
centers of affiliates to operating units of DEC, DEP and Piedmont. Accounting Only
Transactions consist of cash outlays made by DEBS on behalf of the utilities such as
the cost of benefits for utility employees. Comparison reports to the prior year filing
are included, as applicable.
Schedule 4 - Summary of Charges to Affiliates, Accounting Only Transactions
This schedule summarizes the total Accounting Only Transactions from responsibility
centers of DEC, DEP and Piedmont to operating units of affiliates. Comparison
reports to the prior year filing are included, as applicable.
Schedule 5 – Summary of DEBS Charges to Affiliates by Category and Service
This schedule shows the charges from Duke Energy Business Services (DEBS) to DEC,
DEP and Piedmont itemized by charge category and service type. “Direct”
charges were directly charged to affiliates, “Indirect” charges were assigned to
affiliates via an allocation process and “Accounting” indicates Accounting Only
Transactions. The service types listed are as allowed under the Service Company
Duke Energy Carolinas, LLC, Docket No. E-7, Sub 1100A, Duke Energy Progress, LLC, Docket No. E-2, Sub 1095A and
Piedmont Natural Gas Company, Inc., Docket No.G-9, Sub 682A 2016 Annual Report of Affiliate Transactions
2 of 61

Utility Service Agreement filed in Docket Nos. E-2, Sub 1095A, E-7, Sub 1100A and G-
9, Sub 682A.
Schedule 6 – Summary of DEBS Charges to Affiliates by Service and Primary FERC
Account
This schedule shows the direct and indirect (allocated) charges from DEBS to
affiliates itemized by service type and primary FERC account. This schedule
excludes Accounting Only Transactions. The service types listed are as allowed
under the Service Company Utility Service Agreement filed in Docket Nos. E-2, Sub
1095A, E-7, Sub 1100A and G-9, Sub 682A.
Schedule 7 – DEBS Allocations to Affiliates by Service and Allocation Pool
This schedule shows the allocated charges (indirect) from DEBS to DEC, DEP and
Piedmont itemized by service type and allocation method as allowed under the
Service Company Utility Service Agreement and allocation methods described in
Appendix A of the agreement filed in Docket Nos. E-2, Sub 1095A, E-7, Sub 1100A
and G-9, Sub 682A. This schedule excludes direct charges and Accounting Only
Transactions.
Schedule 8 – Joint Purchases Report
As required in Section III.D.5. of North Carolina Code of Conduct, this schedule
identifies all joint purchases entered into by DEC, DEP and one or more affiliated
companies and clearly identifies the each operating company’s portion.
Piedmont did not enter into any joint purchases during 2016.
Schedule 9 – Intercompany Asset Transfer Report
These schedules show the asset transfers between DEC, DEP and their utility
affiliates under the Intercompany Asset Transfer Agreement (IATA). The IATA
governs transfers of assets at “cost” between and among the regulated utilities.
Under the IATA, “assets” include parts inventory, capital spares, equipment and
other goods excluding fuel used in electric generation, electric power, emission
allowances and emission-reducing chemicals. “Cost” means: (i) average unit price
for items in inventory accounted for according to the FERC Uniform System of
Accounts in account 154 as recorded on the books of the transferor, plus stores,
freight, and handling and other applicable costs, or (ii) net book value for assets
other than inventory items.
Duke Energy Carolinas, LLC, Docket No. E-7, Sub 1100A, Duke Energy Progress, LLC, Docket No. E-2, Sub 1095A and
Piedmont Natural Gas Company, Inc., Docket No.G-9, Sub 682A 2016 Annual Report of Affiliate Transactions
3 of 61

Schedule 10 – Rotable Fleet Spares Report
This schedule is required per the Commission’s order dated, September 3, 2014, in
Docket Nos. E-2, Sub 998A and E-7, Sub 986A. It contains the mutually agreed
upon list of Rotable Fleet Spare (RFS) assets eligible for waiver of the cost-based
pricing provisions of the current IATA, with changes expressly identified, and a
detailed listing of (i) the types and quantities of RFS assets transferred with the
Transferor and the Recipient identified for each transfer, and (ii) the accounting
entries made to record such transfers.
Schedule 11 – Commodity Transfers Report
This schedule is required per the Commission’s order dated, February 10, 2015, in
Docket Nos. E-2, Sub 998A and E-7, Sub 986A. It contains the mutually agreed upon
list of commodities and related equipment and services subject to the Commodity
Transfer Agreement, with changes expressly identified, and a detailed listing of: (i)
the types and quantities of fuel, reagents and coal combustion byproducts that
may be transferred, the types and quantities of equipment that may be rented,
leased or otherwise placed under contract to provide transportation services and
the services to which the rights to performance and use may be transferred
pursuant to the Commodity Transfer Agreement; (ii) each asset and service
actually transferred (by type and quantity) during the year with the Transferor and
Recipient identified for each transaction; and (iii) the accounting entries made to
record such transactions.
Schedule 12 – Summary of DEBS Labor Charges to Affiliates by Category and
Service
This schedule is required per the Commission Order, dated March 29, 2016, in
Docket E-7 Sub 986D on Affiliated Transaction Audit Recommendations, No. 10,
Recommendation No. VI-R7 and shows the direct and indirect (allocated) labor
charges from DEBS to DEC, DEP and Piedmont itemized by charge category and
service type allowed under the Service Company Utility Service Agreement filed in
Docket Nos. E-2, Sub 1095A, E-7, Sub 1100A and G-9, Sub 682A.
Schedule 13 – ACP Transactions
This schedule is required per the Commission’s order, dated October 29, 2014, in
Docket Nos. E-2, Sub 1052 and E-7, Sub 1062, related to DEC’s and DEP’s
Duke Energy Carolinas, LLC, Docket No. E-7, Sub 1100A, Duke Energy Progress, LLC, Docket No. E-2, Sub 1095A and
Piedmont Natural Gas Company, Inc., Docket No.G-9, Sub 682A 2016 Annual Report of Affiliate Transactions
4 of 61

investments in the Atlantic Coast Pipeline, LLC (ACP). Schedule 13 of this annual
report includes DEC’s charges to ACP during the reporting year. In addition, during
2016, DEBS incurred $388,003 of internal costs directly charged to Duke Energy
Corporation’s equity investment in ACP to support monitoring and tracking of the
ACP project, including labor, labor loaders and Service Company overhead,
employee expenses and miscellaneous contract costs.
ListsofApprovedServices
Under Regulatory Condition No. 5.4, DEC, DEP and Piedmont are required to file
the list(s) of goods and services that DEC, DEP and Piedmont each intend to take
from DEBS, the list(s)of goods and services DEC, DEP and Piedmont intend to take
from each other and from the Utility Affiliates. The following is a list of functions
approved under the respective Service Agreements and Lists of Services. The
services taken may also include the procurement, purchase and billing of related
goods and services. The Operating Companies and Service Company Service
Agreement Lists are filed in Docket Nos. E-2, Sub 1095A, E-7, Sub 1100A and G-9,
Sub 682A.
1. Operating Companies Service Agreement List:
Outage services
Maintenance services
Fuels services
System optimization
Power generation operations and engineering
Electric transmission and distribution operations, engineering, and
construction
Environmental, Health and Safety (except for health and safety and
environmental programs and compliance and support systems remaining in
Duke Energy Business Services, LLC (DEBS).
Customer Operations/Customer Relations, including customer contact
centers, billing, payments processing, management of accounts receivable,
Duke Energy Carolinas, LLC, Docket No. E-7, Sub 1100A, Duke Energy Progress, LLC, Docket No. E-2, Sub 1095A and
Piedmont Natural Gas Company, Inc., Docket No.G-9, Sub 682A 2016 Annual Report of Affiliate Transactions
5 of 61

metering and customer analytics, large account management, and
customer communications (except for Grid Solutions)
Rates and Regulatory (except for Rate Design and Analysis, and state
support and research)
Wholesale power and renewable generation
Integrated resource planning and analytics (except for production cost
modeling and data management remaining in DEBS)
Water strategy and services
Office of the State President – NC and SC – governmental affairs,
community relations, economic development, external relations.
2. Operating Companies / Nonutility Companies Service Agreement List:
Generation engineering, operations, or maintenance assistance on an
exception basis.
Consulting for the purpose of implementing best practices, including
analytical technical support.
3. Service Company Utility Service Agreement List:
Information Systems - Development and support of mainframe and
distributed computer software applications; procurement and support of
personal computers and related network and software applications;
installation and operation of communication systems; and management
and support of information systems.
Meters - Procurement of meters.
Transportation - Procurement and maintenance of aircraft and
procurement and maintenance of vehicles and other power-operated
equipment.
Grid Solutions - Grid modernization services: planning, outreach, technology
and engineering planning and standards, project management and
governance, project execution.
Power Engineering and Construction - Services related to the following
functions: Enterprise Project Management; Center of Excellence; Project
Duke Energy Carolinas, LLC, Docket No. E-7, Sub 1100A, Duke Energy Progress, LLC, Docket No. E-2, Sub 1095A and
Piedmont Natural Gas Company, Inc., Docket No.G-9, Sub 682A 2016 Annual Report of Affiliate Transactions
6 of 61

Development and Initiation; Project Management and Construction
fossil/hydro retrofits; major project Engineering and Construction Services;
Commercial and International Project Management and Construction;
performance improvement/management.
Human Resources - Establishment and administration of policies, and
supervision of compliance with legal requirements, in the areas of
employment, compensation, benefits and employee health and safety;
payroll and employee benefits payment processing; supervision of contract
negotiations and relations with labor unions.
Supply Chain - Procurement of materials and contract services and related
strategy and support.
Facilities - Operation and maintenance of office and service buildings;
security and housekeeping for such buildings; procurement of office
furniture and equipment.
Accounting - Maintenance of financial books and records; preparation of
financial and statistical reports and tax filings; supervision regarding
compliance with related laws and regulations.
Power Planning and Operations - Production cost modeling and data
management;
Services related to the following functions:
Strategic Programs
Business Services Workforce Strategy
Engineering Services
Doc Con/Config Management
Technical Apps
NERC Compliance
Public Affairs - Preparation and dissemination of information to employees,
customers, government official, communities, and the media; provision of
associated communications materials.
Legal - Services related to labor and employment law, litigation, contracts,
rates and regulatory affairs, environmental matters, financing, financial
reporting, real estate and other legal matters.
Duke Energy Carolinas, LLC, Docket No. E-7, Sub 1100A, Duke Energy Progress, LLC, Docket No. E-2, Sub 1095A and
Piedmont Natural Gas Company, Inc., Docket No.G-9, Sub 682A 2016 Annual Report of Affiliate Transactions
7 of 61

Rate Design and Analysis - Services related to rate design and analysis, and
rates support.
Finance - Services associated with investments, financing, cash
management, risk management, budgeting, financial forecasting, and
economic analyses.
Rights of Way - Purchases, sales, management, surveying, and recording of
real estate interests.
Internal Auditing - Review of internal controls and procedures to ensure that
assets are safeguarded and that transactions are properly authorized and
recorded.
Environmental Health and Safety - Establishment of programs, policies and
procedures, and governance framework for environmental and health and
safety programs and compliance; provision of compliance support.
Investor Relations - Preparation of communications to investors and the
financial community; performance of transfer agent and shareholder
record keeping functions; administration of stock plans; regulatory reporting
related to stock.
Planning - Facilitation of strategic and operating plans preparation;
monitoring of trends; evaluation of business opportunities.
Executive - Provision of general, administrative, and executive management
oversight and direction;
Services related to the following functions:
Integration and Improvement
Sustainability
Emerging Technologies
Federal Policy and Government Affairs
Nuclear Development - Provision of design, engineering, project
management and licensing for new operating units.
Duke Energy Carolinas, LLC, Docket No. E-7, Sub 1100A, Duke Energy Progress, LLC, Docket No. E-2, Sub 1095A and
Piedmont Natural Gas Company, Inc., Docket No.G-9, Sub 682A 2016 Annual Report of Affiliate Transactions
8 of 61

In addition, the following Nuclear Services Agreement List is filed in Docket
Nos. E-2, Sub 998A and E-7, Sub 986A.
4. Nuclear Services Agreement List: Management and Finance - Nuclear executive management and financial
services/business operations oversight; provide financial strategy and
business/accounting support, track key performance indicators and
develop business plans.
Materials and Contracts Support - Central procurement engineering,
nuclear material acquisition, purchasing and contracts oversight and
support, supply chain and warehousing services.
Information Technology - IT support and oversight for plant business
applications.
Nuclear Operations - Operate and maintain nuclear stations which
includes, but is not limited to the following activities:
Operations
Maintenance
Work management
Chemistry
Radiation protection
Training
Organizational effectiveness
Engineering - Provides engineering functions to support the nuclear stations
which includes but is not limited to the following activities:
Plant engineering
Design engineering
Nuclear fuel related activities to support the stations
Corporate Governance and Operations Support - Provides governance
and operations support to the plants in the areas of:
Centers of Excellence
Regulatory Affairs
Security
Duke Energy Carolinas, LLC, Docket No. E-7, Sub 1100A, Duke Energy Progress, LLC, Docket No. E-2, Sub 1095A and
Piedmont Natural Gas Company, Inc., Docket No.G-9, Sub 682A 2016 Annual Report of Affiliate Transactions
9 of 61
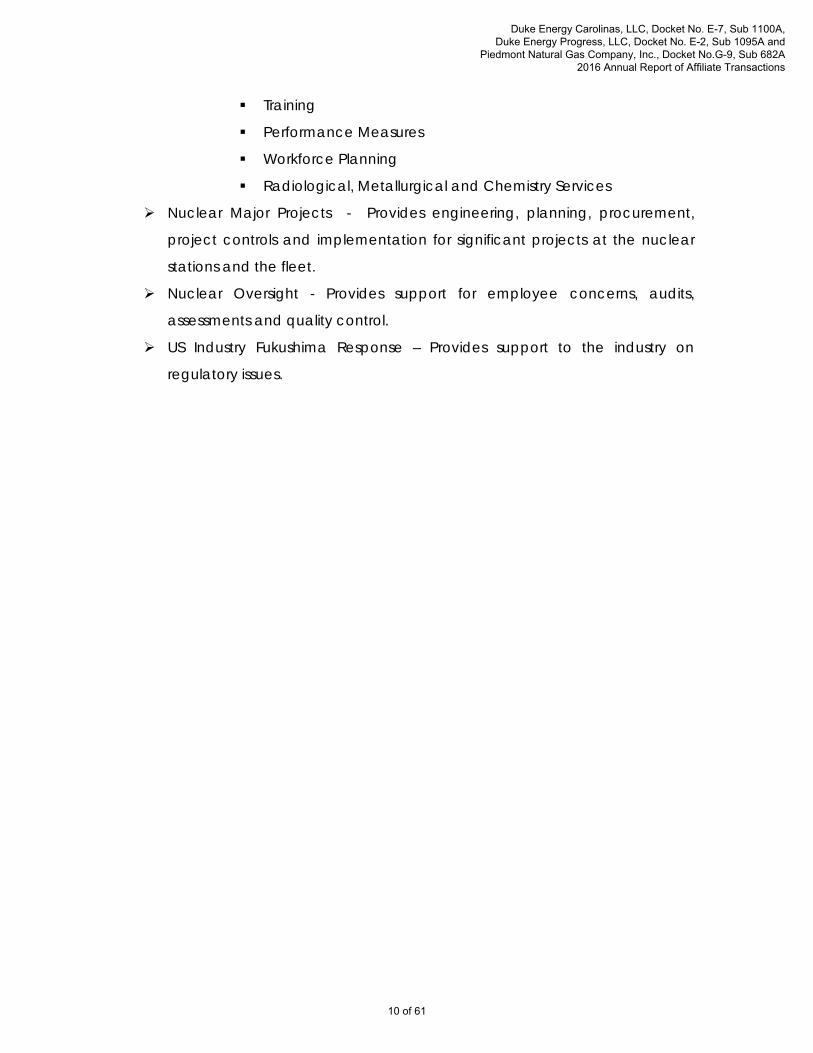
Training
Performance Measures
Workforce Planning
Radiological, Metallurgical and Chemistry Services
Nuclear Major Projects - Provides engineering, planning, procurement,
project controls and implementation for significant projects at the nuclear
stations and the fleet.
Nuclear Oversight - Provides support for employee concerns, audits,
assessments and quality control.
US Industry Fukushima Response – Provides support to the industry on
regulatory issues.
Duke Energy Carolinas, LLC, Docket No. E-7, Sub 1100A, Duke Energy Progress, LLC, Docket No. E-2, Sub 1095A and
Piedmont Natural Gas Company, Inc., Docket No.G-9, Sub 682A 2016 Annual Report of Affiliate Transactions
10 of 61

Schedule 1
Duke Energy Carolinas, Duke Energy Progress and Piedmont Natural Gas
Summary of Charges from Affiliates ‐ excluding Accounting Transactions
For the 12 Months Ended December 31, 2016
From DE Carolinas DE Progress
Piedmont Natural
Gas Total
DE Carolinas (non nuclear) ‐ 361,821,777.30$ (823.83)$ 361,820,953.47$
DE Carolinas (nuclear) ‐ 84,557,773.77 ‐ 84,557,773.77
DE Progress (non nuclear) 54,916,419.94$ ‐ 6,382.71 54,922,802.65
DE Progress (nuclear) 15,195,361.52 ‐ ‐ 15,195,361.52
DE Florida (non nuclear) 4,032,764.25 4,916,710.99 ‐ 8,949,475.24
DE Florida (nuclear) 26,411.95 2,041,547.20 ‐ 2,067,959.15
DE Indiana (non nuclear) 2,280,825.28 1,795,933.66 ‐ 4,076,758.94
DE Kentucky (non nuclear) 171,382.70 307,105.65 ‐ 478,488.35
DE Ohio Regulated (non nuclear) 588,532.32 1,285,736.25 ‐ 1,874,268.57
Piedmont Natural Gas (non nuclear) 1,728,139.59 19,186,299.34 ‐ 20,914,438.93
DEBS (Direct) 562,895,008.83 222,429,805.62 5,422,564.44 790,747,378.89
DEBS (Indirect) 380,614,774.65 239,741,520.61 1,673,908.05 622,030,203.31
Bison Insurance Company 6,640,893.93 ‐ ‐ 6,640,893.93
Duke En Commercial Enterprises 56,219.78 31,357.12 ‐ 87,576.90
Duke Energy International Tota 25.04 3,004.00 ‐ 3,029.04
Fleet 143,546.01 2,056,476.16 ‐ 2,200,022.17
Progress Other Non‐Utility ‐ 6,732.64 ‐ 6,732.64
Grand Total 1,029,290,305.79$ 940,181,780.31$ 7,102,031.37$ 1,976,574,117.47$
To
Duke Energy Carolinas, LLC , Docket No. E-7, Sub 1100A, Duke Energy Progress, LLC, Docket No. E-2, Sub 1095A and
Piedmont Natural Gas Company, Inc., Docket No.G-9, Sub 682A 2016 Annual Report of Affiliate Transactions
11 of 61
j00 DUKE8 ENERGY.

Schedule 1.1
Duke Energy Carolinas
Summary of Charges from Affiliates ‐ excluding Accounting Transactions
Year over Year
From 2016 Amount 2015 Amount Variance
DE Progress (non nuclear) 54,916,419.94$ 41,115,453.59$ 13,800,966.35$
DE Progress (nuclear) 15,195,361.52 16,826,013.12 (1,630,651.60)
DE Florida (non nuclear) 4,032,764.25 2,435,887.23 1,596,877.02
DE Florida (nuclear) 26,411.95 1,453,007.78 (1,426,595.83)
DE Indiana (non nuclear) 2,280,825.28 305,862.60 1,974,962.68
DE Kentucky (non nuclear) 171,382.70 66,294.65 105,088.05
DE Ohio Regulated (non nuclear) 588,532.32 402,022.62 186,509.70
Piedmont Natural Gas (non nuclear) 1,728,139.59 ‐ 1,728,139.59
DEBS (Direct) 562,895,008.83 482,461,256.16 80,433,752.67
DEBS (Indirect) 380,614,774.65 382,671,504.39 (2,056,729.74)
Bison Insurance Company 6,640,893.93 6,927,999.96 (287,106.03)
CE Comm Power Support Misc ‐ 13,676.91 (13,676.91)
CE Commercial Asset Mgmt ‐ 4,200.39 (4,200.39)
CE Duke Energy Retail Sales ‐ 106.58 (106.58)
CE Non Reg Generation ‐ 5,787.00 (5,787.00)
CP Ohio NonReg Gen ‐ 35,638.80 (35,638.80)
DE Renewables & Transmission ‐ 14,600.59 (14,600.59)
Duke En Commercial Enterprises 56,219.78 ‐ 56,219.78
Duke Energy International 25.04 837.40 (812.36)
Fleet 143,546.01 81,334.85 62,211.16
Progress Other Non‐Utility ‐ 79.78 (79.78)
Grand Total 1,029,290,305.79$ 934,821,564.40$ 94,468,741.39$
Duke Energy Carolinas, LLC , Docket No. E-7, Sub 1100A, Duke Energy Progress, LLC, Docket No. E-2, Sub 1095A and
Piedmont Natural Gas Company, Inc., Docket No.G-9, Sub 682A 2016 Annual Report of Affiliate Transactions
12 of 61
P ENERGY.DUKE

Schedule 1.2
Duke Energy Progress
Summary of Charges from Affiliates ‐ excluding Accounting Transactions
Year over Year
From 2016 Amount 2015 Amount Variance
DE Carolinas (non nuclear) 361,821,777.30$ 157,426,133.93$ 204,395,643.37$
DE Carolinas (nuclear) 84,557,773.77 93,320,597.06 (8,762,823.29)
DE Florida (non nuclear) 4,916,710.99 2,933,157.56 1,983,553.43
DE Florida (nuclear) 2,041,547.20 1,492,676.28 548,870.92
DE Indiana (non nuclear) 1,795,933.66 36,945.38 1,758,988.28
DE Kentucky (non nuclear) 307,105.65 31,505.81 275,599.84
DE Ohio Regulated (non nuclear) 1,285,736.25 49,659.06 1,236,077.19
Piedmont Natural Gas (non nuclear) 19,186,299.34 ‐ 19,186,299.34
DEBS (Direct) 222,429,805.62 206,361,278.88 16,068,526.74
DEBS (Indirect) 239,741,520.61 235,556,152.81 4,185,367.80
CE Comm Power Support Misc ‐ 9,827.18 (9,827.18)
CE Commercial Asset Mgmt ‐ 11.14 (11.14)
CP Ohio NonReg Gen ‐ 1,339.87 (1,339.87)
DE Renewables & Transmission ‐ (290,274.55) 290,274.55
Duke En Commercial Enterprises 31,357.12 ‐ 31,357.12
Duke Energy International Tota 3,004.00 ‐ 3,004.00
Fleet 2,056,476.16 1,679,273.59 377,202.57
Progress Other Non‐Utility 6,732.64 34,018.72 (27,286.08)
Grand Total 940,181,780.31$ 698,642,302.72$ 241,539,477.59$
Duke Energy Carolinas, LLC , Docket No. E-7, Sub 1100A, Duke Energy Progress, LLC, Docket No. E-2, Sub 1095A and
Piedmont Natural Gas Company, Inc., Docket No.G-9, Sub 682A 2016 Annual Report of Affiliate Transactions
13 of 61
F00 DUKE8 ENERGY.

Schedule 1.3
Piedmont Natural Gas
Summary of Charges from Affiliates ‐ excluding Accounting Transactions
Year over Year
From 2016 Amount 2015 Amount Variance
DE Carolinas (non nuclear) (823.83)$ ‐$ (823.83)$
DE Progress (non nuclear) 6,382.71 ‐ 6,382.71
DEBS (Direct) 5,422,564.44 ‐ 5,422,564.44
DEBS (Indirect) 1,673,908.05 ‐ 1,673,908.05
Grand Total 7,102,031.37$ ‐$ 7,102,031.37$
Duke Energy Carolinas, LLC , Docket No. E-7, Sub 1100A, Duke Energy Progress, LLC, Docket No. E-2, Sub 1095A and
Piedmont Natural Gas Company, Inc., Docket No.G-9, Sub 682A 2016 Annual Report of Affiliate Transactions
14 of 61
j5 DUKE8 ENERGY.

Schedule 2
Duke Energy Carolinas, Duke Energy Progress and Piedmont Natural Gas
Summary of Charges to Affiliates ‐ excluding Accounting Transactions
For the 12 Months Ended December 31, 2016
To DE Carolinas DE Progress
Piedmont Natural
Gas Total
DE Carolinas (non nuclear) ‐ 54,916,419.94$ 1,728,139.59$ 56,644,559.53$
DE Carolinas (nuclear) ‐ 15,195,361.52 ‐ 15,195,361.52
DE Progress (non nuclear) 361,821,777.30$ ‐ 19,186,299.34 381,008,076.64
DE Progress (nuclear) 84,557,773.77 ‐ ‐ 84,557,773.77
DE Florida (non nuclear) 47,284,684.79 10,859,438.39 6,772.14 58,150,895.32
DE Florida (nuclear) 62,512.57 59,081.15 ‐ 121,593.72
DE Indiana (non nuclear) 113,196,529.01 4,804,048.36 ‐ 118,000,577.37
DE Kentucky (non nuclear) 13,266,089.57 1,063,819.93 56,368.63 14,386,278.13
DE Ohio Regulated (non nuclear) 28,697,182.46 2,378,989.33 219,499.90 31,295,671.69
Piedmont Natural Gas (non nuclear) (823.83) 6,382.71 ‐ 5,558.88
Duke Energy Business Services 21,377,129.38 1,260,821.28 66,179.15 22,704,129.81
Bethel Price Solar, LLC 14.84 ‐ ‐ 14.84
Black Mountain Solar LLC 1,121.67 ‐ ‐ 1,121.67
Cimarron Windpower II LLC 3,157.99 ‐ ‐ 3,157.99
Cinergy Solutions‐Utility, Inc 526,406.45 10,324.83 ‐ 536,731.28
Claiborne Energy Services 157,660.41 ‐ ‐ 157,660.41
Colonial Eagle Solar, LLC 3,498.75 ‐ ‐ 3,498.75
Conetoe II Solar LLC 1,147.01 ‐ ‐ 1,147.01
Creswell Alligood Solar LLC 12.31 ‐ ‐ 12.31
DE Trnsmssn Hldng Cmpny (7,672.66) ‐ ‐ (7,672.66)
DEF Solar Solutions, LLC 24,039.09 30,450.21 ‐ 54,489.30
Dogwood Solar LLC 135.88 ‐ ‐ 135.88
Duke Energy ACP 1,069.84 ‐ ‐ 1,069.84
Duke Energy Beckjord LLC 2,435,591.09 ‐ ‐ 2,435,591.09
Duke Energy Corporation 98,972.83 ‐ ‐ 98,972.83
Duke Energy International 5.23 ‐ ‐ 5.23
Duke Energy North America, LLC 822.22 ‐ ‐ 822.22
Duke Energy One, Inc. 367,325.18 57,848.08 ‐ 425,173.26
Duke Energy Renewable Services 23,149.40 744.12 ‐ 23,893.52
Duke Energy Renewables, Inc. 514.65 ‐ ‐ 514.65
Duke Ventures Real Estate 95.77 ‐ ‐ 95.77
DukeEnergy Renewables Solar,LLC 10,324.50 ‐ ‐ 10,324.50
Everetts Wildcat Solar LLC 14.84 ‐ ‐ 14.84
Fresh Air Energy X LLC 57.31 ‐ ‐ 57.31
Gato Montes Solar LLC 1,121.80 ‐ ‐ 1,121.80
Happy Jack Windpower, LLC 4,212.33 ‐ ‐ 4,212.33
Highlander Solar 1 LLC 983.29 ‐ ‐ 983.29
Highlander Solar 2 LLC 921.74 ‐ ‐ 921.74
HXOap Solar One, LLC 23.81 ‐ ‐ 23.81
Ironwood Windpower, LLC 2,833.90 ‐ ‐ 2,833.90
Kit Carson Windpower,LLC 7,499.96 ‐ ‐ 7,499.96
Laurel Hill Wind Energy, LLC 6,567.64 ‐ ‐ 6,567.64
Los Vientos Windpower 1A, LLC 3,730.90 ‐ ‐ 3,730.90
Los Vientos Windpower 1B,LLC 3,096.67 ‐ ‐ 3,096.67
Los Vientos Windpower III LLC 282.73 ‐ ‐ 282.73
Los Vientos Windpower V LLC 2,437.70 ‐ ‐ 2,437.70
From
Duke Energy Carolinas, LLC , Docket No. E-7, Sub 1100A, Duke Energy Progress, LLC, Docket No. E-2, Sub 1095A and
Piedmont Natural Gas Company, Inc., Docket No.G-9, Sub 682A 2016 Annual Report of Affiliate Transactions
15 of 61
ENERGY.DUKE

Schedule 2
Duke Energy Carolinas, Duke Energy Progress and Piedmont Natural Gas
Summary of Charges to Affiliates ‐ excluding Accounting Transactions
For the 12 Months Ended December 31, 2016
To DE Carolinas DE Progress
Piedmont Natural
Gas Total
From
Mesquite Creek Wind LLC 2,001.50 ‐ ‐ 2,001.50
North Allegheny Wind, LLC 6,165.31 ‐ ‐ 6,165.31
Notrees Windpower, LP 2,207.46 ‐ ‐ 2,207.46
PanEnergy Corp 455.42 ‐ ‐ 455.42
Piedmont ACP, LLC ‐ ‐ 6,772.86 6,772.86
Piedmont Constitution Pipe Co ‐ ‐ 2,536.31 2,536.31
Piedmont Energy Company ‐ ‐ 505,407.45 505,407.45
Piedmont Energy Partners Inc ‐ ‐ 6,798.55 6,798.55
Piedmont Hardy Storage Company ‐ ‐ 2,733.29 2,733.29
Piedmont Interstate Pipe Co ‐ ‐ 2,733.29 2,733.29
Piedmont Intrastate Pipe Co ‐ ‐ 2,733.29 2,733.29
Pioneer Transmission, LLC 82,646.20 ‐ ‐ 82,646.20
Shirley Wind LLC 2,801.02 ‐ ‐ 2,801.02
Silver Sage Windpower, LLC 4,209.37 ‐ ‐ 4,209.37
SoINCPower5, LLC 609.82 ‐ ‐ 609.82
SoINCPower6 LLC 12.31 ‐ ‐ 12.31
Top of the Wrld Wnd Enrgy, LLC 7,982.77 ‐ ‐ 7,982.77
Washington Airport Solar LLC 23.81 ‐ ‐ 23.81
Washington MIllfield Solar LLC 14.84 ‐ ‐ 14.84
Washington White Post SolarLLC 14.84 ‐ ‐ 14.84
Windsor Cooper Hill Solar, LLC 73.69 ‐ ‐ 73.69
674,053,250$ 90,643,730$ 21,792,974$ 786,489,954$
Duke Energy Carolinas, LLC , Docket No. E-7, Sub 1100A, Duke Energy Progress, LLC, Docket No. E-2, Sub 1095A and
Piedmont Natural Gas Company, Inc., Docket No.G-9, Sub 682A 2016 Annual Report of Affiliate Transactions
16 of 61
ENERGY.DUKE

Schedule 2.1
Duke Energy Carolinas
Summary of Charges to Affiliates ‐ excluding Accounting Transactions
Year over Year
To 2016 Amount 2015 Amount Variance
DE Progress (non nuclear) 361,821,777.30$ 157,426,133.93$ 204,395,643.37$
DE Progress (nuclear) 84,557,773.77 93,320,597.06 (8,762,823.29)
DE Florida (non nuclear) 47,284,684.79 28,612,205.77 18,672,479.02
DE Florida (nuclear) 62,512.57 1,686,007.39 (1,623,494.82)
DE Indiana (non nuclear) 113,196,529.01 54,432,228.21 58,764,300.80
DE Kentucky (non nuclear) 13,266,089.57 21,167,639.80 (7,901,550.23)
DE Ohio Regulated (non nuclear) 28,697,182.46 28,646,850.44 50,332.02
Piedmont Natural Gas (non nuclear) (823.83) ‐ (823.83)
Duke Energy Business Services 21,377,129.38 36,637,194.93 (15,260,065.55)
Bethel Price Solar, LLC 14.84 ‐ 14.84
Black Mountain Solar LLC 1,121.67 2,630.84 (1,509.17)
Cimarron Windpower II LLC 3,157.99 2,804.93 353.06
Cinergy Solutions‐Utility, Inc 526,406.45 53,355.97 473,050.48
Claiborne Energy Services 157,660.41 ‐ 157,660.41
Colonial Eagle Solar, LLC 3,498.75 1,789.42 1,709.33
Commercial Power Services ‐ 13,632.36 (13,632.36)
Conetoe II Solar LLC 1,147.01 1,354.09 (207.08)
Creswell Alligood Solar LLC 12.31 ‐ 12.31
DE Trnsmssn Hldng Cmpny (7,672.66) 7,449.25 (15,121.91)
DEF Solar Solutions, LLC 24,039.09 2,992.58 21,046.51
Dogwood Solar LLC 135.88 180.00 (44.12)
Duke Energy ACP 1,069.84 ‐ 1,069.84
Duke Energy Americas, LLC ‐ (2,069.64) 2,069.64
Duke Energy Beckjord LLC 2,435,591.09 7,598,784.32 (5,163,193.23)
Duke Energy CAM ‐ 125,908.19 (125,908.19)
Duke Energy Corporation 98,972.83 1,551.77 97,421.06
Duke Energy Hanging Rock II ‐ 213.64 (213.64)
Duke Energy International 5.23 ‐ 5.23
Duke Energy Miami Fort LLC ‐ 7,773.55 (7,773.55)
Duke Energy North America, LLC 822.22 ‐ 822.22
Duke Energy Ohio ‐ Com Power ‐ 1,168.83 (1,168.83)
Duke Energy One, Inc. 367,325.18 291,425.01 75,900.17
Duke Energy Renewable Services 23,149.40 29,222.61 (6,073.21)
Duke Energy Renewables, Inc. 514.65 ‐ 514.65
Duke Energy Renewables Solar,LLC 10,324.50 ‐ 10,324.50
Duke Energy Zimmer LLC ‐ 8,046.09 (8,046.09)
Duke Ventures Real Estate 95.77 2,826.00 (2,730.23)
Everetts Wildcat Solar LLC 14.84 ‐ 14.84
Fresh Air Energy X LLC 57.31 ‐ 57.31
Gato Montes Solar LLC 1,121.80 2,480.33 (1,358.53)
Happy Jack Windpower, LLC 4,212.33 1,951.04 2,261.29
Highlander Solar 1 LLC 983.29 2,782.49 (1,799.20)
Highlander Solar 2 LLC 921.74 2,503.99 (1,582.25)
HXOap Solar One, LLC 23.81 4,093.49 (4,069.68)
Ironwood Windpower, LLC 2,833.90 3,775.21 (941.31)
Kit Carson Windpower,LLC 7,499.96 10,073.37 (2,573.41)
Laurel Hill Wind Energy, LLC 6,567.64 10,863.08 (4,295.44)
Los Vientos Windpower 1A, LLC 3,730.90 5,756.13 (2,025.23)
Duke Energy Carolinas, LLC , Docket No. E-7, Sub 1100A, Duke Energy Progress, LLC, Docket No. E-2, Sub 1095A and
Piedmont Natural Gas Company, Inc., Docket No.G-9, Sub 682A 2016 Annual Report of Affiliate Transactions
17 of 61
1%0 DUKEENERGY.

Schedule 2.1
Duke Energy Carolinas
Summary of Charges to Affiliates ‐ excluding Accounting Transactions
Year over Year
To 2016 Amount 2015 Amount Variance
Los Vientos Windpower 1B,LLC 3,096.67 9,025.80 (5,929.13)
Los Vientos Windpower III LLC 282.73 4,284.48 (4,001.75)
Los Vientos Windpower V LLC 2,437.70 1,292.62 1,145.08
Mesquite Creek Wind LLC 2,001.50 ‐ 2,001.50
North Allegheny Wind, LLC 6,165.31 7,873.18 (1,707.87)
Notrees Windpower, LP 2,207.46 8,348.46 (6,141.00)
Ocotillo Windpower, LP ‐ 8,615.93 (8,615.93)
PanEnergy Corp 455.42 ‐ 455.42
Pioneer Transmission, LLC 82,646.20 24,603.10 58,043.10
RE Bagdad Solar 1, LLC ‐ 77.10 (77.10)
RP‐Orlando LLC ‐ 90.00 (90.00)
Shirley Wind LLC 2,801.02 4,285.81 (1,484.79)
Silver Sage Windpower, LLC 4,209.37 3,088.85 1,120.52
SoINCPower5, LLC 609.82 360.00 249.82
SoINCPower6 LLC 12.31 233.20 (220.89)
Three Buttes Windpower, LLC ‐ 1,526.07 (1,526.07)
Top of the Wrld Wnd Enrgy, LLC 7,982.77 7,972.59 10.18
TX Solar I LLC ‐ 411.00 (411.00)
Washington Airport Solar LLC 23.81 279.61 (255.80)
Washington MIllfield Solar LLC 14.84 279.61 (264.77)
Washington White Post SolarLLC 14.84 549.61 (534.77)
Windsor Cooper Hill Solar, LLC 73.69 ‐ 73.69
Grand Total 674,053,250.45$ 430,207,373.49$ 243,845,876.96$
Duke Energy Carolinas, LLC , Docket No. E-7, Sub 1100A, Duke Energy Progress, LLC, Docket No. E-2, Sub 1095A and
Piedmont Natural Gas Company, Inc., Docket No.G-9, Sub 682A 2016 Annual Report of Affiliate Transactions
18 of 61
1%0 DUKEENERGY.

Schedule 2.2
Duke Energy Progress
Summary of Charges to Affiliates ‐ excluding Accounting Transactions
Year over Year
To 2016 Amount 2015 Amount Variance
DE Carolinas (non nuclear) 54,916,419.94$ 41,115,453.59$ 13,800,966.35$
DE Carolinas (nuclear) 15,195,361.52 16,826,013.12 (1,630,651.60)
DE Florida (non nuclear) 10,859,438.39 9,459,361.50 1,400,076.89
DE Florida (nuclear) 59,081.15 275,781.12 (216,699.97)
DE Indiana (non nuclear) 4,804,048.36 4,355,750.51 448,297.85
DE Kentucky (non nuclear) 1,063,819.93 983,478.41 80,341.52
DE Ohio Regulated (non nuclear) 2,378,989.33 2,295,945.64 83,043.69
Piedmont Natural Gas (non nuclear) 6,382.71 ‐ 6,382.71
Duke Energy Business Services 1,260,821.28 5,550,114.91 (4,289,293.63)
Cinergy Solutions‐Utility, Inc 10,324.83 19,810.84 (9,486.01)
DEF Solar Solutions, LLC 30,450.21 ‐ 30,450.21
DE Trnsmssn Hldng Cmpny ‐ (335.25) 335.25
Duke Energy ACP ‐ 788.50 (788.50)
Duke Energy Beckjord LLC ‐ 3,177.64 (3,177.64)
Duke Energy CAM ‐ 3,641.21 (3,641.21)
Duke Energy Ohio ‐ Com Power ‐ (3,217.94) 3,217.94
Duke Energy One, Inc. 57,848.08 59,385.73 (1,537.65)
Duke Energy Renewable Services 744.12 ‐ 744.12
Kit Carson Windpower,LLC ‐ 47.51 (47.51)
Pioneer Transmission, LLC ‐ 3,226.79 (3,226.79)
Top of the Wrld Wnd Enrgy, LLC ‐ 70.17 (70.17)
Grand Total 90,643,729.85$ 80,948,494.00$ 9,695,235.85$
Duke Energy Carolinas, LLC , Docket No. E-7, Sub 1100A, Duke Energy Progress, LLC, Docket No. E-2, Sub 1095A and
Piedmont Natural Gas Company, Inc., Docket No.G-9, Sub 682A 2016 Annual Report of Affiliate Transactions
19 of 61
&0 DUKEENERGY.

Schedule 2.3
Piedmont Natural Gas
Summary of Charges to Affiliates ‐ excluding Accounting Transactions
Year over Year
To 2016 Amount 2015 Amount Variance
DE Carolinas (non nuclear) 1,728,139.59$ ‐$ 1,728,139.59$
DE Progress (non nuclear) 19,186,299.34 ‐ 19,186,299.34
DE Florida (non nuclear) 6,772.14 ‐ 6,772.14
DE Kentucky (non nuclear) 56,368.63 ‐ 56,368.63
DE Ohio Regulated (non nuclear) 219,499.90 ‐ 219,499.90
Duke Energy Business Services 66,179.15 ‐ 66,179.15
Piedmont ACP, LLC 6,772.86 ‐ 6,772.86
Piedmont Constitution Pipe Co 2,536.31 ‐ 2,536.31
Piedmont Energy Company 505,407.45 ‐ 505,407.45
Piedmont Energy Partners Inc 6,798.55 ‐ 6,798.55
Piedmont Hardy Storage Company 2,733.29 ‐ 2,733.29
Piedmont Interstate Pipe Co 2,733.29 ‐ 2,733.29
Piedmont Intrastate Pipe Co 2,733.29 ‐ 2,733.29
Grand Total 21,792,973.79$ ‐$ 21,792,973.79$
Duke Energy Carolinas, LLC , Docket No. E-7, Sub 1100A, Duke Energy Progress, LLC, Docket No. E-2, Sub 1095A and
Piedmont Natural Gas Company, Inc., Docket No.G-9, Sub 682A 2016 Annual Report of Affiliate Transactions
20 of 61
&0 DUKEENERGY.

Schedule 3
Duke Energy Carolinas, Duke Energy Progress and Piedmont Natural Gas
Summary of Charges from Affiliates ‐ Accounting Transactions
For the 12 Months Ended December 31, 2016
To
From DE Carolinas DE Progress
Piedmont Natural
Gas Total
DE Carolinas (non nuclear) ‐ 461,532.18$ ‐ 461,532.18$
DE Carolinas (nuclear) ‐ (6,083,825.17) ‐ (6,083,825.17)
DE Progress (non nuclear) 725,877.17$ ‐ ‐ 725,877.17
DE Progress (nuclear) 251,694.63 ‐ ‐ 251,694.63
DE Florida (non nuclear) 103,861.28 (780,289.46) ‐ (676,428.18)
DE Florida (nuclear) ‐ (1,990,976.61) ‐ (1,990,976.61)
DE Indiana (non nuclear) 126,922.32 (55,834.19) ‐ 71,088.13
DE Kentucky (non nuclear) 480.11 65.10 ‐ 545.21
DE Ohio Regulated (non nuclear) 1,019.86 (19,309.57) ‐ (18,289.71)
Piedmont Natural Gas (non nuclear) (107.00) ‐ ‐ (107.00)
DEBS (Accounting) 174,505,889.19 (3,461,771,009.96) 3,174,317.26$ (3,284,090,803.51)
Duke En Commercial Enterprises 24,995.80 3,944.12 ‐ 28,939.92
Grand Total 175,740,633.36$ (3,470,235,703.56)$ 3,174,317.26$ (3,291,320,752.94)$
Duke Energy Carolinas, LLC , Docket No. E-7, Sub 1100A, Duke Energy Progress, LLC, Docket No. E-2, Sub 1095A and
Piedmont Natural Gas Company, Inc., Docket No.G-9, Sub 682A 2016 Annual Report of Affiliate Transactions
21 of 61
&0 DUKEENERGY.

Schedule 3.1
Duke Energy Carolinas
Summary of Charges from Affiliates ‐ Accounting Transactions
Year over Year
From 2016 Amount 2015 Amount Variance
DE Progress (non nuclear) 725,877.17$ 589,440.64$ 136,436.53$
DE Progress (nuclear) 251,694.63 302,040.13 (50,345.50)
DE Florida (non nuclear) 103,861.28 60,644.30 43,216.98
DE Indiana (non nuclear) 126,922.32 230,765.22 (103,842.90)
DE Kentucky (non nuclear) 480.11 (7,978.13) 8,458.24
DE Ohio Regulated (non nuclear) 1,019.86 ‐ 1,019.86
Piedmont Natural Gas (non nuclear) (107.00) ‐ (107.00)
DEBS (Accounting) 174,505,889.19 199,529,404.64 (25,023,515.45)
CE Comm Power Support Misc ‐ (8,993.04) 8,993.04
CE Non Reg Generation ‐ (368.10) 368.10
CP Ohio NonReg Gen ‐ 60.00 (60.00)
DE Renewables & Transmission ‐ (14,032.76) 14,032.76
Duke En Commercial Enterprises 24,995.80 ‐ 24,995.80
Grand Total 175,740,633.36$ 200,680,982.90$ (24,940,349.54)$
Duke Energy Carolinas, LLC , Docket No. E-7, Sub 1100A, Duke Energy Progress, LLC, Docket No. E-2, Sub 1095A and
Piedmont Natural Gas Company, Inc., Docket No.G-9, Sub 682A 2016 Annual Report of Affiliate Transactions
22 of 61
&0 DUKEENERGY.

Schedule 3.2
Duke Energy Progress
Summary of Charges from Affiliates ‐ Accounting Transactions
Year over Year
From 2016 Amount 2015 Amount Variance
DE Carolinas (non nuclear) 461,532.18$ 53,777,652.67$ (53,316,120.49)$
DE Carolinas (nuclear) (6,083,825.17) 14,450,157.85 (20,533,983.02)
DE Florida (non nuclear) (780,289.46) 1,446,239.34 (2,226,528.80)
DE Florida (nuclear) (1,990,976.61) ‐ (1,990,976.61)
DE Indiana (non nuclear) (55,834.19) 54,842.17 (110,676.36)
DE Kentucky (non nuclear) 65.10 ‐ 65.10
DE Ohio Regulated (non nuclear) (19,309.57) (24,908.22) 5,598.65
DEBS (Accounting) (3,461,771,009.96) (2,539,019,156.67) (922,751,853.29)
CE Comm Power Support Misc ‐ (8,992.94) 8,992.94
Duke En Commercial Enterprises 3,944.12 ‐ 3,944.12
Progress Other Non‐Utility ‐ 185.00 (185.00)
Grand Total (3,470,235,703.56)$ (2,469,323,980.80)$ (1,000,911,722.76)$
Duke Energy Carolinas, LLC , Docket No. E-7, Sub 1100A, Duke Energy Progress, LLC, Docket No. E-2, Sub 1095A and
Piedmont Natural Gas Company, Inc., Docket No.G-9, Sub 682A 2016 Annual Report of Affiliate Transactions
23 of 61
P ENERGY.DUKE

Schedule 3.3
Piedmont Natural Gas
Summary of Charges from Affiliates ‐ Accounting Transactions
Year over Year
From 2016 Amount 2015 Amount Variance
DEBS (Accounting) 3,174,317.26$ ‐$ 3,174,317.26$
Grand Total 3,174,317.26$ ‐$ 3,174,317.26$
Duke Energy Carolinas, LLC , Docket No. E-7, Sub 1100A, Duke Energy Progress, LLC, Docket No. E-2, Sub 1095A and
Piedmont Natural Gas Company, Inc., Docket No.G-9, Sub 682A 2016 Annual Report of Affiliate Transactions
24 of 61
j0 DUKE8 ENERGY.

Schedule 4
Duke Energy Carolinas, Duke Energy Progress and Piedmont Natural Gas
Summary of Charges to Affiliates ‐ Accounting Transactions
For the 12 Months Ended December 31, 2016
From
To DE Carolinas DE Progress
Piedmont Natural
Gas Total
DE Carolinas (non nuclear) ‐ 725,877.17$ (107.00)$ 725,770.17$
DE Carolinas (nuclear) ‐ 251,694.63 ‐ 251,694.63
DE Progress (non nuclear) 461,532.18$ ‐ ‐ 461,532.18
DE Progress (nuclear) (6,083,825.17) ‐ ‐ (6,083,825.17)
DE Florida (non nuclear) (193,531.09) 172,806.82 ‐ (20,724.27)
DE Florida (nuclear) (23,697.22) 419,261.22 ‐ 395,564.00
DE Indiana (non nuclear) 5,189,825.87 (155,705.15) ‐ 5,034,120.72
DE Kentucky (non nuclear) (197,254.92) 48,398.76 3,793.84 (145,062.32)
DE Ohio Regulated (non nuclear) (59,581.36) (70,379.64) 15,175.37 (114,785.63)
Duke Energy Business Services 4,023,789.10 897,289.56 7,505.48 4,928,584.14
Cinergy Solutions‐Utility, Inc 241.83 ‐ ‐ 241.83
Claiborne Energy Services (602,021.00) ‐ ‐ (602,021.00)
DE Carolinas, LLC (SEC) (3,240,798.00) ‐ ‐ (3,240,798.00)
DE Commercial Enterprises Inc 97,492.83 ‐ ‐ 97,492.83
DE Trnsmssn Hldng Cmpny 437.30 ‐ ‐ 437.30
Duke Energy Beckjord LLC (676,655.79) ‐ ‐ (676,655.79)
Duke Energy Corporation 2,229,385.00 ‐ ‐ 2,229,385.00
Duke Energy North America, LLC (822.22) ‐ ‐ (822.22)
Duke Energy One, Inc. 2,189.81 ‐ ‐ 2,189.81
Duke Ventures Real Estate 6,703.75 ‐ ‐ 6,703.75
DukeNet Venture Co Inc (5,078.94) ‐ ‐ (5,078.94)
Intercompany Billings 7,734.75 ‐ ‐ 7,734.75
Piedmont ACP, LLC ‐ ‐ 134,317.55 134,317.55
Piedmont Constitution Pipe Co ‐ ‐ 40,208,436.47 40,208,436.47
Piedmont ENCNG Company, LLC ‐ ‐ (8,930,577.78) (8,930,577.78)
Piedmont Energy Company ‐ ‐ (487,282,376.15) (487,282,376.15)
Piedmont Energy Partners Inc ‐ ‐ (50,685,262.51) (50,685,262.51)
Piedmont Hardy Storage Company ‐ ‐ (6,987,027.50) (6,987,027.50)
Piedmont Interstate Pipe Co ‐ ‐ (61,509,917.75) (61,509,917.75)
Piedmont Intrastate Pipe Co ‐ ‐ (25,237,853.63) (25,237,853.63)
Piedmont Natural Gas PA ‐ ‐ 132,253,498.00 132,253,498.00
936,066.71$ 2,289,243.37$ (468,010,395.61)$ (464,785,085.53)$
Duke Energy Carolinas, LLC , Docket No. E-7, Sub 1100A, Duke Energy Progress, LLC, Docket No. E-2, Sub 1095A and
Piedmont Natural Gas Company, Inc., Docket No.G-9, Sub 682A 2016 Annual Report of Affiliate Transactions
25 of 61
P ENERGY.DUKE

Schedule 4.1
Duke Energy Carolinas
Summary of Charges to Affiliates ‐ Accounting Transactions
Year over Year
To 2016 Amount 2015 Amount Variance
DE Progress (non nuclear) 461,532.18$ 53,777,652.67$ (53,316,120.49)$
DE Progress (nuclear) (6,083,825.17) 14,450,157.85 (20,533,983.02)
DE Florida (non nuclear) (193,531.09) (11,928,081.63) 11,734,550.54
DE Florida (nuclear) (23,697.22) 2,037,459.25 (2,061,156.47)
DE Indiana (non nuclear) 5,189,825.87 9,931,587.70 (4,741,761.83)
DE Kentucky (non nuclear) (197,254.92) 2,178,609.61 (2,375,864.53)
DE Ohio Regulated (non nuclear) (59,581.36) 404,990.21 (464,571.57)
Duke Energy Business Services 4,023,789.10 4,123,539.23 (99,750.13)
Cinergy Solutions‐Utility, Inc 241.83 ‐ 241.83
Claiborne Energy Services (602,021.00) ‐ (602,021.00)
DE Carolinas, LLC (SEC) (3,240,798.00) ‐ (3,240,798.00)
DE Commercial Enterprises Inc 97,492.83 408,767.47 (311,274.64)
DE Trnsmssn Hldng Cmpny 437.30 (1,834.13) 2,271.43
Duke Energy Beckjord LLC (676,655.79) 551,685.29 (1,228,341.08)
Duke Energy CAM ‐ 6.08 (6.08)
Duke Energy Corporation 2,229,385.00 ‐ 2,229,385.00
Duke Energy International ‐ (3,009.06) 3,009.06
Duke Energy North America, LLC (822.22) ‐ (822.22)
Duke Energy Ohio ‐ Com Power ‐ (6.08) 6.08
Duke Energy One, Inc. 2,189.81 (194.10) 2,383.91
DukeNet Venture Co Inc (5,078.94) 5,078.94 (10,157.88)
Duke Ventures Real Estate 6,703.75 ‐ 6,703.75
Intercompany Billings 7,734.75 ‐ 7,734.75
Ocotillo Windpower, LP ‐ (180.96) 180.96
Pioneer Transmission, LLC ‐ 164.20 (164.20)
Grand Total 936,066.71$ 75,936,392.54$ (75,000,325.83)$
Duke Energy Carolinas, LLC , Docket No. E-7, Sub 1100A, Duke Energy Progress, LLC, Docket No. E-2, Sub 1095A and
Piedmont Natural Gas Company, Inc., Docket No.G-9, Sub 682A 2016 Annual Report of Affiliate Transactions
26 of 61
fg DUKEENERGY.

Schedule 4.2
Duke Energy Progress
Summary of Charges to Affiliates ‐ Accounting Transactions
Year over Year
To 2016 Amount 2015 Amount Variance
DE Carolinas (non nuclear) 725,877.17$ 589,440.64$ 136,436.53$
DE Carolinas (nuclear) 251,694.63 302,040.13 (50,345.50)
DE Florida (non nuclear) 172,806.82 (335,494.29) 508,301.11
DE Florida (nuclear) 419,261.22 (679,585.93) 1,098,847.15
DE Indiana (non nuclear) (155,705.15) (9,579.33) (146,125.82)
DE Kentucky (non nuclear) 48,398.76 (27.85) 48,426.61
DE Ohio Regulated (non nuclear) (70,379.64) 253.04 (70,632.68)
Duke Energy Business Services 897,289.56 76,950.08 820,339.48
DE Commercial Enterprises Inc ‐ 14,485.57 (14,485.57)
Duke Energy CAM ‐ 148.64 (148.64)
Duke Energy Ohio ‐ Com Power ‐ (148.64) 148.64
Pioneer Transmission, LLC ‐ (2,680.99) 2,680.99
Grand Total 2,289,243.37$ (44,198.93)$ 2,333,442.30$
Duke Energy Carolinas, LLC , Docket No. E-7, Sub 1100A, Duke Energy Progress, LLC, Docket No. E-2, Sub 1095A and
Piedmont Natural Gas Company, Inc., Docket No.G-9, Sub 682A 2016 Annual Report of Affiliate Transactions
27 of 61
DUKEENERGY.

Schedule 4.3
Piedmont Natural Gas
Summary of Charges to Affiliates ‐ Accounting Transactions
Year over Year
To 2016 Amount 2015 Amount Variance
DE Carolinas (non nuclear) (107.00)$ ‐$ (107.00)$
DE Kentucky (non nuclear) 3,793.84 ‐ 3,793.84
DE Ohio Regulated (non nuclear) 15,175.37 ‐ 15,175.37
Duke Energy Business Services 7,505.48 ‐ 7,505.48
Piedmont ACP, LLC 134,317.55 ‐ 134,317.55
Piedmont Constitution Pipe Co 40,208,436.47 ‐ 40,208,436.47
Piedmont ENCNG Company, LLC (8,930,577.78) ‐ (8,930,577.78)
Piedmont Energy Company (487,282,376.15) ‐ (487,282,376.15)
Piedmont Energy Partners Inc (50,685,262.51) ‐ (50,685,262.51)
Piedmont Hardy Storage Company (6,987,027.50) ‐ (6,987,027.50)
Piedmont Interstate Pipe Co (61,509,917.75) ‐ (61,509,917.75)
Piedmont Intrastate Pipe Co (25,237,853.63) ‐ (25,237,853.63)
Piedmont Natural Gas PA 132,253,498.00 ‐ 132,253,498.00
Grand Total (468,010,395.61)$ ‐$ (468,010,395.61)$
Duke Energy Carolinas, LLC , Docket No. E-7, Sub 1100A, Duke Energy Progress, LLC, Docket No. E-2, Sub 1095A and
Piedmont Natural Gas Company, Inc., Docket No.G-9, Sub 682A 2016 Annual Report of Affiliate Transactions
28 of 61
j&0 DUKEENERGY.

Schedule 5.1
DEBS Charges to Duke Energy Carolinas
Summary of Charges by Category and Service
For the 12 Months Ended December 31, 2016
Service Direct Indirect Accounting Total
Accounting $ 26,920,692.86 $ 90,832,748.81 $ 3,824,794.68 $ 121,578,236.35
Electric System Maintenance 2,095,738.35 6,513,259.41 ‐ 8,608,997.76
Electric Transmission & Distribution
Engineering & Construction 9,571,302.30 2,788,455.34 ‐ 12,359,757.64
Environmental, Health and Safety 25,013,893.73 9,006,688.54 ‐ 34,020,582.27
Executive 6,211,840.90 22,968,899.53 27,772,133.54 56,952,873.97
Facilities 43,416,118.53 14,735,140.31 ‐ 58,151,258.84
Facilities Rate of Return Allocation ‐ 907,430.16 ‐ 907,430.16
Finance 5,252,891.30 17,148,476.36 ‐ 22,401,367.66
Fuels 144,227.42 556,114.60 ‐ 700,342.02
Human Resources 8,067,231.63 17,288,323.16 142,908,960.97 168,264,515.76
Information Systems 123,502,340.45 92,472,525.25 ‐ 215,974,865.70
Interest ‐ 877,139.02 ‐ 877,139.02
Internal Auditing 2,691.45 3,105,923.33 ‐ 3,108,614.78
Investor Relations (15,020.00) 2,014,482.20 ‐ 1,999,462.20
Legal 12,985,774.67 12,092,336.33 ‐ 25,078,111.00
Marketing and Customer Relations 92,071,439.51 21,565,689.17 ‐ 113,637,128.68
Meters 68,190,452.49 20.64 ‐ 68,190,473.13
Nuclear Development 15,102,469.63 ‐ ‐ 15,102,469.63
Overhead Allocation (Gov) ‐ (2,727,533.82) ‐ (2,727,533.82)
Planning 19,092,173.65 28,704,005.19 ‐ 47,796,178.84
Power Engineering & Construction 8,921,064.35 19,513.34 ‐ 8,940,577.69
Power Planning and Operations 32,452,063.75 10,298,719.25 ‐ 42,750,783.00
Public Affairs 10,635,252.37 14,807,127.47 ‐ 25,442,379.84
Rates 826,131.13 44,947.14 ‐ 871,078.27
Rights of Way 953,748.17 203,204.98 ‐ 1,156,953.15
Supply Chain 44,788,828.73 9,699,773.97 ‐ 54,488,602.70
Transportation 6,691,661.46 4,691,364.97 ‐ 11,383,026.43
Grand Total 562,895,008.83$ 380,614,774.65$ 174,505,889.19$ 1,118,015,672.67$
Category of Charge
Duke Energy Carolinas, LLC , Docket No. E-7, Sub 1100A, Duke Energy Progress, LLC, Docket No. E-2, Sub 1095A and
Piedmont Natural Gas Company, Inc., Docket No.G-9, Sub 682A 2016 Annual Report of Affiliate Transactions
29 of 61
DUKEENERGY.

Schedule 5.2
DEBS Charges to Duke Energy Progress
Summary of Charges by Category and Service
For the 12 Months Ended December 31, 2016
Service Direct Indirect Accounting Total
Accounting $ 14,653,219.10 $ 57,221,698.43 ($ 3,522,147,203.63) ($ 3,450,272,286.10)
Electric System Maintenance 745,317.29 3,964,022.73 ‐ 4,709,340.02
Electric Transmission & Distribution
Engineering & Construction 2,132,710.19 1,624,052.75 ‐ 3,756,762.94
Environmental, Health and Safety 10,539,077.09 5,712,043.08 ‐ 16,251,120.17
Executive 55,018.39 14,553,743.20 20,403,714.74 35,012,476.33
Facilities 25,799,474.11 10,263,150.06 ‐ 36,062,624.17
Facilities Rate of Return Allocation ‐ 575,148.85 ‐ 575,148.85
Finance 3,143,867.22 10,865,180.80 ‐ 14,009,048.02
Fuels ‐ 471,639.12 ‐ 471,639.12
Human Resources 2,497,876.68 12,039,067.90 39,972,478.93 54,509,423.51
Information Systems 65,781,927.23 60,128,006.26 ‐ 125,909,933.49
Interest ‐ 402,083.28 ‐ 402,083.28
Internal Auditing 945.52 1,968,601.12 ‐ 1,969,546.64
Investor Relations (7,560.88) 1,276,686.84 ‐ 1,269,125.96
Legal 9,972,164.27 7,521,187.59 ‐ 17,493,351.86
Marketing and Customer Relations 22,169,784.57 8,719,023.76 ‐ 30,888,808.33
Meters 46,905.90 12.53 ‐ 46,918.43
Nuclear Development (5,446,349.88) ‐ ‐ (5,446,349.88)
Overhead Allocation (Gov) ‐ (1,722,059.86) ‐ (1,722,059.86)
Planning 11,773,831.75 18,162,945.35 ‐ 29,936,777.10
Power Engineering & Construction 14,380,139.38 12,049.96 ‐ 14,392,189.34
Power Planning and Operations 8,765,415.93 9,146,070.00 ‐ 17,911,485.93
Public Affairs 6,895,702.86 9,427,178.98 ‐ 16,322,881.84
Rates 693,073.11 30,630.97 ‐ 723,704.08
Rights of Way 282,452.54 113,952.22 ‐ 396,404.76
Supply Chain 26,375,652.78 4,291,916.28 ‐ 30,667,569.06
Transportation 1,179,160.47 2,973,488.41 ‐ 4,152,648.88
Grand Total 222,429,805.62$ 239,741,520.61$ (3,461,771,009.96)$ (2,999,599,683.73)$
Category of Charge
Duke Energy Carolinas, LLC , Docket No. E-7, Sub 1100A, Duke Energy Progress, LLC, Docket No. E-2, Sub 1095A and
Piedmont Natural Gas Company, Inc., Docket No.G-9, Sub 682A 2016 Annual Report of Affiliate Transactions
30 of 61
P ENERGY.DUKE

Schedule 5.3
DEBS Charges to Piedmont Natural Gas
Summary of Charges by Category and Service
For the 12 Months Ended December 31, 2016
Service Direct Indirect Accounting Total
Accounting $ 26,087.72 $ 895,652.23 $ 66.18 $ 921,806.13
Executive 5,380,070.99 727,332.60 352,892.71 6,460,296.30
Human Resources ‐ ‐ 2,821,358.37 2,821,358.37
Investor Relations ‐ 48,037.77 ‐ 48,037.77
Legal 6,405.73 ‐ ‐ 6,405.73
Overhead Allocation (Gov) ‐ 2,885.45 ‐ 2,885.45
Public Affairs 10,000.00 ‐ ‐ 10,000.00
Grand Total 5,422,564.44$ 1,673,908.05$ 3,174,317.26$ 10,270,789.75$
Category of Charge
Duke Energy Carolinas, LLC , Docket No. E-7, Sub 1100A, Duke Energy Progress, LLC, Docket No. E-2, Sub 1095A and
Piedmont Natural Gas Company, Inc., Docket No.G-9, Sub 682A 2016 Annual Report of Affiliate Transactions
31 of 61
j5 DUKE8 ENERGY.

Sched
ule 6.1
DEBS Charges to Duke Energy Carolinas
Includes Both Direct an
d Indirect Charges, Excludes Accounting Charges
Summary of Charges by Service and Primary FERC Account
For the 12 M
onths Ended
Decem
ber 31, 2016
SERVICE
107
108
120
163
181
182
186
500 SERIES
900 SERIES
408
419
426
428
430
431
ALL OTH
ER
TOTA
L
Accounting
$ 2,508,901.77 ‐ ‐ ‐ $ ‐ $ 117,337.70 $ 1,161.46 $ 2,571,000.02 $ 108,840,354.54
$ 3,713,686.13 $ (191.37) $ (39.05)
$ ‐ $ ‐ $ 1,015.06 $ 215.41 $ 117,753,441.67
Electric System
Maintenan
ce 199,690.67 $ (13,142.13)
‐ $ 6,044.00
‐ ‐ 130,091.92
898,567.49
7,229,137.99
158,688.07
‐ ‐ ‐
‐ ‐ (80.25) 8,608,997.76
Electric Tran
smission & Distribution Engineering &
Construction
3,800,813.09
181,516.15
‐ 112.51
‐ ‐ 336,468.33
3,772,128.46
3,886,464.73
331,495.26
‐ 33,374.01
‐
‐ ‐ 17,385.10 12,359,757.64
Environmental, Health and Safety
2,983,590.02
1,023,299.99
‐ 1,975.52
‐ ‐ 3,352,326.40
11,925,442.83
11,752,825.87
1,006,646.15
‐ 1,591,810.59
‐
‐ ‐ 382,664.90 34,020,582.27
Executive
269,868.35
‐ ‐ ‐ ‐ ‐ 96,603.51
929,897.50
24,484,529.25
206,102.17
‐ 3,029,371.28
‐
‐ 164,372.76 (4.39) 29,180,740.43
Facilities
24,837,615.77
1,499,799.76 ‐ 340.50
‐ ‐ 365,149.45
1,370,492.02
29,560,062.81
507,323.99
85.31 96,669.14
‐
‐ ‐ (86,279.91) 58,151,258.84
Facilities Rate of R
eturn Allo
cation
‐ ‐ ‐ ‐ ‐ ‐ ‐ ‐ 907,430.16
‐ ‐ ‐ ‐
‐ ‐ ‐ 907,430.16
Finan
ce 37,490.02
‐ ‐ 157.66
‐ ‐ 287,182.37
1,971,197.04
19,582,261.55
483,972.12
‐ 1,880.60
‐
‐ 37,226.30
‐ 22,401,367.66
Fuels
‐ ‐ ‐ ‐ ‐ ‐ ‐ 118,839.78
570,001.32
11,500.92
‐ ‐ ‐
‐ ‐ ‐ 700,342.02
Human
Resources
211,858.80
‐ ‐ ‐ ‐ 8,471.54 912,778.66 3,790,267.71
19,694,055.13
794,922.00
‐ 13,756.85
‐
‐ ‐ (70,555.90) 25,355,554.79
Inform
ation Systems
74,866,873.07
362,347.10
$ 3,180.28 10,231.01
‐ 57,361.95
6,939,777.26
29,502,136.30
99,792,948.58
4,215,630.94 1.50 219.49
‐
‐ ‐ 224,158.22 215,974,865.70
Interest
‐ ‐ ‐ ‐ ‐ ‐ ‐ ‐ ‐ 126.05 (389.26)
‐ ‐
‐ 877,402.23
‐ 877,139.02
Internal Auditing
‐ ‐ ‐ ‐ ‐ ‐ ‐ 654.11 2,962,378.90
145,581.77
‐ ‐ ‐
‐ ‐ ‐ 3,108,614.78
Investor Relations
‐ ‐ ‐ ‐ ‐ ‐ ‐ ‐ 1,962,174.02
37,288.18
‐ ‐ ‐
‐ ‐ ‐ 1,999,462.20
Legal
860,390.47
49,563.14
‐ ‐ ‐ 40,716.42
65,419.92 104,913.90
23,285,710.26
581,282.40
‐ 64,357.40
‐
‐ ‐ 25,757.09 25,078,111.00
Marketing an
d Customer Relations
14,242,278.89
1,136.51 ‐ 587,912.32
‐ 42,619,786.68
1,254,928.43
55,116,057.72
37,780,531.79
658,140.40
‐ 9,738.64
‐
‐ ‐ (38,633,382.70) 113,637,128.68
Meters
68,220,582.75 (81,427.13)
‐ ‐ ‐ ‐ 15,213.49 37,845.92 (1,216.92) 5.12
‐ ‐ ‐
‐ ‐ (530.10) 68,190,473.13
Nuclear Development
8,977,654.70
‐ ‐ ‐ ‐ ‐ 147.59 5,421,594.52
444,167.12
258,905.67
‐ ‐ ‐
‐ ‐ 0.03 15,102,469.63
Overhead
Allo
cation (G
ov)
‐ ‐ ‐ ‐ ‐ ‐ ‐ ‐ (2,727,533.82)
‐ ‐ ‐ ‐
‐ ‐ ‐ (2,727,533.82)
Planning
6,526,107.94
585.87 ‐ 917,989.56
‐ 160,727.13
263,223.64
9,461,910.03
29,724,599.25
722,587.15
‐ 14,832.50
‐
‐ ‐ 3,615.77 47,796,178.84
Power En
gineering & Construction
7,520,745.48
15,700.22
‐ ‐ ‐ ‐ 439,862.44
444,478.35
96,174.27
22,748.37
‐ ‐ ‐
‐ ‐ 400,868.56 8,940,577.69
Power Planning an
d Operations
5,930,224.88
693,649.17 ‐ 1,737,539.84
‐ 154,157.99
427,843.79
24,725,157.22
7,242,317.29
1,098,341.65
‐ 592,287.78
‐
‐ ‐ 149,263.39 42,750,783.00
Public Affairs
1,286,667.00
8,811.83 ‐ ‐ ‐ ‐ 43,373.60 3,051,816.85
16,393,212.31
567,657.92
‐ 4,019,650.52
‐
‐ ‐ 71,189.81 25,442,379.84
Rates
‐ ‐ ‐ ‐ ‐ ‐ ‐ 2,863.13 824,805.89
43,350.16
‐ ‐ ‐
‐ ‐ 59.09 871,078.27
Rights of W
ay 728,983.06
409.69 ‐ ‐ ‐ ‐ 177,678.60
27,275.87
204,338.35
11,771.95
‐ ‐ ‐
‐ ‐ 6,495.63 1,156,953.15
Supply Chain
1,302,314.85
716,269.50 ‐ 38,025,947.18
‐ ‐ 1,231,145.72
2,855,002.91
9,719,651.65
428,076.53
‐ 34,730.35
‐
‐ ‐ 175,464.01 54,488,602.70
Tran
sportation
$ 6,461,963.93 (631,186.88)
‐ ‐ ‐ ‐ 29,729.54 798,660.75
4,623,596.07
100,015.84
‐ ‐ ‐
‐ ‐ 247.18 11,383,026.43
Grand Total
$ 231,774,615.51
$ 3,827,332.79
$ 3,180.28
$ 41,288,250.10
$ ‐ $ 43,158,559.41
$ 16,370,106.12
$ 158,898,200.43
$ 458,834,978.36
$ 16,105,846.91
($ 493.82)
$ 9,502,640.10
$ ‐ $ ‐ $ 1,080,016.35
($ 37,333,449.06)
$ 943,509,783.48
Duke Energy Carolinas, LLC, Docket No. E-7, Sub 1100A, Duke Energy Progress, LLC, Docket No. E-2, Sub 1095A,
Piedmont Natural Gas Company, Inc., Docket No.G-9, Sub 682A
2016 Annual Report of Affiliate Transactions
32 of 61
0YfuDZOm
rp

Sched
ule 6.2
DEBS Charges to Duke Energy Progress
Includes Both Direct an
d Indirect Charges, Excludes Accounting Charges
Summary of Charges by Service and Primary FERC Account
For the 12 M
onths Ended
Decem
ber 31, 2016
SERVICE
107
108
120
163
181
182
186
500 SERIES
900 SERIES
408
419
426
428
430
431
ALL OTH
ER
TOTA
L
Accounting
$ 658,142.38
‐
$‐ $ 859.66
$‐ $ 224,956.49
$ 31,744.20
$ 465,742.02
$ 68,193,034.08
$ 2,299,202.78 $ (121.29) $ (24.73)
$‐ $‐ $ 643.37 $ 738.57 $ 71,874,917.53
Electric System M
aintenance
72,917.06 $ 2,667.23
‐ 19.91
‐ ‐ 97,371.65
515,894.64
3,922,114.74
98,354.79
‐
‐
‐
‐
‐
‐ 4,709,340.02
Electric Transm
ission & Distribution
Engineering & Construction
215,802.12
1,995.19
‐ 8,557.04
‐ ‐ 222,170.20
1,269,576.63
1,884,821.00
140,765.42
‐
‐
‐
‐
‐ 13,075.34
3,756,762.94
Environmental, Health and Safety
644,190.69
1,075,981.21
‐ 815.80
‐ ‐ 2,175,784.95
4,531,059.76
7,148,066.33
449,564.85
‐ 125,498.02
‐
‐
‐ 100,158.56
16,251,120.17
Executive
(5,868.39)
‐
‐ 0.25
‐ ‐ 16,957.59
39,986.29
14,185,661.74
125,317.94
‐ 142,542.33
‐
‐ 104,163.84
‐ 14,608,761.59
Facilities
15,985,714.49
238,821.47
‐ 2,216.36
‐ ‐ 406,174.01
448,484.67
20,233,484.75
379,294.29
14.44 47,209.74
‐
‐
‐ (1,678,790.05)
36,062,624.17
Facilities Rate of Return Allocation
‐
‐
‐ ‐
‐ ‐
‐
‐ 575,148.85
‐
‐
‐
‐
‐
‐
‐ 575,148.85
Finance
70,166.65 (239.32)
‐ 8,931.93
‐ 8,990.52
157,634.08
1,259,880.48
12,174,147.25
318,346.75
‐ 1,189.68
‐
‐ 10,000.00
‐ 14,009,048.02
Fuels
‐
‐
‐ ‐
‐ ‐
‐ 1,204.67
465,573.06
4,861.39
‐
‐
‐
‐
‐
‐ 471,639.12
Human
Resources
104,823.41
‐
‐ 15,433.42
‐ ‐ 648,345.75
1,310,064.85
12,418,682.58
465,244.65
‐ 9,579.91
‐
‐
‐ (435,229.99)
14,536,944.58
Inform
ation Systems
43,452,898.10
116,187.25
‐ 3,576,844.60
‐ 51,495.27
2,756,696.63
10,505,456.19
62,755,878.51
2,529,705.00
‐ 179.58
‐
‐
‐ 164,592.36
125,909,933.49
Interest
‐
‐
‐ ‐
‐ ‐
‐
‐
‐ 57.78 (178.44)
‐
‐
‐ 402,203.94
‐ 402,083.28
Internal Auditing
‐
‐
‐ ‐
‐ ‐
‐ 11.21 1,877,281.34
92,254.09
‐
‐
‐
‐
‐
‐ 1,969,546.64
Investor Relations
‐
‐
‐ 0.48
‐ ‐
‐ 1,589.81
1,243,808.51
23,727.16
‐
‐
‐
‐
‐
‐ 1,269,125.96
Legal
515,434.61
35,615.14
‐ ‐
‐ 18,222.89
284,098.31
32,996.69
16,045,226.09
388,614.08
‐ 2,871.08
‐
‐
‐ 170,272.97
17,493,351.86
Marketing and Customer Relations
5,867,112.41
‐
‐ 6,779.81
‐ 26,361,706.64
468,038.83
8,236,115.39
14,944,454.18
309,770.79
‐ 439.00
‐
‐
‐ (25,305,608.72)
30,888,808.33
Meters
303.16
‐
‐ ‐
‐ ‐ 3,402.27
38,593.73
3,404.52
1,214.75
‐
‐
‐
‐
‐
‐ 46,918.43
Nuclear Developmen
t ‐
‐
‐ ‐
‐ ‐
‐ (4,968,270.76) (396,578.59) (240,414.60)
‐
‐
‐
‐
‐ 158,914.07 (5,446,349.88)
Overhead
Allocation (Gov)
‐
‐
‐ ‐
‐ ‐
‐
‐ (1,722,059.86)
‐
‐
‐
‐
‐
‐
‐ (1,722,059.86)
Planning
3,762,735.47
1,911.83
‐ 1,255,054.78
‐ 155,861.84
213,397.69
5,659,616.83
18,430,186.44
452,226.97
‐ 5,638.93
‐
‐
‐ 146.32 29,936,777.10
Power En
gineering & Construction
14,182,966.56
254.58
‐ 85.52
‐ ‐ (260,625.96)
133,937.21
7,555.27
4,212.55
‐
‐
‐
‐
‐ 323,803.61
14,392,189.34
Power Planning and Operations
2,296,512.84
65,478.95
‐ 622,525.23
‐ 154,552.81
703,064.91
8,780,321.77
3,786,521.01
424,812.95
‐ 989,196.67
‐
‐
‐ 88,498.79
17,911,485.93
Public Affairs
1,797,796.72
133.07
‐ 1,037.27
‐ ‐ 217,303.91
1,710,958.68
10,250,519.58
343,767.69
‐ 1,971,458.73
‐
‐
‐ 29,906.19
16,322,881.84
Rates
‐
‐
‐ ‐
‐ ‐ 12,477.00
378.53 674,627.35
36,162.10
‐
‐
‐
‐
‐ 59.10 723,704.08
Rights of Way
218,372.03
746.64
‐ 15.12
‐ ‐ 33,108.42
21,146.97
115,908.54
7,107.04
‐
‐
‐
‐
‐
‐ 396,404.76
Supply Chain
938,616.44
506,117.26
‐ 23,509,091.91
‐ ‐ 430,982.71
1,377,239.05
3,684,344.84
196,083.94
‐ 17,059.45
‐
‐
‐ 8,033.46
30,667,569.06
Transportation
3,102,871.32
(4,373,274.97)
‐ 4,725.00
‐ ‐ 17,172.00
2,354,498.85
2,969,227.01
77,429.67
‐
‐
‐
‐
‐
‐ 4,152,648.88
Grand Total
$ 93,881,508.07
($ 2,327,604.47)
$‐ $ 29,012,994.09
$‐ $ 26,975,786.46
$ 8,635,299.15
$ 43,726,484.16
$ 275,871,039.12
$ 8,927,684.82
($ 285.29)$ 3,312,838.39
$‐ $‐
$ 517,011.15
($ 26,361,429.42)$ 462,171,326.23
Duke Energy Carolinas, LLC, Docket No. E-7, Sub 1100A, Duke Energy Progress, LLC, Docket No. E-2, Sub 1095A,
Piedmont Natural Gas Company, Inc., Docket No.G-9, Sub 682A
2016 Annual Report of Affiliate Transactions
33 of 61
055DZOm
rp

Sched
ule 6.3
DEBS Charges to Piedmont Natural G
as
Includes Both Direct and In
direct Charges, Excludes Accounting Charges
Summary of Charges by Service and Primary FER
C Account
For the 12 M
onths Ended
Decem
ber 31, 2016
SERVICE
107
108
120
163
181
182
186
500 SERIES
900 SERIES
408
419
426
428
430
431
ALL OTH
ER
TOTA
L
Accounting
$ ‐
$ ‐
$ ‐
$ ‐
$ ‐
$ ‐
$ ‐ $ 4.46 $ 911,826.42
$ 9,909.07
$ ‐
‐
$ ‐
$ ‐
‐
$ ‐ $ 921,739.95
Executive
‐
‐
‐
‐
‐
‐
‐
‐ 6,085,679.47
6,971.67
‐ $ 7,948.32
‐
‐ $ 6,804.13
‐
6,107,403.59
Investor Relations
‐
‐
‐
‐
‐
‐
‐
‐ 46,545.42
1,492.35
‐
‐
‐
‐
‐
‐ 48,037.77
Legal
‐
‐
‐
‐
‐
‐
‐
‐ 6,115.93
289.80
‐
‐
‐
‐
‐
‐ 6,405.73
Overhead
Allocation (Gov)
‐
‐
‐
‐
‐
‐
‐
‐ 2,885.45
‐
‐
‐
‐
‐
‐
‐ 2,885.45
Public Affairs
‐
‐
‐
‐
‐
‐
‐
‐
‐
‐
‐ 10,000.00
‐
‐
‐
‐ 10,000.00
Grand Total
$ ‐
$ ‐
$ ‐
$ ‐
$ ‐
$ ‐
$ ‐
$ 4.46
$ 7,053,052.69
$ 18,662.89
$ ‐
$ 17,948. 32
$ ‐
$ ‐
$ 6,804.13
$ ‐
$ 7,096,472.49
Duke Energy Carolinas, LLC, Docket No. E-7, Sub 1100A, Duke Energy Progress, LLC, Docket No. E-2, Sub 1095A,
Piedmont Natural Gas Company, Inc., Docket No.G-9, Sub 682A
2016 Annual Report of Affiliate Transactions
34 of 61
0YfuDZCI Lu
sp

Schedule 7
Duk
e En
ergy
Bus
ines
s Se
rvic
esAl
loca
tions
(Ind
irect
Cha
rges
) to
Duk
e En
ergy
Car
olin
as, D
uke
Ener
gy P
rogr
ess
and
Pied
mon
t Nat
ural
Gas
by
Serv
ice
and
Allo
catio
n Po
olFo
r the
12
Mon
ths
Ende
d D
ecem
ber 3
1, 2
016
SA#
Serv
ice
Serv
ice
Des
crip
tion
Allo
cati
on M
etho
dO
pera
ting
U
nit
OU
Des
crip
tion
Allo
cati
on P
ool
Allo
c P
ool
Des
crip
tion
St C
d D
uke
Ener
gy C
arol
inas
D
uke
Ener
gy
Prog
ress
P
iedm
ont N
atur
al
Gas
O
ther
Affil
iate
s To
tal
ENM
FM
ainf
ram
e Sv
cs
Ent
ENTC
PUM
FRM
ainf
ram
e Sv
cs E
ntS0
5
1,18
9.37
$
-
-$
565.
95$
1,
755.
32$
D
EMF
Mai
nfra
me
Svcs
En
t D
UK
DEN
TCPU
MFR
Mai
nfra
me
Svcs
Ent
D05
6,00
5,32
7.93
2,
941,
010.
06$
-
5,
227,
203.
16
14,1
73,5
41.1
5
ENW
SW
orks
ta S
vcs
Ente
rpris
eEN
TWKS
WKS
Wor
ksta
Svc
s En
terp
rise
S06
15,7
56.5
7
-
-
2,
579.
20
18,3
35.7
7
D
WSE
Wor
ksta
Svc
s En
terp
rise
DU
KD
ENTW
KSW
KSW
orks
ta S
vcs
Ente
rpris
e D
UK
D06
4,92
8,30
5.40
3,
436,
093.
37
-
2,
440,
955.
76
10,8
05,3
54.5
3
ENSS
Serv
er S
vcs
Ente
rpris
eEN
TSYS
SVR
Serv
er S
vcs
Ente
rpris
eS0
7
14,7
95.8
7
-
-
13
,600
.26
28
,396
.13
DES
SSe
rver
Svc
s En
terp
rise
DU
KD
ENTS
YSSV
RSe
rver
Svc
s En
terp
rise
DU
KD
07
7,93
6,47
1.80
4,
910,
096.
56
-
13
,064
,243
.63
25,9
10,8
11.9
9
UTS
SSe
rver
Svc
s U
tility
UTI
SYSS
VRSe
rver
Svc
s U
tility
S13
1,43
0,35
4.07
-
-
1,25
6,26
4.82
2,
686,
618.
89
EN
TSTe
leco
m S
vcs
Ente
rpris
eEN
TEM
PTEL
Tele
com
Svc
s En
terp
rise
S33
198,
809.
75
-
-
57,3
27.9
7
256,
137.
72
DET
STe
leco
m S
vcs
Ente
rpris
e D
UK
DEN
TEM
PTEL
Tele
com
Svc
s En
terp
rise
DU
KD
3321
,952
,094
.61
15,3
02,7
82.0
1
-
14
,531
,284
.64
51,7
86,1
61.2
6
DU
TSTe
leco
m S
vcs
Util
ityD
UTI
EMPT
ELTe
leco
m S
vcs
Util
ity
ND
D34
1,21
3,54
5.51
84
5,65
9.74
-
75
1,22
9.30
2,81
0,43
4.55
ENH
DH
elpd
esk
Serv
ices
ENTE
MPH
LPH
elpd
esk
Serv
ices
S33
1,36
4.20
-
-
393.
41
1,
757.
61
D
EHD
Hel
pdes
k Se
rvic
es D
UK
DEN
TEM
PHLP
Hel
pdes
k Se
rvic
es
DU
KD
331,
305,
505.
72
910,
067.
03
-
864,
188.
10
3,
079,
760.
85
EN
MA
ITS
Mgt
& A
pps
Svcs
Ent
ENT3
FFIT
MIT
S M
gt &
App
s Sv
cs
Ent
S35
2,12
6,69
9.05
-
-
347,
364.
54
2,
474,
063.
59
D
EMA
ITS
Mgt
& A
pps
Svcs
Ent
DE
DEN
T3FF
ITM
ITS
Mgt
& A
pps
Svcs
En
t D
ED
35
40,0
60,7
39.5
6
27
,930
,990
.61
-
19,8
41,8
20.8
5
87
,833
,551
.02
PR
MA
ITS
Mgt
& A
pps
Svcs
Ent
PE
PRE3
FFIT
MIT
S M
gt &
App
s Sv
cs
Ent
PEP3
5
-
18
9,81
8.33
-
90
,315
.09
28
0,13
3.42
U
TMA
ITS
Mgt
& A
pps
Util
ityU
TI3F
FITM
ITS
Mgt
& A
pps
Util
ityS3
628
,677
.75
-
-
3,66
6.79
32
,344
.54
DU
MA
ITS
Mgt
& A
pps
Svcs
Util
DE
DU
TI3F
FITM
ITS
Mgt
& A
pps
Svcs
U
til D
ED
36
5,25
2,88
8.09
3,
661,
488.
55
-
2,
592,
512.
92
11,5
06,8
89.5
6
Info
rmat
ion
Syst
ems
Tota
l92
,472
,525
.25
$
60,1
28,0
06.2
6$
-
$
61
,085
,516
.39
$
213,
686,
047.
90$
2.M
eter
s Pr
ocur
es, t
ests
and
mai
ntai
ns
met
ers.
Num
ber
of C
usto
mer
s Ra
tio
DEM
SM
eter
Svc
s U
tility
D
ED
UTI
CUSM
TRM
eter
Svc
s U
tility
DE
D14
20.6
4$
12.5
3$
-$
32.2
6$
65.4
3$
M
eter
s To
tal
20.6
4$
12.5
3$
-$
32.2
6$
65.4
3$
3.
Tran
spor
tati
on
Proc
ures
and
mai
ntai
ns
airc
raft
and
equ
ipm
ent.
Thre
e Fa
ctor
Fo
rmul
a
DG
AVTr
ansp
Avi
atio
n G
vrnc
eD
GO
V3FF
AVI
Tran
sp A
viat
ion
Gvr
nce
DG
1
4,69
1,36
4.97
$
2,
973,
488.
41$
-
$
4,
828,
799.
33$
12,4
93,6
52.7
1$
Tran
spor
tati
on T
otal
4,69
1,36
4.97
$
2,
973,
488.
41$
-
$
4,
828,
799.
33$
12,4
93,6
52.7
1$
4.U
TTR
ESS
Elec
Tra
n U
tility
UTI
CMIE
TRES
S El
ec T
ran
Util
ityS1
5
1,55
6,87
5.22
$
74
3,50
8.43
$
-
$
1,
538,
070.
02$
3,83
8,45
3.67
$
UM
TRES
S El
ec T
ran
Util
ity -
MW
UTI
CMIE
MW
ESS
Elec
Tra
n U
tility
-
MW
S96
-
-
-
3,29
9,52
3.84
3,
299,
523.
84
U
TDI
ESS
Elec
Dis
t U
tility
UTI
CMIE
DT
ESS
Elec
Dis
t U
tility
S16
4,95
6,38
4.19
3,
220,
514.
30
-
4,
447,
620.
03
12,6
24,5
18.5
2
UM
DI
ESS
Elec
Dis
t U
tility
MW
onl
yU
TMCM
IED
TES
S El
ec D
ist
Util
ity
MW
onl
yS5
7
-
-
-
790,
909.
72
79
0,90
9.72
El
ectr
ic S
yste
m M
aint
enan
ce T
otal
6,51
3,25
9.41
$
3,
964,
022.
73$
-
$
10
,076
,123
.61
$
20,5
53,4
05.7
5$
Serv
ices
rel
ated
to
tran
smis
sion
sys
tem
:Ci
rcui
t Mile
s of
Ele
ctric
Tr
ansm
Lin
es R
atio
Serv
ices
rel
ated
to
dist
ribut
ion
syst
em:
Circ
uit M
iles
of E
lect
ric
Dist
. Lin
es R
atio
Elec
tric
Sys
tem
Mai
nten
ance
-
Coor
dina
tes
mai
nten
ance
and
su
ppor
t of
ele
ctric
tra
nsm
issi
on
and
dist
ribut
ion
syst
ems.
Cha
rges
by
DEB
S
Info
rmat
ion
syst
ems
man
agem
ent
and
supp
ort
serv
ices
.
No. o
f Per
sona
l Com
pute
r W
orks
tatio
ns R
atio
1.In
form
atio
n Sy
stem
sD
evel
opm
ent
and
supp
ort
of
mai
nfra
me
com
pute
r so
ftw
are
appl
icat
ions
.
Num
ber
of C
entr
al
Proc
essin
g Un
it Se
cond
s Ra
tio/M
illio
ns o
f In
stru
ctio
ns p
er S
econ
d
Proc
urem
ent
and
supp
ort
of
pers
onal
com
pute
rs a
nd
rela
ted
netw
ork
and
soft
war
e ap
plic
atio
ns.
No. o
f Per
sona
l Com
pute
r W
orks
tatio
ns R
atio
Dev
elop
men
t an
d su
ppor
t of
di
strib
uted
com
pute
r so
ftw
are
appl
icat
ions
(e.
g., s
erve
rs).
Num
ber
of I
nfo
Syst
ems
Serv
ers
Ratio
Inst
alla
tion
and
oper
atio
n of
co
mm
unic
atio
ns s
yste
ms.
Num
ber
of E
mpl
oyee
s Ra
tio
Duke Energy Carolinas, LLC , Docket No. E-7, Sub 1100A, Duke Energy Progress, LLC, Docket No. E-2, Sub 1095A and
Piedmont Natural Gas Company, Inc., Docket No.G-9, Sub 682A 2016 Annual Report of Affiliate Transactions
35 of 61
0YPuDZOm
sp

Schedule 7
Duk
e En
ergy
Bus
ines
s Se
rvic
esAl
loca
tions
(Ind
irect
Cha
rges
) to
Duk
e En
ergy
Car
olin
as, D
uke
Ener
gy P
rogr
ess
and
Pied
mon
t Nat
ural
Gas
by
Serv
ice
and
Allo
catio
n Po
olFo
r the
12
Mon
ths
Ende
d D
ecem
ber 3
1, 2
016
SA#
Serv
ice
Serv
ice
Des
crip
tion
Allo
cati
on M
etho
dO
pera
ting
U
nit
OU
Des
crip
tion
Allo
cati
on P
ool
Allo
c P
ool
Des
crip
tion
St C
d D
uke
Ener
gy C
arol
inas
D
uke
Ener
gy
Prog
ress
P
iedm
ont N
atur
al
Gas
O
ther
Affil
iate
s To
tal
Cha
rges
by
DEB
S
5.
Des
ign
and
adm
inis
trat
ion
of
sale
s an
d de
man
d-si
de
man
agem
ent
prog
ram
s.
Num
ber
of C
usto
mer
s Ra
tioN
ETCu
stom
er
Stra
tegy
P&
SU
TISA
LNET
Cust
omer
Str
ateg
y P&
SS7
5
51,4
99.8
6$
-
-
$
34
,091
.04
$
85
,590
.90
$
STD
Stan
dard
Ser
vice
sU
TISA
LSTD
Stan
dard
Ser
vice
sS1
7
64,7
89.0
4
-
-
56
,358
.18
12
1,14
7.22
M
SST
Mkt
Sol
Srv
co
Duk
e St
anda
rdU
TMSA
LSTD
Mar
ket
Solu
tions
-
Lega
cy D
uke
S68
189,
339.
23
-
-
125,
335.
19
31
4,67
4.42
U
ESD
M&
CR S
ls&
Dm
nd
Util
MW
Elec
onl
yU
TMSA
LMCR
M&
CR S
ls&
Dm
nd U
til
MW
Elec
onl
yS6
6
-
-
-
770,
087.
43
77
0,08
7.43
D
TNT
M&
CR E
lec
Onl
y U
til D
ED
UTI
CUSM
CRM
&CR
Ele
c O
nly
Util
D
ED
75
5,97
8.58
3,
626.
50$
-
8,09
3.68
17
,698
.76
UTN
TM
&CR
Ele
ctric
U
tility
UTI
SAN
ETM
&CR
Ele
ctric
Util
ityS7
5
238,
258.
90
-
-
157,
717.
83
39
5,97
6.73
Cu
stom
er m
eter
rea
ding
, bi
lling
and
pay
men
t pr
oces
sing
.
Num
ber
of C
usto
mer
s Ra
tio
UTM
RM
&CR
Mtr
Rd
g&Pm
t Pr
oc U
tilU
TICU
SPM
TM
&CR
Mtr
Rdg
&Pm
t Pr
oc U
tilS3
7
4,58
5,03
4.61
-
-
3,98
8,33
1.08
8,
573,
365.
69
Cu
stom
er m
eter
rea
ding
, bi
lling
and
pay
men
t pr
oces
sing
.
Num
ber
of C
usto
mer
s Ra
tio
DU
MR
M&
CR C
usto
mer
s U
til N
DD
UTI
CUSP
MT
M&
CR C
usto
mer
s U
til
ND
D37
2,91
2,82
5.78
1,
768,
007.
90
-
4,
551,
586.
18
9,23
2,41
9.86
DU
MS
M&
CR C
usto
mer
s U
til N
DD
UTI
CUSP
AYM
&CR
Cus
tom
ers
Util
N
DD
37
976,
679.
31
59
2,42
6.76
-
1,
322,
191.
02
2,89
1,29
7.09
UM
MR
M&
CR
Mtr
Rdg&
PmtP
rc
Util
MW
only
UTM
CUSP
MT
Mar
ket
Sol
- Al
l U
tility
Sol
D95
-
-
-
22,7
30,0
12.9
4
22
,730
,012
.94
D
CTH
Mar
ketin
g an
d Cu
stom
er
Rela
tions
DG
OVC
USC
TACT
A G
over
nanc
e Cu
s D
ED
G5
1,05
3,39
3.25
63
9,38
1.41
-
1,
646,
032.
49
3,33
8,80
7.15
Cust
omer
ser
vice
s in
clud
ing
the
oper
atio
n of
cal
l cen
ter.
Num
ber
of C
usto
mer
s Ra
tio
UM
PDM
&CR
Util
MW
PD
UTM
CUSM
PDM
&CR
Util
MW
PD
S69
-
-
-
50,9
97.1
8
50,9
97.1
8
D
CIS
M&
CR C
ust
Info
Sy
s_U
tilD
UTI
CUSS
YSM
&CR
Cus
t In
fo
Sys_
Util
T05
827,
443.
82
50
2,23
6.35
-
1,
292,
965.
21
2,62
2,64
5.38
UW
PDM
&CR
PD
D
EO/D
EK E
/GU
TMCU
SWPD
M&
CR P
D D
EO/D
EK
E/G
S70
-
-
-
1,49
1,62
7.88
1,
491,
627.
88
Co
sts
asso
ciat
ed w
ith S
mar
t G
rid a
ctiv
ities
Num
ber
of C
usto
mer
s Ra
tioU
SGA
M&
CR S
mar
t G
rid
All E
/GU
TICU
SSG
M&
CR S
mar
t G
ridS7
6,S8
050
,144
.88
-
-
43,6
19.0
4
93,7
63.9
2
U
SGE
M&
CR S
mar
t G
rid
Elec
tric
Onl
yU
TECU
SSG
M&
CR S
mar
t G
rid -
El
ectr
icS7
7,S8
12,
018,
767.
68
-
-
1,
336,
343.
01
3,35
5,11
0.69
DSG
AM
&CR
Sm
art
Grid
D
UKE
E/G
DU
TICU
SSG
M&
CR S
mar
t G
rid
DU
KE E
/GD
89. D
903,
327,
164.
13
2,01
9,50
0.41
-
5,19
6,98
0.43
10
,543
,644
.97
D
SGE
M&
CR S
mar
t G
rid
DU
KE E
lec
Onl
yD
UTE
CUSS
GM
&CR
Sm
art
Grid
D
UKE
Ele
c O
nly
D93
, D94
3,04
5,07
0.09
1,
847,
156.
69
-
4,
122,
414.
09
9,01
4,64
0.87
GIP
AM
&CR
Grid
Str
at
& P
lan-
Duk
e E/
GD
UTI
CUSG
SM
&CR
Grid
St
rat&
Plan
Duk
e E/
GT0
1, T
021,
298,
915.
02
788,
406.
95
-
2,02
9,68
9.43
4,
117,
011.
40
G
IPE
M&
CR G
rid S
trat
&
Pla
n- E
lect
ricD
UTE
CUSG
SM
&CR
Grid
St
rat&
Plan
Ele
ctric
T03,
T04
920,
384.
99
55
8,28
0.79
-
1,
245,
985.
93
2,72
4,65
1.71
Mar
keti
ng a
nd C
usto
mer
Rel
atio
ns T
otal
21,5
65,6
89.1
7$
8,
719,
023.
76$
-
$
52
,200
,459
.26
$
82,4
85,1
72.1
9$
Mar
keti
ng a
nd C
usto
mer
R
elat
ions
- A
dvis
es t
he C
lient
Co
mpa
nies
in r
elat
ions
with
do
mes
tic u
tility
cus
tom
ers.
Duke Energy Carolinas, LLC , Docket No. E-7, Sub 1100A, Duke Energy Progress, LLC, Docket No. E-2, Sub 1095A and
Piedmont Natural Gas Company, Inc., Docket No.G-9, Sub 682A 2016 Annual Report of Affiliate Transactions
36 of 61
0YPuDZOm
sp

Schedule 7
Duk
e En
ergy
Bus
ines
s Se
rvic
esAl
loca
tions
(Ind
irect
Cha
rges
) to
Duk
e En
ergy
Car
olin
as, D
uke
Ener
gy P
rogr
ess
and
Pied
mon
t Nat
ural
Gas
by
Serv
ice
and
Allo
catio
n Po
olFo
r the
12
Mon
ths
Ende
d D
ecem
ber 3
1, 2
016
SA#
Serv
ice
Serv
ice
Des
crip
tion
Allo
cati
on M
etho
dO
pera
ting
U
nit
OU
Des
crip
tion
Allo
cati
on P
ool
Allo
c P
ool
Des
crip
tion
St C
d D
uke
Ener
gy C
arol
inas
D
uke
Ener
gy
Prog
ress
P
iedm
ont N
atur
al
Gas
O
ther
Affil
iate
s To
tal
Cha
rges
by
DEB
S
6.U
TET
Eng
& C
onst
r ET
U
tility
UTI
CON
ETR
Eng
& C
onst
r ET
U
tility
S18
649,
734.
23$
28
6,81
6.42
$
-
$
85
8,29
6.13
$
1,79
4,84
6.78
$
UEE
TEn
g &
Con
str
ET
Util
MW
onl
yU
TMCO
NET
REn
g &
Con
str
ET U
til
MW
onl
yS6
2
-
-
-
6,04
7,24
2.62
6,
047,
242.
62
U
TED
Eng
& C
onst
r ED
U
tility
UTI
CON
EDT
Eng
& C
onst
r ED
U
tility
S30
2,13
8,72
1.11
1,
337,
236.
33
-
2,
646,
923.
21
6,12
2,88
0.65
UEE
DEn
g &
Con
str
ED
Util
MW
onl
yU
TMCO
NED
TEn
g &
Con
str
ED U
til
MW
onl
yS6
1
-
-
-
12,8
67,1
15.2
7
12
,867
,115
.27
2,78
8,45
5.34
$
1,
624,
052.
75$
-
$
22
,419
,577
.23
$
26,8
32,0
85.3
2$
UTE
CEn
g &
Con
str
Pwr
Prod
Util
UTI
CON
PWR
Eng
& C
onst
r Pw
r Pr
od U
tilS2
5
19,5
13.3
4$
12,0
49.9
6$
-
$
37
,097
.37
$
68
,660
.67
$
UEE
CEn
g&Co
nstr
Pw
r Pr
od U
tl M
Won
lyU
TMCO
NPW
REn
g&Co
nstr
Pw
r Pr
od
Utl
MW
only
S63
-
-
-
34,5
69.3
4
34,5
69.3
4
P
ower
Eng
inee
ring
& C
onst
ruct
ion
Tota
l19
,513
.34
$
12
,049
.96
$
-$
71,6
66.7
1$
103,
230.
01$
DG
HR
HR
Svcs
Gvr
nce
DG
OVE
MPH
RSH
R Sv
cs G
vrnc
eD
G2
3,66
6,38
4.75
$
2,
553,
099.
37$
-
$
2,
875,
994.
33$
9,09
5,47
8.45
$
DH
REH
R Se
rvic
es
Ente
rpris
e D
ED
ENTE
MPH
RSH
R Se
rvic
es
Ente
rpris
e D
ED
04
13,6
21,9
38.4
1
9,
485,
968.
53
-
8,
756,
297.
13
31,8
64,2
04.0
7
Hum
an R
esou
rces
Tot
al17
,288
,323
.16
$
12,0
39,0
67.9
0$
-
$
11
,632
,291
.46
$
40,9
59,6
82.5
2$
9.Su
pply
Cha
inD
USC
Mat
ls M
gmt
Sply
Ch
n U
til D
ED
UTI
PRO
SPC
Mat
ls M
gmt
Sply
Chn
U
til D
ED
19
2,58
3,55
6.28
$
92
9,00
1.78
$
-
$
2,
107,
538.
37$
5,62
0,09
6.43
$
DES
CM
atls
Mgm
t Sp
ly
Chai
n En
t D
ED
ENTP
ROSP
CM
atls
Mgm
t Sp
ly
Chai
n En
t D
ED
08
7,11
6,21
7.69
3,
362,
914.
50
-
7,
679,
160.
92
18,1
58,2
93.1
1
UPP
DM
W E
LEC/
GAS
D
ELIV
RY
STO
RERO
OM
UTB
RCPS
MM
MW
ELE
C/G
AS
DEL
IVRY
ST
ORE
ROO
M
S72
-
-
-
5,06
7,86
5.99
5,
067,
865.
99
Su
pply
Cha
in T
otal
9,69
9,77
3.97
$
4,
291,
916.
28$
-
$
14
,854
,565
.28
$
28,8
46,2
55.5
3$
Elec
tric
Tra
nsm
issi
on &
Dis
trib
utio
n En
gine
erin
g &
C
onst
ruct
ion
Tota
l
Proc
urem
ent
of m
ater
ials
and
co
ntra
ct s
ervi
ces
and
vend
or
paym
ent
proc
essi
ng:
Proc
urem
ent S
pend
ing
Ratio
7.P
ower
Eng
inee
ring
&
Con
stru
ctio
n D
esig
ns, m
onito
rs a
nd
supp
orts
the
con
stru
ctio
n of
el
ectr
ic g
ener
atio
n fa
cilit
ies.
Pr
epar
es s
peci
ficat
ions
and
ad
min
iste
rs c
ontr
acts
for
co
nstr
uctio
n of
new
ele
ctric
ge
nera
ting
units
or
impr
ovem
ents
to
exis
ting
elec
tric
gen
erat
ing
units
. Pr
epar
es c
ost
and
sche
dule
es
timat
es a
nd v
isits
i
i
(Ele
ctric
Pr
oduc
tion
Plan
t’s)
Cons
truc
tion
- Ex
pend
iture
s Ra
tio
8.H
uman
Res
ourc
esEs
tabl
ishe
s an
d ad
min
iste
rs
polic
ies
and
supe
rvis
es
com
plia
nce
with
lega
l re
quire
men
ts in
the
are
as o
f em
ploy
men
t, c
ompe
nsat
ion,
be
nefit
s an
d em
ploy
ee h
ealth
an
d sa
fety
. Pr
oces
ses
payr
oll
and
empl
oyee
ben
efit
paym
ents
. Su
perv
ises
co
ntra
ct n
egot
iatio
ns a
nd
rela
tions
with
labo
r un
ions
.
Num
ber
of E
mpl
oyee
s Ra
tio
Tran
smis
sion
eng
inee
ring
and
cons
truc
tion:
(Ele
ctric
Tra
nsm
issio
n Pl
ant’s
) Co
nstr
uctio
n -
Expe
nditu
res
Ratio
Dis
trib
utio
n en
gine
erin
g an
d co
nstr
uctio
n:(E
lect
ric
Dist
ribut
ion
Plan
t’s)
Cons
truc
tion
- Ex
pend
iture
s Ra
tio
Elec
tric
Tra
nsm
issi
on &
D
istr
ibut
ion
Engi
neer
ing
&
Con
stru
ctio
n -
Des
igns
and
m
onito
rs c
onst
ruct
ion
of e
lect
ric
tran
smis
sion
and
dis
trib
utio
n lin
es a
nd s
ubst
atio
ns.
Prep
ares
co
st a
nd s
ched
ule
estim
ates
, vi
sits
con
stru
ctio
n si
tes
to
ensu
re t
hat
cons
truc
tion
activ
ities
coi
ncid
e w
ith p
lans
, an
d ad
min
iste
rs c
onst
ruct
ion
cont
ract
s.
Duke Energy Carolinas, LLC , Docket No. E-7, Sub 1100A, Duke Energy Progress, LLC, Docket No. E-2, Sub 1095A and
Piedmont Natural Gas Company, Inc., Docket No.G-9, Sub 682A 2016 Annual Report of Affiliate Transactions
37 of 61
0YPuDZOm
sp

Schedule 7
Duk
e En
ergy
Bus
ines
s Se
rvic
esAl
loca
tions
(Ind
irect
Cha
rges
) to
Duk
e En
ergy
Car
olin
as, D
uke
Ener
gy P
rogr
ess
and
Pied
mon
t Nat
ural
Gas
by
Serv
ice
and
Allo
catio
n Po
olFo
r the
12
Mon
ths
Ende
d D
ecem
ber 3
1, 2
016
SA#
Serv
ice
Serv
ice
Des
crip
tion
Allo
cati
on M
etho
dO
pera
ting
U
nit
OU
Des
crip
tion
Allo
cati
on P
ool
Allo
c P
ool
Des
crip
tion
St C
d D
uke
Ener
gy C
arol
inas
D
uke
Ener
gy
Prog
ress
P
iedm
ont N
atur
al
Gas
O
ther
Affil
iate
s To
tal
Cha
rges
by
DEB
S
Faci
litie
sG
ORE
RE F
acili
ty S
vcs
CLT
GO
CLTS
QFF
ACRE
Fac
ility
Svc
s CL
T G
OS2
7
(189
,134
.59)
$
(1
31,7
45.7
7)$
-$
(6,6
81.0
5)$
(327
,561
.41)
$
CN
RERE
Fac
Svc
s -
Cinc
inna
tiCI
NSQ
FFAC
RE F
ac S
vcs
- Ci
ncin
nati
S50
(196
,849
.56)
(137
,080
.03)
-
(1
,290
,240
.95)
(1,6
24,1
70.5
4)
PL
RERE
Fac
Svc
s -
Plai
nfie
ldPL
DSQ
FFAC
RE F
ac S
vcs
- Pl
ainf
ield
S51
3,05
2.36
2,
125.
66
-
64,5
08.3
3
69,6
86.3
5
M
WRE
RE F
acili
ty
Serv
ices
MW
U
tility
UTM
SQFF
ACRE
Fac
ility
Ser
vice
s M
W U
tility
S71
-
-
-
2,22
7,99
8.46
2,
227,
998.
46
D
ERE
RE F
acili
ty
Serv
ices
Ent
DE
DEN
T3FF
FAC
RE F
acili
ty S
ervi
ces
Ent
DE
D39
15,1
18,0
72.1
0
10
,529
,850
.20
-
4,69
7,48
8.71
30
,345
,411
.01
Fa
cilit
ies
Tota
l14
,735
,140
.31
$
10,2
63,1
50.0
6$
-
$
5,
693,
073.
50$
30,6
91,3
63.8
7$
Acc
ount
ing
DG
ACAc
coun
ting
Gvr
nce
DG
OV3
FFAC
TAc
coun
ting
Gvr
nce
DG
1
13,9
61,1
91.4
1$
8,
848,
904.
63$
-
14
,422
,159
.49
$
37,2
32,2
55.5
3$
DEA
CAc
coun
ting
Svcs
En
t D
ED
ENT3
FFAC
TAc
coun
ting
Svcs
Ent
D
ED
03
4,24
7,61
4.58
2,
690,
082.
37
-
4,
100,
803.
34
11,0
38,5
00.2
9
UTA
CAc
ctg
Svcs
Util
ityU
TI3F
FACT
Acct
g Sv
cs U
tility
S09
1,93
7,25
2.55
1,
225,
518.
75
-
1,
749,
128.
11
4,91
1,89
9.41
UM
ACAc
ctg
Svcs
Util
M
W F
E&G
onl
yU
TM3F
FACT
Acct
g Sv
cs U
til M
W
FE&
G o
nly
S53
-
-
-
1,31
0,78
9.66
1,
310,
789.
66
D
DEP
DEB
S D
epre
ciat
ion
DE
DEN
T3FF
DEP
SvcC
o D
epre
ciat
ion
Ente
rpris
e D
ED
49
30,7
05,8
13.3
0
19
,446
,483
.10
-
29,6
44,5
15.7
6
79
,796
,812
.16
D
GD
CG
over
nanc
e CT
A D
epre
ciat
ion
DE
DG
OV3
FDEP
PG
over
nanc
e CT
A D
epre
ciat
ion
DE
DG
4
6,30
0,41
2.79
3,
993,
337.
55
-
6,
484,
978.
78
16,7
78,7
29.1
2
DCT
GCT
A G
over
nanc
e D
ED
GO
V3FF
CTA
CTA
Gov
erna
nce
DE
DG
3
21,2
33,7
92.6
5
13
,458
,436
.08
-
21,8
55,8
36.1
8
56
,548
,064
.91
PN
YGPi
edm
ont
CTA
Gov
GO
V3FF
CTAP
Pied
mon
t CT
A G
ovD
G3
10,1
22,6
86.6
4
6,
414,
286.
58
60
0,21
3.84
$
10
,437
,230
.51
27,5
74,4
17.5
7
PNG
GPi
edm
ont
CTA
Gas
GO
V3FC
TAPG
Pied
mon
t CT
A G
ov -
G
as o
nly
DG
6
-
-
295,
438.
39
404,
905.
21
70
0,34
3.60
Gene
ratin
g U
nit M
W
Capa
bilit
y Ra
tio (
MD
C)
DPN
LD
uke
Prog
ress
CT
A N
ucle
arD
GO
V3FF
DPN
Duk
e Pr
ogre
ss C
TA
Nuc
lear
CG3
2,32
3,98
4.89
1,
144,
649.
37
-
-
3,46
8,63
4.26
Acc
ount
ing
Tota
l90
,832
,748
.81
$
57,2
21,6
98.4
3$
89
5,65
2.23
$
90
,410
,347
.04
$
239,
360,
446.
51$
DU
TPPw
r Pl
ng&
Ops
Tr
ans
Plng
Util
ND
DU
TIPK
LETR
Pwr
Plng
&O
ps T
rans
Pl
ng U
til N
DD
3216
8,04
0.21
$
102,
003.
86$
-$
176,
753.
51$
44
6,79
7.58
$
DU
DP
Pwr
Plng
&O
ps
Dis
t Pl
n g U
til N
DD
UTI
CMIE
DL
Pwr
Plng
&O
ps D
ist
Plng
Util
ND
D41
49,7
90.7
1
31,3
07.0
1
-
48
,431
.03
12
9,52
8.75
Tr
ansm
issi
on O
pera
tions
:W
eigh
ted
Aver
age
of t
he
Circ
Mile
s of
Ele
c Tr
ansm
U
TTO
Pwr
Plng
&O
ps
Tran
s O
ps U
tilU
TICM
IOTR
Pwr
Plng
&O
ps T
rans
O
ps U
tilS3
133
7,05
8.37
182,
070.
35
-
343,
355.
32
86
2,48
4.04
U
TDO
Pwr
Plng
& O
ps
Dis
t O
ps U
tilU
TICM
IOD
LPw
r Pl
ng &
Ops
Dis
t O
ps U
tilS2
214
,222
.80
8,
942.
90
-
13,8
34.3
0
37,0
00.0
0
REPO
Pwr
Plng
& O
ps
Pwr
Ops
Reg
REG
CAPP
OP
Pwr
Plng
& O
ps P
wr
Ops
Reg
S28
9,72
9,60
7.16
8,
821,
745.
88
-
16
,637
,112
.63
35,1
88,4
65.6
7
RMW
ORe
g Co
al/C
T -
Mid
wes
t (D
EBS)
REG
MCA
POP
Pwr
Plng
Ops
Reg
M
W o
nly
S99
-
-
-
781,
178.
93
78
1,17
8.93
P
ower
Pla
nnin
g an
d O
pera
tion
s To
tal
10,2
98,7
19.2
5$
9,
146,
070.
00$
-
$
18
,000
,665
.72
$
37,4
45,4
54.9
7$
Dis
trib
utio
n O
pera
tions
:W
eigh
ted
Avg
of t
he C
irc
Mile
s of
ED
Lin
es R
atio
an
d th
e El
ec P
eak
Load
Ra
tioPo
wer
Ope
ratio
ns –
pro
vide
s m
anag
emen
t an
d su
ppor
t se
rvic
es f
or D
uke
Ener
gy
Corp
orat
ion’
s el
ectr
ic
gene
ratio
n sy
stem
.
Gene
ratin
g U
nit M
W
Capa
bilit
y /M
DC
Ratio
Pow
er P
lann
ing
and
Ope
rati
ons
- Co
ordi
nate
s th
e pl
anni
ng, m
anag
emen
t an
d op
erat
ion
of D
uke
Ener
gy
Corp
orat
ion’
s el
ectr
ic p
ower
sy
stem
s.
The
activ
ities
of
the
func
tion
incl
ude:
Sys
tem
Pl
anni
ng -
pla
nnin
g of
add
ition
s an
d re
tirem
ents
to
Duk
e En
ergy
Co
rpor
atio
n’s
elec
tric
ge
nera
tion,
tra
nsm
issi
on a
nd
dist
ribut
ion
syst
ems.
Elec
Pea
k Lo
ad R
atio
Dis
trib
utio
n pl
anni
ng:
Wei
ghte
d Av
g of
the
Circ
M
iles
of E
D L
ines
Rat
io
and
the
Elec
Pea
k Lo
ad
Ratio
11.
Mai
ntai
ns t
he b
ooks
and
re
cord
s of
Duk
e En
ergy
Co
rpor
atio
n an
d its
aff
iliat
es,
prep
ares
fin
anci
al a
nd
stat
istic
al r
epor
ts, p
repa
res
tax
filin
gs a
nd s
uper
vise
s co
mpl
ianc
e w
ith t
he la
ws
and
regu
latio
ns.
Thre
e Fa
ctor
Fo
rmul
a
Tran
smis
sion
pla
nnin
g:12
.
10.
Ope
rate
s an
d m
aint
ains
off
ice
and
serv
ice
build
ings
. Pr
ovid
es s
ecur
ity a
nd
hous
ekee
ping
ser
vice
s fo
r su
ch b
uild
ings
and
pro
cure
s of
fice
furn
iture
and
eq
uipm
ent.
Squa
re F
oota
ge R
atio
Duke Energy Carolinas, LLC , Docket No. E-7, Sub 1100A, Duke Energy Progress, LLC, Docket No. E-2, Sub 1095A and
Piedmont Natural Gas Company, Inc., Docket No.G-9, Sub 682A 2016 Annual Report of Affiliate Transactions
38 of 61
0YPuDZOm
sp

Schedule 7
Duk
e En
ergy
Bus
ines
s Se
rvic
esAl
loca
tions
(Ind
irect
Cha
rges
) to
Duk
e En
ergy
Car
olin
as, D
uke
Ener
gy P
rogr
ess
and
Pied
mon
t Nat
ural
Gas
by
Serv
ice
and
Allo
catio
n Po
olFo
r the
12
Mon
ths
Ende
d D
ecem
ber 3
1, 2
016
SA#
Serv
ice
Serv
ice
Des
crip
tion
Allo
cati
on M
etho
dO
pera
ting
U
nit
OU
Des
crip
tion
Allo
cati
on P
ool
Allo
c P
ool
Des
crip
tion
St C
d D
uke
Ener
gy C
arol
inas
D
uke
Ener
gy
Prog
ress
P
iedm
ont N
atur
al
Gas
O
ther
Affil
iate
s To
tal
Cha
rges
by
DEB
S
DG
PAPu
b Af
frs
Gvr
nce
DG
OV3
FFPA
FPu
b Af
frs
Gvr
nce
DG
1
10,1
75,4
74.7
8$
6,
449,
435.
46$
-
$
10
,473
,579
.53
$
27,0
98,4
89.7
7$
DG
PPPu
blic
Pol
icy
Gvr
nce
DG
OV3
FFPP
OPu
blic
Pol
icy
Gvr
nce
DG
1
2,91
0,77
2.79
1,
844,
910.
51
-
2,
996,
045.
78
7,75
1,72
9.08
DEP
APu
blic
Aff
airs
Se
rvic
es E
nt D
ED
ENT3
FFPA
FPu
blic
Aff
airs
Ser
vice
s En
t D
ED
03
20,5
26.8
7
13,0
00.0
2
-
19
,818
.00
53
,344
.89
UTP
APu
blic
Aff
airs
Se
rvic
es U
tilit
UTI
CUSP
AFPu
blic
Aff
airs
Ser
vice
s U
tilit
S24
1,70
0,35
3.03
1,
119,
832.
99
-
1,
708,
051.
62
4,52
8,23
7.64
Pub
lic A
ffai
rs T
otal
14,8
07,1
27.4
7$
9,
427,
178.
98$
-
$
15
,197
,494
.93
$
39,4
31,8
01.3
8$
DLE
ELe
gal G
over
nanc
eD
GO
V3FF
LEG
Lega
l Gov
erna
nce
CG1
230,
718.
76$
-
-$
132,
048.
30$
36
2,76
7.06
$
EN
LELe
gal G
over
nanc
eG
OV3
FFLE
GLe
gal G
over
nanc
eD
G1
10,9
03,4
03.5
6
6,
910,
812.
63$
-
11
,222
,828
.05
29,0
37,0
44.2
4
PGLG
Lega
l Gov
erna
nce
PEPR
GV3
FFLE
GLe
gal G
over
nanc
e PE
PG1
-
4,
202.
42
-
2,97
2.61
7,
175.
03
U
TLE
Lega
l Ser
vice
s U
tility
UTI
3FFL
EGLe
gal S
ervi
ces
Util
ityS0
995
8,21
4.01
606,
172.
54
-
865,
164.
40
2,
429,
550.
95
Le
gal T
otal
12,0
92,3
36.3
3$
7,
521,
187.
59$
-
$
12
,223
,013
.36
$
31,8
36,5
37.2
8$
15.
Rat
esD
eter
min
es t
he C
lient
Co
mpa
nies
’ rev
enue
re
quire
men
ts a
nd r
ates
to
elec
tric
and
gas
req
uire
men
ts
cust
omer
s.
Adm
inis
ters
in
terc
onne
ctio
n an
d jo
int
owne
rshi
p ag
reem
ents
. Re
sear
ches
and
for
ecas
ts
cust
omer
s’ u
sage
.
Sale
s Ra
tioU
TRA
Rate
s U
tility
UTI
SALR
ATRa
tes
Util
ityS4
444
,947
.14
$
30
,630
.97
$
-$
66,1
66.5
0$
141,
744.
61$
Rat
es T
otal
44,9
47.1
4$
30,6
30.9
7$
-
$
66
,166
.50
$
14
1,74
4.61
$
Fi
nanc
eD
GFI
Fina
ncia
l Svc
s G
vrnc
eD
GO
V3FF
FIN
Fina
ncia
l Svc
s G
vrnc
eD
G1
12,3
85,2
32.8
3$
7,
850,
027.
74$
-
$
12
,748
,057
.82
$
32,9
83,3
18.3
9$
DEF
IFi
nanc
ial S
vcs
DE
DEN
T3FF
FIN
Fina
ncia
l Svc
s En
terp
rise
DE
D03
2,66
8,78
6.82
1,
690,
185.
78
-
2,
576,
550.
31
6,93
5,52
2.91
UTF
IFi
nanc
ial S
ervi
ces
Util
ityU
TI3F
FFIN
Fina
ncia
l Ser
vice
s U
tility
S09
2,09
4,45
6.71
1,
324,
967.
28
-
1,
891,
067.
48
5,31
0,49
1.47
UM
FIFi
nanc
ial S
vc U
til
MW
FEG
onl
yU
TM3F
FFIN
Fina
ncia
l Svc
Util
MW
FE
G o
nly
S53
-
-
-
530,
424.
77
53
0,42
4.77
Fi
nanc
e To
tal
17,1
48,4
76.3
6$
10
,865
,180
.80
$
-$
17,7
46,1
00.3
8$
45
,759
,757
.54
$
17
.R
ight
s of
Way
DU
RDRi
ght
of W
ay E
D
Sys
Util
ND
DU
TICM
IRW
DRi
ght
of W
ay E
D S
ys
Util
ND
D87
98,1
88.9
7$
63,8
00.3
6$
-
$
88
,110
.23
$
25
0,09
9.56
$
-
$
D
URW
Righ
t of
Way
ET
S ys
Util
ND
DU
TICM
IRO
WRi
ght
of W
ay E
T Sy
s U
til N
DD
4510
5,01
6.01
50,1
51.8
6
-
10
3,74
7.58
258,
915.
45
Rig
hts
of W
ay T
otal
203,
204.
98$
11
3,95
2.22
$
-
$
19
1,85
7.81
$
509,
015.
01$
DG
IAIn
tern
al A
udit
Gvr
nce
DG
OV3
FFIA
UIn
tern
al A
udit
Gvr
nce
DG
1
3,10
5,92
3.33
$
1,
968,
601.
12$
-
$
3,
196,
910.
94$
8,27
1,43
5.39
$
Inte
rnal
Aud
itin
g To
tal
3,10
5,92
3.33
$
1,
968,
601.
12$
-
$
3,
196,
910.
94$
8,27
1,43
5.39
$
Serv
ices
rel
ated
to
elec
tric
tra
nsm
issi
on s
yste
m:
Circ
uit M
iles
of E
lect
ric
Tran
sm L
ines
Rat
io
18.
Inte
rnal
Aud
itin
gRe
view
s in
tern
al c
ontr
ols
and
proc
edur
es t
o en
sure
tha
t as
sets
are
saf
egua
rded
&
that
tra
nsac
tions
are
pro
perly
au
thor
ized
& r
ecor
ded.
Thre
e Fa
ctor
Fo
rmul
a
16.
Rend
ers
serv
ices
to
Clie
nt
Com
pani
es w
ith r
espe
ct t
o in
vest
men
ts, f
inan
cing
, cas
h m
anag
emen
t, r
isk
man
agem
ent,
cla
ims
and
fire
prev
entio
n.
Prep
ares
bu
dget
s, f
inan
cial
for
ecas
ts
and
econ
omic
ana
lyse
s.
Thre
e Fa
ctor
Fo
rmul
a
Serv
ices
rel
ated
to
elec
tric
dis
trib
utio
n sy
stem
:Ci
rcui
t Mile
s of
Ele
ctric
D
ist. L
ines
Rat
io
14.
Lega
lRe
nder
s se
rvic
es r
elat
ing
to
labo
r an
d em
ploy
men
t la
w,
litig
atio
n, c
ontr
acts
, rat
es a
nd
regu
lato
ry a
ffai
rs,
envi
ronm
enta
l mat
ters
, fin
anci
ng, f
inan
cial
rep
ortin
g,
real
est
ate
and
othe
r le
gal
mat
ters
.
Thre
e Fa
ctor
Fo
rmul
a
13.
Pub
lic A
ffai
rsPr
epar
es a
nd d
isse
min
ates
in
form
atio
n to
em
ploy
ees,
cu
stom
ers,
gov
ernm
ent
offic
ials
, com
mun
ities
and
the
m
edia
. Pr
ovid
es g
raph
ics,
re
prod
uctio
n lit
hogr
aphy
, ph
otog
raph
y an
d vi
deo
serv
ices
Thre
e Fa
ctor
Fo
rmul
a
Util
ity S
peci
fic A
ctiv
ities
Wei
ghte
d Av
erag
e of
# o
f Cu
stom
ers
Ratio
and
# o
f Em
ploy
ees
Ratio
Duke Energy Carolinas, LLC , Docket No. E-7, Sub 1100A, Duke Energy Progress, LLC, Docket No. E-2, Sub 1095A and
Piedmont Natural Gas Company, Inc., Docket No.G-9, Sub 682A 2016 Annual Report of Affiliate Transactions
39 of 61
0YPuDZOm
sp

Schedule 7
Duk
e En
ergy
Bus
ines
s Se
rvic
esAl
loca
tions
(Ind
irect
Cha
rges
) to
Duk
e En
ergy
Car
olin
as, D
uke
Ener
gy P
rogr
ess
and
Pied
mon
t Nat
ural
Gas
by
Serv
ice
and
Allo
catio
n Po
olFo
r the
12
Mon
ths
Ende
d D
ecem
ber 3
1, 2
016
SA#
Serv
ice
Serv
ice
Des
crip
tion
Allo
cati
on M
etho
dO
pera
ting
U
nit
OU
Des
crip
tion
Allo
cati
on P
ool
Allo
c P
ool
Des
crip
tion
St C
d D
uke
Ener
gy C
arol
inas
D
uke
Ener
gy
Prog
ress
P
iedm
ont N
atur
al
Gas
O
ther
Affil
iate
s To
tal
Cha
rges
by
DEB
S
DG
EAEn
vir
Affr
s G
vrnc
eD
GO
V3FF
ENV
Envi
r Af
frs
Gvr
nce
DG
1
920,
624.
09$
58
3,51
1.52
$
-
$
94
7,59
3.93
$
2,45
1,72
9.54
$
ENEA
Envi
ro A
ffai
rs
Svcs
Ent
ENT3
FFEN
VEn
viro
Aff
airs
Svc
s En
tS4
67,
930,
483.
12
5,02
2,50
4.66
-
7,65
6,41
6.06
20
,609
,403
.84
Util
ity S
peci
fic A
ctiv
ities
Sale
s Ra
tioU
TEA
Envi
ro A
ffai
rs
Svcs
Util
ityU
TISA
LEN
VEn
viro
Aff
airs
Svc
s U
tility
S47
155,
581.
33
10
6,02
6.90
-
22
9,03
1.02
490,
639.
25
Envi
ronm
enta
l, H
ealt
h an
d Sa
fety
Tot
al9,
006,
688.
54$
5,71
2,04
3.08
$
-$
8,83
3,04
1.01
$
23
,551
,772
.63
$
U
TFU
Fuel
s U
tility
UTI
SALF
UE
Fuel
s U
tility
S48
556,
114.
60$
47
1,63
9.12
$
-
$
89
6,51
8.53
$
1,92
4,27
2.25
$
Fuel
s To
tal
556,
114.
60$
47
1,63
9.12
$
-
$
89
6,51
8.53
$
1,92
4,27
2.25
$
DG
IRIn
vest
or R
el
Gvr
nce
DG
OV3
FFIN
VIn
vest
or R
el G
vrnc
eD
G1
2,01
4,48
2.20
$
1,
276,
686.
84$
48
,037
.77
$
2,
074,
937.
08$
5,41
4,14
3.89
$
Inve
stor
Rel
atio
ns T
otal
2,01
4,48
2.20
$
1,
276,
686.
84$
48
,037
.77
$
2,
074,
937.
08$
5,41
4,14
3.89
$
22.
DG
PSPl
anni
ng S
vcs
Gvr
nce
DG
OV3
FFPL
NPl
anni
ng S
vcs
Gvr
nce
DG
1
2,84
7,03
5.99
$
1,
804,
512.
84$
-
$
2,
930,
444.
62$
7,58
1,99
3.45
$
DG
CDCo
rp D
vlpm
nt
Gvr
nce
DG
OV3
FFCD
OCo
rp D
vlpm
nt G
vrnc
eD
G1
934,
787.
89
59
2,48
8.80
-
96
2,17
3.52
2,48
9,45
0.21
DEP
SPl
anni
ng S
vcs
Ente
rpris
e D
ED
ENT3
FFPL
NPl
anni
ng S
vcs
Ente
rpris
e D
ED
03
13,5
74.3
1
8,59
6.84
-
13
,105
.27
35
,276
.42
DU
PSPl
anni
ng S
vcs
Util
ity D
ED
UTI
3FFP
LNPl
anni
ng S
vcs
Util
ity
DE
D09
24,9
08,6
07.0
0
15
,757
,346
.87
-
22,4
89,7
48.2
4
63
,155
,702
.11
P
lann
ing
Tota
l28
,704
,005
.19
$
18,1
62,9
45.3
5$
-
$
26
,395
,471
.65
$
73,2
62,4
22.1
9$
DG
EXEx
ec G
over
nanc
eD
GO
V3FF
EXC
Exec
Gov
erna
nce
DG
1
20,7
69,4
43.5
7$
13
,162
,071
.84
$
727,
332.
60$
21,3
99,6
69.2
1$
56
,058
,517
.22
$
EN
EXEx
ec S
ervi
ces
Ente
rpris
eEN
T3FF
EXC
Exec
Ser
vice
s En
terp
rise
S03
396,
396.
69
25
1,04
4.39
-
38
2,69
5.91
1,03
0,13
6.99
UTE
XEx
ec S
ervi
ces
Util
ityU
TI3F
FEXC
Exec
Ser
vice
s U
tility
S09
1,80
3,05
9.27
1,
140,
626.
97
-
1,
627,
965.
83
4,57
1,65
2.07
Exec
utiv
e To
tal
22,9
68,8
99.5
3$
14
,553
,743
.20
$
727,
332.
60$
23,4
10,3
30.9
5$
61
,660
,306
.28
$
DU
RRFa
cilit
ies
ROR
Gvr
nce
DE
DG
OVE
MRO
RFa
cilit
ies
ROR
Gvr
nce
DG
190
7,43
0.16
$
575,
148.
85$
-$
934,
012.
69$
2,
416,
591.
70$
In
tere
stAl
loca
tes
Inte
rest
DEA
IAc
ctg
Inte
rest
Sv
c En
ter p
rise
DE
DEN
TIN
TACT
Acct
g In
tere
st S
vc
Ente
rpris
e D
ED
5287
7,13
9.02
$
402,
083.
28$
-$
1,16
9,51
8.73
$
2,
448,
741.
03$
O
verh
ead
Load
erO
verh
ead
Allo
catio
n (G
over
nanc
e)N
ON
E(2
,727
,533
.82)
$
(1,7
22,0
59.8
6)$
2,
885.
45$
4,
447,
174.
23$
466.
00$
Gra
nd T
otal
$
3
80,6
14,7
74.6
5 $
239
,741
,520
.61
$
1,6
73,9
08.0
5 $
408
,055
,666
.58
$ 1
,030
,085
,869
.89
Footnote:
**Se
rvic
es li
sted
in th
e su
mm
ary
sche
dul
es o
f Ser
vice
Com
pa
ny C
harg
es to
the
Affi
liate
s inc
lud
e fin
anc
e su
pp
ort,
IT su
pp
ort s
ervi
ces,
and
con
tract
ors s
upp
ort t
o ut
ilitie
s that are labelled as utility operational functions
19.
Envi
ronm
enta
l, H
ealt
h an
d Sa
fety
Esta
blis
hes
polic
ies
and
proc
edur
es a
nd g
over
nanc
e fr
amew
ork
for
com
plia
nce
with
env
ironm
enta
l, he
alth
an
d sa
fety
("E
HS"
) is
sues
, m
onito
rs c
ompl
ianc
e w
ith
EHS
requ
irem
ents
and
pr
ovid
es E
HS
com
plia
nce
Thre
e Fa
ctor
Fo
rmul
a
20.
Fuel
sPr
ocur
es c
oal,
gas
and
oil f
or
the
Clie
nt C
ompa
nies
. En
sure
s co
mpl
ianc
e w
ith p
rice
and
qual
ity p
rovi
sion
s of
fue
l co
ntra
cts
and
arra
nges
for
tr
ansp
orta
tion
of t
he f
uel t
o th
tit
ti
Sale
s Ra
tio
23.
Exec
utiv
ePr
ovid
es g
ener
al
adm
inis
trat
ive
and
exec
utiv
e m
anag
emen
t se
rvic
es.
Thre
e Fa
ctor
Fo
rmul
a
Fac ROR
Faci
litie
s R
ate
of R
etur
n A
lloca
tion
Allo
cate
s th
e Se
rvic
e Co
mpa
ny's
por
tion
of t
he
utili
ties
char
geba
ck f
or
Thre
e Fa
ctor
Fo
rmul
a
21.
Inve
stor
Rel
atio
nsPr
ovid
es c
omm
unic
atio
ns t
o in
vest
ors
and
the
finan
cial
co
mm
unity
, per
form
s tr
ansf
er
agen
t an
d sh
areh
olde
r re
cord
ke
epin
g fu
nctio
ns,
adm
inis
ters
sto
ck p
lans
and
f
tk
lt
d
Thre
e Fa
ctor
Fo
rmul
a
Pla
nnin
gFa
cilit
ates
pre
para
tion
of
stra
tegi
c an
d op
erat
ing
plan
s,
mon
itors
tre
nds
and
eval
uate
s bu
sine
ss
oppo
rtun
ities
.Th
ree
Fact
or
Form
ula
Duke Energy Carolinas, LLC , Docket No. E-7, Sub 1100A, Duke Energy Progress, LLC, Docket No. E-2, Sub 1095A and
Piedmont Natural Gas Company, Inc., Docket No.G-9, Sub 682A 2016 Annual Report of Affiliate Transactions
40 of 61
0YPuDZOm
sp

ScheduleJoint Purcand One Section IIDuke Eneone or mmanner wof the Cotransactio Duke def Joint purspecified Examplesis then divfor a specone or m Note: ThServices against wEstablishmpurchaseIn additioresponsibaccounti Examplesset up byenterpriseinformatioduties of Duke Eneassociatepurchase The followAffiliates no joint pthe detaaccordin
e 8 chases Includ or More Affil
I.D.5. of Northergy Carolinaore of their U
which permitode also requons.
fines joint pur
rchases are prices are re
s of joint purcvided betwecific service tore Utility Aff
hese purchas(DEBS) purch
which multiplment of suce is made unon, those indble for the loing related to
s of purchasy the procuree-level purcon systems mproviding se
ergy maintaed with joint es.
wing is a sumduring calen
purchases duail may contngly.
ding Duke Enliated Comp
h Carolina Cas (DEC), DukUtility Affiliatets clear identuires reportin
rchases for p
actual traneceived by D
chases may een Utility Affto be providfiliates.
ses are conshasing manae entities ma
ch contracts less and unti
dividual entitogistics and o these purc
es not considement deparchases whicmainframe sorvices to affil
ains a detailpurchases a
mmary of jondar year 20uring 2016. Ptain confiden
nergy Carolinanies
Code of Condke Energy Pros, which are tification of eg joint purch
purposes of th
nsactions whDEC, DEP, Pie
be: One releiliates or a coed, the deliv
sidered distinagers or ageay release or is consideril the respectties make puaccounting
hases create
dered joint prtment againh represent
oftware) or piated compa
ed accountand allows fo
oint purchase016 which mearticipant contial vendor
nas, Duke En
duct (Code)ogress (DEP), entered into
each participhases in the c
he Code as f
hereby specedmont and
ease against ontract for avery of which
nct from the nts negotiaterders as needed a DEBS tive entities murchases wh
g related to es a direct ch
purchases mnst which part corporate
purchases maanies.
ting system or clear ident
es involving eet the criteost detail is ar pricing info
ergy Progres
requires tha, Piedmont No pursuant topant’s share ocombined an
follows:
cified quantit one or more
a Purchase a specific purh is split betw
instances ine contracts ded (the samservice, not
make releasehen and if th
their ordersharge to the
may be: Blanrticipating en support cade in conju
that recordtification of e
DEC, DEP aria set forth a
available for ormation and
ss, Piedmont
at all joint purNatural Gas (o this section,of the purchnnual report
ties of goode of their Utilit
Order (PO) orchase of go
ween DEC, DE
n which Dukwith set term
me or similar t a joint pues against thhey initiate r, and it is c
e purchasing
ket contractntities may re
costs (e.g., unction with
ds the distribeach partici
and one or mabove. Pied review as nd would ne
Natural Gas
rchases involPiedmont) a be priced inases. This se of affiliate
ds or servicety Affiliates.
or contract woods or a conEP, Piedmon
e Energy Bums and cond to a blanketrchase, sinc
he PO or conreleases, thecommon tha entity.
t price agreeelease ordersHuman ResDEBS perform
bution of thepant’s share
more of thedmont entereecessary. Soed to be ha
s
lving and n a ction
es for
which ntract t and
siness ditions t PO).
ce no ntract. ey are at the
ements s, sources ming its
e costs e of the
ir Utility ed into ome of andled
Duke Energy Carolinas, LLC , Docket No. E-7, Sub 1100A, Duke Energy Progress, LLC, Docket No. E-2, Sub 1095A and
Piedmont Natural Gas Company, Inc., Docket No.G-9, Sub 682A 2016 Annual Report of Affiliate Transactions
41 of 61
E5 DUKEV ENERGY.

Schedule 8
Joint Purchases Including Duke Energy Carolinas, Duke Energy Progress, Piedmont Natural Gas and One or More Affiliated Companies
For the 12 Months Ended December 31, 2016
Vendor Name Description DE Carolinas DE Progress Other Affiliates Total Invoiced
Amount
ADVANTAGE RESEARCH MONITORING INC Engineering Services 8,021.20$ 12,540.64$ 340.00$ 20,901.84$
ALLIED SPECIALTY RESOURCES LLC Technical Services 91.08 819.72 - 910.80
ALPHA VIDEO AND AUDIO INC Digital Players - Hardware and Technical Support 5,490.00 2,928.00 61,408.00 69,826.00 AMEC FOSTER WHEELER ENVIRONMENT & INFRASTRUCTURE Technical Services 11,317.50 - 1,010.39 12,327.89
AMERICA FUJIKURA LTD Fast Connector Tool Kit for Fiber Cable 21,804.33 2,563.49 - 24,367.82
ATLANTIC CREATIVE COMMUNICATIONS INC Common Digital Platform Video 3,072.00 1,824.00 4,704.00 9,600.00
BELLOMY RESEARCH INC Customer Satisfaction Survey - Marketing 13,505.72 27,011.44 54,022.84 94,540.00
BILINGUAL COMMUNICATIONS INC Spanish Translation Services 215.82 215.85 54.00 485.67
CASEY LEE CONERLY Interactive Voice Recordings 817.93 412.79 654.28 1,885.00
CBS NUCLEAR SERVICES INC Technical Services 3,400.00 8,500.00 - 11,900.00
CHARLES L HARRIS JR Photography - Marketing Programs 343.00 112.00 245.00 700.00
CLASSIC GRAPHICS
Marketing Programs - Appliance Recyle Program, Home Energy House Calls, Welcoming Kits, Summer High Bills 465,182.53 115,091.57 302,987.85 883,261.95
CLEAN ENERGY COLLECTIVE LLCSoftware for the Shared Solar Customer Program (Customer Portal & Program Administration) 40,000.00 40,000.00 - 80,000.00
CONCENTRIX MUSIC AND SOUND DESIGN INC Marketing Program - Home Energy House Call 1,455.50 - 594.50 2,050.00
CONWAY DATA INC Marketing Advertisement 15,000.00 15,000.00 - 30,000.00
CUSTOM CONTROLS UNLIMITED INC Engineering Services 23,016.65 18,259.25 19,940.60 61,216.50
DIRECT OPTIONS INC Direct Mailers, Save Energy & Water Kit Program 277,350.75 27,288.28 82,964.87 387,603.90
ECOMPANYSTORE
Marketing Programs - Small Business Energy Saver, Save Energy & Water Kit Program and CAPS for Hurrican Matthew Responders 56,919.90 7,677.75 15,845.01 80,442.66
ENERGY EFFICIENCY FUNDING GROUP INC Marketing Program - Smart Energy Saver 12,501.68 4,595.86 7,902.46 25,000.00
ENTERGY LOUISIANA LLC Storm Restoration Work 2,283.97 2,283.97 - 4,567.94
ERNST & YOUNG LLP Consulting Services 180,195.40 108,539.02 243,216.58 531,951.00
FAMOUS FRAMES INC Marketing: TV frame illustrations 4,417.50 2,707.50 7,125.00 14,250.00
FLASH PRINTING COMPANY INC Smart Saver Incentive Folders 1,219.91 - 850.69 2,070.60
GEOFFREY WOOD Photography - Marketing Programs 11,597.67 6,222.85 20,384.48 38,205.00
GETTY IMAGES US INC Photography - Marketing Programs 202.56 122.76 288.49 613.81
Duke Energy Carolinas, LLC , Docket No. E-7, Sub 1100A, Duke Energy Progress, LLC, Docket No. E-2, Sub 1095A and
Piedmont Natural Gas Company, Inc., Docket No.G-9, Sub 682A 2016 Annual Report of Affiliate Transactions
42 of 61
4 ENERGY.DUKE

Schedule 8
Joint Purchases Including Duke Energy Carolinas, Duke Energy Progress, Piedmont Natural Gas and One or More Affiliated Companies
For the 12 Months Ended December 31, 2016
Vendor Name Description DE Carolinas DE Progress Other Affiliates Total Invoiced
Amount
GLOBAL RENTAL CO INC Rental of Mobile Utility Equipment 1,725.00 1,725.00 - 3,450.00
GULF POWER COMPANY Storm Restoration Work 81,181.13 81,181.12 - 162,362.25
GUY BROWN MANAGEMENT LLCMarketing Program - Small Business Energy Saver Program 1,921.26 1,124.78 - 3,046.04
HORIZON HYDRAULIC SALES & SERVICE INC Technical Services 5,125.49 5,125.49 - 10,250.98
INTERTEK TECHNICAL SERVICES INC Inspection Services 1,468.93 - 1,468.93 2,937.86
ITEK GRAPHICS LLC Marketing Program - Smart Savers, Energy Efficiency 4,040.36 468.21 3,177.78 7,686.35
J MELANSON INC Consulting Services 2,322.40 4,715.19 - 7,037.59
JOHN DAVIS CONSULTING Political Report Subscription 122.50 122.50 - 245.00
KEITH WOOD INC Smart Gen Consulting Services 42,516.70 9,040.13 301,865.26 353,422.09
LASER INK CORPORATIONMarketing Programs - Home Energy House Calls, Agriculture Brochure 622.88 112.20 174.83 909.91
LEGACY ENVIRONMENTAL SERVICES LLC Technical Services 12,031.00 8,215.00 - 20,246.00
MAKE AN IMPRESSION INCMarketing Programs - Appliance Recyling Pamplet, Demand Response 641.11 387.85 261.59 1,290.55
MCCALLUM SWEENEY CONSULTING Consulting Services - Economic Development 34,545.43 47,350.01 - 81,895.44
MECHANICAL ADVANTAGE INC Mechanical Maintenance Support 20,873.60 5,726.25 - 26,599.85
MEDIA PRINTING CORPORATION Marketing Programs - Everyday Lighting, Direct Mail 74,295.47 - 24,833.68 99,129.15
MISSISSIPPI POWER COMPANY Storm Restoration Work 120,029.52 120,029.52 - 240,059.04
MURRAY & TRETTEL INC METEOROLOGICAL DATA SERVICES - 48,219.03 31,625.00 79,844.03
NANCY G RICH Marketing Program - Energy Efficient Lighting Videos 3,157.40 - 892.60 4,050.00
NATIONAL DATA GRAPHICS CORP Professional Services 1,797.00 582.75 17,966.50 20,346.25
NED RYAN DOYLE Consulting Services 14,271.04 9,918.16 - 24,189.20
NORTH CAROLINA ADVANCED ENERGY CORP Professional Services 14,010.40 6,519.86 - 20,530.26
OKLAHOMA GAS & ELECTRIC CO Storm Restoration Work 115,583.49 115,583.50 - 231,166.99
OLD NORTH STATE MAGAZINES LLC Advertising 2,764.50 2,764.50 - 5,529.00
PARK COMMUNICATIONS LLC Marketing Program -Neighborhood Energy Saver 3,592.57 1,686.01 2,529.00 7,807.58
PHILLIP SHEA ALEXANDER Photography - Advertising 1,178.00 722.00 - 1,900.00
PHOTON CONSULTING LLCAnnual Report on Renewables Supply/Demand/Pricing/Planning 1,760.97 1,232.49 1,956.54 4,950.00
PROJECT ENERGY SAVERS LLC Marketing Program - Project Energy Savers 17,945.00 8,787.50 15,725.00 42,457.50
Duke Energy Carolinas, LLC , Docket No. E-7, Sub 1100A, Duke Energy Progress, LLC, Docket No. E-2, Sub 1095A and
Piedmont Natural Gas Company, Inc., Docket No.G-9, Sub 682A 2016 Annual Report of Affiliate Transactions
43 of 61
4 ENERGY.DUKE

Schedule 8
Joint Purchases Including Duke Energy Carolinas, Duke Energy Progress, Piedmont Natural Gas and One or More Affiliated Companies
For the 12 Months Ended December 31, 2016
Vendor Name Description DE Carolinas DE Progress Other Affiliates Total Invoiced
Amount
PROPUMP SERVICES LLC Technical Services 7,954.58 - 18,560.68 26,515.26
QUESTLINE INCMarketing Programs - Energy Efficient Webinars, Newsletter 8,395.79 4,488.06 5,806.15 18,690.00
RELIABLE TURBINE SERVICES LLC Supplemental Labor 108,681.44 59,851.06 - 168,532.50
RLA INVESTMENTS INC Professional Services 36.97 - 363.44 400.41
ROGER BALL PHOTOGRAPHY INC Photography - Marketing Programs 2,495.65 2,495.64 - 4,991.29
SCOTTMADDEN INC Consulting Services 25,613.98 18,833.81 256,893.15 301,340.94
SHAPCO PRINTING INC Marketing Program - Pool End of Season Brochure 391.71 - 391.72 783.43
SHUTTERSTOCK INC Portraits/Imaging for Advertising 288.00 288.00 864.00 1,440.00
SIGNATURE GRAPHICS INC Vehicle Decals 3,190.69 - 1,823.25 5,013.94
SMITH MOORE LEATHERWOOD LLP Property Donation 57,689.22 57,689.21 - 115,378.43
SPIRACLE MEDIA LLC Marketing Program - Lighting Videos 35,340.00 21,660.00 - 57,000.00
STANTEC CONSULTING SERVICES INC Professional Services 209,016.32 334,404.58 162,985.02 706,405.92
STARCOM MEDIAVEST GROUPDigital/Trade Publications, Agency Fee & Dashboard Mgmt 208,779.29 87,396.72 584,556.68 880,732.69
STERLING ENERGY LLC Engineering Services 7,200.00 10,956.05 8,864.65 27,020.70
STEVEN P WIDOFF INC Photography - Marketing Programs - 2,237.50 2,237.50 4,475.00
STRATEGIC DEVELOPMENT GROUP INC Professional Services - 50,000.00 25,000.00 75,000.00
SUMMIT HELICOPTERS INC Professional Services 67,250.00 6,750.00 - 74,000.00
SURE-FLO INCInspection/Testing of Self-Contained Breathing Apparatus 3,486.68 1,591.32 5,078.00
TAMMY KENNEDY Creative Services - Retouching publications 481.05 - 426.45 907.50
THE FORUM CORPORATION OF NORTH AMERICA Professional Services 263.31 263.31 526.60 1,053.22
THEOREM GEO ASSOCIATES LLC Engineering Support 218,579.29 62,068.55 - 280,647.84
TRAILBLAZER STUDIOS NC INC Recording Studio Rental 435.00 290.00 - 725.00
TRIBUNE PUBLISHING COMPANY LLC Direct Mailings - Marketing 4,403.05 2,373.86 1,850.06 8,626.97
TWITTER INC Advertising/Marketing 6,780.51 3,280.13 9,823.52 19,884.16
US POSTAL SERVICE Postage - Marketing Programs 97.18 59.22 69.60 226.00
VISION ENVELOPE INC Direct Mailings - Appliance Recycling 190.92 116.33 136.75 444.00
W & K ENTERPRISES LLC Maintenance Support 10,428.44 11,928.91 - 22,357.35
Duke Energy Carolinas, LLC , Docket No. E-7, Sub 1100A, Duke Energy Progress, LLC, Docket No. E-2, Sub 1095A and
Piedmont Natural Gas Company, Inc., Docket No.G-9, Sub 682A 2016 Annual Report of Affiliate Transactions
44 of 61
4 ENERGY.DUKE

Schedule 8
Joint Purchases Including Duke Energy Carolinas, Duke Energy Progress, Piedmont Natural Gas and One or More Affiliated Companies
For the 12 Months Ended December 31, 2016
Vendor Name Description DE Carolinas DE Progress Other Affiliates Total Invoiced
Amount
WALSH MEDIA INC Spanish Interactive Voice Recordings 1,676.04 126.28 1,391.73 3,194.05
XTRA LEASE Equipment Rental 610.25 1,674.80 - 2,285.05
ZERO GRAVITY PROJECT LLC Marketing Program - Home Energy House Calls 14,098.00 - 12,502.00 26,600.00
2,742,799.11$ 1,626,879.13$ 2,322,088.70$ 6,691,766.94$
Duke Energy Carolinas, LLC , Docket No. E-7, Sub 1100A, Duke Energy Progress, LLC, Docket No. E-2, Sub 1095A and
Piedmont Natural Gas Company, Inc., Docket No.G-9, Sub 682A 2016 Annual Report of Affiliate Transactions
45 of 61
4 ENERGY.DUKE

Schedule 9.1.a
Inter‐compan
y Asset Tran
sfer Report ‐ Affiliate Asset Tran
sactions To
and From DE Carolin
as
For the 12 M
onths En
ded December 31, 2016
Asset Tran
sfer Tran
sactions from Utility Affiliaties To
Duke
Energy Carolin
asAsset Tran
sfer Tran
sactions From
Duke
Energy Carolin
as to Utility Affiliates
From Affiliate Nam
e
To Affiliate Nam
eQuan
tity
Cost
From Affiliate Nam
eTo
Affiliate Nam
eQuan
tity
Cost
Duke
Energy Florida
Duke Energy Carolinas
184
$45,905.40
Duke Energy Carolinas
Duke
Energy Florida
905
$640,090.71
Duke
Energy Indiana
Duke Energy Carolinas
4,061
$72,730.33
Duke Energy Carolinas
Duke
Energy Indiana
4,758
$279,235.92
Duke
Energy Kentucky
Duke Energy Carolinas
85
$14,353.46
Duke Energy Carolinas
Duke
Energy Kentucky
154
$35,596.84
Duke
Energy Ohio
Duke Energy Carolinas
101
$60,570.44
Duke Energy Carolinas
Duke
Energy Ohio
961
$122,758.11
Duke
Energy Progress
Duke Energy Carolinas
55,366
$330,725.01
Duke Energy Carolinas
Duke
Energy Progress
65,160
$11,028,140.06
Nantahala
25
$1,839.75
Duke
Energy Progress
Total
55,391
$332,564.76
Grand Total
59,822
$526,124.39
Grand Total
71,938
$12,105,821.64
NOTE: These transactions dep
ict all inbound and outbound asset transactions for DE Carolinas recorded
directly within single Supply Chain systems.
Duke Energy Carolinas, LLC , Docket No. E-7, Sub 1100A, Duke Energy Progress, LLC, Docket No. E-2, Sub 1095A and
Piedmont Natural Gas Company, Inc., Docket No.G-9, Sub 682A 2016 Annual Report of Affiliate Transactions
46 of 61
UJ~hCmDZ

Schedule 9.1.b
Inter‐compan
y Asset Tran
sfer Report ‐ Affiliate Asset Tran
sactions To
DE Carolin
as (Cost > $25,000)
For the 12 M
onths En
ded December 31, 2016
Dat
eFr
om A
ffili
ate
Nam
eTo
Aff
iliat
e N
ame
Item
Num
ber
Des
crip
tion
Qua
ntit
yC
ost
07/1
4/16
Duke Energy Ohio
Duke Energy Caroinas
5011
0891
REG
ULATO
R,VOLTAGE,19.92/34.5KV OUTP
UT,375/468A,1PH,OA/FA @
65 DEG
C,W
/
MJ‐XL W/O
COMMUNICATION OR VR‐1
1
27,5
01.3
3$
11/1
4/16
Duke Energy Progress
Duke Energy Caroinas
1514
012
WIRE/CABLE,ELECTR
ICAL, TRIPLEX, 3
CONDUCTO
R, A
LUM/AAAC 6201, (1) BARE, 600V
@ 90 DEG
C, (2) XLPE INSU
LATION,
50,8
00
38,1
00.0
0$
12/1
3/16
Duke Energy Progress
Duke Energy Caroinas
2055
6ATTACHMEN
T, VACUUM DISCONNEC
T SW
ITCH, TWO BOTTLE, F/ 44KV DISCONNEC
T
SWITCH,PARTS, F/ ONE PH ARE SH
OWN ON
9
26,3
46.4
1$
NOTE: Th
ese transactions dep
ict inbound asset transactions to DE Carolinas greater than
or eq
ual to $25,000 recorded
directly within single Supply Chain systems.
Duke Energy Carolinas, LLC , Docket No. E-7, Sub 1100A, Duke Energy Progress, LLC, Docket No. E-2, Sub 1095A and
Piedmont Natural Gas Company, Inc., Docket No.G-9, Sub 682A 2016 Annual Report of Affiliate Transactions
47 of 61
0UJM
DZQm

Schedule 9.1.c
Inter‐compan
y Asset Tran
sfer Report ‐ Affiliate Asset Tran
sactions From DE Carolin
as (Cost > $25,000)
For the 12 M
onths En
ded December 31, 2016
Dat
eFr
om A
ffili
ate
Nam
eTo
Aff
iliat
e N
ame
Item
Nu
mbe
rD
escr
ipti
onQ
uan
tity
Cos
t
02/1
5/16
Duke Energy Carolinas
Duk
e En
ergy
Ind
iana
5135
81BUSH
ING,ELECTR
ICAL CONDUCTO
R,N4,138KV,600A,16.25" BOLT CIRCLE,8 BOLTS,51‐7/8"
UNDER
FLG
3
26,0
58.0
0$
08/2
5/16
Duke Energy Carolinas
Duk
e En
ergy
Pro
gres
s15
1647
5CAP, COMBUSTION, G
AS ONLY, 7FA
+E ASSY, LPR DROP COMBUSTOR, F/ 24K EXTENDED
INTERVAL COMBUSTION SYSTEM
14
67
4,18
4.00
$
08/2
5/16
Duke Energy Carolinas
Duk
e En
ergy
Pro
gres
s15
1647
5CAP, COMBUSTION, G
AS ONLY, 7FA
+E ASSY, LPR DROP COMBUSTOR, F/ 24K EXTENDED
INTERVAL COMBUSTION SYSTEM
14
67
4,18
4.00
$
08/2
5/16
Duke Energy Carolinas
Duk
e En
ergy
Pro
gres
s15
1585
1PIECE, TRANSITION, H
OT GAS PATH
14
1,
202,
026.
00$
08/2
5/16
Duke Energy Carolinas
Duk
e En
ergy
Pro
gres
s15
1585
1PIECE, TRANSITION, H
OT GAS PATH
14
1,
202,
026.
00$
08/2
9/16
Duke Energy Carolinas
Duk
e En
ergy
Pro
gres
s14
9026
5LINER
, COMBUSTION CHAMBER
, COATED, W
/O SPARK PLU
G OR FLAME DETEC
TOR PORTS,
7FA
+E ASSY, LPR DROP COMBUSTOR, 24K
8
372,
832.
00$
08/2
9/16
Duke Energy Carolinas
Duk
e En
ergy
Pro
gres
s14
9026
3LINER
, COMBUSTION CHAMBER
, COATED, W
/ SPARK PLU
G PORTS, 7FA
+E ASSY, LPR DROP
COMBUSTOR, 24K EXTENDED
INTERVAL
2
93,2
08.0
0$
08/2
9/16
Duke Energy Carolinas
Duk
e En
ergy
Pro
gres
s14
9026
3LINER
, COMBUSTION CHAMBER
, COATED, W
/ SPARK PLU
G PORTS, 7FA
+E ASSY, LPR DROP
COMBUSTOR, 24K EXTENDED
INTERVAL
2
93,2
08.0
0$
08/2
9/16
Duke Energy Carolinas
Duk
e En
ergy
Pro
gres
s14
9026
5LINER
, COMBUSTION CHAMBER
, COATED, W
/O SPARK PLU
G OR FLAME DETEC
TOR PORTS,
7FA
+E ASSY, LPR DROP COMBUSTOR, 24K
8
372,
832.
00$
08/2
9/16
Duke Energy Carolinas
Duk
e En
ergy
Pro
gres
s14
9025
6LINER
, COMBUSTION CHAMBER
, COATED, W
/ FLAME DETEC
TOR PORTS, 7FA
+E ASSY, LPR
DROP COMBUSTOR, 24K EXTENDED
INTER
4
186,
416.
00$
08
/29/
16Duke Energy Carolinas
Duk
e En
ergy
Pro
gres
s14
5860
2CLAMP, SUPPORT, FORWARD
28
29
,407
.98
$
08/2
9/16
Duke Energy Carolinas
Duk
e En
ergy
Pro
gres
s14
9025
6LINER
, COMBUSTION CHAMBER
, COATED, W
/ FLAME DETEC
TOR PORTS, 7FA
+E ASSY, LPR
DROP COMBUSTOR, 24K EXTENDED
INTER
4
186,
416.
00$
08
/29/
16Duke Energy Carolinas
Duk
e En
ergy
Pro
gres
s14
9934
8NOZZLE, SEC
OND STA
GE, ALLOY STL, F/ GE 7FA
TURBINES
1
1,22
7,01
2.00
$
08
/29/
16Duke Energy Carolinas
Duk
e En
ergy
Pro
gres
s14
9839
2BLO
CK, SHROUD, SEC
OND STA
GE, ALLOY STL, F/ GEN
ERAL ELEC
TRIC 7FA
TURBINES
1
368,
066.
00$
08
/29/
16Duke Energy Carolinas
Duk
e En
ergy
Pro
gres
s14
9838
5BLO
CK, SHROUD, FIRST STA
GE, ALLOY STL, F/ GEN
ERAL ELEC
TRIC 7FA
TURBINES
1
592,
303.
00$
08
/29/
16Duke Energy Carolinas
Duk
e En
ergy
Pro
gres
s14
9838
9NOZZLE, THIRD STA
GE, ALLOY STL, 20 PER
SET, F/ GEN
ERAL ELEC
TRIC 7FA
TURBINES
1
1,20
0,30
8.00
$
08
/29/
16Duke Energy Carolinas
Duk
e En
ergy
Pro
gres
s14
9839
3BLO
CK, SHROUD, THIRD STA
GE, ALLOY STL, F/ GEN
ERAL ELEC
TRIC 7FA
TURBINES
1
309,
599.
00$
08
/29/
16Duke Energy Carolinas
Duk
e En
ergy
Pro
gres
s14
9838
4BUCKET, THIRD STA
GE, ALLOY STL, 92 PER
SET, F/ GEN
ERAL ELEC
TRIC 7FA
TURBINES
1
1,78
5,94
0.00
$
10/1
3/16
Duke Energy Carolinas
Duk
e En
ergy
Pro
gres
s15
1401
2WIRE/CABLE,ELECTR
ICAL, TRIPLEX, 3
CONDUCTO
R, A
LUM/AAAC 6201, (1) BARE, 600V @
90
DEG
C, (2) XLPE INSU
LATION,
33,6
00
25,1
93.2
8$
11/1
7/16
Duke Energy Carolinas
Duk
e En
ergy
Flo
rida
0000
8706
95PUMP, CIRCULATING COOLING OIL, 1750
2
25,7
77.7
6$
11/2
1/16
Duke Energy Carolinas
Duk
e En
ergy
Flo
rida
5990
65VALVE,MANIFOLD
,MULTIFUNTIONAL,A & B STA
GE
1
43,4
00.0
0$
11/3
0/16
Duke Energy Carolinas
Duk
e En
ergy
Flo
rida
6052
80METER
, ELECTR
ICAL SERVICE,KILOWATT HOUR,240VAC,50A,1PH,0001 R/P RATIO,2S, 3
WIRE,5 DIALS, G
ROUP 66, (1) ELEM
EN30
0
276,
633.
00$
11/3
0/16
Duke Energy Carolinas
Duk
e En
ergy
Flo
rida
6020
59METER
,ELECTR
ICAL SERVICE,KILOWATT HOUR,120/480VAC,5A,3PH,0001 R/P RATIO,9S,4‐
WIRE,5‐DIAL,GROUP NUMBER
66,NUMBE
252
22
7,73
0.46
$
12/0
9/16
Duke Energy Carolinas
Duk
e En
ergy
Ind
iana
1002
017
TRANSFORMER
,PAD M
OUNT, 50KVA, 12470GY/7200VAC PRIM
ARY, 240/120VAC
SECONDARY, 1PH, W
/O TAPS, DEA
D FRONT LO
OP,
50
76
,079
.31
$
NOTE: Th
ese transactions dep
ict outbound asset transactions from DE Carolinas greater than
or eq
ual to $25,000 recorded
directly within single Supply Chain systems.
Duke Energy Carolinas, LLC , Docket No. E-7, Sub 1100A, Duke Energy Progress, LLC, Docket No. E-2, Sub 1095A and
Piedmont Natural Gas Company, Inc., Docket No.G-9, Sub 682A 2016 Annual Report of Affiliate Transactions
48 of 61
0UJ 4C
hler
DZO~

Sched
ule 9.2.a
Inter‐compan
y Asset Transfer Rep
ort ‐ Affiliate Asset Transactions To
and From DE Progress
For the 12 M
onths En
ded
December 31, 2016
Asset Tran
sfer Tran
sactions from Utility Affiliaties To
Duke
Energy Progress
Asset Tran
sfer Tran
sactions From
Duke
Energy Progress to Utility Affiliates
From Affiliate Nam
e
To Affiliate Nam
eQuan
tity
Cost
From Affiliate Nam
e
To Affiliate Nam
eQuan
tity
Cost
Duke
Energy Carolin
asDuke Energy Progress
65,160
$11,028,064.94
Duke Energy Progress
Duke
Energy Florida
1,018
$272,725.67
Duke
Energy Florida
Duke Energy Progress
62,690
$322,234.84
Duke Energy Progress
Duke
Energy Indiana
63
$28,614.31
Duke
Energy Indiana
Duke Energy Progress
212
$14,108.40
Duke Energy Progress
Duke
Energy Kentucky
25
$15,115.36
Duke
Energy Kentucky
Duke Energy Progress
5$1,999.84
Duke Energy Progress
Duke
Energy Carolin
as55,366
$330,725.40
Nan
tahala
25
$1,839.75
Duke Energy Progress
Total
55,391
$332,565.15
Grand Total
128,067
$11,366,408.02
Grand Total
56,497
$649,020.49
NOTE: These transactions depict all inbound and outbound asset transactions for DE Progress recorded
directly within single Supply Chain systems.
Duke Energy Carolinas, LLC , Docket No. E-7, Sub 1100A, Duke Energy Progress, LLC, Docket No. E-2, Sub 1095A and
Piedmont Natural Gas Company, Inc., Docket No.G-9, Sub 682A 2016 Annual Report of Affiliate Transactions
49 of 61
0UJ aC
DZO~

Schedule 9.2.b
Inter‐compan
y Asset Tran
sfer Report ‐ Affiliate Asset Tran
sactions To
DE Progress (Cost > $25,000)
For the 12 M
onths En
ded December 31, 2016
Dat
eFr
om A
ffili
ate
Nam
eTo
Aff
iliat
e N
ame
Item
Num
ber
Des
crip
tion
Qua
ntit
yC
ost
08/2
5/16
Duke Energy Carolinas
Duke Energy Progress
1516
475
CAP, COMBUSTION, G
AS ONLY, 7FA
+E ASSY, LPR DROP COMBUSTOR, F/ 24K EXTENDED
INTERVAL COMBUSTION SYSTEM
14
674,
184.
00$
08/2
5/16
Duke Energy Carolinas
Duke Energy Progress
1516
475
CAP, COMBUSTION, G
AS ONLY, 7FA
+E ASSY, LPR DROP COMBUSTOR, F/ 24K EXTENDED
INTERVAL COMBUSTION SYSTEM
14
674,
184.
00$
08
/25/
16Duke Energy Carolinas
Duke Energy Progress
1515
851
PIECE, TRANSITION, H
OT GAS PATH
14
1,20
2,02
6.00
$
08
/25/
16Duke Energy Carolinas
Duke Energy Progress
1515
851
PIECE, TRANSITION, H
OT GAS PATH
14
1,20
2,02
6.00
$
08/2
9/16
Duke Energy Carolinas
Duke Energy Progress
1490
265
LINER
, COMBUSTION CHAMBER
, COATED, W
/O SPARK PLU
G OR FLAME DETEC
TOR
PORTS, 7FA
+E ASSY, LPR DROP COMBUSTOR, 24K
8
37
2,83
2.00
$
08/2
9/16
Duke Energy Carolinas
Duke Energy Progress
1490
263
LINER
, COMBUSTION CHAMBER
, COATED, W
/ SPARK PLU
G PORTS, 7FA
+E ASSY, LPR
DROP COMBUSTOR, 24K EXTENDED
INTERVAL
2
93
,208
.00
$
08/2
9/16
Duke Energy Carolinas
Duke Energy Progress
1490
263
LINER
, COMBUSTION CHAMBER
, COATED, W
/ SPARK PLU
G PORTS, 7FA
+E ASSY, LPR
DROP COMBUSTOR, 24K EXTENDED
INTERVAL
2
93
,208
.00
$
08/2
9/16
Duke Energy Carolinas
Duke Energy Progress
1490
265
LINER
, COMBUSTION CHAMBER
, COATED, W
/O SPARK PLU
G OR FLAME DETEC
TOR
PORTS, 7FA
+E ASSY, LPR DROP COMBUSTOR, 24K
8
37
2,83
2.00
$
08/2
9/16
Duke Energy Carolinas
Duke Energy Progress
1490
256
LINER
, COMBUSTION CHAMBER
, COATED, W
/ FLAME DETEC
TOR PORTS, 7FA
+E ASSY,
LPR DROP COMBUSTOR, 24K EXTENDED
INTER
4
18
6,41
6.00
$
08/2
9/16
Duke Energy Carolinas
Duke Energy Progress
1458
602
CLAMP, SUPPORT, FORWARD
28
29,4
07.9
8$
08/2
9/16
Duke Energy Carolinas
Duke Energy Progress
1490
256
LINER
, COMBUSTION CHAMBER
, COATED, W
/ FLAME DETEC
TOR PORTS, 7FA
+E ASSY,
LPR DROP COMBUSTOR, 24K EXTENDED
INTER
4
18
6,41
6.00
$
08/2
9/16
Duke Energy Carolinas
Duke Energy Progress
1499
348
NOZZLE, SEC
OND STA
GE, ALLOY STL, F/ GE 7FA
TURBINES
1
1,
227,
012.
00$
08/2
9/16
Duke Energy Carolinas
Duke Energy Progress
1498
392
BLO
CK, SHROUD, SEC
OND STA
GE, ALLOY STL, F/ GEN
ERAL ELEC
TRIC 7FA
TURBINES
1
36
8,06
6.00
$
08/2
9/16
Duke Energy Carolinas
Duke Energy Progress
1498
385
BLO
CK, SHROUD, FIRST STA
GE, ALLOY STL, F/ GEN
ERAL ELEC
TRIC 7FA
TURBINES
1
59
2,30
3.00
$
08/2
9/16
Duke Energy Carolinas
Duke Energy Progress
1498
389
NOZZLE, THIRD STA
GE, ALLOY STL, 20 PER
SET, F/ GEN
ERAL ELEC
TRIC 7FA
TURBINES
1
1,
200,
308.
00$
08/2
9/16
Duke Energy Carolinas
Duke Energy Progress
1498
393
BLO
CK, SHROUD, THIRD STA
GE, ALLOY STL, F/ GEN
ERAL ELEC
TRIC 7FA
TURBINES
1
30
9,59
9.00
$
08/2
9/16
Duke Energy Carolinas
Duke Energy Progress
1498
384
BUCKET, THIRD STA
GE, ALLOY STL, 92 PER
SET, F/ GEN
ERAL ELEC
TRIC 7FA
TURBINES
1
1,
785,
940.
00$
10/1
0/16
Duke Energy Florida
Duke Energy Progress
9220
1292
24KIT, .., STA
GING AREA
MATERIALS,FLO
RIDA.
1
42
,346
.65
$
10/1
0/16
Duke Energy Florida
Duke Energy Progress
9220
1292
24KIT, .., STA
GING AREA
MATERIALS,FLO
RIDA.
1
42
,346
.65
$
10/1
1/16
Duke Energy Florida
Duke Energy Progress
9220
1292
24KIT, .., STA
GING AREA
MATERIALS,FLO
RIDA.
1
42
,346
.65
$
10/1
1/16
Duke Energy Florida
Duke Energy Progress
9220
1292
24KIT, .., STA
GING AREA
MATERIALS,FLO
RIDA.
1
42
,346
.65
$
10/1
3/16
Duke Energy Carolinas
Duke Energy Progress
1514
012
WIRE/CABLE,ELECTR
ICAL, TRIPLEX, 3
CONDUCTO
R, A
LUM/AAAC 6201, (1) BARE, 600V
@ 90 DEG
C, (2) XLPE INSU
LATION,
33,6
00
25
,193
.28
$
NOTE: Th
ese transactions dep
ict inbound asset transactions to DE Progress greater than
or eq
ual to $25,000 recorded
directly within single Supply Chain systems.
Duke Energy Carolinas, LLC , Docket No. E-7, Sub 1100A, Duke Energy Progress, LLC, Docket No. E-2, Sub 1095A and
Piedmont Natural Gas Company, Inc., Docket No.G-9, Sub 682A 2016 Annual Report of Affiliate Transactions
50 of 61
0hc PuDZO~

Schedule 9.2.c
Inter‐compan
y Asset Tran
sfer Report ‐ Affiliate Asset Tran
sactions From DE Progress (Cost > $25,000)
For the 12 M
onths En
ded December 31, 2016
Dat
eFr
om A
ffili
ate
Nam
eTo
Aff
iliat
e N
ame
Item
Nu
mbe
rD
escr
ipti
onQ
uan
tity
Cos
t
05/0
3/16
Duke Energy Progress
Duk
e En
ergy
Flo
rida
9220
2445
89BUSH
ING, TRANSFORMER
, 230 KV, 900 KV BIL, 800 A DRAW LEA
D DRY‐TYPE BUSH
ING IN
NON‐
CER
AMIC
3
61,5
48.8
0$
09/2
6/16
Duke Energy Progress
Duk
e En
ergy
Flo
rida
9220
2445
89BUSH
ING, TRANSFORMER
, 230 KV, 900 KV BIL, 800 A DRAW LEA
D DRY‐TYPE BUSH
ING IN
NON‐
CER
AMIC
3
61,5
48.8
0$
09/2
9/16
Duke Energy Progress
Duk
e En
ergy
Flo
rida
9220
2445
89BUSH
ING, TRANSFORMER
, 230 KV, 900 KV BIL, 800 A DRAW LEA
D DRY‐TYPE BUSH
ING IN
NON‐
CER
AMIC
3
61,5
48.8
0$
11/1
4/16
Duke Energy Progress
Duk
e En
ergy
Car
olin
as15
1401
2WIRE/CABLE,ELECTR
ICAL, TRIPLEX, 3
CONDUCTO
R, A
LUM/AAAC 6201, (1) BARE, 600V @
90
DEG
C, (2) XLPE INSU
LATION,
50,8
00
38
,100
.00
$
12/1
3/16
Duke Energy Progress
Duk
e En
ergy
Car
olin
as20
556
ATTACHMEN
T, VACUUM DISCONNEC
T SW
ITCH, TWO BOTTLE, F/ 44KV DISCONNEC
T
SWITCH,PARTS, F/ ONE PH ARE SH
OWN ON
9
26,3
46.4
1$
NOTE: Th
ese transactions dep
ict outbound asset transactions from DE Progress greater than
or eq
ual to $25,000 recorded
directly within single Supply Chain systems.
Duke Energy Carolinas, LLC , Docket No. E-7, Sub 1100A, Duke Energy Progress, LLC, Docket No. E-2, Sub 1095A and
Piedmont Natural Gas Company, Inc., Docket No.G-9, Sub 682A 2016 Annual Report of Affiliate Transactions
51 of 61
5UJ aC
DZO~

Schedule 9.3
Inter‐compan
y Asset Tran
sfer Report ‐ Piedmont All Tran
sfers
For the 12 M
onths En
ded December 31, 2016
There were no inter‐company asset transfers involving Piedmont to rep
ort for 2016.
Duke Energy Carolinas, LLC , Docket No. E-7, Sub 1100A, Duke Energy Progress, LLC, Docket No. E-2, Sub 1095A and
Piedmont Natural Gas Company, Inc., Docket No.G-9, Sub 682A 2016 Annual Report of Affiliate Transactions
52 of 61
UJ~hCmDZ

Schedule 10
Duke Energy Carolinas and Duke Energy Progress
FV IATA Transfer Components ‐ Rotable Fleet Spares List of Assets
Item # Summary Component Detail Component Average Cost
Estimate*
Component Description
1 End Caps Full Set 544,000$ Combustion system component utilized to meter air through the fuel nozzles
2 Fuel Nozzles (aka. Support Housing / Pilot Nozzle) Full Set 1,050,000$ Combustion system component which mixes fuel and air in preparation for delivery to
the flame
3 Flow Sleeves Full Set 50,000$ Combustion system component utilized to direct flow to the fuel nozzles
4 Liners (aka. Baskets) Full Set 545,500$ Combustion component where reaction (flame) occurs converting the stored energy in
the fuel to heat energy for supply to the turbine
5 Transition Pieces Full Set 678,500$ Combustion component utilized to flow hot gases from the combustion liner to the first
stage nozzle/vanes and begins acceleration of the hot gases
6 Turbine Blades (aka. Turbine Buckets) Row 1 Blades 1,928,500$ Rotating component in the turbine utilized to extract heat energy from gases and
convert to mechanical energy (rotation)
Row 2 Blades 1,525,000$ Rotating component in the turbine utilized to extract heat energy from gases and
convert to mechanical energy (rotation)
Row 3 Blades 1,600,000$ Rotating component in the turbine utilized to extract heat energy from gases and
convert to mechanical energy (rotation)
Row 4 Blades 1,800,000$ Rotating component in the turbine utilized to extract heat energy from gases and
convert to mechanical energy (rotation)
7 Turbine Nozzles (aka. Turbine Vanes) Row 1 Nozzles 1,700,000$ Stationary component in the turbine utilized to accelerate and direct hot gases at the
bucket/blade
Row 2 Nozzles 1,302,000$ Stationary component in the turbine utilized to accelerate and direct hot gases at the
bucket/blade
Row 3 Nozzles 1,118,000$ Stationary component in the turbine utilized to accelerate and direct hot gases at the
bucket/blade
Row 4 Nozzles 1,284,000$ Stationary component in the turbine utilized to accelerate and direct hot gases at the
bucket/blade
8 Turbine Shroud Blocks (aka. Ring Segments) Row 1 Shroud Blocks 375,000$ Stationary component in the turbine utilized to seal and prevent hot gases from going
around turbine blades
Row 2 Shroud Blocks 250,000$ Stationary component in the turbine utilized to seal and prevent hot gases from going
around turbine blades
Row 3 Shroud Blocks 262,500$ Stationary component in the turbine utilized to seal and prevent hot gases from going
around turbine blades
Row 4 Shroud Blocks 200,000$ Stationary component in the turbine utilized to seal and prevent hot gases from going
around turbine blades
9 Blade Ring Row 1 Blade Ring 150,000$ Stationary component in the turbine utilized to hold Vanes, ISSH's, Ring Segments, and
other components in the blade ring assembly
Row 2 Blade Ring 150,000$ Stationary component in the turbine utilized to hold Vanes, ISSH's, Ring Segments, and
other components in the blade ring assembly
Row 3 Blade Ring 150,000$ Stationary component in the turbine utilized to hold Vanes, ISSH's, Ring Segments, and
other components in the blade ring assembly
Row 4 Blade Ring 150,000$ Stationary component in the turbine utilized to hold Vanes, ISSH's, Ring Segments, and
other components in the blade ring assembly
10 Inner Stage Seal Housing (ISSH) Row 2 ISSH 200,000$ Stationary component in the turbine utilized to seal and prevent hot gases from going
around stationary vanes
Row 3 ISSH 250,000$ Stationary component in the turbine utilized to seal and prevent hot gases from going
around stationary vanes
Row 4 ISSH 300,000$ Stationary component in the turbine utilized to seal and prevent hot gases from going
around stationary vanes
11 Compressor Vane/Diaphragm/Blade Rows Complete Row 150,000$ Stationary component in the compressor which converts velocity into pressure
12 Compressor Blade Rows Complete Row 150,000$ Rotating component in the compressor which converts rotational energy into gas
velocity
13 Compressor Blade Wheel Discs Rows 1‐18 200,000$ Rotor component designed to hold rotating blades
14 Turbine Blade Wheel Discs Rows 1‐4 700,000$ Rotor component designed to hold rotating buckets/blades
15 Compressor Rotor Shaft 1 segment 2,500,000$ Component designed to hold rotating blades
16 Turbine Rotor Shaft 1 segment 2,500,000$ Component designed to hold rotating buckets/blades
* Average cost estimates are an inventory cost average or market price.
Duke Energy Carolinas, LLC, Docket No. E-7, Sub 1100A, Duke Energy Progress, LLC, Docket No. E-2, Sub 1095A and
Piedmont Natural Gas Company, Inc., Docket No.G-9, Sub 682A 2016 Annual Report of Affiliate Transactions
53 of 61
P ENERGY.I DUKE

Sched
ule 10
Duke
Energy Carolin
as and Duke
Energy Progress
Rotable Fleet Spares Tran
saction Rep
ort
For the 12 M
onths En
ded
December 31, 2016
(i) Tran
saction Summary
Tran
sferor
Recipient
Asset Typ
e Quantity
Tran
sferor's Net
Book Value *
Fair M
arket Value
Tran
sfer
Month
DEC
DEP
Tran
sition Piece Hot Gas Path (aka. #5. Transition
Pieces) Full Set
28
$2,208,290
$1,202,030
August
DEC
DEP
Cap
, Combustion (aka. #1. End Cap
s) Full Set
28
$1,238,566
$674,184
August
56
$3,446,856
$1,876,214
* Transferor Net Book Value = Inventory Book Value ‐ Dep
reciation Reserve
** Transfer encompasses Dan
River parts in
Service Dec 2012‐M
ar 2015, 28 m
os.
Dep
reciation based on current Ferc 343 rate at Dan
River (Life‐3. 32%, COR‐.17% = Total 3.49%)
(ii) Accounting En
tries
FERC Account
Entity
Debit
Credit
1. Transfer inventory (account 154100)from DEC
inventory system to DEP
projects (account 0107000).
Dr.
107 CWIP
DEP
3,752,429
$
Cr.
154 ‐ M
&S
DEC
(3,752,429)
$
Dr.
146 ‐ In
tercompany Crossbill
DEC
3,752,429
$
Cr.
146 ‐ In
tercompany Crossbill
DEP
(3,752,429)
$
2. A
pply Stores Load
ing Expense (DEC
rate of 12.36% * $3,752,429 = $463,800)
Dr.
163 ‐ Stores Expense
DEP
463,800
$
Cr.
163 ‐ Stores Expense
DEC
(463,800)
$
Dr.
146 ‐ In
tercompany Crossbill
DEC
463,800
$
Cr.
146 ‐ In
tercompany Crossbill
DEP
(463,800)
$
3. ‐ 1. Post accumulated depreciation ‐ rate of 3.49% ** 2. Post Regulatory Asset / Liab
ility
Dr.
108 ‐ Accumulated depreciation
DEC
305,573
$
Cr.
108 ‐ Accumulated depreciation
DEP
(305,573)
$
Dr.
182483 ‐ Rotatable Fleet Spare Reg Asset
DEC
1,570,642
$
Cr.
254106 ‐ Rotatable Fleet Spare Liability
DEP
(1,570,642)
$
Dr.
146 ‐ In
tercompany Crossbill
DEP
1,876,215
$
Cr.
146 ‐ In
tercompany Crossbill
DEC
(1,876,215)
$
Duke Energy Carolinas, LLC , Docket No. E-7, Sub 1100A, Duke Energy Progress, LLC, Docket No. E-2, Sub 1095A and
Piedmont Natural Gas Company, Inc., Docket No.G-9, Sub 682A 2016 Annual Report of Affiliate Transactions
54 of 61
0UJ~
DzO~

ScheduDuke ECommFor the
i)
ii)
iii)
ule 11 Energy Carolimodity Transfee 12 Months
Attached is
subject to t
998A and E
There were
2016.
There are n
inas and Duker Report Ended Decem
s the mutually
the Commodi
E‐7, Sub 986A
e no affiliated
no journal ent
e Energy Pro
mber 31, 201
y agreed upon
ity Transfer A
. There were
d transactions
tries to repor
gress
16
n “List of Com
Agreement file
e no changes
s pursuant to
t.
mmodities an
ed on May 27
to the list sin
the Commod
d Related Equ
7, 2016 in Doc
nce last filed.
dity Transfer A
uipment and
cket Nos. E‐2
Agreement d
Services"
, Sub
uring
Duke Energy Carolinas, LLC , Docket No. E-7, Sub 1100A, Duke Energy Progress, LLC, Docket No. E-2, Sub 1095A and
Piedmont Natural Gas Company, Inc., Docket No.G-9, Sub 682A 2016 Annual Report of Affiliate Transactions
55 of 61
EQ0 DUKEENERGY.

ScheduDuke EList of For the
CommoCoal RefinedFuel OiBiomasLimestoAmmonUrea DibasicTrona Soda ASodiumCalciumCemenPotassiMagneActivatSulfur (Freeze
EquipmRailcarsLocomoTrucks TrailersFuel Oi
ServiceRail traBarge tTruck tTrans‐lThird pThird pSampliProduc
Coal CoFly AshBottomGypsumMill PyCenosp
ule 11 Energy CaroliCommoditiee 12 Months
odities:
d Coal (Sectionl ss one / Lime / Hynia (anhydrous
c Acid
sh m Formate m Bromide t Kiln Dust (CKium Iodide sium Hydroxidted Carbon (emulsified andTreatment (gly
ment (Rent, leas otives
s l Storage Tank
es: ansportation transportation ransportation oading and stoparty railcar anparty on‐site trang and analysiction, storage,
ombustion Byp
m Ash m rites pheres
inas and Dukes and RelatedEnded Decem
n 45)
ydrated Lime /s and aqueous
KD)
de
d molten) ycerin, diethyl
ase or sublease
ks
orage services d locomotive main handling s reclamation, s
products (Bene
e Energy Prod Equipmentmber 31, 201
/ Quick Lime )
ene glycol, calc
e):
maintenance, s
ale, transporta
eficial reuse pu
gress t and Services16
cium chloride,
storage or insp
ation or manag
urposes only):
s
potassium chl
pection
gement of CCP
:
loride)
Ps
Duke Energy Carolinas, LLC , Docket No. E-7, Sub 1100A, Duke Energy Progress, LLC, Docket No. E-2, Sub 1095A and
Piedmont Natural Gas Company, Inc., Docket No.G-9, Sub 682A 2016 Annual Report of Affiliate Transactions
56 of 61
EQO DUKEENERGY.

D
Duke EAffiliatFor the
i)
ii)
uke Energy Caroli
Trade Date
11/03/2016
11/14/2016
Energy Carolite Transactioe 12 Months
Piedmont N
LLC (DEC) a
Through th
spot natura
the period
from Piedm
prices at th
Energy Stan
04/01/2004
nas ‐ Piedmont D
Deal Type
Gas Day Ahead
Gas Day Ahead
inas and Piedons Ended Decem
Natural Gas C
fter being ac
e normal cou
al gas on an a
October 3, 20
mont. These t
e time of the
ndards Board
4 between DE
Day Ahead/Spot Ga
Buy/Sell Start Da
Buy 11/04/201
Buy 11/15/201
dmont Natura
mber 31, 201
ompany, Inc.
quired by par
urse of DEC’s f
rm’s length b
016 and Dece
transactions w
e transactions
(NAESB) Bas
EC and Piedm
as Supply Transact
te End Date
16 11/04/2016 DUKE
16 11/15/2016 DUKE
al Gas
16
(Piedmont) b
rent company
fuel procurem
basis at a com
ember 31, 201
were conduct
s. These purch
e Contract fo
mont.
tions for the Perio
Buyer
E ENERGY CAROLINA
E ENERGY CAROLINA
became an af
y, Duke Energ
ment activity,
mpetitive mar
16, DEC cond
ted on an arm
hases utilized
or Sale and Pu
od 10/3/2016‐12/3
Supplier
Piedmont Nat Gas
Piedmont Nat Gas
ffiliate of Duk
gy Corporatio
, DEC may oc
ket price from
ucted two da
m’s length bas
d the existing
urchase of Na
31/2016
Pricing Locatio
Transco Z5 S
Transco Z5 S
ke Energy Car
on, on 10/3/2
casionally pu
m Piedmont.
aily spot purc
sis and at ma
North Ameri
atural Gas dat
n Exchange
ICE $
ICE $
TOTAL $
rolinas,
016.
rchase
Between
hases
rket
can
ted
Invoice Amount
48,050.00$
35,700.00$
83,750.00$
Duke Energy Carolinas, LLC , Docket No. E-7, Sub 1100A, Duke Energy Progress, LLC, Docket No. E-2, Sub 1095A and
Piedmont Natural Gas Company, Inc., Docket No.G-9, Sub 682A 2016 Annual Report of Affiliate Transactions
57 of 61
EQ0 DUKEENERGY.

Schedule 12.1 DEBS Labor Charges to Duke Energy Carolinas
Summary of Charges by Category and Service
For the 12 Months Ended December 31, 2016
Service Direct Indirect Total
Accounting 3,473,126.11$ 6,659,674.37$ 10,132,800.48$
Electric System Maintenance 269,377.72 1,421,716.85 1,691,094.57
Electric Transmission & Distribution Engineering & Construction 2,432,927.58 1,052,546.09 3,485,473.67
Environmental, Health and Safety 9,049,706.01 3,151,529.29 12,201,235.30
Executive 286,121.39 2,207,146.31 2,493,267.70
Facilities 1,661,714.94 4,672,846.57 6,334,561.51
Finance 1,398,917.37 3,571,125.39 4,970,042.76
Fuels 57,266.54 57,583.45 114,849.99
Human Resources 2,352,089.82 6,048,367.62 8,400,457.44
Information Systems 20,371,580.20 30,357,490.14 50,729,070.34
Internal Auditing 1,022.51 1,464,124.06 1,465,146.57
Investor Relations ‐ 381,274.27 381,274.27
Legal 2,259,778.92 3,597,673.73 5,857,452.65
Marketing and Customer Relations 6,764,135.46 3,220,846.13 9,984,981.59
Meters 417,405.89 ‐ 417,405.89
Nuclear Development 1,336,414.63 ‐ 1,336,414.63
Planning 2,047,008.65 2,309,427.02 4,356,435.67
Power Engineering & Construction 2,098,889.49 ‐ 2,098,889.49
Power Planning and Operations 11,939,782.00 3,054,443.88 14,994,225.88
Public Affairs 2,165,789.83 4,189,001.81 6,354,791.64
Rates 416,801.36 19,132.86 435,934.22
Rights of Way 458,369.17 97,827.12 556,196.29
Supply Chain 17,864,447.14 3,674,356.92 21,538,804.06
Transportation 102,114.43 952,185.76 1,054,300.19
Grand Total 89,224,787.16$ 82,160,319.64$ 171,385,106.80$
Category of Charge
Duke Energy Carolinas, LLC , Docket No. E-7, Sub 1100A, Duke Energy Progress, LLC, Docket No. E-2, Sub 1095A and
Piedmont Natural Gas Company, Inc., Docket No.G-9, Sub 682A 2016 Annual Report of Affiliate Transactions
58 of 61
fg DUKE4 ENERGY.

Schedule 12.2 DEBS Labor Charges to Duke Energy Progress
Summary of Charges by Category and Service
For the 12 Months Ended December 31, 2016
Service Direct Indirect Total
Accounting 1,736,064.16$ 4,198,250.26$ 5,934,314.42$
Electric System Maintenance 220,774.87 813,684.81 1,034,459.68
Electric Transmission & Distribution Engineering & Construction 972,789.34 615,926.43 1,588,715.77
Environmental, Health and Safety 3,292,434.47 1,998,851.32 5,291,285.79
Executive 25,799.52 1,398,237.08 1,424,036.60
Facilities 1,030,625.67 3,254,683.35 4,285,309.02
Finance 1,041,148.18 2,262,099.52 3,303,247.70
Fuels 48,836.33 48,836.33
Human Resources 773,382.79 4,211,903.62 4,985,286.41
Information Systems 11,589,187.90 20,362,829.74 31,952,017.64
Internal Auditing 467.19 927,993.39 928,460.58
Investor Relations 1,151.28 241,620.60 242,771.88
Legal 1,692,793.65 2,204,191.77 3,896,985.42
Marketing and Customer Relations 2,930,870.46 1,537,760.76 4,468,631.22
Meters 18,727.24 ‐ 18,727.24
Nuclear Development 31,121.73 ‐ 31,121.73
Planning 1,691,967.78 1,462,556.51 3,154,524.29
Power Engineering & Construction 1,760,847.20 ‐ 1,760,847.20
Power Planning and Operations 2,960,010.52 2,728,993.03 5,689,003.55
Public Affairs 1,866,928.52 2,656,408.89 4,523,337.41
Rates 345,025.49 13,038.81 358,064.30
Rights of Way 138,204.17 55,229.48 193,433.65
Supply Chain 11,219,297.37 1,660,021.18 12,879,318.55
Transportation 232,687.49 603,515.91 836,203.40
Grand Total 45,572,306.99$ 53,256,632.79$ 98,828,939.78$
Category of Charge
Duke Energy Carolinas, LLC , Docket No. E-7, Sub 1100A, Duke Energy Progress, LLC, Docket No. E-2, Sub 1095A and
Piedmont Natural Gas Company, Inc., Docket No.G-9, Sub 682A 2016 Annual Report of Affiliate Transactions
59 of 61
fg DUKE8 ENERGY.
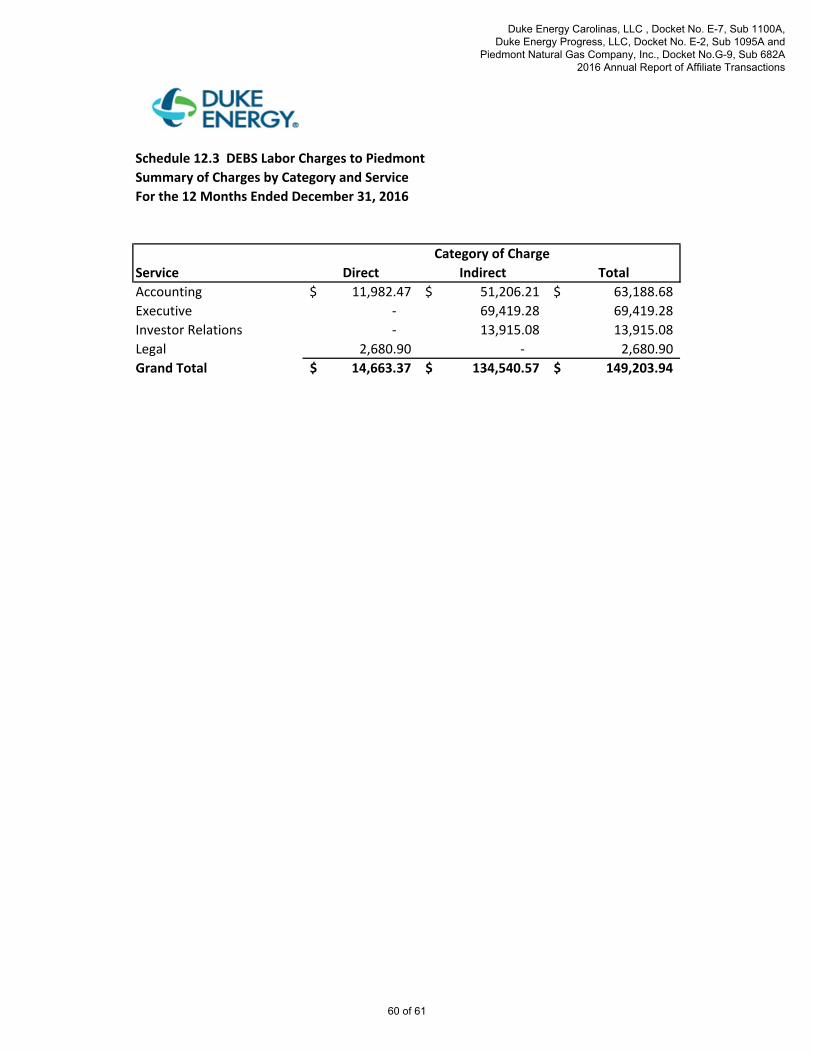
Schedule 12.3 DEBS Labor Charges to Piedmont
Summary of Charges by Category and Service
For the 12 Months Ended December 31, 2016
Service Direct Indirect Total
Accounting 11,982.47$ 51,206.21$ 63,188.68$
Executive ‐ 69,419.28 69,419.28
Investor Relations ‐ 13,915.08 13,915.08
Legal 2,680.90 ‐ 2,680.90
Grand Total 14,663.37$ 134,540.57$ 149,203.94$
Category of Charge
Duke Energy Carolinas, LLC , Docket No. E-7, Sub 1100A, Duke Energy Progress, LLC, Docket No. E-2, Sub 1095A and
Piedmont Natural Gas Company, Inc., Docket No.G-9, Sub 682A 2016 Annual Report of Affiliate Transactions
60 of 61
j%0 DUKEENERGY.

Schedule 13 ACP Transactions
Duke Energy Carolinas and Duke Energy Progress
Charges to Duke Energy ACP
For the 12 Months Ended December 31, 2016
To Affiliate Business Unit Function From FERC Account From Account Description ‐ FERC Amount
Duke Energy ACP DEC Gen Ops Support 920 Administrative and General Salaries 980.05$
408 Payroll Taxes 54.02
926 Employee Benefits 123.92
Duke Energy ACP Total : 1,157.99$
Duke Energy Carolinas, LLC , Docket No. E-7, Sub 1100A, Duke Energy Progress, LLC, Docket No. E-2, Sub 1095A and
Piedmont Natural Gas Company, Inc., Docket No.G-9, Sub 682A 2016 Annual Report of Affiliate Transactions
61 of 61
8 ENERGY.DUKE