Embed Size (px)
Citation preview

DUBAI
Department of Economic Development, Dubai
Economic Information DivisionEconomic Research & Policy Sector
BUSINESSSURVEYQ 1 - 2 0 1 6

INTRODUCTIONThe Department of Economic Development (DED) was established in March 1992, with the objective to organize, regulate and boost trade and industry within the Emirate of Dubai.
In October 2008, HH Sheikh Mohammed bin Rashid Al Maktoum, UAE Prime Minister and Vice-President, and Ruler of Dubai, issued Decree no. 25 giving full responsibility to DED to plan and regulate the overall economic performance of Dubai, supervise its functions and support the economic development to ensure that the objectives of the Dubai Strategic Plan are achieved.
DED is still responsible for its traditional activities of business registration, licensing and commercial protection in Dubai. However with four new agency offices now under the umbrella of DED, the mandate has been extended to include:
1. Mohammed Bin Rashid Establishment for Small & Medium Enterprises (SME)
2. Dubai Export Development Corporation (EDC)
3. Dubai Foundation for the Development of Investment (DFDI)
4. Dubai Competitiveness Office (DCO)
In line with DED’s new mandate, the Economic Information Division conducts a quarterly Business Survey, in coordination with DED Agencies (EDC & SMEs) and in collaboration with Dun & Bradstreet South Asia Middle East Ltd., in order to provide a timely and objective assessment of business expectations and performance. This document summarizes the main findings of the survey for the first quarter of 2016.
1

AT A GLANCE
• The composite BCI has declined on a y-o-y basis from 130.1 points in Q1, 2015 to 116.5 points in Q1, 2016 due to subdued market conditions. On a q-o-q basis, the index has held steady, moving from 116.1 points in Q4, 2015 to 116.5 points in Q1, 2016.
• The sales revenues outlook has become softer both on an annual and quarterly basis. The net balance has declined from 45% for Q2, 2015 and 36% for Q1, 2016 to 34% for Q2, 2016.
• As in the last quarter, large companies have displayed a stronger forecast than SMEs for the second quarter of 2016, with composite BCI scores of 121.0 and 109.6 points respectively.
• Exporters continue to post a weaker outlook compared to the overall business community, with composite BCI scores of 111.8 and 116.5 points respectively.
• Survey participants expect the business situation to largely remain stable as indicated by 47% of them; 39% anticipate an improvement (versus 45% in the previous quarter), but 14% expect deterioration.
• 83% of the businesses do not expect any negative factors to hinder their business operations. Competition is the leading concern for businesses.
• Compared to the last quarter of 2015, fewer businesses are inclined towards capacity expansion (61% in Q1, 2016 versus 67% in Q4, 2015) and investment in technology upgrades (57% in Q1, 2016 versus 63% in Q4, 2015).
2

The Department of Economic Development (DED) is a Dubai Government entity that has the mandate to help achieve the key strategic objectives of fostering ‘Sustainable Economic Development’ and strengthening the ‘Competitiveness of Dubai’.
In order to gauge the perceptions of the business community, DED conducts a quarterly business survey, to assess the level of current economic activity and the outlook of businesses for the next quarter.
In addition, the survey elicits feedback from businesses on challenges that may impact growth and development and assesses their investment outlook for the coming twelve months.
The quarterly business survey for Q1, 2016 was conducted with a total sample of 501 companies across the Emirate of Dubai. The sample included a mix of small, medium, and large enterprises and had adequate representation from the manufacturing, trading, and services sectors in proportion to their respective contributions to Dubai’s GDP.
In order to gauge ‘business outlook’ or expectations, the quarterly survey focuses on key indicators, such as sales revenue, selling prices, volumes sold, profits and number of employees. Respondents are asked to indicate if they expected an ‘increase’, ‘decrease’ or ‘no change’ in these parameters. The Q1, 2016 survey has captured the perceptions of companies across 30-35 sub-sectors.
For the purpose of the survey, each quarter is defined as follows: Q1 is the period between January and March, Q2 is the period between April and June, Q3 is the period between July and September, and Q4 is the period between October and December of each year.
METHODOLOGY
3

The Business Confidence Index (BCI) is calculated as a weighted average score of the following ‘business outlook’ indicators:
• SellingPrices
• VolumesSold
• NumberofEmployees
• Profits
For each indicator, ‘resulting scores’ are calculated using the net balance method: (%ofpositiveresponses-%ofnegativeresponses)+100
For the Composite Business Confidence Index, the resulting scores are multiplied with their corresponding weights to arrive at a weighted average Index score . This index is finally rebased so that Q2, 2011 = 100. Taking account of the economy’s composition by firm size, the index is weighted by the relative contributions of SMEs and large businesses to Dubai’s GDP. The final result is the following index calculation: Overall Index = 60% * (Large Enterprise Index) + 40% * (SME Index).
BCI scores are classified in the following three groups:
• BCI < 100, business expectations are negative
• BCI = 100, business expectations are stable
• BCI > 100, business expectations are positive
When expressed with reference to the base quarter Q2, 2011, the following interpretations hold (t and t-1 referring to two consecutive quarters):
• BCI(t)< BCI(t-1): business expectations are declining
• BCI(t) =BCI(t-1): business expectations are stable
• BCI(t)> BCI(t-1): business expectations are rising
Weighted Average BCI = [(Net Balance on Selling Prices) x (Parameter Weight)] + [(Net Balance on Volumes Sold) x (Parameter Weight)] + [(Net Balance on No. of employees) x (Parameter Weight)] + [(Net Balance on Profits) x (Parameter Weight)]
BUSINESS CONFIDENCE INDEX CALCULATIONS
4
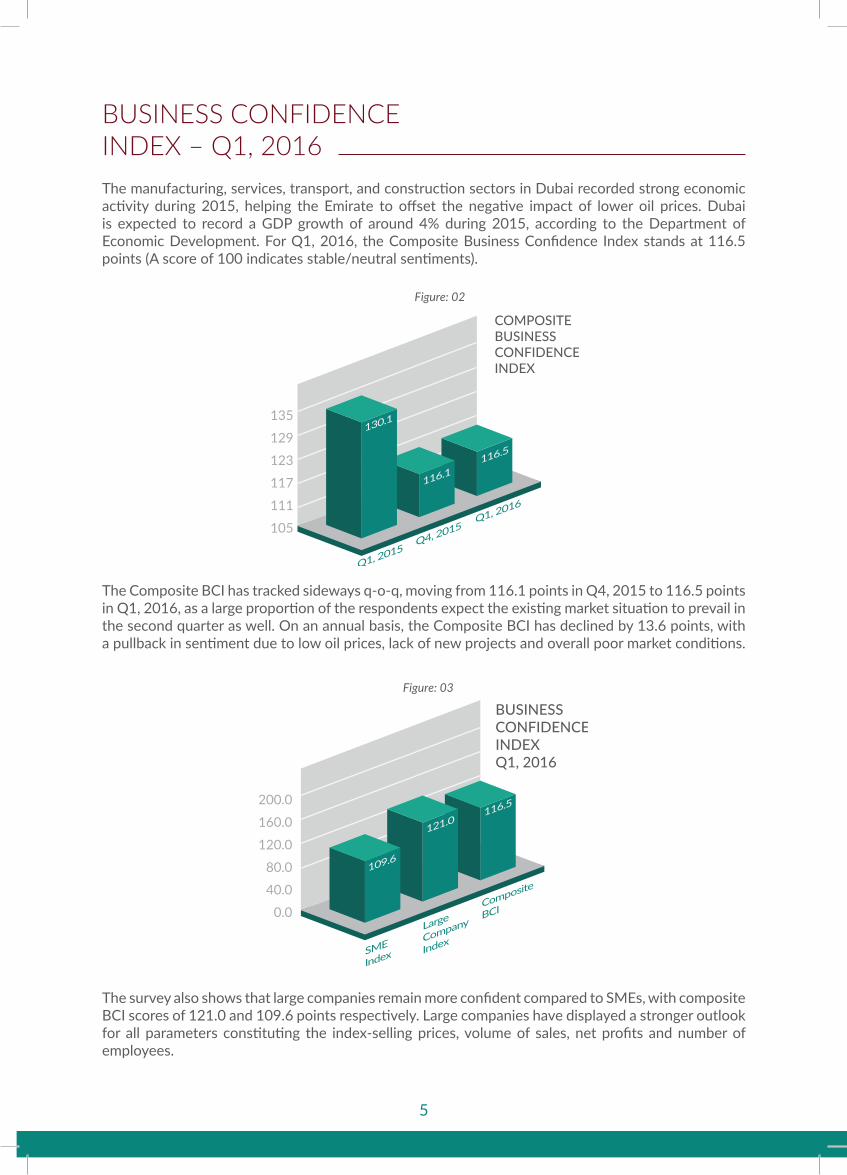
The manufacturing, services, transport, and construction sectors in Dubai recorded strong economic activity during 2015, helping the Emirate to offset the negative impact of lower oil prices. Dubai is expected to record a GDP growth of around 4% during 2015, according to the Department of Economic Development. For Q1, 2016, the Composite Business Confidence Index stands at 116.5 points (A score of 100 indicates stable/neutral sentiments).
The Composite BCI has tracked sideways q-o-q, moving from 116.1 points in Q4, 2015 to 116.5 points in Q1, 2016, as a large proportion of the respondents expect the existing market situation to prevail in the second quarter as well. On an annual basis, the Composite BCI has declined by 13.6 points, with a pullback in sentiment due to low oil prices, lack of new projects and overall poor market conditions.
The survey also shows that large companies remain more confident compared to SMEs, with composite BCI scores of 121.0 and 109.6 points respectively. Large companies have displayed a stronger outlook for all parameters constituting the index-selling prices, volume of sales, net profits and number of employees.
BUSINESS CONFIDENCE INDEX – Q1, 2016
5

According to the survey, Dubai’s businesses expect market conditions prevailing in the first quarter of 2016 to remain steady during the second quarter. However, the forecast for Q2, 2016 is softer than the outlook a year ago. On an annual basis, while the proportion of respondents expecting an increase in revenues has declined, the number of those anticipating a decrease in revenues has increased significantly due to poor market conditions.
• Businesses have indicated a subdued forecast for selling prices (net balance of 1% for Q2, 2016), which is consistent with the low rate of inflation recorded in Dubai (monthly inflation rate of 0.22% in February 2016). Respondents have attributed this to rising competition and poor demand conditions.
• While the profitability outlook has weakened y-o-y, the q-o-q trend is modestly positive backed by expectations of new orders.
• The hiring forecast for Q2, 2016 is on par with the previous quarter, although it is significantly weaker compared to last year.
• With respect to volume of sales, 45% of the companies anticipate an increase and 14% forecast a decrease, resulting in a net balance of 31% for Q2, 2016. This is lower than the net balance of 35% for Q1, 2016 and 44% for Q2, 2015. While the manufacturing sector is more optimistic about volumes for the second quarter, the services sector has displayed a sharp drop in sentiments, which is consistent with the decline in economic activity for the services segment during the summer months.
OVERALL BUSINESS OUTLOOK – Q2, 2016
6
FORECAST BUSINESS PERFORMANCE - Q2, 2016
SalesRevenue
Increase Decrease NoChange
NetBalance
Increase Decrease NoChange
NetBalance
Increase Decrease NoChange
NetBalance
SellingPrices
VolumesSold
No. ofEmployees
Profits
NewPurchaseOrders
Parameter
Q2, 2015 Q1, 2016 Q2, 2016
Table: 01
51%
14%
49%
20%
42%
48%
15%
10%
14%
7%
19%
14%
34%
76%
37%
73%
39%
38%
36%
4%
35%
13%
23%
34%
53%
22%
52%
29%
51%
51%
8%
8%
8%
3%
10%
8%
39%
70%
40%
68%
39%
41%
45%
14%
44%
26%
41%
43%
48%
13%
45%
20%
42%
38%
14%
12%
14%
7%
16%
12%
38%
75%
41%
73%
42%
50%
34%
1%
31%
13%
26%
26%

Within the manufacturing sector, 49% of the firms anticipate an increase in volumes based on expectations of new orders, a favorable business environment, product diversification and other innovative strategies. However, 17% of the respondents expect a decrease, resulting in a net balance of 32%. While the outlook for volumes has weakened on an annual basis, it has become bullish compared to the previous quarter.
Manufacturers in the fields of metals, furniture and plastics have indicated a stronger outlook in comparison to other sub-sectors.
MANUFACTURING SECTOR:
Sector-wise Outlook for Sales Volumes
A comparison across the three main sectors shows that whereas the trading sector is most optimistic about revenues and volumes, the services sector is least optimistic for these parameters. Additionally, while the manufacturing segment is most optimistic about profits, the services sector is most confident about selling prices and hiring.
7

• Within the construction, architecture & real estate services sub-segment, 60% of the firms expect an increase in volumes, whereas 7% anticipate a decline. The forecast is stronger for construction only firms, with 67% of them predicting an increase in volumes.
• Within the travel & hospitality sector, the hotels & restaurants sub-segment has displayed a steep decline in sentiments with 64% of the participants predicting a decline in volumes and just 12% hopeful of an increase, resulting in a net balance of negative 52%. In comparison, car rentals & travel companies however are more optimistic with a net balance of 34%. For the combined travel & hospitality segment, the net balance stands at negative 29%, versus 25% for Q1, 2016.
• In the transportation segment, 41% of the firms expect an increase in volumes during Q2, 2016, while 44% anticipate no change in the parameter as they perceive the business situation to remain stable.
The outlook of the services sector for Q2, 2016 has posted a decline in comparison to Q2, 2015 and Q1, 2016. The q-o-q decline can be attributed to a sharp fall in sentiments in the tourism & hospitality segment. The y-o-y drop in sentiments is due to a softer outlook in the transport & logistics segment. Among the three main sectors, services have posted the least optimistic outlook for volumes.
SERVICES SECTOR:
TRADING SECTOR:Among the three main sectors, the trading sector is the most optimistic with respect to volumes. However, the sector has displayed a modest decline in sentiments for Q2, 2016 when compared with the previous quarter and Q2, 2015. 44% of traders expect an increase in volumes versus 8% that anticipate a decline. The remaining 48% expect a stable business environment; hence they have predicted no change in volumes.
8
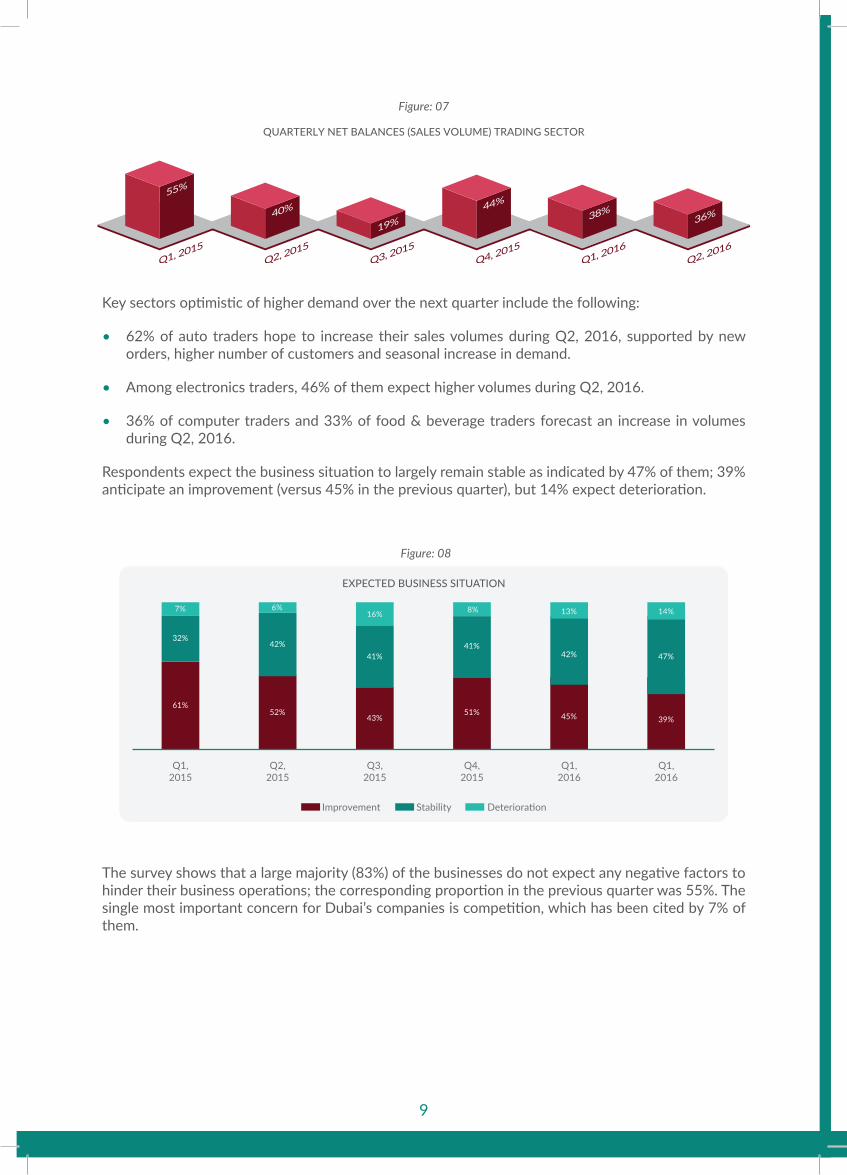
Key sectors optimistic of higher demand over the next quarter include the following:
• 62% of auto traders hope to increase their sales volumes during Q2, 2016, supported by new orders, higher number of customers and seasonal increase in demand.
• Among electronics traders, 46% of them expect higher volumes during Q2, 2016.
• 36% of computer traders and 33% of food & beverage traders forecast an increase in volumes during Q2, 2016.
Respondents expect the business situation to largely remain stable as indicated by 47% of them; 39% anticipate an improvement (versus 45% in the previous quarter), but 14% expect deterioration.
The survey shows that a large majority (83%) of the businesses do not expect any negative factors to hinder their business operations; the corresponding proportion in the previous quarter was 55%. The single most important concern for Dubai’s companies is competition, which has been cited by 7% of them.
9

Subcontracting and Partnership Exchange (SPX)
Definition: SPX is a capacity building program for the manufacturing and service sectors developed by DED Exports Development Corporation (EDC).
Objective of the SPX:• Leverage large companies and public procurement bodies
(including government owned enterprises) to become drivers of SME development. Typical large companies are: Oil companies, aluminum smelters, refineries, desalination plants, steel complexes
• Upgrade the capabilities of SME to supply the local, regional and international markets through benchmarking their performance against international standards
• Support benchmarked potential suppliers in improving their competitive position through international promotion with joint venture partners
• Respond to the needs of large investors seeking qualified local suppliers
• In collaboration with the Gulf Organization for Industrial Consulting (GOIC) and the United Nations Industrial Development Organization (UNIDO), Dubai Exports has established the first SPX unit in all GCC
• Dubai SPX model has become a role model for GCC countries wishing to establishing SPX units
• Dubai Exports received delegations from Kuwait, Bahrain and Qatar to learn from EDC experience in SPX development
SPX Benefits to the Economy:• Increase Exports
• Substitute Imports
• Strengthen Supply Chain
• Spins off new Industries to bridge gaps
Dubai SPX Concept:
• Feasibility Study
• Awareness Seminars
• Profiling suppliers and creation of suppliers database
• Electronically Connect Dubai SPX Database to Gulf SPX Database
• Organizing Matchmaking Events (Between GCC large Industries as buyers and local SME suppliers)
• Send GCC Tender information to Suppliers
Dubai SPX Implementation Milestones:
In Focus
10

SMEs account for a dominant share in Dubai’s total business composition (95% of the total number of firms). 437 of the 501 firms that were interviewed as part of the survey were SMEs. These included micro, small, and medium enterprises as per Dubai’s SME definition. The survey shows that SMEs’ outlook for Q2, 2016 is not as favorable as in the previous quarter or the second quarter of last year. The composite BCI for SMEs stands at 109.6 points in Q1, 2016, which is a 13.1 point decline y-o-y and a 1.7 point decline q-o-q.
Key outlook indicators are summarized below.
• Optimism levels for revenues, selling prices and volumes have weakened both on a quarterly as well as annual basis.
• Large companies remain more optimistic than SMEs with respect to their volume of sales, as indicated by a net balance of 37% for the former compared to 30% for the latter.
• Trading SMEs (net balance of 35%) are more confident than manufacturing and services SMEs (net balance of 28% and 26% respectively) about volumes.
• The hiring outlook has remained steady vis-à-vis last quarter, but has weakened in comparison to the forecast for Q2, 2015.
• The outlook for new purchase orders and profits is consistent with the weaker forecast for volumes.
• 43% of manufacturing firms and 34% of services firms expect to increase their capacity utilization rates during Q2, 2016.
DUBAI SME OUTLOOK – Q2, 2016
11
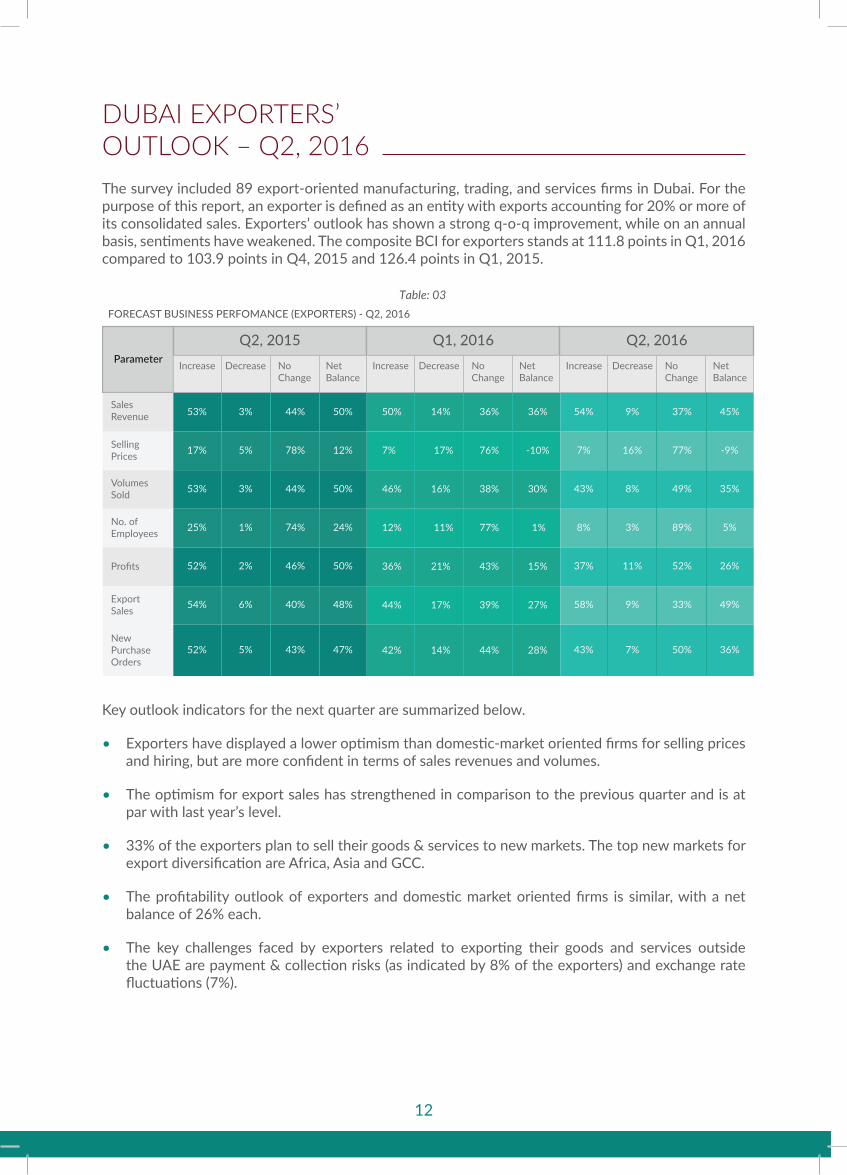
The survey included 89 export-oriented manufacturing, trading, and services firms in Dubai. For the purpose of this report, an exporter is defined as an entity with exports accounting for 20% or more of its consolidated sales. Exporters’ outlook has shown a strong q-o-q improvement, while on an annual basis, sentiments have weakened. The composite BCI for exporters stands at 111.8 points in Q1, 2016 compared to 103.9 points in Q4, 2015 and 126.4 points in Q1, 2015.
Key outlook indicators for the next quarter are summarized below.
• Exporters have displayed a lower optimism than domestic-market oriented firms for selling prices and hiring, but are more confident in terms of sales revenues and volumes.
• The optimism for export sales has strengthened in comparison to the previous quarter and is at par with last year’s level.
• 33% of the exporters plan to sell their goods & services to new markets. The top new markets for export diversification are Africa, Asia and GCC.
• The profitability outlook of exporters and domestic market oriented firms is similar, with a net balance of 26% each.
• The key challenges faced by exporters related to exporting their goods and services outside the UAE are payment & collection risks (as indicated by 8% of the exporters) and exchange rate fluctuations (7%).
DUBAI EXPORTERS’ OUTLOOK – Q2, 2016
12

Although the main purpose of the survey is to gauge business expectations for future activity, it also captures the actual changes in business performance from one quarter to another, as elicited from the feedback given by responding firms.
• 35% of the respondents have indicated that their volumes decreased in Q1, 2016 mainly due to lower oil prices, crisis in the market, poor demand, and lack of new projects, competition, delays in payments and slowdown in global growth.
• While 65% of the firms maintained their selling prices, 25% had to lower them in the face of competition and low demand.
• Employment remained stable for a majority (75%) of the firms, while 14% had to cut down their staff strength due to fewer projects.
• Lower procurement levels in Q1, 2016 reflect the reduced sales volumes.
• The unit cost of labor increased for 39% of the survey participants due to an increase in wages, rise in the cost of living, high visa costs, increments given, higher government fees and higher rates of rental.
OVERALL BUSINESS PERFORMANCE – Q1, 2016
13

• Cost of raw materials remained unchanged for 70% of the firms, while 9% experienced an increase. Rental costs increased for 58% of the respondents during Q1, 2016.
• 80% of the respondents availed bank finance, of which, 16% reported an increase and 81% indicated no change in the cost of finance.
• The manufacturing sector had a weaker performance compared to the traders, but stronger than the services firms. Manufacturers in the food & beverages and cement sub-segments fared better compared to other manufacturers.
• While electronics and computers traders experienced an increase in volumes during Q1, 2016, those in the auto spare parts segment had a weak quarter.
• Within the services sector, hotels & restaurants remained the weakest performers, while construction firms were the strongest.
14
Net Balance = % of respondents citing an increase - % of respondents citing a decrease

• Economic activity (volume of sales) declined again for SMEs since the percentage of firms that indicated an increase in volumes (16%) was lower than those that experienced a decrease (36%).
• SMEs profitability performance improved vis-à-vis the previous quarter.
• The performance of SMEs was weaker than that of large companies, with respect to volumes, hiring and net profits.
SMEs PERFORMANCE – Q1, 2016
15

• Exporters’ performance with respect to sales revenues was weaker than that of domestic-market oriented firms, with net balance scores of negative 25% and negative 18% respectively.
• Exporters outperformed their domestic counterparts with respect to volumes, with a net balance of negative 15% for the former versus negative 19% for the latter.
• Trading exporters displayed the strongest performance for volumes.
• The hiring performance of exporters (net balance of 0%) was modestly better than that of domestic-market oriented firms (net balance of negative 4%).
EXPORTERS’ PERFORMANCE – Q1, 2016
16

KEY BUSINESS CHALLENGES IN DUBAIThe survey also addressed key challenges perceived by businesses at the end of Q1, 2016 that may impact near term business growth and development. The survey shows that a large majority (83%) of the businesses do not expect any negative factors to hinder their business operations; the corresponding proportion in the previous quarter was 55%.
A summary of the major challenges facing Dubai’s business community are as follows:
1. Competition: 7% of the respondents expect competition to impact their business operations. 44% of them expect that competition will intensify.
The remaining concerns were similar in importance and each impacted around 1% of the participants.
For large companies, the main hurdle was high costs of rental/leasing, followed by competition and government regulation/fees. For SMEs, the leading obstacles are competition, and slow demand/market conditions.
The key business challenges impacting exporters are competition and impact of currency fluctuations.
17

INVESTMENT OUTLOOKThe survey also gauges the business community’s investment outlook with respect to capacity expansion and technology upgrade plans over a twelve-month horizon.
• Compared to the last quarter of 2015, fewer businesses are inclined towards capacity expansion and investment in technology upgrades. In Q4, 2015, 67% of the companies had expressed their intention to invest in expansion of capacity. The corresponding percentage for Q1, 2016 stands at 61%. With respect to upgrading technology, 63% had said in Q4, 2015 that they would undertake such investments compared to 57% in Q1, 2016.
• Companies planning capacity expansion are willing to undertake capital investment for expansion of their current office premises and acquisition of fixed assets (such as, factories, warehouses, machinery, and vehicles). Key reasons cited by respondents for not considering expanding business capacity include satisfaction amongst applicable respondents related to size and scale of their current operations and/or prioritization towards achieving stability and profitability, over and above market expansion.
• A comparison among sectors shows that the services sector remains more optimistic towards capacity expansion (64% in services versus 48% in manufacturing and 63% in trading intend to invest in expansion) as well as technology upgrades (62% in services against 52% each in manufacturing and trading plan to invest in upgrading technology).
• SMEs hold a stronger outlook than large firms with respect to investment in technology upgrades, whereas large firms are more inclined towards capacity expansion.
• While exporters are more inclined towards capacity expansion plans, both exporters and domestic oriented firms share a similar outlook towards upgrading their technology.
18

EconomicInformationDivisionEconomicResearch&PolicySector
P.O. Box: 13223, Dubai, United Arab Emirates Tel: +9714 445 5555 | Dir: +9714 445 5881 | Dir: +9714 445 5884,
Fax: +9714 445 5830
w w w . d u b a i d e d . g o v . a e