Embed Size (px)
Citation preview

Dual-Color Monitoring Overcomes the Limitations of SingleBioluminescent Reporters in Fast-Growing Microbes and RevealsPhase-Dependent Protein Productivity during the Metabolic Rhythmsof Saccharomyces cerevisiae
Archana Krishnamoorthy, J. Brian Robertson
Department of Biology, Middle Tennessee State University, Murfreesboro, Tennessee, USA
Luciferase is a useful, noninvasive reporter of gene regulation that can be continuously monitored over long periods of time;however, its use is problematic in fast-growing microbes like bacteria and yeast because rapidly changing cell numbers and met-abolic states also influence bioluminescence, thereby confounding the reporter’s signal. Here we show that these problems canbe overcome in the budding yeast Saccharomyces cerevisiae by simultaneously monitoring bioluminescence from two differentcolors of beetle luciferase, where one color (green) reports activity of a gene of interest, while a second color (red) is stably ex-pressed and used to continuously normalize green bioluminescence for fluctuations in signal intensity that are unrelated to generegulation. We use this dual-luciferase strategy in conjunction with a light-inducible promoter system to test whether differentphases of yeast respiratory oscillations are more suitable for heterologous protein production than others. By using pulses oflight to activate production of a green luciferase while normalizing signal variation to a red luciferase, we show that the earlyreductive phase of the yeast metabolic cycle produces more luciferase than other phases.
Genetic tractability, rapid growth, and simple nutritional re-quirements have made the budding yeast Saccharomyces
cerevisiae an attractive eukaryotic microbe for producing indus-trially important heterologous proteins like insulin, hydrocorti-sone, growth hormones, and vaccines (1–4); however, productionefficiency is always a chief concern when a microbe and growthstrategy for producing protein are being chosen. Rhythmic pro-duction of proteins from oscillating cultures can be more efficientthan steady-state production, especially for unstable proteins andthose strongly affected by cell cycle-dependent proteases (5, 6). Arespiratory oscillation manifests in yeast under specific conditionsof continuous culture and exhibits 1- to 6-h rhythms of oxygenconsumption, cell division, metabolite production, and gene ex-pression (7–10), all of which may make certain phases of the os-cillation better for rhythmic protein production than others.
Monitoring production of heterologous proteins can be labor-intensive; however, by producing a gene product that is easy todetect, the use of heterologous reporter genes can provide a non-invasive, automated way of measuring gene regulation and pro-tein production in real time with high temporal fidelity. When aregulatory element(s) from a gene of interest is used to controlexpression of a reporter gene, the resulting reporter gene productprovides an easily quantifiable surrogate that reflects gene regula-tion (and protein production) for the gene of interest. Luciferasesfrom bacteria (11, 12), fireflies (8, 13), click beetles (14), and ma-rine organisms like Renilla reniformis (15, 16) and Gaussia princeps(17) have been extensively used as reporter genes in a host oforganisms ranging from microbes to animals and plants owinglargely to luciferase’s bioluminescent reaction, which gives offlight that is easily captured and quantified by cameras or photo-multiplier tubes (PMTs) (18). The biochemical reaction catalyzedby these luciferases involves reacting environmental oxygen with aluciferin substrate (that is exogenously supplied) and often re-quires additional cofactors like a cell’s own ATP and Mg2� (19).
The signal from a reporter gene (like luciferase) becomes lessreliable, however, when variables aside from its gene regulationaffect the reporter’s abundance or enzymatic activity. For fast-growing organisms, like microbes whose cell number can rapidlyincrease within the span of hours, accounting for changes in cul-ture density and substrate concentrations (luciferin, O2, etc.) be-comes increasingly important, as these changes also influencesignal intensity. Some assays normalize for cell number by com-paring the reporter’s signal to the optical density of the culture(12, 20), but doing so can involve dilutions and additional mea-surements that add variability and labor to the process, therebyundermining the advantages of automation and real-time contin-uous recording that luciferase provides.
Dual-luciferase assays use two different luciferases simultane-ously, often from two vastly different organisms, like fireflies andRenilla, whereby the differences in substrates and the non-cross-reactive nature of the biochemistries of the two luciferases can beexploited such that sequential addition of the two substrates pro-vides two successive light signals, where the first flash reports reg-
Received 15 May 2015 Accepted 6 July 2015
Accepted manuscript posted online 10 July 2015
Citation Krishnamoorthy A, Robertson JB. 2015. Dual-color monitoring overcomesthe limitations of single bioluminescent reporters in fast-growing microbes andreveals phase-dependent protein productivity during the metabolic rhythms ofSaccharomyces cerevisiae. Appl Environ Microbiol 81:6484 – 6495.doi:10.1128/AEM.01631-15.
Editor: D. Cullen
Address correspondence to J. Brian Robertson, [email protected].
Supplemental material for this article may be found at http://dx.doi.org/10.1128/AEM.01631-15.
Copyright © 2015, American Society for Microbiology. All Rights Reserved.
doi:10.1128/AEM.01631-15
6484 aem.asm.org September 2015 Volume 81 Number 18Applied and Environmental Microbiology
on April 5, 2020 by guest
http://aem.asm
.org/D
ownloaded from

ulation of a gene of interest and the second flash reflects cell number(21) or transfection efficiency (22) by reporting the abundance of astably expressed reference gene product. Although such assays can beautomated and mitigate variation from sample preparation and cellnumber, continuous monitoring from the same sample/culture overtime is not possible once both substrates have been added. Further-more, the differences in biochemistries of the two luciferases do notallow the reference reporter to mitigate changes in reactants and sub-strates that differ between reactions. These problems can be allevi-ated, however, if the two luciferases use the same substrate and sharesimilar biochemistries, as long as each luciferase’s light emission canbe separately detected (e.g., different wavelengths).
The yellow bioluminescence from firefly luciferase (a type ofbeetle luciferase) has been used in yeast to report activity of pro-moters involved in cell cycle and metabolism; however, rapidchanges in cell number and oxygen availability during experi-ments imposed additional variables that affected luminescent out-put (8, 23). We hypothesized that by simultaneously measuringthe luminescence from a stably expressed red luciferase (from fire-flies or related click beetles), we could compensate for non-pro-moter-related variables like changes in cell number and substrateavailability (e.g., O2 and luciferin) with respect to a spectrally dis-tinct (e.g., green) beetle luciferase that reports the activity of ourpromoter of interest. In such a way, we can overcome the short-comings of using a single luciferase reporter in yeast. In this paper,we demonstrate the utility of continually recording the output oftwo colors of luciferase in fast-growing microbes (e.g., yeast) forthe purposes of mitigating signal effects caused by fluctuating cellnumber and reactant concentrations. Furthermore, we use thetwo luciferases to explore phase-dependent productivity of a het-erologous protein (luciferase) in yeast undergoing respiratory os-
cillations to answer the question of whether there are phases of therespiratory oscillation during which yeasts are more productive, atask for which a single luciferase has previously been insufficient.
MATERIALS AND METHODSGreen and red luciferase reporter construction for yeast. Green and redluciferase reporters were constructed from click beetle luciferases as fol-lows. The simian virus 40 (SV40) terminator of pCBG99-basic and pCBR-basic (Promega) was replaced by the 250-bp ADH1 terminator frompRS315-Luc(A4V) (8) using XbaI and SalI. PCR products containing eachluciferase coding sequence (CBG99 or click beetle red [CBR]) with theADH1 terminator were produced using primer 1 or 2 (Table 1), whichadded XmaI and BglII sites to the 5= end (immediately upstream of thestart codon of CBG99 or CBR, respectively) paired with a 3= primer(primer 3) (Table 1) that included a SalI site downstream of the ADH1terminator. These PCR products were introduced into pRS305 andpRS306 (24), respectively, using XmaI and SalI, producing plasmidspRS305-CBG99 and pRS306-CBR.
The pRS305-CBG99 plasmid was additionally modified in two ways.First, a hygromycin-selectable marker was added by PCR amplifying thehphNT1gene from pYM-24 (25) with a 5= primer (primer 6 [Table 1]) thatadded a BamHI site and a 3= primer (primer 7 [Table 1]) that annealeddownstream of the endogenous NotI site to produce pRS305-hph-CBG99. Second, a unique NheI restriction site was engineered into theCBG99 coding sequence (CDS) immediately preceding the stop codonusing primers 8 and 9 (Table 1) for purposes of generating C-terminalprotein fusions for later applications. Finally, by using primers 10 and 11(Table 1), the PEST domain from the CLN2 gene was amplified and addedto the C-terminal end of CBG99 in pRS305-hph-CBG99 to createpRS305-hph-CBG99-PEST.
Redshifted firefly luciferase reporters pRS306-Ppy RE8 and pRS306-PpyRE9 were created by replacing the CBR coding sequence of pRS306-CBR withthat of Ppy RE8 or Ppy RE9 (26). To do this, Ppy RE8 and Ppy RE9 coding
TABLE 1 Primers
Primer no. Name Sequence (5=–3=)a
1 CBG99-5(XmaIBglII) ttcactCCCGGGttacttAGATCTATGGTGAAGCGTGAGAAAAATG2 CBR-5(XmaIBglII) ttcactCCCGGGttacttAGATCTATGGTAAAGCGTGAGAAAAATG3 CBLuc-3(SalI) atgattGTCGACGGATCTATATTACCC4 PpyRE8/9cds-5(BglII) tacctaAGATCTATGGAAGACGCCAAAAACAT5 PpyRE8/9cds-3(NheI) tacctaGCTAGCTTACAATTTGGACTTTCCGC6 HPH-5(BamHI) ttcactGGATCCGACATGGAGGCCCAGAATAC7 HPH-3 TACGACTCACTATAGGGAGACC8 CBG99cds-5(BglII) TTAACAAGATCTATGGTGAAGCG9 CBG99cds-3(NheIXbaI) atgattTCTAGAgatgatGCTAGCACCGCCGGCCTTCTCCAACAA10 PEST-5(NheI) ttcactGCTAGCGCATCCAACTTGAACATTTCG11 ADH1term-3(SalI) atgattGTCGACGGATCTATATTACCCTG12 Ptef1-5(XmaI) ttcactCCCGGGGAGCTCATAGCTTCAAAATGTT13 Ptef1-3(BglII) atgattAGATCTAAAACTTAGATTAGATTGCTATGC14 Pgal1-5(XmaI) ttcactCCCGGGGGCATTACCACCATATACATATC15 Pgal1-3(BglII) atgattAGATCTTATAGTTTTTTCTCCTTGACGTTA16 Ppol-5(XmaI) ttcactCCCGGGTGCATTTTTCTTAAAGAAATATAAC17 Ppol-3(BglII) atgattAGATCTTTTCCACTGTTTATTATATGCCT18 LexACRY2PHR-5(AscI) atcataGGCGCGCCATCTATTGAAGTAATAATAG19 LexACRY2PHR-3(ApaI) atgcttGGGCCCGGTTATTACTGAGTAGTATTTAT20 VP16-CIB1-5(NotI) atcataGCGGCCGCCATCTATTGAAGTAATAATAGG21 VP16-CIB1-3(SpeI) atgcttACTAGTAGGGGAATTTCGACCG22 8op-5(XmaI) ttatatCCCGGGACAGGTTATCAGCAACAACAC23 8op-3(BglII) acttccAGATCTTATAGTTTTTTCTCCTTGACG24 Padh1-5(XmaI) catcatCCCGGGAAGTAATAATAGGCGCATGC25 Padh1-3(BglII) ctacatAGATCTGGAGTTGATTGTATGCTTGGa Underlined portions of primers bind to the target. Bold portions are restriction sites. Lowercase indicates nonspecific nucleotides for restriction site spacing.
Green and Red Luciferases in S. cerevisiae
September 2015 Volume 81 Number 18 aem.asm.org 6485Applied and Environmental Microbiology
on April 5, 2020 by guest
http://aem.asm
.org/D
ownloaded from
sequences were PCR amplified using primers 4 and 5 (Table 1) and intro-duced into pRS306-CBR using BglII and NheI, replacing CBR.
Yeast promoters of interest (e.g., PTEF1, PPOL1, and PGAL1) were addedto any of the luciferase reporter plasmids by amplifying promoters fromplasmids pRS303dKan-PPOL1-Luc(A4V)PEST and pRS315-PGAL1-Luc(A4V) (8) or PTEF1 from plasmid pYM-N18 (25) using primers 12 to17 (Table 1) and then adding the PCR product to the luciferase reporterplasmids with XmaI and BglII.
Yeast strain CEN.PK113-7D (Table 2) (27) provided by Peter Kötter(Goethe University, Frankfurt Germany) was used for single-plasmid in-
tegrations involving pRS305 derived reporters, and transformants wereselected on yeast extract-peptone-dextrose (YPD) with 0.2 mg/ml hygro-mycin B. The ura3 auxotrophic version of the same strain, yBR-ura3�CEN.PK113-7D (9), was used when pRS306-derived reporters wereneeded, and transformants were selected on synthetic minimal me-dium without uracil (6.7 g/liter Difco yeast nitrogen base withoutamino acids, 770 mg/liter Formedium CSM drop-out mix withouturacil, 2% glucose, 2% agar). When multiple reporters were required,yBR-ura3�CEN.PK113-7D was sequentially transformed with the in-tegrating plasmids.
TABLE 2 Strains and plasmids used in this study
Strain or plasmid Description Source or reference
StrainsCEN.PK113-7D MATa MAL2-8c SUC2 Peter Kötter, Goethe
University,Frankfurt,Germany
yBR-ura3�CEN.PK113-7D MATa MAL2-8c SUC2 ura3� 9yBR-G1 CEN.PK113-7D transformed with pRS305-hph-PTEF1-CBG99-PEST This studyyBR-R1 yBR-ura3�CEN.PK113-7D transformed with pRS306-PTEF1-CBR This studyyBR-R2 yBR-ura3�CEN.PK113-7D transformed with pRS306-PTEF1-Ppy RE8 This studyyBR-R3 yBR-ura3�CEN.PK113-7D transformed with pRS306-PTEF1-Ppy RE9 This studyyBR-G2a CEN.PK113-7D transformed with pRS305-hph-PGAL1-CBG99 (no PEST) This studyyBR-G2b CEN.PK113-7D transformed with pRS305-hph-PGAL1-CBG99-PEST This studyyBR-G2b/R1 yBR-ura3�CEN.PK113-7D transformed with pRS305-hph-PGAL1-CBG99-PEST and
pRS306-PTEF1-CBRThis study
yBR-G3/R1 yBR-ura3�CEN.PK113-7D transformed with pRS305-hph-PPOL1-CBG99-PEST andpRS306-PTEF1-CBR
This study
yBR-G4/R1 yBR-ura3�CEN.PK113-7D transformed with pRS305-hph-PLIGHT-CBG99-PEST,pRS306-PTEF1-CBR, pRS304-nat-LEXA-CRY2PHR, and pRS303(d)-Kan-VP16-CIB1
This study
yBR-G4/R4 yBR-ura3�CEN.PK113-7D transformed with pRS305-hph-PLIGHT-CBG99-PEST,pRS306-PADH1-CBR, pRS304-nat-LEXA-CRY2PHR, andpRS303(d)-Kan-VP16-CIB1
This study
PlasmidspRS303 pBluescript shuttle vector containing HIS3 24pRS304 pBluescript shuttle vector containing TRP1 24pRS305 pBluescript shuttle vector containing LEU2 24pRS306 pBluescript shuttle vector containing URA3 24pRS306-CBR CBR luciferase (with ADH1 terminator) added to pRS306 using XmaI and SalI This studypRS306-PTEF1CBR TEF1 promoter added to pRS306-CBR using XmaI and BglII This studypRS306-PTEF1PyRE8 PyRE8 luciferase replaces CBR of pRS306-PTEF1CBR using XmaI and SalI This studypRS306-PTEF1PyRE9 PyRE9 luciferase replaces CBR of pRS306-PTEF1CBR using XmaI and SalI This studypRS306-PADH1CBR ADH1 promoter added to pRS306-CBR before CBR start codon using XmaI and BglII This studypRS305-hph-CBG99 CBG99 luciferase (with ADH1 terminator) added to pRS305 using XmaI and SalI;
hphNT1 added using BamHI and NotIThis study
pRS305-hph-PGAL1CBG99 GAL1 promoter added to pRS305-hph-CBG99 XmaI and BglII This studypRS305-hph-CBG99-PEST PEST degron added preceding the stop codon of CBG99 in pRS305-hph-CBG99 using
NheI and SalIThis study
pRS305-hph-PGAL1CBG99-PEST GAL1 promoter added to pRS305-hph-CBG99-PEST using XmaI and BglII This studypRS305-hph-PPOL1CBG99-PEST POL1 promoter added to pRS305- hph-CBG99-PEST using XmaI and BglII This studypRS305-hph-PTEF1CBG99-PEST TEF1 promoter added to pRS305-hph-CBG99-PEST using XmaI and BglII This studypRS304-nat Nourseothricin resistance cassette added to pRS304 with SacI and BamHI This studypRMH122-LexA-CRY2PHR Yeast expression vector with ADH1 promoter driving LexA-CRY2PHR 28pRS304-nat-LexA-CRY2PHR LexA-CRY2PHR transcriptional factor-phytochrome fusion added to pRS304-nat using
AscI and ApaIThis study
pRS303(d)-Kan pBluescript shuttle vector containing HIS3 and KanMX6, with an AatII site removed 8pRMH124-VP16-CIB1 Yeast expression vector with ADH1 promoter driving VP16-CIB1 28pRS303(d)-Kan-VP16-CIB1 VP16-CIB1 transcriptional factor-CIB1 fusion added to pRS303(d)-Kan using NotI and
SpeIThis study
pSH18-34 2� plasmid containing 8 LexA operators driving LacZ InvitrogenpRS305-hph-PLIGHT CBG99-PEST LexA based promoter added to pRS305-hph-CBG99-PEST using XmaI and BglII This study
Krishnamoorthy and Robertson
6486 aem.asm.org September 2015 Volume 81 Number 18Applied and Environmental Microbiology
on April 5, 2020 by guest
http://aem.asm
.org/D
ownloaded from

Light-responsive reporter construction for yeast. The three geneticelements necessary for the Cry2/Cib1 light-sensitive promoter system(28) were transferred to integrating plasmids with different antibiotic re-sistance markers as follows. The natNT2 gene (marker for nourseothricinresistance) was moved from pYM-N9 (25) to pRS304 (24) by using SacIand BamHI (bringing with it an AscI site at the 5= end) to make pRS304-nat. Then, the LexA-CRY2PHR region was amplified from pRMH122(28) using primers 18 and 19 (Table 1), which added an AscI and ApaI siteat its ends. This PCR product was moved to pRS304-nat with AscI andApaI to yield pRS304-nat-LexA-CRY2PHR. The VP16-CIB1 region ofpRMH124 (28) was PCR amplified using primers 20 and 21 (Table 1) thatadded NotI and SpeI sites to the ends. The PCR product was moved topRS303(d)-Kan (8) to generate pRS303(d)-Kan-VP16-CIB1. The basalpromoter with 8 LexA operator regions (referred to in this work asPLIGHT) was amplified from pSH18-34 (Invitrogen) using primers 22 and23 (Table 1), which added an XmaI site and a BglII site at its ends. ThisPCR product was used to replace the GAL1 promoter of pRS305-hph-PGAL1-CBG99-PEST to make pRS305-hph-PLIGHT-CBG99-PEST. Fi-nally, the region containing the ADH1 promoter was amplified frompRS303(d)-Kan-VP16-CIB1 using primers 24 and 25 (Table 1) and placedin the CBR reporter construct with XmaI and BglII to make pRS306-PADH1-CBR. Yeast strain yBR-ura3�CEN.PK113-7D (9) was sequentiallytransformed with each of the four integrating plasmids, pRS304-nat-LexA-CRY2PHR, pRS303(d)-Kan-VP16-CIB1, pRS305-hph-PLIGHT-CBG99-PEST, and pRS306-PTEF1-CBR (or pRS306-PADH1-CBR), tomake the light-responsive yeast strain yBR-G4/R1.
Monitoring luminescence from batch cultures and plates. In a 15-mlconical glass test tube, a culture of yeast was grown in 8 ml YP-glycerol(1% yeast extract, 2% peptone, 3% glycerol) plus 1.6 �l antifoam A(Sigma) with gentle bubbling for aeration and mixing until the strainreached an optical density at 600 nm (OD600) of �0.6. Then, 10 �l of 100mM beetle luciferin (potassium salt; Promega) was added to the culture,and luminescence was monitored continuously with two HamamatsuPMTs (HC135-01) fitted with 520- � 5-nm (green) and 632- � 5-nm(red) band pass filters (65699 and 65711; Edmund Optics). Figure S1 inthe supplemental material shows the experimental setup for luminescencemonitoring of liquid batch cultures. Yeast grown on solid YP-glycerolmedium (2% agar plus 100 �M beetle luciferin) was imaged using aChemiDoc MP (Bio-Rad) through 520- � 15-nm (green) and 630- �15-nm (red) band pass filters (1708074 and 1708076; Bio-Rad).
Continuous culture conditions and luminescence monitoring. Con-tinuous culture experiments were conducted in a 3-liter BioFlo 115benchtop fermentor (New Brunswick), using media and methods de-scribed previously (8, 29), at pH 4, 900 ml/min air, 550 rpm, 30°C, and a0.08/h dilution rate. The luminescence was continuously recorded usingtwo Hamamatsu PMTs (HC135-01) as described previously (8, 29); how-ever, the PMTs were fitted with 520- � 5-nm (green) and 632- � 5-nm(red) band pass filters (65699 and 65711; Edmund Optics). Figure S2 inthe supplemental material shows the experimental setup for luminescencemonitoring of liquid continuous cultures.
Spectral scans. Emission spectra from overnight cultures ofCEN.PK113-7D transformed with CBR or CBG99 reporters were mea-sured with a QuantaMaster QM-7/SE (Photon Technology Interna-tional). The measurements were recorded as running averages (�10 nm)at 25°C and reported in relative luminescence units (RLU). Transmissionspectra of band pass filters were measured with a Genesys 10s UV-Visspectrophotometer (Thermo Scientific).
Half-life determination of CBG99 in yeast. Yeast strains yBR-G2aand yBR-G2b (i.e., CEN.PK113-7D stably transformed with pRS305-hph-PGAL1-CBG99 with and without the PEST sequence) were grown over-night in YPR (1% yeast extract, 2% peptone, 2% raffinose), diluted 1:100in YPR, grown overnight for a second time, and then diluted to an OD600
of 0.4 in 10 ml YPR plus 100 �M beetle luciferin. Aliquots of 3 ml fromeach culture were made in scintillation vials and shaken in parallel at 28°Con an orbital shaker. After 2.5 h growth (time point �60 min), cells
reached an OD600 of 0.65 and were treated with 150 �l 40% galactose.Luminescence was measured with a FB12 luminometer (Berthold) at in-tervals of 20 min until time zero, when the vials were treated either with125 �l of H2O or with 125 �l of 50% glucose plus 250 �g/ml cyclohexi-mide. Postrepression, bioluminescence was measured every 10 min forthe first hour and then every 15 min thereafter.
Light treatment during continuous culture. The culture was treatedwith one, two, or three 65-W compact cool white fluorescent floodlights(Lithonia Lighting), placed around the vessel’s water jacket, which deliv-ered intensities of 90, 180, and 300 �E/m2/s, respectively. Intensities lessthan 90 �E/m2/s were achieved by positioning one floodlight variousdistances from the culture. The intensity of light was measured using aLi-Cor quantum radiometer/photometer (LI-250A) as described previ-ously (9); briefly, this involved averaging 8 measurements taken at 45° incre-ments around the vessel’s interior. The time period of light delivery was con-trolled by Traceable Lab Controller (Fischer Scientific). Figure S3 in thesupplemental material shows examples of continuous culture illumination.Table S1 shows how the different light intensities were achieved.
RESULTS AND DISCUSSIONAnalysis of spectrally resolvable luciferases in yeast. We con-structed yeast reporters for a variety of beetle luciferases to evalu-ate their in vivo luminescence and spectral separation when ex-pressed from the strong constitutive yeast promoter TEF1. Astrain of S. cerevisiae (CEN.PK113-7D) was stably transformedwith plasmids that expressed CBG99 and CBR click beetleluciferases (https://www.promega.com/�/media/files/resources/promega%20notes/85/introducing%20chroma-luc%20technology.pdf?la�en) and Ppy RE8 and Ppy RE9 red-shifted firefly lu-ciferases (26). These yeasts were patched onto a solid mediumcontaining beetle luciferin and allowed to grow overnight at 30°Cbefore being imaged with a charge-coupled device (CCD) camera.Band pass filters on the camera distinguished light from the greenand red luciferases (Fig. 1A), and quantification of light intensitiesthrough these filters revealed that CBR was a better spectral part-ner for CBG99 with regard to intensity and spectral distinctionthan either of the red-shifted firefly luciferases in our yeast (Fig.1B). Since a small portion of light from CBG99 was detectablethrough our red band pass filters (Fig. 1B and C), we required a redluciferase that was inherently bright enough to be distinguishedfrom this cross talk, thereby ensuring that light detected throughour red filters was overwhelmingly from the red luciferase. Forthese reasons, CBR (and not either of the dimmer firefly lu-ciferases) was used as the red luciferase for the remainder of thisstudy. Figure 1C shows the relative emission spectra for CBG99and CBR in yeast as well as the transmission spectra for the twosets of band pass filters used in this study.
In vivo compensation for changes in cell number. Click beetleluciferase has a half-life in the range of 4.5 to 5 h (Fig. 2), makingsuch stability less effective for reporting rapid changes in pro-moter activity, especially considering that yeast can have cell cyclesas short as �1 h. To improve the temporal fidelity of CBG99 as adynamic reporter for promoters of interest, we fused the sequencefor a destabilizing yeast PEST domain to CBG99, immediatelybefore its stop codon. This modification shortened CBG99’s half-life to about 40 min (Fig. 2), similar to the effect the same modi-fication had on firefly luciferase, as we previously observed (8).However, because the PEST domain also reduces the amount ofluciferase in the cell (and thereby the amount of light produced),we did not similarly modify CBR. We desired a red luciferase that
Green and Red Luciferases in S. cerevisiae
September 2015 Volume 81 Number 18 aem.asm.org 6487Applied and Environmental Microbiology
on April 5, 2020 by guest
http://aem.asm
.org/D
ownloaded from

was as bright and stable as possible for our constitutive referenceluciferase.
We tested whether normalizing luminescence to a constitu-tively expressed red luciferase could mitigate the constant change
in luminescence that results from increasing cell number andchanging metabolic states as yeasts grow in batch cultures formany hours. To do this, we used the well-characterized GAL1promoter to drive our destabilized CBG99 reporter and simulta-neously the strong constitutive TEF1 promoter to drive the refer-ence CBR. GAL1 is a gene whose expression is upregulated in thepresence of galactose and repressed in the presence of glucose(30). Initially, luminescence was evaluated on solid YP-glycerolmedium containing luciferin, where patches of yeast yBR-G2b/R1containing both reporters were arranged in a staggered fashion ona plate and allowed to grow at 30°C overnight (Fig. 3A). The nextday, galactose and glucose were added to the left and right sides ofthe plate, respectively, and imaged 7 h later (Fig. 3B). All patchesemitted red light from PTEF1-CBR (except the control strain yBR-G2b, which lacked the red reporter), but only patches on the leftside of the plate emitted green light from PGAL1-CBG. Ratiometricluminescence measured on solid medium, such as that in Fig. 3B,can be a useful way of evaluating many clones/colonies at once,certainly when growth rate and/or colony size confounds biolu-minescence from the reporter of interest.
A normalizing red luciferase is also especially useful in liquidcultures where cell number and metabolic state change rapidly(for example, see Fig. S4 in the supplemental material). To employthe red luciferase as a normalizer for the effect that cell numberand metabolic state have on green luminescence in liquid culture,we grew two cultures of yBR-G2b/R1 (PGAL1-CBG/PTEF1-CBR) ina 15-ml glass conical tube containing liquid YP-glycerol medium(with luciferin and antifoam) gently bubbled with humidified air foragitation and O2 supply. Green and red luminescence from the cul-tures were simultaneously logged by a computer each minute formore than 56 h (Fig. 3C and D). See Fig. S1 in the supplementalmaterial for the experimental setup. After 8 h of monitoring, redluminescence noticeably increased in both cultures, reflecting a rise inculture density, and even though green luminescence remained lowerthan red (glycerol is neutral to GAL1 promoter), a small amount ofleaky control resulted in it too rising proportionally with culture den-sity. At the 8-h time point, either glucose (Fig. 3C) or galactose
FIG 1 Analysis of green and red luciferases in S. cerevisiae. (A) Yeast strains yBR-G1, yBR-R1, yBR-R2, and yBR-R3 stably transformed with PTEF1 driving variousluciferases (CBG99, CBR, Ppy RE8, and Ppy RE9, respectively) were patched onto solid medium and visualized (5 min exposure) after 24 h growth with a CCDcamera fitted with 520- � 15-nm (green) and 630- � 15-nm (red) band pass filters. The luciferase expressed by each patch is indicated to the left of each patch,abbreviated “G” for CBG99, “R” for CBR, “8” for PpyRE8, and “9” for PpyRE9. (B) The luminescence intensity of each patch recorded through the green and redfilters was quantified using ImageJ software. Bg, signal background averaged from 10 locations on the plate where yeasts were not patched. Bars show means �standard deviations. (C) Spectral scans of CBG99 and CBR luciferases in yeast were compared to the transmission spectra of the filter sets used for this study, i.e.,those for the CCD camera (mentioned above) and photomultiplier tubes (PMT), 520 � 5 nm (green) and 632 � 5 nm (red).
FIG 2 The half-life of CBG activity in yeast is shortened from �5 h to �40min by the addition of a PEST destabilizing sequence to the 3= end of thecoding region of the CBG luciferase gene. Luminescence was periodically mea-sured from strains yBR-G2a and yBR-G2b, which were transformed with ga-lactose-inducible/glucose-repressible reporters with or without a PEST se-quence. Luciferase transcription was induced by addition of galactose to themedium at �60 min for all cultures. Cultures with destabilized reporters (andŒ) showed a smaller amount of expression than cultures with unmodifiedreporters (� and �). Transcription and translation of luciferase were re-pressed at 0 min by the addition of glucose and cycloheximide in cultures withthe destabilized reporter (Œ) and with the unmodified reporter (�). Similarcultures were not repressed at time zero (� and ). Luminescence from allrepressed cultures dropped after time zero, but that of cultures with the desta-bilized luciferase reporter (Œ) dropped much faster than that of cultures withthe unmodified luciferase reporter (}); half-lives were calculated as 4.75 h forCBG and 40 min for CBG with PEST. Cultures that were not repressed at timezero (� and ) continued to increase their luminescence over the course ofthe experiment. Luminescence was graphed on a log scale, and time wasgraphed in negative minutes before repression and in positive minutes afterrepression.
Krishnamoorthy and Robertson
6488 aem.asm.org September 2015 Volume 81 Number 18Applied and Environmental Microbiology
on April 5, 2020 by guest
http://aem.asm
.org/D
ownloaded from

(Fig. 3D) was added to the culture. In the glucose-treated culture,green luminescence continued to gradually rise proportionally withred luminescence. However, in the galactose-treated culture, greenluminescence rose sharply after the addition of sugar.
More dramatic than the gradual change in cell number is therapid drop in luminescence that results when its reaction be-comes limited for one or more components that biolumines-cence requires (e.g., oxygen, ATP, or luciferin). This can occurwhen oxygen is consumed much faster than it can be suppliedor when cells have consumed most of the carbon in the medium(like between hours 24 and 32 in Fig. 3C and between hours 52and 56 in Fig. 3D). However, despite the rise in luminescence asa result of culture growth, or the drop in luminescence as a
result of reactant limitation, the green/red (G/R) ratio reflectedthe expected performance for the GAL1 promoter in both casesof sugar treatment. It remained virtually flat in the glucosetreatment, and it rose rapidly and then slowly decayed in thegalactose treatment.
In vivo compensation for changes in oxygen. When we mon-itor bioluminescence from yeast growing in batch cultures formany hours, we routinely see instances of respiratory bouts wherethe culture rapidly consumes oxygen for a short time (as can beseen in the red and green traces of Fig. 3D at hour 48). In batchculture, these respiratory bouts are transitory; however, whenyeasts are grown in continuous culture where nutrients, pH, andcell number are stabilized, the respiratory bouts can recur at pre-
FIG 3 Effect of sugar treatment on strain yBR-G2b/R1, which contains a galactose-inducible CBG99 (PGAL1-CBG) and constitutively expressed CBR (PTEF1-CBR). (A) Bright-field image of a patch plate (YP-glycerol medium) of yBR-G2b/R1 stably transformed with both reporters, except for the 4 patches indicatedby arrows, which each have only one reporter, as indicated. Galactose (5 �l; 40%, wt/vol) or glucose (4 �l; 36%, wt/vol) were placed as drops where indicated (Xand O), respectively, 7 h prior to imaging. (B) Merged image of bioluminescence from the patch plate recorded through the green filter (10-min exposure) andthrough the red filter (3-min exposure). Yellow indicates coexpression from both GAL1 and TEF1 promoters, and red indicates expression from TEF1 only. (Cand D) Luminescence was continuously recorded automatically every minute for 56� h from two 8-ml YP-glycerol liquid cultures. After 8 h (black arrows),glucose (C) or galactose (D) was added (�2% [final concentration] sugar). Although the output of both luciferases was influenced by constantly changing cellnumber and O2 availability, the G/R ratio reveals that expression from the GAL1 promoter was not affected by glucose (the black trace in panel C remains flat);however, it increased rapidly upon galactose addition (the black trace in panel D rises sharply).
Green and Red Luciferases in S. cerevisiae
September 2015 Volume 81 Number 18 aem.asm.org 6489Applied and Environmental Microbiology
on April 5, 2020 by guest
http://aem.asm
.org/D
ownloaded from
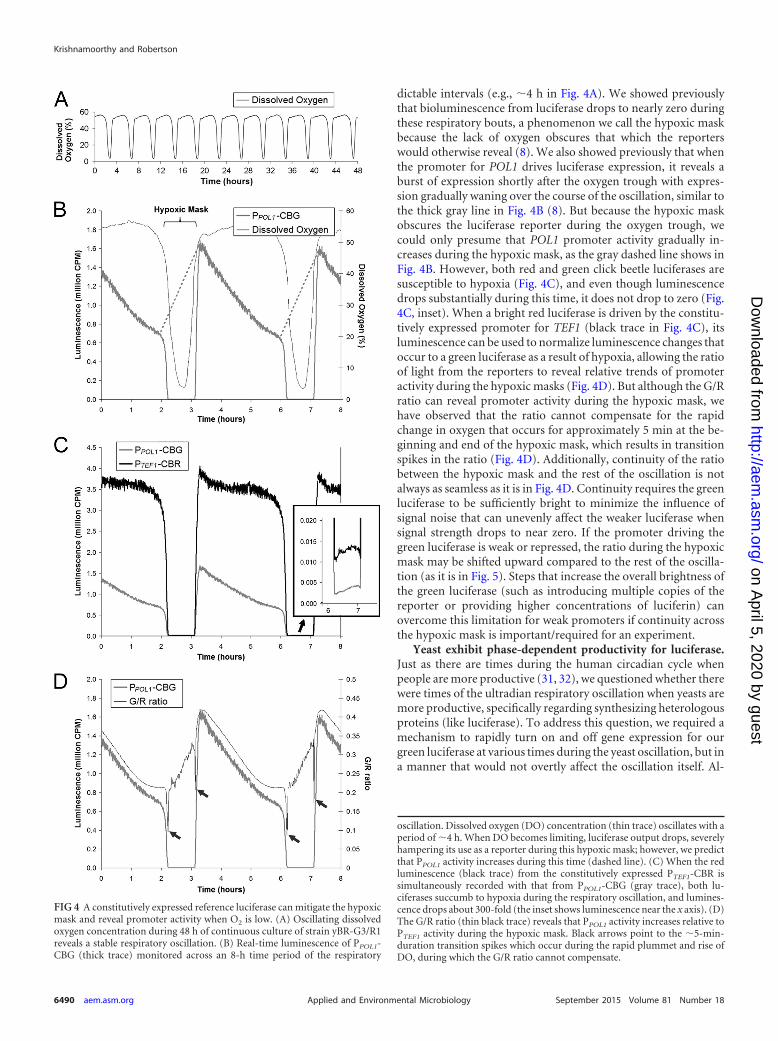
dictable intervals (e.g., �4 h in Fig. 4A). We showed previouslythat bioluminescence from luciferase drops to nearly zero duringthese respiratory bouts, a phenomenon we call the hypoxic maskbecause the lack of oxygen obscures that which the reporterswould otherwise reveal (8). We also showed previously that whenthe promoter for POL1 drives luciferase expression, it reveals aburst of expression shortly after the oxygen trough with expres-sion gradually waning over the course of the oscillation, similar tothe thick gray line in Fig. 4B (8). But because the hypoxic maskobscures the luciferase reporter during the oxygen trough, wecould only presume that POL1 promoter activity gradually in-creases during the hypoxic mask, as the gray dashed line shows inFig. 4B. However, both red and green click beetle luciferases aresusceptible to hypoxia (Fig. 4C), and even though luminescencedrops substantially during this time, it does not drop to zero (Fig.4C, inset). When a bright red luciferase is driven by the constitu-tively expressed promoter for TEF1 (black trace in Fig. 4C), itsluminescence can be used to normalize luminescence changes thatoccur to a green luciferase as a result of hypoxia, allowing the ratioof light from the reporters to reveal relative trends of promoteractivity during the hypoxic masks (Fig. 4D). But although the G/Rratio can reveal promoter activity during the hypoxic mask, wehave observed that the ratio cannot compensate for the rapidchange in oxygen that occurs for approximately 5 min at the be-ginning and end of the hypoxic mask, which results in transitionspikes in the ratio (Fig. 4D). Additionally, continuity of the ratiobetween the hypoxic mask and the rest of the oscillation is notalways as seamless as it is in Fig. 4D. Continuity requires the greenluciferase to be sufficiently bright to minimize the influence ofsignal noise that can unevenly affect the weaker luciferase whensignal strength drops to near zero. If the promoter driving thegreen luciferase is weak or repressed, the ratio during the hypoxicmask may be shifted upward compared to the rest of the oscilla-tion (as it is in Fig. 5). Steps that increase the overall brightness ofthe green luciferase (such as introducing multiple copies of thereporter or providing higher concentrations of luciferin) canovercome this limitation for weak promoters if continuity acrossthe hypoxic mask is important/required for an experiment.
Yeast exhibit phase-dependent productivity for luciferase.Just as there are times during the human circadian cycle whenpeople are more productive (31, 32), we questioned whether therewere times of the ultradian respiratory oscillation when yeasts aremore productive, specifically regarding synthesizing heterologousproteins (like luciferase). To address this question, we required amechanism to rapidly turn on and off gene expression for ourgreen luciferase at various times during the yeast oscillation, but ina manner that would not overtly affect the oscillation itself. Al-
FIG 4 A constitutively expressed reference luciferase can mitigate the hypoxicmask and reveal promoter activity when O2 is low. (A) Oscillating dissolvedoxygen concentration during 48 h of continuous culture of strain yBR-G3/R1reveals a stable respiratory oscillation. (B) Real-time luminescence of PPOL1-CBG (thick trace) monitored across an 8-h time period of the respiratory
oscillation. Dissolved oxygen (DO) concentration (thin trace) oscillates with aperiod of �4 h. When DO becomes limiting, luciferase output drops, severelyhampering its use as a reporter during this hypoxic mask; however, we predictthat PPOL1 activity increases during this time (dashed line). (C) When the redluminescence (black trace) from the constitutively expressed PTEF1-CBR issimultaneously recorded with that from PPOL1-CBG (gray trace), both lu-ciferases succumb to hypoxia during the respiratory oscillation, and lumines-cence drops about 300-fold (the inset shows luminescence near the x axis). (D)The G/R ratio (thin black trace) reveals that PPOL1 activity increases relative toPTEF1 activity during the hypoxic mask. Black arrows point to the �5-min-duration transition spikes which occur during the rapid plummet and rise ofDO, during which the G/R ratio cannot compensate.
Krishnamoorthy and Robertson
6490 aem.asm.org September 2015 Volume 81 Number 18Applied and Environmental Microbiology
on April 5, 2020 by guest
http://aem.asm
.org/D
ownloaded from
though there are yeast promoters that rapidly respond to chemicaladditives like galactose (Fig. 3) or copper (33), we wished to min-imize any inherent, time-dependent propensity yeasts may havefor their own promoters, so we looked to heterologous transcrip-tion factors and promoters. Furthermore, the rapid introductionof chemicals like galactose and copper often perturbs the oscilla-tion, and such chemicals are difficult to remove from the cultureonce added; therefore, such chemical induction systems were notpursued. Alternatively, the Cry2 and Cib1 proteins from plantsdimerize in the presence of blue light, which can in turn be used toactivate a modified bacterial lexA promoter (28, 34). And al-though we have previously shown that intense visible light per-turbs the yeast oscillation, we have also shown that intensities lessthan 100 �E/m2/s have little effect on the oscillation (9). A light-inducible promoter system offers the advantages of a heterologousgene control system that can be rapidly activated or inactivatedwithout adding chemicals to the culture or disturbing the oscilla-tion.
We constructed yBR-G4/R1, a strain of yeast that containedthe genetic elements necessary to allow the light-dependentdimerization of Cry2 and Cib1 to control the expression of ourdestabilized CBG luciferase (PLIGHT-CBG) independently from aconstitutive PTEF1 controlled CBR reference gene. Briefly, this re-quired transformation using three integrating plasmids. The firstcontained a yeast ADH1 promoter controlling transcription of aCDS containing the binding domain of the bacterial lexA splittranscription factor fused to the photoresponsive domain of Cry2from Arabidopsis. The second contained a yeast ADH1 promoterdriving a CDS containing the transcriptional activating domain ofthe viral VP16 fused to Cib1 from Arabidopsis, and the third con-tained the PLIGHT promoter (consisting of a yeast basal promoterelement fused to 8 repeats of the lexA operator) driving destabi-lized CBG99.
A yeast respiratory oscillation with a period of approximately 4h was established in the dark, and during this time, a small amountof green bioluminescence could be detected from the culture, in-
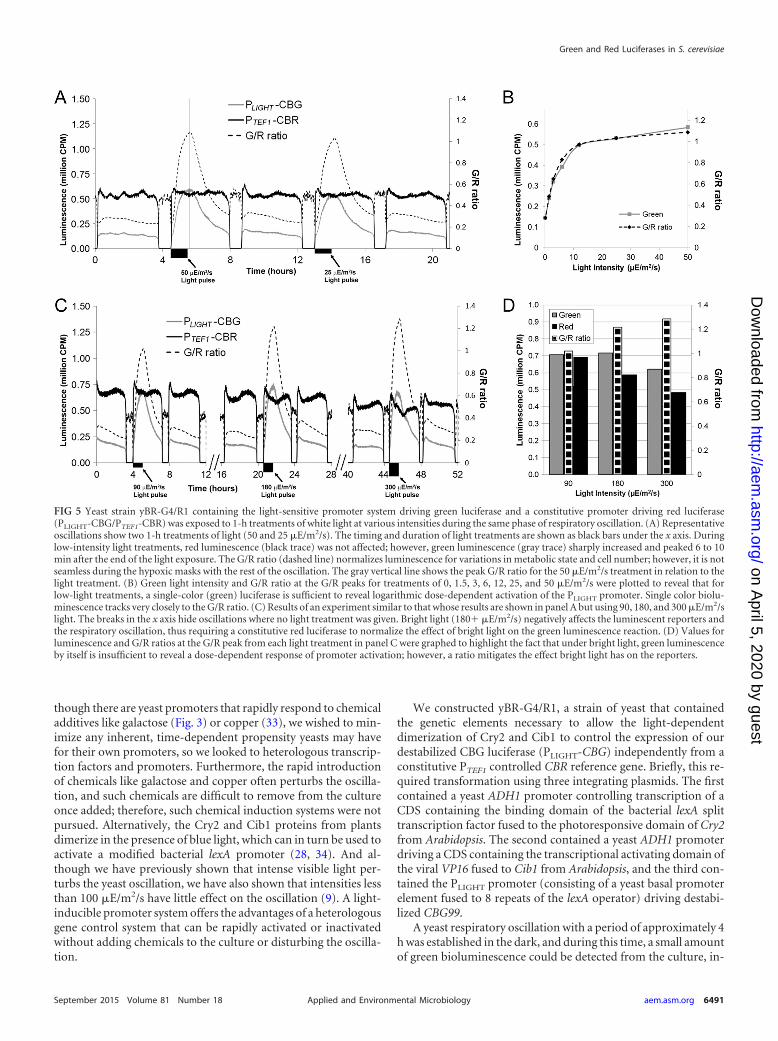
FIG 5 Yeast strain yBR-G4/R1 containing the light-sensitive promoter system driving green luciferase and a constitutive promoter driving red luciferase(PLIGHT-CBG/PTEF1-CBR) was exposed to 1-h treatments of white light at various intensities during the same phase of respiratory oscillation. (A) Representativeoscillations show two 1-h treatments of light (50 and 25 �E/m2/s). The timing and duration of light treatments are shown as black bars under the x axis. Duringlow-intensity light treatments, red luminescence (black trace) was not affected; however, green luminescence (gray trace) sharply increased and peaked 6 to 10min after the end of the light exposure. The G/R ratio (dashed line) normalizes luminescence for variations in metabolic state and cell number; however, it is notseamless during the hypoxic masks with the rest of the oscillation. The gray vertical line shows the peak G/R ratio for the 50 �E/m2/s treatment in relation to thelight treatment. (B) Green light intensity and G/R ratio at the G/R peaks for treatments of 0, 1.5, 3, 6, 12, 25, and 50 �E/m2/s were plotted to reveal that forlow-light treatments, a single-color (green) luciferase is sufficient to reveal logarithmic dose-dependent activation of the PLIGHT promoter. Single color biolu-minescence tracks very closely to the G/R ratio. (C) Results of an experiment similar to that whose results are shown in panel A but using 90, 180, and 300 �E/m2/slight. The breaks in the x axis hide oscillations where no light treatment was given. Bright light (180� �E/m2/s) negatively affects the luminescent reporters andthe respiratory oscillation, thus requiring a constitutive red luciferase to normalize the effect of bright light on the green luminescence reaction. (D) Values forluminescence and G/R ratios at the G/R peak from each light treatment in panel C were graphed to highlight the fact that under bright light, green luminescenceby itself is insufficient to reveal a dose-dependent response of promoter activation; however, a ratio mitigates the effect bright light has on the reporters.
Green and Red Luciferases in S. cerevisiae
September 2015 Volume 81 Number 18 aem.asm.org 6491Applied and Environmental Microbiology
on April 5, 2020 by guest
http://aem.asm
.org/D
ownloaded from

dicating that the light-sensitive promoter (PLIGHT) permitted asmall amount of “leaky” expression. However, a 1-h white lightpulse (50 �E/m2/s) initiated immediately following the end of oneof the hypoxic masks revealed that light could rapidly induce a risein PLIGHT-CBG’s green bioluminescence about 3-fold above basallevels, while no rise was detected in PTEF1-CBR’s red luminescence(Fig. 5A). The expression of CBG from the PLIGHT promoter wasdirectly controlled by the presence of light. Once the light pulsehad concluded, green bioluminescence began dropping about 10min after the cessation of light, with luminescence levels returningto baseline by the following oscillation. Testing subsequent oscil-lations in a similar manner, using half as much light each time,revealed a logarithmic dose response to light (Fig. 5B). At theselow intensities, light did not substantially affect the oscillation orthe output from the green reporter, and as a result, the dose re-sponse conveyed by a single luciferase tracked nicely with the G/Rratio. This was not the case, however, when the experiment wasrepeated using bright light.
The light-sensitive nature of the luciferin substrate (35), alongwith the destabilizing affect that bright light has on the oscillation(9), resulted in bright light (especially 300 �E/m2/s) hamperingemission of luminescence (Fig. 5C). The G/R ratio increased withincreasingly intense light treatments, even though overall lumi-nescence generally decreased when light intensity exceeded 100.Figure 5D shows the values of luminescence and their ratio whenthe G/R ratio peaks for each of the light treatments in Fig. 5C. Theeffect of bright light on a bioluminescent reaction, in addition toany gradual dimming that a culture may sustain over a long timecourse, highlights the importance for using a normalizing lucifer-ase in experiments like these.
To test the productivity of yeasts at different phases of theirrespiratory oscillation, we treated the yBR-G4/R1 strain from theprevious experiment with 1-h light pulses (90-�E/m2/s intensity)at different phases of their oscillation. Figure 6A shows a contin-uously recorded 54-h experiment where light pulses were deliv-ered at three different phases (early oscillation, mid-oscillation,
FIG 6 Light-induced green luciferase production is greater at some phases of the respiratory oscillation than other phases. (A) A 52�-h experiment whereoscillating yeast yBR-G4/R1 (containing PLIGHT-CBG and PTEF1-CBR) was exposed to 1-h treatments of 90 �E/m2/s of white light during different phases ofrespiratory oscillation. The duration and phase of light treatments are shown as black bars under the x axis. Red luminescence (black trace) was not affected bythe light treatments; however, green luminescence (gray trace) sharply increased during light treatments: more so when light treatments were administered earlyduring the hypoxic mask (at �21 and �30 h), less so when treatments were given midway into the oscillation (at �0.5 and �7 h), and least when treatments wereadministered late into the oscillation (at �41 and �49 h). The G/R ratio (dashed line) normalizes luminescence for variations in metabolic state and cell number.(Inset) Timing of the light treatments with regard to one representative oscillation. (B) The peak G/R ratios that resulted from the 6 light treatments (A) wereplotted in relationship to a representative respiratory oscillation with time units of degrees of period. Phase points 0 and 360 were defined as DO troughs. (C) Anexperiment similar to those whose results are shown in panels A and B was performed using yBR-G4/R4 (which contains PADH1-CBR as the red luciferase insteadof PTEF1-CBR). Peak G/R ratios that resulted from the 5 light treatments were plotted in relationship to a representative respiratory oscillation, with the time unitsbeing degrees of period. Phases similar to those shown in panel B were tested as well as additional ones.
Krishnamoorthy and Robertson
6492 aem.asm.org September 2015 Volume 81 Number 18Applied and Environmental Microbiology
on April 5, 2020 by guest
http://aem.asm
.org/D
ownloaded from
and late oscillation) in duplicate with at least one oscillation be-tween treatments. Early-phase light treatments can be seen in Fig.6A at �21 h and �30 h, mid-phase light treatments at �0.5 h and�7 h, and late-phase treatments at �41 h and �49 h. Althoughthe same amount of light was applied in each treatment, the timeat which the light was administered relative to the oscillation hada noticeable effect on the amount of green bioluminescence pro-duced, with no effect on the red bioluminescence. Figure 6B sum-marizes the results from Fig. 6A by plotting the peak G/R ratio thatoccurred from each light treatment in relationship to the phase ofa representative respiratory oscillation (light treatments wereplotted at the phase of mid-light pulse). Timing for each treatmentwas standardized to degrees of period, and phases 0° and 360° weredefined as dissolved oxygen’s trough.
Although the results from Fig. 6B suggested that yeasts aremore capable of producing a candidate heterologous protein (lu-ciferase) at early phases of their oscillation than later phases, andalthough we attempted to minimize endogenous yeast promoterbias by using heterologous transcription factors and promoters tocontrol green bioluminescence, we were concerned that the “con-stitutive” yeast ADH1 promoter that drove the light-sensitiveCry2 and Cib1 split transcription factor system (28) contributedto the phase-dependent results we observed in green biolumines-cence. Microarray data from others (7) visualized through scep-trans.org revealed that ADH1 expression is constitutive in manygrowth conditions; however, for yeast exhibiting respiratory oscil-lations during the yeast metabolic cycle, ADH1 has low-amplituderhythmic expression, which may have imparted a phase-depen-dent bias to our experiment. To mitigate any phase-dependentinfluence PADH1 may exert on the light-sensitive promoter system,we performed an experiment similar to that whose results areshown in Fig. 6A and B but instead used yBR-G4/R4, a yeast strainwith PADH1 driving CBR’s red luciferase expression instead ofPTEF1 (Fig. 6C). In this way, any inherent rhythmic influence ingreen bioluminescence that resulted from rhythmic production ofCry2 and Cib1 would be mitigated by analyzing the G/R ratio ofequally rhythmic red bioluminescence. By testing similar and ad-ditional phase points, our results (Fig. 6C) corroborate our previ-ous observation that light pulses delivered during (and shortlyafter) the high-oxygen-consumption phase of the oscillation re-sult in substantially more CBG production than later phases and,additionally, that any low-amplitude rhythmic PADH1 activity thatdrives the production of the light-detecting plant proteins doesnot substantially impact their effectiveness for revealing phase-dependent productivity of yeast.
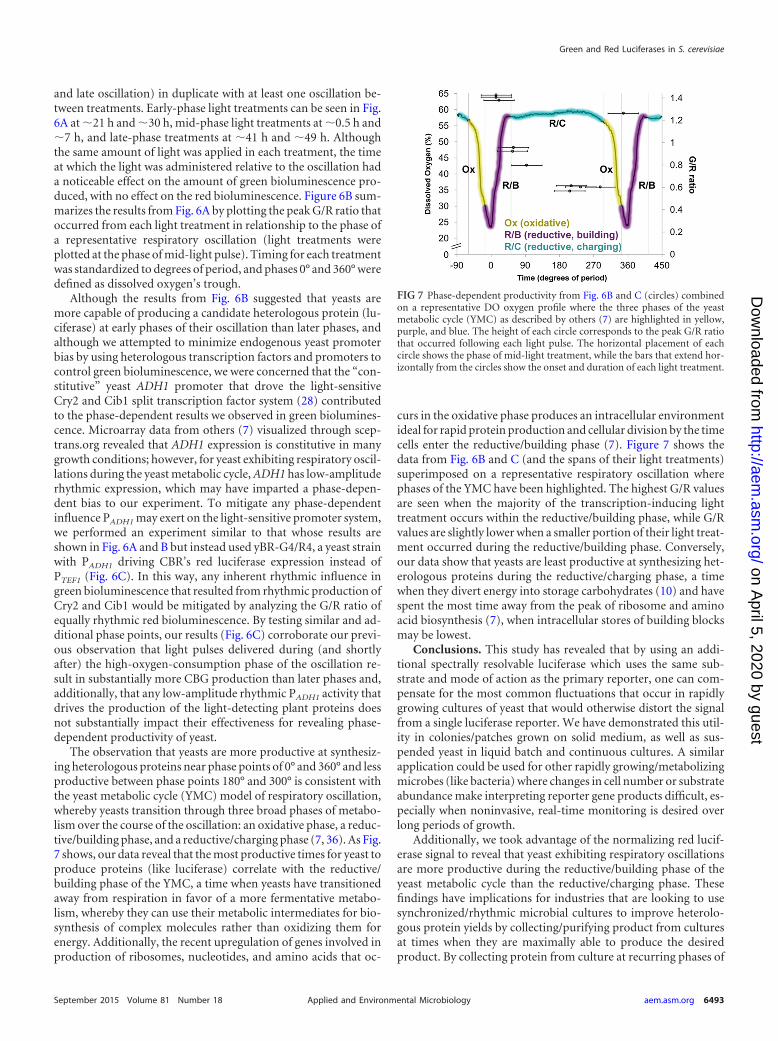
The observation that yeasts are more productive at synthesiz-ing heterologous proteins near phase points of 0° and 360° and lessproductive between phase points 180° and 300° is consistent withthe yeast metabolic cycle (YMC) model of respiratory oscillation,whereby yeasts transition through three broad phases of metabo-lism over the course of the oscillation: an oxidative phase, a reduc-tive/building phase, and a reductive/charging phase (7, 36). As Fig.7 shows, our data reveal that the most productive times for yeast toproduce proteins (like luciferase) correlate with the reductive/building phase of the YMC, a time when yeasts have transitionedaway from respiration in favor of a more fermentative metabo-lism, whereby they can use their metabolic intermediates for bio-synthesis of complex molecules rather than oxidizing them forenergy. Additionally, the recent upregulation of genes involved inproduction of ribosomes, nucleotides, and amino acids that oc-
curs in the oxidative phase produces an intracellular environmentideal for rapid protein production and cellular division by the timecells enter the reductive/building phase (7). Figure 7 shows thedata from Fig. 6B and C (and the spans of their light treatments)superimposed on a representative respiratory oscillation wherephases of the YMC have been highlighted. The highest G/R valuesare seen when the majority of the transcription-inducing lighttreatment occurs within the reductive/building phase, while G/Rvalues are slightly lower when a smaller portion of their light treat-ment occurred during the reductive/building phase. Conversely,our data show that yeasts are least productive at synthesizing het-erologous proteins during the reductive/charging phase, a timewhen they divert energy into storage carbohydrates (10) and havespent the most time away from the peak of ribosome and aminoacid biosynthesis (7), when intracellular stores of building blocksmay be lowest.
Conclusions. This study has revealed that by using an addi-tional spectrally resolvable luciferase which uses the same sub-strate and mode of action as the primary reporter, one can com-pensate for the most common fluctuations that occur in rapidlygrowing cultures of yeast that would otherwise distort the signalfrom a single luciferase reporter. We have demonstrated this util-ity in colonies/patches grown on solid medium, as well as sus-pended yeast in liquid batch and continuous cultures. A similarapplication could be used for other rapidly growing/metabolizingmicrobes (like bacteria) where changes in cell number or substrateabundance make interpreting reporter gene products difficult, es-pecially when noninvasive, real-time monitoring is desired overlong periods of growth.
Additionally, we took advantage of the normalizing red lucif-erase signal to reveal that yeast exhibiting respiratory oscillationsare more productive during the reductive/building phase of theyeast metabolic cycle than the reductive/charging phase. Thesefindings have implications for industries that are looking to usesynchronized/rhythmic microbial cultures to improve heterolo-gous protein yields by collecting/purifying product from culturesat times when they are maximally able to produce the desiredproduct. By collecting protein from culture at recurring phases of
FIG 7 Phase-dependent productivity from Fig. 6B and C (circles) combinedon a representative DO oxygen profile where the three phases of the yeastmetabolic cycle (YMC) as described by others (7) are highlighted in yellow,purple, and blue. The height of each circle corresponds to the peak G/R ratiothat occurred following each light pulse. The horizontal placement of eachcircle shows the phase of mid-light treatment, while the bars that extend hor-izontally from the circles show the onset and duration of each light treatment.
Green and Red Luciferases in S. cerevisiae
September 2015 Volume 81 Number 18 aem.asm.org 6493Applied and Environmental Microbiology
on April 5, 2020 by guest
http://aem.asm
.org/D
ownloaded from
an oscillation when the cells are most productive, one could com-bine the advantages of long-duration runs of continuous culturewith the bolus-like production of batch fermentations. The au-tonomously synchronizing yeast metabolic cycle that manifests astrong respiratory oscillation and partially synchronized cell divi-sion cycle may provide an efficient, low-maintenance oscillatingsystem from which heterologous proteins can be rhythmicallyproduced in continuous culture.
Although this work revealed an optimal time window duringwhich yeasts are most productive, continued research is requiredbefore oscillating protein production becomes practical in an in-dustrial setting. The biggest challenge involves how to efficientlyget protein out of the bioreactor’s culture without disturbing theoscillation. At the dilution rates used in this study, only about 8%of the culture exits the bioreactor each hour. So even though all ofthe cells in the culture may be synthesizing the heterologous pro-tein during a roughly 1-hour window of optimal productivity,only 8% of the culture could be innocuously harvested during thewindow (from the bioreactor’s effluent). However, after 12.5 cy-cles (roughly 2 days) of collecting cells from the effluent during therecurring hour-long windows, one would have collected the sameamount of cells as if the oscillation had been sacrificed during awindow to harvest all cells (even more cells if a greater dilutionrate is used). Therefore, there may be an achievable efficiency/yield advantage for harvesting from an oscillating system if thelabor and cost of maintaining an oscillation for 12.5 cycles are lessthan those needed to establish the oscillation. This is because every12.5 cycles (at a dilution rate of 8%/h), the culture would produceone bioreactor volume’s worth of cells from the optimal produc-tion window (while continuing to produce additional cycles aslong as the system runs). Further developments that allow one to“scrub” the oscillating reactor’s culture for secreted proteins mayprovide better methods to harvested periodically produced pro-tein from the entire culture without perturbing the oscillation,and easily detectable bioluminescent enzymes like those used inthis study may be good candidate proteins for this task.
Ancillary to our major objectives, our results show a rapid,dose-dependent response of the light-sensitive promoter systemin yeast to white light treatments. Although light as dim as �1�E/m2/s can stimulate yeast to produce luciferase, intensitiesgreater than 10 �E/m2/s provide substantially more productionbut do so with diminishing returns. Detectable increases in lumi-nescence above background can be seen in as little as 10 min afteronset of light treatment and similarly begin to fall about 10 minafter cessation of treatment. Together, these data demonstrate aseries of tools by which yeast gene expression can be rapidly andreversibly controlled, as well as continuously monitored. Theircombination can be used to dissect critical cellular events requiredfor the establishment and maintenance of the yeast respiratoryoscillation to reveal genetic underpinnings of the yeast metaboliccycle.
ACKNOWLEDGMENTS
We thank Peter Kötter (Goethe University, Frankfurt, Germany) for hisgift of yeast strain CEN.PK113-7D.
This work was supported in part by FRCAC and URECA programsfrom MTSU.
REFERENCES1. Tokunaga T, Iwai S, Gomi H, Kodama K, Ohtsuka E, Ikehara M,
Chisaka O, Matsubara K. 1985. Expression of a synthetic human growth
hormone gene in yeast. Gene 39:117–120. http://dx.doi.org/10.1016/0378-1119(85)90117-9.
2. Szczebara FM, Chandelier C, Villeret C, Masurel A, Bourot S, DuportC, Blanchard S, Groisillier A, Testet E, Costaglioli P, Cauet G, DegryseE, Balbuena D, Winter J, Achstetter T, Spagnoli R, Pompon D, DumasB. 2003. Total biosynthesis of hydrocortisone from a simple carbon sourcein yeast. Nat Biotechnol 21:143–149. http://dx.doi.org/10.1038/nbt775.
3. Thim L, Hansen MT, Norris K, Hoegh I, Boel E, Forstrom J, AmmererG, Fiil NP. 1986. Secretion and processing of insulin precursors in yeast.Proc Natl Acad Sci U S A 83:6766 – 6770. http://dx.doi.org/10.1073/pnas.83.18.6766.
4. McAleer WJ, Buynak EB, Maigetter RZ, Wampler DE, Miller WJ,Hilleman MR. 1984. Human hepatitis B vaccine from recombinant yeast.Nature 307:178 –180. http://dx.doi.org/10.1038/307178a0.
5. Hjortso MA. 1996. Population balance models of autonomous periodicdynamics in microbial cultures. Their use in process optimization. Can JChem Eng 74:612– 620.
6. Stowers CC, Robertson JB, Ban H, Tanner RD, Boczko EM. 2009.Periodic fermentor yield and enhanced product enrichment from auton-omous oscillations. Appl Biochem Biotechnol 156:59 –75. http://dx.doi.org/10.1007/s12010-008-8486-7.
7. Tu BP, Kudlicki A, Rowicka M, McKnight SL. 2005. Logic of the yeastmetabolic cycle: temporal compartmentalization of cellular processes.Science 310:1152–1158. http://dx.doi.org/10.1126/science.1120499.
8. Robertson JB, Stowers CC, Boczko E, Johnson CH. 2008. Real-timeluminescence monitoring of cell-cycle and respiratory oscillations inyeast. Proc Natl Acad Sci U S A 105:17988 –17993. http://dx.doi.org/10.1073/pnas.0809482105.
9. Robertson JB, Davis CR, Johnson CH. 2013. Visible light alters yeastmetabolic rhythms by inhibiting respiration. Proc Natl Acad Sci U S A110:21130 –21135. http://dx.doi.org/10.1073/pnas.1313369110.
10. Xu Z, Tsurugi K. 2006. A potential mechanism of energy-metabolismoscillation in an aerobic chemostat culture of the yeast Saccharomycescerevisiae. FEBS J 273:1696 –1709. http://dx.doi.org/10.1111/j.1742-4658.2006.05201.x.
11. Close DM, Patterson SS, Ripp S, Baek SJ, Sanseverino J, Sayler GS.2010. Autonomous bioluminescent expression of the bacterial luciferasegene cassette (lux) in a mammalian cell line. PLoS One 5:e12441. http://dx.doi.org/10.1371/journal.pone.0012441.
12. Sanseverino J, Gupta RK, Layton AC, Patterson SS, Ripp SA, SaidakL, Simpson ML, Schultz TW, Sayler GS. 2005. Use of Saccharomycescerevisiae BLYES expressing bacterial bioluminescence for rapid, sen-sitive detection of estrogenic compounds. Appl Environ Microbiol 71:4455– 4460. http://dx.doi.org/10.1128/AEM.71.8.4455-4460.2005.
13. Izumo M, Sato TR, Straume M, Johnson CH. 2006. Quantitative anal-yses of circadian gene expression in mammalian cell cultures. PLoS Com-put Biol 2:e136. http://dx.doi.org/10.1371/journal.pcbi.0020136.
14. Kim SB, Otani Y, Umezawa Y, Tao H. 2007. Bioluminescent indicatorfor determining protein-protein interactions using intramolecular com-plementation of split click beetle luciferase. Anal Chem 79:4820 – 4826.http://dx.doi.org/10.1021/ac0621571.
15. Lorenz WW, Cormier MJ, O’Kane DJ, Hua D, Escher AA, Szalay AA.1996. Expression of the Renilla reniformis luciferase gene in mammaliancells. J Biolumin Chemilumin 11:31–37.
16. Zhang Y, Xie Q, Robertson JB, Johnson CH. 2012. pHlash: a newgenetically encoded and ratiometric luminescence sensor of intracel-lular pH. PLoS One 7:e43072. http://dx.doi.org/10.1371/journal.pone.0043072.
17. Tannous BA, Kim DE, Fernandez JL, Weissleder R, Breakefield XO.2005. Codon-optimized Gaussia luciferase cDNA for mammalian geneexpression in culture and in vivo. Mol Ther 11:435– 443.
18. Greer LF, III, Szalay AA. 2002. Imaging of light emission from theexpression of luciferases in living cells and organisms: a review. Lumines-cence 17:43–74. http://dx.doi.org/10.1002/bio.676.
19. Hastings JW, Johnson CH. 2003. Bioluminescence and chemilumines-cence. Methods Enzymol 360:75–103. http://dx.doi.org/10.1016/S0076-6879(03)60107-2.
20. Kraxenberger T, Fried L, Behr S, Jung K. 2012. First insights into theunexplored two-component system YehU/YehT in Escherichia coli. J Bac-teriol 194:4272– 4284. http://dx.doi.org/10.1128/JB.00409-12.
21. McNabb DS, Reed R, Marciniak RA. 2005. Dual luciferase assay systemfor rapid assessment of gene expression in Saccharomyces cerevisiae. Eu-
Krishnamoorthy and Robertson
6494 aem.asm.org September 2015 Volume 81 Number 18Applied and Environmental Microbiology
on April 5, 2020 by guest
http://aem.asm
.org/D
ownloaded from
karyot Cell 4:1539 –1549. http://dx.doi.org/10.1128/EC.4.9.1539-1549.2005.
22. Behre G, Smith LT, Tenen DG. 1999. Use of a promoterless Renillaluciferase vector as an internal control plasmid for transient co-transfection assays of Ras-mediated transcription activation. Biotech-niques 26:24 –28.
23. Leskinen P, Virta M, Karp M. 2003. One-step measurement of fireflyluciferase activity in yeast. Yeast 20:1109 –1113. http://dx.doi.org/10.1002/yea.1024.
24. Sikorski RS, Hieter P. 1989. A system of shuttle vectors and yeast hoststrains designed for efficient manipulation of DNA in Saccharomycescerevisiae. Genetics 122:19 –27.
25. Janke C, Magiera MM, Rathfelder N, Taxis C, Reber S, Maekawa H,Moreno-Borchart A, Doenges G, Schwob E, Schiebel E, Knop M. 2004.A versatile toolbox for PCR-based tagging of yeast genes: new fluorescentproteins, more markers and promoter substitution cassettes. Yeast 21:947–962. http://dx.doi.org/10.1002/yea.1142.
26. Branchini BR, Ablamsky DM, Davis AL, Southworth TL, Butler B, FanF, Jathoul AP, Pule MA. 2010. Red-emitting luciferases for biolumines-cence reporter and imaging applications. Anal Biochem 396:290 –297.http://dx.doi.org/10.1016/j.ab.2009.09.009.
27. Nijkamp JF, van den Broek M, Datema E, de Kok S, Bosman L,Luttik MA, Daran-Lapujade P, Vongsangnak W, Nielsen J, HeijneWH, Klaassen P, Paddon CJ, Platt D, Kotter P, van Ham RC,Reinders MJ, Pronk JT, de Ridder D, Daran JM. 2012. De novosequencing, assembly and analysis of the genome of the laboratorystrain Saccharomyces cerevisiae CEN.PK113-7D, a model for modernindustrial biotechnology. Microb Cell Fact 11:36. http://dx.doi.org/10.1186/1475-2859-11-36.
28. Hughes RM, Bolger S, Tapadia H, Tucker CL. 2012. Light-mediatedcontrol of DNA transcription in yeast. Methods 58:385–391. http://dx.doi.org/10.1016/j.ymeth.2012.08.004.
29. Robertson JB, Johnson CH. 2011. Luminescence as a continuous real-time reporter of promoter activity in yeast undergoing respiratory oscil-lations or cell division rhythms. Methods Mol Biol 734:63–79. http://dx.doi.org/10.1007/978-1-61779-086-7_4.
30. Platt A, Reece RJ. 1998. The yeast galactose genetic switch is mediated bythe formation of a Gal4p-Gal80p-Gal3p complex. EMBO J 17:4086 – 4091.http://dx.doi.org/10.1093/emboj/17.14.4086.
31. Folkard S, Tucker P. 2003. Shift work, safety and productivity. OccupMed (Lond) 53:95–101. http://dx.doi.org/10.1093/occmed/kqg047.
32. Horne JA, Reyner LA. 1995. Sleep related vehicle accidents. BMJ 310:565–567. http://dx.doi.org/10.1136/bmj.310.6979.565.
33. Labbe S, Thiele DJ. 1999. Copper ion inducible and repressible promotersystems in yeast. Methods Enzymol 306:145–153. http://dx.doi.org/10.1016/S0076-6879(99)06010-3.
34. Kennedy MJ, Hughes RM, Peteya LA, Schwartz JW, Ehlers MD, TuckerCL. 2010. Rapid blue-light-mediated induction of protein interactions inliving cells. Nat Methods 7:973–975. http://dx.doi.org/10.1038/nmeth.1524.
35. White EH, McCapra F, Field GF. 1963. The structure and synthesis offirefly luciferin. J Am Chem Soc 85:337–343. http://dx.doi.org/10.1021/ja00886a019.
36. Kuang Z, Cai L, Zhang X, Ji H, Tu BP, Boeke JD. 2014. High-temporal-resolution view of transcription and chromatin states across distinct met-abolic states in budding yeast. Nat Struct Mol Biol 21:854 – 863. http://dx.doi.org/10.1038/nsmb.2881.
Green and Red Luciferases in S. cerevisiae
September 2015 Volume 81 Number 18 aem.asm.org 6495Applied and Environmental Microbiology
on April 5, 2020 by guest
http://aem.asm
.org/D
ownloaded from