Embed Size (px)
DESCRIPTION
From 22nd February to 6th March 2016, the DTM team identified and visited 107 potential displacement sites across the affected districts. Of these, 82 sites were hosting an estimated 5,727 households (26,272 people). For more information visit: http://www.globaldtm.info #GlobalDTM
Citation preview

DISPLACEMENT TRACKING MATRIX : NEPAL EARTHQUAKE 2015 DTM ROUND 6 : PUBLISHED 18 MARCH 2016
www.cccmcluster.org Page | 1 of 12 www.cccmnepal.org/DTM
HIGHLIGHTS
active sites hosting 20 or more households
assessed between 22 February and 06 March 2016
in 12 districts
people from 5,727 households were living in 82 sites hosting 20
or more households
new sites had become active after Round 5 assessments and 25 sites which were active
in Round 5 had been found closed in Round 6
DTM Round 6 From 22nd February to 6th March 2016, the DTM team identified and visited 107
potential displacement sites across the affected districts. Of these, 82 were active
and hosting 20 households or more in camp-like settings while remaining 25 were
found closed or below DTM criteria (20 or more households). These 82 sites were
hosting an estimated 5,727 households (26,272 people). Of this population,
13,847 were female, 12,425 male and 3,394 were children under 5 years old.
Since the last round of DTM, the number of IDPs has dropped by almost 35%, as
can be seen in the table below:
5,295
3,727 3,6863,167
2,852 2,804
1,6761,154
745 539 371 256
0
2,000
4,000
6,000
no. of sites no. of households no. of individuals
Round 2 409 21,711 117,700
Round 3 104 11,100 59,433
Round 4 120 11,703 58,689
Round 5 100 8,207 40,706
Round 6 82 5,727 26,272
WHAT IS DTM? This Displacement Tracking Matrix (DTM) report is produced by the
International Organization for Migration in its role as Camp Coordination
and Camp Management (CCCM) Cluster Lead Agency. The DTM monitors
the status and location of displaced populations in temporary
displacement sites, gathering information about humanitarian needs and
gaps of persons displaced by the earthquake. The data is collected
primarily through key informant interviews, observations, small group
discussions with both men, women and children.
For more information on DTM in Nepal, please visit:
http://www.cccmnepal.org/DTM
7
26,272
82
Number of IDPs living in sites with 20 households or more by districts:
No. of camps, households and persons for camps hosting 20 households or more in DTM Round 2, 3, 4, 5 and 6
Panipokhari - Dolakha

DISPLACEMENT TRACKING MATRIX : NEPAL EARTHQUAKE 2015 DTM ROUND 6 : PUBLISHED 18 MARCH 2016
www.cccmcluster.org Page | 2 of 12 www.cccmnepal.org/DTM

DISPLACEMENT TRACKING MATRIX : NEPAL EARTHQUAKE 2015 DTM ROUND 6 : PUBLISHED 18 MARCH 2016
www.cccmcluster.org Page | 3 of 12 www.cccmnepal.org/DTM
57
53%
4.6
47% Male : Female 53% <1 1-5
6-17 18-59 60+
0.7% Pregnant women over 18 0.1% Pregnant women under 18 3.1% Breastfeeding mothers 0.9% Persons with disabilities 0.4% Unaccompanied/separated children 1.0% Persons with chronic diseases 2.0% Single-female headed households 0.2% Single-child headed households 2.0% Elderly headed households
67.0% Marginalized caste/ethnicity
Average household size in Round 6 decreased from what was in Round 5 of the displacement sites population are female. 2% increase from 51% since the Round 5 people living in displacement sites had injury related disability as the result of the earthquake
DEMOGRAPHICS
SPECIAL NEEDS
Compared to DTM Round 5, there was a considerable decrease in total number of households living in displacement sites (from 8,207 to 5,727) while the number of individuals had also continued to decrease (from 40,706 to 26,272). This could mean that a number of households had either return to repair or rebuild their homes, or gone in search of livelihood opportunities elsewhere. It was also noted that there had been a slight decrease in proportion of male individuals living in displacement sites - from 49% in Round 5 to 47% in Round 6. It could be due to the reason that some of male members of household had gone back for repair and reconstruction of their damaged houses or for cultivation as agriculture was one the main source of livelihood.
Number of households living in displacement sites in DTM Round 3, 4, 5 and 6 by district
Sindhupalchok, Nuwakot, Dhading, and Dolakha have shown a significant decrease in the number of households living at displacement sites. This was due partly to return of people from some of large sites in Bhaktapur (Bhelukhel, Jana Sewa Sibir, Suryamadi), Dhading (Aalchi Danda, Damgade, Dhansakharka, Tatopani), Gorkha (Ghansu, Gupse Pakha, Mandre, Panglacho, RCB), Kathmandu (Chuchepati), Nuwakot (Kalanchi toll, Simbutar), Rasuwa (Bogetaar 2, Naubise), Sindhupalchok (20 Kilo, Banskharka-Selang-1, Barahbise, Bhedichaur, Bhimtar, Khadegaun-Selang-1, Lamoshangu, Sikre), Kavrepalanchok (Panchkhal-9-Aapghari).
05,00010,00015,00020,00025,000
020,00040,00060,00080,000
100,000120,000
R2 R3 R4 R5 R6no. of households no. of individuals
9%55%
23%9%
4%
10%50%
27%9%
4%
0 5,000 10,000 15,000 20,000
Makwanpur
Okhaldhunga
Ramechhap
Lalitpur
Dolakha
Rasuwa
Kavrepalanchok
Dhading
Gorkha
Sindhupalchok
Bhaktapur
Nuwakot
Kathmandu
Round 6 Round 5 Round 4 Round 3
DISPLACEMENT TRACKING MATRIX : NEPAL EARTHQUAKE 2015 DTM ROUND 6 : PUBLISHED 18 MARCH 2016
www.cccmcluster.org Page | 4 of 12 www.cccmnepal.org/DTM
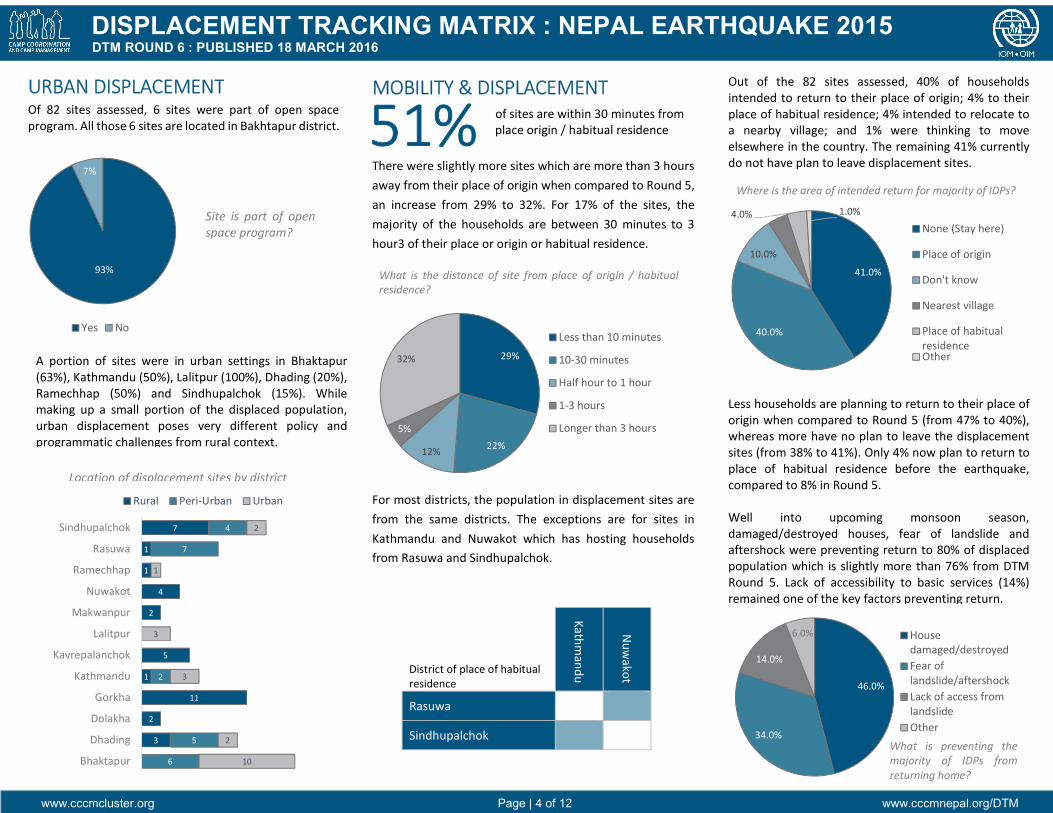
MOBILITY & DISPLACEMENT of sites are within 30 minutes from place origin / habitual residence
There were slightly more sites which are more than 3 hours away from their place of origin when compared to Round 5, an increase from 29% to 32%. For 17% of the sites, the majority of the households are between 30 minutes to 3 hour3 of their place or origin or habitual residence.
URBAN DISPLACEMENT Of 82 sites assessed, 6 sites were part of open space program. All those 6 sites are located in Bakhtapur district. 51%
District of place of habitual residence
Kathmandu
Nuwakot
Rasuwa Sindhupalchok
Out of the 82 sites assessed, 40% of households intended to return to their place of origin; 4% to their place of habitual residence; 4% intended to relocate to a nearby village; and 1% were thinking to move elsewhere in the country. The remaining 41% currently do not have plan to leave displacement sites.
For most districts, the population in displacement sites are from the same districts. The exceptions are for sites in Kathmandu and Nuwakot which has hosting households from Rasuwa and Sindhupalchok.
A portion of sites were in urban settings in Bhaktapur (63%), Kathmandu (50%), Lalitpur (100%), Dhading (20%), Ramechhap (50%) and Sindhupalchok (15%). While making up a small portion of the displaced population, urban displacement poses very different policy and programmatic challenges from rural context.
Site is part of open space program?
What is the distance of site from place of origin / habitual residence?
Where is the area of intended return for majority of IDPs?
Less households are planning to return to their place of origin when compared to Round 5 (from 47% to 40%), whereas more have no plan to leave the displacement sites (from 38% to 41%). Only 4% now plan to return to place of habitual residence before the earthquake, compared to 8% in Round 5. Well into upcoming monsoon season, damaged/destroyed houses, fear of landslide and aftershock were preventing return to 80% of displaced population which is slightly more than 76% from DTM Round 5. Lack of accessibility to basic services (14%) remained one of the key factors preventing return.
What is preventing the majority of IDPs from returning home?
Location of displacement sites by district
32
111
5
24
11
7
65
2
74
102
3
3
1
2
BhaktapurDhadingDolakhaGorkha
KathmanduKavrepalanchok
LalitpurMakwanpur
NuwakotRamechhap
RasuwaSindhupalchok
Rural Peri-Urban Urban
29%
22%12%5%
32%Less than 10 minutes10-30 minutesHalf hour to 1 hour1-3 hoursLonger than 3 hours
41.0%
40.0%
10.0%
4.0%4.0% 1.0%None (Stay here)Place of originDon't knowNearest villagePlace of habitualresidenceOther
46.0%
34.0%
14.0%6.0% Housedamaged/destroyed
Fear oflandslide/aftershockLack of access fromlandslideOther
93%
7%
Yes No

DISPLACEMENT TRACKING MATRIX : NEPAL EARTHQUAKE 2015 DTM ROUND 6 : PUBLISHED 18 MARCH 2016
www.cccmcluster.org Page | 5 of 12 www.cccmnepal.org/DTM
SITE MANAGEMENT Ownership: Of the 82 sites assessed, 42 were on private land while 40 were on public/government land. Across the districts, however, the proportion of private and public land use varied widely. Bhaktapur, Dhading, Ramecchap, Nuwakot, and Sindhupalchok saw significant number of public or government lands being used as displacement sites than other districts.
Site Management Agency (SMA) is an external body that works to support the site committee, coordinate and advocate for assistance and protection in sites, as well as return or alternative durable solutions for the displaced population. At the time of assessment, the following agencies were carrying out site management activities: ACTED, Dwarika hotel, IOM, NCV, and People in Need.
All sites in Kathmandu, Dhading and Dolakha have site committees. The majority of sites in Bhaktapur (88%), Sindhupalchok (92%), Rasuwa (75%), Nuwakot (75%) and Gorkha (91%) had site committees whereas none in Ramecchap, Lalitpur, Makwanpur and Kavrepalanchok at the time of assessment.
CCCM cluster continues to prioritise the following districts for camp management and coordination, based on the population size, growth pattern, and the number of sites within the district: Bhaktapur, Dhading, Gorkha, Kathmandu, Rasuwa, Nuwakot and Sindhupalchok. Site Committees are composed of representatives of sites residents. In the 82 sites assessed, 63 sites were found to have site committees. Of the 63 site committees identified, 10% had no female members (down from 11% in Round 5), and 46% had less than 25% female members.
Is there a site committee (by district)?
Is there a site management agency?
The identified SMAs were active in seven districts; Sindhupalchok, Lalitpur, Kathmandu, Gorkha, Dolakha, Dhading, and Bakhtapur. Is there a site management agency (by district)?
Number of sites and land ownership type (by district)
Is there a site committee? What is the proportion of women in the site committee?
55
29
43
2
2
55
115
22
21
22
23
8
BhaktapurDhadingDolakhaGorkha
KathmanduKavrepalanchok
LalitpurMakwanpur
NuwakotRamechhap
RasuwaSindhupalchok
PrivatePublic/Government
77%
23%
Yes No
46%43%
2%10%
Less than 25% 25% to 75%More than 75% None
1410
210
6
3
612
2
1
53
21
22
1
BhaktapurDhadingDolakhaGorkha
KathmanduKavrepalanchok
LalitpurMakwanpur
NuwakotRamechhap
RasuwaSindhupalchok
YesNo
73%
27%
Yes No
1610
211
6
3
12
5
24
28
1
BhaktapurDhadingDolakhaGorkha
KathmanduKavrepalanchok
LalitpurMakwanpur
NuwakotRamechhap
RasuwaSindhupalchok
YesNo

DISPLACEMENT TRACKING MATRIX : NEPAL EARTHQUAKE 2015 DTM ROUND 6 : PUBLISHED 18 MARCH 2016
www.cccmcluster.org Page | 6 of 12 www.cccmnepal.org/DTM
SHELTER & NFIs For 75% of the sites, the most common type of shelter was temporary shelters using corrugated iron roofing sheets (CGIs), a marked increase from 55% in the last assessment. Most households of 16% sites were living in makeshift/tarpaulin shelters, while tents were most common in 8% of the sites (predominantly in Bakhtapur, Dhading and Gorkha).
What percentage of households on sites have access to safe cooking facilities?
In 43% of the sites assessed, there was no access to electricity. In 44% of the sites, more than 75% of the households had access to electricity, compared to 29% in Round 5. There was generally more access to electricity for people living in displacement sites when compared to Round 5.
1st 2nd 3rd CGIs 34% 6% 11% Fire wood 19% 10% 3% Cooking gas 9% 20% 1% Support in reconstruction 8% 6% 2% Water supply 7% 3% 4% Tools 1% 6% 10% Kitchen sets 4% 6% 3% Solar light 3% 1% 1% Electric supply 2% 4% 1% Other ** 5% 6% 5%
Non-food items needs CGIs, cooking gas/fire wood, and tools remained the first, second and third priority needs for NFIs. In 82 sites assessed, 51% people needed CGIs and 42% for cooking gas/fire wood whereas 17% were for tools. It reflects the continuing basic lifesaving and shelter needs that were likely exacerbated by insufficient supply throughout the affected districts specifically during the winter season. Though the increased number of temporary shelters made with CGIs in displacement sites (from 55% to 76% when compared to Round 5) had likely contributed to the satisfied shelter conditions yet there was still need of CGIs for better shelter conditions before the upcoming monsoon season. The table below shows the first, second and third priority needs for NFIs.
There was no access to safe cooking facilities in 25% of sites and only in 17% of the sites had more than 75% of the households with access to safe cooking facilities. This was partly due to the worsening weather which was driving many households to cook inside their tents and make shift shelters.
In many cases, the lack of upgrade into temporary shelter indicated restrictions placed on the households by land owners rather than signifying lack of resources.
What percentage of households on sites have access to electricity?
What is the most common type of shelter?
What is the most common type of shelter (by district)?
What are the top 3 priority NFIs need? (Excluding ‘None’ category which accounted for 8%, 32% and 59% of 1st, 2nd and 3rd priority need respectively)
** Of the ‘others’ category, the answers included blankets, bedding/floor mat, improved stoves, tarpaulin, mosquito net, hygiene kits and school supplies.
76% 16% 8%
0% 20% 40% 60% 80% 100%Temporary shelter (CGIs) Makeshift Tent
%75%70
%100%91
%33%100
%67%100%100%100
%88%54
%10
%67
%33
%13%46
%25%20
%9
BhaktapurDhadingDolakhaGorkha
KathmanduKavrepalanchok
LalitpurMakwanpur
NuwakotRamechhap
RasuwaSindhupalchok
Temporary shelter Makeshift Tent
17%
22%
6%29%
25%Less than 25%25% to 50%51% to 75%More than 75%None
4% 9%
44%
43%
Less than 25%25% to 75%More than 75%None

DISPLACEMENT TRACKING MATRIX : NEPAL EARTHQUAKE 2015 DTM ROUND 6 : PUBLISHED 18 MARCH 2016
www.cccmcluster.org Page | 7 of 12 www.cccmnepal.org/DTM
What is the main source of drinking water?
In 65% of the displacement sites assessed, there was no common practice of treating drinking water before consumption.
Large number of sites in Dolakha (50%), Ramechhap (50%), and Sindhupalchok (54%) were showing evidence of open defecation.
Main source of water Piped water supply was the main source of drinking water method for the displaced people. 82% of IDPs had access to the piped water supply which was 61% in Round 5. Other sources of drinking water were water trucking (6%), spring/river (5%), protected wells (4%), unprotected wells (2%), and hand pumps (1%).
What is the condition of most latrines on site?
WASH Access to water In 80% of sites, water was either accessible on-site or within 20 minutes walking distance. Among sites with complete data, 41% had access to 15 litres or more of water per person/day (SPHERE Standard). The number of sites with access to less than 5 litres per person per day has increased from 1% in Round 5 to 10% in this Round.
Latrines Where functioning toilets were available on-site, there was an average of one toilet for 27 IDPs, which qualifies the SPHERE Standard (1.2 toilet to 50 persons). In addition, 61% of the sites reported IDPs using toilets were not hygienically good. In 3% of sites, the latrines were not usable and 2% of the sites had no latrines.
Is drinking water being treated before consumption?
How far is the location of main water source (walking, one way)?
What is the average amount of water use per person per day?
Number of toilets in need of decommissioning/desludging Waste disposal The main method for waste disposal in sites were burning (44%) and use of garbage pits (27%) followed by Municipal collection (16%). For 13% of the sites, there was no system for disposal of waste and garbage was thrown into nearby water ways and hills.
What is the main garbage / waste disposal method? In 60% of the displacement sites assessed, there was interruption in water supply to the sites since the last wound of DTM. This interruption had particularly been seen on sites in Bhaktapur, Dhading, Gorkha, Lalitpur, Makwanpur, Nuwakot, Rasuwa and Sindhupalchok.
Of 82 sites assessed, 22 sites had segregated toilets for males and females. At 15 sites these segregated toilets were completely separate while at 7 sites segregated toilets were found next to each other. There were 36 toilets at 16 sites which were found in need of decommissioning or desludging due to being non-functioning or unhygienic to use. These sites are mainly in Dhading, Dolakha, Gorkha, Bhaktapur, Rasuwa, and Sindhupalchok.
62% 18% 20%
On-site Off-site (Less than 20 mins)Off-site (More than 20 mins)
10% 27% 22% 41%Less than 5 liters 5-10 liters11-15 liters More than 15 liters
44%
27%
16%
13% BurningGarbage pitMunicipal collectionNo System
82%
6%5%4%2% 1% Piped water supply
Water truckSpring/riverProtected WellUnprotected WellHand pumps
65%23%
5% 5%2%
No treatmentFilteredBoiledChlorinatedSODIS
61% 34% 3%2%
Not so good (not hygienic) Good (Hygienic)Non usable No toilets
05
10
Number of sites having toilets in need ofdecommissioning/desludgingNumber of toilets in need ofdecommissioning/desludging

DISPLACEMENT TRACKING MATRIX : NEPAL EARTHQUAKE 2015 DTM ROUND 6 : PUBLISHED 18 MARCH 2016
www.cccmcluster.org Page | 8 of 12 www.cccmnepal.org/DTM
HEALTH Of 82 sites assessed, 56% sites reported having access to functioning health facilities close by (either onsite or within 30 minute walk one way). Of these 57% of the services were provided by government, 29% by local clinics and 14% by local and international NGOs. 30% of the sites reported that the nearest health facilities lacked adequate drug supply.
EDUCATION In all displacement sites assessed, children had access to formal education, in addition, 7% stated that they had access to non-formal education.
Has screening for malnutrition been conducted in the area in the last 4 weeks?
How far is the closest functioning health facilities/services (walking, one way)?
What is the most common source of obtaining food?
Who is the main provider of health facilities/services? More than 75% of girls and boys in displacement sites were attending schools in 83% and 84% respectively.
In total, 42 sites reported cough and cold as the most prevalent health problem and 15 sites reported having at least one TB case known to the community.
FOOD & NUTRITION 92% of the sites assessed, food were bought by families’ own resources, an increase from 79% in Round 5.
Food distribution was the main source of food for residents in 21% of the displacement sites in Round 5 which has decreased in Round 6 to 4%. This distribution was identified in some sites of Kathmandu and Sindhupalchok. Meanwhile, IDPs in 15% of sites reported that screening for malnutrition has been conducted in the area in the past 4 weeks which was at 41% of sites in Round 5. 21% sites assessed mentioned that there was availability of supplementary feeding for pregnant & lactating mothers.
What is the distance to nearest formal education facility? What is the distance to nearest non-formal education facility?
What percentage of girls are attending school? What percentage of boys are attending school?
The most common reason for both girls and boys not attending school is school fees and associated costs.
What are the most common reasons girls/boys are not attending school?
27 out of 82 sites were receiving some form of psychosocial assistance. Providers of psychosocial support in sites were IOM, People in Need, Focus Nepal, ASIA Foundation, and Handicap International.
Number of sites having cases tuberculosis among IDPs
8% 48% 34% 10%On-site Off-site (Less than 30 minutes)Off-site (1 - 2 hours) Off-site (More than 2 hours)
57% 28% 15%
Government Local Clinic/med practitioners NGO/iNGO
3 3 3
1 1 1 1 1
00.5
11.5
22.5
33.5
%100%70
%100%100
%67%100%100%100
%50%50
%88%92
%50%50
%12
%30
%33
%8
BhaktapurDhadingDolakhaGorkha
KathmanduKavrepalan…
LalitpurMakwanpur
NuwakotRamechhap
RasuwaSindhupalc…
Own cash Own cultivatedBorrowed cash Food assistance
No, 85%
Yes, 15%
Off-site (More than 20 minutes), 41%Off-site (Less than 20 minutes), 39%
On-site (Less than 20 minutes), 20%On-site (Less than 20 minutes), 83%
On-site (More than 20 minutes), 17%
83%
5% 11%1%More than 75%
51% to 75%25% to 50%Less than 25% 84%
4% 11%1%
2%6%
2%1%
5%4%
1%
Distance to schoolFees or costs
Distance to schoolDisabilities Boys
Girls

DISPLACEMENT TRACKING MATRIX : NEPAL EARTHQUAKE 2015 DTM ROUND 6 : PUBLISHED 18 MARCH 2016
www.cccmcluster.org Page | 9 of 12 www.cccmnepal.org/DTM
PROTECTION 82Security: Of the 82 site assessed, 27 reported that security is provided on site by the following actors:
Reporting & Assistance In Kavrepalanchok, Bhaktapur, Kathmandu, Rasuwa, Dhading, Makwanpur, Ramechhap and Sindhupalchok some knowledge gaps remained among those living in displacement sites on how to report incidents of abuse or exploitation.
Do toilets have light?
Who provides the main security in the site?
Is there lighting in the majority of communal point? (WASH, facilities, public spaces, etc.)
What is the most common type of security incidents reported?
The most common type of security incidents reported was alcohol/drug related in 46% of the sites, while other security incidents were friction/tension within households, friction with host community and theft. 77% of sites stated that no security incidents have been reported.
Services & Infrastructure 16% of sites assessed have designated safe/recreational places for children. 11% sites have designated safe/social places for women. In 66% of the sites assessed, there were either no or inadequate lighting available in communal areas such as around WASH facilities and public spaces.
Majority of latrines/bathrooms have no lighting (86%), and 31% had no lock from inside.
Do you know who (or where) to report (or seek assistance) when you or your family face any abuse or exploitation?
Of 64 sites that replied ‘Yes’ to the above questions, 24 sites said a person who reported abuse or exploitation had access to support services.
Would a person who reports abuse or exploitation have access to support services?
On 78% of sites assessed, people knew who (or where) to report (or seek assistance) when they or their family face any abuse or exploitation in this area. 84% sites didn't have designated safe/recreational places for children whereas designated safe/social places for women couldn't be found at 89% sites. In 73% of the sites assessed, there were no gender segregated latrines.
Are there functioning disaggregated toilets on-site for female? Do toilets have locks?
48% 48% 4%
Self organized Police None
46%
23%
23%8% Alcohol/drug-related disturbance
Friction/tension within householdsTheftFriction with host community
Yes, 27%
No, 73%
7
24
3
2
64
91
23
21
11
14
9
82
21
11
5
BhaktapurDhadingDolakhaGorkha
KathmanduKavrepalanch…
LalitpurMakwanpur
NuwakotRamechhap
RasuwaSindhupalchok
Yes, there is lighting andit is adequateYes, there is lighting butit is NOT adequateNo lighting
Yes, 69% No, 31%
Yes, 14% No, 86%
139
211
3
31
41
512
31
35
1
13
1
BhaktapurDhadingDolakhaGorkha
KathmanduKavrepalanchok
LalitpurMakwanpur
NuwakotRamechhap
RasuwaSindhupalchok
YesNo
110
111
23
1
12
11
2
1
3
1
51
4
45
13
BhaktapurDhadingDolakhaGorkha
KathmanduKavrepalanchok
LalitpurMakwanpur
NuwakotRamechhap
RasuwaSindhupalchok
UnknownYesNo

DISPLACEMENT TRACKING MATRIX : NEPAL EARTHQUAKE 2015 DTM ROUND 6 : PUBLISHED 18 MARCH 2016
www.cccmcluster.org Page | 10 of 12 www.cccmnepal.org/DTM
Sindhupalchok
Rasuwa
Ramechhap
Nuwakot
Makwanpur
Lalitpur
Kavrepalanchok
Kathmandu
Gorkha
Dolakha
Dhading
Bhaktapur
Sindhupalchok
Rasuwa
Ramechhap
Nuwakot
Makwanpur
Lalitpur
Kavrepalanchok
Kathmandu
Gorkha
Dolakha
Dhading
Bhaktapur
LIVELIHOOD Agriculture was the most common form of livelihood (84%) before the earthquake for those living in displacement sites. Though for 33% living in sites it had not been possible to continue after the earthquake yet 51% of the displaced population still depended on agriculture. Daily labour (27%) was the most common coping mechanism following the earthquake, a large increase from 7% before the earthquake. For 15% of the sites, most of the households had not been able to find alternative means of income generation.
What is the occupation/trade of majority of households living on site before (left) and after (right) the earthquake?
In majority of sites, women were interested in weaving/knitting (44%) and running store/small businesses (15%) for income generating activities. For men the majority were interested in running store/small businesses (35%), construction works (22%), and agriculture (16%).
What income generating activities would men and women be interested in doing?
Agriculture/Livestock Daily wage laborer Trade Craftsmen Other None
44%
15% 15%
6% 5% 5% 4%0%
3% 3%0%
16%
35%
0%5% 6% 8%
22%
3% 5%
Men
COMMUNICATION For female living in displacement sites, friends and families were the most common mean of getting information (46%), followed by radio and newspaper (16%) and mobile phone (16%). For male residents, the most common source of information were radio and newspaper (26%), friends and families (23%), and mobile phone (18%).
Where do most male (left) and female (right) residences get their information from?
Families & friends Radio/Newspaper Mobile phone Local leaderSocial Media Site management Authorities
The majority of communities in displacement sites were requesting information on
recovery plans (35%), access to services (11%), future of the site (11%) and other relief
assistance (10%). 90% of sites assessed stated they were aware that assistance did not
be exchanged for anything.
What is the main topic on which the community is requesting information on?
Is everyone aware that assistance do not need to be exchanged for anything?
35%
11%11%
10%
9%
7%
7%5%5% Recovery plans
Access to servicesSite lifetimeRelief assistanceShelterOrigin situationWork opportunitiesDistributionNone
90%
10%
Yes
No

DISPLACEMENT TRACKING MATRIX : NEPAL EARTHQUAKE 2015 DTM ROUND 6 : PUBLISHED 18 MARCH 2016
www.cccmcluster.org Page | 11 of 12 www.cccmnepal.org/DTM
Of 82 sites assessed, more than 75% households in 74 sites received winterization items support from various humanitarian partners.
WINTERIZATION ASSISTANCE In 79 of 82 sites visited, displaced people got cash assistance in terms of winterization support either from the government or humanitarian partners.
What was household % that received cash assistance in terms of winterization support either from the government and humanitarian partners?
In 76 sites cash assistance came from the government while in 24 sites humanitarian partners distributed cash assistance.
Did households receive cash assistance from government?
What was the primary use of cash assistance?
Winterization kit support was given by ACF, ACTED, Action-Aid, Asia Foundation, Care Nepal, Focus Nepal, GOAL, IOM, Khwopa En College, Lumanti, Manekor, Nepal Mandal, Nepal Pariwartan, Oxfam, PIN, Plan Nepal, Red Cross, Samaritan Purse, SSICDC and UNICEF. Blankets (72%), floor foam mats (43%), winter clothes (33%), mattress/beds (26%) and stoves (22%) remain the core items in winterization kits which were distributed to displaced people at 74 sites. In 91% of sites which got winterization kits, distribution was on-site, 6% had distribution off-site but within 1-hour travel distance from the site whereas people of 3% sites had to travel more than 1 hour to receive assistance.
1510
211
4
3
41
711
1
11
1
15
1
2
1
BhaktapurDhadingDolakhaGorkha
KathmanduKavrepalanchok
LalitpurMakwanpur
NuwakotRamechhap
RasuwaSindhupalchok
More than 75%25%-50%51%-75%No cash assistance
Did households receive cash assistance from non-government humanitarian partners?
93%
7%YesNo
40%60%
YesNo
In 17% sites assessed, households received more than NPR 25,000 as cash assistance from either the government or humanitarian partners while in 77% sites the cash assistance per household remained between NPR 10,000-25,000. There was no cash assistance from any actor in 4% of sites assessed in Round 6. 64% of households who got cash assistance primarily used it to buy clothes and blankets in the winter season, 16% for repairing their damaged houses, 12% for buying food and 8% for miscellaneous daily expenses.
%77
%17
%100
%10
%96
%64
%55
%100
%100
%74
%100
%15
%8
%61
%11
%15
%8%75
%6
%11
%23%4
%24%45
%100
BhaktapurDhadingDolakhaGorkha
KathmanduKavrepalanchok
LalitpurMakwanpur
NuwakotRamechhap
RasuwaSindhupalchok
Buy clothes, blankets, etc. Repair damaged housesBuy food Daily household misc. needs
122
33
16
810
1111
1
14
2
RamechhapDolakha
MakwanpurLalitpur
NuwakotKavrepalanchok
KathmanduRasuwa
DhadingGorkha
Sindhupalchok
More than 75%
No winterizationassistance
What was household % at site that received winterization kit assistance?

DISPLACEMENT TRACKING MATRIX : NEPAL EARTHQUAKE 2015 DTM ROUND 6 : PUBLISHED 18 MARCH 2016
www.cccmcluster.org Page | 12 of 12 www.cccmnepal.org/DTM
DTM METHODOLOGY This Displacement Tracking Matrix (DTM) report is produced by the International Organization for Migration in its role as CCCM Cluster Lead Agency. Data was gathered by field staff and analysed by a team in Kathmandu. Prior to data collection, the DTM team contacts local authorities, humanitarian partners, and key informants to gather information about sites to be targeted for each round of the DTM. Criteria for conducting on-site assessments are as follow:
1. 20 households or more – the number of households living on site exceed 20. 2. Higher density tents/shelters in camp-like setting – excluding villages that have scattered
shelter within. 3. Cross-district displacement – Groups of IDPs that have been displaced from another district,
even if they do not comply to having 20 households or more 4. IDPs living on site – accessing basic services and infrastructure on site.
• Accessing toilets/latrines on site, or using a nearby toilet that is NOT their own. • Possession of their belongings – look for things like cooking pots and stoves. • Clear indications that they are cooking on site (gas cylinders, communal cooking area).
The data is collected primarily through key informant interviews, observations, small group discussions with both men, women and children. For every site, the team completes a standard assessment form (available on link below). The field teams approach each individual camp in a targeted manner, so the method of data collection can vary depending on the situation of the specific site.
AVAILABLE RESOURCES This report is a short synthesis of top line figures and basic analysis of the DTM database. Round 6 data upon which this report is based, as well as data from previous rounds, are publicly available at: http://www.cccmnepal.org/DTM (note: sensitive data on protection at site level is available through protection cluster) The web page also provide links to the following:
• A Site Profile document giving all basic information of all sites assessed in the DTM is available in the form of a Site Profile PDF from
• A google map showing the location and basic demographics information of all displacement sites in Nepal is available at http://cccmnepal.org/DTMSitesMap
For more information and queries, please contact: [email protected]
Chuchepati - Kathmandu


![NEPAL EARTHQUAKE - DTM assessed Displaced ... Kathmandu valley DTM VDC Analysis Snapshot [Converted] Created Date 5/9/2015 10:46:03 PM](https://img.dokumen.tips/doc/110x75/5adc9f4a7f8b9aa5088bb89d/nepal-earthquake-dtm-assessed-displaced-kathmandu-valley-dtm-vdc-analysis.jpg)