Embed Size (px)
Citation preview

DSV Panalpina Annual Report 20 20
Keeping supply chains flowing

Tel. +45 43 20 30 40Email: [email protected] no. 58 23 35 28
We provide and manage supply chain solutions for thousands of companies every day – from the small family-run business to the large global corporation. Our reach is global, yet our presence is local and close to our customers.
More than 56,000 employees in more than 80 countries work passionately to deliver great customer experiences and high-quality services.
Read more at www.dsv.com
About DSV Panalpina Group
Hovedgaden 6302640 HedehuseneDenmark
Annual Report for the year ended 31 December 2020 – 44th financial yearPublished 10 February 2021
2 DSV Panalpina Annual Report 2020 About DSV Panalpina Group

ContentsManagement’s commentary
Financial statementsConsolidated financial statements Income statement . . . . . . . . . . . . . . . . . . . . . . . . . . . . . . . . . 42Statement of comprehensive income . . . . . . . . . . . . . . . . 42Cash flow statement. . . . . . . . . . . . . . . . . . . . . . . . . . . . . . . 43Balance sheet . . . . . . . . . . . . . . . . . . . . . . . . . . . . . . . . . . . . . 44Statement of changes in equity . . . . . . . . . . . . . . . . . . . . . 45Notes to the consolidated financial statements . . . . . . . . 46Definition of key figures and ratios. . . . . . . . . . . . . . . . . . . 79Group company overview . . . . . . . . . . . . . . . . . . . . . . . . . . 80
StatementsManagement’s statement . . . . . . . . . . . . . . . . . . . . . . . . . . 85Independent auditor’s report. . . . . . . . . . . . . . . . . . . . . . . . 86
Parent Company financial statementsParent Company financial statements . . . . . . . . . . . . . . . . 89
IntroductionLetter from CEO . . . . . . . . . . . . . . . . . . . . . . . . . . . . . . . . . . . 4Highlights 2020. . . . . . . . . . . . . . . . . . . . . . . . . . . . . . . . . . . . 6Five-year overview. . . . . . . . . . . . . . . . . . . . . . . . . . . . . . . . . 8
Strategy and financial targetsIndustry and markets . . . . . . . . . . . . . . . . . . . . . . . . . . . . . . . 9Our business model. . . . . . . . . . . . . . . . . . . . . . . . . . . . . . . . 10 Vision and strategy . . . . . . . . . . . . . . . . . . . . . . . . . . . . . . . . 11Technology and digitalisation . . . . . . . . . . . . . . . . . . . . . . . 14Outlook 2021 and long-term financial targets . . . . . . . . 15Capital structure and allocation . . . . . . . . . . . . . . . . . . . . . 16
Financial and non-financial performanceFinancial review . . . . . . . . . . . . . . . . . . . . . . . . . . . . . . . . . . 17Non-financial review. . . . . . . . . . . . . . . . . . . . . . . . . . . . . . . 20Air & Sea . . . . . . . . . . . . . . . . . . . . . . . . . . . . . . . . . . . . . . . . . 22Road . . . . . . . . . . . . . . . . . . . . . . . . . . . . . . . . . . . . . . . . . . . . 25Solutions . . . . . . . . . . . . . . . . . . . . . . . . . . . . . . . . . . . . . . . . . 27
Corporate governance and shareholder informationRisk management . . . . . . . . . . . . . . . . . . . . . . . . . . . . . . . . . 29Corporate governance . . . . . . . . . . . . . . . . . . . . . . . . . . . . . 35Board of Directors and Executive Board . . . . . . . . . . . . . . 37Shareholder information. . . . . . . . . . . . . . . . . . . . . . . . . . . . 38
Other informationQuarterly financial highlights . . . . . . . . . . . . . . . . . . . . . . . . 40
Page 12Corporate responsibility is now an integrated part of our vision and strategy
Page 10Our business model
Page 15Our outlook for 2021
and new 2025 financial targets
3 DSV Panalpina Annual Report 2020 Contents

Despite the disrupting COVID-19 pandemic, 2020 was another strong year for DSV Panalpina. Our staff have delivered an extra-ordinary effort to keep supply chains flowing and have achieved excellent results. We have now completed the integration of Panalpina and have set new ambitious long-term targets, both for sustainability and financial performance.
Letter from CEO
Keeping supply chains flowing
4 DSV Panalpina Annual Report 2020 Introduction

In just15 months, we succeeded in integrating Panalpina, a company half the size of DSV.
47.3% growth in EBIT before special items For the Group, we achieved revenue of DKK 115,932 million (+26.0%), gross profit of DKK 28,534 million (+23.5%) and operating profit before special items of DKK 9,520 million (+47.3%). Adjusted free cash flow came to DKK 8,746 mil-lion, and we distributed DKK 5,619 million to shareholders in 2020 via share buybacks and dividend. The DSV Panalpina share price rose 33% in 2020. 2020 was a tough and unpredictable year, and it is a remark-able achievement that the financial results for 2020 are bet-ter than we anticipated before COVID-19 hit us. Across all our divisions and markets, we have delivered excellent results and, throughout the year, DSV Panalpina has played an impor-tant role in global society; when the world closed due to the pandemic, our employees found transport solutions to secur-ing, e.g., food, household products and personal protection equipment on behalf of our customers. Despite grounded passenger aircrafts and disruption across all transport modes, we managed to keep supply chains flowing. Panalpina successfully integrated In just 15 months, we succeeded in integrating Panalpina, a company half the size of DSV and the biggest acquisition in the history of our company. It takes a lot of effort and at-tention to carry out a comprehensive integration in such short time, but the good results of joining forces are already showing. The skills, knowledge and capacity that Panalpina has brought to DSV have made us a stronger company and have clearly created value for our shareholders.
With the addition of Panalpina, the Group is now among the leading companies in the global transport and logistics indus-try, but our market share is less than 5% due to a very frag-mented industry. Our acquisition ambition therefore remains a core part of our growth strategy along with our ambition to
grow organically. In 2020, we announced two smaller bolt-on acquisitions, Prime Cargo and Globeflight, but large acquisi-tions remain our primary focus. New ambitious sustainability targets Earlier this year, we unveiled our ambitious targets for reducing greenhouse gas emissions. The combined DSV and Panalpina emissions amounted to 16 million tonnes CO2 in 2019, of which the largest part was related to freight transport. We are commit-ted to the Science Based Targets initiative, which enables us to credibly demonstrate that we do our fair share to pave the road for a greener future. Therefore, by 2030, we must reduce our carbon footprint by at least 30% from a 2019 base year.
In 2020, we already saw a reduction; however, this was mainly due to lower volumes following COVID-19. The long-term target can only be achieved if we work closely with our customers and suppliers and form partnerships with different stakeholders in and outside our industry. In 2020, we have partnered with other large companies to develop sustainable fuels, and in the coming years we will increase our focus on developing sustainable logistics services.
We went through a challenging 2020 without reducing focus on other corporate responsibility activities. We remain com-mitted to the UN Global Compact, we support the Sustainable Development Goals, and we focus strongly on both business ethics, responsible procurement and, not least, a safe and se-cure working environment for our employees. The latter has been especially important in 2020, where the safety of em-ployees has been a top priority during the pandemic.
Technology driving us forward In DSV Panalpina, we take part in pushing the industry for-ward towards a more digitalised future. Technology helps us support our customers effectively and professionally with
better products and value-added services. It is also an impor-tant tool for our employees in securing our company’s pro-ductivity and efficiency.
In 2020, we have taken important steps forward in several areas: We have introduced new, advanced track-and-trace services creating visibility in supply chains. We have implemented new robotic storage and retrieval systems in our warehouses that are particularly suited for e-commerce operations. And we have tested our first autonomous drones, which help us manage inventory in warehouses. New ambitious financial targets We have already signed off on our old financial targets. We met our goals, ahead of schedule, and I am happy that we can now announce a new set of ambitious targets.
We are a top performer in our industry, but we see further potential to improve – driven by growth, scale, technology and our strong organisation. By 2025, we target a conversion ratio of 40.0% or higher for the Group (see more details about the targets on page 15).
We owe our employees a special thank you for their tireless and impressive effort in very difficult circumstances throughout the year. The COVID-19 crisis has shown us that freight forwarding is still a people’s business, and the results that DSV Panalpina has achieved in 2020 are due to our people. 2021 will be another unpredictable and challenging year, but with our strong and flexible business model and the right people on board, we will make sure to keep our customers’ supply chains flowing.
Jens Bjørn Andersen, CEO
5 DSV Panalpina Annual Report 2020 Introduction

Highlights 2020
Group results
EBIT before special items Slightly above our outlook for 2020, operating profit before special items came to DKK 9,520 million. Despite challenging market conditions and COVID-19, we delivered strong results.
Adjusted free cash flow For 2020, adjusted free cash flow came to DKK 8,746 million. The positive devel-opment is mainly due to the higher EBIT before special items.
ROIC before taxThe return on invested capital came to 14.3% in 2020 against 13.4% for 2019. The increase can mainly be attributed to the growth in EBIT before special items.
2020 Actual
2020 Actual
2020 Actual
2020 Outlook
2019 Actual
2019 Actual
2019 Actual
9,2509,520
6,6548,746
3,678
14.3%13.4%
Gross profitDKK 28,534 million
+23.5%Air & Sea
59%
Air & Sea
73%
Road
22%
Road
15%
Solutions
19%
Solutions
12%
EBIT before special itemsDKK 9,520 million
+47.3%
6 DSV Panalpina Annual Report 2020 Introduction

EMEAGross profit: DKK 17,148 million
60% of total
EBIT before special items: DKK 4,484 million
47% of total
APACGross profit: DKK 5,455 million
19% of total
EBIT before special items: DKK 2,859 million
30% of total
AMERICASGross profit: DKK 5,931 million
21% of total
EBIT before special items: DKK 2,177 million
23% of total
Air & SeaThe growth in EBIT before special items was primarily a result of the successful integration of Panalpina and strong cost management. Freight volumes were negatively impacted by the COVID-19 crisis, however, this was compensated by strong gross profit per shipment, especially in air freight.
EBIT before special items: DKK 7,026 million
RoadThe Road market was negatively impacted by the COVID-19 crisis during 2020. The market recovered gradually in the second half of 2020, especially the do-mestic distribution activities picked up, whereas activity on most international transports remained low. The growth in EBIT before special items was driven by strong cost management (COVID-19 cost savings) and improved productivity.
EBIT before special items: DKK 1,390 million
SolutionsThe Solutions market gradually recovered in the second half of the year, and especially e-commerce activities performed. The growth in EBIT before special items was driven by cost discipline, improved productivity, continued consoli-dation of warehouse capacity and the successful integration of Panalpina.
EBIT before special items: DKK 1,161 million
Global footprint
+18.8%+12.3%+61.0%
7 DSV Panalpina Annual Report 2020 Introduction

Five-year overviewRatios 2020 2019 2018* 2017* 2016*
Financial ratios (%)Gross margin 24.6 25.1 22.1 22.2 23.4Operating margin 8.2 7.0 6.9 6.5 5.1Conversion ratio 33.4 28.0 31.2 29.4 21.9Effective tax rate 24.3 25.8 23.3 20.7 26.7
ROIC before tax 14.3 13.4 26.7 23.4 21.5Return on equity 8.8 11.6 27.2 21.1 13.2Solvency ratio 49.2 50.7 37.5 38.6 33.2Gearing ratio 1.3 1.8 0.9 1.0 2.0
Share ratiosEarnings per share of DKK 1 18.7 18.7 22.0 16.0 9.0Diluted adjusted earnings per share of DKK 1 26.5 22.1 22.1 18.4 13.4Number of shares issued (‘000) 230,000 235,000 188,000 190,000 190,000Share price at year-end (DKK) 1,020.0 767.8 429.2 488.6 314.2Proposed dividend per share (DKK) 4.00 2.50 2.25 2.00 1.80
Financials 2020 2019 2018* 2017* 2016*
Results (DKKm)Revenue 115,932 94,701 79,053 74,901 67,747Gross profit 28,534 23,754 17,489 16,605 15,838Operating profit before amortisation, depreciation (EBITDA) before special items 13,559 10,292 6,212 5,664 4,250Operating profit (EBIT) before special items 9,520 6,654 5,450 4,878 3,475Special items, costs 2,164 800 - 525 1,002Net financial expenses 1,729 858 249 556 184Profit for the year 4,258 3,706 3,988 3,012 1,678Adjusted earnings 6,146 4,456 4,093 3,484 2,506
Cash flow (DKKm)Operating activities 10,276 6,879 4,301 4,664 1,273Investing activities (556) 1,371 (444) (325) (4,953)Free cash flow 9,720 8,250 3,857 4,339 (3,680)Adjusted free cash flow 8,746 3,678 3,916 4,835 1,838Share buyback (5,031) (4,888) (4,161) (1,559) -Dividends distributed (588) (423) (380) (342) (327)Cash flow for the year 2,721 766 (143) (376) (3,284)
Financial position (DKKm)DSV Panalpina A/S shareholders’ share of equity 47,385 49,430 14,561 14,835 13,416Non-controlling interests (88) (111) (29) (26) (38)Balance sheet total 96,250 97,557 38,812 38,388 40,367Net working capital 2,701 3,125 1,767 1,410 1,809Net interest-bearing debt (NIBD) 16,970 18,355 5,831 5,575 8,299Invested capital 64,285 68,595 20,381 20,391 21,336Gross investment in property, plant and equipment 1,121 1,000 720 620 728
Environmental and social data 2020 2019 2018 2017 2016
CO2e Scope 3 – Air (‘000 tonnes) 6,825 4,631 3,291 3,208 3,002CO2e Scope 3 – Sea (‘000 tonnes) 1,366 1,553 820 855 867CO2e Scope 3 – Road (‘000 tonnes) 4,233 3,682 3,899 3,864 3,569Occupational accidents 6.7 5.0 4.6 4.2 4.6Sickness absence (days per FTE) 6.4 6.0 5.9 4.7 5.1Gender diversity (female/male) 38/62 39/61 38/62 39/61 38/62Employee turnover ratio 32.5 23.6 20.1 18.0 26.6Employees 56,621 61,216 47,394 45,636 44,779
* The implementation of IFRS 16 Leases as from 1 January 2019 had a material impact on the financial statements and key ratios for 2019 and onwards. Comparative figures for 2016-2018 have not been restated.
For a definition of key figures and ratios, please refer to page 79.
8 DSV Panalpina Annual Report 2020 Introduction

Market shares
■ DHL Logistics■ Kuehne + Nagel ■ DB Schenker
Logistics
■ Nippon Express■ DSV Panalpina■ Top 6-20■ Others, estimated
Source: Journal of Commerceand DSV Panalpina estimates.
66%
16%
5%4%3%3%3%
Global top five freight forwarders and market share based on 2019 revenue.
The competitive landscapeDSV Panalpina is among the top five players in the global freight for-warding market and has an estimated market share of less than 5%. To-gether, the top 20 players have an estimated market share of 30-40% of the global freight forwarding market. The remaining market consists of a long tail of regional and local freight forwarders.
The fragmented industry and the standardised services mean that the pricing environment is competitive. Due to scale benefits, dense global networks and superior service levels, the largest freight forwarders are in a good position to gain market share from the smaller players, and we expect this trend to prevail in the coming years.
GDP sets the pace for market growth In 2020, the transport and logistics markets were negatively impacted by COVID-19, and we expect that 2021 will be characterised by rela-tively high growth rates as the global economy gradually recovers. In re-cent years, growth in global trade has been in parallel with GDP growth, and we expect this correlation to continue. Air freight is the most volatile transport mode, and changes in economic growth or events like the COVID-19 crisis impact both demand and the available capacity.
Growth rates vary regionally, and several trends are impacting global trade flows; the economic growth in Asia is generally higher than that of the mature markets in Europe and North America. However, the historically- known export markets in Asia are gradually also becoming import markets as economies are shifting towards consumption. After years of outsourcing of production to China, we have in recent years seen a shift to other countries, mainly in East Asia. This outsourcing shift can create more robust supply chain opportunities by reducing dependency on single countries and single suppliers, but it also increases complexity, as more countries are involved. This creates business opportunities for freight forwarders, e.g. in relation to purchase order management and custom clearance.
Industry and markets
Political trends impacting trade flowsIn recent years, we have seen a political trend towards increased protec-tionism. The trade tensions between the US and China and the Brexit process are examples of such trends which may cause changes to supply chains if tariffs are implemented. However, we expect that the benefits of global supply chains will outweigh disadvantages of potential protec-tionist measures, and we can assist companies prepare for and adapt to the changes. International trade and transport of goods are impacted by other regulatory changes, and we see a steady increase in trade restric-tions, trade embargoes and security measures. This means that a strong compliance setup is an important part of the value proposition of a freight forwarder.
New distribution channelsThe growth in e-commerce has impacted consumer goods and last-mile distribution significantly, and this trend has accelerated following COVID-19. While distribution to physical shops has declined, the activity in distri-bution centres and last-mile distribution has increased. As freight for-warders, we must adapt to these changes and ensure that we can offer the relevant services to customers. This has created a new market and growth opportunities as we provide e-fulfilment to customers in our warehouses.
New market entrantsWhen digital start-ups emerge in our industry or if established carriers offer traditional freight forwarding services, we are potentially faced with new competition. Given our strong road map for continuous de-velopment of our services and digital platforms, we – along with other established freight forwarders with years of experience and pre-existing global networks – are in a strong position to hold on to and expand our market position.
9 DSV Panalpina Annual Report 2020 Strategy and financial targets

Our business model
TransportSubcontracted
From shipper
Our key resourcesPeople — IT systems — Industry know-how — Standardised global workflows — Carrier relations — Global network with local presence
Freight forwarding services Logistics and distribution
Shipment booking — Pick-up — Warehouse — Documentation & customs clearance Cargo consolidation — Purchase order management
Cross-dock terminal — Insurance
Warehousing — Picking/packing — Cross-dock terminal — DeconsolidationLabelling, configuration, testing — Distribution — Documentation & customs clearanceE-commerce fulfilment — Carbon emission reports — Supply chain innovation — 4PL
To consignee
DSV Panalpina is one of the leading players in the global freight forward-ing market. Through our network in more than 80 countries, we offer services within air and sea freight, overland transport (road and rail) as well as contract logistics (solutions).
We support our customers’ entire supply chain – all the way from shipper to consignee. We organise the transportation of goods through our sub-contractors (container carriers, airlines, road hauliers and railway opera-tors). Our business model is asset-light, enabling us to scale activities to match changes in demand in the market and to choose the suppliers with the most appropriate service offering, e.g. related to sustainability.
Adding value to complex supply chainsIn addition to organising transports, we offer our customers a full range of
freight forwarding, logistics and distribution services. These value- added services, among others, include digital tools for purchase order manage-ment, booking and track-and-trace, as well as cargo consolidation, insur-ance, customs clearance and pick-and-pack.
Our workflows are highly digitalised and our IT systems are integrated with both customers and suppliers. This enables us to monitor the entire supply chain and provide supply chain visibility services and propose opti-misation initiatives. The increasing complexity and time sensitivity of global supply chains have added Lead Logistics (4PL) and Supply Chain Innovation to our value proposition in recent years. Together with the in-creasing focus on sustainable logistics, this illustrates that the market and our services continuously develop.
10 DSV Panalpina Annual Report 2020 Strategy and financial targets

Customers
We want to be a leading global supplier, fulfilling customers’ needs for transport and logistics services, targeting extensive growth and to be among the most profitable in our industry.
Vision and strategy
Our four strategic focus areas
People
Growth
Operational excellence
Our vision is based on four strategic focus areas and has remained un-changed for years. Still, we must adapt to a dynamic market, and each element is evaluated and fine-tuned when relevant. Corporate Responsi-bility is a good example of an area which has become more deeply em-bedded in the strategic planning in recent years. We have been working with Corporate Responsibility for many years, but the topic is moving up on the agenda, driven by our own ambitions and influenced by important stakeholders: including customers, employees, investors and authorities.
Customers at the centreWe offer our customers global and competitive transport and logistics ser-vices of a consistently high quality that support their entire supply chain.
We have a strong foothold among both the large, global customers and in the SME segment (small and mid-sized customers). To cater for different needs and requirements, we offer industry-specific solutions for customers within Automotive, Industrial, Retail & Fashion, Healthcare, Technology and Renewable Energy.
We want to be a leading global supplier, fulfilling customers’ needs for transport and logistics services, targeting extensive growth and to be among the most profitable in our industry.
We continually work with customers to find optimal solutions to their logistics challenges – and we proactively manage relations through our global customer success programme.
Above-market growth We pursue profitable growth balanced between a solid, above-market growth and an active acquisition approach.
Measured by revenue and profit margins, we rank among the largest and most profitable players in the industry. This gives us a strong market posi-tion and a foundation for continuously growing our business above market level in all markets where we operate.
The Group has a strong track record of company integrations – with the recent acquisitions of UTi Worldwide and Panalpina as good examples.
Our main acquisition targets are large, global freight forwarders, prefera-bly with high exposure to the air and sea market.
Operational excellence: transparency, productivity, scalabilityFreight forwarding is a service industry characterised by high volumes and a low profit per shipment. Operational excellence is essential to achieving profitability above market level, and transparency, productivity and scala-bility are the key components.
We create transparency by measuring productivity and financial perfor-mance across the organisation to ensure that Management has the best possible basis for decision making.
Standardised workflows and efficient systems support productivity and ensure a high quality of the services we provide to customers.
Our international and regional shared service centres serve as admini-strative competency hubs, servicing our global organisation and driving up productivity.
11 DSV Panalpina Annual Report 2020 Strategy and financial targets

Based on the principle of one main system per business area, we operate a consolidated, standardised and scalable IT landscape. We work systematically to ensure high data quality and data secu-rity. When available, we prefer standard, off-the-shelf IT systems.
DSV Property drives an ongoing consolidation of our physical infrastructure. Based on road maps for each country, we de-velop large and efficient warehouses, terminals and offices, replacing smaller and outdated facilities. In line with our as-set-light business model, developed properties are sold to external investors and leased back.
People at the heart of operationsWhile we focus on IT and business process optimisation, our people are at the heart of our operations. We strive to ensure that they have the tools, training and conditions to perform their best. The COVID-19 crisis has demonstrated that the transport markets can quickly be disrupted and only the skills of an experienced freight forwarder can help solving the issues.
Our Group has experienced significant changes and growth over the years, but we still aim to maintain a flat organisation with a high degree of local empowerment. We want our staff to be close to the local market and to the customers, and we encourage decisions which are based on sound business acu-men and supported by solid data. We work as one global com-pany, we centralise back-office functions and we use stand-ardised, global IT systems and workflows – but we always strive to maintain the local ownership and responsibility.
Recruitment and retention of talent remain key to the Group’s success. We offer clear career-advancing opportunities to tal-ented employees. Global HR initiatives, e.g. DSV Academy, e-learning, talent management and global mobility, are all in place to attract, motivate and retain the best people.
Corporate responsibility We are committed to a responsible and sustainable way for-ward for transport and logistics. This is the overarching state-ment and ambition for our responsibility work, and this goes hand in hand with the vision and strategy described in the pre-vious section. Our impact on the environment, our ethical be-haviour and the working environment we offer to our employ-ees are just some of the areas which are becoming increasingly important. Moreover, we can only create value for our stake-holders if we set a high standard and ambitious targets.
The combination of DSV and Panalpina has created a group with a strong profile within corporate responsibility. Based on the principles in the UN Global Compact, DSV had a strong founda-tion and governance in place, whereas Panalpina had been more active in entering into partnerships and communicating about corporate responsibility. With the combined strengths of the two legacy companies, we intend to lead the way in our industry, and in 2020 we updated our corporate responsibility strategy.
Corporate responsibility is anchored with the Board of Direc-tors and Executive Management, but the plans can only be brought to life and targets achieved if the initiatives are driven and implemented by our central responsibility team and the local management teams across the organisation.
Our responsibility focus areas Our corporate responsibility strategy focuses on five areas, which are all of high importance for the Group: business ethics, people, environment, community engagement and responsible procurement. Within each of these areas, we identify the most material topics and set targets for improvement. We measure the performance systematically and work with both global and local initiatives to ensure that we achieve the targets.
We are a signatory to the United Nations Global Compact, and we have pledged to adhere to the Compact’s ten principles. We have also been supporting the UN’s Sustainable Develop-ment Goals since 2015, and we have identified and work sys-tematically with nine SDGs within the areas we affect the most through our business.
Ambitious environmental targets DSV Panalpina is committed to the Science Based Targets initi-ative, and in 2020 we were one of the first logistics compa-nies to set approved targets: Using 2019 as baseline, we aim to reduce carbon emissions from buildings and company cars (scope 1 and 2) by 40% and to reduce emissions from freight transports (scope 3) by 30% by 2030.
To achieve these ambitious targets, we need to collaborate with customers, suppliers and other key stakeholders. Via our CO2 reporting platform, our customers can receive reports on greenhouse gas emissions which will enable us to identify areas for optimisation to ensure greener supply chains. De veloping sustainable logistics services is a focus area for us – we wish to offer a range of standardised services, which give our custom-ers a clear choice when it comes to optimising supply chains, also considering the environmental impact of the transport.
Partnerships with other stakeholders in our industry are key to achieve progress on the green agenda. During 2020, we have joined two partnerships with the purpose of exploring renew-able hydrogen as an alternative to fossil-based fuels, which will be one of the key focus areas in the decarbonation of the transportation industry.
In 2020, we established a Sustainability Board, chaired by our CEO. The board sets the direction for our activities and ap-proves global initiatives related to environmental sustainability.
DSV Panalpina can only create
value for the stakeholders, if we set a high standard and
ambitious targets.
12 DSV Panalpina Annual Report 2020 Strategy and financial targets

Diversity and inclusionWe believe that having a diverse workforce where employees can realise their potential based on their different individual backgrounds is a significant business advantage. A diverse workforce situated in an inclusive culture fosters dynamic workplaces and ultimately better business decisions.
We recognise and support equal human rights and we are against discrimination, differential treatment and harassment of any kind. This and more is reflected in our Diversity and Inclusion Policy, which was updated in 2020.
Health and safetyWe have more than 56,000 employees across the world per-forming a large variety of jobs – from office workers to ware-house operatives and truck drivers. Regardless of the job function, we are committed to providing a safe and healthy workplace worldwide and to nurture and develop our employ-ees through mentorship, motivation and talent management. By setting and implementing health and safety standards, our employees and subcontractors are informed about hazards and required safety measures in their line of work.
Throughout the COVID-19 crisis, our priority has been the health and safety of our people, who have worked hard to keep global supply chains flowing. Due to lockdowns, a large part of our staff were working from home during the year. However, not all logistics can be handled from home, and for those who had to come to work we have prioritised a safe working environment by providing personal protection equip-ment and providing guidelines for all employees. In 2020, we also implemented a new QHSE (Quality, Health, Safety, Environment) programme and moved forward on sev-eral other related initiatives. We continue to work systemati-
cally with our targets; to keep occupational accidents to a minimum, to reduce loss of working days and to completely avoid fatalities.
In this report, you will find a review of our performance within Corporate Responsibility during 2020 on page 20. More infor-mation can be found in our 2020 Corporate Responsibility Report.
We are committed to a responsible and sustainable way forward for
transport and logistics.
Corporate responsibility Focus areas
EnvironmentWe have a responsibility
to drive our own operations and the industry towards minimising the environ-
mental impact of transport and logistics services.
Business ethicsWe do business with integ-
rity, respecting different cultures and the dignity and rights of individuals
in all countries.
People We provide safe and
healthy workplaces, and we strive to attract, motivate and retain talented people by offering responsibility,
empowerment and growth opportunities.
Community engagement
We engage with and support communities in which we operate, and we use our expertise to support people in need.
Responsible procurement
We ensure our suppliers meet our high standards, service quality and price
requirements and demonstrate an under-
standing of our Corporate Responsibility objectives.
13 DSV Panalpina Annual Report 2020 Strategy and financial targets

Market trends driving technology Technological development is a major driver for change in our industry, and we work with strategic road maps for each area of our operations to ensure that we stay on top of the development.
Customer integrations and real-time supply chain visibilityDigitalisation impacts our interaction with customers in several ways; this includes all steps of a shipment from quote, purchase order, booking, shipment tracking and status alerts to the final billing and KPI report to the customer.
myDSV is our digital freight forwarding platform, and we continue to de-velop and add more customers to the platform. For large customers, we also work extensively with classic EDI integrations and more advanced API integrations.
Through our DSV Mobility Driver App and Last Mile Delivery App, we en-sure that critical data are captured and the shipment can be tracked by our customers. DSV ETA is the latest addition to myDSV; through the use of GPS tracking and traffic data, customers can see the estimated time of arrival and receive alerts about delays.
Warehouse automationWarehouse processes can be automated and optimised in several ways. Growth in e-commerce and increase in number of transactions lead to an increase in demand for efficient warehouse solutions. It is key for us that automation solutions are scalable and can be implemented across several warehouses.
Technology and digitalisation
We have successfully implemented automated storage/retrieval systems and automated guided vehicles in several warehouses. This enables fast order fulfilment, improved productivity and efficient utilisation of ware-house spaces. Furthermore, in 2020 we have successfully tested drone technology for inventory management.
New and modern warehouses are a prerequisite for large-scale automa-tion; the layout of the warehouse, quality of floors, fire safety measures and energy efficiency are examples of areas where DSV Property plays an important role, when we implement new technology.
A flexible IT landscape for the futureTo support the requirements of a dynamic market and to fulfil our strategy, we operate a robust and flexible IT landscape. We are now implementing a hybrid computing platform to manage both on-premise and cloud-based
infrastructure – operational systems, data and analytics, customer inte-grations and engagement services. The new architecture governance model enables us to combine our global network and physical infrastruc-ture with a high level of digitalisation.
DSV Innovation HubIn close cooperation with the operational units and the IT department, our Innovation Hub monitors and prioritises relevant trends and technologies. Several technologies are already in use, while others are tested or merely tracked.
Self-driving vehicles on public roads and blockchain are examples of technologies which do not yet have a significant commercial impact on our industry. We continue to monitor these and other technologies and if, at some point, we see a good business case, we will be ready to act.
DSV technology trend radar – selected examples
Alternative fuels 3D printing
Machine Learning (AI)
Automated storage systems
Visibility platform/ Live
tracking
Hybrid computing platform
Automated guided vehicles
Self-driving vehicles
Drones
Augmented reality2020
Blockchain
5G network
AdoptingTestingTracking/ Assessing
14 DSV Panalpina Annual Report 2020 Strategy and financial targets

Outlook 2021 and long-term financial targetsFor 2021, we expect EBIT before special items of DKK 10,500-11,500 million, and we announce new ambitious 5-year targets.
Outlook 2021 (DKKm)2020actual
Outlook 2021
Operating profit (EBIT) before special items 9,520 10,500-11,500Effective tax rate 24.3% 23.0%
2025 targets (%) 2020actual
2025 targets
DSV Panalpina Group
Conversion ratio 33.4 >40.0ROIC (before tax) 14.3 >20.0
Divisional targets for conversion ratio
Air & Sea 41.6 >47.5Road 22.6 >30.0Solutions 21.6 >30.0
Market assumptions The 2021 outlook assumes stable development in the mar-kets in which we operate and a continued gradual recovery of the global economy after the COVID-19 crisis. The OECD and IMF project global economic growth around 5% in 2021, with lower growth rates in Europe and USA and higher growth in emerging economies, mainly in Asia. We expect growth rates in the transport markets to be in line with underlying eco-nomic growth. Our ambition is to gain market share in all the markets in which we operate.
With growth in transport volumes and our continuous focus on operational excellence, we see opportunities to improve productivity. Our IT systems, infrastructure and back-office functions are scalable, providing operational leverage oppor-tunities in all three divisions.
The Air & Sea division is expected to benefit from a strength-ened market position after the Panalpina integration, and from further optimisation of work flows and improved utilisation of IT systems in the period.
The Road division is expected to continue the positive momen tum from 2020, and the Road Way Forward project is expec ted to gradually improve productivity during the period.
The Solutions division will continue the work on automation, consolidation of existing infrastructure and addition of new warehouse capacity at key logistics locations.
Forward-looking statements
This annual report includes forward-looking state-ments on various matters, such as expected earnings and future strategies and expansion plans.
Such statements are uncer-tain and involve various risks, because many fac-tors, some of which are beyond our control, may result in actual develop-ments differing considera-bly from the expectations set out in the 2020 Annual Report.
Such factors include, but are not limited to, general economic and business conditions, exchange rate and interest rate fluctua-tions, the demand for our services, competition in the transport sector, opera-tional problems in one or more of DSV Panalpina’s subsidiaries and uncertainty in connection with the ac-quisition and divestment of enterprises.
Impact from integration synergies and COVID-19 cost savingsSynergies and savings were achieved faster than expected in 2020, and the remaining full-year impact in 2021 will be approximately DKK 1,200 million (previously expected DKK 1,300 million). This will bring total annual cost synergies and savings to DKK 3,700 million, in line with what we have previ-ously communicated.
The outlook for 2021 assumes that the currency exchange rates, especially the US dollar against DKK, will remain at the current level.
Long-term financial targetsFollowing the integration of Panalpina in 2019-2020, new ambitious 2025 financial targets have now been set for the Group as a whole and for each division.
The targets are based on the assumption of stable global eco-nomic development during the period, with annual global GDP growth of approximately 3% and transport market growth in line with GDP. Based on our market position, we expect that we can take market share in all divisions and exceed the mar-ket growth in the five-year period.
The targets are based on organic growth and do not include the potential impact from larger acquisitions in the period.
The strategic objectives of the Group are translated into the following targets:
15 DSV Panalpina Annual Report 2020 Strategy and financial targets

Capital structure The aim of the target capital structure is to ensure:• Sufficient financial flexibility to meet the strategic objectives; • A robust financial structure to maximise the return for our shareholders.
Our target financial gearing ratio is below 2.0 x EBITDA before special items. The ratio may exceed this level following significant acqui sitions.
Capital allocation policyOur free cash flow allocation strategy is unchanged from previous years:1 Repayment of net interest-bearing debt in periods when the financial
gearing ratio is above target range;2 Value-adding investments in the form of acquisitions or development
of the existing business;3 Distribution to the shareholders by means of share buybacks and
dividends.
Value-adding investments DSV Panalpina actively participates in the consolidation of a fragmented industry and has created substantial shareholder value through M&A over the years.
The Group has a track record of successful com pany integrations – the acquisition of Panalpina in 2019 being the newest, significant chapter in this story.
As illustrated in the graph, the Group has been able to create increasing return on invested capital over time. However, large acquisitions have ini-tially diluted ROIC before tax.
Group Management continuously monitors whether the capital structure is in line with the targets and excess capital is distributed to shareholders through share buybacks and dividends.
Adjustments to the capital structure are normally announced in connec-tion with the release of quarterly financial reports and are made primarily through share buybacks.
Dividend policyDSV Panalpina aims to ensure an annual dividend pay-out ratio of approxi mately 15% of net profit.
Proposed dividend for 2020 amounts to DKK 4.00 per share (2019: 2.50 per share). The proposed dividend for 2020 is equivalent to 22% of net profit and 15% of adjusted earnings.
Capital structure and allo cation
Value through acquisitions
%DSV acquires
UTi Worldwide
80,000
70,000
60,000
50,000
40,000
30,000
20,000
10,000
0
30%
25%
20%
15%
10%
5%
0%
20202019201820172016
DSV acquires Panalpina Welttransport (Holding) AG
Right-of-use assets Goodwill and customer relations Invested capital excl. goodwill and customer relations ROIC before tax incl. goodwill and customer relations
2015
14.3%13.4%
26.7%
23.4%
21.5%
(DKKm)
26.8%
16 DSV Panalpina Annual Report 2020 Strategy and financial targets

Income statement (DKKm) 2020 2019 Growth*
Revenue 115,932 94,701 26.0%Direct costs 87,398 70,947
Gross profit 28,534 23,754 23.5%
Gross margin 24.6% 25.1%Other external expenses 3,291 3,133Staff costs 11,684 10,329
Operating profit before amortisation and depreciation (EBITDA) before special items 13,559 10,292
Amortisation and depreciation 4,039 3,638
Operating profit (EBIT) before special items 9,520 6,654 47.3%
Conversion ratio 33.4% 28.0%Special items, costs 2,164 800Net financial expenses 1,729 858
Profit before tax 5,627 4,996
Tax on profit for the year 1,369 1,290
Profit for the year 4,258 3,706
For the Group, we achieved revenue of DKK 115,932 million, gross profit of DKK 28,534 million and operating profit of DKK 9,520 million.
Financial review PerformanceIn 2020, all three divisions delivered strong results and achieved significant growth compared to 2019.
We completed the Panalpina integration in 2020, and this was accomplished in 15 months. The synergies were achieved faster than expected, and the successful integration is the main reason why the conversion ratio for the Group came to 33.4% for 2020 against 28.0% for 2019.
COVID-19 started to impact our markets and financial results in February and March 2020. As we saw volumes decline and uncertainty increase, we reacted by adjusting our capacity. Our COVID-19 cost savings initiatives reduced the cost base by approximately 10%, and the strict cost discipline was a main driver for the growth in earnings during the second half of 2020.
Adjusted free cash flow for the year was DKK 8,746 million (2019: DKK 3,678 million). When the COVID-19 crisis broke out, we suspended our ongoing share buyback programme, but based on the strong cash flow during the year a new programme was initiated in October 2020.
Return on invested capital (ROIC before tax) including goodwill and customer relationships was 14.3% for 2020, compared to 13.4% for the same period last year. The increase can be at-tributed to the growth in EBIT before special items, which was partly offset by higher average invested capital (+33%) due to the full-year impact of the Panalpina transaction.
Integration of PanalpinaThe acquisition of Panalpina Welttransport (Holding) AG (Panalpina) was closed on 19 August 2019, as of which date Panalpina was included in the consolidated financial statements. The full-year effect of Panalpina had a significant impact on the consol-idated income statement in 2020 compared to 2019.
Jens H. Lund, CFO
*Growth including M&A and in constant currencies.
17 DSV Panalpina Annual Report 2020 Financial and non-financial performance

ResultsRevenue The growth of 26.0% was driven by the acquisition of Panalpina, especially in Air & Sea. The transport volumes were negatively impacted by the COVID-19 crisis, but due to lack of capacity the freight rates reached record-highs during the year, both for air and for sea. Road and Solutions were also impacted by COVID-19, especially in Q2, but the markets re-covered during the second half of the year, and Road achieved revenue which was close to the level of 2019 and Solutions above 2019.
(DKKm) 2020 2019 Growth*
Air & Sea 73,689 51,151 49.7%Road 30,395 31,621 (2.6%)Solutions 14,608 14,390 4.5%Group and eliminations (2,760) (2,461)
Total 115,932 94,701 26.0%
* Growth including M&A and in constant currencies.
Gross profitSimilar to revenue, gross profit was impacted positively by the acquisition of Panalpina and grew 23.5% in 2020. The decline in transport volumes following COVID-19 was compensated by improved gross profit per ship-ment across most business areas. As the pandemic disrupted supply chains and created capacity shortages, we did our best to find solutions for our customers, and, in some cases the extraordinary market conditions have led to temporarily improved yields, most significantly in air freight.
During 2020, gross profit was also positively impacted by benefits from the integration, where the combination of the two networks and consoli-dation of IT created scale benefits. Both Road and Solutions have also benefitted from the continuous focus on optimisation of workflows and consolidation of infrastructure.
EBIT before special itemsThe 47.3% growth in EBIT before special items was driven by the Air & Sea division, which benefitted from the Panalpina integration and cost discipline in 2020. After a challenging H1 2020, Road and Solutions achieved growth in earnings due to improving market conditions and strong cost discipline. EBIT before special items was negatively impacted by currency translation of DKK 192 million in 2020, mainly due to USD and currencies floating with the USD.
(DKKm) 2020 2019 Growth*
Air & Sea 7,026 4,506 61.0%Road 1,390 1,251 12.3%Solutions 1,161 1,013 18.8%Group and eliminations (57) (116)
Total 9,520 6,654 47.3%
* Growth including M&A and in constant currencies.
Total staff costs (excluding hourly workers) was DKK 11,684 million for 2020 (2019: DKK 10,329 million). The increase was due to the inclusion of Panalpina, but the integration synergies and cost saving initiatives re-duced the cost base during the year.
Other external expenses totalled DKK 3,291 million for 2020 (2019: DKK 3,133 million) and were impacted by the same factors as staff costs.
Integration synergies and COVID-19 savings amount to approximately DKK 3,700 million, of which approximately DKK 2,400 million impacted P&L in 2020 (2019: DKK 100 million). The synergies and savings were achieved faster than expected in 2020, and the remaining full-year im-
(DKKm) 2020 2019 Growth*
Air & Sea 16,909 12,517 39.7%Road 6,138 6,156 1.0%Solutions 5,369 4,969 11.5%Group and eliminations 118 112
Total 28,534 23,754 23.5%
* Growth including M&A and in constant currencies.
Revenue (DKKm)
120,000
100,000
80,000
60,000
40,000
20,000
02016 2020201920182017
Gross profit(DKKm)
35,000 30,00025,00020,00015,00010,000
5,0000
%
20192018
504540353025201510
50
EBIT before special items(DKKm)
10,0009,0008,0007,0006,0005,0004,0003,0002,0001,000
0
%
2016 2020201920182017
12
10
8
6
4
2
0
Gross profit
Operating margin
Conversion ratio
EBIT
2016 2017 2020
18 DSV Panalpina Annual Report 2020 Financial and non-financial performance

Diluted adjusted earningsThe diluted adjusted earnings per share for 2020 grew by 19.9% and came to DKK 26.5 (2019: DKK 22.1). The growth in adjusted earnings more than offsets the higher average number of shares issued. Please refer to note 4.6 for further details.
Cash flow statement Cash flow from operating activities for 2020 increased by 49.4% and came to DKK 10,276 million. Cash flow was positively affected by higher EBIT before special items, although this was partly offset by the cash impact of special items.
Cash flow from investing activities was negative by DKK 556 million in 2020 (2019: positive by DKK 1,371 million). 2019 was impacted by a net cash position of DKK 1,975 million acquired from Panalpina.
Cash flow from financing activities was negative by DKK 6,999 million in 2020 (2019: DKK 7,484 million) and was mainly related to allocations to shareholders and repayments of lease liabilities.
Adjusted free cash flow (adjusted for M&A, IFRS 16 and special items) amounted to DKK 8,746 million and was significantly above the DKK 3,678 million for 2019, reflecting the improved EBIT before special items.
In accordance with the Group’s capital allocation policy, the majority of the free cash flow for 2020 was distributed to shareholders, as the fi-nancial gearing ratio was below the target level throughout the year. Distributions to shareholders totalled DKK 5,619 million in 2020. It should be noted that, due to the uncertainty created by the pandemic, share buybacks were suspended from March to October 2020.
Capital structureDSV Panalpina shareholders’ share of equity was DKK 47,385 million on 31 December 2020 (2019: DKK 49,430 million). Equity was positively impacted by the result for the period, but reduced by distribution to shareholders and currency translation on goodwill.
Net interest-bearing debt came to DKK 16,970 million by the end of 2020 (2019: DKK 18,355 million). The financial gearing ratio was 1.3 x EBITDA before special items and in line with the target of below 2.0 x EBITDA before special items.
The weighted average duration of the Company’s bonds, committed loans and credit facilities was 3.2 years on 31 December 2020, com-pared to 2.9 years on 31 December 2019. The Group issued new seven-year bonds of EUR 500 million (approx. DKK 3,730 million) in February 2020, which were used for repayment of other loans.
In February 2021, the Group received an A3 rating with a stable outlook from Moody’s.
Net working capital (NWC) came to DKK 2,701 million on 31 December 2020 (2019: DKK 3,125 million). Relative to full-year revenue, funds tied up in NWC at year-end decreased to 2.3%, compared to 3.3% in 2019. We consider the level at year-end 2020 to be satisfactory, but we will continue to focus on optimisation of NWC.
pact in 2021 will be approximately DKK 1,200 million (previously ex-pected DKK 1,300 million in 2021).
Temporary cost savings due to COVID-19 impacted both staff costs and other external cost, e.g. due to reduced travel activity and reduced working hours. We estimate that these temporary savings amounted to DKK 350 million in 2020.
Depreciations totalled DKK 4,039 million for 2020 (2019: DKK 3,638 mil-lion). The increase was mainly due to the integration of Panalpina and depre-ciations on new leased terminals and warehouses. Amortisation of customer relationships was DKK 208 million for 2020 (2019: DKK 102 million).
Special items totalled DKK 2,164 million for 2020 (2019: DKK 800 mil-lion) and are expenses derived from the combination of DSV and Panalpina and the COVID-19 cost saving initiatives. The acquisition of Prime Cargo in Q4 2020 was the main reason that total special items were slightly higher than previously guided for the year.
Net financial expenses totalled DKK 1,729 million for 2020 (2019: DKK 858 million). The increase was due to higher currency translation which amounted to an expense of DKK 1,055 million (2019: DKK 188 million). The currency translation primarily relates to non-cash exchange rate adjustments on intercompany loans in USD, CHF and other loans in currencies floating with the USD.
(DKKm) 2020 2019
Interest on lease liabilities 434 383Other interest cost, net 224 265Interest on pensions 16 22Currency translation 1,055 188
Net financial expenses 1,729 858
Tax on profit for the year was 24.3%, compared to 25.8% in 2019. The effective tax rate for 2020 was impacted by restructuring costs andother one-offs during the year.
NIBD and gearing ratio Gearing ratioNIBD
(DKKm)
20,00018,00016,00014,00012,00010,000
8,0006,0004,0002,000
0
%
2016 2020201920182017
2,5
2,0
1,5
1,0
0,5
0
IFRS lease
19 DSV Panalpina Annual Report 2020 Financial and non-financial performance

Non-financial review
Indicator Unit Target 2021 2020 2019
CO2e Scope 1* ‘000 tonnes CO2 -40% by 2030 80 83CO2e Scope 2* ‘000 tonnes CO2 -40% by 2030 98 107CO2e Scope 3* ‘000 tonnes CO2 -30% by 2030 12,564 15,927Occupational accidents
Number per million working hours
<5.0 6.7 5.0
Lost workdays due to occupa tional injury
Number per million working hours
<100 78.8 97.5
Fatalities Number 0 0 1Code of Conduct e-learning**
Percentage 100% 100% 86%
Integration and revised strategyA key activity in 2020 was the integration of employees from the Panalpina acquisition into our business ethics framework. Our organisation and geographical footprint have expanded, and it is important that we all share the corporate culture and comply with the same Code of Conduct. The process started in 2019, and in 2020 we continued onboarding our new col-leagues and communicating the framework via newsletters, e-learning and other channels.
Equally important was integrating new entities and suppliers of Panalpina into our framework for responsible procurement. The DSV Panalpina Supplier Code of Conduct outlines the standards required to perform services on our behalf and is dis-tributed to all suppliers with a yearly spend above EUR 25,000.
While managing the challenges of COVID-19 and finalising the integration of Panalpina in 2020, we also revised our strategy for corporate responsibility. Based on a reassessment of the topics that are most important to our stakeholders and to DSV Panalpina, the revised strategy includes new and more ambitious targets for short- and long-term improvements.
We raised our ambitions for corporate responsibility in 2020 and made good progress on our initiatives.
Environmental and social data
* Comparative figures for 2019 have been restated.** Percentage of white-collar employees trained (2020 and 2019 only white-collar managers).
For the results of our Corporate Responsibility
activities, the full set of data and reporting on progress,
please refer to our Corporate Responsibility Report 2020
20 DSV Panalpina Annual Report 2020 Financial and non-financial performance

Reporting on corporate social responsibility Reporting on Corporate Social Responsibility cf. section 99a of the Danish Financial Statements Act We report separately on cor-porate social responsibility in our Corporate Responsibility Report in accordance with section 99a of the Danish Financial Statements Act.
Reporting on management gender composition cf. section 99b of the Danish Financial Statements Act We report separately on manage ment gender composi-tion in accordance with section 99b of the Danish Financial Statements Act in our Corporate Responsibility Report 2020.
Reporting on diversity cf. section 107d of the Danish Financial Statements Act We report separately on diver-sity in accordance with section 107d of the Danish Financial Statements Act in our Corporate Responsibility Report 2020.
Progress towards our science-based targetsIn 2020, we made progress towards our science-based targets, which are based on a 2019 baseline, which has been adjusted for the full-year impact of Panalpina.
The reduction in 2020 compared to our science-based tar-gets was mainly due to the COVID-19 crisis, which caused reduced transport volumes and thus reduced CO2 emissions from subcontracted transport. Other consequences of COVID-19 restrictions, such as less business travel, also affected total emissions. In 2021, we expect increased CO2 emissions as shipping volumes and business activities rebound.
In 2020, we also saw reductions in CO2 emissions resulting from energy efficiency improvements in our own facilities and through our partnerships with subcontractors. Through these partnerships, we encourage the use of more energy efficient vehicles. We will continue our focus on energy efficiency and green transport solutions in the coming years.
Employee developmentsUnfortunately, we saw an increase in the rate of occupational accidents, mainly in our terminals and warehouses, in 2020. As the impact and severity of the accidents were low, we also experienced the lowest rate of lost workdays due to occupa-tional injury since 2016.
We implemented a new health and safety programme in 2020 and moved forward on several other related initiatives aiming to reduce work accidents among our employees. After finalising the integration of Panalpina, we have reinstated tar-gets for lost workdays and occupational accidents and in-cluded a target for eliminating fatalities.
We saw an increase in the employee turnover ratio in 2020, which was due to the integration of Panalpina and organisa-tional adjustments as a response to the decline in global trade activity during COVID-19. As the integration is now com-plete, we expect the turnover ratio to decline in 2021 and revert to historical levels. Employee turnover is generally high among blue-collar workers in the transport and logistics in-dustry due to seasonal fluctuation in the required workforce.
New diversity and inclusion policyWe revised our Diversity Policy in 2020, adding focus on in-clusion and making it clear that we respect, recognise and value the uniqueness of each individual. To strengthen the development of a diverse and inclusive working environment, we started a number of initiatives all aiming to promote and increase general diversity and inclusion awareness. We have also accommodated for this in our recruitment and advance-ment practices, talent management processes and succession planning.
Guiding ethical behaviourIn 2020, we continued our journey of creating awareness about our business ethics framework and whistleblower pro-gramme. By the end of the year, we had reached a 100% completion rate among managers of our Code of Conduct e-learning. In 2021, our target is to ensure that 100% of our white-collar employees complete the e-learning course and to achieve a first-attempt pass rate of 90% or above. The course will be automatically assigned to all new managers as a mandatory, annual task.
Our responsible way forward
DSV Panalpina Corporate Responsibility Report 2020
Our Corporate Responsibility Report 2020 is available at dsv.com/en/about-dsv/corporate-responsibility/ governance/responsibility-reports
3% reduction in 2020 40% 40%
30%8% reduction in 2020
2030 target 2030 target
2019 baseline 2019 baseline 2019 baseline
21% reduction in 2020
2030 target
Scope 1 statusDirect emissions
Scope 2 statusIndirect emissions
Scope 3 statusOther indirect emissions, incl. subcontracted transport
21 DSV Panalpina Annual Report 2020 Financial and non-financial performance

The integration of Panalpina was completed in 2020, and DSV Air & Sea reported EBIT before special items of DKK 7,026 million against DKK 4,506 million in 2019. COVID-19 impacted volumes negatively, but this was compensated by strong yields and cost discipline.
Air & Sea Market developmentThe global air freight market was significantly impacted by the COVID-19 crisis during a volatile 2020 and we estimate that market volumes were 13-15% below 2019. As a large part of passenger planes were grounded, the belly-hold ca-pacity was missing, and total available capacity was more than 20% below pre-COVID-19 levels. The demand for air freight exceeded available capacity on most trade lanes, lead-ing to historical high rate levels. Geographically the demand was strongest for exports from Asia during the year, whereas European exports were weaker.
DSV achieved growth in air freight volumes of 19% for 2020. The positive development was driven by the full-year impact of Panalpina.
We expect that the air freight market will remain challenging in the foreseeable future. It may take two years before inter-continental passenger traffic is back at 2019 levels, and the market will continue to rely on freighter aircraft capacity.
The sea freight market was less impacted by the COVID-19 crisis than the air market, and we estimate that the market volumes declined 3-5% compared to 2019. The Trans-Pacific trade lane stood out with a growth of 4% in 2020 whereas the development on other major trade lanes was negative. Due to efficient capacity management by the carriers, rates were high during 2020, and during Q3 and Q4 the rates reached record levels on several trade lanes. COVID-19 re-strictions also played a role as container ports were con-gested, and, in the last months of 2020, lack of capacity and empty containers caused severe challenges in the market.
DSV achieved sea freight volume growth of 16% for 2020, also impacted by the addition of Panalpina. We expect that the current situation with tight capacity and high rates in the sea freight market will persist for a good part of 2021.
Condensed income statement and key figures (DKKm) 2019 Growth*2020
Revenue 73,689 51,151 49.7%Direct costs 56,780 38,634
Gross profit 16,909 12,517 39.7%
Other external expenses 2,870 2,267Staff costs 6,048 5,093
Operating profit before amortisation and depreciation (EBITDA) before special items 7,991 5,157
Amortisation and depreciation 965 651
Operating profit (EBIT) before special items 7,026 4,506 61.0%
Gross margin (%) 22.9 24.5Conversion ratio (%) 41.6 36.0Operating margin (%) 9.5 8.8
Number of full-time employees at year-end 18,008 21,516
Total invested capital 43,305 45,475Net working capital 3,215 2,433ROIC before tax (%) 15.8 15.5
+61% EBIT growth of more than
61% in constant currencies. * Growth including M&A and in constant currencies.
22 DSV Panalpina Annual Report 2020 Financial and non-financial performance

Due to the Group’s European footprint, DSV Air & Sea has a relatively high exposure to European imports and exports and less exposure to the Trans-Pacific and Intra-Asia traffics, which had the strongest development in 2020. DSV’s volume performance in 2020 was also impacted by the discontinua-tion of certain Panalpina activities and customer contracts which had low profitability and did not fit into the network.
Results Revenue totalled DKK 73,689 million for 2020 (2019: DKK 51,151 million). Growth for the year came to 49.7%.
The growth in revenue was mainly attributable to the acqui-sition of Panalpina. During the year, revenue was negatively impacted by lower volumes following COVID-19, but this was compensated by higher freight rates both for air and sea freight.
Gross profit totalled DKK 16,909 million for 2020 (2019: DKK 12,517 million). Growth for the year came to 39.7%.
The growth in gross profit was mainly driven by the full-year impact of Panalpina. The negative volume impact from COVID-19 was compensated by improved gross profit per unit (yields), especially for air freight in Q2 and Q3, driven by the high rates and improved profitability of the air charter network. The improved yields can also be contributed to the integration of Panalpina and the benefits from combining the volumes and optimising Panalpina’s operations. Furthermore, the disposal of Airflo (perishables) in Q3 2020 and other dis-continued low-yield contracts during the year led to a better activity mix and higher average yields.
In line with market trends, the division achieved the highest growth in gross profit in the APAC region, driven by export volumes growth, especially related to consumer goods and personal protection equipment.
Geographic segmentation 2020Division gross profit can be broken down by the following geographi cal areas:
AMERICAS
27%
EMEA
44%
APAC
29%
The division’s gross margin was 22.9% for 2020, compared to 24.5% in 2019. The decline was mainly due to the difference in activity mix between legacy DSV and Panalpina and, sec-ondly, a negative impact from pass-through revenue where higher freight rates cause lower gross margin.
EBIT before special items totalled DKK 7,026 million for 2020 (2019: DKK 4,506 million). Growth for the year was 61.0%. The positive development was mainly a result of the inclusion of Panalpina, the realisation of synergies and the im-pact from the COVID-19 cost savings. All regions contributed to the EBIT growth, but the APAC region achieved the highest growth, driven by strong performance on gross profit.
Amortisation of customer relationships was DKK 181 million (2019: DKK 82 million) and EBIT before special items was negatively impacted by currency translation of DKK 142 mil-lion in 2020, mainly due to USD and currencies floating with the USD.
The conversion ratio came to 41.6% for 2020 against 36.0% for 2019. The conversion ratio improved during 2020 as in-tegration synergies and cost savings were realised. The oper-ating margin also increased during 2020 but was diluted by the high pass-through revenue.
Net working capital came to DKK 3,215 million at the end of 2020 against DKK 2,433 million at year-end 2019. The de-velopment was mainly due to increased activity with large key accounts with long credit terms.
Return on invested capital was 15.8% in 2020 against 15.5% in 2019. The increase is due to the increase in EBIT, however, partly offset by the full-year impact of the Panalpina transac-tion on invested capital.
Air freight (DKKm) 2020 2019
Revenue 44,756 27,134Direct costs 34,481 20,540
Gross profit 10,275 6,594
Gross margin (%) 23.0 24.3Volume (tonnes) 1,272,405 1,071,266Gross profit per unit (DKK) 8,075 6,155
Sea freight (DKKm) 2020 2019
Revenue 28,933 24,017Direct costs 22,299 18,094
Gross profit 6,634 5,923
Gross margin (%) 22.9 24.7Volume (TEUs) 2,204,902 1,907,126Gross profit per unit (DKK) 3,009 3,106
23 DSV Panalpina Annual Report 2020 Financial and non-financial performance

Strategic and operational highlights2020 was very much about integration and COVID-19. With the integration of Panalpina completed, DSV has significantly strengthened the Air & Sea division, which holds a position as a top-three player in both markets. Our organisation and IT- systems have stood the test, and we have integrated more than 60 countries on time and in line with the integration plans, de-spite the COVID-19 impact. That is a remarkable achievement.
DSV and Panalpina are now one company, operating from the same offices and using one IT platform. However, there is still potential for improvement across the organisation and this is reflected in our new long-term financial targets. We will con-tinue our focus on optimising processes and ensuring that we use our systems the right way across the organisation. This includes our integrations with customers (EDI, API, myDSV), and we will continue to promote these solutions to customers and ensure that the booking data we receive from customers has the right quality.
During 2020, we have made great efforts to secure the re-quired freight capacity for our customers. We have benefitted from our strong market position and relationships with carriers, and, while our processes are highly digitalised, the classic craftsmanship of a freight forwarder has been important. The capacity issues will continue into 2021 and we are ready to assist, also when companies take a critical look at their supply chains.
Our air charter network (a legacy from Panalpina) has proven its worth in 2020. It is a unique and strong value proposition to customers where we control air cargo capacity and the gate-way, and we use alternative and less congested airports. In 2020, we have expanded capacity, now handling around 10% of the divisions air freight volumes. The capacity is based on more flexible charter contracts, compared to Panalpina’s long-term leasing contracts, but the service offering is the same.
Focus areas 2021In 2021, our focus will be on organic growth. We have a strong value proposition and relationships with both large, global cus-tomers and customers in the SME segment, and we will focus on profitable growth within both segments. Our target is growth above the market, and our ability to achieve this target will improve as 2021 progresses.
During the year we will also focus on our internal processes to ensure we all benefit from our digital tools.
Our systems have enabled us to work from home during lock-downs, but we hope for a normalisation soon. Winning new business and sharing best practices are easier when we can meet face to face. One of the leading
freight forwarders
With the inclusion of Panalpina, we significantly strengthened the Air & Sea division and our market position within air freight and sea freight, be-come a global top three player in both markets. Our com-bined industry-specific solu-tions have been strengthened.
Revenue Gross profit EBIT before special itemsGross profit Conversion ratio Operating margin
EBIT
(DKKm) (DKKm) (DKKm)
80,000
70,000
60,000
50,000
40,000
30,000
20,000
10,000
0
18,000
16,000
14,000
12,000
10,000
8,000
6,000
4,000
2,000
0
8,000
7,000
6,000
5,000
4,000
3,000
2,000
1,000
0
%%
2016 2016 20162020 2020 20202019 2019 20192018 2018 20182017 2017 2017
60
50
40
30
20
10
0
14
12
10
8
6
4
2
0
24 DSV Panalpina Annual Report 2020 Financial and non-financial performance

DSV Road achieved EBIT before special items of DKK 1,390 million for 2020, compared to DKK 1,251 million in 2019. The activity was negatively impacted by COVID-19, but strong cost discipline supported growth in earnings for the year.
Road Market situation and performanceWe estimate that the demand for road freight was down by approximately 5-7% in 2020. In the second half of the year, the market gradually recovered and the domestic distribution markets showed year-on-year growth, whereas the market for international transports only partly recovered. Certain industries, especially in the automotive industry and capital goods, remained below normal activity levels.
Geographically, the Southern European and South African markets were more negatively impacted by the COVID-19 crisis than Northern/Eastern Europe and North America.
Results Revenue totalled DKK 30,395 million for 2020 (2019: DKK 31,621 million). Growth for the year was negative 2.6% and was impacted by the COVID-19 crisis.
The activity picked up since the low point in Q2 2020, and, in line with the general market, our domestic distribution activities (e.g. distribution to supermarkets and do-it-your-self markets) achieved the strongest performance, whereas international transports remained below last year. In a chal-lenging market, DSV Road has benefitted from scale and strong network, enabling the division to offer a high service level to customers, also on trade lanes with lower-than- normal activity.
Gross profit totalled DKK 6,138 million in 2020 (2019: DKK 6,156 million). Growth for the year was 1.0%.
The division’s gross margin for 2020 was 20.2%, compared to 19.5% for 2019. The improvement was mainly driven by lower rates from external hauliers, due to excess capacity on the market for international transports. Furthermore, the division achieved higher productivity and cost savings on cross-dock terminals.
Condensed income statement and key figures (DKKm) 2019 Growth*2020
Revenue 30,395 31,621 (2.6%)Direct costs 24,257 25,465
Gross profit 6,138 6,156 1.0%
Other external expenses 1,021 1,060Staff costs 2,799 2,864
Operating profit before amortisation and depreciation (EBITDA) before special items 2,318 2,232
Amortisation and depreciation 928 981
Operating profit (EBIT) before special items 1,390 1,251 12.3%
Gross margin (%) 20.2 19.5Conversion ratio (%) 22.6 20.3Operating margin (%) 4.6 4.0
Number of full-time employees at year-end 14,003 13,644
Total invested capital 8,942 10,243Net working capital (1,310) (422)ROIC before tax (%) 14.5 13.6
+12.3% EBIT growth of more than
12.3% in constant currencies. * Growth including M&A and in constant currencies.
25 DSV Panalpina Annual Report 2020 Financial and non-financial performance

EBIT before special items totalled DKK 1,390 million for 2020 (2019: DKK 1,251 million). Growth for the year was 12.3% and was mainly driven by the COVID-19 cost-saving initia-tives implemented during Q2 2020. The growth in earnings was mainly driven by Northern Europe, where DSV Road has the strongest presence on the domestic markets.
The cost discipline and improved productivity was reflected in the conversion ratio, which came to 22.6% for 2020, against 20.3% for 2019. The operating margin saw a similar improvement.
Net working capital was negative by DKK 1,310 million at the end of 2020, compared to a negative DKK 422 million at year-end 2019. The development was mainly attributable to strong NWC management, changes in provision and lower funds tied up in inventories.
Return on invested capital was 14.5% in 2020 (2019: 13.6%). The improvement was driven by higher result and lower invested capital.
Strategic and operational highlights On top of the challenges in handling the COVID-19 situation, the preparations for Brexit impacted our operations during 2020, both in the UK and the rest of the network. We added capacity for custom clearance and prepared as much as pos-sible in close cooperation with customers.
In 2020 we continued to develop our digital services. We add-ed the DSV ETA module, which allows customers to receive a pre-alert on the day of delivery.
While digital development is crucial, our physical infrastructure – cross-dock terminals – are the backbone of our groupage network, and during 2020 we added two new terminals.
The development of our new transport management system – now called Road Way Forward – progressed in 2020. The comprehensive project is taking shape, and after a final pilot planned during 2021 we expect to start the roll-out at the end of year. Road Way Forward comprises several modules and is expected to facilitate improved productivity
in the coming years through standardisation and automation of processes.
Focus areas in 2021 Road Way Forward is at the top of our agenda for 2021, and we will maintain our focus on the project to ensure progress.
In 2021, we hope to see market growth returning and we are ready to service our customers. International groupage is an important part of our product catalogue, and this is an area we plan to prioritise and optimise in 2021.
We receive more than 90% of bookings from customers elec-tronically, but the quality of the data is not optimal. We will in close cooperation with customers focus on improving the quality of booking data.
Finally, we look forward to working with our customers on sustainability. This involves both individual solutions for large customers and standardised green logistics services.
Geographic segmentation 2020
Division gross profit can be broken down by the following
geographi cal areas:
AMERICAS
5%
EMEA
95%
Revenue Gross profit EBIT before special itemsGross profit Conversion ratio Operating margin
EBIT
(DKKm) (DKKm) (DKKm)
32,000
24,000
16,000
8,000
0
7,000
6,000
5,000
4,000
3,000
2,000
1,000
0
1,6001,4001,2001,000
800600400200
0
%%
2016 2016 20162020 2020 20202019 2019 20192018 2018 20182017 2017 2017
25
20
15
10
5
0
6
5
4
3
2
1
0
26 DSV Panalpina Annual Report 2020 Financial and non-financial performance

DSV Solutions reported EBIT before special items of DKK 1,161 million against DKK 1,013 million in 2019. The growth in earnings was driven by improved productivity, cost discipline and continued consolidation of warehouse capacity.
Solutions Market situation and performance We estimate that the market for contract logistics was down by approximately 5% for 2020. The initial impact of the COVID-19 lockdowns led to a decline in activity of up to 20% in Q2 2020, but activity gradually picked up in the second half of the year.
Activity levels within the e-commerce segment, pharma-ceuticals, essential retail and do-it-yourself stores have been growing following the crisis, whereas automotive and capital goods are examples of industries that remain below 2019 levels. Retail businesses with a high dependency on high street sales have been severely impacted during 2020, and these retailers have accelerated the process of moving as much business as possible to online sales.
Results Revenue totalled DKK 14,608 million in 2020 (2019: DKK 14,390 million). Growth for the year was 4.5%. The develop-ment was positively impacted by the integration of Panalpina, which expanded the footprint of the division in Asia, the Middle East and South America.
The pandemic had an overall negative impact on the activity, especially the first half of 2020, but as mentioned, the im-pact was different from industry to industry.
Gross profit totalled DKK 5,369 million in 2020 (2019: DKK 4,969 million). Growth for the year was 11.5%.
The division achieved a gross margin of 36.8% in 2020 against 34.5% in 2019. The improvement reflects higher productivity in warehouses and higher utilisation of capacity. During 2020, the performance on certain low-margin con-tracts and sites improved or the contracts were terminated.
+18.8% EBIT growth of more than
18.8% in constant currencies.
Condensed income statement and key figures (DKKm) 2019 Growth*2020
Revenue 14,608 14,390 4.5%Direct costs 9,239 9,421
Gross profit 5,369 4,969 11.5%
Other external expenses 1,089 1,088Staff costs 1,449 1,306
Operating profit before amortisation and depreciation (EBITDA) before special items 2,831 2,575
Amortisation and depreciation 1,670 1,562
Operating profit (EBIT) before special items 1,161 1,013 18.8%
Gross margin (%) 36.8 34.5Conversion ratio (%) 21.6 20.4Operating margin (%) 7.9 7.0
Number of full-time employees at year-end 21,478 22,777
Total invested capital 11,370 11,768Net working capital 775 883ROIC before tax (%) 10.0 10.0
* Growth including M&A and in constant currencies.
27 DSV Panalpina Annual Report 2020 Financial and non-financial performance

The improved gross margin is also a result of the ongoing consolidation, both of warehouses and IT infrastructure. In recent years, the division has inaugurated several new, large warehouses and vacated smaller and less efficient facilities. The new warehouses often involve automation of processes enabling higher productivity.
EBIT before special items totalled DKK 1,161 million in 2020 (2019: DKK 1,013 million), and growth came to 18.8%.
Growth in EBIT before special items was driven by the higher gross profit and lower cost base due to the COVID-19 cost- saving initiatives, which supported EBIT growth in the second half of 2020. The growth in earnings was highest in Europe, and the division also achieved improved results in APAC.
The conversion ratio was 21.6% in 2020 against 20.4% last year, and the operating margin saw a similar improvement. The improved margins reflect the division’s cost discipline and continuous focus on consolidation and operational excellence.
Net working capital amounted to DKK 775 million at the end of 2020 and was on level with last year. Return on invested capital was 10.0% for 2020, also on level with last year.
Strategic and operational highlights The Panalpina integration was finalised in 2020, in line with plans. Panalpina strengthened the division’s global footprint and contributed positively to the activity level in 2020.
The growth in e-commerce accelerated in 2020 and DSV Solutions has taken part in this development. Handling the large volumes and seasonal peaks in online sales require strong and standardised processes, and automation of ware-houses often plays an important role. During 2020 we have progressed with several automation projects, including Auto-store, automated ground vehicles and goods-to-man.
The acquisition of Prime Cargo at the end of 2020 will add to our e-commerce competences, initially in the Nordic region, and we will continue to focus on developing our competences in this market.
In 2020, we initiated or completed the construction of several new warehouses and continue to work with strategic road maps for all regions ensuring that we have a strong base for organic growth and can offer attractive solutions for our customers.
With our DSV Smarter Storage concept, we offer storage so-lutions to private customers. The project is still only a pilot in Denmark, but we plan to add new storage facilities in the coming years.
Focus areas in 2021We expect a continued recovery of the markets in 2021 and hope to see an increase in activity levels among our customers.
We will continue several existing projects; new warehouses will be added, warehouse automation projects continue, and we will continue the work on our BI-platform (business in telli-gence), making the data we use for internal optimisation avail-able for customers.
Geographic segmentation 2020
Division gross profit can be broken down by the following
geographi cal areas:
AMERICAS
18%
APAC
9%
EMEA
73%
Revenue Gross profit EBIT before special itemsGross profit Conversion ratio Operating margin
EBIT
(DKKm) (DKKm) (DKKm)
15,000
12,000
9,000
6,000
3,000
0
7,0006,0005,0004,0003,0002,0001,000
0
1,4001,2001,000
800600400200
0
%%
2016 2016 20162020 2020 20202019 2019 20192018 2018 20182017 2017 2017
25
20
15
10
5
0
98 765 43210
28 DSV Panalpina Annual Report 2020 Financial and non-financial performance

Risk managementRisk governance structureAs a global freight forwarder, we are exposed to a variety of risks inher-ent to our business operations. Managing these risks is an integrated part of our management activities.
Our risk management framework is based on structured risk identifica-tion, analysis and reporting processes providing the basis for risk assess-ments and subsequent initiation of relevant mitigation actions.
Our flat organisational structure facilitates fast escalation and timely re-sponse to issues that may have a material impact on the Group’s earn-ings and financial and strategic targets.
The Board of Directors is responsible for the Group’s risk management strategy and the overall framework for identifying and mitigating risks. The Audit Committee supervises compliance with the established framework.
The Executive Board is responsible for the day-to-day risk management processes as well as the continuous development of the Group’s risk management activities.
Risk management processOur risk management process is structured into two parallel tracks: 1. Operational risk management – comprising continuous handling of vari-
ous identified risks resulting from our normal day-to-day operations;2. Strategic risk management – addressing key risks and the more
strategic mid to long-term risk scenario in which we operate.
Operational risk managementEvery week, the Executive Board and senior management receive re-ports on risks and other operational matters of importance from across the Group. The report includes information on risk mitigation actions undertaken.
The operational risk reporting forms the basis of the Executive Board’s day-to-day risk management activities and serves as input for the re gular reporting to the Board of Directors and the Audit Committee.
The consolidated weekly report is distributed to managers across the or-ganisation to create awareness of risks and prevent potential incidents.
Strategic risk managementThe operational risk management process is followed up annually by a strategic risk assessment, focusing on identifying and mapping the key risks of the Group.
The assessment is based on input from the operational risk management process, and from an extensive risk survey involving a large number of key employees across functions, departments and regions.
The key risks are addressed by the Executive Board and assigned to risk owners within the Group, ensuring that relevant preventive measures are implemented. In line with the established framework, the key risks are reported to the Audit Committee and the Board of Directors.
MitigationReportingRecordingAnalysis and assessment
Identification
Dynamic risk adaption
Identified risks are analysed to determine cause,
impact and likelihood of the risk occurring.
Risks are identified using the Group’s risk reporting and
analysis tools.
Identified key risks are recorded and prioritised. Risk
owners are allo cated to identified key risks.
Ongoing key risk reassessment Tracking
Risks are reported to the Board of
Directors, the Audit Committee, the Execu-
tive Board and other stakeholders in the
organisation.
Risks are monitored and preventive measures
implemented in cooperation with the affected business
units. When necessary, mitigation actions are
initiated immediately after risk identification.
29 DSV Panalpina Annual Report 2020 Corporate governance and shareholder information

1
2 3
4
56
7
Key risk analysis 2020The latest analysis of the Group’s internal and external strate-gic risks was carried out in Q4 2020.
The analysis reconfirmed the existing six overall key risk areas identified in previous years which may have a significant im-pact on the Group’s earnings, financial position and achieve-ment of other strategic objectives should they materialise.
In 2020, commercial risk – the risk of failure to execute on our organic growth strategy has been added to the list of key risks.
The results of the risk analysis are presented in the risk map and described on the following pages. The indicated likelihood of occurrence and worst-case yearly EBIT impact are based on our best estimates, after mitigating strategies, but are associated with uncertainty.
The risk from climate changesClimate changes impact our industry and we monitor the po-tential impact closely, but currently do not consider this a key risk for the Group. Climate changes create a series of business risks – e.g. due to extreme weather events or increased costs for emitting greenhouse gases. Emission of greenhouse gases is a material factor in our industry and can lead to higher transport costs in the future.
An increase in the transport costs will ultimately be passed on to the shippers and may be negative for economic growth, but climate changes can also offer business opportunities; we have set ambitious targets for reducing emissions and we will offer a range of sustainable logistics services to our customers.
1 IT System and process breakdown
2 Macroeconomy Recession and regional exposure
3 Employees Employee retention and attraction
4 Compliance Fines, claims and damages, etc.
5 M&A Acquisitions and integration
6 Technology Disruption and technological adoption
7 Com mercial (New) Failure to execute on organic growth
Key risk map
Likelihood of occurrence
Above DKK 2,000 million
2020
2019
Up to DKK 500 million
Estimated worst-case yearly EBIT impact if occurring
Almost certain
Moderate LikelyUnlikelyRare
30 DSV Panalpina Annual Report 2020 Corporate governance and shareholder information

Risk descriptionIT systems, networks and related processes are crucial to our day-to-day operations – from the delivery of our core logistics services to our analytic capabilities and reporting to the financial markets.
This makes us vulnerable to system outages, cyberattacks and failed IT implementation.
Furthermore, we rely on the scalability of our systems, continuous inno-vation and improvement of our IT landscape to be able to offer competi-tive services that meet our customers’ expectations, improve our pro-ductivity and respond to new business opportunities as they arise. Our current Road Way Forward project is a good example of a strategic IT project.
Mitigation strategiesConsolidation, centralisation and standardisation of our systems and pro-cesses are cornerstones of our IT strategy. This strategy also applies to acquired companies, which we move to our operational and administra-tive IT platforms as quickly as possible, only retaining systems that add additional value and which are not duplicated by our existing systems.
Our Group IT department oversees IT risks globally. In cooperation with the rest of the organisation, Group IT undertakes the implementation and operation of uniform systems, standards and controls, the decommis-sioning of redundant systems and oversees the coordinated reporting on operational status, security risks, etc.
We focus on rolling out centrally managed solutions worldwide to reduce the number of software and hardware applications in use. This allows for central management and monitoring of platforms, master data, control systems and security functions.
The Executive Board always sponsors strategic IT projects, ensuring that relevant resources are allocated to the projects and that the projects are progressing as planned or relevant actions are taken.
Risk assessment 2020The Panalpina acquisition in 2019 meant taking over a standalone business with separate data centres, IT systems and processes. Until Panalpina was fully moved to the DSV IT platform, this implied a period with two separate IT frameworks and an increased risk exposure in both operations and cybersecurity.
During 2020, the Panalpina operations have successfully been moved onto the DSV IT platform and the majority of the old Panalpina sys-tems closed down, reducing last year’s heightened exposure level.
Furthermore, we have experienced stable performance from our IT and security systems throughout 2020. This has been achieved whilst si-multaneously handling the added challenges of setting up large parts of our organisation to work from home as a consequence of the COVID-19 pandemic.
By the end of 2020, the overall IT risk exposure of the Group is back at a pre-acquisition level.
Risk descriptionAn economic recession, e.g. triggered by geopolitical events or a pandemic, will directly impact our activity level and consequently our financial results.
Similarly, protectionist measures enacted by the major world economic powers will have a negative impact on overall economic growth, al-though restrictions may be counterbalanced to some extent by increas-ing domestic activities and demand for custom clearance and other logistics services.
Finally, changing industry and consumer patterns leading to lower global trade volumes – e.g. as a consequence of increasing environmental awareness – is something we follow closely, although it must be noted that we have yet to see any real impact of this on our business.
Mitigation strategiesTo diversify our geographical exposure, we have for several years fo-cused on organic and acquisitive growth outside Europe, which histori-cally has been our main market.
We combine this strategy with a continued focus on staying true to our asset-light business model and with a high attention to process and cost optimisation.
Our asset-light approach implies that the majority of our terminals, warehouses and operational equipment are leased on short to medi-um-term contracts, with the average duration closely monitored to ac-commodate capacity requirements.
This allows us to quickly adapt to any potential slowdown in individual markets. We have a history of stable earnings margins, even in periods of declining freight volumes.
Risk assessment 2020The global economic recession triggered by the COVID-19 pandemic, continued frictions between the world’s major economic powers and the Brexit process have been high on the agenda for 2020 and will likely remain so for some time to come.
Our Company has successfully navigated through the global economic downturn in 2020, and the full-year results were higher than expected when the year started. This confirms the strength of our scalable business model and our organisation’s ability to react quickly to market changes.
Due to our more diversified regional exposure, larger scale and com-mercial opportunities gained with the Panalpina acquisition, we believe our business to be less vulnerable to macroeconomic risks now com-pared to before the acquisition.
Looking past the momentary effects of COVID-19 – the macroeco-nomic risk exposure of the Group has been reduced in the risk assess-ment for 2020.
ITsystem and process breakdowns
Macro-economy recession and regional exposure
31 DSV Panalpina Annual Report 2020 Corporate governance and shareholder information

Risk descriptionEmployees are a vital resource to DSV Panalpina.
Our business depends on highly qualified management teams and em-ployees with technical and operational qualifications at all organisational levels who are capable of handling situations out of the ordinary and jointly contributing to the Group’s financial results.
Failure to attract new talents or retaining existing, experienced key em-ployees can potentially have long-term consequences for the opera-tional, strategic and financial development of the Group.
Mitigation strategiesTo retain and attract the right colleagues, we strive to ensure that our company is an attractive place to work.
Across the organisation, we aim to offer an attractive working environ-ment to all employees. This includes a good and safe physical environ-ment in offices and warehouses, user-friendly IT systems, and emphasis on a healthy psychological environment, through good leadership, trans-parency and mutual respect.
We have established a performance culture based on employee empow-erment enabling our employees to influence their everyday work life. Additionally, we offer clear career advancing opportunities to talented employees.
We drive this strategy through several initiatives undertaken by both the local management teams and by our Group HR department. Examples include our updated Inclusion and Diversity Policy, employer branding activities and talent development programmes.
Risk assessment 2020Factoring in the reorganisations related to the DSV and Panalpina inte-gration, our overall employee turnover rate remained stable in 2020 and on par with previous years. Still, hiring and retaining the right peo-ple in certain parts and/or geographic areas of our business remains a challenge.
The Panalpina acquisition in 2019 led to concerns about key-employee retention as a consequence of the restructuring and reorganisation process. However, with the integration now behind us, we can conclude that we have been able to retain the required key employees from both organisations to a satisfactory degree.
At the end of 2020, exposure to employee-related risks is therefore less of a concern compared to the year before.
Risk descriptionAt all levels of our organisation and in all the countries we do business, we are committed to honest and ethical business practices and comply-ing with all relevant regulations.
As a result of our global operations, we are subject to extensive national and international regulatory requirements. In particular, regulation relat-ing to tax, customs, VAT, data privacy and competition law continue to increase in scope and complexity. Trade embargoes impacting interna-tional transports is another area undergoing continuous changes.
Cases of non-compliance may carry a long-term impact on our public reputation, which may negatively impact relationships with our custom-ers and other stakeholders. Additionally, cases of non-compliance may lead to fines, claims etc. for the Group, our Management and employees.
Mitigation strategiesThe tone at the top in DSV Panalpina is very clear: “We do not deal in compliance” is a mantra which is well-known throughout the organisa-tion. The high standards are set not only to safeguard the company and its employees, but simply because we believe it is the right thing to do as a global citizen.
Our internal procedures, systems and employee training programmes are designed to ensure conformity with relevant legislation and our Code of Conduct.
Our compliance framework is integrated into our business processes, containing clear guidelines on how to identify compliance-related issues and how to act accordingly. In addition, communicating and creating awareness of relevant topics is high on our agenda, enacted through regular news updates, global newsletters, webcasts, and internal conferences.
Significant compliance-related risks are monitored and managed from Group level in close cooperation with the local business units.
Risk assessment 2020Following the trend from previous years, regulatory requirements con-tinue to expand in scope and complexity within areas such as interna-tional taxation and transfer pricing, GDPR (data privacy) and goods/country restrictions.
Last year’s acquisition of Panalpina added further to this complexity as the acquisition implied taking over new business activities, which, until fully integrated, implied an increased risk of non-conformance with ex-isting compliance processes.
With a structured effort across the organisation, we have managed to successfully integrate the Panalpina business into our compliance framework.
Therefore – while regulatory complexity remains high – the finalisation of the Panalpina integration implies that the compliance risk exposure is back at a low level.
Employ-ees retention and attraction failure
Com-pliance fines, claims and damages, etc.
32 DSV Panalpina Annual Report 2020 Corporate governance and shareholder information

Risk descriptionGrowth through acquisitions is fundamental to our corporate strategy, and the current DSV Panalpina network is to a large extent a result of past strategic acquisitions.
Acquisitions always entail a risk of unsuccessful integration of the ac-quired company, which could result in cost synergies, strategic advan-tages and economies of scale being delayed or not fully realised.
Furthermore, deciding on and carrying out the wrong acquisition may be costly and take up valuable resources that could have been spent on other potential acquisition candidates.
Mitigation strategiesWe have a history of successful integration of acquired companies and realisation of expected synergies. This rests on several factors. First of all, we stress the importance of any potential acquiree matching our business model. During the due diligence process, we make sure to in-volve the right people from our organisation, considering all vital aspects of the business.
Our IT, reporting and operational systems are designed to be scalable and to accommodate effective integration. This means that we are able to integrate acquired companies quickly.
Large integrations are headed by an integration board, and the activities are organised into work streams (operational, commercial, financial, IT, legal, tax, etc.). The work streams systematically report on the progress and risks during the entire process. The integration of operational activi-ties is anchored and headed by local management teams based on guid-ance from Group Management. Local ownership ensures that acquired activities are well integrated.
Risk assessment 2020The acquisition of Panalpina in 2019 was the largest and most signifi-cant acquisition in the history of DSV, triggering a moderate increase in M&A risk reflecting the theoretical possibility of the acquisition failing.
The integration is now behind us, and both our systems and organisation have stood the test. The integration has been finalised according to plan and at lower cost than initially expected. The combined DSV Panalpina Group has successfully navigated through the first part of the COVID-19 pandemic whilst still delivering all-time high financial results.
For these reasons, the overall M&A risk exposure has been lowered in the Group risk assessment for 2020.
Risk descriptionAs with most industries, the freight forwarding business is undergoing gradual changes – both in terms of technological developments and the competitive landscape. This development is driven by both existing play-ers and new entrants to the market.
Currently, digitisation and automation of processes (quoting, booking, tracking, reporting and billing) are the most significant developments in the freight forwarding industry. These developments imply an opportu-nity to optimise workflows and increase productivity, while also providing higher levels of service and product offerings to our customers.
Failure to keep up, adapt to and utilise these new technological opportu-nities will lead to gradual long-term loss of market share and earnings.
Mitigation strategiesOur overall mitigation approach is centred on monitoring of the logistics market, technologies, customer offerings and other processes that could potentially impact the way we do business. As highlighted in the Techno-logical trends section (page 14), we see new technologies as opportuni-ties, not threats, and we are open to new ideas.
We focus on developing our services, systems and operational proce-dures to ensure that we have a strong and competitive product offering that fulfils our customers’ requirements and enables us to remain price competitive. The aim of our IT strategy is to ensure that we can continue to benefit from our scale and global network in the future (as a classic freight forwarder), while increasing our digital competences and utilise the benefits of technology.
An indirect impact of new technologies and changes in the competitive landscape is that some of the basic freight forwarding services are be-coming increasingly commoditised, leading to increasing price pressure. To compensate for this, we continuously seek to increase the scope of value-added services towards our customers.
Risk assessment 2020Failure to adapt the existing DSV Panalpina business model to new technologies, services or other related business opportunities remains a risk that we do not take lightly.
However, even though new technologies and related new ways of do-ing business continue to emerge, we are still to see new innovations that will have the potential to impact our core business in any signifi-cant way in the foreseeable future.
Likewise, we feel comfortable with our current technological initiatives, keeping us competitive and on a par with the industry development.
Consequently, the potential financial impact and likelihood of tech-nology risks occurring remain unchanged from last year.
M&A acquisitions and integration failure
Tech-nology disruption and tech-nological adoption
33 DSV Panalpina Annual Report 2020 Corporate governance and shareholder information

Risk descriptionWith the acquisition of UTi Worldwide in 2016 and Panalpina in 2019, the Group has grown significantly in less than five years, increasing both revenue and number of employees by more than 100%.
Our network and market position have been strengthened, but the growth carries several challenges; retaining focus on customers and op-erational excellence and maintaining a strong commercial collaboration across the globe. In short, we must protect the ‘DSV-DNA’ as we grow.
If we fail to adapt to the changes, our ability to execute on our organic growth strategy will be impaired and the long-term financial results of the Group will be lower.
Mitigation strategiesManaging this risk is anchored with the Executive Board and the Group Executive Committee. In this forum, strategic initiatives are aligned and cross-selling opportunities are explored. It is also part of the agenda of the Executive Committee to discuss and resolve any cooperation issues across the organisation.
Through regular business reviews with all the operational companies, Top Management ensures that each country is aligned with the Group’s strategy and policies. The business reviews include evaluation of financial performance, market situation, organisation, local strategic initiatives, etc.
While we hold on to a culture with local empowerment at country level, we have added strong central functions over the years to support growth, not least with large, global customers. This includes our Global Commercial Organisation, which focuses on key account management, competences within key industry verticals and our digital interaction with customers.
Risk assessment 2020As expected, our ability to achieve organic growth was reduced in 2020, due to our focus on the integration of Panalpina, and we estimate that we have lost some market share in Air & Sea.
With the integration behind us, we are now in a good position to get back on the organic growth path in the coming years. This is in line with the development we saw after the integration of UTi Worldwide and previous transactions.
Management will continue to focus on the issue to ensure that our organisation is efficient, motivated and works closely together.
Com-mercial failure to ex-ecute on or-ganic growth strategy
34 DSV Panalpina Annual Report 2020 Corporate governance and shareholder information

Corporate governance
Management structureTogether, the Board of Directors and the Executive Board form the gov-erning body of DSV Panalpina. The ultimate authority rests with the shareholders in general meeting.
The Board of Directors supervises and outlines the overall vision, strategy and objectives of the Group’s business activities.
The Executive Board is responsible for the execution of the strategy and objectives set, the overall day-to-day management of the Group and furthermore contributes essential input to the work of the Board of Directors.
The Board of Directors has established audit, nomination and remunera-tion committees to perform various preparatory tasks relating to key areas of the Board’s responsibilities.
The allocation of responsibilities between the Board of Directors and the Executive Board is defined by the Rules of Procedure.
Division Management is responsible for the day-to-day management of the operational activities of the divisions, supported by centralised group functions.
Board of DirectorsCompositionIn accordance with the Company’s Articles of Association, the Board of Directors must comprise at least five and not more than nine directors. Directors are elected for a term of one year, and new directors are elect-ed according to the applicable rules of the Danish Companies Act.
In 2020, Robert S. Kledal retired from the Board, and Niels Smedegaard was elected new member. Niels Smedegaard joins the Board with exten-sive management experience from positions held within the shipping, logistics and airline industries.
Competencies of the BoardThe composition of the Board of Directors is intended to ensure the diversity of the Board’s competency profile and that the Board is able to perform its duties effectively. Overboarding is also taken into con-sideration when evaluating the Board composition.
Current competencies required of the Board include knowledge of the transport sector, international commercial experience and experience in strategy, M&A, risk management, IT, human resources and accounting. See page 37 for a description of the Directors’ competencies and experience.
Board of Directors self-evaluationOnce every year, the Board of Directors performs an overall self-eva-luation focusing on the composition and competencies of the Board and the results achieved. In this regard, diversity, overboarding, internal management cooperation, succession planning and focus areas for the coming year are also con sidered.
The Chairman of the Board is in charge of the self-evaluation process. When completed, the self-evaluation report is presented to and dis-cussed by the Board.
Organisation
Air & SeaRoad Solutions
Board Committees
Group functions
Annual General Meeting
Board of Directors
Executive Board
Division Management
35 DSV Panalpina Annual Report 2020 Corporate governance and shareholder information

The DSV Panalpina Remuneration Policy is available at dsv.com/en/ about-dsv/corporate-responsibility/policies/remuneration-policy
Remuneration reportRemuneration of the Board of Directors and Executive Board is reported on separately in the DSV Panalpina Remuneration Report. The Report is prepared in accordance with section 139b of the Danish Companies Act and section 4.2.3 of the Danish Recommendations on Corporate Govern-ance and is available at dsv.com/en/about-dsv/corporate-responsibility/governance/remuneration-reports
Report on Corporate Governance cf. section 107b of the Danish Financial Statements ActIn managing DSV Panalpina, the Board of Directors actively applies the latest Recommendations on Corporate Governance issued by the Danish Committee on Corporate Governance.
The Board applies the Recommen dations as inspiration for setting up management structures, tasks and procedures and acting in accordance with the principal intentions of the Recommendations. The Board regularly assesses its procedures based on the Recommendations.
For 2020, DSV Panalpina has opted to partly derogate from one of the 47 Recommendations (3.5.1 regarding use of external assistance for the annual evaluation of the Board of Directors), but otherwise fully abides by the codex. The Board of Directors expects to be in full compliance with the recommendations during next year.
Adherence to the Recommendations, including reporting on internal con-trols and risk management systems applied as basis for the financial re-porting process, is reported on in the Statutory Report on Corporate Governance available at dsv.com/en/about-dsv/corporate-responsibility/governance/governance-report
The result of the self-evaluation conducted in 2020 did not give rise to any significant remarks and validated the appropriateness of the current Board composition. As such, the Board is considered to have the right competencies supporting the long-term value creation for our shareholders and is considered independent in accordance with the Danish Recommendations on Corporate Governance. Board meetingsThe Board of Directors held nine ordinary and two extraordinary board meetings in 2020. The meeting agenda is set according to the annual cycle of the Board, thus ensuring that the strategic and operational policy framework of the Group is reviewed and up to date.
Besides the work laid down in the annual cycle, the work of the Board in 2020 mainly focused on the integration of Panalpina and adapting the business to the consequences of the COVID-19 pandemic.
The meeting attendance of the Board members in 2020 is highlighted in the table below.
Board committees The three committees assist the Board of Directors within each their area of responsibility and evaluate and assess the material used for decisions by the Board of Directors, thereby ensuring the best possible preparation and focus on each topic before decisions are made.
The rules of procedure of the three committees are available at dsv.com/en/about-dsv/corporate-responsibility/governance/board-committees
Remuneration of the Board of Directors and the Executive BoardRemuneration PolicyRemuneration of the Board of Directors and the Executive Board is carried out in accordance with the DSV Panalpina Remuneration Policy as adopted by the annual general meeting. The intention of the Remuneration Policy is to ensure that DSV Panalpina is always able to attract and retain a qualified management team, to align management and shareholder interests and to incentivise the long-term value creation of the Company.
At the 2020 annual general meeting, a revised Remuneration Policy was approved. The Remuneration Policy was updated to comply with new requirements of the Danish Companies Act and with the intention of simplifying the Company’s existing remuneration practices.
Meeting attendance 2020
Board of Directors
Audit Committee
Nomination Committee
Remu ne ration Committee
Thomas Plenborg 11/11 3/3 2/2 2/2Jørgen Møller 11/11 - 2/2 2/2
Annette Sadolin 11/11 3/3 - -Birgit W. Nørgaard 11/11 - 2/2 -Marie-Louise Aamund 11/11 3/3 - -Beat Walti 11/11 - - 1/1Niels Smedegaard 8/8 2/2 - -
36 DSV Panalpina Annual Report 2020 Corporate governance and shareholder information

Thomas Plenborg
Office ChairmanMember since 2011Up for re-election YesBorn 1967
Jørgen Møller
Office Deputy chairmanMember since 2015Up for re-election YesBorn 1950
Jens Bjørn Andersen
Office CEOMember since 2008Born 1966
Jens H. Lund
Office CFOMember since 2002Born 1969
Executive Board
Board of Directors
Committee Audit Committee MemberNomination Committee ChairmanRemuneration Committee Chairman
Skills and experience• Management experience from directorships and honorary offices• Strategy and financial management• Professor of accounting and auditing at Copenhagen Business
School
Other Board positionsCM Everyday Luxury Feeling A/S ME COWI Holding A/S
Committee Audit Committee -Nomination Committee MemberRemuneration Committee Member
Skills and experience• General international management experience• Extensive experience in shipping and logistics • CEO of DSV Air & Sea Holding A/S 2002-2015
Marie-Louise Aamund
Office MemberMember since 2019Up for re-election Yes Born 1969
Committee Audit Committee MemberNomination Committee - Remuneration Committee -
Skills and experience• General international management experience• International tech leadership experience from Microsoft, IBM and
Google• Digital transformation and sustainability
Other Board positionsCM Environmental Technology Development and Demonstration
ProgramME KIRKBI A/SME Navico Group AS
Beat Walti
Office MemberMember since 2019 Up for re-election Yes Born 1968
Committee Audit Committee -Nomination Committee - Remuneration Committee Member
Skills and experience• Professional board and general management experience• Acquisition and divestment of enterprises• Dr. jur. and legal experience serving as attorney at law
Other Board positionsCM Ernst Göhner Foundation, RehaClinic AG DC Rahn AGME EGS Beteiligungen Ltd, Wenger & Vieli AG
Annette Sadolin
Office MemberMember since 2009Up for re-election YesBorn 1947
Committee Audit Committee ChairmanNomination Committee -Remuneration Committee -
Skills and experience• General international management experience• Acquisition and divestment of enterprises
Other Board positionsDC DSB ME Blue Square Re N.V. ME KNI A/S
Birgit W. Nørgaard
Office MemberMember since 2010Up for re-election YesBorn 1958
Committee Audit Committee -Nomination Committee MemberRemuneration Committee -
Skills and experience• General international management experience • Acquisition and divestment of enterprises• Strategy and financial management
Other Board positionsCM NO Invest A/S and two related subsidiaries DC NNE A/SDC The Danish Council for ICTDC Dansk Vækstkapital I
ME Dansk Vækstkapital IIME NCC AB*ME ABP Asspcoated British
PortsME WSP Global Inc.* ME RGS Nordic A/S
Niels Smedegaard
Office MemberMember since 2020Up for re-election Yes Born 1962
Committee Audit Committee MemberNomination Committee - Remuneration Committee -
Skills and experience• General international management experience• Extensive experience in shipping, logistics and the airline industry• Acquisition and divestment of enterprises
Other Board positions CM Norwegian Air Shuttle ASA* CM BikubenfondenCM Abacus Medicine A/SME Falck A/SME Royal Greenland A/S ME UK P&IME TT Club
CM = Chairman DC = Deputy Chairman ME = Member * = Listed company
37 DSV Panalpina Annual Report 2020 Corporate governance and shareholder information

Shareholder informationShare price performance in 2020 At year-end, the closing price of DSV Panalpina shares on Nasdaq Copenhagen was DKK 1,020.0, up 32.8% since year-end 2019.
During the same period, the Danish C25 Index increased by 33.7%.
The average daily trading volume of DSV Panalpina shares on Nasdaq Copenhagen was 484,818 shares in 2020 (0.2% of shares issued).
At year-end 2020, the market capitalisation of DSV Panalpina (excluding treasury shares) was DKK 231 billion against DKK 176 billion at the end of 2019, driven by the increase in share price.
OwnershipOn 31 December 2020, DSV Panalpina had 67,917 regis-tered shareholders. The registered shares totalled 222 million, corresponding to 96.5% of the share capital. The largest 25 of these shareholders owned 53.3% of the free-floating share capital.
DSV Panalpina has no majority shareholders. The Ernst Göhner Foundation from Switzerland has informed DSV Panalpina that they hold 10.72% of the share capital.
The following shareholders have flagged that they hold more than 5% of the share capital:
• BlackRock, Inc., USA (7.82%)• Capital Group Companies, USA (5.09%)• Morgan Stanley, USA (5.02%)
Cash distribution to shareholders Our capital allocation principles are described on page 16. The Company has increased both share buybacks and divi-dend paid over the last five years. The only exception was 2016, after the acquisition of UTi Worldwide Inc.
Share buyback and treasury shares In 2020, the Company acquired 6.2 million treasury shares at a total purchase price of DKK 5,031 million (average purchase price DKK 818.5 per share).
During 2020, 5,000,000 treasury shares were cancelled in connection with reduction of the registered share capital.
On 31 December 2020, the Company held 3.9 million shares as treasury shares, corresponding to 1.7% of the share capital.
On 9 February 2021, the Company’s portfolio of treasury shares amounted to 5.9 million shares.
Due to COVID-19, a share buyback programme was tem po-rarily suspended on 16 March 2020. Following the strong financial results and cash flow of the Group, a new share buy-back programme was launched on 29 October 2020. The purpose of the share buyback programmes is to accommo-date the exercise of share options under incentive sche mes and to adjust the capital structure in accordance with the financial targets.
DSV Panalpina share price (DKK)
Distribution of Capital (DKKm)
■ DSV ■ C25 rebased 01-01-2017
■ Dividends ■ Share buyback
2016 2017 2018 2020
Shares issued (‘000) 2016 2017 2018 2019 2020
Number of shares issued 190,000 190,000 188,000 235,000 230,000Average number of shares issued for the past 12 months 184,937 186,028 182,092 198,273 227,246Average diluted number of shares for the past 12 months 187,097 189,112 185,287 201,405 231,576
6,000
5,000
4,000
3,000
2,000
1,000
0
31/12 201731/12 2016 31/12 2018 31/12 2019 31/12 2020
1.200
1.000
800
600
400
200
0
327 3421,559
380
4,888 5,0314,161
423 588
2019
38 DSV Panalpina Annual Report 2020 Corporate governance and shareholder information

Company announcements A total of 43 company announ ce ments were published in 2020 (Nos. 810-852). The most important of these are listed below:
7 Feb. No. 815 Annual Report 2019
16 Mar. No. 825 Outlook for 2020 withdrawn and share buy-back suspended
16 Mar. No. 826 Annual General Meeting
30 Apr. No. 830 Interim Financial Report – Q1
22 Jun. No. 833 Trading update for Q2
31 Jul. No. 836 Interim Financial Report – H1
9 Oct. No. 839 Trading update for Q3
29 Oct. No. 841 Interim Financial Report – Q3
Number of shares of DKK 1 on 31 Dec. 2020 230,000,000
Share classes 1
Restrictions on transferability and voting rights None
Listed Nasdaq Copenhagen
Trading symbol DSV
ISIN code: DK0060079531
DSV Panalpina share data
The shares were acquired under the authorisation granted at the Annual General Meeting and in compliance with the Safe Harbour principles.
Dividends The Board of Directors proposes an ordinary dividend of DKK 4.00 per share for 2020 (2019: DKK 2.50).
Authorities granted to the Board The following authorities have been granted to the Board of Directors:
• To increase the Company’s share capital by issuing up to 48.3 million shares with or without pre-emptive rights for existing shareholders. The authority remains valid until 24 September 2024;
• To acquire up to 23.0 million own shares of which 4.1 million was utilised as per 9 February 2021. The authority remains valid until 16 March 2025.
Share capital reductionFollowing the acquisition of treasury shares, the Board of Directors intends to propose to the 2021 Annual General Meeting that the Board be authorised to reduce the share capital by a nominal value of DKK 6 million.
Communication with shareholders Through open and proactive communication, we aim to provide the basis for fair and efficient pricing of the DSV Panalpina share.
To keep investors updated, we host conference calls with Ex-ecutive Management following the release of financial results. Executive Management and Investor Relations preserved close contact with both existing and potential investors during 2020 by ensuring engagement with investors and analysts through
virtual roadshows and participation in virtual conferences hosted by various brokers, as in-person meetings have been very limited due to COVID-19.
We observe a four-week silent period prior to the publication of annual and interim reports.
DSV Panalpina is covered by 27 equity analysts. For more in-formation about analyst coverage, please visit investor.dsv
Financial calendarThe financial calendar for 2021 is as follows:
Annual General Meeting15 March
Q1 2021 Report27 April
H1 2021 Report29 July
Q3 2021 Report26 October
Denmark
19%
Shareholder geographical distribution
Other
7%
Belgium2%
Luxembourg
5%
UK12%
Switzerland13%
USA
36%
Ireland
6%
39 DSV Panalpina Annual Report 2020 Corporate governance and shareholder information

2020 2019
Q1 Q2 Q3 Q4 Full year Q1 Q2 Q3 Q4 Full year
Income statement (DKKm)Revenue* 27,309 28,782 28,125 31,716 115,932 19,979 20,079 24,521 30,122 94,701Gross profit* 6,684 7,386 7,252 7,212 28,534 5,114 5,285 6,271 7,084 23,754EBIT before special items* 1,566 2,613 2,725 2,616 9,520 1,454 1,631 1,785 1,784 6,654Operating margin (%) 5.7 9.1 9.7 8.2 8.2 7.3 8.1 7.3 5.9 7.0Conversion ratio (%) 23.4 35.4 37.6 36.3 33.4 28.4 30.9 28.5 25.2 28.0ROIC before tax (%) (trailing 12 months) 13.7 16.0 12.9 14.3 14.3 19.5 20.1 12.5 13.4 13.4Invested capital (YTD) 67,868 66,546 65,018 64,285 64,285 30,744 30,027 69,424 68,595 68,595
Segment information (DKKm)
Air & SeaRevenue 16,674 19,144 17,910 19,961 73,689 9,411 9,682 13,981 18,077 51,151Gross profit 3,875 4,663 4,303 4,068 16,909 2,424 2,529 3,443 4,121 12,517EBIT before special items 1,130 2,112 1,994 1,790 7,026 998 1,093 1,220 1,195 4,506Operating margin (%) 6.8 11.0 11.1 9.0 9.5 10.6 11.3 8.7 6.6 8.8Conversion ratio (%) 29.2 45.3 46.3 44.0 41.6 41.2 43.2 35.4 29.0 36.0
RoadRevenue 7,921 6,987 7,521 7,966 30,395 8,102 7,833 7,698 7,988 31,621Gross profit 1,535 1,431 1,585 1,587 6,138 1,561 1,535 1,528 1,532 6,156EBIT before special items 259 263 448 420 1,390 298 338 343 272 1,251Operating margin (%) 3.3 3.8 6.0 5.3 4.6 3.7 4.3 4.5 3.4 4.0Conversion ratio (%) 16.9 18.4 28.3 26.5 22.6 19.1 22.0 22.4 17.8 20.3
SolutionsRevenue 3,441 3,256 3,388 4,523 14,608 3,049 3,147 3,465 4,729 14,390Gross profit 1,256 1,271 1,313 1,529 5,369 1,126 1,186 1,256 1,401 4,969EBIT before special items 159 234 312 456 1,161 193 241 239 340 1,013Operating margin (%) 4.6 7.2 9.2 10.1 7.9 6.3 7.7 6.9 7.2 7.0Conversion ratio (%) 12.7 18.4 23.8 29.8 21.6 17.1 20.3 19.0 24.3 20.4
Please refer to page 79 for a definition and calculation of key figures and financial ratios.* Reference is made to note 2.1 Segment information for a reconciliation of revenue, gross profit and EBIT before special items.
Quarterly financial highlights
40 DSV Panalpina Annual Report 2020 Other information

Consolidated financial statements 2020Income statement . . . . . . . . . . . . . . . . . . . . . . . . . . . . . . . . . . . . . . . . . . . . . 42Statement of comprehensive income. . . . . . . . . . . . . . . . . . . . . . . . . . . . 42Cash flow statement . . . . . . . . . . . . . . . . . . . . . . . . . . . . . . . . . . . . . . . . . . 43Balance sheet . . . . . . . . . . . . . . . . . . . . . . . . . . . . . . . . . . . . . . . . . . . . . . . . . 44Statement of changes in equity . . . . . . . . . . . . . . . . . . . . . . . . . . . . . . . . . 45Notes. . . . . . . . . . . . . . . . . . . . . . . . . . . . . . . . . . . . . . . . . . . . . . . . . . . . . . . . . 46
41 DSV Panalpina Annual Report 2020 Consolidated financial statements 2020
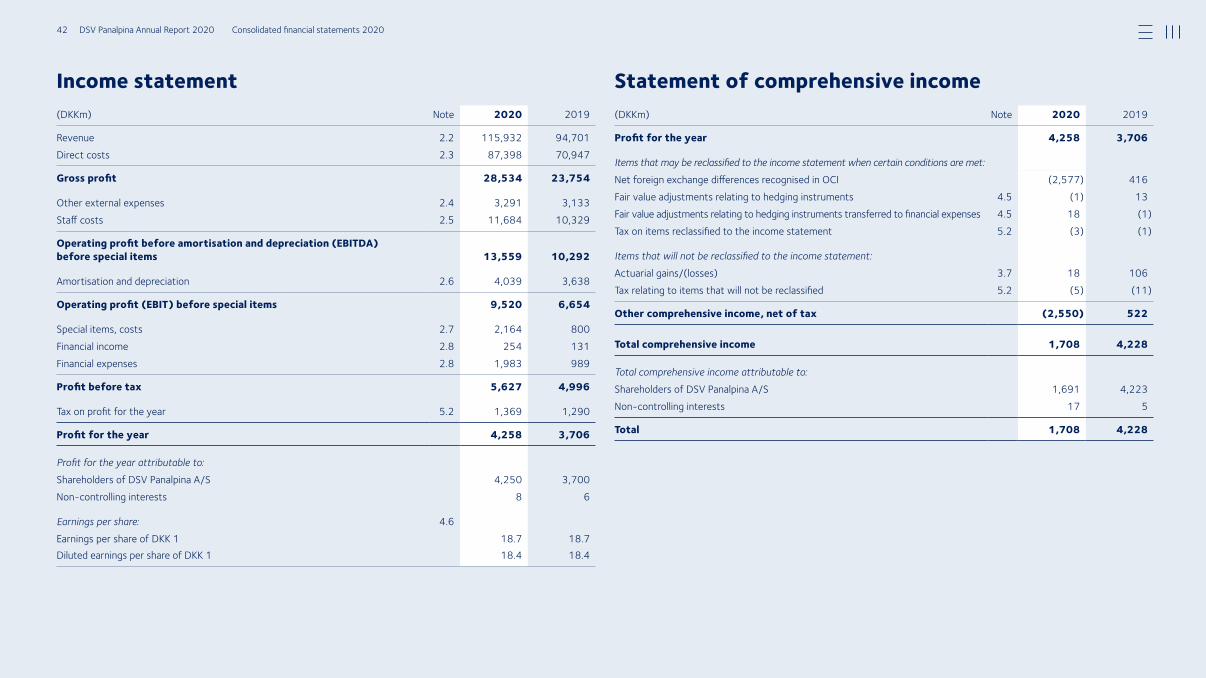
Income statement Statement of comprehensive income(DKKm) Note 2020 2019
Revenue 2.2 115,932 94,701Direct costs 2.3 87,398 70,947
Gross profit 28,534 23,754
Other external expenses 2.4 3,291 3,133Staff costs 2.5 11,684 10,329
Operating profit before amortisation and depreciation (EBITDA) before special items 13,559 10,292
Amortisation and depreciation 2.6 4,039 3,638
Operating profit (EBIT) before special items 9,520 6,654
Special items, costs 2.7 2,164 800Financial income 2.8 254 131Financial expenses 2.8 1,983 989
Profit before tax 5,627 4,996
Tax on profit for the year 5.2 1,369 1,290
Profit for the year 4,258 3,706
Profit for the year attributable to:Shareholders of DSV Panalpina A/S 4,250 3,700Non-controlling interests 8 6
Earnings per share: 4.6 Earnings per share of DKK 1 18.7 18.7Diluted earnings per share of DKK 1 18.4 18.4
(DKKm) Note 2020 2019
Profit for the year 4,258 3,706
Items that may be reclassified to the income statement when certain conditions are met:Net foreign exchange differences recognised in OCI (2,577) 416Fair value adjustments relating to hedging instruments 4.5 (1) 13Fair value adjustments relating to hedging instruments transferred to financial expenses 4.5 18 (1)Tax on items reclassified to the income statement 5.2 (3) (1)
Items that will not be reclassified to the income statement: Actuarial gains/(losses) 3.7 18 106Tax relating to items that will not be reclassified 5.2 (5) (11)
Other comprehensive income, net of tax (2,550) 522
Total comprehensive income 1,708 4,228
Total comprehensive income attributable to:Shareholders of DSV Panalpina A/S 1,691 4,223Non-controlling interests 17 5
Total 1,708 4,228
42 DSV Panalpina Annual Report 2020 Consolidated financial statements 2020
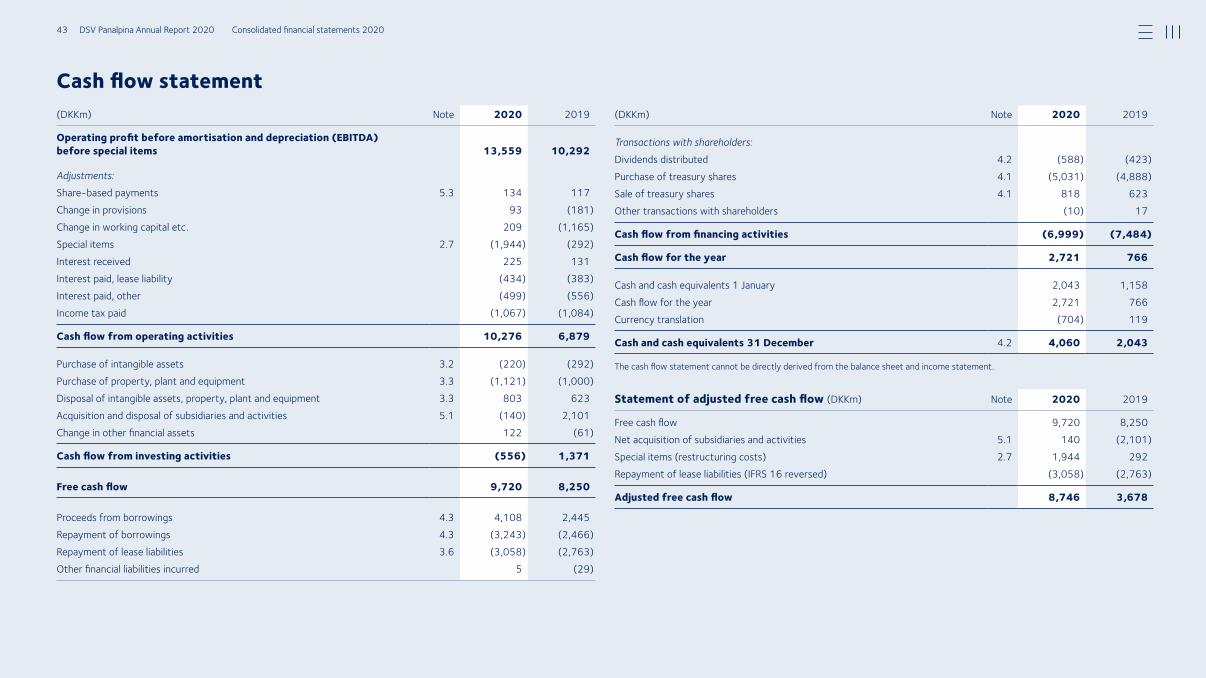
Cash flow statement(DKKm) Note 2020 2019
Operating profit before amortisation and depreciation (EBITDA) before special items 13,559 10,292
Adjustments:Share-based payments 5.3 134 117Change in provisions 93 (181)Change in working capital etc. 209 (1,165)Special items 2.7 (1,944) (292)Interest received 225 131Interest paid, lease liability (434) (383)Interest paid, other (499) (556)Income tax paid (1,067) (1,084)
Cash flow from operating activities 10,276 6,879
Purchase of intangible assets 3.2 (220) (292)Purchase of property, plant and equipment 3.3 (1,121) (1,000)Disposal of intangible assets, property, plant and equipment 3.3 803 623Acquisition and disposal of subsidiaries and activities 5.1 (140) 2,101Change in other financial assets 122 (61)
Cash flow from investing activities (556) 1,371
Free cash flow 9,720 8,250
Proceeds from borrowings 4.3 4,108 2,445Repayment of borrowings 4.3 (3,243) (2,466)Repayment of lease liabilities 3.6 (3,058) (2,763)Other financial liabilities incurred 5 (29)
(DKKm) Note 2020 2019
Transactions with shareholders:Dividends distributed 4.2 (588) (423)Purchase of treasury shares 4.1 (5,031) (4,888)Sale of treasury shares 4.1 818 623Other transactions with shareholders (10) 17
Cash flow from financing activities (6,999) (7,484)
Cash flow for the year 2,721 766
Cash and cash equivalents 1 January 2,043 1,158Cash flow for the year 2,721 766Currency translation (704) 119
Cash and cash equivalents 31 December 4.2 4,060 2,043
The cash flow statement cannot be directly derived from the balance sheet and income statement.
Statement of adjusted free cash flow (DKKm) Note 2020 2019
Free cash flow 9,720 8,250Net acquisition of subsidiaries and activities 5.1 140 (2,101)Special items (restructuring costs) 2.7 1,944 292Repayment of lease liabilities (IFRS 16 reversed) (3,058) (2,763)
Adjusted free cash flow 8,746 3,678
43 DSV Panalpina Annual Report 2020 Consolidated financial statements 2020

Balance sheetAssets (DKKm) Note 2020 2019
Intangible assets 3.2 48,665 51,988Right-of-use (ROU) assets 3.6 11,111 11,671Property, plant and equipment 3.3 3,014 3,022Other receivables 372 494Deferred tax assets 5.2 2,536 2,164
Total non-current assets 65,698 69,339
Trade receivables 4.4 19,038 18,252Contract assets 3.4 3,283 3,054Inventories 3.5 1,426 1,324Other receivables 2,635 3,410Cash and cash equivalents 4,060 2,043Assets held for sale 3.3 110 135
Total current assets 30,552 28,218
Total assets 96,250 97,557
Equity and liabilities (DKKm) Note 2020 2019
Share capital 4.1 230 235Reserves and retained earnings 4.1 47,155 49,195
DSV Panalpina A/S shareholders’ share of equity 47,385 49,430
Non-controlling interests (88) (111)
Total equity 47,297 49,319
Lease liabilities 3.6 9,428 9,227Borrowings 4.3 7,696 6,464Pensions and similar obligations 3.7 1,219 1,494Provisions 3.8 1,253 1,282Deferred tax liabilities 5.2 243 455
Total non-current liabilities 19,839 18,922
Lease liabilities 3.6 2,850 3,385Borrowings 4.3 1,185 1,520Trade payables 4.4 9,926 9,783Accrued cost of services 3.4 5,913 5,330Provisions 3.8 1,525 1,157Other payables 6,316 7,201Tax payables 1,399 940
Total current liabilities 29,114 29,316
Total liabilities 48,953 48,238
Total equity and liabilities 96,250 97,557
44 DSV Panalpina Annual Report 2020 Consolidated financial statements 2020

Statement of changes in equity2020 2019
Attributable to shareholders of DSV Panalpina A/S Attributable to shareholders of DSV Panalpina A/S
(DKKm) Share capital Reserves*Retained earnings Total
Non-con trolling
interests Total equityShare
capital Reserves*Retained earnings Total
Non-con trolling
interests Total equity
Equity at 1 January as previously reported 235 (265) 49,460 49,430 (111) 49,319 188 (704) 15,077 14,561 (29) 14,532Impact of accounting policy change ** - - - - - - - - (593) (593) (16) (609)
Equity at 1 January 235 (265) 49,460 49,430 (111) 49,319 188 (704) 14,484 13,968 (45) 13,923
Profit for the year - - 4,250 4,250 8 4,258 - - 3,700 3,700 6 3,706Other comprehensive income, net of tax - (2,573) 14 (2,559) 9 (2,550) - 435 88 523 (1) 522
Total comprehensive income for the year - (2,573) 4,264 1,691 17 1,708 - 435 3,788 4,223 5 4,228
Transactions with shareholders:Share-based payments - - 134 134 - 134 - - 117 117 - 117Tax on share-based payments - - 383 383 - 383 - - 412 412 - 412Dividends distributed - - (588) (588) (3) (591) - - (423) (423) (1) (424)Purchase of treasury shares - (6) (5,025) (5,031) - (5,031) - (7) (4,881) (4,888) - (4,888)Sale of treasury shares - 3 1,367 1,370 - 1,370 - 2 768 770 - 770Capital increase - - - - - - 56 - 35,202 35,258 - 35,258Capital reduction (5) 5 - - - - (9) 9 - - - -Addition/disposal of non-controlling interests - - - - 1 1 - - - - (124) (124)Dividends on treasury shares - - 23 23 - 23 - - 22 22 - 22Other adjustments - - (27) (27) 8 (19) - - (29) (29) 54 25
Total transactions with shareholders (5) 2 (3,733) (3,736) 6 (3,730) 47 4 31,188 31,239 (71) 31,168
Equity at 31 December 230 (2,836) 49,991 47,385 (88) 47,297 235 (265) 49,460 49,430 (111) 49,319
* For a specification of reserves, please see note 4.1. ** Cumulative effect of applying IFRS 16 Leases in 2019.
45 DSV Panalpina Annual Report 2020 Consolidated financial statements 2020

Chapter 1
Basis of preparationIntroduction . . . . . . . . . . . . . . . . . . . . . . . . . . . . . . . . . 47Basis of measurement . . . . . . . . . . . . . . . . . . . . . . . . . . . 47Changes in accounting policies . . . . . . . . . . . . . . . . . . . . . . 47Management judgements and estimates . . . . . . . . . . . . . . . . 47Basis of consolidation . . . . . . . . . . . . . . . . . . . . . . . . . . . 47Foreign currency . . . . . . . . . . . . . . . . . . . . . . . . . . . . . . 48Presentation. . . . . . . . . . . . . . . . . . . . . . . . . . . . . . . . . 48New accounting regulations . . . . . . . . . . . . . . . . . . . . . . . . 48
Chapter 2
Profit for the year2.1 Segment information. . . . . . . . . . . . . . . . . . . . . . . . . 492.2 Revenue . . . . . . . . . . . . . . . . . . . . . . . . . . . . . . . . 512.3 Direct costs . . . . . . . . . . . . . . . . . . . . . . . . . . . . . . 522.4 Other external expenses. . . . . . . . . . . . . . . . . . . . . . . 522.5 Staff costs. . . . . . . . . . . . . . . . . . . . . . . . . . . . . . . 522.6 Amortisation and depreciation . . . . . . . . . . . . . . . . . . . 522.7 Special items . . . . . . . . . . . . . . . . . . . . . . . . . . . . . 532.8 Financial income and expenses . . . . . . . . . . . . . . . . . . . 53
Chapter 3
Operating assets and liabilities3.1 Impairment testing . . . . . . . . . . . . . . . . . . . . . . . . . . 543.2 Intangible assets . . . . . . . . . . . . . . . . . . . . . . . . . . . 56
3.3 Property, plant and equipment . . . . . . . . . . . . . . . . . . . 573.4 Contract assets and accrued costs of services . . . . . . . . . . 583.5 Inventories . . . . . . . . . . . . . . . . . . . . . . . . . . . . . . 583.6 Leases . . . . . . . . . . . . . . . . . . . . . . . . . . . . . . . . . 583.7 Pension obligations . . . . . . . . . . . . . . . . . . . . . . . . . . 603.8 Provisions . . . . . . . . . . . . . . . . . . . . . . . . . . . . . . . 62
Chapter 4
Capital structure and finances4.1 Equity . . . . . . . . . . . . . . . . . . . . . . . . . . . . . . . . . 634.2 Capital structure and capital allocation . . . . . . . . . . . . . . . 644.3 Financial liabilities . . . . . . . . . . . . . . . . . . . . . . . . . . . 654.4 Financial risks . . . . . . . . . . . . . . . . . . . . . . . . . . . . . 664.5 Derivative financial instruments. . . . . . . . . . . . . . . . . . . 694.6 Earnings per share . . . . . . . . . . . . . . . . . . . . . . . . . . 704.7 Financial instruments – fair value hierarchy . . . . . . . . . . . . 70
Chapter 5
Other notes5.1 Acquisition and disposal of entities . . . . . . . . . . . . . . . . . 715.2 Tax . . . . . . . . . . . . . . . . . . . . . . . . . . . . . . . . . . . 725.3 Share option schemes . . . . . . . . . . . . . . . . . . . . . . . . 755.4 Remuneration of the Executive Board and
the Board of Directors . . . . . . . . . . . . . . . . . . . . . . . . 775.5 Fees to auditors appointed at the Annual General Meeting . . . 775.6 Related-party transactions . . . . . . . . . . . . . . . . . . . . . 785.7 Contingent liabilities and security for debt. . . . . . . . . . . . . 78
Table of contentsNotes to the consolidated financial statements
46 DSV Panalpina Annual Report 2020 Consolidated financial statements 2020

Chapter 1
IntroductionThe Annual Report of DSV Panalpina A/S comprises the consolidated fi-nancial statements of DSV Panalpina A/S and its subsidiaries.
The Board of Directors considered and approved the 2020 Annual Re-port of DSV Panalpina A/S on 10 February 2021. The Annual Report will be submitted to the shareholders of DSV Panalpina A/S for approval at the Annual General Meeting on 15 March 2021.
Basis of measurementAll amounts in the Annual Report are stated in Danish kroner (DKK) and rounded to the nearest million. The Annual Report has been prepared un-der the historical cost convention with the exception of derivative finan-cial instruments and acquisition opening balances, which are measured at fair value. Non-current assets held for sale are measured at the lower of their carrying amount and fair value less costs to sell. The accounting policies described in the notes have been applied consistently for the fi-nancial year and for the comparative figures.
Changes in accounting policiesAll amendments to the International Financial Reporting Standards (IFRS) effective for the financial year 2020 have been implemented as basis for preparing the consolidated financial statements and notes to the state-ments.
None of the implementations has had any material impact on the state-ments or notes presented.
Management judgements and estimatesIn preparing the consolidated financial statements, Management makes various accounting judgements and estimates that affect the reported amounts and disclosures in the financial statements and notes to the statements. These are based on professional experience, historical data and other factors available to Management.
By nature, a degree of uncertainty is involved when carrying out these judgements and estimates, hence actual results may deviate from the assessments made at the reporting date. Judgements and estimates are continuously evaluated, and the effects of any changes are recognised in the relevant period.
The primary financial statements items for which more significant ac-counting estimates are applied are listed below:
• Contract assets and accrued cost of services (note 3.4)• Provisions (note 3.8)• Tax (note 5.2)
Additional description of management judgements and estimates made are described in the relevant notes.
Basis of consolidationThe consolidated financial statements include the Parent Company (DSV Panalpina A/S) and all subsidiaries over which DSV Panalpina A/S exer-cises control. Entities in which the Group directly or indirectly controls at least 20%, but not more than 50%, of the voting power are accounted for as associates and measured using the equity method. Investments with negative net asset values are recognised at DKK 0.
The consolidated financial statements are prepared based on uniform accounting policies in all Group entities. Consolidation of Group entities is performed after elimination of all intra-group transactions, balances, income and expenses.
Basis of preparation
The 2020 Annual Report of DSV Panalpina A/S has been prepared in accordance with International Financial Reporting Standards (IFRS) as issued by the International Accounting Standards Board (IASB) and in accordance with IFRS as endorsed by the European Union and further requirements in the Danish Financial Statements Act.
47 DSV Panalpina Annual Report 2020 Consolidated financial statements 2020

Group compositionThe Group holds interests in 386 entities and was composed as follows at 31 December 2020:
Entities (Number)
Region
EMEA Americas APAC Total
Subsidiaries 255 50 74 379Associates 6 1 - 7
Foreign currency
Functional currencyA functional currency is determined for each Group entity. The functional currency is the currency used in the primary financial environment in which the individual Group entity operates.
Foreign currency translationOn initial recognition, foreign currency transactions are translated into the functional currency at the exchange rate at the transaction dates. Foreign currency translation differences between the exchange rates at the transaction date and the date of payment are recognised in the income statement under financials.
Monetary items denominated in a foreign currency are translated at the exchange rate at the reporting date. The difference between the ex-change rates at the reporting date and the transaction date or the ex-change rate used in the latest annual report is recognised in the income statement under financials.
Foreign currency translation differences arising on the translation of non-monetary items, such as investments in associates, are recognised directly in other comprehensive income.
Recognition in the consolidated financial statements On preparation of the consolidated financial statements, the income statements of entities with a functional currency other than DKK are translated at the average exchange rate for the period, and balance sheet items are translated at the exchange rate ruling at the reporting date.
Foreign exchange differences arising on translation of the equity of for-eign entities and on translation of receivables considered part of net investment are recognised directly in other comprehensive income.
Foreign exchange differences arising on the translation of income state-ments from the average exchange rate for the period to the exchange rate at the reporting date are also recognised in other comprehensive income. Adjustments are presented under a separate translation reserve in equity.
Presentation
Cash flow statementThe cash flow statement is prepared using the indirect method based on operating profit before amortisation, depreciation and special items. The cash flow statement cannot be derived directly from the balance sheet and income statement.
Materiality in financial reportingIn preparing the Annual Report, Management seeks to improve the in-formation value of the consolidated financial statements, the notes to the statements and other measures disclosed by presenting the informa-tion in a way that supports the understanding of the Group’s perfor-mance in the reporting period.
This objective is achieved by presenting fair transactional aggregation levels on items and other financial information, emphasising information that is considered of material importance to the user and making rele-vant rather than generic descriptions throughout the Annual Report.
All disclosures are made in compliance with the International Financial Reporting Standards, the Danish Financial Statements Act and other rel-evant regulations, ensuring a true and fair view throughout the Annual Report.
Presentation of items and subtotalsThe presentation of items and subtotals is based on separate classifica-tion of material groups of similar items. In the income statement, income and expense items are classified based on the ‘nature of expense’ method in accordance with IAS 1. Furthermore, the use of special items is applied to improve the transparency and understanding of the Group’s financial statements by separating the core performance of the Group from exceptional items. For a definition and reconciliation of Group re-sults before and after special items, please see note 2.7 Special items.
New accounting regulationsThe IASB has issued a number of new standards and amendments not yet in effect or endorsed by the EU and therefore not relevant for the preparation of the 2020 consolidated financial statements. DSV Panalpina expects to implement these standards when they take effect.
None of the new standards issued are currently expected to have any significant impact on the Group’s financial statements when imple-mented.
48 DSV Panalpina Annual Report 2020 Consolidated financial statements 2020

Chapter 2
Profit for the year
This chapter includes disclosures on components of consolidated profit for the year. The consolidated profit is based on the combined results of our three operating segments – Air & Sea, Road and Solutions – as described in the following.
Reference is also made to the comments on the financial performance of the Group and the divisions in Management’s commentary.
Accounting policiesOperating segments are defined by the operational and management structure of DSV Panalpina, which is derived from the types of services we deliver and our geographical presence on the world market. As such, our operating segments reflect our divisional and Group reporting used for management decision-making.
Operating segmentsOur business operations are carried out by three divisions, forming the basis of our segment reporting.
Air & Sea The Air & Sea division provides air and sea freight services across the globe.
Road The Road division provides road freight services across Europe, North America and South Africa. Solutions The Solutions division offers contract logistics services, incl. warehousing and inventory management, across the globe.
Measurement of earnings by segmentOur business segments are measured and reported down to operating profit before special items. Segment results are accounted for in the same way as in the consolidated financial statements.
Segment income/expenses and assets/liabilities comprise the items di-rectly attributable to the individual segment as well as the items that may be allocated to the individual segment on a reliable basis.
Income and expenses relating to Group functions, investing activities, etc. are managed at Group level. These items are not included in the statement of segment information, but are presented under ‘Non- allocated items and eliminations’.
2.1 Segment information
Financial position of business segmentsAssets and liabilities are included in the segmental reporting to the extent they are used for the operation of the segment.
Assets and liabilities that cannot be attributed to any of the three seg-ments on a reliable basis are presented under ‘Non-allocated items and eliminations’.
Geographical information DSV Panalpina operates in most parts of the world and has activities in more than 80 countries, which are divided into the following geo-graphical regions:
• EMEA: Europe, Middle East and Africa• Americas: North and South America• APAC: Asia, Australia and the Pacific
Revenue and non-current assets are allocated to the geographical areas according to the country in which the individual consolidated entity is based. The corporate headquarter of DSV Panalpina is located in Denmark, which is included in the EMEA segment. DSV Panalpina business is based on transactions in our global network rather than in individual countries or regions. Therefore, goodwill is not allocated to regions.
Intersegment transactions are made on an arm’s length basis.
Major customersDSV Panalpina is not reliant on any major customers, as no single exter-nal customer exceeds 5% of combined Group revenue.
49 DSV Panalpina Annual Report 2020 Consolidated financial statements 2020

2.1 Segment information — continued Segment information – divisions (DKKm)
Air & Sea Road SolutionsNon-allocated items
and eliminations Total
2020 2019 2020 2019 2020 2019 2020 2019 2020 2019
Condensed income statementRevenue 73,032 50,527 28,410 30,042 13,747 14,046 743 86 115,932 94,701Intercompany revenue 657 624 1,985 1,579 861 344 (3,503) (2,547) - -
Divisional revenue 73,689 51,151 30,395 31,621 14,608 14,390 (2,760) (2,461) 115,932 94,701
Direct costs 56,780 38,634 24,257 25,465 9,239 9,421 (2,878) (2,573) 87,398 70,947
Gross profit 16,909 12,517 6,138 6,156 5,369 4,969 118 112 28,534 23,754
Other external expenses 2,870 2,267 1,021 1,060 1,089 1,088 (1,689) (1,282) 3,291 3,133Staff costs 6,048 5,093 2,799 2,864 1,449 1,306 1,388 1,066 11,684 10,329
Operating profit before amortisation, depreciation and special items 7,991 5,157 2,318 2,232 2,831 2,575 419 328 13,559 10,292
Amortisation and depreciation 965 651 928 981 1,670 1,562 476 444 4,039 3,638
Operating profit before special items* 7,026 4,506 1,390 1,251 1,161 1,013 (57) (116) 9,520 6,654
Total gross investments 1,233 12,107 1,161 1,291 1,754 2,277 369 24,503 4,517 40,178Total assets 51,047 45,429 22,123 20,508 16,024 13,771 7,056 17,849 96,250 97,557Total liabilities 50,560 46,681 16,107 13,747 12,435 11,686 (30,149) (23,876) 48,953 48,238
Geographical information – major countries (DKKm)
Revenue Non-current assets**
2020 2019 2020 2019
USA 19,386 14,534 882 947Germany 10,727 8,606 1,609 1,641Denmark 10,200 8,766 2,120 2,393Netherlands 5,853 3,926 1,319 1,133Sweden 4,769 4,695 960 934Other 64,997 54,174 8,315 9,185
Total 115,932 94,701 15,205 16,233
Geographical information – regions (DKKm)
Revenue Non-current assets**
2020 2019 2020 2019
EMEA 72,639 63,854 12,294 13,069Americas 28,191 20,687 1,632 1,778APAC 15,102 10,160 1,279 1,386
Total 115,932 94,701 15,205 16,233
** Non-current assets less tax assets, customer relationships and goodwill.
* Reference is made to the income statement for a reconciliation from operating profit before special items to profit for the year.
50 DSV Panalpina Annual Report 2020 Consolidated financial statements 2020

2.2 Revenue
Accounting policiesRevenue comprises freight forwarding services, contract logistics and other related services delivered in the finan cial year.
Revenue from services delivered is recognised in accordance with the over-time recognition principle following the satisfaction of various mile-stones as the performance obligation is fulfilled towards the customer. Our main services comprise air, sea, road and solutions services as de-scribed in the following.
Air services Air services comprise air freight logistics facilitating transportation of goods across the globe. Air services are reported within the Air & Sea reporting segment. Air services are characterised by short delivery times as most air transports are completed within a few days.
Sea servicesSea services comprise sea freight logistics facilitating transportation of goods across the globe. Sea services are reported within the Air & Sea reporting segment. Sea services are characterised by longer delivery times, averaging one month depending on destination.
Road servicesRoad services comprise road freight logistics facilitating transportation of goods by road networks mainly in Europe, the US and South Africa. Road services are reported within the Road reporting segment. Road services are characterised by short delivery times as most road transports are completed within a few days.
Solutions servicesSolutions services comprise contract logistics, incl. warehousing and in-ventory management across the globe. Solutions services are reported within the Solutions re porting segment. Solutions services are charac-terised by very short delivery times, happening almost instanta neously as agreed actions under the customer contract are carried out.
General recognition principlesRevenue from services delivered are recognised based on the price specified in the contract with the customer. Revenue is measured ex-cluding VAT and other tax collected on behalf of third parties, and any discounts are offset against the revenue. Incremental costs of obtaining a contract with a customer are not recognised as an asset but as an expense when incurred due to the short delivery times.
Trade receivables are recognised as services delivered are invoiced to the customer and are not adjusted for any financing components as credit terms are short – typically between 14 and 60 days – and the financing component therefore insignificant. Where services delivered have yet to be invoiced and invoices on services received from hauliers have still to be received, contract assets and accrued cost of services are recognised at the reporting date.
Revenue allocated to remaining performance obligations are not dis-closed following the practical expedient of IFRS 15.
Revenue also comprises income from sale of property projects in the form of sale of land and buildings acquired, constructed and held for sale in the ordinary course of business.
Revenue from property projects is recognised at a point in time in the reporting segment to which it relates when control of and legal title to the property has been transferred to the customer. Revenue is recog-nised based on the price specified in the contract with the customer, and the consideration is due upon transfer of the legal title. Delivery times on property projects are typically 8-18 months.
If the property is leased back after completion, the right-of-use asset arising from the leaseback is recognised at the proportion of the previous carrying amount of the asset that relates to the right of use retained by DSV Panalpina. As such, any gain or loss recognised only corresponds to rights transferred to the buyer.
Sale of services and geographical segmentation specify as follows:
Services and geogra phical segmentation (DKKm)
EMEA Americas APAC Total
2020 2019 2020 2019 2020 2019 2020 2019
Air services 18,187 12,554 11,405 8,393 15,163 6,187 44,755 27,134Sea services 14,607 14,279 8,874 6,816 5,453 2,922 28,934 24,017Road services 28,076 28,994 2,319 2,627 - - 30,395 31,621Solutions services 10,348 9,957 2,910 3,220 1,350 1,213 14,608 14,390
Total 71,218 65,784 25,508 21,056 21,966 10,322 118,692 97,162
Non-allocated items and eliminations (2,760) (2,461)
Total revenue 115,932 94,701
51 DSV Panalpina Annual Report 2020 Consolidated financial statements 2020

2.2 Revenue — continued 2.4 Other external expenses
2.6 Amortisation and depreciation
2.5 Staff costs
2.3 Direct costs
Accounting policiesOther external expenses include expenses relating to marketing, IT, other rent, training and education, office premises, travelling, communications as well as other selling costs and administrative expenses, less costs transferred to direct costs.
Sale of services includes revenue from freight forwarding services, con-tract logistics, sale of property projects and other related services. Sale of services recognised at a point in time constitutes less than 2% of total revenue (2019: less than 2%). Other operating income includes rental income from terminal and building leases, gains from disposal of non- current assets and income from insurance contracts.
RevenueRevenue is specified as follows:
Revenue (DKKm) 2020 2019
Sale of services 115,298 94,187Other operating income 634 514
Total revenue 115,932 94,701
Accounting policiesDirect costs comprise costs paid to generate the revenue for the year. Direct costs include settlement of accounts with haulage contractors, shipping companies, airlines, etc. Direct costs also include staff costs relating to hourly workers used for fulfilling orders and other direct costs of operation, such as rental of logistics facilities and costs of property projects.
Accounting policiesStaff costs include wages and salaries, pensions, social security costs and other staff costs for salaried employees, but exclude staff costs for hourly workers, which are recognised as direct costs.
Staff costs are recognised in the financial year in which the employee renders the related service. Costs related to long-term employee benefits, e.g. share-based payments, are recognised in the periods in which they are earned.
Reference is made to note 3.7 for detailed information on pension plans, note 5.4 for detailed information on remuneration of Management and note 5.3 for detailed information on the Group’s share option schemes and shares held by Management.
Accounting policiesAmortisation and depreciation for the year are recognised based on the amor-tisation and depreciation profiles of the underlying assets (see notes 3.2 and 3.3).
Direct costs (DKKm) 20192020
Cost of carriers 78,473 62,305Staff costs, hourly workers 5,274 5,299Other costs of operation 3,651 3,343
Direct costs 87,398 70,947
Other external expenses (DKKm) 2020 2019
Other external expenses 6,942 6,476Transferred to direct costs (3,651) (3,343)
Total other external expenses 3,291 3,133
Staff costs (DKKm) 2020 2019
Salaries and wages, etc. 14,137 13,136Defined contribution pension plans 578 526Defined benefit pension plans 27 22Other social security costs 2,082 1,827Share-based payments 134 117
Total staff costs 16,958 15,628
Recognised in the income statement items:Hourly workers – recognised as direct costs 5,274 5,299Salaried employees – recognised as staff costs 11,684 10,329
Total 16,958 15,628
Weighted average number of full-time employees 56,079 51,367Number of full-time employees at year-end 56,621 61,216
Amortisation and depre ci ation (DKKm) 20192020
Customer relationships 208 102Software and other intangible assets 332 320Buildings 154 154Other operating equipment 355 328ROU assets – Land and buildings 2,451 2,161
ROU assets – Other operating equipment 539 573
Total amortisation and depreciation 4,039 3,638
52 DSV Panalpina Annual Report 2020 Consolidated financial statements 2020
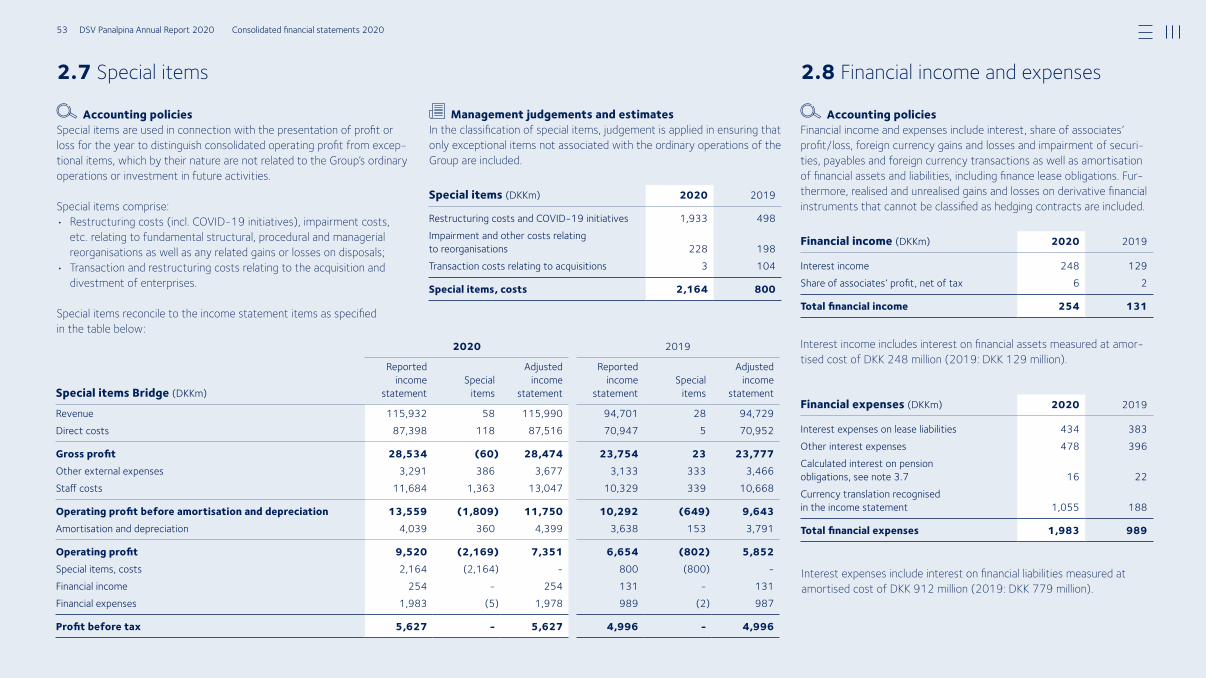
2.7 Special items 2.8 Financial income and expenses
Accounting policiesSpecial items are used in connection with the presentation of profit or loss for the year to distinguish consolidated operating profit from excep-tional items, which by their nature are not related to the Group’s ordinary operations or investment in future activities.
Special items comprise: • Restructuring costs (incl. COVID-19 initiatives), impairment costs,
etc. relating to fundamental structural, procedural and managerial reorganisations as well as any related gains or losses on disposals;
• Transaction and restructuring costs relating to the acqui sition and divestment of enterprises.
Special items reconcile to the income statement items as specified in the table below:
Accounting policiesFinancial income and expenses include interest, share of associates’ profit/loss, foreign currency gains and losses and impairment of securi-ties, payables and foreign currency transactions as well as amortisation of financial assets and liabilities, including finance lease obligations. Fur-thermore, realised and unrealised gains and losses on derivative financial instruments that cannot be classified as hedging contracts are included.
Interest income includes interest on financial assets measured at amor-tised cost of DKK 248 million (2019: DKK 129 million).
Interest expenses include interest on financial liabilities measured at amortised cost of DKK 912 million (2019: DKK 779 million).
2020 2019
Special items Bridge (DKKm)
Reported income
statementSpecial
items
Adjusted income
statement
Reported income
statementSpecial
items
Adjusted income
statement
Revenue 115,932 58 115,990 94,701 28 94,729Direct costs 87,398 118 87,516 70,947 5 70,952
Gross profit 28,534 (60) 28,474 23,754 23 23,777Other external expenses 3,291 386 3,677 3,133 333 3,466Staff costs 11,684 1,363 13,047 10,329 339 10,668
Operating profit before amortisation and depreciation 13,559 (1,809) 11,750 10,292 (649) 9,643Amortisation and depreciation 4,039 360 4,399 3,638 153 3,791
Operating profit 9,520 (2,169) 7,351 6,654 (802) 5,852Special items, costs 2,164 (2,164) - 800 (800) -Financial income 254 - 254 131 - 131Financial expenses 1,983 (5) 1,978 989 (2) 987
Profit before tax 5,627 - 5,627 4,996 - 4,996
Management judgements and estimatesIn the classification of special items, judgement is applied in ensuring that only exceptional items not associated with the ordinary operations of the Group are included.
Special items (DKKm) 2020 2019
Restructuring costs and COVID-19 initiatives 1,933 498Impairment and other costs relating to reorganisations 228 198Transaction costs relating to acquisitions 3 104
Special items, costs 2,164 800
Financial income (DKKm) 2020 2019
Interest income 248 129Share of associates’ profit, net of tax 6 2
Total financial income 254 131
Financial expenses (DKKm) 2020 2019
Interest expenses on lease liabilities 434 383Other interest expenses 478 396Calculated interest on pension obligations, see note 3.7 16 22Currency translation recognisedin the income statement 1,055 188
Total financial expenses 1,983 989
53 DSV Panalpina Annual Report 2020 Consolidated financial statements 2020
Chapter 3
Operating assets and liabilitiesThis chapter includes notes disclosures on the Group’s invested capital that forms the basis of our business activities. Invested capital represents the Group’s property, plant and equipment, intangible assets and net working capital in the form of operating assets and liabilities.
Invested capital is structured based on our asset-light business model, including our focus on minimising funds tied up in work-ing capital to optimise the generation of available free cash flow. Invested capital also comprises significant intangible assets mainly relating to acquired goodwill from business combinations carried out over the years.
Accounting policiesGoodwillThe carrying amount of goodwill is tested for impairment at least annu-ally together with other non-current assets of the Group.
Impairment testing is performed for each cash-generating unit to which consolidated goodwill is allocated, as defined by our divisional manage-ment and operational structure. The cash-generating units thereby fol-low our divisional structure: Air & Sea, Road and Solutions.
Goodwill is written down to its recoverable amount through the income statement if lower than the carrying amount.
The recoverable amount is determined as the present value of the dis-counted future net cash flow from the cash-generating unit to which the goodwill relates. In calculating the present value, discount rates are ap-plied reflecting the risk-free interest rate with the addition of risks relat-ing to the individual cash-generating units, such as geographical and fi-nancial exposure.
Other non-current intangible assets, property, plant and equipmentThe carrying amount of other non-current assets is tested for impair-ment at least once a year in connection with the impairment test of goodwill. If the tests show evidence of impairment, the asset is written down to the recoverable amount through the income statement if lower than the carrying amount. The recoverable amount is the higher of the fair value of the asset less the expected costs to sell and its value in use.
The value in use is calculated as the present value of expected future cash flows from the asset or the division of which the asset forms part.
3.1 Impairment testing
Management judgements and estimatesFor goodwill impairment testing, a number of estimates are made on the development in revenues, gross profits, operating margins, future capital expenditures, discount rates and growth expectations in the terminal pe-riod. These are based on an assessment of current and future develop-ments in the three cash-generating units and on historical data and as-sumptions of future expected market developments, including expected long-term average market growth rates.
Material value drivers affecting the future net cash flows of the three cash-generating units are:
Air & SeaThe Air & Sea division operates globally, so developments in the global economy and world trade therefore have a material impact on the divi-sion’s future net cash flow. Developments in gross profit per shipment, cost management initiatives and development in internal productivity (number of shipments per employee) also affect the division’s cash flow.
RoadThe Road division mainly operates on the European market, which means that the division’s future net cash flow is affected by the growth rate in this region. Developments in gross profit per shipment, including truck and terminal utilisation rates, cost management initiatives and devel-opment in internal productivity (number of shipments per employee) also affect the division’s cash flow.
SolutionsThe Solutions division operates globally, so developments in the global economy and world trade therefore have a material impact on the divi-sion’s future net cash flow. Developments in warehouse lease costs and costs of related services, utilisation of warehouse facilities, cost manage-ment initiatives and development in internal productivity (number of or-der lines per employee) also affect the division’s cash flows.
54 DSV Panalpina Annual Report 2020 Consolidated financial statements 2020

3.1 Impairment testing — continued
The expected future net cash flow is based on budgets and business plans approved by Management for the year 2021 and projections for subsequent years up to and including 2025. From 2025 onwards, DSV Panalpina expects the growth rate to remain in line with the expected long-term average growth rate for the industry.
Goodwill impairment test at 31 December 2020 (DKKm)2020 2019
Air & Sea Road Solutions Air & Sea Road Solutions
Carrying amount of goodwill 36,883 6,006 4,587 38,841 6,092 5,317
Budget periodAnnual revenue growth 4.0% 4.0% 4.0% 4.0% 3.0% 5.0%Operating margin 9.5% 4.6% 7.9% 8.7% 4.3% 7.3%
Terminal periodGrowth 2.5% 2.5% 2.5% 2.5% 2.5% 2.5%Pre-tax discount rate 7.2% 5.4% 6.5% 7.2% 5.1% 7.0%
Sensitivity analysisGrowth in budget period – allowed decline (percentage points) 29.6% 42.7% 26.7% 23.0% 35.4% 18.3%Discount rate – allowed increase (percentage points) 7.4% 5.2% 6.7% 6.2% 8.2% 4.0%
Impairment test Goodwill was tested for impairment at 31 December 2020. The tests did not result in any impairment of carrying amounts.
The assumptions used, including a sensitivity analysis, are stated in the fol-lowing. The pre-tax discount rate is calculated in accordance with IAS 36.
The sensitivity analysis assesses the impact of changes in cash flows and discount rates on the impairment test results. The analysis concluded that even negative changes, which are unlikely to occur, will not result in impairment of goodwill in any of the three cash-generating units.
Sensitivity analysisThe sensitivity analysis shows the lowest possible growth rate or highest possible discount rate in percentage points by which the assumptions used can change before goodwill becomes impaired.
Other non-current intangible assets, property, plant and equipmentOther non-current assets were also tested for impairment indications together with goodwill at 31 December 2020. No indication of impairment was identified in connection with these tests.
55 DSV Panalpina Annual Report 2020 Consolidated financial statements 2020

3.2 Intangible assets
Accounting policiesGoodwillOnly goodwill arising from business combinations is recognised in the fi-nancial statements. Goodwill is measured as the difference between the total of the fair value of the consideration transferred, the value of non-controlling interests and any equity investments previously held in the acquiree, compared to the fair value of identifiable net assets on the date of acquisition.
Goodwill is not amortised, but is tested for impairment at least annually.
Customer relationshipsOn initial recognition, customer relationships identified from business combinations are recognised in the balance sheet at fair value. Subse-quently, customer relationships are measured at fair value less accumu-lated amortisation and impairment losses.
Customer relationships are amortised over a period of eight years using the diminishing balance method.
2020 2019
Intangible assets (DKKm) GoodwillCustomer
relationships SoftwareSoftware in
progress Total GoodwillCustomer
relationships SoftwareSoftware in
progress Total
Cost at 1 January 50,250 2,059 2,316 230 54,855 15,508 1,320 2,333 363 19,524Additions from business combinations/previous period adjustments (35) - - - (35) 34,529 732 7 - 35,268Additions for the year - - 26 194 220 - - 39 253 292Disposals - - (1,276) - (1,276) - - (485) (1) (486)Reclassifications - - 215 (215) - - - 420 (386) 34Currency translation (2,739) (27) (16) (3) (2,785) 213 7 2 1 223
Total cost at 31 December 47,476 2,032 1,265 206 50,979 50,250 2,059 2,316 230 54,855
Total amortisation and impairment at 1 January - 1,368 1,499 - 2,867 - 1,259 1,523 - 2,782Amortisation and impairments for the year - 208 332 - 540 - 102 320 - 422Disposals - (1,056) - (1,056) - (1) (378) - (379)Reclassification - - - - 1 36 - 37Currency translation - (25) (12) - (37) - 7 (2) - 5
Total amortisation and impairment at 31 December - 1,551 763 - 2,314 - 1,368 1,499 - 2,867
Carrying amount at 31 December 47,476 481 502 206 48,665 50,250 691 817 230 51,988
Computer software and software in progressComputer software bought or developed for internal use is measured at the lower of cost less accumulated amortisation and impairment losses and the recoverable amount. Cost comprises payments for the software and other directly attributable expenses of preparing the software for its intended use.
After commissioning, software is amortised on a straight-line basis over its expected useful life. The amortisation period is 1-10 years.
56 DSV Panalpina Annual Report 2020 Consolidated financial statements 2020

3.3 Property, plant and equipment
Accounting policiesLand and buildings and other plant and operating equipment are meas-ured at cost less accumulated depreciation and impairment losses.
The cost comprises the acquisition price and other directly attributable expenses of preparing the asset for its intended use. The present value of estimated expenses for dismantling and disposing of the asset as well as restoration expenses are added to the cost if such expenses are rec-
ognised as a provision. Material borrowing costs directly attributable to the construction of the individual asset are also added to cost.
If the individual components of an asset have different useful lives, each component will be depreciated separately.
The cost of self-constructed assets comprises direct and indirect costs for materials, components, subcontractors, wages and salaries. Costs for self-constructed assets are recognised as property, plant and equipment in progress on an ongoing basis until the assets are ready for use.
Subsequent costs, such as partial replacement of property, plant and equipment, are included in the carrying amount of the asset in question when it is probable that such costs will result in future economic benefits.
The carrying amount of the replaced parts is derecognised from the balance sheet and recognised in the income statement.
2020 2019
Property, plant and equipment (DKKm)Land and buildings
Other plant and operating
equipment
Property, plant and equipment
in progress TotalLand and buildings
Other plant and operating
equipment
Property, plant and equipment
in progress Total
Cost at 1 January 2,663 2,772 99 5,534 2,041 2,254 116 4,411Additions from business combinations/previous period adjustments 11 - - 11 556 126 6 688Additions for the year 276 403 442 1,121 345 577 78 1,000Disposals (528) (388) (19) (935) (147) (304) (35) (486)Transferred to assets held for sale - - - - (154) - - (154)Reclassification 59 (22) (37) - (22) 79 (68) (11)Currency translation (126) (116) (12) (254) 44 40 2 86
Total cost at 31 December 2,355 2,649 473 5,477 2,663 2,772 99 5,534
Total depreciation and impairment at 1 January 972 1,540 - 2,512 856 1,258 - 2,114Depreciation for the year 154 355 - 509 154 337 - 491Disposals (137) (317) - (454) (4) (103) - (107)Transferred to assets held for sale - - - - (19) - - (19)Reclassification 15 (15) - - (27) 29 - 2Currency translation (37) (67) - (104) 12 19 - 31
Total depreciation and impairment at 31 December 967 1,496 - 2,463 972 1,540 - 2,512
Carrying amount at 31 December 1,388 1,153 473 3,014 1,691 1,232 99 3,022
57 DSV Panalpina Annual Report 2020 Consolidated financial statements 2020

3.3 Property, plant and equipment — continued
3.4 Contract assets and accrued costs of services
3.6 Leases
3.5 Inventories
Depreciation is carried out on a straight-line basis over the expected useful lives of the assets. The expected useful lives on the overall asset categories are as follows:
• Terminals and administration buildings: 40-60 years• Other buildings and building elements: 10-25 years• Technical plant and machinery: 6-10 years• Other plant and operating equipment: 3-8 years• Land is not depreciated
The basis of depreciation takes into account the residual value of assets and is reduced by any impairment losses. The residual value is calculated on the date of acquisition and reassessed once a year. Depreciation will be halted if the residual value exceeds the carrying amount of the asset.
Assets are transferred to assets held for sale if it is highly probable that their carrying amount will be recovered primarily through sale rather than through continuing use.
Assets held for sale, which amounted to DKK 110 million at 31 Decem-ber 2020 (2019: DKK 135 million), are measured at the lower of their carrying amount and fair value less costs to sell. The net gain is included in other operating income.
Management judgements and estimatesJudgement is applied in determining the depreciation period and future residual value of the assets recognised and is generally based on histori-cal experience. Reassessment is done annually to ascertain that the de-preciation basis applied is still representative and reflects the expected life and future residual value of the assets.
Accounting policiesContract assets and accrued costs of services include accrued revenue and accrued costs from freight forwarding services, contract logistics and other related services in progress at 31 December 2020.
Contract assets are recognised when a sales transaction fulfils the crite-ria for revenue recognition, but no final invoice has yet been issued to the customer for the services delivered.
Accrued costs of services are estimated and recognised when supplier invoices relating to recognised revenue for the reporting period have yet to be received.
Management judgements and estimatesAt the close of accounting periods, significant estimates are applied in assessing services in progress, including accrual of income and pertaining direct costs. These estimates are based on experience and continuous follow-up on services in progress relative to subsequent invoicing.
Accounting policiesInventories are measured at the lower of cost and net realisable value. The cost of inventories comprises all costs of purchase, processing and other costs incurred in bringing the inventories to their present condition. Write-downs of inventories to net realisable value are recognised as di-rect costs in the income statement.
Accounting policiesWhether a contract contains a lease is assessed at contract inception. For identified leases, a right-of-use asset and corresponding lease liabil-ity are recognised on the lease commencement date.
Upon initial recognition, the right-of-use asset is measured at cost cor-responding to the lease liability recognised, adjusted for any lease pre-payments or directly related costs, including dismantling and restoration costs. The lease liability is measured at the present value of lease pay-ments of the leasing period discounted using the interest rate implicit in the lease contract. In cases where the implicit interest rate cannot be determined, an appropriate incremental DSV Panalpina borrowing rate is used. In determining the lease period extension, options are only included if it is reasonably certain they will be utilised.
At subsequent measurement, the right-of-use asset is measured less accumulated depreciation and impairment losses and adjusted for any remeasurements of the lease liability.
Depreciation is carried out following the straight-line method over the lease term or the useful life of the right-of-use asset, whichever is
Inventories mainly consist of land and buildings under construction held for the purpose of sale in the ordinary course of business (property pro-jects). In total, DKK 1,169 million relating to property projects was rec-ognised as an expense in 2020 (2019: DKK 1,255 million).
Inventories (DKKm) 20192020
Stocks 57 55Property projects under construction 1,369 1,269
Total 1,426 1,324
58 DSV Panalpina Annual Report 2020 Consolidated financial statements 2020

shortest. The lease liability is measured at amortised cost using the ef-fective interest method and adjusted for any remeasurements or modifi-cations made to the contract.
Right-of-use assets and lease liabilities are not recognised for low value lease assets or leases with a lease term of 12 months or less. These are recognised as an expense on a straight-line basis over the term of the lease. Any service elements separable from the lease contract are also accounted for following the same principle.
Extension options are only included in the lease term if extension of the lease is reasonably certain. The majority of extension and termination options held are exercisable only by the Group and not by the respective lessor.
Management judgements and estimatesIn accounting for lease contracts, various judgements are applied in de-termining right-of-use assets and lease liabilities. Judgements include assessment of lease periods, utilisation of extension options and applica-ble discount rates.
The profit or loss and cash flow impact of leases recognised for the year are specified below:
3.6 Leases — continued
2020 2019
Right-of-use assets 2020 (DKKm)Land and buildings
Other plant and operating
equipment TotalLand and buildings
Other plant and operating
equipment Total
Carrying amount at 1 January 10,313 1,358 11,671 14 179 193
Impact of accounting policy change - - - 8,893 1,098 9,991
Additions from business combinations 51 - 51 1,750 467 2,217
Additions for the year 2,739 472 3,211 2,221 321 2,542
Disposals for the year (121) (297) (418) (458) (150) (608)
Depreciation for the year (2,451) (539) (2,990) (2,161) (573) (2,734)
Currency translation (385) (29) (414) 54 16 70
Carrying amount at 31 December 10,146 965 11,111 10,313 1,358 11,671
Contractual maturity of lease liabilities (DKKm) 20192020
0-1 year 3,122 3,654
1-5 years 7,299 7,560> 5 years 3,499 3,237
Total undiscounted lease liabilities at 31 December 13,920 14,451
Current/non-current classification (discounted):
Current 2,850 3,385Non-current 9,428 9,227
Lease effects recognised in profit or loss and cash flow (DKKm) 20192020
Profit or loss:Interest expenses on lease liabilities (434) (383)Expenses relating to short-term leases (334) (395)Expenses relating to leases of low-value assets (135) (77)Expenses relating to variable lease payments not included in the measurement of lease liabilities (81) (129)Gains or losses from sale and leaseback transactions 56 32Cash flow:Total cash outflow for leases (3,492) (3,133)
LeasesRight-of-use assets classified as land and buildings mainly relate to leases of warehouses, terminals and office buildings, whereas assets recognised as other plant and operating equipment mainly relate to leases of trailers, trucks, company cars, forklifts, IT hardware and other office equipment.
Land and building leases normally have a lease term of up to ten years, whereas leases of other plant and operating equipment normally have a lease term of up to five years.
Land and buildings may include extension options with the intention of securing flexibility in the lease – however, any leasing period beyond the normal ten years expected at the initiation of the lease will normally be reflected in the contractual lease term agreed.
Analysis of lease liabilities showing the remaining contractual maturities is provided in the following table:
59 DSV Panalpina Annual Report 2020 Consolidated financial statements 2020

3.7 Pension obligations
Accounting policiesPension obligations relating to defined contribution plans, under which the Group pays regular pension contributions to independent pension funds, are recognised in the income statement for the period in which they are earned. Contributions payable are recognised in the balance sheet under other current liabilities.
In regards to defined benefit plans, an actuarial valuation of the present value of future benefits payable under the plan is made once a year. The present value is calculated based on various assumptions, including the future development in wage/salary levels, interest rates, inflation and mor-tality. The present value is only calculated for benefits to which the employ-ees have become entitled during their employment with the Group. The actuarial calculation of the present value less the fair value of assets under the plan is recognised in the balance sheet under pension obligations. Pen-sion costs for the year are recognised in the income statement based on actuarial estimates and the financial outlook at the beginning of the year.
Differences between the calculated development in pension plan assets and liabilities and the realised values are recognised in other comprehen-sive income as actuarial gains or losses.
Changes in benefits payable for employees’ past services to the com-pany result in an adjustment of the actuarial calculation of the present value, which is classified as past service costs. Past service costs are charged to the income statement immediately if the employees have al-ready earned the right to the adjusted benefits. Otherwise, they will be recognised in the income statement over the period in which the em-ployees earn the right to the adjusted benefits.
Management judgements and estimatesIn determining pension obligations, management makes use of external and independent actuaries as basis for the estimates applied in measuring
the obligations. The actuarial assumptions used in the valuations vary from country to country owing to national, economic and social conditions.
Pension obligations
Of these obligations, DKK 863 million relates to unfunded pension obli-gations (2019: DKK 1,076 million) and DKK 356 million relates to partly funded obligations (2019: DKK 418 million).
Total pension costs for the yearIn 2020, net costs of DKK 621 million relating to the Group’s pension plans were recognised in the income statement (2019: DKK 569 million) and break down as follows:
Defined benefit pension obligationsDevelopment in the present value of defined benefit pension obligations break down as follows:
The expected average duration of the obligations is 16 years.
Pension obligations (DKKm) 2020 2019
Present value of defined benefit plans 4,218 4,878Fair value of pension plan assets 2,999 3,384
Pension obligations, net 1,219 1,494
Pension cost 2020 (DKKm)
Defined contribution
plans
Defined benefit
plans Total
Staff costs 578 27 605Financial expenses - 16 16
Total costs recognised 578 43 621
Pension cost 2019 (DKKm)
Defined contribution
plans
Defined benefit
plans Total
Staff costs 526 21 547Financial expenses - 22 22
Total costs recognised 526 43 569
Defined benefit pension obligations (DKKm) 20192020
Obligations at 1 January 4,878 2,145Current service cost 131 73Past service cost from plan amendments, curtailments and gains/losses on settlements (104) (64)Calculated interest on obligations 43 51
Actuarial gains/losses arising from changes in financial assumptions 22 101Actuarial gains/losses arising from changes in demographic assumptions 21 (30)Actuarial gains/losses arising from experience adjustments (9) (66)Payments from the plan (552) (207)Additions from business combinations - 2,807Currency translation (212) 68
Obligations at 31 December 4,218 4,878
Expected maturity of pension obligations (DKKm) 20192020
0-1 year 208 3661-5 years 589 698> 5 years 3,421 3,814
Total obligations recognised 4,218 4,878
60 DSV Panalpina Annual Report 2020 Consolidated financial statements 2020

3.7 Pension obligations — continued
Pension plan assetsDevelopment in the fair value of pension plan assets breaks down as follows:
DSV Panalpina expects to contribute DKK 55 million to defined benefit plan assets in 2021 (2020: DKK 64 million). The composition of the pension plan assets is as follows:
Sensitivity analysisThe following table illustrates the change in the gross obligation relating to defined benefit plans from a change in the key actuarial assumptions. The analysis is based on fairly probable changes, provided that the other parameters remain unchanged.
Significant pension plansThe most significant defined benefit plans of the Group relate to Europe, with Germany representing 59% (2019: 55%) and Sweden 27% (2019: 19%) of the total net obligation of DKK 1,219 million (2019: DKK 1,494 million). No other countries have individual defined benefit plans of significance. The plan in Sweden is a final pay scheme, which covers all salaried employees born in or before 1978 and is based on a collective labour agreement. Salaried employees born in or after 1979 are covered by a defined contribution plan.
The plan in Germany covers both salaried and hourly workers. Under this plan, employees earn a fixed amount for each year in service. The plan has been closed for new employees since 1994.
Pension plan assets (DKKm) 2020 2019
Pension plan assets at 1 January 3,384 1,230Calculated interest on plan assets 27 33Return on plan assets excluding calculated interest 52 111Contributions to the plan 108 74Payments from the plan (527) (209)Additions from business combinations 0 2,050Currency translation (45) 95
Pension plan assets at 31 December 2,999 3,384
Composition of pension plan assets (%) 20192020
Shares 50% 69%Bonds 37% 16%Insurance contracts 13% 15%
Total 100% 100%
Sensitivity analysis (DKKm) 20192020
Defined benefit pension obligation 4,218 4,878
Discount rate
Increase of 0.5 percentage point 3,891 4,371Decrease of 0.5 percentage point 4,570 5,165
Future wage/salary increase
Increase of 0.5 percentage point 4,282 4,877Decrease of 0.5 percentage point 4,129 4,629
Inflation
Increase of 0.5 percentage point 4,396 5,082Decrease of 0.5 percentage point 4,026 4,404
Life expectancy
Life expectancy increase of 1 year 4,296 4,873Life expectancy decrease of 1 year 4,100 4,561
We continuously work to change our defined benefit plans in DSV Panalpina into defined contribution plans for the benefit of the Group and the employees.
Key assumptions on the most significant pension plans are as follows:
Key assumptions 2020 Discount rate
Future wage/salary
increaseFuture rate of inflation
Sweden 1.9% 2.3% 1.8%Germany 0.8% 2.0% 1.5%
Other 0.1-6.8% 0-10.0% 0-2.0%Weighted average 1.6% 2.9% 1.0%
Mortality prognosis table
Sweden DUS14 (w-c)Germany RT Heubeck 2018 G
Key assumption 2019 Discount rate
Future wage/salary
increaseFuture rate of inflation
Sweden 2.6% 2.0% 1.8%Germany 1.8% 2.1% 1.6%
Other 0.9-8.1% 0.0-10.0% 0.0-2.1%Weighted average 2.4% 2.3% 1.8%
Mortality prognosis table
Sweden DUS14 (w-c)Germany RT Heubeck 2018 G
61 DSV Panalpina Annual Report 2020 Consolidated financial statements 2020

3.8 Provisions
Accounting policiesProvisions are recognised when, due to an event occurring on or before the reporting date, the Group has a legal or constructive obligation and it is probable that the Group will have to give up future economic benefits to meet the obligation.
Provisions are measured on the basis of Management’s best estimate of the anticipated expenditure for settle ment of the relevant obligation and are discounted if deemed material.
Management judgements and estimatesManagement continually assesses provisions, including contingencies and the likely outcome of pending and potential legal proceedings. The out-come of such proceedings depends on future events, which are, by nature, uncertain.
When considering provisions involving significant estimates, opinions and estimates by external legal experts as well as existing case law are applied in assessing the probable outcome of material legal proceedings etc.
Provisions Provisions have not been discounted as the effect thereof is immaterial. Provisions are expected to be settled within two years in all material respects.
Restructuring costsRestructuring costs relate mainly to the integration of acquirees and the restructuring plans previously announced, which consist mainly of termi-nation benefits and costs under terminated leases.
Provisions (DKKm)
Restruc turing costs
Disputes and legal actions Other Total
Provisions at 1 January 2020 507 528 1,404 2,439Additions for the year 1,107 221 1,200 2,528Additions from acquisitions 20 - - 20Used for the year (847) (224) (939) (2,010)Adjustment of provisions made in previous years - (54) (53) (107)Currency translation (6) (28) (58) (92)
Provisions at 31 December 2020 781 443 1,554 2,778
Current/non-current classification:Non-current liabilities 199 195 859 1,253Current liabilities 582 248 695 1,525
Provisions at 31 December 2020 781 443 1,554 2,778
Disputes and legal actionsProvisions for disputes and legal actions relate mainly to probable lia-bilities taken over at the acquisition of enterprises.
Other provisionsOther provisions relate mainly to restoration obligations in connection with property leases and onerous contracts relating to business combi-nations.
62 DSV Panalpina Annual Report 2020 Consolidated financial statements 2020

Chapter 4
Capital structure and finances
This chapter includes disclosures on the fi-nancial basis and exposures of the Group’s activities derived by our capital structure and net working capital.
The capital structure is linked to our long-term financial target of a gearing ratio below 2.0 x EBITDA before special items and the principles for capital allocation.
In order of priority, the free cash flow is used to reduce the Group’s net interest- bearing debt in periods when the gearing ratio ex-ceeds the target, for investments and busi-ness combinations, and for share buybacks or distribution to the Company’s shareholders.
Accounting policiesShare capitalAt year-end, the share capital of DSV Panalpina A/S amounted to 230 million shares with a nominal value of DKK 1 each.
Shares consist of only one share class and include no special rights, pref-erences or restrictions. All shares are fully paid up.
Reserves specification – 2020 (DKKm)
Treasury share reserve
Hedging reserve
Translation reserve
Total reserves
Reserves at 1 January (6) (24) (235) (265)
Other comprehensive income, net of tax - 13 (2,586) (2,573)
Total comprehensive income for the year - 13 (2,586) (2,573)
Transactions with owners:Purchase of treasury shares (6) - - (6)Sale of treasury shares 3 - - 3Capital reduction 5 - - 5
Reserves at 31 December (4) (11) (2,821) (2,836)
Reserves specification – 2019 (DKKm)
Treasury share reserve
Hedging reserve
Translation reserve
Total reserves
Reserves at 1 January (10) (42) (652) (704)
Other comprehensive income, net of tax - 18 417 435
Total comprehensive income for the year - 18 417 435
Transactions with owners:Purchase of treasury shares (7) - - (7)Sale of treasury shares 2 - - 2Capital reduction 9 - - 9
Reserves at 31 December (6) (24) (235) (265)
4.1 Equity
63 DSV Panalpina Annual Report 2020 Consolidated financial statements 2020

ReservesReserves as presented in the statement of changes in equity comprise treasury reserve, hedging reserve and translations reserve, as specified on the previous page. Treasury share reserveThe reserve comprises the nominal value of treasury shares. The differ-ence between the market price paid and the nominal value plus dividends on treasury shares is recognised directly as retained earnings in equity. Treasury shares are bought back to meet obligations under the Company’s incentive schemes and to adapt the capital structure. The reserve is a distributable reserve.
Hedging reserveThe hedging reserve comprises the fair value of hedging instruments qualifying for hedge accounting. Hedge accounting ceases when the hedging instrument matures or if a hedge is no longer effective. Translation reserveThe reserve comprises foreign currency translation arising on the trans-lation of net investments and related hedging in entities with a functional currency other than DKK. The reserve is dissolved upon disposal of entities.
4.1 Equity — continued 4.2 Capital structure and capital allocation
2020 2019
Treasury sharesMarket value
(DKKm)% of share capital at 31 December
Nominal value (DKKm)
Market value(DKKm)
% of share capital at 31 December
Nominal value (DKKm)
Portfolio, beginning of year 4,247 2.7% 6.1 4,286 4.2% 10.0 Cancellation of treasury shares (3,317) (2.2%) (5.0) (4,528) (3.6%) (8.5)
Portfolio of treasury shares less cancelled shares 930 0.5% 1.1 (242) 0.6% 1.5 Purchased during the year 5,031 2.7% 6.2 4,888 3.1% 7.0 Sold during the year (1,370) (1.5%) (3.4) (770) (1.1%) (2.4)Value adjustment (619) - - 371 - -
Portfolio, end of year 3,972 1.7% 3.9 4,247 2.6% 6.1
Capital structureThe capital structure of DSV Panalpina is intended to ensure financial stability for the purpose of reducing the Company’s cost of capital and maintaining sufficient financial stability to reach its strategic objectives.
The gearing ratio was 1.3 at 31 December 2020 (2019: 1.8). The target gearing ratio is below 2.0 x EBITDA, but may exceed this level following significant acquisitions.
Capital allocationThe Group aims to spend its free cash flow in the following order of priority:1. Repayment of net interest-bearing debt in periods when the financial
gearing ratio is above target;2. Value-adding investments in the form of acquisitions or development
of the existing business;3. Distribution to the Company’s shareholders by means of share
buybacks and dividends.
Net interest-bearing debt The Group reduced its net interest-bearing debt by DKK 1,385 million in 2020. Net interest-bearing debt can be specified as follows:
Net interest-bearing debt (DKKm) 2020 2019
Lease liabilities 12,278 12,612Borrowings 8,881 7,984Other receivables (129) (198)Cash and cash equivalents (4,060) (2,043)
Net interest-bearing debt 16,970 18,355
Value-adding investmentsNo material investments/acquisitions were made in 2020.
64 DSV Panalpina Annual Report 2020 Consolidated financial statements 2020

Accounting policiesThe financial liabilities of the Group are divided into four financing cate-gories: bank loans and credit facilities, issued bonds, lease liabilities and other financial liabilities.
Bank loans and other borrowings and loans obtained through the issuance of bonds are initially recognised at fair value net of transaction expenses.
Subsequently, the financial liability is measured at amortised cost, corre-sponding to the capitalised value using the effective interest method,
4.2 Capital structure and capital allocation — continued
4.3 Financial liabilities so that the difference between the proceeds and the nominal value is rec-ognised in the income statement over the term of the loan. Lease liabili-ties are described in further detail in note 3.6.
Other liabilities are measured at amortised cost, which, in all essentials, corresponds to the net realisable value.
Financial liabilities (DKKm) 20192020
Non-current liabilities 17,124 15,691Current liabilities 4,035 4,905
Total 21,159 20,596
Financing activities 2019 (DKKm)
Loans and credit facilities 2,895 (145) 69 48 - 2,867Issued bonds 3,972 - 1,070 12 (8) 5,046Lease liability 10,896 (2,750) 2,217 (10) 2,259 12,612
Total liabilities from financing activities 17,763 (2,895) 3,356 50 2,251 20,525
Other non-current liabilities 79 71
Total financial liabilities 17,842 20,596
* Other includes additions and remeasurement of financial liabilities.
Non-cash change
Financing activities 2020 (DKKm)Beginning
of year Cash flow AcquisitionCurrency
effects Other* End of year
Loans and credit facilities 2,867 (1,791) 10 3 - 1,089Issued bonds 5,046 2,697 - (25) 12 7,730Lease liabilities 12,612 (3,058) 51 (368) 3,041 12,278
Total liabilities from financing activities 20,525 (2,152) 61 (390) 3,053 21,097
Other non-current liabilities 71 62
Total financial liabilities 20,596 21,159
Distribution to the Company’s shareholdersIn 2020, the Group spent DKK 5,031 million on share buyback and DKK 588 million on dividends distributed (2019: DKK 4,888 million and DKK 423 million, respectively). It is proposed to distribute a dividend of DKK 4.00 per share for 2020 (2019: DKK 2.50).
Cash and capital restrictionsCash and cash equivalents comprise cash on hand and short-term liquid assets that are readily convertible to cash. Of total cash and cash equivalents, DKK 930 million (2019: DKK 1,447 million) are subject to restrictions implying that the cash may not be readily available for general use or distribution by the Group. Major types of cash and capital restrictions specify as follows:
Cash and capital restrictions (DKKm) 20192020
Exchange control restrictions 736 1,299Insurance collaterals 187 141Other collaterals 7 7
Total 930 1,447
Exchange control restrictions Exchange control restrictions comprise cash balances in countries where various forms of foreign exchange controls or other legal restrictions apply. While the cash balances are available for the daily operations of the local entities, the balances cannot be immediately repatriated to the ultimate parent company in Denmark (DSV Panalpina A/S).
Insurance collaterals Insurance collaterals constitutes security for outstanding insurance contracts sold to customers by DSV Insurance. The amount is regulated and measured in accordance with laws and regulations issued by the Danish Financial Supervisory Authority.
65 DSV Panalpina Annual Report 2020 Consolidated financial statements 2020

Commitments and amounts drawn on long-term credit facilities at 31 December 2020:
The Group’s financial liabilities fall due as follows:
4.4 Financial risks
Liquidity risk The cash readiness of the Group is ensured through short and long-term credit facilities from the main banks of the Group and through the issu-ance of bonds. The purpose of issuing bond loans is to diversify the Group’s long-term debt, making the Group less dependent on bank loans.
The Group’s bank and bond loans are subject to standard clauses, accord-ing to which the Group’s debt must be repaid in case of a change of con-trol. The long-term credit facilities with banks are furthermore subject to one covenant. The covenant relates to the gearing ratio of the Group and is reported on every quarter. The covenant has not been breached in 2020.
The total duration of the Group’s long-term loan commitments and the amounts drawn on its credit lines at 31 December 2020 are shown in the accompanying table. Furthermore, a maturity analysis has been pro-vided based on contractual cash flows, including estimated interest pay-ments. The amounts have not been discounted and as such do not rec-oncile directly to the balance sheet.
Foreign currency riskDue to its global activities, the Group is exposed to exchange rate fluc-tuations to a certain extent. DSV Panalpina seeks to eliminate foreign currency risks by hedging currency exposures centrally via the Group’s Treasury department. The risk exposure is managed on a net basis, pri-marily by using foreign exchange forward contracts.
The Group’s foreign subsidiaries are not affected where trading income and costs are denominated in the local functional currency. This applies to a large part of the Group’s subsidiaries. Furthermore, a large propor-tion of the income and expenses of the Group are denominated in EUR, and the total foreign currency risk is therefore limited.
Loan facilities Amount (EURm) Amount (DKKm)Expiry of
commitments Duration (years) Undrawn
Long-term loan I 200 1,488 31-01-2023 2.1 1,488Long-term loan II 180 1,339 31-12-2022 2.0 1,339Long-term loan III 100 744 31-01-2023 2.1 744Long-term loan IV 100 744 28-02-2022 1.2 744Long-term loan V 125 930 28-02-2023 2.2 930Long-term loan VI 75 558 15-01-2023 2.0 558Bond loan I 100 750 18-03-2022 1.2 -Bond loan II 100 750 18-03-2022 1.2 -Bond loan III 200 1,488 20-09-2024 3.7 -Bond loan IV 138 1,027 12-12-2022 1.9 -Bond loan V 500 3,720 26-02-2027 6.2 -
Total and weighted duration 1,818 13,538 3.2 5,803
Financial liabilities – maturity 2020 (DKKm) Carrying amount
Total cash flow, inclu ding interest 0-1 year 1-5 years > 5 years
Loans and credit facilities 1,089 1,096 1,096 - -Issued bonds 7,730 7,985 89 4,160 3,736Lease liabilities 12,278 13,920 3,122 7,299 3,499Trade payables 9,926 9,926 9,926 - -Interest rate derivatives 17 20 3 17 -
Total 31,040 32,947 14,236 11,476 7,235
Financial liabilities – maturity 2019 (DKKm) Carrying amount
Total cash flow, inclu ding interest 0-1 year 1-5 years > 5 years
Loans and credit facilities 2,867 2,950 566 2,384 -Issued bonds 5,046 5,279 1,096 4,183 -Lease liabilities 12,612 14,451 3,654 7,560 3,237Trade payables 9,783 9,783 9,783 - -Interest rate derivatives 44 47 4 43 -
Total 30,352 32,510 15,103 14,170 3,237
66 DSV Panalpina Annual Report 2020 Consolidated financial statements 2020

4.4 Financial risks — continued
The Group is also exposed to foreign currency risks, partly on the trans-lation of debt denominated in foreign currency other than the functional currency and partly on the translation of net investments in enterprises with a functional currency other than DKK. The former risk affects profit before tax. However, where debt is classified as hedging of net invest-ments in foreign subsidiaries, fair value adjustments are recognised di-rectly in equity under other comprehensive income. On recognition of net investments in foreign subsidiaries, the Group is exposed to a trans-lation risk when the profit or loss and equity of foreign subsidiaries are translated into DKK at the reporting date based on the average rates of exchange and the closing rates. The need to hedge the Parent’s net in-vestments in subsidiaries is assessed on a regular basis. It is Group policy to reduce net investments in Group subsidiaries on an ongoing basis by distributing the subsidiaries’ profits as dividends.
The Group hedges booked external net currency positions and currencies with larger expected short-term operational cash flows for up to six months. At year-end 2020, 80% of expected six-month cash flows in USD were hedged.
As hedge accounting is only applied to a limited extent, and we do not hedge currency exposure related to intra-group balances with no under-lying cash flow impact, significant changes in currency rates, especially CHF/DKK and USD/DKK, will result in more fluctuations in reported fi-nancial items. Unhedged intra-group balances at 31 December are high-lighted in the main currency exposures table to the right.
In general, the Group does not hedge EUR positions as it expects that the official Danish fixed exchange-rate policy against the EUR will continue.
The sensitivity analysis of foreign currency exposures shows the effect of a 5% change in average exchange rates for the year on profit/loss (EBIT) and the effect of a 5% change in year-end closing rates on other comprehensive income. The calculation method applied in the sensitivity analysis is unchanged compared to previous years.
Loan and credit facilities (DKKm)
2020 2019
Carrying amountFixed/floating
interest rate Expiry Carrying amountFixed/floating
interest rate Expiry
Bank loans 444 Fixed/floating 2021 1,985 Fixed/floating 2020-2023Bond loans 7,730 Fixed/floating 2022-2027 5,046 Fixed/floating 2020-2024Overdraft facility 645 Floating 2021 882 Floating 2020-2023
Loans and credit facilities at 31 December 8,819 7,913
Current/non-current classification:Non-current liabilities 7,730 6,393Current liabilities 1,089 1,520
Unhedged intra-group balances Currency exposures – sensitivity analysis
Main currency exposures (DKKm)
2020 2019 2020 2019
Net positionImpact on profit/loss Net position
Impact on profit/loss
Impact on profit/loss
Impact on OCI
Impact on profit/loss
Impact on OCI
USD/DKK 5,540 277 3,995 200 86 180 68 162CHF/DKK (5,478) (274) (9,556) (478) 9 310 18 600EUR/DKK (3,378) (169) (12,839) (642) 104 229 77 522CNY/DKK (1,167) (58) (879) (44) 68 44 31 25
Total n.a. (224) n.a. (964) 267 763 194 1,309
67 DSV Panalpina Annual Report 2020 Consolidated financial statements 2020

4.4 Financial risks — continued
Interest rate riskThe Group’s interest rate risk relates to the long-term floating-rate loans raised by the Parent. These loans are partly converted to fixed rate loans by using interest rate swaps with a duration of up to 120 months. The Group’s loans and credit facilities break down as shown on the pre vious page.
At year-end 2020, 81% (2019: 73%) of Group borrowings were securedeither through fixed-rate loans or other hedge transactions. The duration of hedges relating to net borrowings of the Group was 88 months (2019: 34 months).
The weighted average interest rate on the Group’s loans, credit facilitiesand interest rate hedging was 1.3% at the end of 2020 (2019: 1.6%).
A 1 percentage point increase in interest rates would reduce profit for theyear by DKK 9 million (2019: DKK 15 million) and increase/reduce othercomprehensive income by DKK 12 million (2019: DKK 30 million), based on average net interest-bearing debt for 2020. The calculation method applied in the sensitivity analysis is unchanged compared to previous years.
Credit riskThe Group’s credit risk mainly relates to trade receivables.
The Group is not dependent on particular customer segments or any spe-cific customers, and all customers are subjected to individual credit assess-ments and credit limits in accordance with the Group’s Credit Policy. As a result, the credit risk of the Group is generally considered insignificant.
The Group mainly hedges credit risks through the use of credit insurance.
For a limited number of customers, the Group uses non-recourse fac-toring. At the end of 2020, non-recourse factoring amounted to DKK 1,407 million (2019: 1,402 million).
DSV Panalpina is exposed to counterparty credit risk when entering into derivative financial instruments. In order to reduce this risk, DSV Panalpina only enters into derivative financial instruments with the existing banks of the Group whose credit ratings from Standard & Poor’s are long-term A or higher.
As a general rule, the Group only makes short-term deposits with banks rated short-term A-2 or higher by Standard & Poor’s and/or P-2 or higher by Moody’s.
Impairment of trade receivablesImpairment of trade receivables are assessed on an ongoing basis and insurance policies taken out for the majority of these.
At 31 December 2020, credit insurances amounted to DKK 15,163 million, corresponding to 78% of total trade receivables (2019: DKK 10,010 million or 55%).
Loss allowances for impaired trade receivables are provided for following an expected credit loss model. The model includes uninsured trade receiv-ables and also factors in any own risk on insured receivables. Expected credit loss at 31 December 2020 is presented in the following table:
Expected credit loss 2020(DKKm)
Carrying amount
Expected loss rate (%)
Loss allowance
Current 15,901 0.3% 40Overdue 1-30 days 2,204 2.0% 45Overdue 31-60 days 530 7.1% 37Overdue 61-90 days 230 15.2% 35Overdue 91-120 days 137 21.9% 30Overdue >121 days 459 51.4% 236
Total 19,461 423
Expected credit loss 2019(DKKm)
Carrying amount
Expected loss rate (%)
Loss allowance
Current 14,502 0.3% 44Overdue 1-30 days 2,554 1.9% 49Overdue 31-60 days 650 7.1% 46Overdue 61-90 days 307 12.7% 39Overdue 91-120 days 175 21.1% 37Overdue >121 days 574 51.4% 295
Total 18,762 510
Current receivables are considered to have high credit worthiness with a low risk of loss.
The loss allowance provision for the year is specified below:
Loss allowance provision (DKKm) 20192020
Provision at 1 January 510 240Additions from acquisitions - 289Additions for the year 251 140Losses recognised (94) (44)Reversal of provisions from previous years (211) (115)Currency translation (33) -
Provision at 31 December 423 510
Impairment losses on trade receivables for 2020 amounted to DKK 94 million, corresponding to 0.08% of consolidated revenue (2019: DKK 44 million, or 0.05%).
68 DSV Panalpina Annual Report 2020 Consolidated financial statements 2020

4.5 Derivative financial instruments
Accounting policiesDerivative financial instruments are recognised on the trade date and are measured at fair value. Positive and negative fair values are included in other current re ceivables or other current payables in the balance sheet. Positive and negative fair values are only offset if the Group has a right and an intention to settle several financial instruments net (by means of settlement of differences). Fair value is determined based on generally accepted valuation methods using available observable market data.
When entering into contracts for financial instruments, an assessment is made of whether the instrument qualifies for hedge accounting, including whether the instrument hedges recognised assets and liabilities or net investments in foreign entities. The effectiveness of recognised financial instruments is assessed on a monthly basis, and any in effectiveness is recognised in the income statement.
Fair value changes which are classified as and fulfil the criteria for recog-nition as a fair value hedge are recognised in the income statement to-gether with changes in the value of the part of the asset or liability that has been hedged.
Fair value changes in the part of the derivative which is classified as and qualifies for recognition as a future cash flow hedge and which effectively hedges against changes in the value of the hedged item are recognised in other comprehensive income as a separate hedging reserve.
When the underlying hedged item is realised, any gain or loss on the hedging transaction is transferred from equity and recognised together with the hedged item.
Fair value changes that do not meet the criteria for treatment as hedging instruments are recognised on an ongoing basis in the income statement under financials.
External hedging instruments (DKKm)
2020 2019
Currency instruments
Interest rate instruments Total
Currency instruments
Interest rate instruments Total
Contractual value 6,447 744 7,191 5,623 1,219 6,842Maturity (year) 2021 2021-2022 2020 2020-2023
Fair value 50 (17) 33 26 (44) (18)Of which recognised in income statement 51 - 51 21 - 21Of which recognised in OCI (1) (17) (18) 5 (44) (39)
Foreign currency risk hedgingThe Group mainly uses foreign exchange forward contracts to hedge foreign currency risks. The main currencies hedged are CNY and USD. The foreign exchange forward contracts are used as fair value hedges of currency exposures relating to external balance sheet assets and liabilities as well as expected short-term operational cash flows.
A gain on hedging instruments of DKK 76 million was recognised in the income statement for 2020 (2019: a loss of DKK 78 million). In the same period, a loss of DKK 1,131 million was recognised relating to assets and liabilities (2019: a loss of DKK 110 million). The net loss in 2020 primarily relates to unhedged intercompany positions.
Interest rate risk hedgingThe Group has obtained long-term loans on a floating rate basis, implying that the Group is exposed to interest rate fluctuations.
The Group mainly uses interest rate swaps to hedge future cash flows relating to interest rate risks. Thereby, floating-rate loans are converted to fixed-rate financing.
The weighted average effective interest rate for existing interest rate in-struments used as hedges of long-term loans was 0.8% at the reporting date (2019: 0.9%).
69 DSV Panalpina Annual Report 2020 Consolidated financial statements 2020

4.6 Earnings per share
Fair value hierarchy by categoryDSV Panalpina has no financial instruments measured at fair value based on level 1 input (quoted active market prices) or level 3 input (non-observable market data).
All financial instruments are measured based on level 2 input (input other than quoted prices that are observable either directly or indirectly).
Derivative financial instruments The fair value of currency and interest rate derivatives is determined based on generally accepted valuation methods using available obser-vable market data. Calculated fair values are verified against comparable external market quotes on a monthly basis.
Financial liabilities measured at amortised costThe carrying value of financial liabilities measured at amortised cost is not considered to differ significantly from fair value. Trade receivables, trade payables and other receivablesReceivables and payables pertaining to operating activities and with short churn ratios are considered to have a carrying value equal to fair value.
Earnings per share (DKKm) 2020 2019
Profit for the year 4,258 3,706Non-controlling interests’ share of consolidated profit for the year 8 6
DSV Panalpina A/S shareholders’ share of profit for the year 4,250 3,700
Amortisation of customer relationships 208 102Share-based payment 134 117Special items, costs 2,164 800Related tax effect (610) (263)
Adjusted profit for the year 6,146 4,456
(‘000 shares)Total average number of shares 231,462 206,415Average number of treasury shares (4,216) (8,142)Average number of shares in circulation 227,246 198,273
Average dilutive effect of outstanding share options under incentive schemes 4,330 3,132
Diluted average number of shares in circulation 231,576 201,405
Earnings per share of DKK 1 18.7 18.7Diluted earnings per share of DKK 1 18.4 18.4Adjusted earnings per share of DKK 1 27.0 22.5Diluted adjusted earnings per share of DKK 1 26.5 22.1
Financial instruments by category (DKKm)
2020 Carrying amount
2019 Carrying amount
Financial assets:Currency derivatives 50 26
Trade receivables 19,038 18,252Other receivables 3,007 3,904Cash and cash equivalents 4,060 2,043
Financial assets measured at amortised cost 26,105 24,199
Financial liabilities:Interest rate derivatives 17 44
Issued bonds measured at amortised cost 7,730 5,046Loans and credit facilities 1,089 2,867Lease liabilities 12,278 12,612Trade payables 9,926 9,783
Financial liabilities measured at amortised cost 31,023 30,308
Diluted average number of shares Diluted earnings per share and diluted adjusted earnings per share have been calculated excluding out-of-the money share options. The number of out-of-the money share options was 0 in 2020 (2019: 0).
4.7 Financial instruments — fair value hierarchy
70 DSV Panalpina Annual Report 2020 Consolidated financial statements 2020

Accounting policiesWhen accounting for business combinations, the acquisition method is applied in accordance with IFRS 3.
Acquirees are recognised in the consolidated financial statements from the date of acquisition. The date of acquisition is the date on which DSV Panalpina obtains control of the company. Entities disposed of are recog-nised in the consolidated financial statements until the date of disposal. The date of disposal is the date on which DSV Panalpina surrenders con-trol of the company.
The consideration transferred as payment for the acquiree consists of the fair value of assets transferred, liabilities incurred to former owners of the acquiree and equity instruments issued. Contingent considerations dependent on future events or the performance of contractual obliga-tions are also recognised at fair value and form part of the total consid-eration transferred. Fair value changes in contingent considerations are recognised in the income statement until final settlement.
Identifiable assets, liabilities and contingent liabilities of the acquiree are measured at fair value at the date of acquisition by applying relevant valua-tion methods. Identifiable intangible assets are recognised if they are sepa-rable or arise from a contractual right. Deferred tax is recognised for identi-fiable tax benefits existing at the date of acquisition and from the per spec-tive of the new combined Group in compliance with local tax legislation.
The excess of the total consideration transferred, value of non-con-trolling interests and the fair value of any equity investments previously held in the acquiree over the total identifiable net assets measured at fair value are recog nised as goodwill. If measurement of the identifiable net assets is uncertain at the date of acquisition, initial recognition is done based on provisional amounts. Measurement period adjustments to the provisional amounts may be done for up to 12 months following the date of acquisition. The effects
of cross-period measurement period adjustments are recognised in equity at the beginning of the financial year, and comparative figures are restated.
After the end of the measurement period, goodwill is no longer adjusted. Transaction costs inherent from the acquisition are recognised in the in-come statement when incurred.
Goodwill and fair value adjustments arising from the acquisition of an ac-quiree whose functional currency differs from the presentation currency of the Group are translated into the functional currency of the foreign entity using the exchange rate ruling at the date of acquisition.
Other than cross-period measurement period adjustments, comparative figures are not adjusted when acquiring or disposing of entities.
Management judgements and estimatesIn applying the acquisition method of accounting, estimates are an inte-gral part of assessing fair values of several identifiable assets acquired and liabilities assumed, as observable market prices are typically not available.
Valuation techniques where estimates are applied typically relate to de-termining the present value of future uncertain cash flows or assessing other events in which the outcome is uncertain at the date of acquisition.
More significant estimates are typically applied in accounting for prop-erty, plant and equipment, customer relationships, trade receivables, de-ferred tax, debt and contingent liabilities. As a result of the uncertainties inherent in fair value estimation, measurement period adjustments may be applied.
Acquisitions and disposalsNo material enterprises, non-controlling interests or activities were ac-quired or divested in 2020.
5.1 Acquisition and disposal of entities Chapter 5
Other notes
This chapter includes disclosures on other statutory information not directly related to the operating activities of the Group.
The chapter describes the acquisition and disposal of entities during the year, tax on activities, contingent liabilities and security for debt as well as transactions with Group Management, auditors and other related parties.
71 DSV Panalpina Annual Report 2020 Consolidated financial statements 2020

5.1 Acquisition and disposal of entities — continued 5.2 Tax
In 2019, DSV acquired Panalpina Welttransport (Holding) AG (Panalpina) via a public exchange offer. No other material acquisitions or divestments were made in 2019.
Panalpina was one of the world’s leading providers of supply chain solu-tions with its core services comprising Air Freight, Ocean Freight, and Logistics and Manufacturing. Panalpina generated revenues of approxi-mately CHF 6 billion in 2018 and operated a global network with some 500 offices in more than 70 countries and 14,000 employees world-wide. The acquisition substantially strengthened the Air & Sea division, which became one of the largest providers globally with close to 3 mil-lion containers (TEUs) and more than 1.7 million tonnes of air freight transported yearly.
Consideration transferredThe consideration transferred for the shares in Panalpina was made in DSV equity instruments by offering 2.375 ordinary DSV shares for one Panalpina share. A total of 55,526,507 DSV shares were exchanged at a fair value of DKK 35,270 million based on the acquisition date share closing price of DKK 635.20 on Nasdaq Copenhagen.
The total consideration transferred amounted to DKK 35,829 million. Adjusted for the fair value of cash and cash equivalents acquired of DKK 1,975 million, the net consideration amounted to DKK 33,854 million.
In 2020, DKK 118 million was recognised as measurement period ad-justments to the acquisitional opening balance. For further details, please refer to note 5.1 in the DSV Panalpina Annual Report 2019.
The fair value of identified net assets and goodwill recognised from the acquisition comprises as highlighted in the following table:
(DKKm)Fair value at date
of acquisition
Customer relationships 732Other intangible assets 7Right-of-use (ROU) assets 2,217Property, plant and equipment 688Trade receivables 6,669Contract assets 1,146Deferred tax assets 956Other receivables 613Cash and cash equivalents 1,975
Total assets 15,003
Lease liabilities 2,217Borrowings 1,109Provisions 1,320Pensions and similar obligations 757Trade payables 2,591Accrued cost of services 3,214Deferred tax liabilities 201Tax payables 435Other payables 1,735
Total liabilities 13,579
NCI share of acquired net assets 6
Acquired net assets 1,418
Fair value of total consideration transferred 35,829
Goodwill arising from the acquisition 34,411
Accounting policiesCurrent taxCurrent tax payable and receivable is recognised in the balance sheet as tax calculated on the taxable income for the year adjusted for tax on taxable income for previous years and for prepaid tax.
Tax for the yearTax for the year comprises current and deferred tax on profit or loss for the year, interest expenses related to pending tax disputes and adjust-ments to previous years, including adjustments due to tax rulings.
Tax for the year is recognised in the income statement, unless the tax expense relates directly to items included in other comprehensive in-come or equity.
Deferred taxDeferred tax is recognised based on temporary differences between the carrying amount and the tax value of assets and liabilities. No recognition is made of deferred tax on temporary differences relating to amortisation or depreciation of goodwill, properties and other items if disallowed for tax purposes, except at the acquisition of enterprises, if such temporary differences arose on the date of acquisition without affecting the results or the taxable income. In cases where it is possible to calculate the tax value according to different taxation rules, deferred tax is measured on the basis of the planned use of the asset or the settlement of the liability.
Deferred tax assets, including the tax base of tax loss carryforwards, are recognised as other non-current assets at the expected value of their utilisation, either by elimination in tax on future earnings or by offsetting deferred tax liabilities within the same legal tax entity and jurisdiction.
Deferred tax assets and tax liabilities are offset if the enterprise has a le-gally enforceable right to set off current tax liabilities and tax assets or intends either to settle current tax liabilities and tax assets on a net basis or to realise the assets and liabilities simultaneously.
72 DSV Panalpina Annual Report 2020 Consolidated financial statements 2020

Deferred tax is adjusted for elimination of unrealised intra-group gains and losses. Deferred tax is measured on the basis of the tax rules and tax rates of the relevant countries that will be effective under current legis-lation at the reporting date on which the deferred tax is expected to ma-terialise as current tax.
Management judgements and estimatesManagement applies significant estimates when recognising and meas-uring deferred tax assets.
5.2 Tax — continued
Tax for the year (DKKm) 20192020
Tax for the year is disaggregated as follows:
Tax on profit for the year 1,369 1,290Tax on other changes in equity (383) (412)Tax on other comprehensive income 8 11
Total tax for the year 994 889
Tax on profit for the year is calculated as follows:
Current tax 1,905 1,352Deferred tax (621) 9Tax adjustment relating to previous years 85 (71)
Total tax on profit for the year 1,369 1,290
Tax on other comprehensive income specifies as follows:
Fair value adjustment of hedging instruments (3) (1)Actuarial gains/(losses) (5) (10)
Total (8) (11)
Tax rate (%) 20192020
Tax rate specifies as follows:Calculated tax on profit for the year before tax 22.0% 22.0%Adjustment of calculated tax in foreign group enterprises relative to 22.0% 3.3% 0.6%Change in deferred tax based on change in income tax rate 0.0% 1.7%
Tax effect of:
Non-deductible expenses/non-taxable income (2.5%) 2.2%Non-deductible losses/non-taxable gains on shares 0.2% (0.1%)Tax adjustment relating to previous years 1.5% (1.4%)Tax asset valuation adjustments, net (1.7%) (2.0%)Other taxes and adjustments 1.5% 2.8%
Effective tax rate 24.3% 25.8%
Deferred tax assets, including the tax base of tax loss carryforwards are recognised if it is assessed that there will be sufficient future taxable in-come against which the temporary differences and unutilised tax losses can be utilised. This assessment is based on budgets and business plans for the following years, including planned business initiatives.
Deferred tax assets are tested annually and are only recognised if likely to be utilised.
When considering tax and duties disputes, Management applies signifi-cant estimates of the likely outcome based on the knowledge available of the actual substance of the disputes, including opinions and estimates by external tax experts and case law, if available. The resolution of dis-putes may take several years, and the outcome is subject to considerable uncertainty.
Deferred tax recognised in the balance sheet (DKKm) 20192020
Deferred tax at 1 January 1,709 801Deferred tax for the year 621 (9)Tax adjustment relating to previous years (162) 79Tax on changes in equity 383 401Additions from business combinations - 623Other adjustments (258) (186)
Deferred tax at 31 December 2,293 1,709
Deferred tax not recog nised in the balance sheet (DKKm) 20192020
Temporary differences (27) 37Tax loss carryforwards 982 848
Total tax assets not recognised 955 885
Of tax loss carryforwards, DKK 982 million may be carried forward in-definitely.
73 DSV Panalpina Annual Report 2020 Consolidated financial statements 2020

5.2 Tax — continued
The deferred tax assets and liabilities recognised are allocated to the following items:
Deferred tax allocation 2020 (DKKm) Intangible assetsPPE and
ROU assets Provisions Other liabilities
Tax base oftax loss carry-
forwards Total
Deferred tax at 1 January (364) (1,762) 988 1,989 858 1,709Recognised in profit/loss 111 (61) (103) 310 202 459Recognised in equity - - 380 3 - 383Additions from business combinations - - - - - -Other adjustments - (3) (2) - (131) (136)Currency translation - 48 (38) (74) (58) (122)
Deferred tax at 31 December (253) (1,778) 1,225 2,228 871 2,293
Balance sheet classification:Deferred tax assets (129) (1,576) 1,310 2,071 860 2,536Deferred tax liabilities (124) (202) (85) 157 11 (243)
Deferred tax allocation 2019 (DKKm) Intangible assetsPPE and
ROU assets Provisions Other liabilities
Tax base of tax loss carry-
forwards Total
Deferred tax at 1 January (171) (2,042) 546 1,983 485 801Recognised in profit/loss (35) 228 (360) (4) 241 70Recognised in equity - - 412 (11) - 401Additions from business combinations (159) 43 386 31 322 623Other adjustments - 9 - (14) (199) (204)Currency translation 1 - 4 4 9 18
Deferred tax at 31 December (364) (1,762) 988 1,989 858 1,709
Balance sheet classification:Deferred tax assets (190) (1,437) 1,103 1,842 846 2,164Deferred tax liabilities (174) (325) (115) 147 12 (455)
74 DSV Panalpina Annual Report 2020 Consolidated financial statements 2020
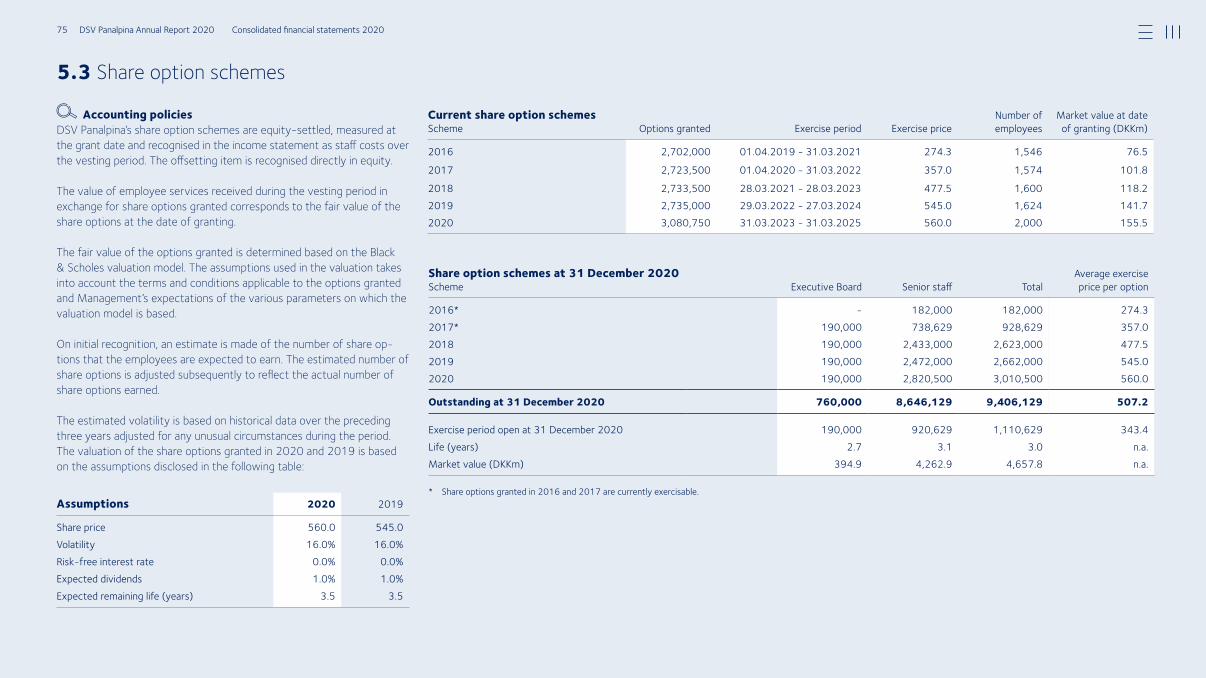
5.3 Share option schemes
Accounting policiesDSV Panalpina’s share option schemes are equity-settled, measured at the grant date and recognised in the income statement as staff costs over the vesting period. The offsetting item is recognised directly in equity.
The value of employee services received during the vesting period in exchange for share options granted corresponds to the fair value of the share options at the date of granting.
The fair value of the options granted is determined based on the Black & Scholes valuation model. The assumptions used in the valuation takes into account the terms and conditions applicable to the options granted and Management’s expectations of the various parameters on which the valuation model is based.
On initial recognition, an estimate is made of the number of share op-tions that the employees are expected to earn. The estimated number of share options is adjusted subsequently to reflect the actual number of share options earned.
The estimated volatility is based on historical data over the preceding three years adjusted for any unusual circumstances during the period. The valuation of the share options granted in 2020 and 2019 is based on the assumptions disclosed in the following table:
Assumptions 2020 2019
Share price 560.0 545.0Volatility 16.0% 16.0%Risk-free interest rate 0.0% 0.0%Expected dividends 1.0% 1.0%Expected remaining life (years) 3.5 3.5
Current share option schemesScheme Options granted Exercise period Exercise price
Number of employees
Market value at date of granting (DKKm)
2016 2,702,000 01.04.2019 - 31.03.2021 274.3 1,546 76.5
2017 2,723,500 01.04.2020 - 31.03.2022 357.0 1,574 101.8
2018 2,733,500 28.03.2021 - 28.03.2023 477.5 1,600 118.22019 2,735,000 29.03.2022 - 27.03.2024 545.0 1,624 141.72020 3,080,750 31.03.2023 - 31.03.2025 560.0 2,000 155.5
Share option schemes at 31 December 2020Scheme Executive Board Senior staff Total
Average exercise price per option
2016* - 182,000 182,000 274.3 2017* 190,000 738,629 928,629 357.0 2018 190,000 2,433,000 2,623,000 477.52019 190,000 2,472,000 2,662,000 545.02020 190,000 2,820,500 3,010,500 560.0
Outstanding at 31 December 2020 760,000 8,646,129 9,406,129 507.2
Exercise period open at 31 December 2020 190,000 920,629 1,110,629 343.4Life (years) 2.7 3.1 3.0 n.a.Market value (DKKm) 394.9 4,262.9 4,657.8 n.a.
* Share options granted in 2016 and 2017 are currently exercisable.
75 DSV Panalpina Annual Report 2020 Consolidated financial statements 2020
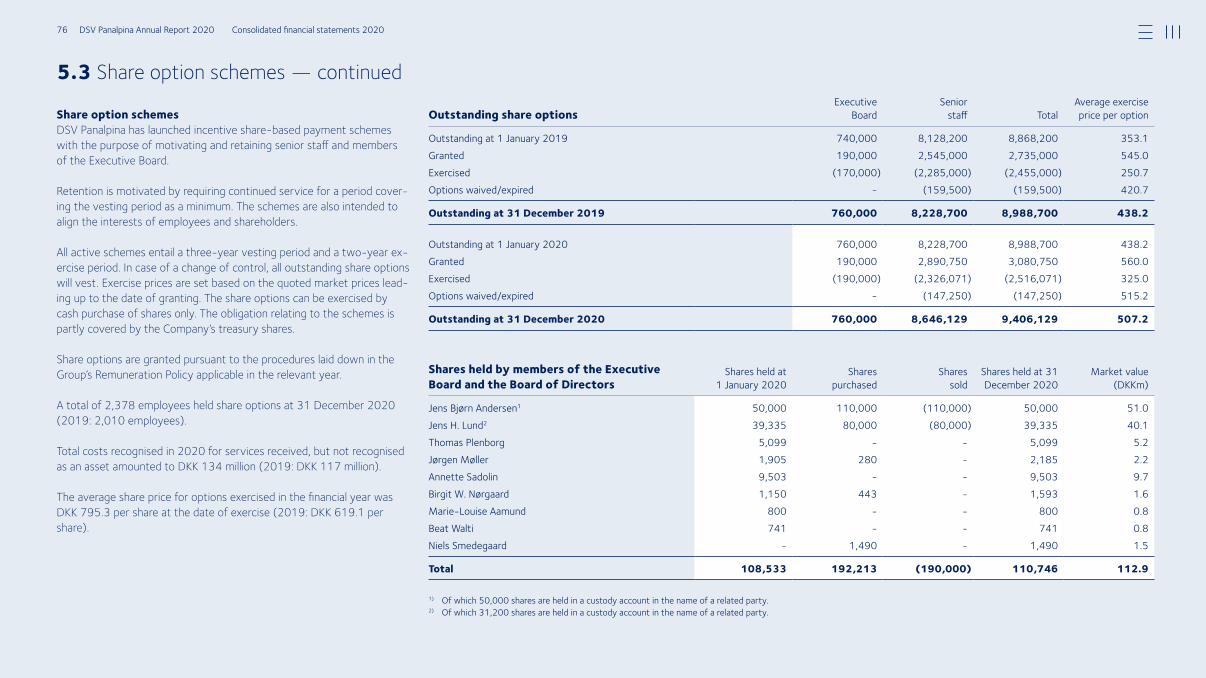
5.3 Share option schemes — continued
Share option schemesDSV Panalpina has launched incentive share-based payment schemes with the purpose of motivating and retaining senior staff and members of the Executive Board.
Retention is motivated by requiring continued service for a period cover-ing the vesting period as a minimum. The schemes are also intended to align the interests of employees and shareholders.
All active schemes entail a three-year vesting period and a two-year ex-ercise period. In case of a change of control, all outstanding share options will vest. Exercise prices are set based on the quoted market prices lead-ing up to the date of granting. The share options can be exercised by cash purchase of shares only. The obligation relating to the schemes is partly covered by the Company’s treasury shares.
Share options are granted pursuant to the procedures laid down in the Group’s Remuneration Policy applicable in the relevant year.
A total of 2,378 employees held share options at 31 December 2020 (2019: 2,010 employees).
Total costs recognised in 2020 for services received, but not recognised as an asset amounted to DKK 134 million (2019: DKK 117 million).
The average share price for options exercised in the financial year was DKK 795.3 per share at the date of exercise (2019: DKK 619.1 per share).
Outstanding share optionsExecutive
BoardSenior
staff TotalAverage exercise price per option
Outstanding at 1 January 2019 740,000 8,128,200 8,868,200 353.1Granted 190,000 2,545,000 2,735,000 545.0Exercised (170,000) (2,285,000) (2,455,000) 250.7Options waived/expired - (159,500) (159,500) 420.7
Outstanding at 31 December 2019 760,000 8,228,700 8,988,700 438.2
Outstanding at 1 January 2020 760,000 8,228,700 8,988,700 438.2Granted 190,000 2,890,750 3,080,750 560.0Exercised (190,000) (2,326,071) (2,516,071) 325.0Options waived/expired - (147,250) (147,250) 515.2
Outstanding at 31 December 2020 760,000 8,646,129 9,406,129 507.2
Shares held by members of the Executive Board and the Board of Directors
Shares held at 1 January 2020
Shares purchased
Shares sold
Shares held at 31 December 2020
Market value (DKKm)
Jens Bjørn Andersen1 50,000 110,000 (110,000) 50,000 51.0Jens H. Lund2 39,335 80,000 (80,000) 39,335 40.1Thomas Plenborg 5,099 - - 5,099 5.2Jørgen Møller 1,905 280 - 2,185 2.2Annette Sadolin 9,503 - - 9,503 9.7Birgit W. Nørgaard 1,150 443 - 1,593 1.6Marie-Louise Aamund 800 - - 800 0.8Beat Walti 741 - - 741 0.8Niels Smedegaard - 1,490 - 1,490 1.5
Total 108,533 192,213 (190,000) 110,746 112.9
1) Of which 50,000 shares are held in a custody account in the name of a related party. 2) Of which 31,200 shares are held in a custody account in the name of a related party.
76 DSV Panalpina Annual Report 2020 Consolidated financial statements 2020

5.4 Remuneration of the Executive Board and the Board of Directors
5.5 Fees to auditors appointed at the Annual General Meeting
Executive BoardThe members of the Executive Board are subject to a notice period of up to 24 months. Remuneration of the members of the Executive Board and the Board of Directors complies with the principles of the Company’s Remuneration Policy.
The aggregate remuneration for the members of the Executive Board for 2020 was DKK 37.6 million (2019: DKK 36.7 million). The remuneration of the Executive Board breaks down as follows:
Board of DirectorsThe aggregate remuneration for the Board of Directors of DSV Panalpina A/S for 2020 was DKK 6.9 million (2019: DKK 6.1 million).
Non-audit services provided by PwC Denmark amounted to DKK 4 million in 2020 relating to data AI solution advisory services, various tax advisory services and other advisory services. Non-audit services provided by PwC Denmark did not exceed 70% of the audit fees in accordance with EU audit legislation.
* 2019 includes fees to Deloitte amounting to DKK 23 million for statutory audit, DKK 4 million for tax and VAT advisory services and DKK 2 million for other services.
Board of Directors’ remuneration (DKK ‘000) 20192020
Thomas Plenborg, Chairman 2,250 1,434Jørgen Møller, Deputy Chairman 1,000 647Annette Sadolin 1,000 769Birgit W. Nørgaard 625 563Marie-Louise Aamund (elected in 2019) 750 506Beat Walti (elected in 2019) 584 113Niels Smedegaard (elected in 2020) 565 -Robert S. Kledal (resigned in 2020) 130 525Kurt K. Larsen (resigned in 2019) - 1,519
Total 6,904 6,076
Audit fees and services (DKKm) 2020 2019
Statutory audit fees 33 35Assurance engagements other than audits 1 6Tax and VAT advisory services 1 1Other services 4 1
Total fees to auditors appointed at the Annual General Meeting 39 43
Statutory audit fees 5 26Tax and VAT advisory services 13 24Other services 8 8
Total fees, other* 26 58
Total fees 65 101
Executive Board’s remuneration (DKKm)
2020
Jens Bjørn Andersen
Jens H. Lund Total
Fixed salary 15.2 11.3 26.5Pension 1.2 0.9 2.1Share-based payment 5.2 3.8 9.0
Total 21.6 16.0 37.6
Executive Board’s remuneration (DKKm)
2019
Jens Bjørn Andersen
Jens H. Lund Total
Fixed salary 11.9 8.8 20.7Pension 4.3 3.7 8.0Share-based payment 4.6 3.4 8.0
Total 20.8 15.9 36.7
77 DSV Panalpina Annual Report 2020 Consolidated financial statements 2020

The Group had the following balances with associates at 31 December:
Contingent liabilities
Accounting policiesContingent liabilities comprise possible obligations which have not yet been confirmed, are uncertain or cannot be measured reliably, but which, if realised, may result in a drain on the Group’s resources. Obligations are recognised in the financial statements only to the extent that the criteria for recognising a provision is met.
Management judgements and estimatesManagement applies judgements in assessing the existence of contin-gent liabilities on an ongoing basis and in this regard considers if the criteria for recognising a provision is met.
These judgements may involve advice from external experts, legal advisors, etc.
Contingent liabilities 2020As an international transport service provider, the Group is regularly in-volved in tax and VAT disputes, legal proceedings or inquiries from com-petition authorities. Management believes that the cases currently iden-tified will have no material impact on the financial position of the Group.
A detailed disclosure of individual contingent liabilities is considered impracticable and has therefore not been included in the notes to the financial statements.
Security for debtBank guaranteesAs part of its ordinary operations, DSV Panalpina has provided bank guarantees to authorities, suppliers, etc.
Associated companies balances (DKKm) 20192020
Receivables 29 44Payables 2 2
The counterparties may claim appropriation of collateral if DSV Panalpina fails to pay any amount due.
At the reporting date, all liabilities relating to the bank guarantees pro-vided were recognised in the balance sheet or described in note 3.6 as operating lease obligations.
PledgesAt 31 December 2020, property, plant and equipment and other finan-cial assets with a carrying value of DKK 9.8 million were pledged as se-curity (2019: DKK 11 million). The carrying amount of debt secured by pledges amounted to DKK 0 million (2019: DKK 0 million).
ContractsDSV Panalpina has concluded IT service contracts. Costs related to these contracts are recognised as the services are provided.
Associated companies transactions (DKKm) 20192020
Sale of services 193 217Purchase of services 19 30
DSV Panalpina has no related parties with control of the Group and no related parties with significant influence other than key management personnel – mainly in the form of the Board of Directors and the Executive Board.
Related-party transactionsBoard of Directors and Executive BoardNo transactions with related parties were made in 2020 other than ordinary remuneration, as described in notes 5.3 and 5.4.
Associated companiesDSV Panalpina holds ownership interests in seven associates (2019: eight associates). The Group’s share of associates’ profit for the year amounted to DKK 6 million (2019: DKK 2 million).
The carrying amount of the investment was DKK 37 million at 31 December 2020 (2019: DKK 34 million).
The Group had the following transactions with associates:
5.7 Contingent liabilities and security for debt5.6 Related-party transactions
78 DSV Panalpina Annual Report 2020 Consolidated financial statements 2020

Definition of key figures and ratios
Key figures and ratios are disclosed in accordance with ‘Recommendations & Ratios’ published by the Danish Finance Society, except for financial ratios marked with (*) as these are either derived or not included in the publication. Earnings per share and diluted earnings per share are disclosed in accordance with IAS 33. Environmental and social key figures and ratios are defined in the DSV Panalpina Responsibility Report 2020 to which reference is made.
Net interest- = bearing debt
Net working capital =
Invested capital =
Adjusted earnings =
Adjusted free = cash flow
Gross margin =
Operating margin =
Conversion ratio =
Effective tax rate* =
Return on invested =capital before tax
Return on equity =
Solvency ratio =
Gearing ratio* =
Earnings per share =
Diluted earnings = per share
Diluted adjusted = earnings per share
Number of shares =
Average number = of shares
Average number =of shares diluted
Interest-bearing debt less interest-bearing assets and cash and cash equivalents
Receivables and other current operating assets less trade payables and other payables and other current operating liabilities
NWC + property, plant and equipment, right-of-use (ROU) assets, intangible assets including goodwill and customer relationships less long-term provisions
The DSV Panalpina A/S shareholders’ share of profit for the reporting period adjusted for amortisation and impairment of goodwill and customer relation-ships, costs related to share-based payments and special items. The tax effect of the adjustments has been taken into account
Free cash flow adjusted for net acquisition of subsid-iaries and activities, lease liability repayments, spe-cial items and normalisation of working capital in subsidiaries and activities acquired
Gross profit * 100Revenue
Operating profit (EBIT) before special items * 100
Revenue
Operating profit (EBIT) before special items * 100Gross profit
Tax on profit for the yearProfit before tax
Operating profit (EBIT) before special items * 100Average invested capital
Profit attributable to the shareholders of DSV Panalpina A/S * 100
Average equity excluding non-controlling interests
Equity excluding non-controlling interests * 100Total assets
Net interest-bearing debtOperating profit before amortisation,
depreciation (EBITDA) before special items
Profit attributable to the shareholders of DSV Panalpina A/S
Average number of shares
Profit attributable to the shareholders of DSV Panalpina A/S
Average number of shares diluted
Adjusted earningsAverage number of shares diluted
Total number of shares outstanding excluding treasury shares at the reporting date
Average number of shares outstanding during the re-porting period
Average number of shares outstanding during the re-porting period including share options, but excluding out-of-the-money options measured relative to the average share price for the period
Key figures Financial ratios Share ratios
79 DSV Panalpina Annual Report 2020 Consolidated financial statements 2020

Group company overview
The overview below is a list of companies in the DSV Panalpina Group at 31 December 2020 showing the companies by segment and not by legal structure.
Company CountryOwnership
share Activity
Parent
DSV Panalpina A/S Denmark
Subsidiaries
Europe
DSV Air & Sea GmbH Austria 100.0%
DSV Road GmbH Austria 100.0%
DSV Transport Ltd. Belarus 100.0%
DSV Air & Sea NV Belgium 100.0%
Maartens Art Packers and Shippers B.V.B.A. Belgium 100.0%
Panalpina World Transport N.V. Belgium 100.0%
AD Handling NV Belgium 100.0%
ABX Worldwide Holdings NV/SA Belgium 100.0%
DSV Road Holding NV Belgium 100.0%
Air & Sea Road Solutions GroupActivity:
DSV Air & Sea Belgium NV Belgium 100.0%
DSV Solutions N.V. Belgium 100.0%
DSV Logistics N.V. Belgium 100.0%
DSV Road N.V. Belgium 100.0%
MCI Brokers N.V. Belgium 100.0%
Panalpina GBS Bulgaria EOOD Bulgaria 100.0%
DSV Air & Sea EOOD Bulgaria 100.0%
DSV Road EOOD Bulgaria 100.0%
DSV Hrvatska d.o.o. Croatia 100.0%
Panalpina Business Services (Prague), s.r.o. Czech Republic 100.0%
DSV Air & Sea s.r.o. Czech Republic 100.0%
Panalpina Czech S.R.O. Czech Republic 100.0%
DSV Air & Sea Czech Republic s.r.o. Czech Republic 100.0%
DSV Solutions s.r.o. Czech Republic 100.0%
DSV Road a.s. Czech Republic 100.0%
DSV Insurance A/S Denmark 100.0%
DSV Group Services A/S Denmark 100.0%
DSV Property ApS Denmark 100.0%
DSV FS A/S Denmark 100.0%
GP0615 ApS Denmark 100.0%
Anpartselskabet af 25. januar 2017 Denmark 100.0%
DSV Real Estate Valby A/S Denmark 100.0%
DSV Smarter Storage A/S Denmark 100.0%
DSV Real Estate Glostrup A/S Denmark 100.0%
DSV Air & Sea Holding A/S Denmark 100.0%
DSV Air & Sea A/S Denmark 100.0%
DSV Ocean Transport A/S Denmark 100.0%
PC KH ApS Denmark 100.0%
DSV Air & Sea Denmark ApS Denmark 100.0%
DSV Solutions Holding A/S Denmark 100.0%
DSV Solutions A/S Denmark 100.0%
DSV Real Estate Duisburg A/S Denmark 100.0%
Prime Cargo A/S Denmark 100.0%
DSV Road Holding A/S Denmark 100.0%
DSV Road A/S Denmark 100.0%
DSV Real Estate Horsens A/S Denmark 100.0%
DSV Road Services A/S Denmark 100.0%
DSV Estonia AS Estonia 100.0%
DSV Air & Sea Oy Finland 100.0%
DSV Air & Sea Nordic AB – filial Finland Finland 100.0%
UTi Logistics (Finland) Oy Finland 100.0%
Panalpina CIS Helsinki OY Finland 100.0%
DSV Solutions Oy Finland 100.0%
DSV Road Oy Finland 100.0%
DSV Air & Sea SAS France 100.0%
DSV International Air & Sea France France 100.0%
DSV Solutions SAS France 100.0%
DSV Road Holding S.A. France 100.0%
DSV Road SAS France 100.0%
ING REEIF WATTRELOS France 100.0%
DSV Air & Sea Germany GmbH Germany 100.0%
DSV Air & Sea Deutschland GmbH Germany 100.0%
DSV Real Estate Duisburg A/S - German Branch Germany 100.0%
DSV Solutions Group GmbH Germany 100.0%
DSV Solutions GmbH Germany 100.0%
DSV Stuttgart GmbH & Co. KG Germany 100.0%
DSV Stuttgart Verwaltung GmbH Germany 100.0%
Administration & Accounting Service GmbH Germany 100.0%
DSV Road GmbH Germany 100.0%
Company CountryOwnership
share Activity
Europe (continued)
Company CountryOwnership
share Activity
Europe (continued)
80 DSV Panalpina Annual Report 2020 Consolidated financial statements 2020

DSV HELLAS S.A. Greece 100.0%
UTi Networks Limited Guernsey 100.0%
DSV Air & Sea Hungary Kft. Hungary 100.0%
DSV Solutions Hungary Kft. Hungary 100.0%
DSV Hungaria Kft. Hungary 100.0%
DSV Air & Sea Limited Ireland 100.0%
UTi Ireland Ltd. Ireland 100.0%
Panalpina World Transport (Ireland) Ltd. Ireland 100.0%
DSV Air & Sea (Ireland) Limited Ireland 100.0%
DSV Solutions Ltd. Ireland 100.0%
UTI Inventory Management Solutions Limited Ireland 100.0%
DSV Road Limited Ireland 100.0%
DSV S.p.A. Italy 100.0%
UTi Italy SrL Italy 100.0%
Panalpina Trasporti Mondiali S.p.A. Italy 100.0%
DSV Real Estate S.p.A. Italy 89.3%
DSV Air & Sea Italy S.r.l. Italy 100.0%
DSV Real Estate Novara S.r.l. Italy 66.0%
Saima Caspian LLC Kazakhstan 100.0%
UTi Kazakhstan LLP Kazakhstan 100.0%
Panalpina World Transport LLP Kazakhstan 100.0%
DSV Latvia SIA Latvia 100.0%
DSV Lithuania UAB Lithuania 100.0%
DSV Air & Sea S.A. Luxembourg 100.0%
XB Luxembourg Holdings 1 SA Luxembourg 100.0%
XB Luxembourg Holdings 2 SARL Luxembourg 100.0%
DSV Lead Logistics B.V. Netherlands 100.0%
African Investments BV Netherlands 100.0%
UTi (Netherlands) Holdings BV Netherlands 100.0%
DSV Air & Sea Nederland B.V. Netherlands 100.0%
DSV Shared Services B.V. Netherlands 100.0%
DSV Solutions Holding B.V. Netherlands 100.0%
DSV Solutions Nederland B.V. Netherlands 100.0%
IMS Holdings BV Netherlands 100.0%
DSV Multi-Channel Fulfilment B.V. Netherlands 100.0%
VTS Beheer B.V. Netherlands 100.0%
DSV Solutions (Dordrecht) B.V. Netherlands 100.0%
DSV Solutions (Moerdijk) B.V. Netherlands 100.0%
DSV Real Estate Dallas Holding B.V. Netherlands 100.0%
DSV Road Holding N.V. Netherlands 100.0%
DSV Road B.V. Netherlands 100.0%
DSV ROAD DOOEL Skopje North Macedonia 100.0%
DSV Air & Sea AS Norway 100.0%
Panalpina AS Norway 100.0%
DSV Solutions AS Norway 100.0%
DSV Road AS Norway 100.0%
DSV International Shared Services Sp. z o.o. Poland 100.0%
DSV Real Estate Warsaw Sp. z o.o. Poland 100.0%
DSV Air & Sea Sp. z o.o. Poland 100.0%
UTi Poland Sp. z o.o. Poland 100.0%
Panalpina Polska Sp. z o.o. Poland 100.0%
DSV Air & Sea Poland Sp. z o.o. Poland 100.0%
DSV Services Sp. z o.o. Poland 100.0%
Prime Cargo Poland Sp. z o.o. Poland 100.0%
DSV Road Sp. z o.o. Poland 100.0%
DSV Solutions Sp. z o.o. Poland 100.0%
DSV Group Services Unipessoal, Lda Portugal 100.0%
DSV Air & Sea Portugal, LDA Portugal 100.0%
DSV Solutions, Lda. Portugal 100.0%
DSV SGPS, Lda. Portugal 100.0%
DSV Transitarios, Lda. Portugal 100.0%
DSV Air & Sea SRL Romania 100.0%
DSV Solutions S.R.L. Romania 100.0%
DSV Air & Sea JSC Russia 100.0%
DSV Sakhalin, OOO Russia 100.0%
Panalpina CIS Helsinki Oy - Russia Branch Russia 100.0%
DSV Solutions OOO Russia 100.0%
DSV Road OOO Russia 100.0%
OOO DSV Transport Russia 100.0%
DSV Road d.o.o. Serbia 100.0%
DSV Solutions Slovakia s. r. o. Slovakia 100.0%
DSV Air & Sea Slovakia s.r.o. Slovakia 100.0%
DSV Slovakia, s.r.o. Slovakia 100.0%
DSV Transport d.o.o. Slovenia 100.0%
Tacisa Transitaria S.L. Spain 100.0%
DSV Air & Sea International, S.L.U. Spain 100.0%
DSV Solutions Spain S.A.U. Spain 100.0%
Servicios Logisticos Integrados SLI, S.A. Spain 100.0%
DSV Road Spain S.A.U. Spain 100.0%
DSV Holding Spain S.L. Spain 100.0%
DSV Air & Sea, S.A.U. Spain 100.0%
DSV Air & Sea AB Sweden 100.0%
UTi Logistics AB Sweden 100.0%
DSV Air & Sea Nordic AB Sweden 100.0%
DSV Solutions AB Sweden 100.0%
DSV Group AB Sweden 100.0%
DSV Road AB Sweden 100.0%
Göinge Frakt EK Sweden 100.0%
DSV Road Property Holding AB Sweden 100.0%
Panalpina Welttransport Holding AG Switzerland 100.0%
Company CountryOwnership
share Activity
Europe (continued)
Company CountryOwnership
share Activity
Europe (continued)
Company CountryOwnership
share Activity
Europe (continued)
81 DSV Panalpina Annual Report 2020 Consolidated financial statements 2020

Panalpina Management AG Switzerland 100.0%
Panalpina International AG Switzerland 100.0%
Panalpina Global Employment Services AG Switzerland 100.0%
Panalpina Air & Ocean AG in liquidation Switzerland 100.0%
DSV Air & Sea AG Switzerland 100.0%
DSV Logistics S.A. Switzerland 100.0%
DSV Air & Sea A.S. Turkey 100.0%
DSV International Hava ve Deniz Taşimaciliği Ltd.Şirketi Turkey 100.0%
DSV Road & Solutions A.S. Turkey 100.0%
Panalpina World Transport Ltd. Ukraine 100.0%
DSV Logistics LLC Ukraine 100.0%
DSV Air & Sea Limited United Kingdom 100.0%
UTi (UK) Holdings Ltd. United Kingdom 100.0%
UTi Worldwide (UK) Ltd. United Kingdom 100.0%
Panalpina World Transport Ltd. United Kingdom 100.0%
DSV Air & Sea 2018 (UK) Limited United Kingdom 100.0%
DSV Peterborough Real Estate Limited United Kingdom 100.0%
DSV Road Holding Ltd. United Kingdom 100.0%
DSV Commercials Ltd. United Kingdom 100.0%
DSV Road Ltd. United Kingdom 100.0%
DSV Pension Trustees Ltd. United Kingdom 100.0%
DSV Solutions Ltd. United Kingdom 100.0%
DFDS Transport Ltd. United Kingdom 100.0%
DSV Real Estate Tamworth Ltd. United Kingdom 100.0%
North America
DSV Air & Sea Inc. Canada 100.0%
DSV Solutions Inc. Canada 100.0%
DSV Road, Inc. Canada 100.0%
DSV Air & Sea, S.A. de C.V. Mexico 100.0%
UTi Services S.A. de C.V. Mexico 100.0%
Panalpina Servicios S.A. de C.V. Mexico 100.0%
DSV Solutions S.A. de C.V. Mexico 100.0%
DSV Road, S.A. de C.V. Mexico 100.0%
DSV 4PL Inc. United States 100.0%
DSV Air & Sea Holding Inc. United States 100.0%
DSV Air & Sea Inc. United States 100.0%
DSV Air & Sea International Holding Inc. United States 100.0%
DSV Solutions, LLC United States 100.0%
UTi Inventory Management Solutions Inc. United States 100.0%
DSV Real Estate Dallas Inc. United States 100.0%
Market Industries LLC United States 100.0%
Sammons Transportation, Inc. United States 100.0%
DSV Road, Inc. United States 100.0%
South America
DSV Air & Sea S.A. Argentina 100.0%
UTi Logistics Argentina S.A. Argentina 100.0%
Panalpina Transportes Mundiales S.A. Argentina 100.0%
DSV Solutions Brasil Serviços de Logística Ltda. Brazil 100.0%
Panalpina Ltda. Brazil 100.0%
UTi Worldwide Inc. Brit. Virgin Islands 100.0%
Goddard Company Limited Brit. Virgin Islands 100.0%
UTi International Inc. Brit. Virgin Islands 100.0%
Pyramid Freight (Proprietary) Limited Brit. Virgin Islands 100.0%
UTi Logistics (Proprietary) Limited Brit. Virgin Islands 100.0%
Thomas International Freight Auditors Limited Brit. Virgin Islands 100.0%
UTi Asia Pacific Limited Brit. Virgin Islands 100.0%
UTi Kazakhstan Investments Ltd Brit. Virgin Islands 100.0%
DSV Air & Sea (Latin America) S.A. Chile 100.0%
DSV Air & Sea S.A. Chile 100.0%
Panalpina Chile Transportes Mundiales Ltda. Chile 100.0%
DSV Air & Sea S.A.S. Colombia 100.0%
DSV Solutions S.A.S. Colombia 100.0%
DSV Air & Sea S.A. Costa Rica 100.0%
DSV Air & Sea Dominicana, S.R.L.Dominican
Republic 100.0%
Panalpina Ecuador S.A. Ecuador 100.0%
DSV Air & Sea, S.A. de C.V. El Salvador 100.0%
DSV Air & Sea PA Inc. Panama 100.0%
Panalpina SEM, S.A. Panama 100.0%
Panalpina S.A. Panama 100.0%
Almacenadora Mercantil S.A. Panama 100.0%
DSV Air & Sea S.A. Peru 100.0%
DSV Air & Sea (PR) Inc. Puerto Rico 100.0%
Arabella Shipping LtdSaint Vincent And
The Grenadines 100.0%
UTi Uruguay SA Uruguay 100.0%
Panalpina Uruguay Transportes Mundiales S.A. Uruguay 100.0%
Panalpina Zona Franca S.A. Uruguay 100.0%
Asia
DSV Air & Sea Ltd. Bangladesh 100.0%
ABX LOGISTICS (Bangladesh) Ltd. Bangladesh 100.0%
UTI Pership (Pvt) Limited - Bangladesh Branch (BDT) Bangladesh 100.0%
Panalpina World Transport (Cambodia) Co., Ltd Cambodia 100.0%
Company CountryOwnership
share Activity
North America (continued)
Company CountryOwnership
share Activity
Europe (continued)
Company CountryOwnership
share Activity
South America (continued)
82 DSV Panalpina Annual Report 2020 Consolidated financial statements 2020
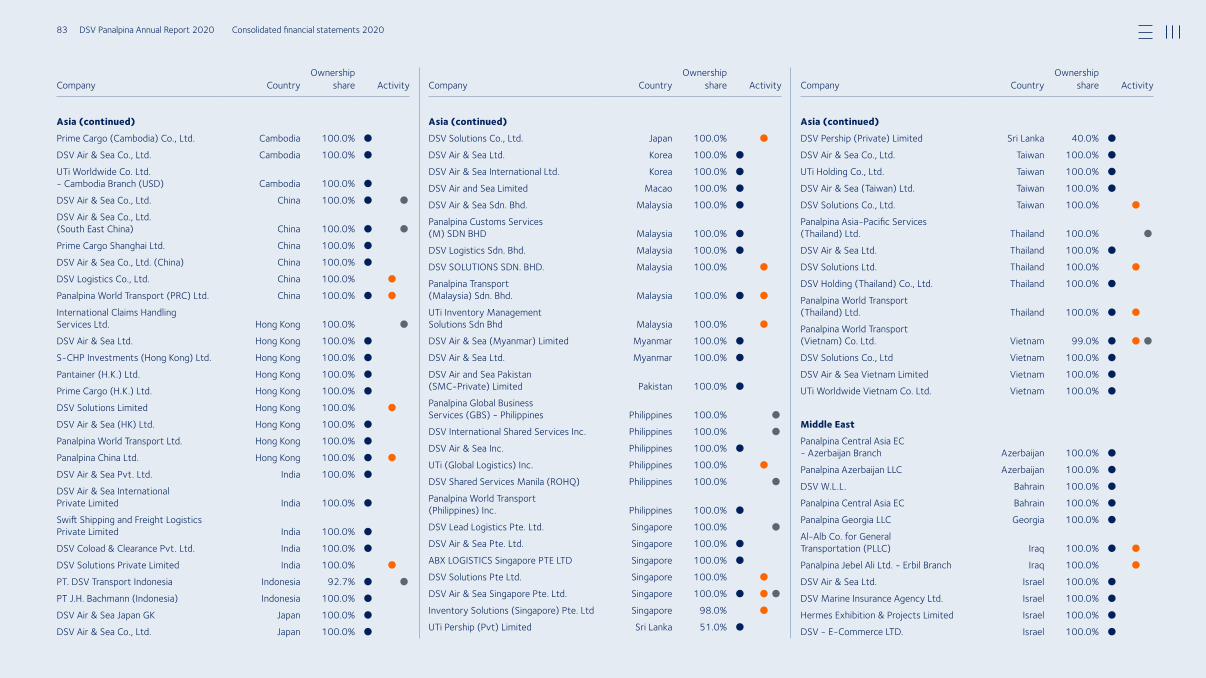
Prime Cargo (Cambodia) Co., Ltd. Cambodia 100.0%
DSV Air & Sea Co., Ltd. Cambodia 100.0%
UTi Worldwide Co. Ltd. - Cambodia Branch (USD) Cambodia 100.0%
DSV Air & Sea Co., Ltd. China 100.0%
DSV Air & Sea Co., Ltd. (South East China) China 100.0%
Prime Cargo Shanghai Ltd. China 100.0%
DSV Air & Sea Co., Ltd. (China) China 100.0%
DSV Logistics Co., Ltd. China 100.0%
Panalpina World Transport (PRC) Ltd. China 100.0%
International Claims Handling Services Ltd. Hong Kong 100.0%
DSV Air & Sea Ltd. Hong Kong 100.0%
S-CHP Investments (Hong Kong) Ltd. Hong Kong 100.0%
Pantainer (H.K.) Ltd. Hong Kong 100.0%
Prime Cargo (H.K.) Ltd. Hong Kong 100.0%
DSV Solutions Limited Hong Kong 100.0%
DSV Air & Sea (HK) Ltd. Hong Kong 100.0%
Panalpina World Transport Ltd. Hong Kong 100.0%
Panalpina China Ltd. Hong Kong 100.0%
DSV Air & Sea Pvt. Ltd. India 100.0%
DSV Air & Sea International Private Limited India 100.0%
Swift Shipping and Freight Logistics Private Limited India 100.0%
DSV Coload & Clearance Pvt. Ltd. India 100.0%
DSV Solutions Private Limited India 100.0%
PT. DSV Transport Indonesia Indonesia 92.7%
PT J.H. Bachmann (Indonesia) Indonesia 100.0%
DSV Air & Sea Japan GK Japan 100.0%
DSV Air & Sea Co., Ltd. Japan 100.0%
DSV Solutions Co., Ltd. Japan 100.0%
DSV Air & Sea Ltd. Korea 100.0%
DSV Air & Sea International Ltd. Korea 100.0%
DSV Air and Sea Limited Macao 100.0%
DSV Air & Sea Sdn. Bhd. Malaysia 100.0%
Panalpina Customs Services (M) SDN BHD Malaysia 100.0%
DSV Logistics Sdn. Bhd. Malaysia 100.0%
DSV SOLUTIONS SDN. BHD. Malaysia 100.0%
Panalpina Transport (Malaysia) Sdn. Bhd. Malaysia 100.0%
UTi Inventory Management Solutions Sdn Bhd Malaysia 100.0%
DSV Air & Sea (Myanmar) Limited Myanmar 100.0%
DSV Air & Sea Ltd. Myanmar 100.0%
DSV Air and Sea Pakistan (SMC-Private) Limited Pakistan 100.0%
Panalpina Global Business Services (GBS) - Philippines Philippines 100.0%
DSV International Shared Services Inc. Philippines 100.0%
DSV Air & Sea Inc. Philippines 100.0%
UTi (Global Logistics) Inc. Philippines 100.0%
DSV Shared Services Manila (ROHQ) Philippines 100.0%
Panalpina World Transport (Philippines) Inc. Philippines 100.0%
DSV Lead Logistics Pte. Ltd. Singapore 100.0%
DSV Air & Sea Pte. Ltd. Singapore 100.0%
ABX LOGISTICS Singapore PTE LTD Singapore 100.0%
DSV Solutions Pte Ltd. Singapore 100.0%
DSV Air & Sea Singapore Pte. Ltd. Singapore 100.0%
Inventory Solutions (Singapore) Pte. Ltd Singapore 98.0%
UTi Pership (Pvt) Limited Sri Lanka 51.0%
DSV Pership (Private) Limited Sri Lanka 40.0%
DSV Air & Sea Co., Ltd. Taiwan 100.0%
UTi Holding Co., Ltd. Taiwan 100.0%
DSV Air & Sea (Taiwan) Ltd. Taiwan 100.0%
DSV Solutions Co., Ltd. Taiwan 100.0%
Panalpina Asia-Pacific Services (Thailand) Ltd. Thailand 100.0%
DSV Air & Sea Ltd. Thailand 100.0%
DSV Solutions Ltd. Thailand 100.0%
DSV Holding (Thailand) Co., Ltd. Thailand 100.0%
Panalpina World Transport (Thailand) Ltd. Thailand 100.0%
Panalpina World Transport (Vietnam) Co. Ltd. Vietnam 99.0%
DSV Solutions Co., Ltd Vietnam 100.0%
DSV Air & Sea Vietnam Limited Vietnam 100.0%
UTi Worldwide Vietnam Co. Ltd. Vietnam 100.0%
Middle East
Panalpina Central Asia EC - Azerbaijan Branch Azerbaijan 100.0%
Panalpina Azerbaijan LLC Azerbaijan 100.0%
DSV W.L.L. Bahrain 100.0%
Panalpina Central Asia EC Bahrain 100.0%
Panalpina Georgia LLC Georgia 100.0%
Al-Alb Co. for General Transportation (PLLC) Iraq 100.0%
Panalpina Jebel Ali Ltd. - Erbil Branch Iraq 100.0%
DSV Air & Sea Ltd. Israel 100.0%
DSV Marine Insurance Agency Ltd. Israel 100.0%
Hermes Exhibition & Projects Limited Israel 100.0%
DSV - E-Commerce LTD. Israel 100.0%
Company CountryOwnership
share Activity
Asia (continued)
Company CountryOwnership
share Activity
Asia (continued)
Company CountryOwnership
share Activity
Asia (continued)
83 DSV Panalpina Annual Report 2020 Consolidated financial statements 2020

DSV Solutions Ltd Israel 100.0%
U.T.I.-Inventory Management Solutions Limited partnership Israel 100.0%
UTI IMS Ltd. Israel 100.0%
UTi Egypt/Jordan Ltd. Jordan 100.0%
Panalpina World Transport (Kuwait) WLL Kuwait 49.0%
Panalpina Freight LLC Oman 70.0%
Panalpina Qatar WLL Qatar 49.0%
DSV Panalpina Marine Shipping W.L.L. Qatar 100.0%
Panalpina World Transport (Saudi Arabia) Ltd. Saudi Arabia 100.0%
DSV Air & Sea (LLC)United Arab
Emirates 100.0%
Panalpina World Transport (Dubai) DWC-LLC
United Arab Emirates 100.0%
Panalpina Jebel Ali Ltd.United Arab
Emirates 100.0%
Panalpina Gulf LLCUnited Arab
Emirates 49.0%
DSV Air and Sea DWC-LLCUnited Arab
Emirates 100.0%
DSV Air and Sea Middle East DWC-LLCUnited Arab
Emirates 100.0%
Oceania
DSV Air & Sea Pty. Ltd. Australia 100.0%
DSV Solutions Pty. Ltd. Australia 100.0%
DSV Air & Sea Limited New Zealand 100.0%
Africa
Frans Maas Algerie S.a.r.l. Algeria 100.0%
Panalpina Transportes Mundiais Navegãçao e Trânsitos S.A.R.L. Angola 49.0%
DSV Air & Sea (PTY) Limited Botswana 100.0%
Swift Freight International Burundi SA Burundi 100.0%
Panalpina Transports Mondiaux Cameroun S.A.R.L. Cameroon 90.0%
DSV Swift SARL DR Congo 100.0%
DSV-UTI Egypt Ltd. Egypt 100.0%
Panalpina World Transport Egypt LLC Egypt 100.0%
Panalpina Transports Mondiaux Gabon S.A. Gabon 89.8%
DSV Air & Sea Limited Ghana 100.0%
DSV Air & Sea Limited Kenya 100.0%
Panalpina Kenya Ltd. Kenya 100.0%
DSV Air & Sea LIMITED Malawi 100.0%
Panalpina Morocco S.A.R.L. Morocco 100.0%
DSV Transport Int’l S.A Morocco 100.0%
Terminal Handling Company Morocco 100.0%
DSV Air & Sea Limitada Mozambique 100.0%
Saima Nigeria Ltd. Nigeria 40.0%
Nationwide Clearing & Forwarding Ltd. Nigeria 36.6%
DSV Freight International Limited Nigeria 100.0%
DSV Air & Sea Ltd. Rwanda 100.0%
DSV Air and Sea (Proprietary) Limited South Africa 100.0%
Pyramid Freight (Pty) Limited South Africa 100.0%
DSV South Africa (Pty) Ltd. South Africa 75.0%
DSV Shared Services (Pty) Ltd. South Africa 100.0%
UTi Logistics (Proprietary) Limited - SC OCS Division South Africa 100.0%
DSV AFRICA HOLDING (Pty) Ltd. South Africa 100.0%
DSV Skyservices (Pty) Ltd South Africa 100.0%
Scorpion Share Block (Pty) Ltd. South Africa 100.0%
Marine Link (Pty) Ltd. South Africa 100.0%
DSV Real Estate Johannesburg (Pty) Ltd. South Africa 100.0%
Firefly Investments 337 Properties Proprietary Limited South Africa 100.0%
Linkit lnvestments (Pty) Ltd. South Africa 80.0%
DSV Healthcare (Pty) Ltd. South Africa 100.0%
DSV Solutions (Pty) Ltd. South Africa 100.0%
DSV Assembly Services (Pty) Ltd. South Africa 65.3%
DSV Mounties (Pty) Ltd. South Africa 100.0%
DSV Road (Pty) Ltd. South Africa 100.0%
DSV Air & Sea Limited Tanzania 100.0%
Panalpina World Transport Tanzania Limited Tanzania 100.0%
Swift Global Logistics Togo 100.0%
DSV Air & Sea Limited Uganda 100.0%
Panalpina Uganda Limited Uganda 100.0%
Swift Freight International (Zambia) Ltd. Zambia 100.0%
DSV Air & Sea Limited Zambia 100.0%
DSV Air & Sea (Private) Limited Zimbabwe 100.0%
Associates
MGM Lines Srl Italy 30.0%
Sama Al Imad General Transport LLC Iraq 30.0%
GT Stevedores Oy Finland 25.5%
KM Logistik GmbH Germany 35.0%
IDS Logistik GmbH Germany 28.0%
Beavor Properties (Pty) Ltd. South Africa 25.0%
Key Logistics, Inc. United States 49.0%
Company CountryOwnership
share Activity
Africa (continued)
Company CountryOwnership
share Activity
Middle East (continued)
Company CountryOwnership
share Activity
Africa (continued)
84 DSV Panalpina Annual Report 2020 Consolidated financial statements 2020
Statement by the Board of Directors and the Executive Board
The Board of Directors and Executive Board have today considered and adopted the Annual Report of DSV Panalpina A/S for the financial year 1 January to 31 December 2020. The Annual Report has been prepared in accordance with International Financial Reporting Standards (‘IFRS’) as issued by the International Accounting Standard Board (‘IASB’) and in accordance with IFRS as endorsed by the EU and further requirements in the Danish Financial Statements Act. In our opinion, the Consolidated Financial Statements and the Parent Company Financial Statements give a true and fair view of the financial position at 31 December 2020 of the Group and the Parent Company and of the results of the Group and Parent Company operations and cash flows for 2020.
Hedehusene, 10 February 2021
Executive Board:
Jens Bjørn Andersen CEO
Jens H. LundCFO
Board of Directors:
Thomas PlenborgChairman
Marie-Louise Aamund
Jørgen MøllerDeputy Chairman
Beat Walti
Annette Sadolin
Niels Smedegaard
Birgit W. Nørgaard
In our opinion, the annual report of DSV Panalpina A/S for the financial year 1 January to 31 December 2020 with the file name DSVP-2020-12-31 is prepared, in all material respects, in compliance with the ESEF Regulation. In our opinion, Management’s Commentary includes a true and fair ac-count of the development in the operations and financial circumstances of the Group and the Parent Company, of the results for the year and of the financial position of the Group and the Parent Company as well as a description of the most significant risks and elements of uncertainty facing the Group and the Parent Company. We recommend that the Annual Report be adopted at the Annual General Meeting.
85 DSV Panalpina Annual Report 2020 Statements

Independent Auditor’s reportsTo the shareholders of DSV Panalpina A/S Report on the audit of the Financial Statements
OpinionIn our opinion, the Consolidated Financial Statements and the Parent Company Financial Statements give a true and fair view of the Group’s and the Parent Company’s financial position at 31 December 2020 and of the results of the Group’s and the Parent Company’s operations and cash flows for the financial year 1 January to 31 December 2020 in accordance with International Financial Reporting Standards (‘IFRS’) as issued by the International Accounting Standards Board (‘IASB’) and in accordance with IFRS as endorsed by the EU and further requirements in the Danish Financial Statements Act.
Our opinion is consistent with our Auditor’s Long-form Report to the Audit Committee and the Board of Directors.
What we have auditedThe Consolidated Financial Statements and Parent Company Financial Statements of DSV Panalpina A/S for the financial year 1 January to 31 December 2020 comprise income statement and statement of com-prehensive income, cash flow statement, balance sheet, statement of changes in equity and notes, including summary of significant accounting policies for the Group as well as for the Parent Company. Collectively referred to as the ‘Financial Statements’.
Basis for opinionWe conducted our audit in accordance with International Standards on
Auditing (ISAs) and the additional requirements applicable in Denmark. Our responsibilities under those standards and requirements are further described in the ‘Auditor’s responsibilities for the audit of the Financial Statements’ section of our report.
We believe that the audit evidence we have obtained is sufficient and appropriate to provide a basis for our opinion.
IndependenceWe are independent of the Group in accordance with the International Ethics Standards Board for Accountants’ Code of Ethics for Professional Accountants (IESBA Code) and the additional requirements applicable in Denmark. We have also fulfilled our other ethical responsibilities in accordance with the IESBA Code.
To the best of our knowledge and belief, prohibited non-audit services re-ferred to in Article 5(1) of Regulation (EU) No 537/2014 were not provided.
AppointmentWe were first appointed auditors of DSV Panalpina A/S on 9 March 2017 for the financial year 2017. We have been reappointed annually by share-holder resolution for a total period of uninterrupted engagement of four years including the financial year 2020.
Key audit mattersKey audit matters are those matters that, in our professional judgement, were of most significance in our audit of the Financial Statements for 2020. These matters were addressed in the context of our audit of the Financial Statements as a whole, and in forming our opinion thereon, and we do not provide a separate opinion on these matters.
Revenue recognition, contract assets and accrued cost of services
The Group’s revenue consists primarily of services, i.e. shipments of goods between destinations, which by nature is rendered over a period of time. The determination of timing of revenue recognition is dependent on the appli-cation of the Group’s accounting policies and terms in the customer contracts.
We focused on this area because the process of accruing for services ren-dered around the balance sheet date (contract assets and accrued cost of services) is complex and dependent on relevant IT controls in certain oper-ational systems as well as Management estimates, including methods and data applied and assumptions made by Management. In addition, we fo-cused on this area because of the significance of revenue and as revenue comprises a substantial number of transactions, including with different characteristics depending on which business segment the revenue relates to.
Reference is made to notes 2.2 and 3.4 in the Consolidated Financial Statements.
How our audit addressed the key audit matter:Our audit procedures included considering the appropriateness of the accounting policies for revenue recognition applied by Management and assessing compliance with applicable financial reporting standards.
We tested relevant internal controls, including IT controls, concerning the timing of revenue recognition and evaluated whether these were designed in line with the Group’s accounting policies and were operating effectively.
For revenue, contract assets and accrued cost of services, we examined reports concerning services in progress and challenged the assumptions made by Management in this regard.
Moreover, we selected a sample of revenue transactions during the year and traced these to underlying evidence to ensure accuracy and existence.
In addition, we applied data analysis in our testing of revenue transactions in order to identify and assess transactions outside the ordinary trans-action flow.
Deferred tax assets and income tax positions
The Group operates in many territories and is, consequently, subject to local laws and cross-border transfer pricing legislation, which complicates the Group’s tax matters.
86 DSV Panalpina Annual Report 2020 Statements

The Group also carries significant deferred tax assets on the balance sheet that consist primarily of tax on provisions made at the balance sheet date and tax loss carryforwards. The utilisation of tax assets are, inherently, uncertain as they are dependent on the financial development of business activities in certain countries and regions.
We focused on this area because the valuation of deferred tax assets and income tax positions is complex and dependent on Management esti-mates, including Management’s applied model, data and assumptions.
Reference is made to note 5.2 to the Consolidated Financial Statements.
How our audit addressed the key audit matter:Our audit procedures included considering the appropriateness of the Group’s accounting policies and valuation models within the tax accounting area and assessing compliance with applicable financial reporting standards.
We also assessed Management’s process for identifying and assessing complex income tax transactions as well as deferred tax assets that might not be recoverable.
We tested provisions made in the tax accounting. As part of this, we re-viewed correspondence with tax authorities and discussed methods and data applied as well as assumptions made by Management. In doing so, we used our internal corporate tax specialists.
Moreover, we tested Management’s assessment of the recoverability of the carrying value of deferred tax assets arising from temporary differ-ences and tax loss carryforwards on the basis of internal forecasts of fu-ture taxable income, and evaluated the assumptions made by Manage-ment in this connection.
Statement on Management’s CommentaryManagement is responsible for Management’s Commentary.
Our opinion on the Financial Statements does not cover Management’s Com-mentary, and we do not express any form of assurance conclusion thereon.
In connection with our audit of the Financial Statements, our responsi bility is to read Management’s Commentary and, in doing so, consider whether Management’s Commentary is materially inconsistent with the Financial Statements or our knowledge obtained in the audit, or otherwise appears to be materially misstated.
Moreover, we considered whether Management’s Commentary includes the disclosures required by the Danish Financial Statements Act.
Based on the work we have performed, in our view, Management’s Commentary is in accordance with the Consolidated Financial Statements and the Parent Company Financial Statements and has been prepared in accordance with the requirements of the Danish Financial Statements Act. We did not identify any material misstatement in Management’s Commentary.
Management’s responsibilities for the Financial StatementsManagement is responsible for the preparation of consolidated financial statements and parent company financial statements that give a true and fair view in accordance with International Financial Reporting Standards (‘IFRS’) as issued by the International Accounting Standards Board (‘IASB’) and in accordance with IFRS as endorsed by the EU and further require-ments in the Danish Financial Statements Act, and for such internal con-trol as Management determines is necessary to enable the preparation of financial statements that are free from material misstatement, whether due to fraud or error.
In preparing the Financial Statements, Management is responsible for assessing the Group’s and the Parent Company’s ability to continue as a going concern, disclosing, as applicable, matters related to going concern and using the going concern basis of accounting unless Management either intends to liquidate the Group or the Parent Company or to cease operations, or has no realistic alternative but to do so.
Auditor’s responsibilities for the audit of the Financial StatementsOur objectives are to obtain reasonable assurance about whether the Financial Statements as a whole are free from material misstatement,
whether due to fraud or error, and to issue an auditor’s report that in-cludes our opinion. Reasonable assurance is a high level of assurance, but is not a guarantee that an audit conducted in accordance with ISAs and the additional requirements applicable in Denmark will always detect a material misstatement when it exists. Misstatements can arise from fraud or error and are considered material if, individually or in the aggregate, they could reasonably be expected to influence the economic decisions of users taken on the basis of these Financial Statements.
As part of an audit in accordance with ISAs and the additional require-ments applicable in Denmark, we exercise professional judgement and maintain professional scepticism throughout the audit.
We also: • Identify and assess the risks of material misstatement of the Financial
Statements, whether due to fraud or error, design and perform audit procedures responsive to those risks, and obtain audit evidence that is sufficient and appropriate to provide a basis for our opinion. The risk of not detecting a material misstatement resulting from fraud is higher than for one resulting from error, as fraud may involve collusion, for-gery, intentional omissions, misrepresentations, or the override of internal control.
• Obtain an understanding of internal control relevant to the audit in order to design audit procedures that are appropriate in the circum-stances, but not for the purpose of expressing an opinion on the effec-tiveness of the Group’s and the Parent Company’s internal control.
• Evaluate the appropriateness of accounting policies used and the rea-sonableness of accounting estimates and related disclosures made by Management.
• Conclude on the appropriateness of Management’s use of the going concern basis of accounting and based on the audit evidence obtained whether a material uncertainty exists related to events or conditions that may cast significant doubt on the Group’s and the Parent Compa-ny’s ability to continue as a going concern. If we conclude that a mate-rial uncertainty exists, we are required to draw attention in our audi-tor’s report to the related disclosures in the Financial Statements or, if such disclosures are inadequate, to modify our opinion. Our conclu-
87 DSV Panalpina Annual Report 2020 Statements

Lars BaungaardState Authorised Public AccountantMne23331
Kim TromholtState Authorised Public AccountantMne33251
sions are based on the audit evidence obtained up to the date of our auditor’s report. However, future events or conditions may cause the Group or the Parent Company to cease to continue as a going concern.
• Evaluate the overall presentation, structure and content of the Finan-cial Statements, including the disclosures, and whether the Financial Statements represent the underlying transactions and events in a manner that achieves fair presentation.
• Obtain sufficient appropriate audit evidence regarding the financial in-formation of the entities or business activities within the Group to ex-press an opinion on the Consolidated Financial Statements. We are re-sponsible for the direction, supervision and performance of the group audit. We remain solely responsible for our audit opinion.
We communicate with those charged with governance regarding, among other matters, the planned scope and timing of the audit and significant audit findings, including any significant deficiencies in internal control that we identify during our audit.
We also provide those charged with governance with a statement that we have complied with relevant ethical requirements regarding independ-ence, and to communicate with them all relationships and other matters that may reasonably be thought to bear on our independence, and where applicable, related safeguards.
From the matters communicated with those charged with governance, we determine those matters that were of most significance in the audit of the Financial Statements of the current period and are therefore the key audit matters. We describe these matters in our auditor’s report unless law or regulation precludes public disclosure about the matter or when, in extremely rare circumstances, we determine that a matter should not be communicated in our report because the adverse consequences of doing so would reasonably be expected to outweigh the public interest benefits of such communication.
Report on compliance with the ESEF regulationAs part of our audit of the Financial Statements, we performed procedures to express an opinion on whether the annual report of DSV Panalpina A/S for the financial year 1 January to 31 December 2020 with the filename DSVP-2020-12-31 is prepared, in all material respects, in compliance with the Commission Delegated Regulation (EU) 2019/815 on the European Single Electronic Format (ESEF Regulation) which includes requirements related to the preparation of the annual report in XHTML format and iXBRL tagging of the Consolidated Financial Statements.
Management is responsible for preparing an annual report that complies with the ESEF Regulation. This responsibility includes:• The preparing of the annual report in XHTML format;• The selection and application of appropriate iXBRL tags, including ex-
tensions to the ESEF taxonomy and the anchoring thereof to elements in the taxonomy, for all financial information required to be tagged us-ing judgement where necessary;
• Ensuring consistency between iXBRL tagged data and the Consolidated Financial Statements presented in human-readable format; and
• For such internal control as Management determines necessary to en-able the preparation of an annual report that is compliant with the ESEF Regulation.
Our responsibility is to obtain reasonable assurance on whether the annual report is prepared, in all material respects, in compliance with the ESEF Regulation based on the evidence we have obtained, and to issue a report that includes our opinion. The nature, timing and extent of procedures se-lected depend on the auditor’s judgement, including the assessment of the risks of material departures from the requirements set out in the ESEF Regulation, whether due to fraud or error. The procedures include:• Testing whether the annual report is prepared in XHTML format;• Obtaining an understanding of the company’s iXBRL tagging process
and of internal control over the tagging process;• Evaluating the completeness of the iXBRL tagging of the Consolidated
Financial Statements;
• Evaluating the appropriateness of the company’s use of iXBRL elements selected from the ESEF taxonomy and the creation of extension elements where no suitable element in the ESEF taxonomy has been identified;
• Evaluating the use of anchoring of extension elements to elements in the ESEF taxonomy; and
• Reconciling the iXBRL tagged data with the audited Consolidated Financial Statements.
In our opinion, the annual report of DSV Panalpina A/S for the financial year 1 January to 31 December 2020 with the file name DSVP-2020-12-31 is prepared, in all material respects, in compliance with the ESEF Regulation.
Copenhagen, 10 February 2021
PricewaterhouseCoopersStatsautoriseret RevisionspartnerselskabCVR no 3377 1231
88 DSV Panalpina Annual Report 2020 Statements

Parent Company financialstatements 2020
Financial statements
Income statement . . . . . . . . . . . . . . . . . . . . . . . . . . . . . 90Statement of comprehensive income . . . . . . . . . . . . . . . . . . 90Cash flow statement . . . . . . . . . . . . . . . . . . . . . . . . . . . . 91Balance sheet . . . . . . . . . . . . . . . . . . . . . . . . . . . . . . . . 92Statement of changes in equity . . . . . . . . . . . . . . . . . . . . . 93
Notes
Basis of preparation1. Accounting policies . . . . . . . . . . . . . . . . . . . . . . . . . 942. Changes in accounting policies . . . . . . . . . . . . . . . . . . . 943. Management judgements . . . . . . . . . . . . . . . . . . . . . 944. New accounting regulations . . . . . . . . . . . . . . . . . . . . 94
Income statement
5. Revenue . . . . . . . . . . . . . . . . . . . . . . . . . . . . . . . 946. Fees to auditors appointed at the Annual General Meeting . . . 947. Staff costs . . . . . . . . . . . . . . . . . . . . . . . . . . . . . . 948. Special items . . . . . . . . . . . . . . . . . . . . . . . . . . . . . 949. Financial income . . . . . . . . . . . . . . . . . . . . . . . . . . . 9510. Financial expenses . . . . . . . . . . . . . . . . . . . . . . . . . . 9511. Tax for the year . . . . . . . . . . . . . . . . . . . . . . . . . . . 95
Table of contents
Balance sheet
12. Intangible assets . . . . . . . . . . . . . . . . . . . . . . . . . . . 9513. Property, plant and equipment . . . . . . . . . . . . . . . . . . . 9614. Receivables from Group entities and other receivables . . . . . 9615. Equity reserves . . . . . . . . . . . . . . . . . . . . . . . . . . . 9616. Financial liabilities . . . . . . . . . . . . . . . . . . . . . . . . . . 9717. Payables to Group entities and other payables . . . . . . . . . . 9718. Deferred tax . . . . . . . . . . . . . . . . . . . . . . . . . . . . . 97
Supplementary information
19. Share option schemes . . . . . . . . . . . . . . . . . . . . . . . . 9820. Investments in Group entities . . . . . . . . . . . . . . . . . . . 9821. Derivative financial instruments . . . . . . . . . . . . . . . . . . 9922. Financial risks . . . . . . . . . . . . . . . . . . . . . . . . . . . . . 9923. Contingent liabilities and security for debt . . . . . . . . . . . 10024. Related parties . . . . . . . . . . . . . . . . . . . . . . . . . . . 100
89 DSV Panalpina Annual Report 2020 Parent Company financial statements 2020

Income statement Statement of comprehensive income(DKKm) Note 2020 2019
Revenue 5 2,290 1,664
Gross profit 2,290 1,664
Other external expenses 6 964 704Staff costs 7 995 634
Operating profit before amortisation and depreciation (EBITDA) before special items 331 326
Amortisation and depreciation 395 404
Operating profit (EBIT) before special items (64) (78)
Special items, costs 8 235 113Financial income 9 2,167 2,032Financial expenses 10 865 442
Profit before tax 1,003 1,399
Tax on profit for the year 11 (97) 1
Profit for the year 1,100 1,398
Proposed distribution of profit:Proposed dividend per share is DKK 4.0 (2019: DKK 2.5 per share) 920 588Transferred to equity reserves 180 810
Total distribution 1,100 1,398
(DKKm) 2020 2019
Profit for the year 1,100 1,398
Items that may be reclassified to the income statement when certain conditions are met:Fair value adjustments relating to hedging instruments (1) 5Fair value adjustments relating to hedging instruments transferred to financial expenses 21 (2)Tax on items reclassified to the income statement (1) (1)
Other comprehensive income, net of tax 19 2
Total comprehensive income 1,119 1,400
90 DSV Panalpina Annual Report 2020 Parent Company financial statements 2020

Cash flow statement(DKKm) Note 2020 2019
Operating profit before amortisation and depreciation (EBITDA) before special items 331 326
Adjustments:Share-based payments 23 20Change in working capital etc. (10,083) 2,766Special items (14) (12)Dividend received 1,630 1,441Interest received 537 591Interest paid, other (228) (350)Income tax paid (34) (29)
Cash flow from operating activities (7,838) 4,753
Purchase of intangible assets 12 (172) (251)Purchase of property, plant and equipment 13 (65) (112)Acquisition and disposal of subsidiaries and activities 14,511 -Change in other financial assets (1,729) (982)
Cash flow from investing activities 12,545 (1,345)
Free cash flow 4,707 3,408
(DKKm) Note 2020 2019
Proceeds from borrowings 6,756 7,870Repayment of borrowings (6,666) (2,876)Repayment of lease liabilities (18) (37)
Transactions with shareholders:Dividends distributed (588) (423)Dividends on treasury shares 23 22Purchase of treasury shares (5,031) (4,888)Sale of treasury shares 2,357 1,511Other transactions with shareholders - (12)
Cash flow from financing activities (3,167) 1,167
Cash flow for the year 1,540 4,575
Cash and cash equivalents 1 January 4,622 46Cash flow for the year 1,540 4,575Currency translation (2) 1
Cash and cash equivalents at 31 December 6,160 4,622
The cash flow statement cannot be directly derived from the balance sheet and income statement.
91 DSV Panalpina Annual Report 2020 Parent Company financial statements 2020

Assets (DKKm) Note 2020 2019
Intangible assets 12 616 968Right-of-use (ROU) assets 1 19Property, plant and equipment 13 146 156Investments in Group entities 20 26,914 41,425Receivables from Group entities and other receivables 17,284 15,555
Total non-current assets 44,961 58,123
Receivables from Group entities and other receivables 14 20,501 14,868Cash and cash equivalents 6,160 4,622
Total current assets 26,661 19,490
Total assets 71,622 77,613
Equity and liabilities (DKKm) Note 2020 2019
Share capital 230 235Reserves and retained earnings 15 38,345 40,420
Total equity 38,575 40,655
Lease liabilities 16 - 1Borrowings 16 6,674 4,897Deferred tax liabilities 18 29 128
Total non-current liabilities 6,703 5,026
Lease liabilities 16 1 18Borrowings 16 4,135 5,802Tax payables 75 34Payables to Group entities and other payables 17 22,133 26,078
Total current liabilities 26,344 31,932
Total liabilities 33,047 36,958
Total equity and liabilities 71,622 77,613
Balance sheet
92 DSV Panalpina Annual Report 2020 Parent Company financial statements 2020

Statement of changes in equity2020 2019
(DKKm) Share capital Reserves* Retained earnings Total equity Share capital Reserves* Retained earnings Total equity
Equity at 1 January as previously reported 235 552 39,868 40,655 188 536 6,994 7,718Impact of accounting policy change ** - - - - - - (2) (2)
Equity at 1 January 235 552 39,868 40,655 188 536 6,992 7,716
Profit for the year - (148) 1,248 1,100 - 9 1,389 1,398Other comprehensive income, net of tax - 19 - 19 - 2 - 2
Total comprehensive income for the year - (129) 1,248 1,119 - 11 1,389 1,400
Transactions with shareholders:Share-based payments - - 23 23 - - 20 20Dividends distributed - - (588) (588) - - (423) (423)Purchase of treasury shares - (6) (5,025) (5,031) - (7) (4,881) (4,888)Sale of treasury shares - 3 2,354 2,357 - 3 1,508 1,511Capital increase - - - - 56 - 35,202 35,258Capital reduction (5) 5 - - (9) 9 - -Dividends on treasury shares - - 23 23 - - 22 22Other adjustments - - 17 17 - - 39 39
Total transactions with owners (5) 2 (3,196) (3,199) 47 5 31,487 31,539
Equity at 31 December 230 425 37,920 38,575 235 552 39,868 40,655
* For a specification of reserves, please refer to note 15.** Cumulative effect of applying IFRS 16 Leases in 2019.
93 DSV Panalpina Annual Report 2020 Parent Company financial statements 2020

1. Accounting policies
As the Parent Company of the DSV Panalpina Group, the financial state-ments of DSV Panalpina A/S are separate financial statements disclosed as required by the Danish Financial Statements Act. The separate financial statements have been prepared in accordance with International Financial Reporting Standards (IFRS) as issued by the International Accounting Standards Board (IASB) and in accordance with IFRS as endorsed by the EU and further requirements of the Danish Financial Statements Act. The accounting policies of the Parent Company are identical with the accounting policies for the consolidated financial statements, except for the following:
Dividends from investments in subsidiariesDividends from investments in subsidiaries are recognised as income in the Parent Company’s income statement under financial income in the fi-nancial year in which the dividends are declared.
Investments in subsidiaries in the Parent Company’s financial statementsInvestments in subsidiaries are measured at cost. If there is any indication of impairment, investments are tested for impairment as described in the accounting policies applied by the Group. If the cost exceeds the recover-able amount, the investment is written down to this lower value.
Currency translationForeign currency adjustments of balances considered part of the total net investment in enterprises which have a functional currency other than Danish kroner (DKK) are recognised in the income statement of the Parent Company under financials. 2. Changes in accounting policies
All amendments to the International Financial Reporting Standards (IFRS) ef-fective for the financial year 2020 have been implemented as basis for pre-paring the Parent Company financial statements and notes to the statements.
None of the implementations has had any material impact on the state-ments or notes presented.
3. Management judgements
For the preparation of the Annual Report of DSV Panalpina A/S, Manage-ment makes various accounting judgements that affect the reported amounts and disclosures in the statements and in the notes to the finan-cial statements. These judgements are based on professional judgement, historical data and other factors available to Management. By their na-ture, judgements include a degree of uncertainty and actual results may therefore deviate from the judgements made at the reporting date. Judgements are continuously evaluated, and the effect of any changes is recognised in the relevant period. Accounting judgements considered significant in the preparation and understanding of the financial state-ments of the Parent Company includes the following:
Investments in subsidiariesManagement assesses annually whether there is an indication of impair-ment of investments in subsidiaries. If so, the investments will be tested for impairment in the same way as Group goodwill, involving various esti-mates on future cashflows, growth, discount rates, etc. At 31 December 2020 and 2019, no impairment indicators were identified.
4. New accounting regulations
The IASB has issued a number of new standards and amendments not yet in effect or endorsed by the EU and therefore not relevant for the prepa-ration of the 2020 Parent Company financial statements. These standards and amendments are expected to be implemented when they take effect.
None of the new standards or amendments issued are currently expected to have any significant impact on the Parent Company financial state-ments when implemented.
5. Revenue
7. Staff costs
For information on remuneration of the Executive Board and the Board of Directors, please see notes 5.3 and 5.4 to the consolidated financial statements.
(DKKm) 2020 2019
Intra-group charges 2,290 1,664
Total revenue 2,290 1,664
(DKKm) 2020 2019
Statutory audit 5 10Assurance engagements other than audits - 6Tax and VAT advisory services 1 -Other services 4 -
Total fees 10 16
(DKKm) 2020 2019
Remuneration of the Board of Directors 6 6Salaries etc. 202 220Intra-group salary charges etc. 758 380Defined contribution pension plans 29 28
Total staff costs 995 634
Average number of full-time employees 437 431
8. Special items
(DKKm) 2020 2019
Impairment and other costs relating to reorganisations 235 9Transaction cost relating to acquisition of Panalpina - 104
Total special items, costs 235 113
6. Fees to auditors appointed at the Annual General Meeting
94 DSV Panalpina Annual Report 2020 Parent Company financial statements 2020

11. Tax for the year
Tax for the year is disaggregated as follows:
12. Intangible assets
Tax on profit for the year specifies as follows: Tax rate specifies as follows:
Interest income includes interest on financial assets measured at amor-tised cost of DKK 156 million (2019: DKK 73 million). 10. Financial expenses
Interest expenses include interest on financial liabilities measured at amortised cost of DKK 209 million (2019: DKK 214 million).
(DKKm) 2020 2019
Interest income 156 73Interest income from Group entities 381 518Currency translation - -Dividends from subsidiaries 1,630 1,441
Total financial income 2,167 2,032
(DKKm) 2020 2019
Interest expenses 209 214Interest expenses for Group entities 19 82Currency translation 637 146
Total financial expenses 865 442
(DKKm) 2020 2019
Tax on profit for the year (97) 1Tax on other comprehensive income 1 1
Total tax for the year (96) 2
(DKKm) 2020 2019
Current tax (12) (3)Deferred tax 109 3Tax adjustment relating to previous years - (1)
Total tax on profit for the year 97 (1)
(DKKm) 2020 2019
Calculated tax on profit for the year before tax 22.0% 22.0%
Tax effect of:Non-deductible expenses/non-taxable income (31.7%) (22.1%)Tax adjustment relating to previous years 0.0% 0.1%
Total tax on profit for the year (9.7%) 0.0%
2020 2019
(DKKm) SoftwareSoftware in
progress Total SoftwareSoftware in
progress Total
Cost at 1 January 2,048 209 2,257 2,022 385 2,407Additions for the year - 172 172 7 244 251Disposals (1,259) - (1,259) (362) (39) (401)Reclassifications 215 (215) - 381 (381) -
Total cost at 31 December 1,004 166 1,170 2,048 209 2,257
Total amortisation and im pairment at 1 January 1,289 - 1,289 1,256 39 1,295Amortisation and impairment for the year 232 - 232 395 - 395Disposals (967) - (967) (362) (39) (401)
Total amortisation and im pairment at 31 December 554 - 554 1,289 - 1,289
Carrying amount at 31 December 450 166 616 759 209 968
9. Financial income
95 DSV Panalpina Annual Report 2020 Parent Company financial statements 2020

13. Property, plant and equipment 15. Equity reserves
Equity reserves are specified below.
For a description of equity reserves, please see note 4.1 to the consolidated financial statements.
14. Receivables from Group entities and other receivables
(DKKm) 2020 2019
Cost at 1 January 358 279Additions for the year 65 112Disposals (73) (33)
Total cost at 31 December 350 358
Total amortisation and impairment at 1 January 202 166Amortisation and impairment for the year 75 69Disposals (73) (33)
Total amortisation and impairment at 31 December 204 202
Carrying amount at 31 December 146 156
(DKKm) 2020 2019
Receivables from Group entities 20,177 14,632Fair value of derivative financial instruments - 31Other receivables etc. 324 205
Receivables from Group entities and other receivables at 31 December 20,501 14,868
2020
(DKKm)Treasury share
reserve Hedging reserveDevelopment cost reserve Total reserves
Reserves at 1 January (5) (30) 587 552
Profit for the year - - (148) (148)Other comprehensive income, net of tax - 19 - 19
Total comprehensive income for the year (5) (11) 439 423
Transactions with shareholders:Purchase of treasury shares (6) - - (6)Sale of treasury shares 2 1 - 3Capital reduction 5 - - 5
Reserves at 31 December (4) (10) 439 425
2019
(DKKm)Treasury share
reserve Hedging reserveDevelopment cost reserve Total reserves
Reserves at 1 January (10) (32) 578 536
Profit for the year - - 9 9Other comprehensive income, net of tax - 2 - 2
Total comprehensive income for the year (10) (30) 587 547
Transactions with shareholders:Purchase of treasury shares (7) - - (7)Sale of treasury shares 3 - - 3Capital reduction 9 - - 9
Reserves at 31 December (5) (30) 587 552
96 DSV Panalpina Annual Report 2020 Parent Company financial statements 2020
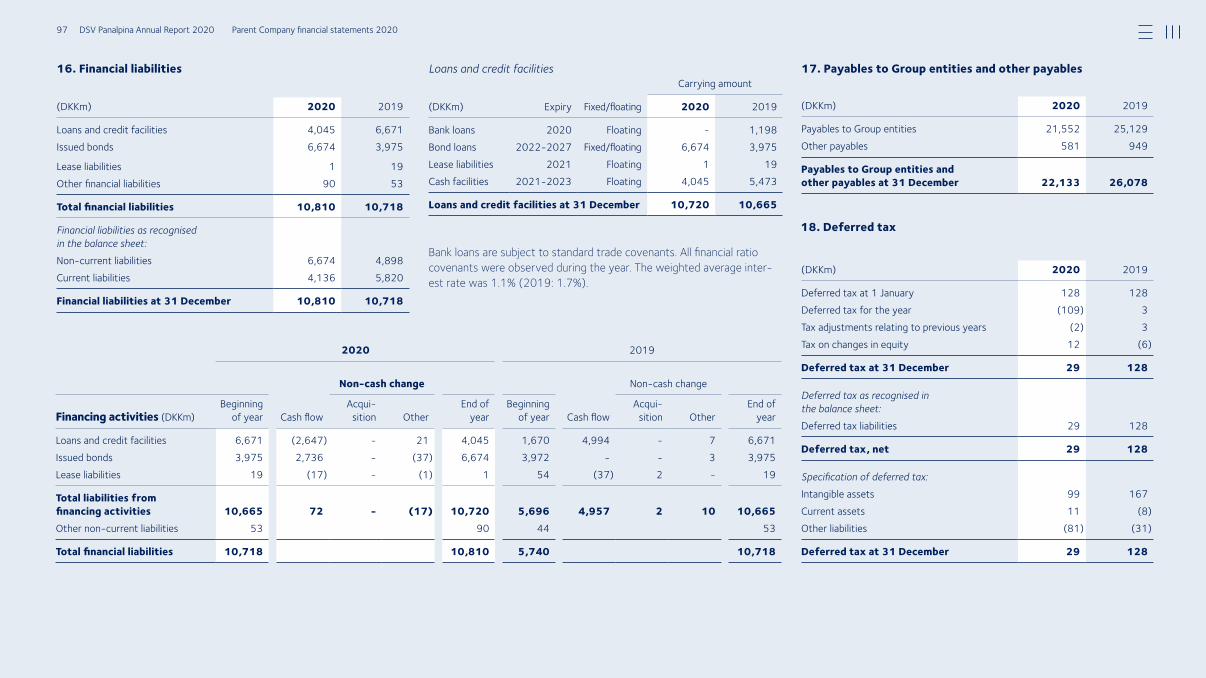
16. Financial liabilities 17. Payables to Group entities and other payables
18. Deferred tax
Loans and credit facilities
Bank loans are subject to standard trade covenants. All financial ratio covenants were observed during the year. The weighted average inter-est rate was 1.1% (2019: 1.7%).
(DKKm) 2020 2019
Loans and credit facilities 4,045 6,671Issued bonds 6,674 3,975
Lease liabilities 1 19Other financial liabilities 90 53
Total financial liabilities 10,810 10,718
Financial liabilities as recognised in the balance sheet:Non-current liabilities 6,674 4,898Current liabilities 4,136 5,820
Financial liabilities at 31 December 10,810 10,718
Carrying amount
(DKKm) Expiry Fixed/floating 2020 2019
Bank loans 2020 Floating - 1,198Bond loans 2022-2027 Fixed/floating 6,674 3,975Lease liabilities 2021 Floating 1 19Cash facilities 2021-2023 Floating 4,045 5,473
Loans and credit facilities at 31 December 10,720 10,665
2020 2019
Non-cash change Non-cash change
Financing activities (DKKm)Beginning
of year Cash flowAcqui-
sition OtherEnd of
yearBeginning
of year Cash flowAcqui-
sition OtherEnd of
year
Loans and credit facilities 6,671 (2,647) - 21 4,045 1,670 4,994 - 7 6,671Issued bonds 3,975 2,736 - (37) 6,674 3,972 - - 3 3,975Lease liabilities 19 (17) - (1) 1 54 (37) 2 - 19
Total liabilities from financing activities 10,665 72 - (17) 10,720 5,696 4,957 2 10 10,665Other non-current liabilities 53 90 44 53
Total financial liabilities 10,718 10,810 5,740 10,718
(DKKm) 2020 2019
Payables to Group entities 21,552 25,129Other payables 581 949
Payables to Group entities and other payables at 31 December 22,133 26,078
(DKKm) 2020 2019
Deferred tax at 1 January 128 128Deferred tax for the year (109) 3Tax adjustments relating to previous years (2) 3Tax on changes in equity 12 (6)
Deferred tax at 31 December 29 128
Deferred tax as recognised in the balance sheet:Deferred tax liabilities 29 128
Deferred tax, net 29 128
Specification of deferred tax:Intangible assets 99 167Current assets 11 (8)Other liabilities (81) (31)
Deferred tax at 31 December 29 128
97 DSV Panalpina Annual Report 2020 Parent Company financial statements 2020

19. Share option schemes
DSV Panalpina A/S has issued share options to senior staff and members of the Executive Board of the Company. Please see note 5.3 to the con-solidated financial statements for a list of current incentive share option schemes and a description of the assumptions used for the valuation of the share options granted in 2020.
Total costs recognised in 2020 for services received, but not recognised as an asset amounted to DKK 23 million (2019: DKK 20 million).
The average share price for options exercised in the financial year was DKK 780.2 per share at the date of exercise.
20. Investments in Group entities
DSV Panalpina A/S owns the following subsidiaries, all of which are included in the consolidated financial statements:
Owner ship 2020
Owner ship 2019
Registered office
Share capital (DKKm)
DSV Road Holding A/S 100% 100%
Hedehusene, Denmark 100
DSV Air & Sea Holding A/S 100% 100%
Hedehusene, Denmark 50
DSV Solutions Holding A/S 100% 100%
Hedehusene, Denmark 100
DSV Insurance A/S 100% 100%Hedehusene,
Denmark 25DSV Group Services A/S 100% 100%
Hedehusene, Denmark 5
DSV FS A/S 100% 100%Hedehusene,
Denmark 0.5Panalpina Welttransport AG 100% 100%
Basel, Switzerland 16
UTi (NA) holdings NV - 100%
Willemstad, Curacao 0
Share option schemes at 31 December 2020Scheme Exercise period
ExecutiveBoard
Seniorstaff Total
Average exercise price
per option
2016* 01.04.2019 - 31.03.2021 - 12,000 12,000 274.32017* 01.04.2020 - 31.03.2022 190,000 62,129 252,129 357.02018 28.03.2021 - 28.03.2023 190,000 263,500 453,500 477.52019 29.03.2022 - 27.03.2024 190,000 276,500 466,500 545.02020 31.03.2023 - 31.03.2025 190,000 312,000 502,000 560.0
Outstanding 760,000 926,129 1,686,129 501.3
Exercise period open at 31 December 2020 190,000 74,129 264,129 353.2Life (years) 2.7 3.1 3.0 n/aMarket value (DKKm) 394.9 451.0 845.9 n/a
*Share options granted in 2016 and 2017 are currently exercisable.
Outstanding share optionsExecutive
BoardSenior
staff Total
Average exercise price
per option
Outstanding at 1 January 2019 740,000 773,000 1,513,000 352.1Granted 190,000 287,500 477,500 545.0Exercised (170,000) (209,500) (379,500) 241.4Options waived/expired - (23,000) (23,000) 458.8
Outstanding at 31 December 2019 760,000 828,000 1,588,000 435.0
Outstanding at 1 January 2020 760,000 828,000 1,588,000 435.0Granted 190,000 312,000 502,000 560.0
Exercised (190,000) (207,871) (397,871) 310.6Options waived/expired - (6,000) (6,000) 513.7
Outstanding at 31 December 2020 760,000 926,129 1,686,129 501.3
98 DSV Panalpina Annual Report 2020 Parent Company financial statements 2020

21. Derivative financial instruments
The weighted average effective interest rate for existing interest rate instruments was 0.8% at the reporting date (2019: 0.9%).
A gain on hedging instruments of DKK 57 million was recognised in the income statement for the 2020 financial year (2019: loss of DKK 61 million).
In the same period, a loss of DKK 694 million was recognised relating to assets and liabilities (2019: loss of DKK 85 million).
For more information on foreign currency and interest rate risk hedging, please see notes 4.4 and 4.5 to the consolidated financial statements.
22. Financial risks
Financial risks of the Parent Company are handled within the risk man-agement processes and framework of the Group. Please see note 4.4 to the consolidated financial statements.
The liabilities of DSV Panalpina A/S fall due as listed in the adjacent table.
The analysis of expected maturity is based on contractual cash flows, in-cluding estimated interest payments. No amounts have been discounted, for which reason they cannot necessarily be reconciled to the related items of the balance sheet.
2020
External hedging instruments(DKKm) Contractual value Maturity Fair value
Of which recog-nised in income
statement
Of which recognised
in OCI
Currency instruments 6,353 2021 26 - (2)Interest rate instruments 744 2021-2022 (17) - (17)
Total 7,097 9 - (19)
2019
(DKKm) Contractual value Maturity Fair value
Of which recog-nised in income
statement
Of whichrecognised
in OCI
Currency instruments 3,699 2020 25 19 6Interest rate instruments 1,219 2020-2023 (44) - (44)
Total 4,918 (19) 19 (38)
2020 2019
Financial risks(DKKm) 0-1 year 1-5 years > 5 years
Total cash flows, incl.
interest 0-1 year 1-5 years > 5 years
Total cash flows, incl.
interest
Loans, credit facilities and issued bonds 5,922 3,123 3,736 12,781 5,916 5,005 - 10,921Lease liabilities 1 - - 1 18 1 - 19Other payables 581 - - 581 949 - - 949Payables to Group entities 21,552 - - 21,552 25,129 - - 25,129Currency derivatives (26) - - (26) (25) - - (25)Interest rate derivatives 3 17 - 20 4 43 - 47
Total 28,033 3,140 3,736 34,909 31,991 5,049 - 37,040
99 DSV Panalpina Annual Report 2020 Parent Company financial statements 2020

22. Financial risks – continued
Financial instruments by category
The fair value of financial assets and liabilities does not differ significantly from the carrying amount.
The valuation of financial instruments measured at fair value is based on other observable input than prices quoted in active markets (level 2). Interest rate swaps and foreign exchange forward contracts are valued using generally accepted valuation techniques based on relevant ob-servable data.
Carrying amount(DKKm) 2020 2019
Financial assets:Currency derivatives 49 31
Receivables 20,501 14,868Other receivables 17,284 15,555Cash and cash equivalents 6,160 4,622
Total cash and receivables 43,945 35,045
Financial liabilities:Interest rate derivatives 19 47Currency derivatives 23 6
Issued bonds measured at amortised cost 6,674 3,975Loans and credit facilities 4,045 6,671Lease liabilities 1 19Payables to Group entities etc. 22,133 26,078
Financial liabilities measured at amortised cost 32,853 36,743
23. Contingent liabilities and security for debt
Contingent liabilitiesDSV Panalpina A/S and the other Danish Group entities are registered jointly for VAT purposes and are jointly and severally liable for the VATliabilities.
DSV Panalpina A/S is assessed jointly for Danish tax purposes with the other domestic Group entities. DSV Panalpina A/S is the administration company of the joint taxation arrangement and is under an unlimited and joint liability regime for all Danish tax payments and withholding taxes on dividends, interest and royalties from the jointly taxed entities. Income tax and withholding tax payables under the joint taxation arrangement amounted to DKK 74 million (2019: DKK 34 million), which is included in the financial statements of DSV Panalpina A/S.
Parent Company guarantees DSV Panalpina A/S has provided guarantees for subsidiaries’ outstanding balances with banks and liabilities to leasing companies, suppliers and public authorities, etc. in the amount of DKK 4,408 million (2019: DKK 5,938 million).
Moreover, DSV Panalpina A/S has issued several declarations of intent relating to outstanding balances between subsidiaries and third parties.
24. Related parties
DSV Panalpina A/S has no related parties with control of the Group and no related parties with significant influence other than key management personnel – mainly in the form of the Board of Directors and Executive Board.
Related-party transactions
Board of Directors and Executive BoardNo transactions with related parties were made in the 2020 financial year other than ordinary remuneration, as described in notes 5.3 and 5.4 to the consolidated financial statements.
Intra-group transactionsNo intra-group transactions were made in 2020 other than as stated in the income statement and notes.
100 DSV Panalpina Annual Report 2020 Parent Company financial statements 2020


![STRATEGISK ANALYSE OG VÆRDIANSÆTTELSE AF DSV PANALPINA A/S · DSV PANALPINA A/S [DOKUMENTETS UNDERTITEL] Afhandling HD (R) Forfattere: Vibeke Kristensen, studienummer: 20185781](https://img.dokumen.tips/doc/110x75/5f0ffbad7e708231d446dbd8/strategisk-analyse-og-vrdiansttelse-af-dsv-panalpina-as-dsv-panalpina-as-dokumentets.jpg)