Embed Size (px)
Citation preview
10/12/2013
1
Atle BjørnerudThe Intervention Centre, OUH
Dept. of Physics. Univ. of Oslo
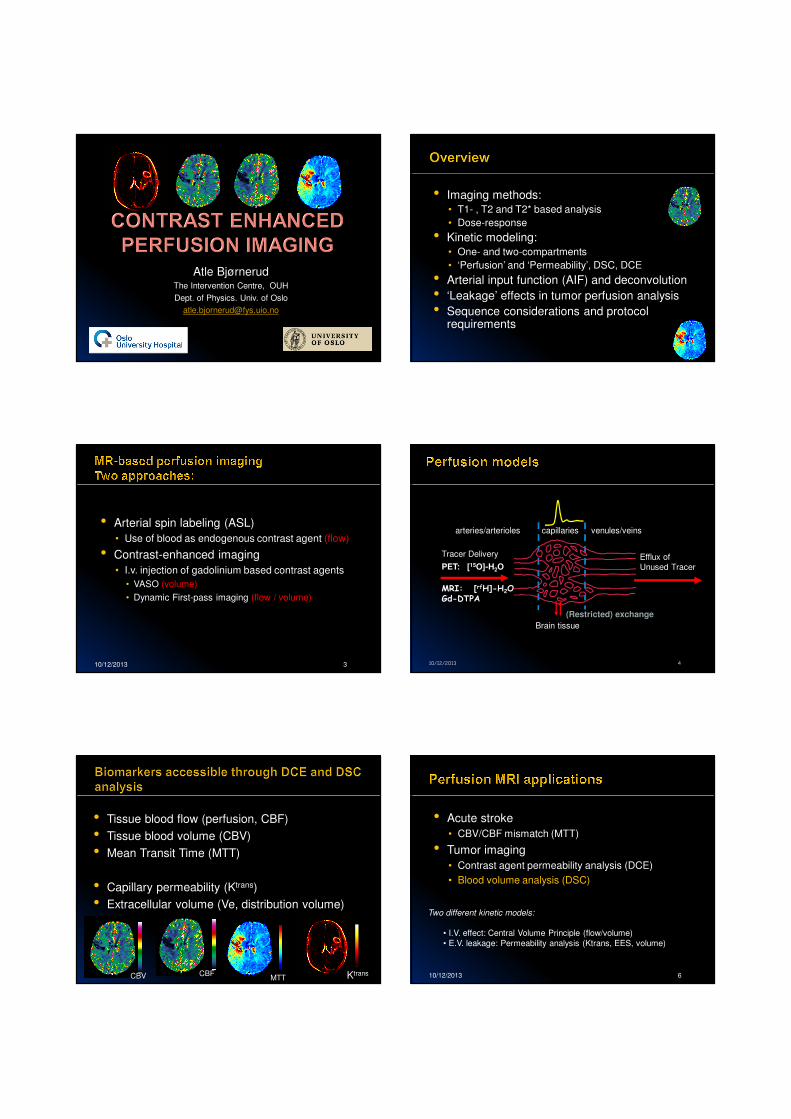
• Imaging methods:• T1- , T2 and T2* based analysis
• Dose-response
• Kinetic modeling:• One- and two-compartments
• ‘Perfusion’ and ‘Permeability’, DSC, DCE
• Arterial input function (AIF) and deconvolution
• ‘Leakage’ effects in tumor perfusion analysis
• Sequence considerations and protocol requirements
• Arterial spin labeling (ASL)
• Use of blood as endogenous contrast agent (flow)
• Contrast-enhanced imaging
• I.v. injection of gadolinium based contrast agents
• VASO (volume)
• Dynamic First-pass imaging (flow / volume)
10/12/2013 3 10/12/2013 4
arteries/arterioles capillaries venules/veins
Tracer Delivery
PET: [15O]-H2O
MRI: [rfH]-H2OGd-DTPA
Efflux ofUnused Tracer
(Restricted) exchange
Brain tissue
• Tissue blood flow (perfusion, CBF)
• Tissue blood volume (CBV)
• Mean Transit Time (MTT)
• Capillary permeability (Ktrans)
• Extracellular volume (Ve, distribution volume)
CBV CBFMTT Ktrans
• Acute stroke
• CBV/CBF mismatch (MTT)
• Tumor imaging
• Contrast agent permeability analysis (DCE)
• Blood volume analysis (DSC)
10/12/2013 6
Two different kinetic models:
• I.V. effect: Central Volume Principle (flow/volume)
• E.V. leakage: Permeability analysis (Ktrans, EES, volume)
10/12/2013
2
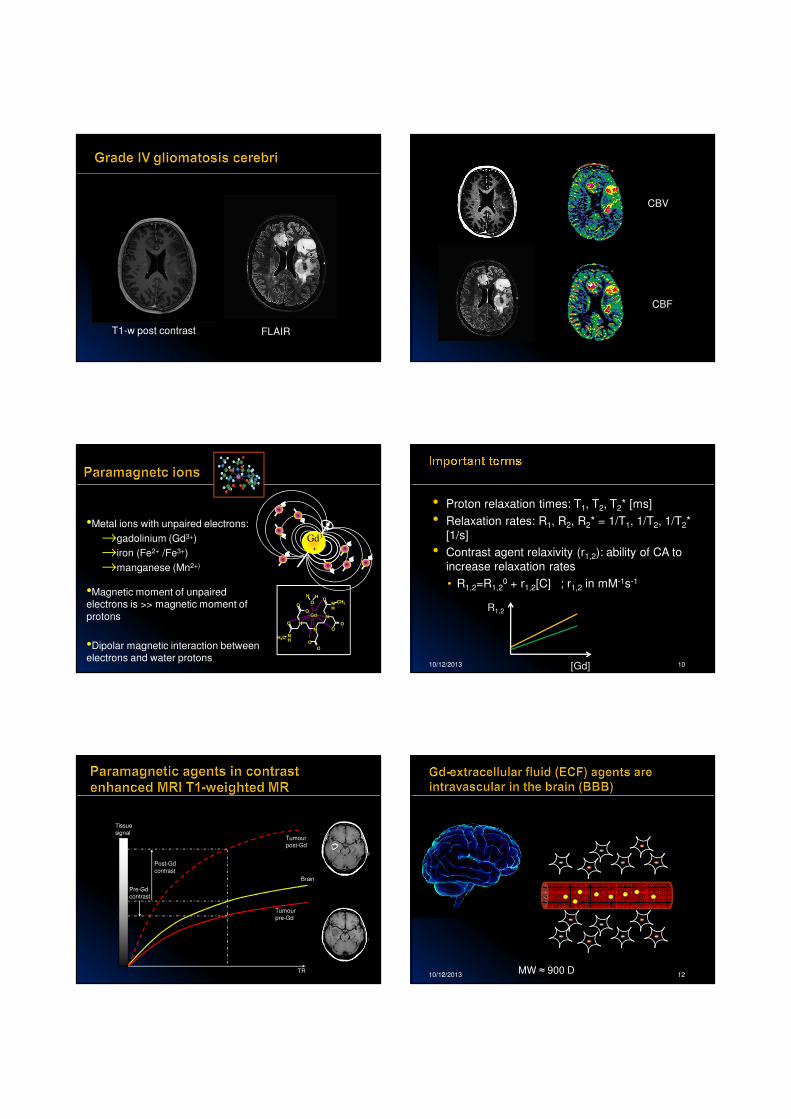
T1-w post contrast FLAIR
CBV
CBF
•Metal ions with unpaired electrons:
→gadolinium (Gd3+)
→iron (Fe2+ /Fe3+)
→manganese (Mn2+)
•Magnetic moment of unpaired electrons is >> magnetic moment of
protons
•Dipolar magnetic interaction between electrons and water protons
Gd3
+
CH3NH
N
OHH
O
O
O
O N
N
O
NH
H3C
O
OO
Gd
10/12/2013 10
• Proton relaxation times: T1, T2, T2* [ms]
• Relaxation rates: R1, R2, R2* = 1/T1, 1/T2, 1/T2*
[1/s]
• Contrast agent relaxivity (r1,2): ability of CA to
increase relaxation rates
• R1,2=R1,20 + r1,2[C] ; r1,2 in mM-1s-1
[Gd]
R1,2
Tissue
signal
Brain
Tumour
pre-Gd
Tumour
post-Gd
TR
Post-Gd
contrast
Pre-Gd
contrast
10/12/2013 12MW ≈ 900 D
10/12/2013
3
K2
K1
13
Gd3+
CH3N
H
N
OHH
O
O
O
O N
N
O
N
HH3C
O
O
O
Gd
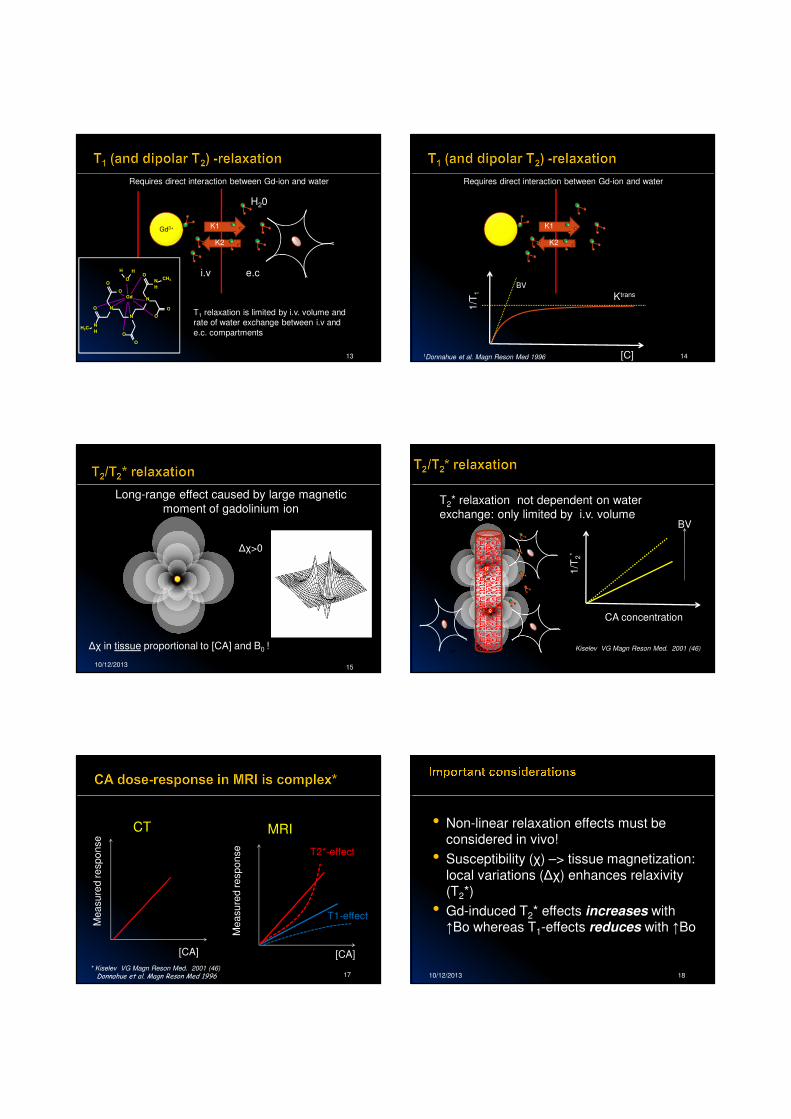
Requires direct interaction between Gd-ion and water
T1 relaxation is limited by i.v. volume and rate of water exchange between i.v and
e.c. compartments
i.v e.c
H20
K2
K1
14
Requires direct interaction between Gd-ion and water
[C]
1/T
1
BV
Ktrans
1Donnahue et al. Magn Reson Med 1996
10/12/2013 15
By
Long-range effect caused by large magnetic
moment of gadolinium ion
∆χ>0
∆χ in tissue proportional to [CA] and B0 !
By
By
CA concentration
1/T
2*
BV
Kiselev VG Magn Reson Med. 2001 (46)
T2* relaxation not dependent on water
exchange: only limited by i.v. volume
17
[CA]
Mea
su
red
resp
on
se
[CA]
Me
asu
red
resp
on
se
CT MRI
T1-effect
T2*-effect
* Kiselev VG Magn Reson Med. 2001 (46)Donnahue et al. Magn Reson Med 1996 10/12/2013 18
• Non-linear relaxation effects must be considered in vivo!
• Susceptibility (χ) –> tissue magnetization:
local variations (∆χ) enhances relaxivity (T2*)
• Gd-induced T2* effects increases with ↑Bo whereas T1-effects reduces with ↑Bo
10/12/2013
4
19
CBV
CBF
MTT
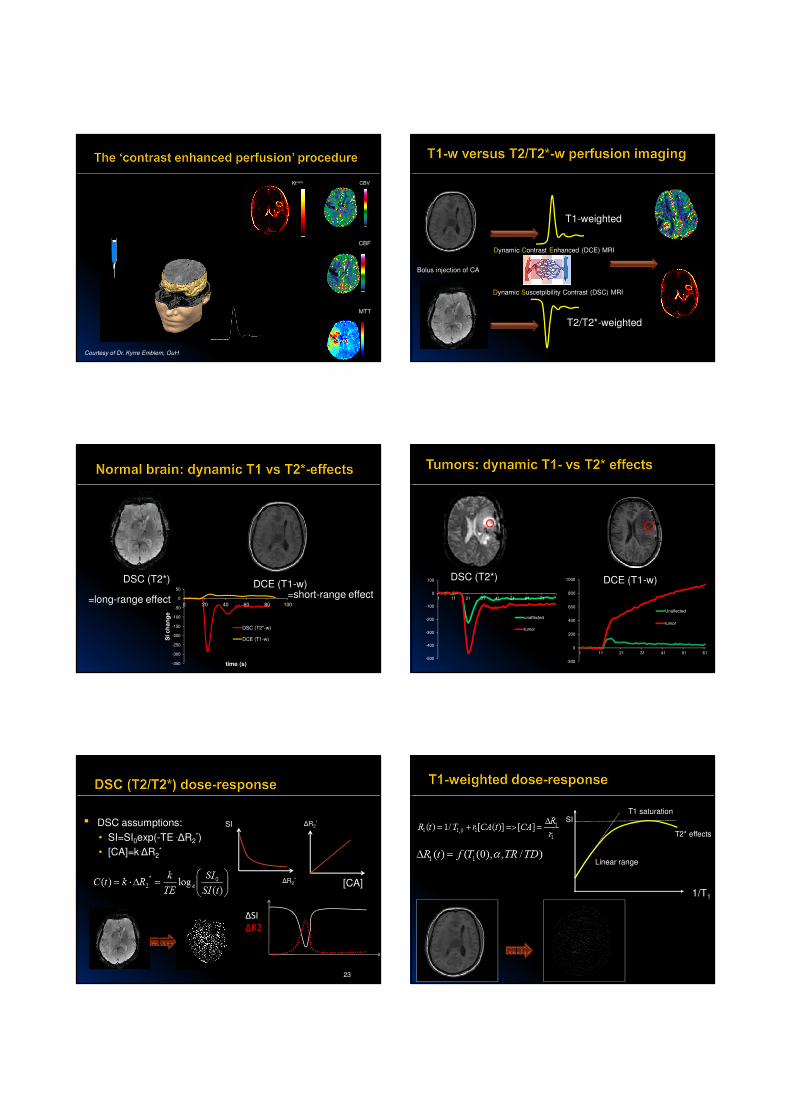
Courtesy of Dr. Kyrre Emblem, OuH
Ktrans
Bolus injection of CA
Dynamic Suscetpibility Contrast (DSC) MRI
Dynamic Contrast Enhanced (DCE) MRI
T1-weighted
T2/T2*-weighted
DSC (T2*)DCE (T1-w)
-350
-300
-250
-200
-150
-100
-50
0
50
0 20 40 60 80 100
SI c
ha
ng
e
time (s)
DSC (T2*-w)
DCE (T1-w)
=long-range effect=short-range effect
DSC (T2*) DCE (T1-w)
-200
0
200
400
600
800
1000
1 11 21 31 41 51 61
Unaffected
tumor
-500
-400
-300
-200
-100
0
100
1 11 21 31 41 51 61 71
unaffected
tumor
• DSC assumptions:
• SI=SI0exp(-TE .∆R2*)
• [CA]=k.∆R2*
23
[CA]
∆R2*
∆R2*
SI
∆SI
∆R2
1/T1
SI
Linear range
T1 saturation
T2* effects
10/12/2013
5
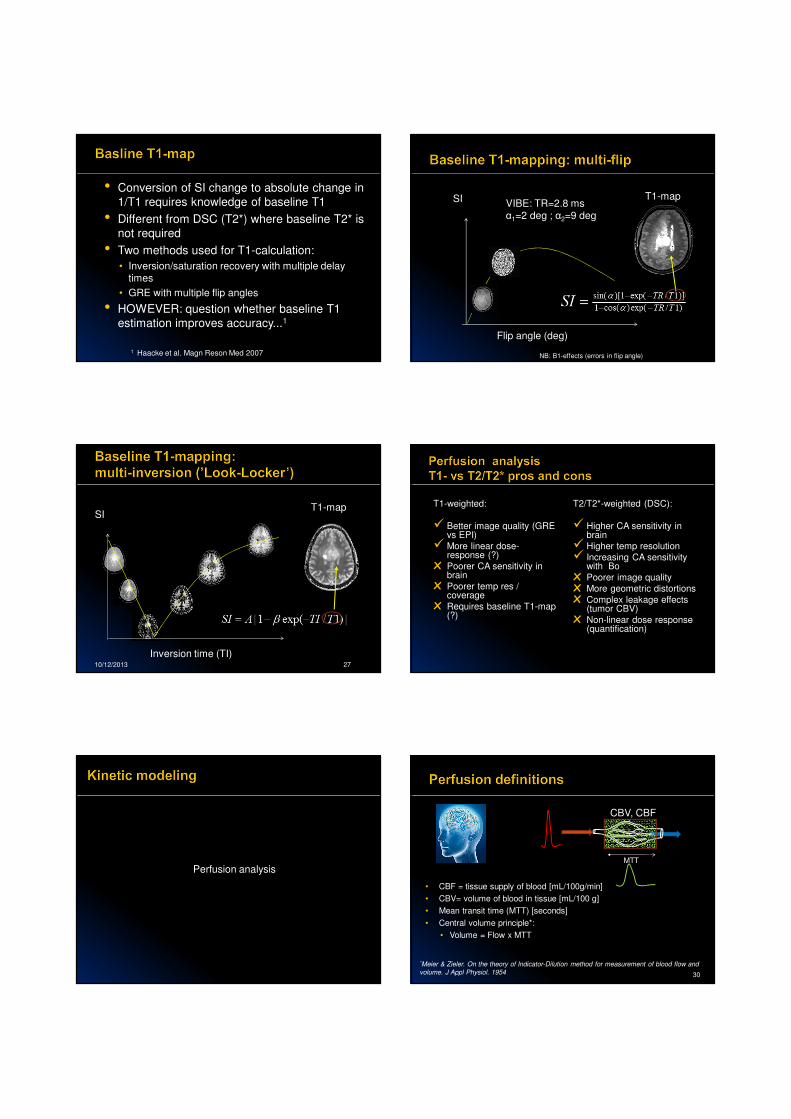
• Conversion of SI change to absolute change in
1/T1 requires knowledge of baseline T1
• Different from DSC (T2*) where baseline T2* is
not required
• Two methods used for T1-calculation:
• Inversion/saturation recovery with multiple delay times
• GRE with multiple flip angles
• HOWEVER: question whether baseline T1
estimation improves accuracy...1
1 Haacke et al. Magn Reson Med 2007
Flip angle (deg)
SI VIBE: TR=2.8 msα1=2 deg ; α2=9 deg
T1-map
NB: B1-effects (errors in flip angle)
10/12/2013 27
Inversion time (TI)
SIT1-map T1-weighted:
� Better image quality (GRE vs EPI)
� More linear dose-response (?)
х Poorer CA sensitivity in brain
х Poorer temp res / coverage
х Requires baseline T1-map (?)
T2/T2*-weighted (DSC):
� Higher CA sensitivity in brain
� Higher temp resolution
� Increasing CA sensitivity with Bo
х Poorer image quality
х More geometric distortions
х Complex leakage effects (tumor CBV)
х Non-linear dose response (quantification)
Perfusion analysis
30
*Meier & Zieler. On the theory of Indicator-Dilution method for measurement of blood flow and
volume. J Appl Physiol. 1954
CBV, CBF
MTT
• CBF = tissue supply of blood [mL/100g/min]
• CBV= volume of blood in tissue [mL/100 g]
• Mean transit time (MTT) [seconds]
• Central volume principle*:
• Volume = Flow x MTT
10/12/2013
6
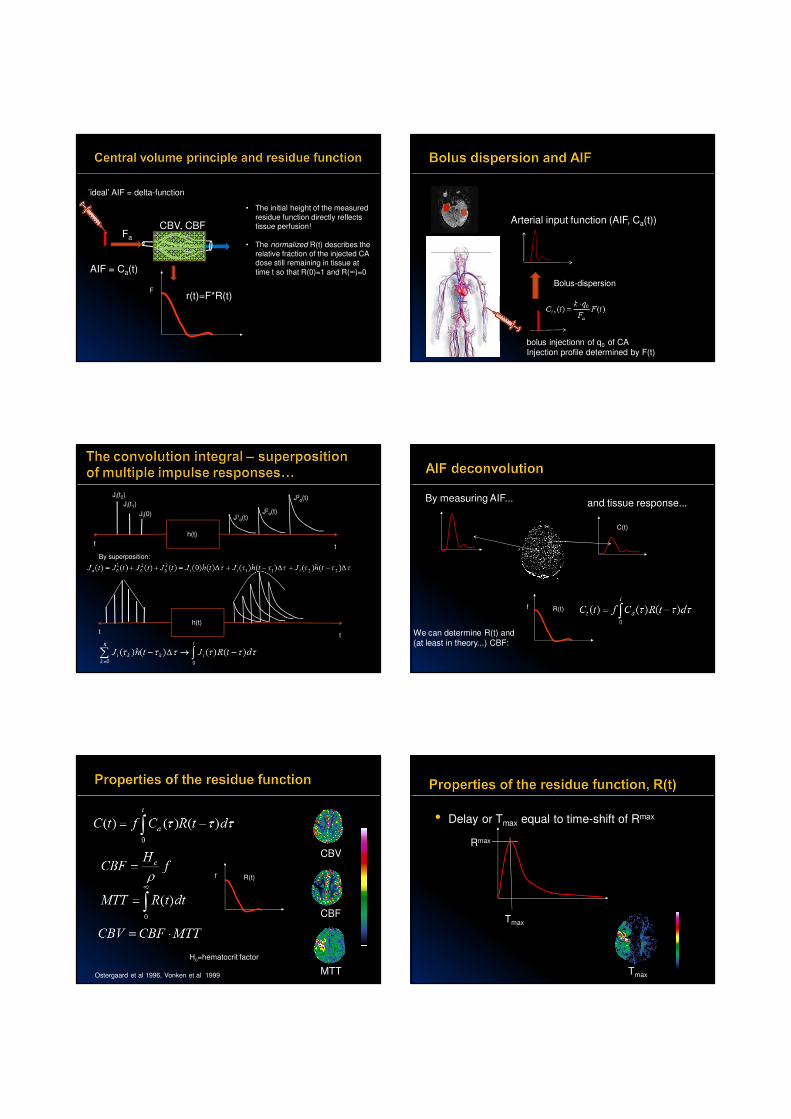
’ideal’ AIF = delta-function
F
Fa
CBV, CBF
AIF = Ca(t)
• The initial height of the measured
residue function directly reflects tissue perfusion!
• The normalized R(t) describes the relative fraction of the injected CA dose still remaining in tissue at
time t so that R(0)=1 and R(∞)=0
r(t)=F*R(t)
bolus injectionn of q0 of CAInjection profile determined by F(t)
Arterial input function (AIF, Ca(t))
Bolus-dispersion
h(t)
t
Ji(0)J1
o(t)
Ji(t1)J2
o(t)
t
Ji(t2) J3o(t)
h(t)
tt
By superposition:
R(t)f
C(t)
By measuring AIF... and tissue response...
We can determine R(t) and (at least in theory...) CBF:
R(t)f
CBV
CBF
MTTOstergaard et al 1996, Vonken et al 1999
Hc=hematocrit factor
• Delay or Tmax equal to time-shift of Rmax
Rmax
Tmax
Tmax

10/12/2013
7
DWI + MTT map (overlay)
DWI (b=1000)MTT Tmax
• Can be solved for R(t) using standard deconvolution methods like:• Singular value decomposition (SVD)1
• Fourier (FFT) based deconvolution2
• NOTE: For some deconvolution methods CBF estimates are sensitive to Tmax.
• Delay-insensitive deconvolution methods exist like block-circulant SVD2 or FFT-based methods3
1 Osteergaard et al. Magn Reson Med. 1996; 36(5):715-252 Wu et al. Magn Reson Med 2003; 50:164-174 3 Salluzzi M. Magn Reson Imaging. 2005 ;23(3):481-92
• AIF:
• Correct identification
• Dispersion effects
• Non-linear dose-response
• Partial volume effects
• Knowledge of tissue-specific constants
• Deconvolution of noisy data
39CBV CBF MTT Tmax
1 Mouridsen et al Magn Reson Med 2006;55(3):524-312 Caroll et al. Radiology 2003;227(2):593-6003 Bjørnerud and Emblem, JCBFB 20104 Knutsson et al JMRI 2006
• Tumor perfusion: most studies based on
normalized CBV analysis. A few studies on
quantitative analysis but with lower specificity1
• In acute stroke, Tmax may be the most sensitive
parameter2
• In longitudinal studies (e.g. treatment
response) quantitative analysis may have
merit3
• AIF determination or tissue normalization may
be required in most cases1 Law et al. Am J Neuroradiol 27:1975– 82 ; 2006 2 Christensen S et al. Stroke. 2009;40(6):2055-61; 20093 Sorensen et al . Cancer Res 72(2) 2012
• Relative: rCBV, rCBF*
• commonly used for parameters derived without
deconvolution or normalization
* Zierler. Circ Res 1965
10/12/2013
8
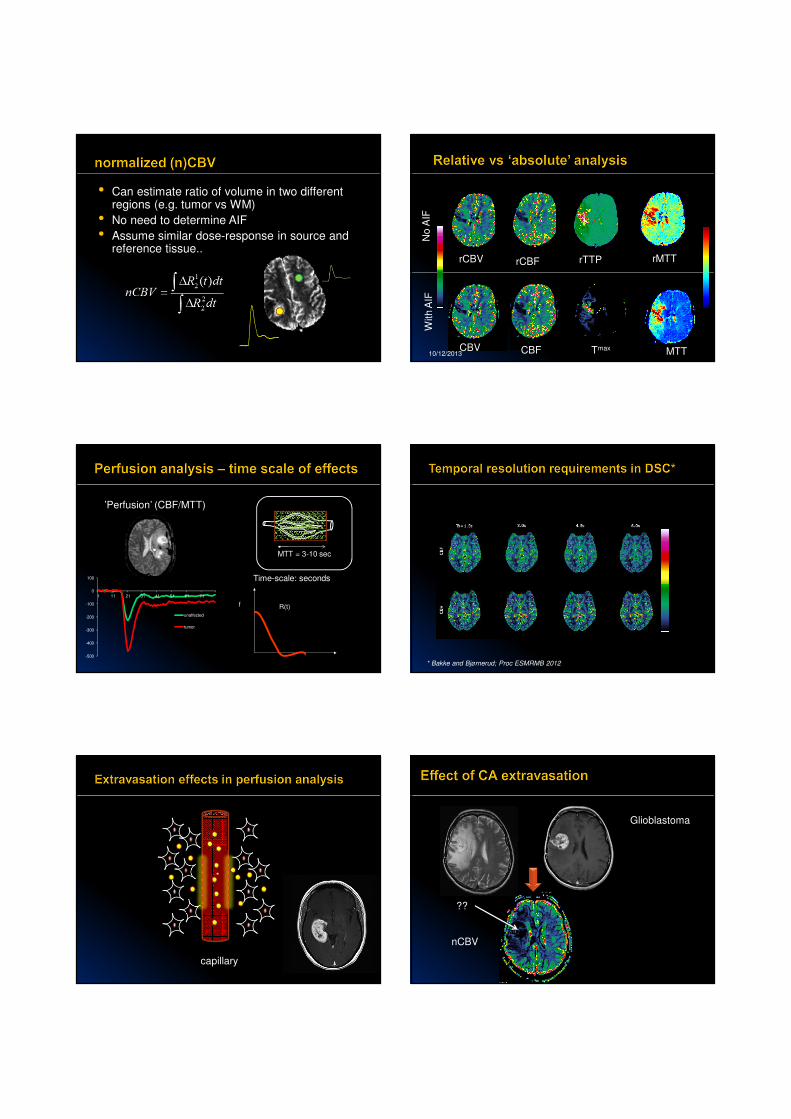
• Can estimate ratio of volume in two different regions (e.g. tumor vs WM)
• No need to determine AIF
• Assume similar dose-response in source and reference tissue..
10/12/2013 44
rCBV rCBF rMTTrTTP
No
AIF
With A
IF
CBV CBF MTTTmax
-500
-400
-300
-200
-100
0
100
1 11 21 31 41 51 61 71
unaffected
tumor
R(t)f
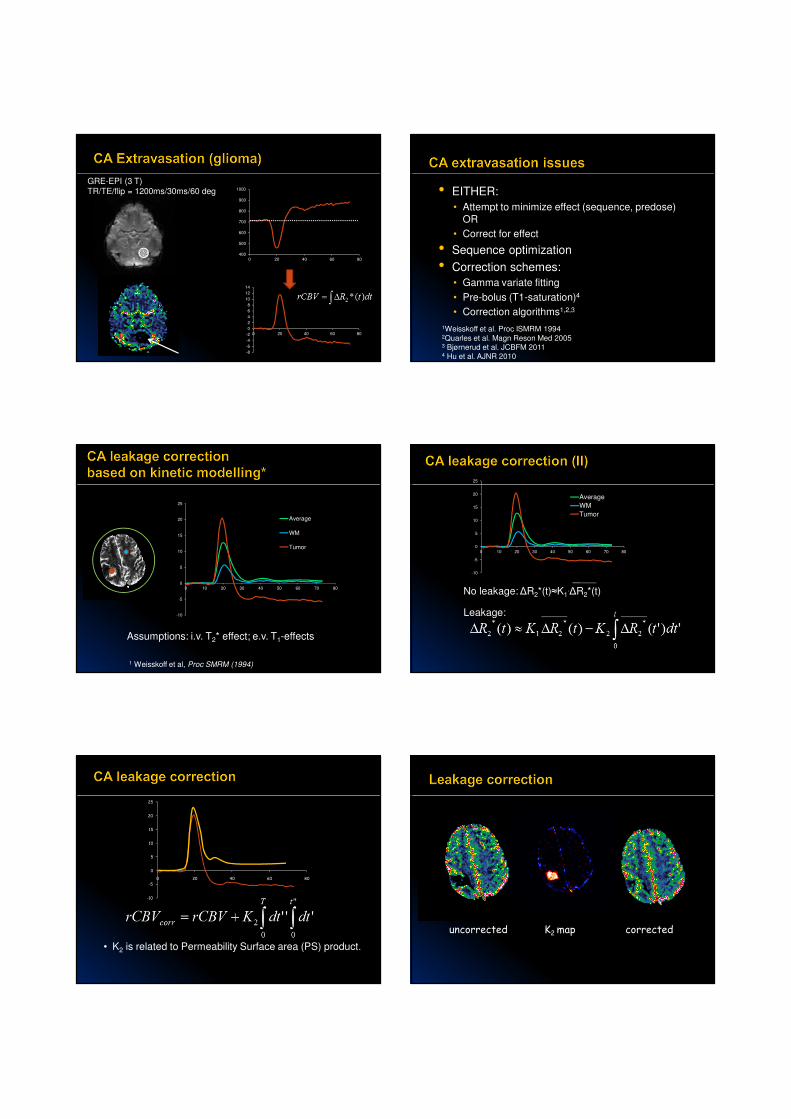
’Perfusion’ (CBF/MTT)
Time-scale: seconds
MTT = 3-10 sec
* Bakke and Bjørnerud; Proc ESMRMB 2012
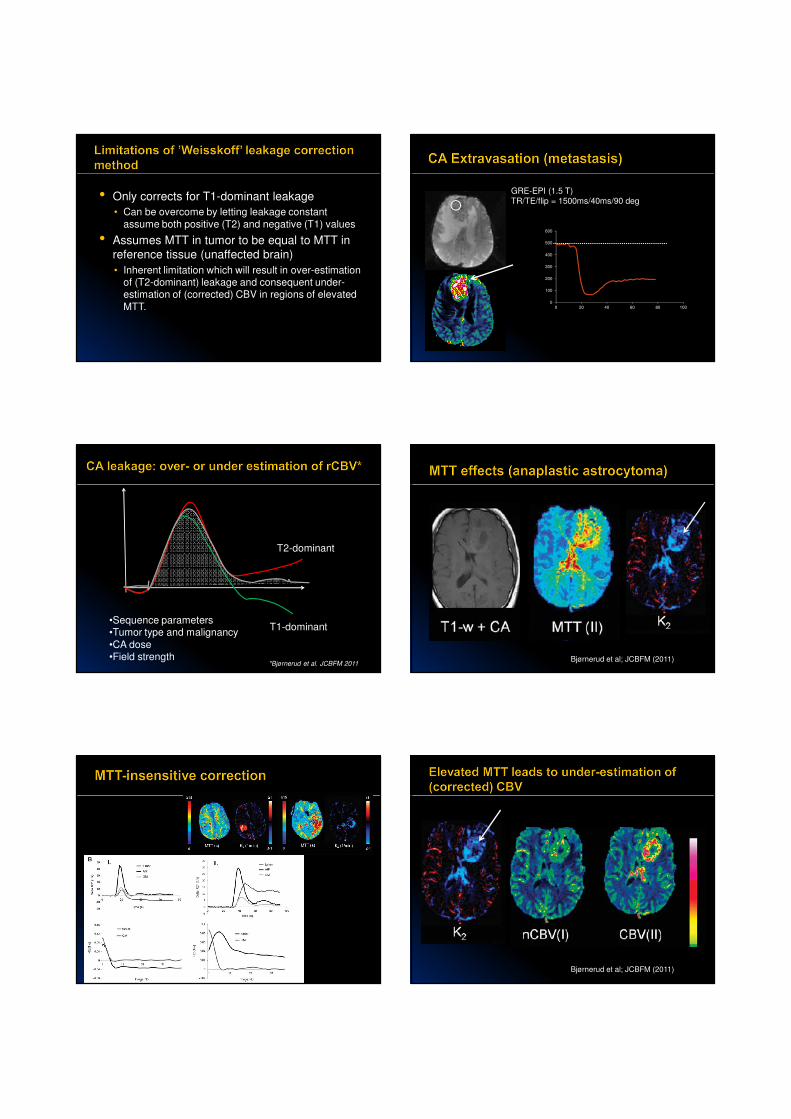
capillary
T2 T1+C
Glioblastoma
nCBV
??
10/12/2013
9
400
500
600
700
800
900
1000
0 20 40 60 80
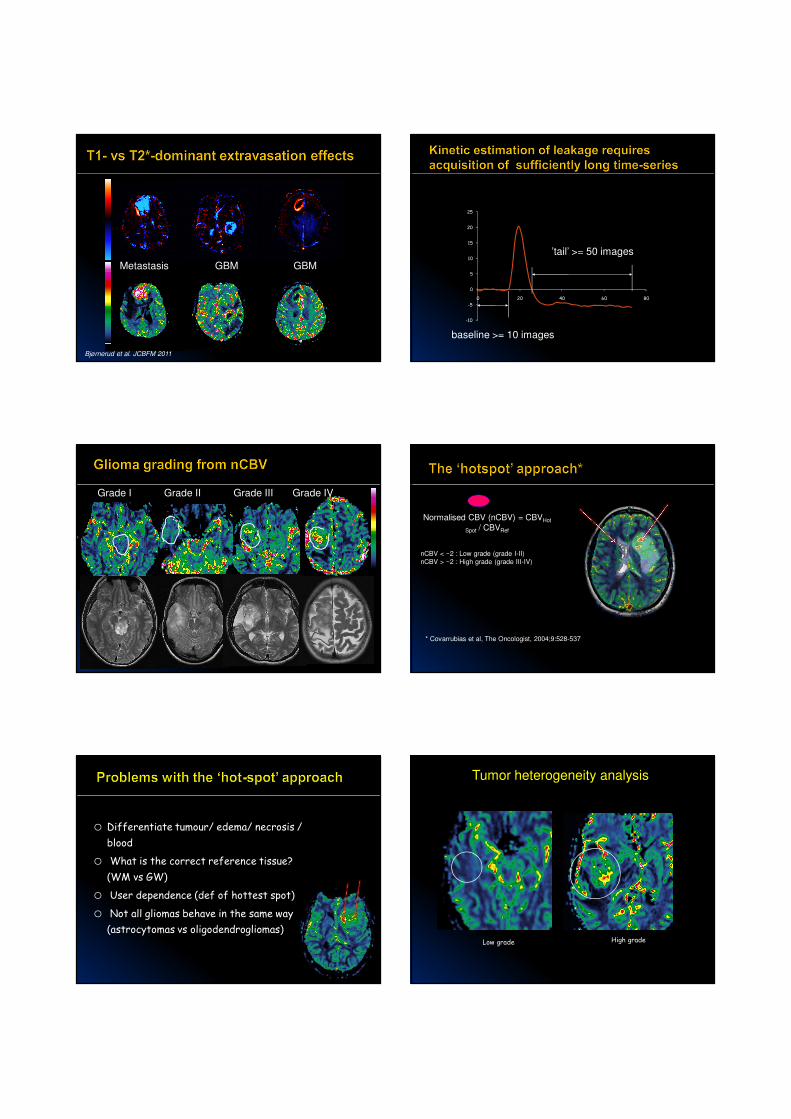
GRE-EPI (3 T)TR/TE/flip = 1200ms/30ms/60 deg
-8
-6
-4
-2
0
2
4
6
8
10
12
14
0 20 40 60 80
• EITHER:
• Attempt to minimize effect (sequence, predose)
OR
• Correct for effect
• Sequence optimization
• Correction schemes:
• Gamma variate fitting
• Pre-bolus (T1-saturation)4
• Correction algorithms1,2,3
1Weisskoff et al. Proc ISMRM 19942Quarles et al. Magn Reson Med 20053 Bjørnerud et al. JCBFM 20114 Hu et al. AJNR 2010
-10
-5
0
5
10
15
20
25
0 10 20 30 40 50 60 70 80
Average
WM
Tumor
Assumptions: i.v. T2* effect; e.v. T1-effects
1 Weisskoff et al, Proc SMRM (1994)
-10
-5
0
5
10
15
20
25
0 10 20 30 40 50 60 70 80
Average
WM
Tumor
No leakage: ∆R2*(t)≈K1.∆R2*(t)
Leakage:
-10
-5
0
5
10
15
20
25
0 20 40 60 80
• K2 is related to Permeability Surface area (PS) product.
uncorrected K2 map corrected
10/12/2013
10
• Only corrects for T1-dominant leakage
• Can be overcome by letting leakage constant
assume both positive (T2) and negative (T1) values
• Assumes MTT in tumor to be equal to MTT in
reference tissue (unaffected brain)
• Inherent limitation which will result in over-estimation of (T2-dominant) leakage and consequent under-estimation of (corrected) CBV in regions of elevated
MTT.0
100
200
300
400
500
600
0 20 40 60 80 100
GRE-EPI (1.5 T)TR/TE/flip = 1500ms/40ms/90 deg
T2-dominant
T1-dominant•Sequence parameters•Tumor type and malignancy
•CA dose•Field strength
*Bjørnerud et al. JCBFM 2011Bjørnerud et al; JCBFM (2011)
Bjørnerud et al; JCBFM (2011)
10/12/2013
11
Metastasis GBM GBM
Bjørnerud et al. JCBFM 2011
-10
-5
0
5
10
15
20
25
0 20 40 60 80
baseline >= 10 images
’tail’ >= 50 images
Grade I Grade II Grade III Grade IV
Normalised CBV (nCBV) = CBVHot
Spot / CBVRef
nCBV < ~2 : Low grade (grade I-II)
nCBV > ~2 : High grade (grade III-IV)
* Covarrubias et al, The Oncologist, 2004;9:528-537
o Differentiate tumour/ edema/ necrosis /
blood
o What is the correct reference tissue?
(WM vs GW)
o User dependence (def of hottest spot)
o Not all gliomas behave in the same way
(astrocytomas vs oligodendrogliomas)
Tumor heterogeneity analysis
Low grade High grade
10/12/2013
12
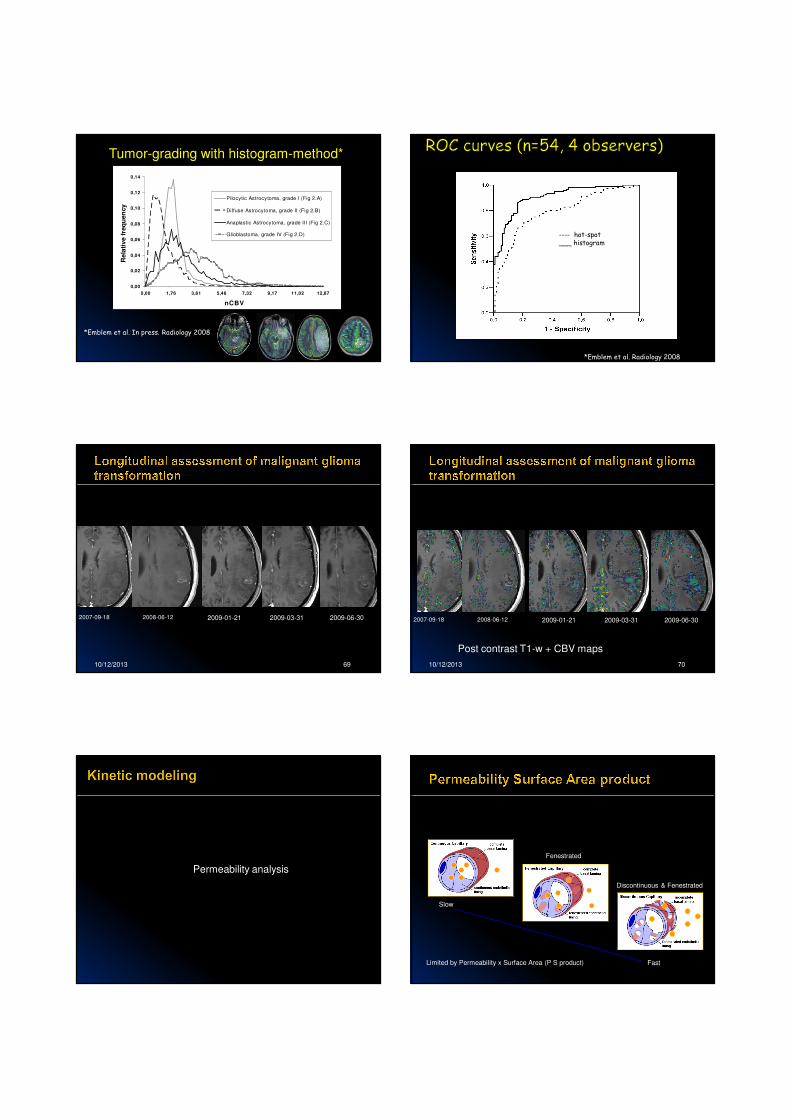
Tumor-grading with histogram-method*
*Emblem et al. In press. Radiology 2008
0,00
0,02
0,04
0,06
0,08
0,10
0,12
0,14
0,00 1,76 3,61 5,46 7,32 9,17 11,02 12,87
nCBV
Rela
tive f
req
uen
cy
Pilocytic Astrocytoma, grade I (Fig 2.A)
Diffuse Astrocytoma, grade II (Fig 2.B)
Anaplastic Astrocytoma, grade III (Fig 2.C)
Glioblastoma, grade IV (Fig 2.D)
*Emblem et al. Radiology 2008
---- hot-spot___ histogram
10/12/2013 69
2007-09-18 2008-06-12 2009-01-21 2009-03-31 2009-06-30
10/12/2013 70
2007-09-18 2008-06-12 2009-01-21 2009-03-31 2009-06-30
Post contrast T1-w + CBV maps
Permeability analysis
Fenestrated
Discontinuous & Fenestrated
Slow
FastLimited by Permeability x Surface Area (P S product)
10/12/2013
13
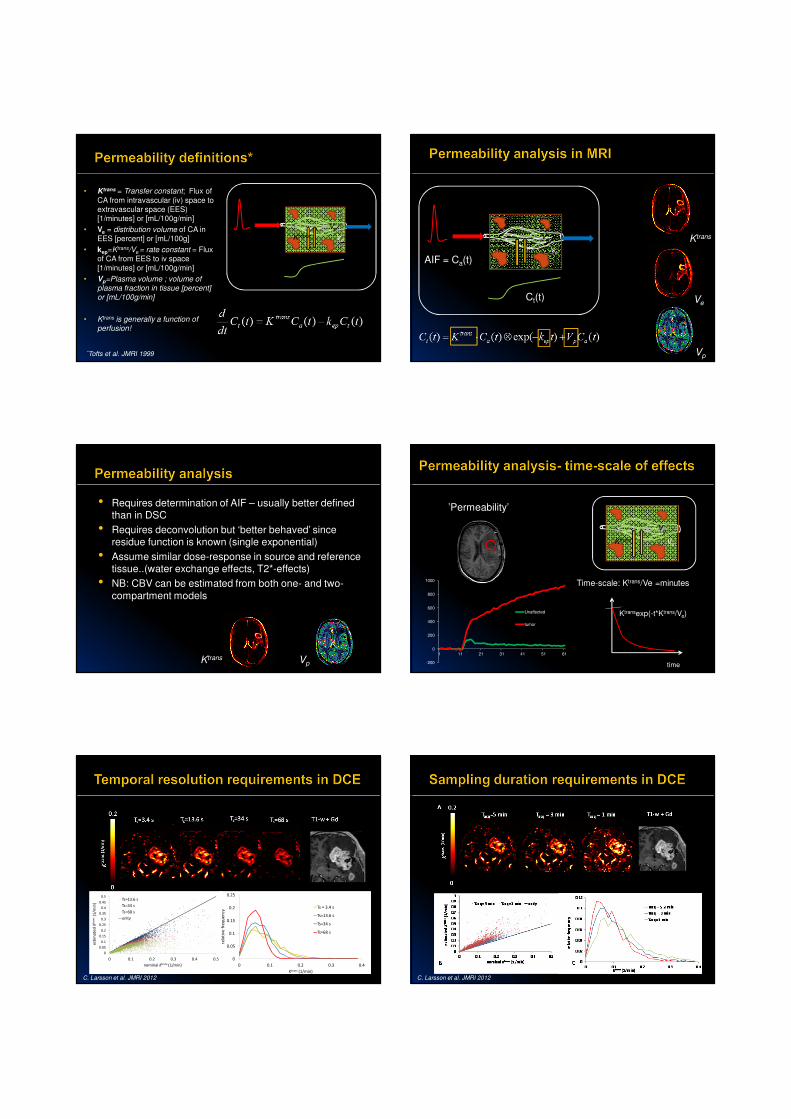
*Tofts et al. JMRI 1999
Ve
Vp
Ktrans
• Ktrans = Transfer constant; Flux of
CA from intravascular (iv) space to extravascular space (EES) [1/minutes] or [mL/100g/min]
• Ve = distribution volume of CA in EES [percent] or [mL/100g]
• kep=Ktrans/Ve = rate constant = Flux of CA from EES to iv space
[1/minutes] or [mL/100g/min]
• Vp=Plasma volume ; volume of plasma fraction in tissue [percent] or [mL/100g/min]
• Ktrans is generally a function of perfusion!
AIF = Ca(t)
Ct(t)
Ve
Vp
Ktrans
Ktrans
Vp
Ve
• Requires determination of AIF – usually better defined than in DSC
• Requires deconvolution but ‘better behaved’ since residue function is known (single exponential)
• Assume similar dose-response in source and reference tissue..(water exchange effects, T2*-effects)
• NB: CBV can be estimated from both one- and two-
compartment models
Ktrans Vp -200
0
200
400
600
800
1000
1 11 21 31 41 51 61
Unaffected
tumor
’Permeability’
time
Time-scale: Ktrans/Ve =minutes
Ktransexp(-t*Ktrans/Ve)
Ve
Vp
Ktrans
0
0.05
0.1
0.15
0.2
0.25
0.3
0.35
0.4
0.45
0.5
0 0.1 0.2 0.3 0.4 0.5
est
ima
ted
Ktr
an
s(1
/min
)
nominal Ktrans (1/min)
Ts=13.6 s
Ts=34 s
Ts=68 s
unity
0
0.05
0.1
0.15
0.2
0.25
0 0.1 0.2 0.3 0.4
rela
tiv
e f
req
ue
ncy
Ktrans (1/min)
Ts = 3.4 s
Ts=13.6 s
Ts=34 s
Ts=68 s
C. Larsson et al. JMRI 2012 C. Larsson et al. JMRI 2012
10/12/2013
14
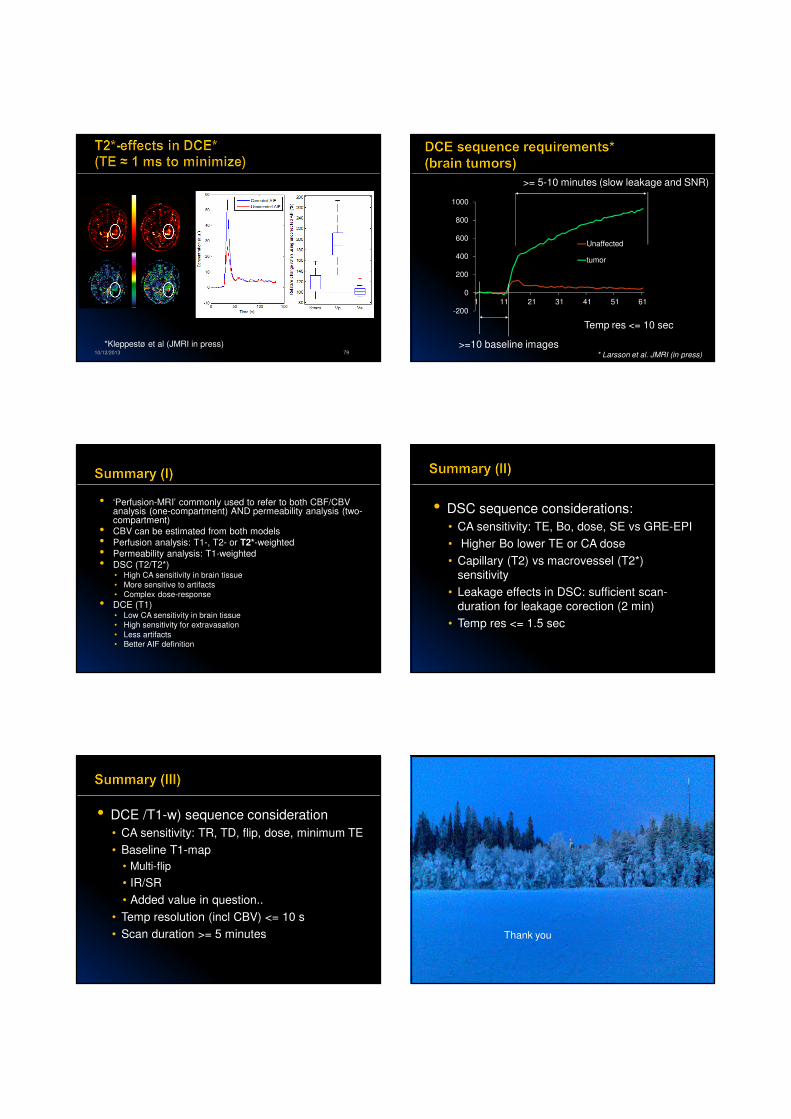
10/12/2013 79
*Kleppestø et al (JMRI in press)
-200
0
200
400
600
800
1000
1 11 21 31 41 51 61
Unaffected
tumor
>=10 baseline images
>= 5-10 minutes (slow leakage and SNR)
Temp res <= 10 sec
* Larsson et al. JMRI (in press)
• ‘Perfusion-MRI’ commonly used to refer to both CBF/CBV analysis (one-compartment) AND permeability analysis (two-compartment)
• CBV can be estimated from both models
• Perfusion analysis: T1-, T2- or T2*-weighted
• Permeability analysis: T1-weighted
• DSC (T2/T2*)• High CA sensitivity in brain tissue
• More sensitive to artifacts
• Complex dose-response
• DCE (T1)• Low CA sensitivity in brain tissue
• High sensitivity for extravasation
• Less artifacts
• Better AIF definition
• DSC sequence considerations:
• CA sensitivity: TE, Bo, dose, SE vs GRE-EPI
• Higher Bo lower TE or CA dose
• Capillary (T2) vs macrovessel (T2*)
sensitivity
• Leakage effects in DSC: sufficient scan-
duration for leakage corection (2 min)
• Temp res <= 1.5 sec
• DCE /T1-w) sequence consideration
• CA sensitivity: TR, TD, flip, dose, minimum TE
• Baseline T1-map
• Multi-flip
• IR/SR
• Added value in question..
• Temp resolution (incl CBV) <= 10 s
• Scan duration >= 5 minutes
10/12/2013 84
Thank you


![GI_2.vjezbe_-_EC7 [3,61 MiB]](https://img.dokumen.tips/doc/110x75/58668da11a28abaf408b76c5/gi2vjezbe-ec7-361-mib.jpg)