Embed Size (px)
Citation preview
Slope Stability 2013 – P.M. Dight (ed) © 2013 Australian Centre for Geomechanics, Perth, ISBN 978-0-9870937-5-2
Slope Stability 2013, Brisbane, Australia 513
D.S. Lucas Mining One Consultants, Australia
P.J.H. de Graaf Rio Tinto Iron Ore, Australia
Rio Tinto Iron Ore’s (RTIO) Tom Price open cut mine in the Pilbara region of Western Australia commenced in 1966 and had a cumulative production to mid 2012 estimated at over 800 Mt. The South East Prongs (SEP) pit at Tom Price hosts one of the mine’s prime sources of high grade and low impurity hematite ore. An integrated mine planning and geotechnical design approach was required to evaluate and optimise late stage mining design options within large scale structural geological (adverse bedding strength anisotropy and fault) and hydrogeological controls.
The SEP pit is structurally complex. The orebody is hosted within a doubly-plunging syncline bounded by the low-permeability shale, with predominant east-west striking faults confining the mineralisation to within the central part of the syncline. Multiple deformation events have resulted in significant folding and additional faulting. The complex structural geology, with bedding dipping into the pit void, and numerous faults, present a challenging geotechnical environment to design and implement robust mine design to maximise late stage mining ore recovery.
By mid 2010, the SEP pit had been mined to between 600 and 640 RL. Mining ceased after accelerated movement was detected in the north wall. Additional geotechnical investigations were undertaken in late 2010 and 2011. This augmented information obtained from previous investigations. Stratigraphic units and faults were defined by mapping and geophysical logging, but areas of uncertainty remained, particularly in some fault locations, which could not be improved by further drilling.
The planned final 375 m high pit shell is to extend 30 to 70 metres deeper than the current mining levels, and about 100 m below the regional water table. A modified pit design was required to fit within a constrained region of the pit, to minimise the likelihood of fault controlled instability impacting the main access ramp on the west wall, and to account for dewatering and depressurisation requirements.
The project geotechnical team, consisting of RTIO geotechnical personnel and their geotechnical consultants (Mining One) worked closely with RTIO’s mine design team to develop workable risk assessed options which enabled an optimum design to be adopted, with a detailed hazard and risk management plan for implementation during mining.
The final design was optimised to allow access by a large equipment fleet for more efficient mining, while deferring key geotechnical risks to a later stage of mining to provide greater reliability of ore supply for the short-term mining schedule and opportunity to improve design reliability as mining proceeds.
Rio Tinto Iron Ore’s (RTIO) Tom Price open cut mining operation is located in the Pilbara region of Western Australia (Figure 1). Mining of iron ore commenced in 1966 and the mine had a cumulative production to mid 2012 estimated at over 800 Mt. The South East Prongs (SEP) pit at Tom Price hosts one of the mine’s prime sources of high grade and low impurity hematite ore, which is critical to the mine’s delivery schedule. The pit has reached a late stage of mining in which large scale re-design options are unlikely to be

Iterative geotechnical pit slope design in a structurally complex setting: D.S. Lucas and P.J.H. de Graaf a case study from Tom Price, Western Australia
514 Slope Stability 2013, Brisbane, Australia
cost−effective. Therefore an integrated approach to mine planning and geotechnical design was required to evaluate and optimise mine design options in a geotechnically challenging environment.
The SEP pit is structurally complex. The orebody is hosted within a doubly-plunging syncline bounded by shale, with predominant east-west striking faults confining the mineralisation to within the central part of the syncline. Multiple deformation events have resulted in significant folding and additional faulting. The complex structural geology within the syncline, with bedding dipping into the pit void and numerous faults, present challenges for design and successful implementation.
The SEP pit has been the subject of several geotechnical investigations, beginning in the 1990s. By mid 2010, the pit had been mined to 600 RL, and to 630–640 RL at the north wall. Mining ceased after accelerated movement was detected in the north wall. Geotechnical investigations were undertaken in late 2010 and 2011, adding to the information from earlier investigations.
The planned final pit shell will be 375 m high, and will extend 30 to 70 metres deeper than the current mining levels, and about 100 metres below the regional water table. The challenge facing RTIO was to design a pit within a constrained region, while minimising the likelihood of fault controlled instability impacting the main access ramp on the west wall, and to account for dewatering and depressurisation requirements.
The geotechnical team worked closely with RTIO’s mine design team through a number of design iterations, to develop workable risk assessed options which enabled an optimum design to be adopted.
The SEP pit lies within the Hamersley Province (Figure 1) that spans some 80,000 square kilometres and hosts one of the world’s largest sources of iron ore. The Late Archaean to Palaeoproterozoic Hamersley Group is 2,500 metres thick, and hosts the mineralised banded iron formation (BIF) belonging to the Brockman Iron Formation and the uppermost part of the Mount McRae Shale (MCS) that is mined at Tom Price. The 620 m thick Brockman Iron Formation sequence is divided into four members: the lowermost Dales Gorge Member (DG), the Whaleback Shale Member, the Joffre Member and the Yandicoogina Shale Member.

Uncertainty in design
Slope Stability 2013, Brisbane, Australia 515
The SEP pit targets the hematite-rich orebody within the DG of the lower Brockman Iron Formation, and the upper mineralised portion of the Footwall Zone (FWZ) that forms the uppermost part of the underlying MCS. The DG is an approximately 150 m thick alternating sequence of BIF and shale microbands (10 cm to several metres thick), whilst the MCS is a 50 to 60 m thick carbonaceous shale unit with interbedded chert and minor BIF (Trendall and Blockley, 1970; Harmsworth et al., 1990; Blake and Barley, 1992).
The Tom Price iron ore deposit is approximately 7.5 km long and 1 km wide, and lies on the southern limb of the Turner Syncline. Several pits extend along the length of the deposit, with additional deposits of the Brockman Iron Formation, and the Marra Mamba Formation of the lower Hamersley Group, also mined to the south of the primary mineralised zone. The SEP pit lies at the eastern extend of the main deposit, where mineralisation of the DG extends to 250 m depth below the natural ground surface.
The SEP pit lies within an east–west trending syncline, part of the Turner Syncline, which has undergone several phases of deformation. Of greatest geotechnical significance is the Ophthalmian Orogeny, which resulted in small to medium scale folding which is evident in the SEP pit with wavelengths of 5 to 30 m, and amplitudes less than 10 m. These are termed F2 folds.
The SEP deposit is extensively faulted by predominantly east–west trending extensional faults, and secondary north-east to north-northeast trending extensional faults. The predominant faults and fault systems (known as the FSEP fault system), consists of structures dipping south and trending east-west in the northern limb of the SEP syncline, and east-west trending, north-dipping faults in the southern limb of the syncline. These effectively form a graben structure, enclosing the orebody within the syncline and between the faults.
Several smaller faults occur in the SEP pit which are also of geotechnical significance. Most reflect the general trends of the horst and graben structure. However, one fault, the F12 fault, in the west and north walls of the SEP pit has an unusual geometry. It is inferred as a shallow-dipping fault, sub-parallel to bedding possibly folded by the syncline, and probably faulted by the secondary north-east to north−northeast trending faults.
The SEP pit approximately follows the shape of the predominent synclinal structure, with the north and south walls in the northern and southern limbs of the syncline. The current pit walls are developed largely within the DG and MCS units, with Mount Silvia Formation (MTS) and some Wittenoom Formation (WD) exposed on the higher pit slopes. The Whaleback Shale that overlies the DG has been mined out to gain access to the current pit.
Figure 2(a) shows the SEP pit, viewed facing east. Figure 3 shows the major geological and structural features, viewed as for Figure 2(b), and sectioned through 15020 E. Figure 2(b) shows the primary syncline that is the dominant feature of the SEP pit, with the major faults, and the secondary, smaller scale F2 folds that are evident on the limbs of the primary syncline, particularly in the south wall (right of figure).
The structural model is of major significance to understanding the past pit wall performance of the SEP pit. Structural modelling has been carried out by a dedicated RTIO geology team, using a combination of pit wall mapping and drilling information including lithology, bedding dips, geochemistry and geophysical logging that characterise each of the major stratigraphic units and marker beds. Model interpretation uncertainties remain where F2 folding produces complex intersections of stratigraphic markers in boreholes and for which additional drilling would not further reduce the uncertainties.

Iterative geotechnical pit slope design in a structurally complex setting: D.S. Lucas and P.J.H. de Graaf a case study from Tom Price, Western Australia
516 Slope Stability 2013, Brisbane, Australia
The primary aquifer in the SEP pit comprises the mineralised DG and the FWZ, which together comprise the Orebody Aquifer. The Orebody Aquifer is bounded below by the MCS, which is an aquitard, with a hydraulic conductivity some two orders of magnitude lower than the aquifer. The doubly plunging synclinal structure in the deeper parts of the SEP pit are largely within the MCS, which restricts groundwater flow to the open pit. A prominent chert band (Bruno’s Band) marks the contact between the MCS and the underlying MTS, and is a higher-conductivity unit that acts as an aquifer, and preferential flow path for water behind the pit walls. The WD, which is approximately 100 m behind the pit walls, and the orebody are major regional aquifers.
Faulting and folding also lead to localised compartments of groundwater behind the pit walls, potentially resulting in zones of elevated pore pressure, where the effectiveness of depressurisation is limited.
The current pit, and planned future extension at depth, is below the original phreatic surface of the Orebody Aquifer. Depressurisation of pit walls is therefore a key consideration in geotechnical design, and a component of geotechnical hazard management in the mining operation. RTIO carries out pit wall depressurisation with a program of horizontal holes, generally at 25 m horizontal spacing, to depths of between 50 and 255 m. Depressurisation effectiveness is assessed by a network of open standpipe piezometers and vibrating wire piezometers (VWP). A more detailed account of the SEP pit hydrology is presented by New et al. (2010).
Two fall of ground events of significance have occurred in the SEP pit in the last six years: 1) a large scale non-daylighting wedge failure of the southeastern wall, and 2) batter failure and larger scale movement of the north wall down to 640 RL, which was detected by prism monitoring and slope stability radar. The latter is directly related to the SEP pit design and highlights the challenges faced by mining within a syncline, with the predominent bedding structure dipping into the pit in the north and south walls.
RTIO uses a state of the art network of monitoring systems to detect wall movement and piezometric pressure changes. Prisms are located on all pit walls and are monitored by an automated reading and alarm system, and results are regularly assessed by RTIO’s site-based geotechnical team. Slope movement monitoring is supplemented by slope stability radar for areas where increased movement, or heightened risks are identified. VWP are installed in boreholes behind the north and south walls, and are assessed

Uncertainty in design
Slope Stability 2013, Brisbane, Australia 517
regularly by RTIO’s site-based hydrogeology team. Time Domain Reflectometery (TDR) cables are sometimes grouted into VWP holes, and are used to identify potential deep seated dilation on structures.
The large scale wedge failure in the southeastern wall occurred in December 2006, and was investigated extensively by RTIO and presented by Day and Seery (2007). The failure occurred on an intersecting pair of faults with a non-daylighting line of intersection, resulting in a complex wedge failure on the two structures with shear through the rock mass at the toe. Being primarily structurally controlled, back-analysis of the failure was of limited use in assessing rock mass shear strength criteria for future SEP pit designs. The back−analysed fault shear strengths compared closely with the strengths determined from other sources and used for this study.
The southeastern wedge failure was a key factor in RTIO’s decision to change ramp accesses and cutback designs for the SEP pit, which ultimately led to the investigation that is the subject of this paper.
By mid 2010, the SEP pit had been mined to 600 RL, and to 630–640 RL at the north wall, with a trim shot (final wall blast) having been fired and left un-mined at the 640 to 630 RL (Figure 4). In May 2010, a portion of the north wall experienced a sudden increase in prism movement on the 660 RL berm. The movement was extensively investigated by RTIO (RTIO, 2010).
Prisms on the 660 RL berm had shown a slow decrease of movement in early to mid 2010, and reached a steady rate of creep. There was some concern at the time that the prisms were taking longer than expected to reach a steady rate of creep, and this appeared to suggest that a larger, possibly deeper and more complex sliding mechanism was developing. The movement occurred in the area shown in Figure 4, near to and down-slope of a previous batter failure that occurred on the 720–690 RL batter. Prisms on the 690 RL and 720 RL berms adjacent to the batter failure continued with a relatively low rate of movement and did not respond in a similar manner to those on the 660 RL.
A fall in piezometric pressure was identified in VWPs behind the north wall, in response to firing the trim shot on the 660 to 640 RL. RTIO’s investigations were not able to determine whether the fall in pressure was caused by, or was associated with the slope movement, or whether the movement and the pressure drop both occurred as a result of the blast. The change did, however, raise concerns that the two were connected.
RTIO carried out stability analyses for three cross-sections, which showed that the lowest Factor of Safety (FS) occurred in the vicinity of the greatest prism movement. FS were higher, approaching 1.2 to the west and east. Mining to the then-approved design to 630 RL would have led to a decrease in the FS in the eastern part of the affected area.
RTIO’s investigation concluded that the then-approved design to mine to 630 RL at the north wall should be suspended, pending further investigations and monitoring.
The north wall prisms continued to move gradually, and then accelerated in response to major rainfall events:
In late December 2010 to early January 2011, 239 mm of rainfall resulted in southerly movements of up to 0.5 mm/day.
In January and February 2012, 231 mm of rainfall resulted in southerly and downward movement of the wall at up to 1.24 mm/day. The velocity of movement was greater in this period, but the distances that prisms moved were similar to, or less than the first event.

Iterative geotechnical pit slope design in a structurally complex setting: D.S. Lucas and P.J.H. de Graaf a case study from Tom Price, Western Australia
518 Slope Stability 2013, Brisbane, Australia
Figure 3 shows prism movements for the second event, with vectors representing the movement velocities. These movements suggested that the 640 to 630 RL trim shot was marginally stable, and was probably being buttressed by the blasted material.
Prism monitoring of the north wall suggested that the movement was related to the structure, with upper prisms (on the 720 RL) moving downward, and prisms near the toe of the zone of movement (on the 660 RL) moving outward, see Figure 3(b). This observed prism behaviour gave confidence in the interpreted structural influence of the slope movement, and highlighted the need to maintain the trim shot as a buttress.
RTIO had been aware through earlier design assessments that mining within the syncline, with the complex structural conditions, presented geotechnical risks that were only partly understood. There was little to be gained from further geotechnical drilling to improve the geotechnical model, because geological and structural interpretations from the drilling were hampered by the lack of reliable marker beds and the complex structural conditions, particularly the F2 folds that presented an apparently repeated stratigraphy in boreholes that intersected multiple folds. RTIO’s structural geology team had demonstrated that geological mapping of surface exposures in the pit was the most reliable way to further improve the structural model.
For these reasons, mining was planned to progress as an initial ‘Phase 1’ design to 630 RL, which would provide surface exposures and an opportunity to further update the structural model before progressing to ‘Phase 2’, mining to 570 RL. The Phase 1 design to 630 RL was approved for mining, and Phase 2 designs were presented for geotechnical assessments.
The adopted mining strategy and key issues may be understood by examining the mining sequence that was initially proposed. Figure 4(a) shows the current pit, which has remained largely unchanged since 2010 when this investigation commenced. Figure 4(b) shows the originally approved Phase 1 design to mine to 630 RL via a north wall ramp. Mining to the approved 630 RL design shown in Figure 4(b) was suspended in mid 2010 following the accelerated movement of the north wall, described in Section 3.3. Geotechnical assessments were then carried out for the proposed Phase 2 designs, following concerns about the increased risks of north wall instability.

Uncertainty in design
Slope Stability 2013, Brisbane, Australia 519
Initial Phase 2 designs were prepared in 2009, and proposed to complete mining the SEP pit to 570 RL by mining to the final north wall via a south wall ramp (Figure 5(a)), then by constructing a fill ramp on the north wall (Figure 5(b)) to provide access to mine out the south wall ramp.
Assessment of these designs was carried out in 2010, and identified the geotechnical concerns that are illustrated in Figures 6 and 7:
The west wall ramp is undercut by the F12 Fault, which is folded by the main syncline and plunges to the east, forming a potential failure surface. The F12 fault is itself displaced by several faults that strike approximately north–south, which cause the fault to daylight in several locations. There was some doubt as to whether the F12 Fault is continuous across the base of the syncline, or is two separate faults. If it is the latter, there is a lower likelihood of failure on the fault, but geotechnical assessments were carried out assuming the worst case, i.e. a continuous fault.
The final north wall is designed almost parallel to the south-dipping bedding, and the F12 Fault lies sub-parallel to the bedding.
Stability concerns in the west and north wall designs are further compounded by sensitivity to depressurisation, as well as a degree of uncertainty about the structural model:
Each wall would be marginally stable or would have estimated FS less than RTIO’s design standard, even if full depressurisation targets are met. Depressurisation of pit walls in SEP requires horizontal drain holes to be drilled in congested operating floor areas, restricting mining operations and the rate of vertical mining progression.
Structural modelling of the F12 Fault was difficult, where it lies sub-parallel to bedding. RTIO’s structural geology team modelled the F12 Fault position to an expected accuracy of 5 to 10 m in the west and north walls.

Iterative geotechnical pit slope design in a structurally complex setting: D.S. Lucas and P.J.H. de Graaf a case study from Tom Price, Western Australia
520 Slope Stability 2013, Brisbane, Australia

Uncertainty in design
Slope Stability 2013, Brisbane, Australia 521
Stability assessments were carried out using the following criteria:
1. Visual assessments of failure likelihood were carried out as an initial phase, particularly for potential smaller scale failures on structures and the impact of uncertainty in the geological model. These visual assessments identify areas for further analysis.
2. 2D stability analyses using RocScience SLIDE software (RocScience Inc., 2013) were carried out for cross-sections selected in step 1, using parameters established from previous work and recent drilling and testing.
3. 2D analyses have been shown to estimate Factors of Safety (FS) close to 1.0 for the current north wall slope. This is in agreement with the north wall performance that suggests the FS may have been close to 1.0 for wet seasonal conditions. This provides confidence that the analysis parameters are reasonable, or slightly conservative within the constraints of 2D limit equilibrium slope performance calibration.
4. 2D back-analyses were carried out of the north wall Pineapple Ramp movement, to determine a friction angle for bedding to give FS of 1.0, and this same friction angle has been used to check for a down-slope extension of the existing failure along bedding.
5. 2D stability analyses of the west wall estimate FS close to 1.0 for the F12 Fault in the current west wall, using the conservative end of the estimated range of rock mass strengths. While not strictly a back-analysis, this provides confidence that the chosen strength parameters are at least equal to, or above the conservative estimate.
6. 2D stability analyses do not account for 3D confinement and are therefore somewhat conservative where 3D confinement is evident. Where the geometry suggests that 3D confinement may have a stabilising influence, this has been taken into account in assessing results and making recommendations.
Various design options were assessed to maximise high grade recovery and reducing waste stripping within the tight structural constraints of the adverse geological controls. RTIO presented several ultimate pit design options for geotechnical assessment, from late 2010 to early 2012. A total of 15 designs were assessed, not including the initial Phase 2 designs (UF101 and UF201, described above), before arriving at the ultimate design options that were presented to RTIO’s management for approval. It is beyond the scope of this paper to describe all design iterations. Instead, the focus will be on the ultimate design options, which are:
Development Fleet Design (v12.2), refer to Figure 8(a). Ramps would be designed for access by RTIO’s smaller truck and shovel development fleet that is typically used for establishing new pits in difficult terrain. This option has the benefits of narrower and steeper ramps that could be positioned more favourably with respect to critical geological structures. This design attempted to mine behind the F12 fault on the west and north west walls, positioning the ramp in more favourable geology.
Large Fleet Design (UF106), refer to Figure 8(b). This option which would provide access for RTIO’s standard truck and shovel fleet, with the benefit of more rapid mining, and the potential disadvantages of wider ramps, more limited floor space and potentially more ramp widths at risk of failure. The west wall ramp cannot be positioned behind the F12 Fault, and must be positioned above it, where it is at risk of failure on the fault.
Final north wall design (Figure 8(c)), which mines out the north wall to the final shell.

Iterative geotechnical pit slope design in a structurally complex setting: D.S. Lucas and P.J.H. de Graaf a case study from Tom Price, Western Australia
522 Slope Stability 2013, Brisbane, Australia
The large fleet and development fleet designs would access the pit via the west wall, and an interim ramp on the north wall which would then be mined out via a fill ramp on the south wall. This key change from the earlier designs defers the reliance on north wall depressurisation and provides opportunities for further structural mapping prior to mining back to the critical final north wall. The north wall has historically proven more difficult to achieve effective depressurisation over the south wall (New et al., 2010).
RTIO’s mine schedule required one million tonnes of high-grade ore to be mined from the SEP pit in 2012. A key driver for selection of a preferred option was to ensure that one million tonnes could be delivered with the lowest geotechnical risk, deferring risks to later mining if possible and allowing more time for structural mapping and further geotechnical assessments.
The key risk is west wall stability, and potential failure of the west wall ramp on the F12 Fault. The north wall stability was also a concern, but was managed as far as possible by accessing the pit via a north wall ramp and deferring mining to the final north wall shell. Thus, the focus of discussion is on the west wall.
The potential risks can be seen in cross-sections of the west wall ramp, Figures 9 and 10:
The large fleet design (Figure 9) has the west wall ramp positioned above the F12 Fault. It was not possible to cut back the west wall slope to accommodate the large-fleet ramp in stable ground. The F12 Fault was modelled with a stated accuracy of ± 5 to 10 m over much of the wall, and ± 10 to 20 m in the west, or upper part of the wall. As Figure 9 shows, variations in the vertical position of the fault will have a significant impact on wall stability. The table in Figure 17 summarises the likely extent of failures, in terms of ramp width lost, and RL of the failure toe.
The development fleet design (Figure 10) has a narrower west wall ramp positioned behind the modelled location of the F12 Fault. It was not possible to cut back the wall to position the ramp any further behind the fault.
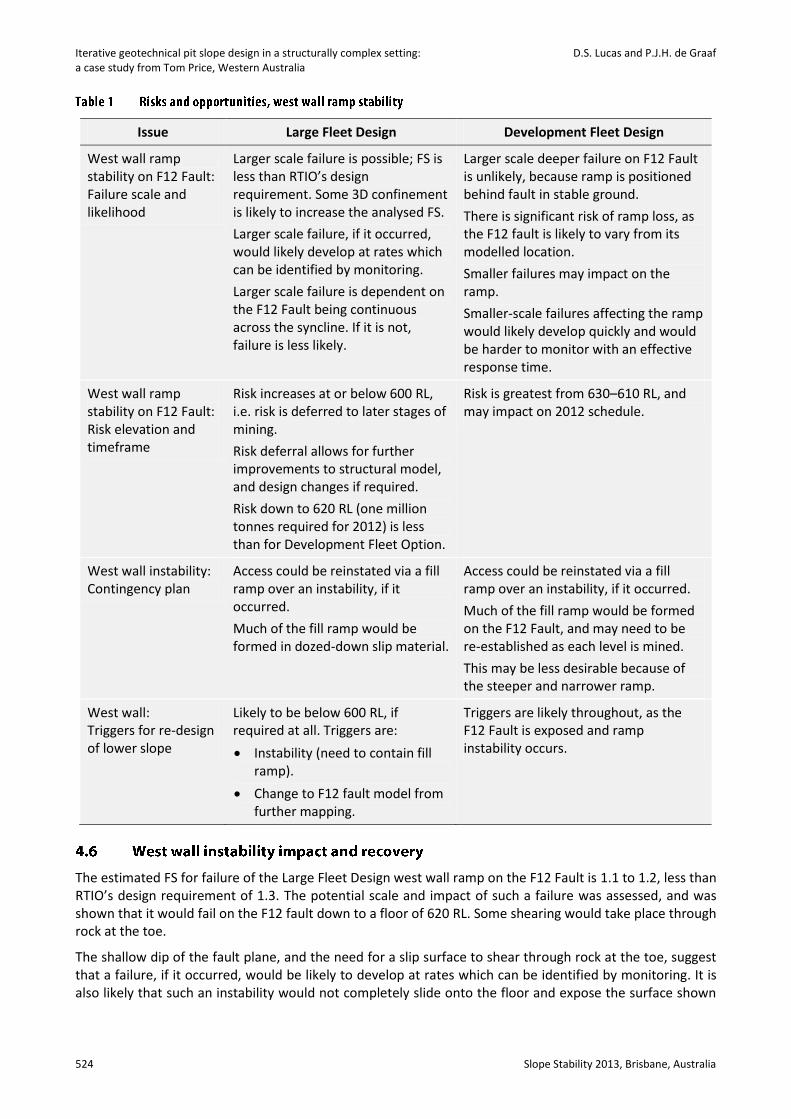
Risks and opportunities for the two design options are summarised and compared in Table 1. While both designs have risks in the west wall ramp stability, the large fleet design option has a lower risk for the one million tonne mining schedule to 620 RL. The development fleet design option not only has greater risks within the one million mining period, but failure is highly likely to occur if the fault is anywhere deeper than its modelled location, which has a 50% likelihood.

Uncertainty in design
Slope Stability 2013, Brisbane, Australia 523
Iterative geotechnical pit slope design in a structurally complex setting: D.S. Lucas and P.J.H. de Graaf a case study from Tom Price, Western Australia
524 Slope Stability 2013, Brisbane, Australia
Issue Large Fleet Design Development Fleet Design
West wall ramp stability on F12 Fault: Failure scale and likelihood
Larger scale failure is possible; FS is less than RTIO’s design requirement. Some 3D confinement is likely to increase the analysed FS.
Larger scale failure, if it occurred, would likely develop at rates which can be identified by monitoring.
Larger scale failure is dependent on the F12 Fault being continuous across the syncline. If it is not, failure is less likely.
Larger scale deeper failure on F12 Fault is unlikely, because ramp is positioned behind fault in stable ground.
There is significant risk of ramp loss, as the F12 fault is likely to vary from its modelled location.
Smaller failures may impact on the ramp.
Smaller-scale failures affecting the ramp would likely develop quickly and would be harder to monitor with an effective response time.
West wall ramp stability on F12 Fault: Risk elevation and timeframe
Risk increases at or below 600 RL, i.e. risk is deferred to later stages of mining.
Risk deferral allows for further improvements to structural model, and design changes if required.
Risk down to 620 RL (one million tonnes required for 2012) is less than for Development Fleet Option.
Risk is greatest from 630–610 RL, and may impact on 2012 schedule.
West wall instability: Contingency plan
Access could be reinstated via a fill ramp over an instability, if it occurred.
Much of the fill ramp would be formed in dozed-down slip material.
Access could be reinstated via a fill ramp over an instability, if it occurred.
Much of the fill ramp would be formed on the F12 Fault, and may need to be re-established as each level is mined.
This may be less desirable because of the steeper and narrower ramp.
West wall: Triggers for re-design of lower slope
Likely to be below 600 RL, if required at all. Triggers are:
Instability (need to contain fill ramp).
Change to F12 fault model from further mapping.
Triggers are likely throughout, as the F12 Fault is exposed and ramp instability occurs.
The estimated FS for failure of the Large Fleet Design west wall ramp on the F12 Fault is 1.1 to 1.2, less than RTIO’s design requirement of 1.3. The potential scale and impact of such a failure was assessed, and was shown that it would fail on the F12 fault down to a floor of 620 RL. Some shearing would take place through rock at the toe.
The shallow dip of the fault plane, and the need for a slip surface to shear through rock at the toe, suggest that a failure, if it occurred, would be likely to develop at rates which can be identified by monitoring. It is also likely that such an instability would not completely slide onto the floor and expose the surface shown

Uncertainty in design
Slope Stability 2013, Brisbane, Australia 525
in Figure 19, but is more likely to slump partially down, leaving a toe of failed material on the floor and exposing the backscarp.
If such an instability occurred, access could be re-established over it:
Initially, by dozing down material to redistribute weight from the top of the slip to the toe and provide some support to slow movement. Light vehicle access could be maintained via a temporary track.
When safe to do so, a fill ramp could be established over the slip material, using high quality fill, or reinforced constructed fill.
Depending on the buttress of waste material at or around the 600 RL needed to retain the fill ramp, a redesign of the slope below 600 RL may be required.
While the estimated FS for this design would not normally be accepted, it is greater than 1.0, and recovery from instability can be achieved.
Stability concerns in the west wall, and the north wall risk of down-slope extension of the Pineapple Ramp movement, could each be addressed by cutbacks.
A west wall cutback would provide room to position a large-fleet ramp west of the F12 Fault, and to effectively eliminate stability issues associated with that particular fault. However, the structural model in that area is also expected to be complex, and detailed modelling has not been carried out. A west wall cutback would require further drilling and geotechnical investigations, and may reveal further geotechnical issues that would also need to be addressed.
Cutback options for the west and north walls would cause delays in iron ore delivery and significant additional waste mining. For this reason, the investigation aimed to find design solutions that fit within the current SEP limits to avoid the cutback options.
The Large Fleet Design was recommended to RTIO’s management as the preferred option, with a west wall instability risk management and recovery strategy. The risk assessment indicated that the critical one million tonnes required for 2012 could be achieved by mining to 620 RL with lesser risks, and with the more significant risks deferred to later mining. Other options were ruled out, because:
The development fleet design has greater risks of ramp failure and slower mining progression.
The cutback option would cause significant delays and failure to achieve the one million tonnes required.
Initial recommendations indicate that depressurisation is required below 610 mRL. However, ongoing geotechnical slope performance (including hydrogeological) reconciliation will determine the extent and timing of required depressurisation.
RTIO’s SEP pit was identified as having significant geotechnical risks in the north wall (where movement had occurred), and in the west wall (where a fault threatened future ramp stability). Geotechnical assessments provided design options to manage and minimise risks, and provided risk and opportunity profiles for each design for the mine’s management to assess and determine their preferred risk exposure:
Slope performance in the north wall was identified as a hazard, and mining to the then-approved design was halted pending further investigation.

Iterative geotechnical pit slope design in a structurally complex setting: D.S. Lucas and P.J.H. de Graaf a case study from Tom Price, Western Australia
526 Slope Stability 2013, Brisbane, Australia
Geological and geotechnical investigations were carried out, and a new geological and structural model was produced.
Design options were assessed, to change the pit access from an initial south wall ramp, to an initial north wall ramp, to postpone mining to the critical final north wall shell.
A detailed geotechnical review then identified risks in the west wall, and potential instability of the ramp access via the west wall.
Design iterations and geotechnical assessments were carried out, and risks were assessed for each option.
The final design option was selected to minimise risks for the critical one million tonnes of ore required for the 2012 schedule, and to postpone risks for later mining below 620 RL, when the structural model can be updated from further exposures, and further geotechnical assessments can be carried out.
The authors acknowledge the efforts and assistance of RTIO’s Tom Price geotechnical, hydrogeology and structural geology teams for their efforts in collecting and processing data, particularly Leigh Nicholas, RTIO’s structural geologist, and Peter Croft, from Brockman Solutions, whose work in developing the structural model was an invaluable part of the design process. RTIO is also acknowledged for permission to publish this paper.
Blake, T.S. and Barley, M.E. (1992) Tectonic evolution of the Late Archaean to Early Proterozoic Mount Bruce Megasequence set, Western Australia, Tectonics, American Geophysical Union, Vol. 11(6), pp. 1415–1425.
Day, A.P. and Seery, J.M. (2007) Monitoring of a Large Wall Failure at Tom Price Iron Ore Mine, in Proceeding International Symposium on Rock Slope Stability in Open Pit Mining and Civil Engineering (Slope07), Y. Potvin (ed), 12–14 September 2007, Perth, Australia, Australian Centre for Geomechanics, Perth, pp. 333–340.
Harmsworth, R.A., Kneeshaw, M., Morris, R.C., Robinson, C.J. and Shrivastava, P.K. (1990) BIF-derived iron ores of the Hamersley Province, F.E. Hughes (ed), Geology of the Mineral Deposits of Australia and Papua New Guinea, Monograph 14, Australasian Institute of Mining and Metallurgy, pp. 617–642.
New, C.E.S., de Graaf, P.J.H. and Lucas, D. (2010) Applicability of the ‘observational method’ to manage slope depressurisation in a large open-cut mine, South East Prongs Pit, Tom Price, Western Australia, in Proceedings International Symposium on Rock Slope Stability in Open Pit Mining and Civil Engineering (Slope Stability 2011), 18–21 September 2011, Vancouver, Canada, Canadian Rock Mechanics Association, Canada, CD-rom only.
Rocscience Inc. (2013) SLIDE Version 6.0, 2D Limit Equilibrium Slope Stability Analysis Software, http://www.rocscience.com/ products/8/Slide.
RTIO (2010) Rio Tinto Iron Ore. SEP north wall geotechnical assessment of wall movement, unpublished, 21 May 2010. Taylor, D., Dalstra, H.J., Harding, A.E., Broadbent, G.C. and Barley, M.E. (2001) Genesis of high-grade hematite orebodies of the
Hamersley Province, Western Australia, Economic Geology, Society of Economic Geologists, Vol. 96, pp. 837–873. Trendall, A.F. and Blockley, J.G. (1970) The iron formations of the Precambrian Hamersley Group, Western Australia, with special
reference to the associated crocidolite, Geological Survey of Western Australia, Bulletin, Department of Mines and Petroleum, Vol. 119.