Embed Size (px)
Citation preview

DRY BULK FORWARD FREIGHT AGREEMENTS
SSY Futures Ltd are authorised and regulated by the Financial Conduct Authority.
The material contained herein is for information purposes only and should not be seen as a trading
recommendation or solicitation of trade.
JAN 2018

INTRODUCTION
JAN 2018

SIMPSON SPENCE YOUNG
• Established 1880
• Largest privately owned shipbroker in the world
• Worldwide network of 15 offices
• Represented on all major shipping committees & indices.
• Expertise in:-
Dry Cargo
Tankers
Futures
Research and Consultancy
Sale and Purchase
Agency and Towage
SSY Futures Ltd 30 Derivatives Brokers
In London, Singapore & NY
Team of 12 analysts on tanker & dry bulk
markets
JAN 2018 | 3

THE BALTIC INDICES
JAN 2018

THE BALTIC EXCHANGE
• The Baltic Exchange is the international membership
organization for the global shipping markets. Since
1985 it has been publishing Freight Indices
• Baltic Exchange Dry Index (BDI)
• Baltic Exchange Handysize Index (BHSI)
• Baltic Exchange Supramax Index (BSI)
• Baltic Exchange Panamax Index (BPI)
• Baltic Exchange Capesize Index (BCI)
JAN 2018 | 5

THE BALTIC PANELISTS
• The Baltic carries out annual
“audits” on independent ship
brokers.
• Companies who are doing
sufficient business fixing
individual routes and who
demonstrate competence are
invited to become Panelists.
• The Panelists make daily
professional assessments of
where routes should be priced.
• The Baltic oversee
assessments, publish results
and calculate averages.
JAN 2018 | 6

BALTIC INDICES ARE PRICED IN US$ PER DAY
(TIMECHARTER) OR FREIGHT RATES IN US$ PER
METRIC TONNE (VOYAGE)
• Time Charter:
• Panamax Route 2a: A voyage from Europe to the far
east priced in USD/Day.
• Voyage:
• Capesize Route 4: Richards Bay to Rotterdam, coal
route priced in USD/Mt.
The Baltic Index Council decide on which rates to report and the correct
specifications. They are an independent group of industry experts. Who
work with the Baltic’s Management and the Senior Freight Reporter.
JAN 2018 | 7

BALTIC TYPE VESSEL DESCRIPTIONS
Capesize 2014: Basis a Capesize 180,000mt dwt, not over 10 years of
age,198,000cbm grain max. Loa 290m,max.beam 45m, draft 17.75m, 14 knots
laden, 15.0 knots ballast on 62mts fuel oil or 12 knots laden, 13 knots ballast on
43mt, no diesel at sea.
Panamax: Basis a Panamax 74,000mt dwt, not over 12 years of age,
89,000cbm grain max. Loa 225m, max. draft 13.95m, 14.0knots 32/28 fuel oil
laden/ballast and no diesel at sea. Changing to Tess 82.
Supramax 58: 2018 Replacing Tess 52 Standard "Tess 58" type vessel with
grabs as follows: 58,328mt dwt on 12.80m SSW, 189.99m, beam 32.26m •
72,360cbm grain, 70,557cbm bale • 5 holds, 5 hatches • 4 x 30mt cranes with
12cbm grabs • 14 knots laden on 33mt fuel oil (380cst), no diesel at sea / 14
knots ballast on 32mt fuel oil (380cst), no diesel at sea. • 12 knots laden on 24mt
fuel oil (380cst) no diesel at sea / 12.5 knots ballast on 23mt fuel oil (380cst), no
diesel at sea
Handysize: Basis a 28,000mt dwt, self trimming single deck bulk carrier on
9.78mssw 169m LOA 27m beam. 5 ho/ha. 37,523 cum grain 35,762 cum bale 14
knots average laden/ballast on 22 mt ifo (380) no diesel at sea. 4 x 30mt cranes.
Maximum age 15 years. Changing to Imabari 38.
JAN 2018 | 8

BALTIC CAPESIZE 2014 TIME CHARTER AVERAGE
COMPONENT PARTS
Gib-Hamburg TA - 25%
Cont-Med/Far East - 25%
Pacific RV - 25%
China/Brazil Round Voyage – 12.5
China-Japan/Cont-Med – 12.5%
The Capesize Time Charter Average 2014 now includes the
China Brazil route to reflect the importance of this trade and the
relative decline of the so called backhaul.
JAN 2018 | 9

BALTIC SUPRAMAX “TESS 52”
TIME CHARTER AVERAGE COMPONENT PARTS
S1A – Antwerp/Skaw trip to Sing/Japan – 12.5%
S1B - Cannakale trip to Sing/Japan – 12.5%
S2 – SK/Japan to Aus or Pacific RV - 25%
S3 – SK/Japan to Skaw/Passero – 25%
S4A – US Gulf to Skaw/Passero – 12.5%
S4B – Skaw/Passero to US Gulf – 12.5%
JAN 2018 | 10

NEW BALTIC SUPRAMAX “TESS 58”
TIME CHARTER AVERAGE COMPONENT PARTS
JAN 2018 | 11
S1B_58 Canakkale trip via Med or Bl Sea to China-South Korea
S1C_58 US Gulf trip to China-south Japan
S2_58 North China one Australian or Pacific round voyage
S3_58 North China trip to West S4A_58 US Gulf trip to Skaw-Passero
S4A_58 US Gulf trip to Skaw-Passero
S4B_58 Skaw-Passero trip to US Gulf
S5_58 West Africa trip via east coast South America to north China
S8_58 South China trip via Indonesia to east coast
S9_58 West Africa trip via east coast South America to Skaw-Passero
S10_58 South China trip via Indonesia to south China

WHAT IS AN FFA?
JAN 2018

FFA DEFINITION
An FFA or Forward Freight Agreement is a contract for
differences on freight costs.
In just the same way that people buy commodity futures to
benefit from rising prices they can buy FFAs.
They can also Sell FFAs if they believe freight prices will fall.
FFAs always have a buyer and a seller - one will make
money at the settlement and the other will lose it.
It’s simple to trade an FFA instead of really participating in
the freight market.
No need to own a ship, employ operations staff, fill it with
crew, fuel, food, water etc etc.
JAN 2018 | 13

Cape Time Charter Average
FORWARD CURVE – 17th January 2018
JAN 2018 | 14

CAPE TC AVG SPOT AND FORWARD
PRICING BASIS 2017 YEAR END.
JAN 2018 | 15

ELEMENTS OF A TIMECHARTER AVERAGE FFA
• Buyer /Seller - freight exposure / market view
• Vessel Type - Cape, Panamax, Supramax, Handy
• Period - month / quarter / year
• Quantity - number of days
• Contract Price - level traded
• Clearing - EEX / NASDAQ / SGX
JAN 2018 | 16

FFAs CASH SETTLE
AGAINST THE AVERAGE DAILY PRICE PER MONTH
BUYER: Charterer
SELLER: Shipowner
TYPE: BCI TC AVG Q2 ‘18
RATE: USD 14,000
QUANTITY: 10 days per month
PERIOD: April, May, June ‘18
SETTLEMENT: Avg of all index Days
SETTLEMENT DATE: Last Day of each Month
Market Rises April settlement = $15,000 Sett Val = 15,000 – 14,000
X 10 Days = $10,000 BUYER PROFITS
Market Falls May settlement = $13,000 Sett Val = 13,000 – 14,000
X 10 Days = ($10,000) SELLER PROFITS
JAN 2018 | 17

OPPORTUNITIES FOR USING FFAs
• Time Charter and FFA.
Fix ships on long term time charter but buy/sell FFAs to switch
To a floating price if rates show signs of improvement.
• Spot Market and FFA.
Leave ships on the spot market but buy/sell FFAs to prevent
earnings from erosion if the market starts to move.
• Floating Rate Time Charter and FFA.
Fix a floating rate time charter and then buy/sell FFAs to lock in the rate
when rates are advantageous.
• Investment Strategy.
Use FFAs as an alternative to ship ownership. Employing capital to
hold FFA positions that profit from a strengthening shipping market.
• Portfolio Insurance.
Use FFAs to hedge a portfolio of shipping investments.
JAN 2018 | 18
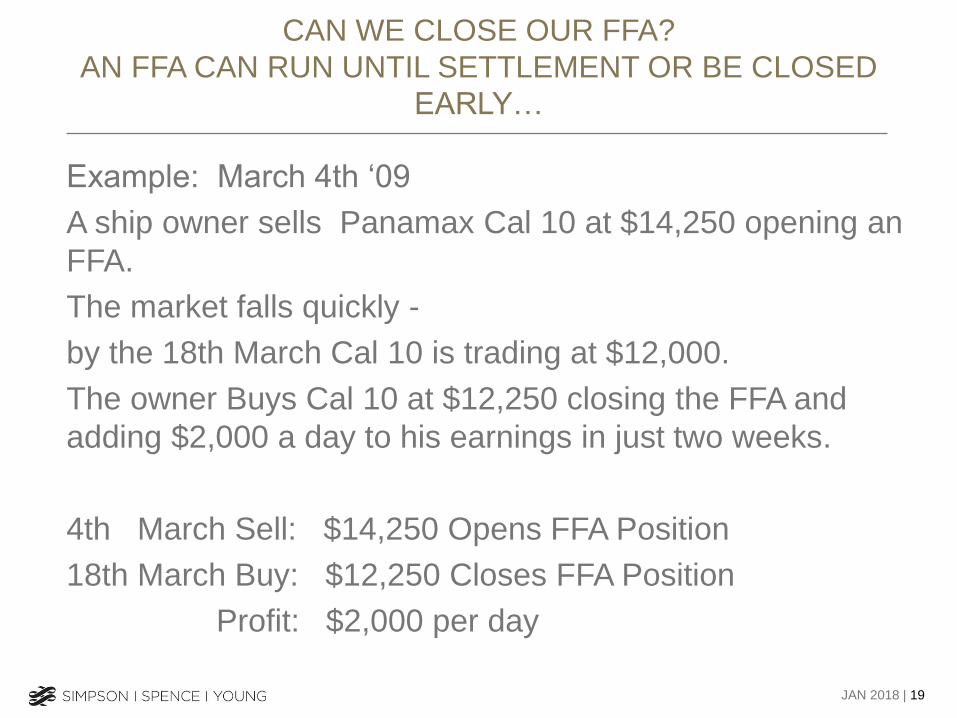
CAN WE CLOSE OUR FFA?
AN FFA CAN RUN UNTIL SETTLEMENT OR BE CLOSED
EARLY…
Example: March 4th ‘09
A ship owner sells Panamax Cal 10 at $14,250 opening an
FFA.
The market falls quickly -
by the 18th March Cal 10 is trading at $12,000.
The owner Buys Cal 10 at $12,250 closing the FFA and
adding $2,000 a day to his earnings in just two weeks.
4th March Sell: $14,250 Opens FFA Position
18th March Buy: $12,250 Closes FFA Position
Profit: $2,000 per day
JAN 2018 | 19

CLEARING
JAN 2018

TRADITIONALLY FFAs WERE TRANSACTED DIRECTLY
BETWEEN THE BUYER AND THE SELLER
Seller BUYER SELLER
JAN 2018 | 21

OTC BI-LATERAL TRADES EVENTUALLY LEAD TO
INCREASED COUNTERPARTY RISK AS TRADERS OPEN
AND CLOSE FFAs WITH MULTIPLE COUNTERPARTIES
JAN 2018 | 22
A
B
C
D
E
F G

COUNTERPARTY CREDIT RISK IS MITIGATED BY USING A
CENTRAL CLEARING COUNTERPARTY
Central Clearing
Counterparty
JAN 2018 | 23

CLEARING WITH BLOCK FUTURES
JAN 2018 | 24
BUYER
CENTRAL
CLEARING
COUNTERPARTY
CLEARING
BROKER
CLEARING
BROKER
SELLER EXECUTION
BROKER
EXCHANGE

THE COST OF CLEARING
CURRENT INDICATIVE SGX ASIACLEAR PRICING.
Clearing Example: Initial margin requirement.
Cape Q4 ‘18 position 10 days a month:
Front Month Margin $3300
Discounted Forward Margin for Q4
= $1430 X 30 days = $42,900
+/- Variation margin, marked to market each day.
JAN 2018 | 25
Indicative Initial Margins
Cape Avg 5 TC - $3300
Panamax Avg 4 TC - $1200
Supramax Avg 6 TC - $880
Handysize Avg 6 TC - $600
Initial Margin Rates are subject to change
without notice in volatile markets

BENEFITS OF CLEARING
• Virtual elimination of counterparty risk
• Netting of positions
• Efficient use of available margin
• Standardised contracts
• Daily profit or loss adjustment
• Increased liquidity
• Level playing field
• Regulated market
JAN 2018 | 26

ADDING VALUE
JAN 2018

Trading Strategies
Beyond the core broking service there are a number of strategies
brokers can assist with :
• Integrating FFAs in Physical Trading Strategies
• Inter-Market Spreads – i.e. Cape vs Panamax
• Time Spreads – i.e. Cape Cal16 vs Cape Cal 17
• Options Strategies
• Integrated FFA / Option Strategies
JAN 2018 | 28

FFA MARKET VOLUMES
JAN 2018

DRY FFAs – HOW DO THE VOLUMES STACK UP? Quarterly Volume
JAN 2018 | 30

CURRENT APPROX. MARKET SHARE BY OPEN
INTEREST
JAN 2018 | 31

FFA Use by Region and Company Type
JAN 2018 | 32

CONCLUSIONS
• The Baltic Exchange remains the preferred freight index provider
• The FFA Markets remain focused on Dry Bulk Markets
• Time Charter Average Contracts are the preferred Contracts
• The large vessel sizes are more liquid
• The program of vessel reviews continues
• Volume growth appears set to increase
• Growth is likely to be focused in the Pacific region
JAN 2018 | 33