Embed Size (px)
Citation preview

www.druid.dk
DRUID Working Paper No. 08-13
Technological Discontinuities and the Comparative Strategic Value of New Capabilities: Evidence from the Comparison of Small-
and Large-Molecule Targeted Anti-Cancer Drug Discovery
By
M. Lourdes Sosa
brought to you by COREView metadata, citation and similar papers at core.ac.uk
provided by Research Papers in Economics

www.druid.dk
Technological Discontinuities and the Comparative Strategic Value of New Capabilities: Evidence from the Comparison of Small-
and Large-Molecule Targeted Anti-Cancer Drug Discovery
M. Lourdes Sosa London Business School
Strategic and International Management Sussex Place, Regent’s Park
London NW1 4SA E-mail: [email protected]
Revised August 28, 2008 Abstract: Traditional creative destruction theories distinguish disruptions as competence-destroying or competence-enhancing to incumbents’ capabilities, with the former case resulting in incumbents’ loss of competitive advantage in in-house R&D performance (even if complementary assets aid in retaining final market share). In this paper, I propose that attention to the extent of competence destruction is necessary but not sufficient for analyses of competitive advantage in R&D through a technological discontinuity. A full analysis requires the comparison of the value added and ease of access (i.e., strategic value) of all capabilities, old and new. In other words, an analysis of competition during a transition requires assessment not only of how many of the old capabilities were lost but also what it takes to acquire the new ones. I find evidence for this proposition in qualitative and quantitative data from the transition of anti-cancer drug discovery from standard chemotherapy to targeted therapies. Among targeted therapies, I compare two variants, small- vs. large-molecule drugs, which though equally competence-destroying to chemotherapy-based drug discovery, differ in that large-molecule drugs require one more new capability: expertise in biopharmaceutical technology. By tracing the origin and evolution of biopharmaceutical technology, as well as its comparative value added, I can show a contrast in results: incumbents led in small-molecule targeted drug discovery; but they fell behind biopharmaceutical technology pioneers in large-molecule targeted drug discovery, where one of the new capabilities (i.e., expertise in biopharmaceutical technology) had higher value added and was more difficult to acquire than other new capabilities. Keywords: R&D capabilities; incumbents; technological disruption; competence enhancing; competence destroying
ISBN 978- 87-7873-267-5

www.druid.dk
Acknowledgements: I thank Tom Allen, Roberto Fernandez, Tony Sinskey, Jesper Sørensen and Jim Utterback for their support and insight. I am also thankful for valuable comments from Lisa Cohen, Michael Jacobides, Brandon Lee, Margaret Kyle, Anita McGahan, Isabel Fernández-Mateo, Woody Powell and Phanish Puranam in previous drafts of this paper. Detailed feedback from participants at various conferences is also gratefully acknowledged. I offer gratitude and appreciation to Kathleen Cui, Zuzana Grygarova, Daniel Malconian, Manisha Manmohan, Lili Peng, Divya Titus and Sharon Zhang for meticulous research assistance in different phases of this project.

3
_________________________________________________________________________________
1. Introduction
Research on creative destruction has traditionally distinguished technological disruptions that are
competence-enhancing from those that are competence-destroying to the capabilities1 that incumbents had
mastered (Tushman and Anderson, 1986). According to this classic research, when a technological
change is competence-enhancing, the disruption will not affect the value of the capabilities already
present within the research and development (R&D) process of incumbent firms. Therefore, those
capabilities will be available for re-use by incumbents during the next technological regime of the market.
Since some of these capabilities must have exhibited an isolating mechanism (Rumelt, 1987) in order for
their owning firms to have survived so far,2 such as unavailable trade in the open market (Teece, 1980;
Kogut and Zander, 1992) or the presence of time compression diseconomies in the accumulation of
research know-how (Diericks and Cool, 1989), incumbents will retain a competitive advantage above
entrant firms through a competence-enhancing discontinuity.
In contrast, when a technological change is competence-destroying, the disruption obsoletes the value
of the capabilities involved in the R&D process within the value chain of incumbents. Incumbents will
therefore lose their source of competitive advantage in R&D and be forced to start from scratch. In the
presence of organizational inertia, incumbents will incur an additional disadvantage through two main
mechanisms: underinvestment and incompetence (Henderson, 1993). That is, incumbents will tend to
invest less in the new technology, and controlling for their investment will also be less productive in the
R&D of products under the new technology, as compared to the set of firms entering the market.
Incumbents will only retain their leadership in market share in spite of their loss in R&D productivity if
their complementary assets retain their value and remain inaccessible to entrants (Teece, 1986; Tripsas,
1997).
1 For convenience, throughout this paper I refer to resources and capabilities simply as capabilities. I also use the terms “capabilities” and “competencies” interchangeably following the definitions in Amit and Schoemaker (1997). 2 Incumbents are the leaders, evolutionarily selected from all firms that ever competed in the focal market during the prior technological regime.

4
As can be seen, according to current theory, the key variable in the analysis of the competitive
dynamics of R&D through a transition into a radically new technology is the degree of loss of value in
these firms’ prior capabilities (i.e., the degree of competence destruction).
In this paper, I argue that understanding the impact that the technological change has on the value of
incumbents’ prior capabilities (i.e., the extent of competence destruction) is necessary but not sufficient
for the analysis of R&D competitive dynamics through a technological discontinuity. It is also necessary
to understand the characteristics of the new capabilities required, in particular in terms of comparative
value added and comparative ease of access for the different firms in competition (i.e., in terms of
comparative strategic value [Barney, 1991]). If incumbents lose their prior sources of competitive
advantage in R&D, but the new capabilities are easily accessible to them, entrants should not accrue an
advantage over incumbents. Or if the new capabilities with the highest value added are easily acquired
and those with the lowest value added are the only ones difficult to acquire for incumbents, then entrants’
competitive advantage will be slim. Indeed, the point of interest becomes the assessment of comparative
strategic value of the full set of capabilities (old and new) available to different groups of firms to execute
the steps of the value chain required to generate new products in the focal market.
In light of this proposition, and based on a combination of qualitative and quantitative methodologies, I
present a study of the anti-cancer drug market and its transition from standard chemotherapy (i.e.,
cytotoxic drugs) into targeted therapies (i.e., targeted drugs). This technological discontinuity is a
consequence of the biotechnology revolution and has been characterized as competence-destroying to the
steps of R&D termed “drug discovery” (Rang, 2006),3 which are therefore the sole focus of this study.
Within this competence-destroying change, I identify two separate variants of the new technology: small-
and large-molecule targeted anti-cancer drugs. Both variants require new capabilities in drug discovery,
but large-molecule targeted drugs require one additional capability: biopharmaceutical technology. By
tracing the origin and evolution of this additional capability, I show that, in contrast to other newly
3 The technological change is, in contrast, competence-enhancing to the later steps of the R&D termed “clinical trials.”

5
required capabilities, this capability was not easily accessible to incumbents. Furthermore, recent
research (Sosa, 2008a) has shown that in targeted anti-cancer drug discovery, in spite of the competence
destruction of prior technological platforms mastered by incumbents, the knowledge of the indication
(i.e., long-term oncology research), has retained significant strategic value and sustained these firms’
competitive advantage in R&D. As a result, I can show the following contrast.
In the transition from cytotoxic to small-molecule targeted drug discovery, the disruption dynamics
were as follows: all old capabilities lost their value except for one (long-term oncology research), and
new capabilities were easy to access. As a result, incumbents retained leadership in their in-house R&D
performance of small-molecule targeted drug discovery.
In contrast, in the transition from cytotoxic to large-molecule targeted drug discovery, the disruption
dynamics were as follows: again all old capabilities lost their value except for one (long-term oncology
research), and new capabilities were easy to access except for one (biopharmaceutical technology). This
last exception led to the contrasting result. Because biopharmaceutical technology had higher value
added than long-term oncology research and because biopharmaceutical technology had accrued to a sub-
set of diversifying entrants (biopharmaceutical technology pioneers) and was difficult to acquire by
follower firms, incumbents were not the absolute leaders in the in-house R&D performance of large-
molecule targeted drug discovery. Nonetheless, incumbents fell behind only the specific group of
entrants that were biopharmaceutical technology pioneers, still outperforming all other entrants.
The evidence in this paper thus supports my proposition that there is a need to move attention within
studies of R&D competition through a technological discontinuity beyond the competence destruction of
incumbents’ old capabilities, and into the analysis of the comparative strategic value of all capabilities,
old and new, available to the different sets of firms in competition. The remainder of this paper advances
as follows: section two elaborates on the theoretical proposition presented in this paper; section three
explains the data collection, both qualitative and quantitative; section four presents the qualitative
evidence to show that biopharmaceutical technology was a value-adding capability with restricted access
for incumbents, and that this aspect of the capability made incumbents fall behind biopharmaceutical

6
technology pioneers both in subsequent innovations in this capability and in its subsequent application in
large-molecule anti-cancer drug discovery; section five concludes with implications for theory.
2. Old Competence Destruction and New Competence Access: A Dynamic Representation of the
Resource-Based View of the Firm
Although several interrelated taxonomies have been developed to characterize the impact of a
technological change on a seemingly stable market, ranging from the effect on the product and
organizational architecture (Henderson and Clark, 1990) to the industry architecture (Abernathy and
Clark, 1985), the analysis of competitive advantage focuses largely on the distinction between
competence enhancement and competence destruction (Tushman and Anderson, 1986). Within this
categorization, a technological change can either disrupt the value of the capabilities that market
incumbents had mastered within their value chains (i.e., competence destruction), or it can leave such
value undisrupted and readily available for re-use (i.e., competence enhancement). Much attention has
been given to the former category because the prediction is then that incumbents will underperform in the
in-house R&D of products under the new technological regime. However, a competence-destroying
technological change disrupts the value of the capabilities that incumbents had mastered precisely
because it makes available a new set of capabilities with significantly improved performance within the
steps of the value chain where they are put to use. After all, what competence destruction implies is not
that a capability has been lost from the value chain of an incumbent firm in the sense that the literature on
asset erosion suggests (Dierickx and Cool, 1989). Competence destruction does not imply a loss of
“skill” but rather a change in the comparative value added provided by that “skill” for its owning firm.
That is, when a competence-destroying technological change takes place, a new set of capabilities for the
same value chain becomes available (now based on a new scientific foundation), and in comparison, the
value added of the old capabilities is now relatively lower. In theory, if one could price the old
capabilities in the open market (and often managers cannot), these capabilities would now accrue a
smaller price than they would have in the state of the world when the new capabilities did not exist yet.
For example, consider what the value of having a manual loom is for a textile mill before and after a

7
power loom is available in the strategic factor market for looms (Barney, 1986).4 Although the manual
loom continues to add value in the value chain of a textile mill even once a power loom is available for
purchase, the value this manual loom adds to the textile mill is comparatively lower than what a power
loom can now provide in terms of helping the textile mill outperform its competitors in the market for
fabric. Both looms remain feasible options as resources for the textile mill. However, if the manual loom
is significantly slower than the power loom within the mill’s value chain, and if speed is a key factor for
the mill’s competitive performance, the “electrification” revolution (i.e., the transition from manual to
power looms) will have imposed competence-destruction on the textile mill’s traditional value chain by
depreciating the value that its traditional manual loom could convey for competition in the market for
fabric.
In other words, during a technological discontinuity, some steps of the value chain required to operate
within the focal market are faced with more than one version of each capability available for use. During
the period of technological discontinuity, and until the turmoil subsides, capabilities based on the old
technological paradigm and capabilities based on the new technological paradigm are both feasible
options to be used by firms in competition (see Figure 1). Which option of capabilities represents the best
choice for each firm in competition to use in its value chain depends on the comparative strategic value
that each capability conveys.
Insert Figure 1
I therefore propose in this paper that the analysis of the central dynamics of a competence-destroying
technological discontinuity should center on an understanding of the available capabilities (old and new),
their comparative value (which will factor in the cost of acquisition), and the relative access that different
groups of firms in competition (including incumbents) have to them.
4 I refer to the strategic factor market as the market for looms, where the textile mill is a buyer, as opposed to the product market for fabric, where the textile mill is a seller.

8
3. Method
3.1 The Setting and the Technological Discontinuity
The setting for this case study is the market for anti-cancer drugs and its transition from cytotoxic agents
(i.e., standard chemotherapy) to the radically new category termed targeted drugs, a transition brought
about by the biotechnology revolution. Studies have shown that this transition in anti-cancer drugs has
been (and continues to be) a radical and competence-destroying change to the preclinical phase of R&D
in this market, usually referred to as “drug discovery” (Rang, 2006; Capdeville, et al., 2002), a description
that is consistent with that made of biotechnology’s impact at the industry level (e.g., Henderson,
Orsenigo, and Pisano, 1999; Rothaermel, 2001). Interview data collected support this characterization.
As described in interview material, targeted anti-cancer drug development comprises two main variants:
small-molecule and large-molecule drugs. Although both variants of targeted anti-cancer drugs are
radically different from cytotoxic drug discovery in that targeted drugs are developed through a “science-
driven” approach, among the capabilities new to incumbents, only large-molecule targeted drugs require
the capability I refer to as “biopharmaceutical technology.” It is within this distinction that I could
compare two variants of a technological change with the same attributes (i.e., radical, competence-
destroying, and sustaining5) that differ only in the access that incumbents had to one of the newly required
capabilities.
The capability of interest, biopharmaceutical technology, represents not one invention but a stream of
innovations through a particular technological trajectory (Dosi, 1982). In that sense, it represents what
5 A sustaining technological change is one where the dimensions of merit preferred by consumers (i.e., customer preferences) do not change, in contrast to disruptive technological changes where these dimensions do change (Christensen, 1997). In order to isolate the dynamics of competence destruction, I need to choose a radical, competence-destroying change that is sustaining in customer preferences, along the lines of prior cases in the literature (Henderson, 1993, 1995). According to data by the American Cancer Society (2000), the anti-cancer drug market was, during the years under study (i.e., up to 2004), far from satiation (i.e., far from saturation on the part of consumers) on the levels of efficacy and safety, the main dimensions of merit considered in an anti-cancer drug by consumers. Indeed, the 5-year survival rate had changed from 50% in the years 1974-1976, to 51% in the years 1980-1982, to 59% in the years 1989-1995, a trend that proves the market in general was far from satiation, even though the difference in rates between 1974-1976 and 1989-1995 is statistically significant (p<0.05). Customer preferences were clearly the maximization of efficacy and safety, with ample room for improvement in those dimensions by any firm in competition, making this a radical change that was sustaining in customer preferences. Available patient accounts (e.g., Bazell, 1998) support this point as well.

9
strategy researchers refer to as a first-order dynamic capability or an R&D capability (Teece, Pisano and
Shuen, 1997; Winter, 2003). The capability is not a single asset that is stable over time, to which firms
would pursue access at a single point in time. This R&D capability instead comprises a series of
innovations that are path-dependent and whose definition is time-variant (Eisenhardt and Martin, 2000).
That is, the relevant innovations to which an organization required access in order to use this capability
for the competitive advantage it conferred changed over time and therefore required sustained investment
in it. For example, although in the mid-1970s a high level of expertise in biopharmaceutical technology
involved being able to re-engineer E.Coli bacteria to mass-produce a protein, by the mid-1980s a high
level of expertise in biopharmaceutical technology required proficiency in mammalian cell culture.
Therefore, although many firms achieved access to a one-time license on the original recombinant DNA
technological innovation (Feldman, 2003), this step was not sufficient to have access to the full range of
innovations and know-how that comprised the underlying dynamic capability I refer to as
biopharmaceutical technology (see, for example, Nature, 2007, for a sub-set of innovations generated
after the original recombinant DNA invention).
For the empirical design of the present study, it is important not only that biopharmaceutical technology
as a capability was dynamic (so that a single spot-transaction would not grant long-term access) and
coincided with other newly required capabilities in entailing time compression diseconomies and low
levels of tradeability, but also that biopharmaceutical technology had one distinctive feature that
differentiated its origin and evolution: the increasing number of markets to which the capability became
applicable over time (i.e., its decreasing market specificity [Montgomery and Wernerfelt, 1988]).
3.2 Data Sources and Measures
I organize the analysis in this study in two parts. Part one is the qualitative portion, where I offer
evidence that biopharmaceutical technology evolved with increasing market coverage and that as a result
anti-cancer drug market incumbents were unable to recognize in time that this capability was also
required in anti-cancer drug discovery (albeit only for the sub-set of drugs that were large-molecule). Part
two is the quantitative portion of the study. I first assess the impact that the delay in start of investment in

10
biopharmaceutical technology had on incumbents’ subsequent performance in this R&D capability, a
representative case of the dynamics described by Cohen and Levinthal (1990:136) as being “locked out”
of a technology due to late investment. This step therefore tests the fact that this new capability had
restricted access for anti-cancer drug market incumbents. Indeed, it was the sub-set of diversifying
entrants that had pioneered biopharmaceutical technology who retained leadership in the performance of
this capability in the longer term. As a second step, I assess the impact of the lack of access to the
biopharmaceutical technology capability on the part of incumbents on their competitive advantage in the
performance of drug discovery in anti-cancer drugs. I then show that the competitive advantage in the
capability for biopharmaceutical technology that accrued to the sub-set of diversifying entrants who
pioneered this technology translated into a competitive advantage for these same firms in the drug
discovery of large- but not small-molecule targeted anti-cancer drugs. Finally, I replace the dummy
variables identifying the different groups of firms with a direct, continuous measure of the two most
valuable capabilities in targeted anti-cancer drug discovery: long-term oncology research, an undestroyed
capability that being market-specific remained available only to incumbents; and expertise in
biopharmaceutical technology, a new capability that requiring development over long time periods
remained available only to its pioneers. I can then show that the latter carried higher value than the
former capability in the case of large-molecule drugs, reinforcing therefore the evidence for the
mechanism behind the differences in R&D performance within drug discovery across the two variants of
targeted drugs.
I present data sources and measures for both the qualitative and quantitative parts of the study next.
3.2.1 Qualitative Analysis
I collected data through 45 interviews ranging between 30 and 90 minutes each, with an evolving semi-
structured interview guide. Interviewees included R&D managers in large and small pharmaceutical
firms (including R&D executives of three of the eight incumbent firms in the sample), industry analysts,
and scientists both from industry and from academia. I complemented that data with historical material
from Walsh’s (2003) report of large-molecule drug development, customized searches in the PubMed

11
database for historical background on specific drugs, and data from PJB Publications’ Pharmaprojects for
selected information on the introduction of drugs into clinical trials.
3.2.2 Quantitative Analysis
For part two of the study, I looked into the possible impact of the delay of start of investment in
biopharmaceutical technology on the performance of incumbents and different groups of entrants, both on
their subsequent ability to innovate in this technology and on their ability to use it in anti-cancer drug
discovery. I explain next the sample and variables used for these purposes.
Sample. To construct the sample of firms, I started by identifying all anti-cancer drugs in clinical trials
in the period 1989-2004 through PJB Publications’ database Pharmaprojects and then focused on the
firms responsible for them. In order to generate a sample that included firms with a clear intention to
compete in the anti-cancer drug market, I matched the firms from Pharmaprojects to the firms reported in
all available Pharmaceutical Research and Manufacturers of America (PhRMA) surveys New Medicines
in Development for Cancer (administered in 1988 and every two years from 1989 to 2003). After
excluding non-profit organizations, matching all cases to parent company names only, and adjusting for
mergers and acquisitions and missing data, I identified the final sample, which comprises 165 firms
(further details of the sampling frame is given in Sosa, 2005, 2006).
Dependent Variables. In order to avoid the “tautology problem,” I performed separate tests on the
impact of differences in time of start of investment in biopharmaceutical technology, first on the long-
term performance in the capability itself, and second on the performance in the discovery of the sub-set of
anti-cancer drugs that are large-molecule. I explain next these two dependent variables.
Performance in researching biopharmaceutical technology (i.e., sustained advantage in the R&D
capability). I estimated competence in this R&D capability by measuring over time the rate of production
of patented innovations in this area, as reported in Thomson Scientific’s Derwent World Patent Index
(DWPI). This database is constructed around innovations, not patents. Therefore, each record represents
a unique innovation that matches to several patents, as catalogued by expert librarians. I asked an expert
interviewee to perform the selection of relevant codes from the DWPI catalog. The resulting set of four

12
specific DWPI manual codes paired with the 165 firms in the sample generated a dataset of 1,375
patented innovations. Based on these data, I then analyzed the rate of production of patented innovations
through a Cox model with repeated events following the design used previously in the management
literature (Sørensen and Stuart, 2000). To do this, I used the earliest date of priority filing for the patented
innovation as the time when the event took place. I considered the start of the time at risk for each firm’s
first patented innovation to be either January 1st of the first year in the dataset or of the year of founding
for the firm, whichever was latest. Time at risk for all subsequent cases was set to start the day
immediately after the previous event occurrence. To avoid selection bias, I included in the Cox
regression all 165 firms, including those who never generated a patented innovation in biopharmaceutical
technology (in which case, the firm’s only spell appeared as right-censored).6
Performance in Targeted Anti-Cancer Drug Discovery (i.e., advantage in R&D performance in one
market: anti-cancer drugs; in the step of R&D that experienced competence destruction: drug discovery).
In order to test for differences in competence in targeted anti-cancer drug discovery as this R&D step was
disrupted by a competence-destroying technological change, I constructed a dependent variable that
measured R&D performance at the stage in the value chain of a firm in this market where competence
destruction had taken place, namely drug discovery (see Figure 2).
Insert Figure 2
I identified the set of drug molecules that each of the firms in the sample patented (a step executed
during drug discovery, likely towards the end of this step), regardless of whether the originating firms
decided to enter them into clinical trials or not. To do this, I again used the DWPI database, this time
identifying the code for anti-cancer drugs, which has been available since 1994. Just like the patented
innovations in biopharmaceutical technology, the patented molecules in this section are each a stand-
6 As a robustness check I counted the total number of forward citations that the set of patents tied to each innovation generated. I incorporated this measure in Cox regressions as frequency weights, that is, by duplicating records by as many forward citations as the patents tied to the innovation had. This implies that this second set of regressions predicts the rate of production of forward citations in biopharmaceutical technology, controlling for the number of different patents applied for per innovation (analyses are available in Tables A.1 and A.2 in Appendix A).

13
alone innovation that can correspond to an array of patents, all catalogued under the same molecule by an
expert librarian.7 The resulting dataset had 19,106 patented anti-cancer drug molecules, of which 9,037
are targeted therapies (3,672 are small-molecule and 5,365 are large-molecule targeted drugs). Just as
with patented innovations in biopharmaceutical technology, I based the analysis on a Cox model with
repeated events, this time setting the start at risk at the time of first entry into this market by each firm.
Therefore, the regression evaluates the rate of production of molecules but instead of assigning a discount
on performance due to late entry, leaves the time of entry as strategic for the firm and evaluates instead
their sustained productivity after they finally enter (so that if a firm decides to enter late but still achieves
high productivity, it will generate higher coefficients).
Independent Variables. The principal interest was to distinguish whether performance advantages
accrued to some categories of firms in particular, and whether there was a difference between the two
variants of the new technology that stemmed from the use of biopharmaceutical technology. Therefore,
the following binary variables were of primary importance.
Small- vs. Large-Molecule Targeted Drugs. I classified targeted anti-cancer drugs as large- vs. small-
molecule drugs through the sub-categories (e.g., interferons, interleukins) available in their classification
within the DWPI catalogue. The correspondence of sub-categories of technologies (e.g., interferons) to
the appropriate broader technological variant within anti-cancer drugs (e.g., interferons corresponding to a
type of large-molecule targeted drug) was based on the information that interviewees had provided.
Firm Categories. I distinguished among incumbents, diversifying and de novo entrants based on
whether a firm had been present in the anti-cancer drug market prior to 1983 (the start of the
biotechnology revolution in that market); in which case it was an incumbent. In contrast, if the firm was
not an incumbent but an entrant, I determined whether it had been operating in any market prior to its
incursion into anti-cancer drug R&D; in which case the firm was a diversifying entrant. If the firm had no
organizational pre-history, it was a de novo firm. Further details are available in Sosa (2005, 2006).
7 As a robustness check, I repeated analyses with a different dependent variable: advancement of drugs through clinical trials based on the information available in the Pharmaprojects database. All results were qualitatively the same (see Appendix A, Tables A.3 – A.6).

14
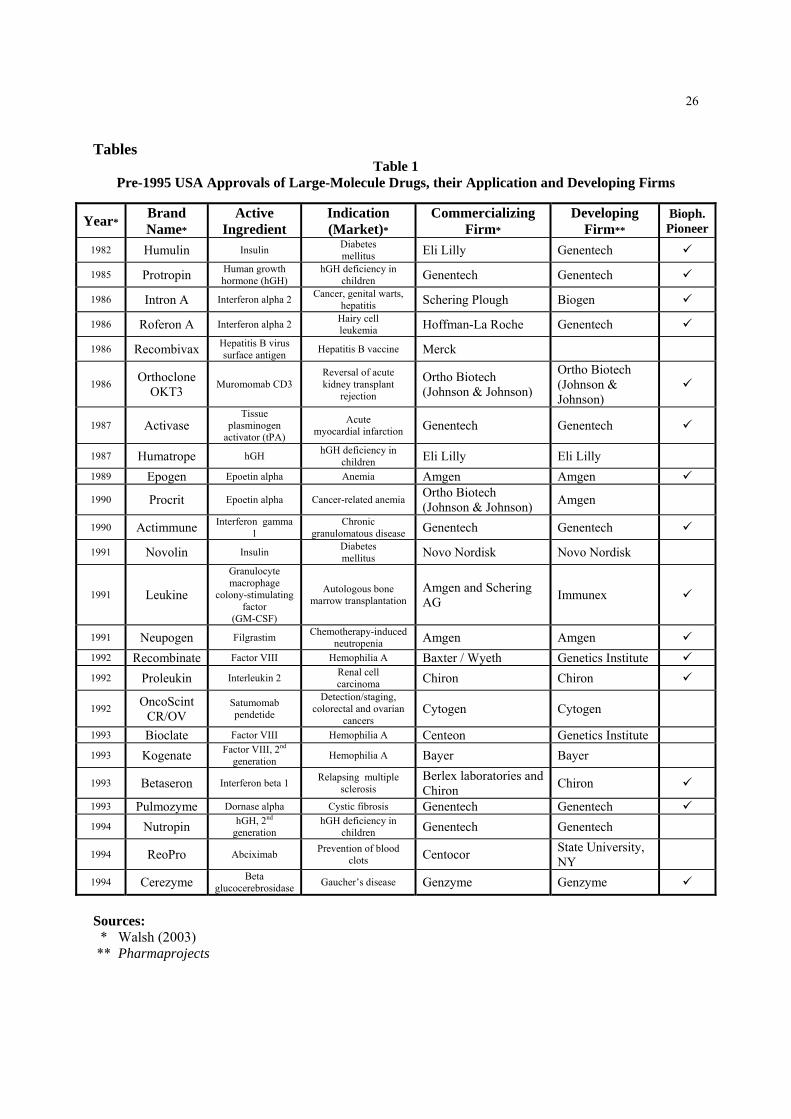
Biopharmaceutical Technology Pioneers. As I will explain, the evolutionary path of biopharmaceutical
technology did lead to differences in the timing of start of investment across firms. Because the anti-
cancer drug market is one of the last markets to which biopharmaceutical technology (and its resulting
large-molecule variant of drugs) became applicable, I took the date that large-molecule drugs entered
clinical trials with a clear anti-cancer application, namely 1995 (Colwell, 2002), which coincides with the
start of the DWPI code for anti-cancer drug molecules as well, as the cut-off date to identify
biopharmaceutical technology pioneers. I then used Walsh’s (2003) report to identify all large-molecule
drugs approved up to 1994 irrespective of market application, and then combined that information with
information from Pharmaprojects to pinpoint the developing firms for those large-molecule drugs. I
therefore classified as a biopharmaceutical technology pioneer a firm that had a large-molecule drug that
(1) had been developed in-house, (2) had been approved in 1994 or before (irrespective of market
application), and (3) was the first one in its active ingredient.8 The identification of these
biopharmaceutical technology pioneering firms is shown in Table 1.
Insert Table 1
This classification implies a sub-division of the larger firm categories (namely, incumbent, diversifying
and de novo firms). Although none of the anti-cancer market incumbents were biopharmaceutical
technology pioneers, one of the de novo entrants and four of the diversifying entrants into the anti-cancer
drug market were biopharmaceutical technology pioneers. As such, in statistical analyses, I tested the
hypothesis that biopharmaceutical technology pioneers accrued a competitive advantage in large- but not
small-molecule anti-cancer targeted drugs through two separate tests. The first is to replace the original
three firm categories (i.e., incumbent, diversifying and de novo firms competing in the anti-cancer drug
8 Unlike small-molecule drugs, which can only reach the market with a unique active ingredient, large-molecule drugs that represent a protein that exists in the human body (precisely those that were launched prior to 1994) can reach the market even if their active ingredient is already present in another large-molecule drug available in the market. This is because a protein that exists naturally in the human body cannot be patented as a molecule (i.e., there is no patent protection for the active ingredient). The only patent protection available is for the manufacturing method for it, which remains unique even in the case of large-molecule drugs that share the same active ingredient.

15
market) with four firm categories: biopharmaceutical technology pioneers, incumbents, diversifying
entrants that are not biopharmaceutical technology pioneers, and de novo entrants that are not
biopharmaceutical technology pioneers (see Table 2 for the intersections of these four firm categories
with the previous three identified). The second operationalization of the test to see if biopharmaceutical
technology pioneers accrued an advantage in large-molecule targeted anti-cancer drugs was based on the
two continuous measurements of their firm-level capabilities, as described next.
Insert Table 2
Oncology Research prior to 1983 (i.e., long-term oncology researc). As in prior research (Sosa,
2008a), I created the variable “oncology research prior to 1983” to equal the cumulative number of
publications in the field of oncology as available in the Web of Science database from 1972 to 1982, a
year before the start of the disruption that biotechnology imposes on the anti-cancer drug market.
Capability for Biopharmaceutical Technology. To assess the individual level of this capability that
accrued to each firm in the sample, I generated the equivalent to fixed effects (i.e., firm-specific
dummies) in the Cox regression assessing competitive advantage in biopharmaceutical technology (i.e.,
the analysis of the rate of production of patented innovations in biopharmaceutical technology). I then
used the firm-specific hazard rates from this Cox regression as an independent variable in the Cox
regression predicting the rate of production of patented anti-cancer molecules.
Control Variables. In all analyses using Cox regressions, I controlled for the cumulative introduction
of patented biopharmaceutical technology innovations or patented anti-cancer drug molecules,
respectively. In the analysis of patented anti-cancer drug molecules I also included “gene therapy,” a
dummy variable singling out molecules that are gene therapy derivatives since current research has shown
the differing level of risk in this modality separates it from the rest of biotechnology (Sosa, 2008b).
4. Analysis and Results
4.1 The Origin and Evolution of Biopharmaceutical Technology

16
According to interviewees and the supporting archival sources abovementioned, biopharmaceutical
technology has made possible the mass-production of one variant of biotechnology-based drugs: large-
molecule drugs. Interviewees consistently reported that biopharmaceutical technology not only made
large-molecule drugs economically available for the first time but also, as I explain next, that their
evolution advanced through three stages with increasing market coverage. Indeed, in a recent article in
the natural sciences, Leader, Baca and Golan (2008) argue for the distinction of these three classes.9
Biopharmaceutical technology was first developed to mass-produce proteins (i.e., large-molecule drugs)
that not only occurred naturally in the human body but also whose use in disease treatment had already
been established. Indeed, the first applications of large-molecule drugs spanned only diseases that
represented protein deficiencies. This set of diseases comprises stage I in the evolution of the market
specificity of biopharmaceutical technology.
A representative case in the application of biopharmaceutical technology during stage I of its evolution
is that of insulin. Insulin’s principal therapeutic value is the treatment of diabetes mellitus, a disease in
which patients lack natural insulin production and where artificially supplying the protein restores health
to the patient. The enzyme has been researched under the name “insulin” since at least 1909, and by 1922
researchers at the University of Toronto had isolated the enzyme and proved its effectiveness in
regulating sugar metabolism (Rosenfeld, 2002). By 1976 when Genentech successfully applied for the
first time biopharmaceutical technology to the production of a drug (to be commercialized by Eli Lilly
and Co. [Christensen, 1996]), the enzyme had been in commercial production by semi-synthetic processes
since 1923 (when Eli Lilly and Co. achieved successful yield and standardization of the first mass-
production method). By 1976 therefore, both the molecule for insulin and its therapeutic connection to
diabetes mellitus were public knowledge.
It was not until later, as biopharmaceutical technology evolved, that other known proteins for which no
connection to disease treatment was known began to be researched in-depth. This then is stage II of the
9 The authors propose an additional fourth class for the use of large-molecule drugs in diagnostics, but this application falls out of the scope of the current paper.

17
evolution of biopharmaceutical technology’s market coverage. A case in point is that of erythropoietin,
commonly referred to as Epo, a protein today commercially available as Amgen’s best-selling large-
molecule drug for anemia treatment, Epogen®. According to scientist J.W. Fisher’s (1998) own account
of his and others’ breakthrough research in “the quest for erythropoietin,” one of the most important
academic papers confirming the existence of Epo was published in 1950; however,
“until the gene for Epo was cloned by Lin et al. [1985] at Amgen and Jacobs et al. [1985], Epo
was [erroneously] thought to be produced in the glomerular epithelial cells. The ability to
clone made it possible [to determine Epo’s appropriate source and therapeutic value]” (p. 10).
As biopharmaceutical technology developed, the therapeutic potential of large-molecule drugs grew in
relevance. Ultimately a class of large-molecule drugs of laboratory-based design emerged. This new
product class comprises stage III in the evolution of this R&D capability’s market coverage. This stage
includes markets with higher profitability prospects (e.g., anti-cancer drugs). An example is Herceptin®,
the new targeted anti-cancer large-molecule drug designed by Genentech that targets Her2-expressing
breast cancers (Bazell, 1998).
Interviewees coincided in their descriptions of the historical progression of the R&D of large-molecule
drugs in the three stages described above: (I) a class of known proteins with known connections to disease
treatment (e.g., insulin); (II) a class of known proteins with unknown connections to disease treatment
(e.g., Epo); and (III) a newly born class of engineered proteins (e.g., Herceptin®). Therefore, sub-types
of large-molecule drugs available in the market can be classified into the three sub-classes defined by the
three stages of evolution of biopharmaceutical technology (see Table 3). For illustration purposes I
constructed Figure 3 (below) based on these three sub-classes and the list of all large-molecule drugs
(irrespective of indication) approved in the USA up to 2003 as reported in Walsh (2003).
Insert Table 3
Insert Figure 3

18
Because each disease treatment is, in rough terms, a stand-alone market,10 what this progression of
applicability to ever more diseases represents for biopharmaceutical technology as a capability is an
expansion on market coverage (see Figure 4). This temporal difference in market coverage (or its
opposite index, market specificity) led to temporal differences in the start of investment in
biopharmaceutical technology for some firms, among them, precisely the eight firms that constituted the
group of incumbents in the largest market within pharmaceuticals: anti-cancer drugs.
Indeed, anti-cancer drug market incumbents have publicly declared their delay in investment to be a
result of excess technological uncertainty, as then-president for international R&D at Hoffmann-La Roche
publicly explained:
“At first, the pharmaceutical industry was slow to react to the challenge. Many companies
regarded [biopharmaceutical technology] as an esoteric science with little promise for
substantial economic returns … . This initial promise has since been convincingly redeemed
…” Drews (1993: S16).
In fact, later expansion into markets with intense use of biopharmaceutical technology has prompted
some of the anti-cancer drug market incumbents to resort to the acquisition of drugs, precisely because
the acquisition of the capability itself is not an option (i.e., there is no access to the capability). For
example, whereas according to Pharmaprojects, the anti-cancer drug market incumbent Bristol-Myers
Squibb (BMS) did not have internally developed AIDS-treatment drugs that reached clinical trials in the
period 1989-2004, the firm is currently a leader in sales in the AIDS-treatment market. All their
successful AIDS-treatment drugs are acquisitions: Reyataz® acquired from Novartis, Videx® acquired
from the National Institutes of Health, and Zerit® acquired in early stages from Yale University. In a
non-confidential interview in March 2007, an R&D executive for BMS explained their complex pattern of
decisions: whereas BMS did invest early in the application-specific side (i.e., the part considered
oncology research [Sosa, 2008a]) of large-molecule anti-cancer drug development (mainly through 10 Cancer and many therapeutic areas comply not only with the basic definition of a market (i.e., a set of products that are substitutes for one another) but also with the additional requirements discussed in the economics literature for high-tech settings (Sutton, 1998).

19
investment in the Lewis-Y mechanism of action to target cancer treatment), they did fall behind in
biopharmaceutical technology (a nonmarket-specific technological platform that was not applicable to
cancer during its early stages).
4.2 The Impact of Differences in Time of Start of Investment in Biopharmaceutical Technology on
Long-Term Performance in this Capability
The increase over time in the number of markets in which biopharmaceutical technology was applicable
generated heterogeneity in the timing of start of investment in this technological capability. This then led
to differences in the competence to further research biopharmaceutical technology. The hypothesis tested
in this section is therefore whether biopharmaceutical technology pioneers had a sustained advantage in
the competence to further research biopharmaceutical technology over time. Table 4 offers descriptive
statistics, and Table 5 offers the Cox model results for regressions predicting the rate of production of
patented innovations in the biopharmaceutical technology area in the period 1979-2004.
Insert Table 4
Insert Table 5
The baseline (omitted category) in models 1 and 2 is entrants and diversifying entrants, respectively. In
model 1, incumbents have a clear advantage over all entrants. Model 2 then shows that this advantage is
driven by de novo firms having a disadvantage, with the mean performance of incumbents and all
diversifying entrants being equal. In model 3, the baseline (omitted category) is now diversifying
entrants that are not biopharmaceutical technology pioneers. In this model, de novo firms that are not
biopharmaceutical technology pioneers are the lowest ranking group in competition, with a statistically
significant disadvantage (their hazard rate is < 1 and significant). The group of diversifying entrants now
sub-divides into a group out-performing incumbents and another under-performing them:
biopharmaceutical technology pioneers outperform incumbents (the test for equality of coefficients is

20
rejected at p < 0.00001), whereas diversifying entrants that are not biopharmaceutical technology pioneers
underperform incumbents (where the former are the baseline and the latter are statistically significantly >
1 with a hazard rate of 1.5). This analysis implies that pioneers in the area of biopharmaceutical
technology accrued an advantage in this R&D capability that persisted until at least 2004, the year
observation ended.
4.3 The Impact of Heterogeneity in the Capability for Biopharmaceutical Technology on
Performance in the R&D of Anti-Cancer Drugs
So far, I have offered evidence supporting the result that the origin and evolution of biopharmaceutical
technology with its gradual increase in market coverage translated into differences in time of start of
investment in this technological capability across firms in competition. This delay in start of investment
in biopharmaceutical technology turned into a persistent difficulty in access for many firms in
competition, including incumbents, as they tried to catch up but failed to achieve leadership in this
capability’s expertise. In this section, I present evidence that the sustained advantage in the research of
biopharmaceutical technology resulted in an advantage in the execution of drug discovery of large-
molecule targeted anti-cancer drugs for the firms who pioneered the technology, leaving incumbents in
2nd place. Furthermore, although long-term oncology research is a capability conferring strategic value to
incumbents in both variants of the new technology (i.e., small- and large-molecule targeted anti-cancer
drugs), the newly required capability of biopharmaceutical technology had comparatively higher strategic
value in the one variant of the new technology that required it (namely large-molecule targeted anti-
cancer drugs). Therefore, in this section I show that in the particular case of large-molecule targeted anti-
cancer drug discovery, although long-term oncology research still provided significant strategic value to
incumbents, that source of competitive advantage fell behind biopharmaceutical technology in strategic
value. As a consequence, although incumbents led in the execution of small-molecule targeted anti-
cancer drug discovery thanks to their re-usable long-term oncology research, these firms fell behind those
few entrants who had pioneered biopharmaceutical technology in the case of large-molecule targeted anti-
cancer drug discovery.

21
To show these dynamics I use Cox regressions predicting the rate of production of patented anti-cancer
drug molecules. Table 6 presents descriptive statistics, whereas Table 7 presents analyses.
Insert Table 6
Insert Table 7
In the comparison of Table 7 models 1 and 2, the key dynamics are present: incumbents lead in small-
molecule targeted anti-cancer drug discovery (their hazard rate is significantly > 1 and significantly
higher than that of biopharmaceutical technology pioneers) but follow second in the case of the large-
molecule counterparts (incumbents’ hazard rate is still significantly > 1 but this time significantly lower
than biopharmaceutical technology pioneers’ hazard rate).11 In Table 7 model 3, I replace the use of
binary variables that identify the specific firm categories in competition with a continuous proxy for the
underlying capabilities present in these firm categories. As can be seen, both capabilities enhance
performance (both have hazard rates significantly > 1), but the capability for biopharmaceutical
technology has higher comparative value than long-term oncology research in this variant of products (the
test of equality of coefficients is rejected at p < 0.00001).
5. Discussion
I started this paper with the proposition that the assessment of the extent of competence destruction is
necessary but not sufficient for the analysis of competitive dynamics through a technological
discontinuity. An assessment of the comparative strategic value (i.e., the comparative value added and
ease of access) of the new capabilities, with respect to one another and to old capabilities, is necessary
too. Indeed recent research has shown that managers can separately identify the effect of competence-
destruction/enhancement from that of competence acquisition for the innovations involved in the markets
in which their firms compete (Gatignon, Tushman, Smith and Anderson, 2002). With the evaluation of
the comparative strategic value of different capabilities (old and new) in mind, the analyst can determine 11 Results are qualitatively equal if a Negative Binomial, as a cross-sectional count-model specification, is used.

22
how ownership of (and access to) these capabilities is heterogeneously distributed across the different
groups of firms in competition and conclude which firms will accrue a competitive advantage over others.
I tested and found evidence for the proposition in this paper by looking at the transition from cytotoxic
to targeted drug discovery in the market for anti-cancer drugs, a transition that is competence-destroying
to the drug discovery steps of incumbents’ standing value chains. Within targeted drugs, I differentiated
between two technological variants, small- and large-molecule drugs, which differ, not in their level of
competence-destruction vs. cytotoxic drug discovery, but in the characteristics of the new capabilities
they required. In particular, large-molecule drug discovery required one more capability, namely
biopharmaceutical technology, than small-molecule drug discovery. I then looked at the origin and
evolution of this new capability, and the unfolding timing of start of investment of different groups of
firms that ultimately competed in the anti-cancer drug market. In so doing, I was able to show that
biopharmaceutical technology was harder to access later on than other new capabilities, precisely because
its origin and evolution gave rise to a “resource position barrier” (Wernerfelt, 1984: 173) that favored
pioneering firms.12 That is, this is a first mover advantage into a capability, not a first mover advantage
into a market. I was also able to show that biopharmaceutical technology had higher comparative value-
added than the only old capability that incumbents could retain due to its market-specificity: long-term
oncology research (Sosa, 2008a). As a consequence, within the anti-cancer drug market incumbents
retained the lead in the drug discovery of small-molecule targeted drugs, but fell behind
biopharmaceutical technology pioneers in large-molecule counterparts.
Beyond fulfilling this study’s initial objective, the unique case presented offers further contributions to
both the literature on creative destruction and, more broadly, research in strategy formulation for markets
with rapid technological change. Within the literature on creative destruction, I show how incumbents
delayed their investment in the new technology even though the change was sustaining in customer
preferences. That is, the determinant of late investment among incumbents was not an unforeseen change 12 Classic studies of the effect of timing of entry on competitive advantage (e.g., Mitchell, 1991; Lieberman and Montgomery, 1988) examine the order of entry into a product market (therefore investigating the emergence of market entry barriers). In contrast, the current study examines the order of start of investment in an R&D capability useful to compete in one or more markets (therefore investigating the emergence of resource position barriers).

23
in customer preferences as prior research has suggested (Christensen, 1997). It was rather an unforeseen
change in the market-specificity of a technological capability generated within the new technological
paradigm. This result implies that attention should be centered not only on whether a change is sustaining
in customer preferences, given that the case in this paper shows there is a second mechanism that could
generate uncertainty leading to delayed investment. Rather, attention should be centered on the varied
sources of uncertainty arising during a technological discontinuity and whether the monitoring system
that incumbents possess can adequately circumvent them, which is in line with current research in the
impact of information infrastructure on firms’ strategic decisions (Williams and Mitchell, 2004).
Within the literature on strategy formulation for markets with rapid technological change, this study
elaborates on the current interest in the origin and evolution of capabilities (Helfat and Lieberman, 2002;
Ahuja and Katila, 2004; Ethiraj et al., 2005). In contrast to prior studies, I am able to identify both the
origin and evolution of a capability to show how during a transition from one technological regime to
another these characteristics of a capability had an impact on heterogeneity in R&D performance.
Lastly, in this case the same capability (long-term oncology research), although conveying the same
absolute value, became a definite source of competitive advantage in one variant of products, and fell
behind another capability in a second variant, through a technological discontinuity. This is the case
because the strategic value of capabilities through a discontinuity is measured in relative terms, always in
comparison to other capabilities required. Future research will be needed to further develop our
understanding of how firms might evaluate the comparative strategic value of the different capabilities in
their choice set.
References
Abernathy, W.J., K.B. Clark. 1985. Innovation – Mapping the Winds of Creative Destruction. Research Policy. 14(1) 3-22.
Ahuja, G., R. Katila. 2004. Where do Resources come from? The Role of Idiosyncratic Situations. Strategic Management Journal. 25 887-907.
American Cancer Society. 2000. Cancer Facts & Figures. Available online at http://www.cancer.org/downloads/STT/F&F00.pdf
Barney, J.B. 1986. Strategic Factor Markets – Expectations, Luck, and Business Strategy. Management Science. 32(10) 1230-1241.

24
Barney, J.B. 1991. Firm Resources and Sustained Competitive Advantage. Journal of Management. 17(1) 99-120.
Bazell, R. 1998. Her-2: The Making of Herceptin, a Revolutionary Treatment for Breast Cancer. Random House.
Capdeville, R., E. Buchdunger, J. Zimmermann, A. Matter. 2002. Glivec (STI571, Imanitib), a rationally developed, targeted anticancer drug. Nature Reviews Drug Discovery, 1 493-502.
Christensen, C. 1996. Eli Lilly and Co.: Innovation in Diabetes Care. Harvard Business Case #696077. ______________. 1997. The Innovator’s Dilemma. Harvard Business School Press, Boston, MA. ______________, J. Bower. 1996. Customer Power, Strategic Investment, and the Failure of Leading
Firms. Strategic Management Journal. 17(3) 197-218. Colwell, R.R. 2002. Fulfilling the Promise of Biotechnology. Biotechnology Advances. 20 215-228. Cohen, W.M., D.A. Levinthal. 1990. Absorptive Capacity: A New Perspective on Learning and
Innovation. Administrative Science Quarterly. 35(1) 128-152. Dierickx, I., K. Cool. 1989. Assets Accumulation and Sustainability of Competition Advantage.
Management Science. 35(12) 1504-1514. Dosi, G. 1982. Technological paradigms and technological trajectories, a suggested interpretation of the
determinants and directions of technical change. Research Policy, 11(3) 147-162. Drews, J. 1993. Into the 21st Century: Biotechnology and the Pharmaceutical Industry in the Next Ten
Years. Biotechnology. 11 S16-S20. Eisenhardt, K.M., J.A. Martin. 2000. Dynamic Capabilities: What are they? Strategic Management
Journal. 21(10-11) 1105-1121. Ethiraj, S.K., P. Kale, M.S. Krishnan, J.V. Singh. 2005. Where do Capabilities come from and How do
they matter? A Study in the Software Services Industry. Strategic Management Journal. 26 25-45.
Feldman, M. 2003. The Locational Dynamics of the US Biotech Industry: Knowledge Externalities and the Anchor Hypothesis. Industry and Innovation. 10(3) 311-329.
Fisher, J.W. 1998. A Quest for Erythropoietin over Nine Decades. Ann.Rev.Pharmacol.Toxicol. 38 1-20. Gatignon, H., M.L. Tushman, W. Smith, P. Anderson. 2002. A Structural Approach to Assessing
Innovation: Construct Development of Innovation Locus, Type, and Characteristics. Management Science. 48(9) 1103-1122.
Helfat, C.E., M.B. Lieberman. 2002. The Birth of Capabilities: Market Entry and the Importance of Pre-History. Industrial and Corporate Change. 11(4) 725-760.
Henderson, R.M., K.B. Clark. 1990. Architectural innovation: the reconfiguration of existing product technologies and the failure of established firms. Administrative Science Quarterly. 35(1) 9-30.
______________. 1993. Underinvestment and Incompetence as responses to Radical Innovation – Evidence from the Photolithographic Alignment Equipment Industry. Rand Journal of Economics. 24(2) 248-270.
______________. 1995. Of Life-Cycles Real and Imaginary – The Unexpectedly Long Old-Age of Optical Lithography. Research Policy. 24(4) 631-643.
______________, L. Orsenigo, G. Pisano. 1999. The Pharmaceutical Industry and the Revolution in Molecular Biology: Interactions Among Scientific, Institutional, and Organizational Change. D.C. Mowery, R.R. Nelson, eds. Sources of Industrial Leadership. Cambridge University Press.
Kogut, B., U. Zander. 1992. Knowledge of the Firm, Combinative Capabilities, and the Replication of Technology. Organization Science. 3(3) 383-397.
Leader, B., Q.J. Baca, D.E. Golan. 2008. Protein Therapeutics: A Summary and Pharmacological Classification. Nature Reviews Drug Discovery. 7 21-39.
Lieberman, M.B., D.B. Montgomery. First-mover Advantages. Strategic Management Journal. 9 41-58. Mitchell, W. 1991. Dual Clocks: Entry Order Influences on Incumbent and Newcomer Market Share and
Survival when Specialized Assets Retain their Value. Strategic Management Journal. 12(2) 85-100.

25
Montgomery, C.A., B. Wernerfelt. 1988. Diversification, Ricardian Rents, and Tobin’s Q. Rand Journal of Economics. 19(4) 623-632.
Nature. 2007. Nature Milestones: DNA Technologies. S5-S20. Available online at http://www.nature.com/milestones/miledna/timeline.html
Rang, H.P. 2006. The Drug Discovery Process: General Principles and Some Case Histories. H.P. Rang, ed. Drug Discovery and Development: Technology in Transition. Churchill Livingstone Elsevier.
Rosenfeld, L. 2002. Insulin: Discovery and Controversy. Clinical Chemistry. 48(12) 2270-2288. Rothaermel, F.T. 2001. Incumbent’s Advantage through Exploiting Complementary Assets via Interfirm
Cooperation. Strategic Management Journal. 22(6/7) 687-699. Rumelt, R.P. 1987. Theory, Strategy, and Entrepreneurship. D. Teece, ed. The Competitive Advantage
Challenge. Ballinger, Cambridge, MA. Sørensen, J., T. Stuart. 2000. Aging, Obsolescence and Innovation. Administrative Science Quarterly.
45(1) 81-112. Sosa, M.L. 2005. Decoupling Market Incumbency from Organizational Experience: Locating the Real
Sources of Competence in the Research and Development of Radical Innovation. Sloan Industry Studies Working Paper WP-2005-10. Available online at http://www.industry.sloan.org/industrystudies/WorkingPapers/admin/uploads/31.pdf
______________. 2006. Decoupling Market Incumbency from Organizational Experience: A Study of Biotechnology’s Impact on the Market for Anti-Cancer Drugs. Unpublished doctoral dissertation, Sloan School of Management, Cambridge, Massachusetts.
______________. 2008a. Application-Specific R&D Capabilities and the Advantage of Incumbents: Evidence from the Anti-Cancer Drug Market. Working paper, London Business School.
______________. 2008b. From an Ecology of Organizations to an Ecology of Capabilities: Anti-Cancer vs. Psychotropic Drug Discovery. Working paper, London Business School.
Sutton, J. 1998. Technology and Market Structure. MIT Press, Cambridge, MA. Teece, D.J. 1980. Economies of scope and the scope of the enterprise. Journal of Economic Behavior &
Organization. 1(3) 223-247. ______________. 1986. Profiting from Technological Innovation: Implications for Integration,
Collaboration, Licensing and Public Policy. Research Policy. 15 285-305. ______________, G. Pisano, A. Shuen. 1997. Dynamic capabilities and strategic management. Strategic
Management Journal. 18(7) 509-533. Tripsas, M. 1997. Unraveling the process of creative destruction: Complementary assets and incumbent
survival in the typesetter industry. Strategic Management Journal. 18 119-142. Tushman, M., P. Anderson. 1986. Technological Discontinuities and Organizational Environments.
Administrative Science Quarterly. 31(3) 439-465. Walsh, G. 2003. Biopharmaceuticals: Biochemistry and Biotechnology, 2nd ed. John Wiley & Sons, Ltd. Williams, C., W. Mitchell. 2004. Focusing Firm Evolution: The Impact of Information Infrastructure on
Market Entry by U.S. Telecommunications Companies, 1984-1998. Management Science. 50(11) 1561-1575.
Winter, S.G. 2003. Understanding Dynamic Capabilities. Strategic Management Journal. 24(10) 991-995.
26
Tables Table 1
Pre-1995 USA Approvals of Large-Molecule Drugs, their Application and Developing Firms
Year* Brand Name*
Active Ingredient
Indication (Market)*
Commercializing Firm*
Developing Firm**
Bioph. Pioneer
1982 Humulin Insulin Diabetes mellitus Eli Lilly Genentech
1985 Protropin Human growth hormone (hGH)
hGH deficiency in children Genentech Genentech
1986 Intron A Interferon alpha 2 Cancer, genital warts, hepatitis Schering Plough Biogen
1986 Roferon A Interferon alpha 2 Hairy cell leukemia Hoffman-La Roche Genentech
1986 Recombivax Hepatitis B virus surface antigen Hepatitis B vaccine Merck
1986 Orthoclone OKT3 Muromomab CD3
Reversal of acute kidney transplant
rejection
Ortho Biotech (Johnson & Johnson)
Ortho Biotech (Johnson & Johnson)
1987 Activase Tissue
plasminogen activator (tPA)
Acute myocardial infarction Genentech Genentech
1987 Humatrope hGH hGH deficiency in children Eli Lilly Eli Lilly
1989 Epogen Epoetin alpha Anemia Amgen Amgen
1990 Procrit Epoetin alpha Cancer-related anemia Ortho Biotech (Johnson & Johnson) Amgen
1990 Actimmune Interferon gamma 1
Chronic granulomatous disease Genentech Genentech
1991 Novolin Insulin Diabetes mellitus Novo Nordisk Novo Nordisk
1991 Leukine
Granulocyte macrophage
colony-stimulating factor
(GM-CSF)
Autologous bone marrow transplantation
Amgen and Schering AG Immunex
1991 Neupogen Filgrastim Chemotherapy-induced neutropenia Amgen Amgen
1992 Recombinate Factor VIII Hemophilia A Baxter / Wyeth Genetics Institute 1992 Proleukin Interleukin 2 Renal cell
carcinoma Chiron Chiron
1992 OncoScint CR/OV
Satumomab pendetide
Detection/staging, colorectal and ovarian
cancers Cytogen Cytogen
1993 Bioclate Factor VIII Hemophilia A Centeon Genetics Institute 1993 Kogenate Factor VIII, 2nd
generation Hemophilia A Bayer Bayer
1993 Betaseron Interferon beta 1 Relapsing multiple sclerosis
Berlex laboratories and Chiron Chiron
1993 Pulmozyme Dornase alpha Cystic fibrosis Genentech Genentech 1994 Nutropin hGH, 2nd
generation hGH deficiency in
children Genentech Genentech
1994 ReoPro Abciximab Prevention of blood clots Centocor State University,
NY
1994 Cerezyme Beta glucocerebrosidase Gaucher’s disease Genzyme Genzyme
Sources: * Walsh (2003) ** Pharmaprojects

27
Table 2 Sub-Division of the Three Firm Categories (Incumbents, Diversifying and De Novo Entrants) into
Four Categories Given the Firms’ Status as Pioneers or Followers in Biopharmaceutical Technology
Biopharmaceutical Technology Pioneers Followers
Incumbents
None
All
Diversifying Entrants
4
Remainder
De Novo Entrants 1
Remainder
Biopharmaceutical technology pioneers Incumbents Diversifying entrants that are not biopharmaceutical technology pioneers De novo entrants that are not biopharmaceutical technology pioneers

28
Table 3
Evolution of Biopharmaceutical Technology
(3a) Different indications (i.e., product markets) to which biopharmaceutical technology was applicable in each stage of this capability’s chronological evolution.
Stage I protein and connection to
disease known
Stage II only protein known
Stage III new product class
Insulin Epo Factor VIII Interferons
Human Growth Hormone Glucocerebrosidase
Interleukins Monoclonal-Antibody-based
products
(3b) Visual representation of the increase in market coverage of the capability for biopharmaceutical technology as time progressed in three discrete stages in the history of the evolution of the underlying technology (adapted from Wernerfelt, 1984).
MARKETS Insulin
deficiency (diabetes)
… Anemia … AIDS Cancer …
…
Biopharmaceutical technology Stage I … Stage II … Stage III Stage III …
RE
SOU
RC
ES
AN
D
CA
PAB
ILIT
IES
…

29
Table 4 Competence in Biopharmaceutical Technology
Descriptive Statistics and Correlation Matrix for Analysis of Rate of Production of Patented Innovations
(1,540 Spells, 1,375 Events)
Count Mean Std.Dev. Min. Max. (1) Incumbent 329 (2) De Novo 252 (3) Biopharmaceutical Technology Pioneer 450
(4) De Novo, no Pioneer 245 (5) Cumulative 319 247 0 846
(1) (2) (3) (4) (5)
(1) Incumbent 1 (2) De Novo -0.25 1 (3) Biopharmaceutical Technology Pioneer -0.36 -0.28 1
(4) De Novo, no Pioneer -0.24 0.98 -0.30 1 (4) Cumulative -0.34 -0.37 0.15 -0.36 1

30
Table 5
Cox Model Analysis of Rate of Production of Patented Innovations in Biopharmaceutical Technology
(1,540 Spells, 1,375 Events) All Coefficients in Hazard Rates
Model 1 Model 2 Model 3
Incumbent 1.56*** (0.10)
0.96 (0.06)
1.50*** (0.11)
De Novo 0.27*** (0.02)
Biopharmaceutical Pioneer 2.13*** (0.16)
De Novo, no Pioneer 0.40*** (0.03)
Cumulative 1.00 (0.00)
1.00** (0.00)
1.00 (0.00)
Log Likelihood -8,992 -8,846 -8,796 + p < 0.1, * p < .05, ** p < .01, *** p < .001 Standard errors in parentheses.
≠ coefficients p < 0.00001

31
Table 6 Descriptive Statistics and Correlation Matrix for
Analyses of Rate of Production of Patented Drug Molecules (Drug Discovery)
Small-Molecule Targeted Anti-Cancer Drugs
count mean std.dev. (1) (2) (3) (4) (5) (6) (7) (8) (9) (10) (1) Incumbent 1,360 1 (2) Diversifying 1,780 -0.73 1 (3) De Novo 578 -0.33 -0.41 1 (4) Biopharmaceutical Pioneer 260 -0.21 0.24 -0.05 1 (5) De Novo, no Pioneer 556 -0.32 -0.40 0.98 -0.12 1 (6) Cumulative 68.1 68.3 0.34 -0.10 -0.31 -0.16 -0.30 1 (7) Cumulative X Incumbent 0.73 -0.53 -0.24 -0.15 -0.23 0.69 1 (8) Cumulative X De Novo -0.15 -0.20 0.47 -0.04 0.47 0.02 -0.11 1 (9) Cumulative X Biopharmaceutical Pioneer -0.17 0.21 -0.08 0.79 -0.09 -0.08 -0.12 -0.04 1
(10) Cumulative X De Novo, no Pioneer -0.15 -0.19 0.46 -0.06 0.48 0.02 -0.11 0.99 -0.04 1
Large-Molecule Targeted Anti-Cancer Drugs
count mean std.dev. (1) (2) (3) (4) (5) (6) (7) (8) (9) (10) (11) (1) Incumbent 1,066 1 (2) Diversifying 3,278 -0.62 1 (3) De Novo 1,055 -0.24 -0.61 1 (4) Biopharmaceutical Pioneer 1,879 -0.36 0.53 -0.29 1 (5) De Novo, no Pioneer 988 -0.23 -0.59 0.96 -0.35 1 (6) Cumulative 265.1 372.1 -0.20 0.41 -0.30 0.63 -0.29 1 (7) Cumulative X Incumbent 22.7 62.2 0.74 -0.45 -0.18 -0.27 -0.17 -0.07 1 (8) Cumulative X De Novo 7.5 25.6 -0.15 -0.36 0.59 -0.18 0.58 -0.13 -0.11 1 (9) Cumulative X Biopharmaceutical Pioneer 203.3 393.0 -0.26 0.41 -0.25 0.71 -0.25 0.97 -0.19 -0.15 1
(10) Cumulative X De Novo, no Pioneer 7.1 25.4 -0.14 -0.35 0.56 -0.20 0.59 -0.13 -0.10 0.99 -0.14 1
(11) Gene Therapy 3,794 -0.07 0.13 -0.09 0.11 -0.07 0.25 0.01 0.05 0.20 0.07 1

32
Table 7
Drug Discovery Cox Model Analysis of Rate of Production
of Patented Molecules All Coefficients in Hazard Rates
All Analyses estimated with Robust Standard Errors
Only Small Targeted
Only Large Targeted
Model 1 Model 2 Model 3 Incumbent 3.28***
(0.75)
2.44* (0.99)
De Novo Biopharmaceutical Pioneer 0.80
(0.22) 5.43** (2.92)
De Novo, no Pioneer 0.29*** (0.06) 0.35**
(0.11)
Cumulative 1.01*** (0.00) 1.01***
(0.00) 1.00*** (0.00)
Cumulative X Incumbent 0.99**
(0.00) 1.00 (0.00)
Cumulative X Biopharmaceutical Pioneer
1.02** (0.01) 1.00***
(0.00)
Cumulative X De Novo, no Pioneer 1.02***
(0.00) 1.02*** (0.00)
Gene Therapy 1.80** (0.31)
Oncology Research prior to 1983 1.00
(0.00)
Capability for Biopharmaceutical Technology
13.29*** (7.46)
Spells 3,718 5,399 5,399 Events 3,672 5,365 5,365 Log Likelihood -14,235 -19,035 -20,616 + p < 0.1, * p < .05, ** p < .01, *** p < .001 Standard errors in parentheses.
one-way test of coeff’s p < 0.00001
≠ coeff p < 0.00001
one-way test of coeff’s p < 0.09

33
Figures
Figure 1 A Dynamic View of the Resource-Based View of the Firm
(adapted from Wernerfelt, 1984:179)
(1a). The Original, Static Representation of the Resource Base View of the Firm
Market A Market B Market C Resource 1 V1A V1C Resource 2 V2A V2B V2C Resource 3 V3A
(1b). A Dynamic Representation of the Resource-Based View of the Firm
Resource-Market Matrix at t = t0 State of Market A before the Transition to the New
Technological Paradigm of Resource 1 started
Market A Market B Market C Resource 1 V1A Resource 2 V2A V2B V2C Resource 3 V3A V3C
Resource-Market Matrix at t = t1 Period of Transition of Market A, through the Technological
Discontinuity in Resource 1
Market A Market B Market C Resource 1
(* indicates the new technological paradigm)
V1A or V1*A where V1*A > V1A
Resource 2 V2A V2B V2C Resource 3 V3A V3C
Resource-Market Matrix at t = t2 New State of Market A, after the Transition to the New
Technological Paradigm for Resource 1 has ended
Market A Market B Market C Resource 1
(* indicates the new technological paradigm)
V1*A
Resource 2 V2A V2B V2C Resource 3 V3A V3C

34
Figure 2 Typical Value Chain in the Pharmaceutical Industry
Adapted from Fig. 4.1 (p.44) in Rang (2006)
R&D Process Drug Discovery (Preclinical) Development (Clinical)
Target Selection
Target Validation
Lead Finding
Lead Optimization
Animal Studies Phase I Phase II Phase III
Commercialization
Investigational New Drug (IND)
New Drug Application
(NDA)

35
Figure 3
The Unfolding Three Groups of Large-Molecule Drugs in the Biotechnology Revolution Resulting from the Three Stages of Evolution of the Underlying Capability for Biopharmaceutical technology
0
2
4
6
8
10
12
1982 1983 1984 1985 1986 1987 1988 1989 1990 1991 1992 1993 1994 1995 1996 1997 1998 1999 2000 2001 2002
new product class
only protein known
protein and connection to disease treatment known
Year of Market Launch in USA
Cou
nt o
f Pro
duct
s