Embed Size (px)
Citation preview
St. John Fisher College St. John Fisher College
Fisher Digital Publications Fisher Digital Publications
Pharmacy Faculty/Staff Publications Wegmans School of Pharmacy
6-20-2018
Drug-Phospholipid Complex-loaded Matrix Film Formulation for Drug-Phospholipid Complex-loaded Matrix Film Formulation for
the Enhanced Transdermal Delivery of Quercetin the Enhanced Transdermal Delivery of Quercetin
Darshan R. Telange Nagpur University
Kuldeep D. Wavare Nagpur University
Arun T. Patil Nagpur University
Milind J. Umekar Nagpur University
Sridhar Anand St. John Fisher College, [email protected]
See next page for additional authors
Follow this and additional works at: https://fisherpub.sjfc.edu/pharmacy_facpub
Part of the Pharmacy and Pharmaceutical Sciences Commons
How has open access to Fisher Digital Publications benefited you?
Publication Information Publication Information Telange, Darshan R.; Wavare, Kuldeep D.; Patil, Arun T.; Umekar, Milind J.; Anand, Sridhar; and Dave, Vivek S. (2018). "Drug-Phospholipid Complex-loaded Matrix Film Formulation for the Enhanced Transdermal Delivery of Quercetin." Journal of Excipients and Food Chemicals 9.2, 31-50. Please note that the Publication Information provides general citation information and may not be appropriate for your discipline. To receive help in creating a citation based on your discipline, please visit http://libguides.sjfc.edu/citations.
This document is posted at https://fisherpub.sjfc.edu/pharmacy_facpub/168 and is brought to you for free and open access by Fisher Digital Publications at St. John Fisher College. For more information, please contact [email protected].
Drug-Phospholipid Complex-loaded Matrix Film Formulation for the Enhanced Drug-Phospholipid Complex-loaded Matrix Film Formulation for the Enhanced Transdermal Delivery of Quercetin Transdermal Delivery of Quercetin
Abstract Abstract A novel quercetin-phospholipid-complex(QPLC)-loaded matrix film for improved transdermal delivery of quercetin was developed. The QPLC formulation, prepared using a solvent-evaporation method, was optimized using a central-composite design. The optimized QPLC formulation was characterized by particle size and zeta potential analysis, thermal analysis, Fourier transform infrared spectroscopy (FTIR), and proton nuclear magnetic resonance spectroscopy (1H-NMR). QPLC formulation was functionally evaluated for solubility and in vitro dissolution of quercetin. Matrix films of pure quercetin (Q-MF)or QPLC QPLC-MF) were prepared using a solvent casting method. The prepared Q-MF and QPLC-MF were characterized for weight uniformity, folding endurance, moisture content, and moisture uptake. The films were also functionally characterized for in vitro diffusion of quercetin through a dialysis membrane and ex vivo permeability of quercetin across rat skin. Finally, the anti-inflammatory activity of the films was evaluated on carrageenan-induced paw edema in Wistar albino rats. The experimental design identified the optimal formulation and process variables for the preparation of QPLC. The validation of the obtained model using these values confirmed the suitability and robustness of the model. The physical-chemical characterization of the prepared QPLC supported the formation of a stable complex. The solubility analysis of QPLC showed a 22-fold increase in quercetin aqueous solubility, compared to pure quercetin. The dissolution results exhibited a significantly higher rate and extent of quercetin dissolution from QPLC compared to that of pure quercetin. The permeability of quercetin from Q-MF and QPLC-MF across rat skin mirrored those obtained from the dissolution studies. Topical application of QPLC-MF exhibited a significant (p<0.05) inhibition of carrageenan-induced paw edema in rats compared to that of Q-MF. This study provides a promising combination approach, i.e., phospholipid-based complexation and transdermal film formulation for improved transdermal delivery of quercetin and similar pharmacologically active phytoconstituents.
Disciplines Disciplines Pharmacy and Pharmaceutical Sciences
Comments Comments This Journal is © IPEC-Americas. This article is also available through the publisher's website.
Creative Commons License Creative Commons License
This work is licensed under a Creative Commons Attribution-No Derivative Works 4.0 License.
Authors Authors Darshan R. Telange, Kuldeep D. Wavare, Arun T. Patil, Milind J. Umekar, Sridhar Anand, and Vivek S. Dave
This article is available at Fisher Digital Publications: https://fisherpub.sjfc.edu/pharmacy_facpub/168
This Journal is © IPEC-Americas June 2018 J. Excipients and Food Chem. 9 (2) 2018 31
*Corresponding address: St. John Fisher College, Wegmans School of Pharmacy, Rochester, NY, 14534, Tel: 1-585-385-5297, Fax: 1-585-385-5295, E-mail: [email protected]
Received: March 18, 2018; Accepted: April 11, 2018 Original Article
Drug-phospholipid complex-loaded matrix film formulation for enhanced transdermal delivery of quercetin.
Darshan R. Telangea, Kuldeep D. Wavarea, Arun T. Patila, Milind J. Umekara, Sridhar Anandb, Vivek S. Daveb*
aSmt. Kishoritai Bhoyar College of Pharmacy, New Kamptee, Nagpur, Maharashtra, IndiabSt. John Fisher College, Wegmans School of Pharmacy, Rochester, NY, USA
ABSTRACT
A novel quercetin-phospholipid-complex (QPLC)-loaded matrix film for improved transdermal delivery of quercetin was developed. The QPLC formulation, prepared using a solvent-evaporation method, was optimized using a central-composite design. The optimized QPLC formulation was characterized by particle size and zeta potential analysis, thermal analysis, Fourier transform infrared spectroscopy (FTIR), and proton nuclear magnetic resonance spectroscopy (1H-NMR). QPLC formulation was functionally evaluated for solubility and in vitro dissolution of quercetin. Matrix films of pure quercetin (Q-MF) or QPLC (QPLC-MF) were prepared using a solvent casting method. The prepared Q-MF and QPLC-MF were characterized for weight uniformity, folding endurance, moisture content, and moisture uptake. The films were also functionally characterized for in vitro diffusion of quercetin through a dialysis membrane and ex vivo permeability of quercetin across rat skin. Finally, the anti-inflammatory activity of the films was evaluated on carrageenan-induced paw edema in Wistar albino rats. The experimental design identified the optimal formulation and process variables for the preparation of QPLC. The validation of the obtained model using these values confirmed the suitability and robustness of the model. The physical-chemical characterization of the prepared QPLC supported the formation of a stable complex. The solubility analysis of QPLC showed a 22-fold increase in quercetin aqueous solubility, compared to pure quercetin. The dissolution results exhibited a significantly higher rate and extent of quercetin dissolution from QPLC compared to that of pure quercetin. The permeability of quercetin from Q-MF and QPLC-MF across rat skin mirrored those obtained from the dissolution studies. Topical application of QPLC-MF exhibited a significant (p<0.05) inhibition of carrageenan-induced paw edema in rats compared to that of Q-MF. This study provides a promising combination approach, i.e., phospholipid-based complexation and transdermal film formulation for improved transdermal delivery of quercetin and similar pharmacologically active phytoconstituents.
KEY WORDS: Quercetin, phospholipid, solubility, permeability, transdermal, excipients
INTRODUCTION
Quercetin is a lipophilic molecule that belongs to the class of plant derived flavonoids (1-4). Studies have reported quercetin to elicit a wide range of
pharmacological activities including, anti-hypertensive, anti-inflammatory, anti-proliferative, anti-diabetic, anti-neural disorders, and importantly anti-oxidant activity attributed to quenching of free-radicals by quercetin (5-12). Despite promising pharmacological effects, quercetin displays low bioavailability owing to its poor solubility in water (~1-7 μg/mL), simulated gastric juice (~ 5.5 μg/mL), and simulated intestinal
This Journal is © IPEC-Americas June 2018 J. Excipients and Food Chem. 9 (2) 2018 32
Original Article
juice (~29 μg/mL) (13). It is thus appropriately classified as a BCS Class II drug. Furthermore, the oral bioavailability of quercetin has been reported to be negatively influenced by extensive first-pass metabolism. The bioavailability of quercetin after oral administration was reported to be only about 1% in humans (14-16). Novel formulation strategies are thus needed to improve the bioavailability of quercetin.
Among the recently explored formulation strategies for improving quercetin bioavailability include nanotechnology based formulations, polymeric micelles, microspheres, and solid dispersions (4, 17-20). Hatahet et. al. prepared nanocrystal-based dermal gel formulation with quercetin, and demonstrated enhanced solubility and dissolution of quercetin in these formulations (7). The protective effect of quercetin on hydrogen peroxide induced toxicity on epithelial cell lines was also demonstrated. Wang et. al. evaluated a solid non-aqueous self-double emulsifying drug delivery system for the topical application of quercetin (21). The study showed a significant improvement in the permeability and accumulation of quercetin in the skin. Zhang et. al. developed a combined novel drug delivery system for improving the bioavailability and prolonging the retention time of curcumin in the body (22). Cai et. al. prepared huperzine A-phospholipids complex-loaded biodegradable thermosensitive gel PLGA-PEG-PLGA polymer gel as implant system for controlled release of huperzine A (23). Transdermal delivery is a promising strategy to bypass the first-metabolism associated with oral administration. While the approaches explored in the studies mentioned above overcome a specific barrier to improve bioavailability i.e. solubility or permeability enhancement, a systematic, design-optimized, formulation development approach, complemented with detailed evaluation, is still needed.
Previously, studies have shown drug-phospholipids complexation as a successful approach for enhancing the aqueous solubility, permeability, and in vivo bioavailability of pharmacoactive molecules (23-29). In the current study this approach was taken a step further. Using a two-step approach, a phospholipid-based complex of quercetin was first prepared. This
prepared complex was then formulated into polymeric matrix films. The quercetin phospholipid complex formulation (QPLC) was prepared and optimized using a central composite design. The design-optimized formulation was characterized by particle size and zeta potential analysis, thermal analysis, Fourier transform infrared spectroscopy (FTIR), proton nuclear magnetic resonance spectroscopy (1H-NMR), powder x-ray diffractometry (PXRD), and solubility analysis. The dissolution behavior of QPLC was also compared to pure quercetin. The QPLC was then formulated into hydroxypropyl methyl cellulose-based matrix films (QPLC-MF) using a solvent casting method. The prepared films were then evaluated for physical properties such as thickness, weight variation, moisture content, and moisture uptake. The films were functionally characterized for in vitro diffusion across a dialysis membrane and ex vivo permeation across rat skin. Finally, the QPLC-loaded film was pharmacologically evaluated for in vivo anti-inflammatory activity.
Materials and methods
Materials
Quercetin dihydrate (>99% purity) was obtained from Sisco Research Laboratories Pvt. Ltd., Mumbai, India. Phospholipon® 90H was obtained from Lipoid, Ludwigshafen, Germany. Carrageenan was obtained from Sigma-Aldrich Corporation, St. Louis, MO. Chloroform, dibutyl phthalate, dimethyl sulfoxide (DMSO), ethanol, n-hexane, hydroxypropyl methyl cellulose (HPMC E15) and methanol were obtained from Loba Chemicals Pvt. Ltd., Mumbai, India. Other chemicals used in the study were of analytical grade.
The formulation of the quercetin-phospholipid complex (QPLC)
The quercetin-phospholipids complex (QPLC) was prepared by a solvent evaporation method reported previously (26). Briefly, quercetin and Phospholipon®
90H were weighed individually in molar ratios of 1:0.55, 1:1.05, 1:1.78, 1:2.51 and 1:3.00 and transferred to a 100 mL reflux flask. To this mixture
This Journal is © IPEC-Americas June 2018 J. Excipients and Food Chem. 9 (2) 2018 33
Original Article
20 mL absolute ethanol was added and mixed well. The temperature of the flask was controlled at 40.4, 44.4, 50.1, 56.2, or 60.2°C using a water bath. The reflux reaction was allowed to continue for 1.0, 1.4, 2.1, 2.6 or 3.0 hours. After the reaction was complete, the flask contents was evaporated until a ~ 2-3 mL residue remained. 10 mL of n-hexane was added to this residue, resulting in the precipitation of the formed QPLC. The resultant QPLC was filtered and dried at 40°C for 12 hours using vacuum drying. Finally, the dried QPLC powder was placed in an amber (light-protected) glass vial, flushed with nitrogen and stored at room temperature until further characterization.
Optimizing variables (central composite design)
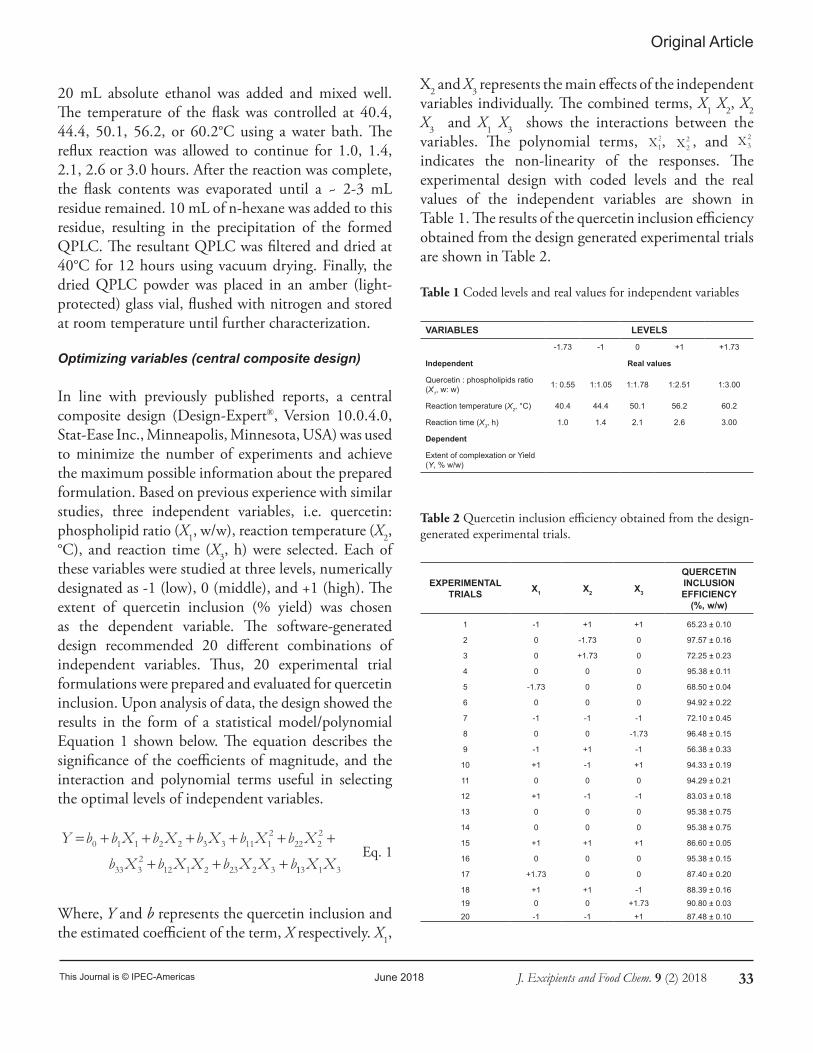
In line with previously published reports, a central composite design (Design-Expert®, Version 10.0.4.0, Stat-Ease Inc., Minneapolis, Minnesota, USA) was used to minimize the number of experiments and achieve the maximum possible information about the prepared formulation. Based on previous experience with similar studies, three independent variables, i.e. quercetin: phospholipid ratio (X1, w/w), reaction temperature (X2, °C), and reaction time (X3, h) were selected. Each of these variables were studied at three levels, numerically designated as -1 (low), 0 (middle), and +1 (high). The extent of quercetin inclusion (% yield) was chosen as the dependent variable. The software-generated design recommended 20 different combinations of independent variables. Thus, 20 experimental trial formulations were prepared and evaluated for quercetin inclusion. Upon analysis of data, the design showed the results in the form of a statistical model/polynomial Equation 1 shown below. The equation describes the significance of the coefficients of magnitude, and the interaction and polynomial terms useful in selecting the optimal levels of independent variables.
Where, Y and b represents the quercetin inclusion and the estimated coefficient of the term, X respectively. X1,
X2 and X3 represents the main effects of the independent variables individually. The combined terms, X1 X2, X2 X3 and X1 X3 shows the interactions between the variables. The polynomial terms, X1
2, X22 , and
indicates the non-linearity of the responses. The experimental design with coded levels and the real values of the independent variables are shown in Table 1. The results of the quercetin inclusion efficiency obtained from the design generated experimental trials are shown in Table 2.
Table 1 Coded levels and real values for independent variables
VARIABLES LEVELS
-1.73 -1 0 +1 +1.73
Independent Real values
Quercetin : phospholipids ratio (X1, w: w) 1: 0.55 1:1.05 1:1.78 1:2.51 1:3.00
Reaction temperature (X2, °C) 40.4 44.4 50.1 56.2 60.2
Reaction time (X3, h) 1.0 1.4 2.1 2.6 3.00
Dependent
Extent of complexation or Yield (Y, % w/w)
Table 2 Quercetin inclusion efficiency obtained from the design-generated experimental trials.
EXPERIMENTAL TRIALS X1 X2 X3
QUERCETIN INCLUSION EFFICIENCY
(%, w/w)
1 -1 +1 +1 65.23 ± 0.10
2 0 -1.73 0 97.57 ± 0.16
3 0 +1.73 0 72.25 ± 0.23
4 0 0 0 95.38 ± 0.11
5 -1.73 0 0 68.50 ± 0.04
6 0 0 0 94.92 ± 0.22
7 -1 -1 -1 72.10 ± 0.45
8 0 0 -1.73 96.48 ± 0.15
9 -1 +1 -1 56.38 ± 0.33
10 +1 -1 +1 94.33 ± 0.19
11 0 0 0 94.29 ± 0.21
12 +1 -1 -1 83.03 ± 0.18
13 0 0 0 95.38 ± 0.75
14 0 0 0 95.38 ± 0.75
15 +1 +1 +1 86.60 ± 0.05
16 0 0 0 95.38 ± 0.15
17 +1.73 0 0 87.40 ± 0.20
18 +1 +1 -1 88.39 ± 0.16
19 0 0 +1.73 90.80 ± 0.03
20 -1 -1 +1 87.48 ± 0.10
Y b b X b X b X b X b X
b X b X X b X X b
= + + + + + +
+ + +0 1 1 2 2 3 3 11 1
222 2
2
33 32
12 1 2 23 2 3 113 1 3X XEq. 1
X23
This Journal is © IPEC-Americas June 2018 J. Excipients and Food Chem. 9 (2) 2018 34
Original Article
Estimation of the quercetin inclusion in the prepared complex The extent of the quercetin inclusion in the prepared complex was determined by a slightly modified method to that described previously (26). Briefly, an accurately weighed amount of the prepared QPLC (containing ~ 50 mg quercetin) was dispersed into 5 mL chloroform. The QPLC and any unused Phospholipon® 90H were readily dissolved in the chloroform. The unused (pure, non-complexed quercetin) remained undissolved, and was separated as a precipitate. This precipitate was separated by filtration (Whatman® quantitative filter paper, ashless, Grade 41, Sigma-Aldrich Corporation, St. Louis, MO), and dried at room temperature. The dried residue was dissolved in sufficient methanol, and after suitable dilutions, analyzed spectrally (Model: V-630, JASCO International Co., Ltd., Tokyo, Japan) at a wavelength of 381.2 nm. The amount of quercetin incorporated in the prepared QPLC was calculated using Equation 2.
Quercetin inclusionC CC
xt f
t
(%)=−
100 Eq. 2
Where, Ct is the total theoretical amount of quercetin in QPLC used, and Cf is the amount of quercetin in the filtrate.
Preparation of the quercetin or QPLC-loaded matrix film formulation (Q-MF or QPLC-MF)
The quercetin or QPLC-loaded matrix films were prepared using a solvent casting method reported previously (30). Briefly, accurately weighed HPMC E15 (700 mg) was dispersed in a mixture of methanol: chloroform (1:1, 10 mL) using a magnetic stirrer until a homogeneous dispersion was formed. To this polymeric dispersion, dibutyl phthalate (plasticizer, 2 mL) and dimethyl sulfoxide (permeation enhancer, 0.5 mL) was added. The dispersion was stirred well to ensure the removal of air bubbles, if any. An accurately weighed amount of Q-MF (containing ~30 mg of quercetin) or QPLC (containing ~30 mg of quercetin, prepared earlier) was added to this dispersion stirring
continuously to ensure that the quercetin or QPLC particles were uniformly distributed throughout the polymeric dispersion. This polymeric dispersion containing quercetin or QPLC was then poured into a pre-fabricated, circular glass well placed in a glass petri dish filled three fourths with mercury. The mold was covered with inverted glass funnel to qualitatively control the rate of solvent evaporation. The assembly was placed in a solvent hood overnight to facilitate solvent evaporation, and obtain dried films. The obtained dry matrix films were then packed in aluminum foil and stored in desiccators at a controlled temperature (25°C) until further use.
Physical-chemical characterization of QPLC
Particle size and zeta potential analysis
The particle size and zeta potential analysis of the design-optimized QPLC formulation was carried out using methods reported previously (28). Photon Cross Correlation Spectroscopy (PCCS) together with dynamic light scattering was used to evaluate the particle size distribution of the QPLC formulation. An aqueous dispersion (0.5 mg/mL) of QPLC was prepared and examined using a particle size analyzer (Model: NANOPHOX Sympatec, GmbH, Clausthal-Zellerfeld, Germany). The equipment was sensitive in the range of 1 nm to 10 µm, and flexibility of positioning the sample to optimize the count rate using the associated software. A nano particle analyzer (NanoPlusTM-2, Particulate system, Norcross, GA, USA) equipped with dynamic light scattering was used to measure the zeta potential of the QPLC formulation. The measurements were conducted at room temperature within the equipment sensitivity range of -200 to 200 mV.
Thermal analysis
Differential scanning calorimetry (DSC) was used for comparative thermal characterization of the pure quercetin, Phospholipon® 90H, the physical mixture of quercetin and Phospholipon® 90H, and the design-optimized QPLC formulation. The instrument (Model: DSC-1 821e, Mettler-Toledo AG, Analytical,

This Journal is © IPEC-Americas June 2018 J. Excipients and Food Chem. 9 (2) 2018 35
Original Article
Schwerzenbach, Switzerland) was pre-calibrated for heat flow and heat capacity with high-purity indium standard. The sample chamber was continuously purged with nitrogen (50 mL/min). Individual samples (2.0 ± 0.2 mg) were subjected to a single heating cycle in the range of 40 to 400°C at the rate of 10°C/min. The DSC thermograms obtained for each sample were analyzed with the software (Universal Analysis 2000, V4.5A, build 4.5.0.5) accompanying the instrument.
Fourier transform infrared spectroscopy (FTIR)
Pure quercetin, Phospholipon® 90H, the physical mixture of quercetin and Phospholipon® 90H, and the design-optimized QPLC formulation were further chemically characterized and compared using an FTIR spectroscopy. The samples were tested using an FTIR spectrophotometer (Model: FTIR-8300, Shimadzu, Kyoto, Japan). Sample preparation involved preparing potassium bromide (KBr) pellets containing ~2 mg air-dried samples. Thin transparent discs of KBr were compressed on a Mini Hand Press (Model: MHP -1, P/N – 200-66747-91, Shimadzu, Kyoto, Japan) at a pressure of 10 ton/Nm2. Individual sample discs were scanned within a wavelength ranging from 4000 to 400 cm-1, with a scan resolution of 4 cm-1. The obtained spectra were analyzed by the software (IRsolution FTIR control software, version 1.10) associated with the instrument.
Powder X-ray diffractometry (PXRD)
The comparative crystalline nature of pure quercetin, Phospholipon® 90H, the physical mixture of quercetin and Phospholipon® 90H, and the design-optimized QPLC formulation were studied using a PXRD on a x-ray diffractometer (Model: D8 ADVANCE, Bruker AXS, Inc., Madison, WI, USA) equipped with Bragg-Brentano geometry (θ/2θ) optical setup. The method reported previously was used to analyze the samples (28).
Proton nuclear magnetic resonance spectroscopy (1H-NMR)
The structural framework of individual samples
as well as the prepared QPLC formulation was analyzed by proton NMR using a 400 MHz FT-NMR spectrophotometer (Model: Bruker Advance II, Bruker, Rheinstatten, Germany) with an operational temperature range of -90°C to 80°C.
Solubility analysis
The aqueous and non-aqueous solubility of pure quercetin, as well as quercetin in the physical mixture with Phospholipon® 90H, or in the prepared QPLC was determined using a procedure established previously (27). Briefly, 5 mL dispersions of samples were prepared in purified water or n-octanol and agitated on a water bath shaker (Model: RSB-12, Remi House, Mumbai, India) for 24 hours. The dispersions were then centrifuged at 1500 RPM for 25 minutes at ambient temperature (25°C). The dispersions, after centrifugation, were filtered using a membrane filter (0.45 µm). The filtrates, after appropriate dilution with water or methanol were assayed spectrally at 381.2 nm using UV-visible spectrophotometer (Model: V-630, JASCO International Co., Ltd., Tokyo, Japan).
Physical-chemical characterization of QPLC-MF
The physical-chemical attributes of the prepared QPLC-loaded matrix films were evaluated using various methods described below.
Film thickness and weight variation
The thickness of the prepared QPLC-loaded matrix films (surface area at 1.0 cm2) was measured using a digital thickness gauge (Model: 500-JD, Electromatic Equipment Co., INC. Cedarhurst, NY, USA). The measurements were carried out in triplicate and the mean calculated. The same films were used for weight variation study. The films were weighed using a digital balance (Model: CAS -164, serial no.1502677, capacity ~160g, sensitivity ~0.1mg, Contech® Electronic Balance, Contech Instrument Pvt., Ltd., Mahape, Navi Mumbai) and calculating the average weight of six films.
This Journal is © IPEC-Americas June 2018 J. Excipients and Food Chem. 9 (2) 2018 36
Original Article
Moisture contentFinal weight of film Initial weight of film
In(%)=
−iitial weight of film
x 100 Eq. 3
Folding endurance
The prepared films were evaluated for folding endurance using a well-established procedure (30). A 6 cm2 film is repeatedly folded at the same location multiple times until it breaks. The number of foldings required to break a film is described as the folding endurance. All measurements were carried out in triplicate.
Quercetin content in QPLC-MF
The quercetin content of the prepared QPLC-loaded matrix films was determined after extracting quercetin from a film sample of fixed dimensions (1 cm2). Briefly, the film was cut, weighed and transferred to a volumetric flask containing sufficient quantity of methanol. The flask contents were agitated on a water bath shaker (Model: RSB-12, Remi House, Mumbai, India) for 24 hours at 37°C. After 24 hours, the flask contents were filtered (Whatman® quantitative filter paper, ashless, Grade 41, Sigma-Aldrich Corporation, St. Louis, MO), the filtrate diluted suitably, and the solutions assayed spectrally at 381.2 nm on a UV-visible spectrophotometer (Model: V-630, JASCO International Co., Ltd., Tokyo, Japan).
QPLC-MF moisture content
The moisture content of the prepared films was determined using the standard procedure reported earlier (30). Each sample formulation film (random triplicates of same dimensions) were individually weighed (initial weight) and placed in desiccators at a constant temperature (25°C). The films were weighed at regular intervals until a constant weight (final weight) for each film was achieved. The moisture content (%) was calculated using Equation 3.
QPLC-MF moisture uptake
The hygroscopicity (extent of ambient moisture
uptake) of a film formulation is a good indicator of the physical stability of the films. To assess the moisture uptake of the prepared QPLC-loaded matrix films, the pre-weighed film samples of fixed dimensions were exposed to elevated humidity condition (saturated NaCl solution, ~75% RH). The samples were weighed at regular intervals until a constant weight was achieved (final weight). The moisture uptake (%) was calculated using Equation 3.
Functional characterization of QPLC and QPLC-MF
As described below, the prepared complex (QPLC) was first characterized for the in vitro release and diffusion of quercetin across a dialysis membrane. Subsequently, the prepared QPLC-loaded matrix film (QPLC-MF) was characterized for in vitro diffusion of quercetin across a dialysis membrane, ex vivo permeation efficiency of quercetin across rat abdominal skin membrane, and in vivo anti-inflammatory activity in rats.
In vitro dissolution studies
The dissolution profiles of pure quercetin and the prepared complex (QPLC) were compared using a dialysis method described earlier by Maiti et. al. (31). The dialysis membrane (LA395, dialysis membrane-110, average diameter ~21.55 mm, average flat width ~32.34 mm, capacity ~3.63 mL/cm; HiMedia Laboratories, Mumbai, India) was pre-treated and rinsed according to the manufacturer’s guidelines. The molecular size cut off of the dialysis membrane was 12000 – 14000 Da. The dialysis bags were prepared and loaded with samples i.e., pure quercetin suspension in phosphate buffer saline (PBS, pH 7.4, containing ~5 mg quercetin) or QPLC (containing ~5 mg quercetin). The sample loaded bags were vertically suspended in a beaker containing PBS (200 mL, pH 7.4) and Tween®
20 (1% w/w) as a dissolution medium. The assembly was stirred at 50 RPM, and the temperature of the dissolution medium was maintained at 37.0 ± 2.0°C. At regular intervals, aliquots (5 mL) of the dissolution medium were removed, diluted suitably with PBS, and absorbance recorded at 381.2 nm (ƛmax for quercetin in PBS, pH 7.4) on a UV-visible spectrophotometer (Model: V-630, JASCO International Co., Ltd.,
This Journal is © IPEC-Americas June 2018 J. Excipients and Food Chem. 9 (2) 2018 37
Original Article
Tokyo, Japan).
In vitro diffusion studies
The in vitro diffusion of quercetin from the quercetin-loaded matrix films (Q-MF) and QPLC-loaded matrix film (QPLC-MF) were determined using a method reported previously by Parhi et. al. (32). The studies were carried out using a Franz diffusion cell with an exposed surface area of 3.8 cm2. The dialysis membrane of the specifications described above was pre-soaked (overnight) in phosphate buffer (pH 7.4) before using in experiments. On the day of the experiment, the membrane was mounted between the donor and the receptor compartment of the cell. The receptor compartment was filled with PBS (22 mL, pH 7.4), magnetically stirred at 200 RPM, and maintained at 32.0 ± 0.5°C (mimicking human skin temperature). Q-MF (containing ~5 mg quercetin) or QPLC-MF (containing ~5 mg quercetin) was then placed over the membrane. At regular intervals, aliquots (1 mL) of the dissolution medium were removed, diluted suitably with PBS (pH 7.4), and spectral absorbance recorded at 381.2 nm. The measured absorbance was used to estimate the cumulative amount of quercetin diffused across the membrane.
Ex vivo skin permeation studies
The comparative permeation efficiencies of quercetin from the quercetin-loaded matrix films (Q-MF) and quercetin present in the prepared QPLC-loaded matrix film (QPLC-MF) were determined using a method reported previously by Parhi et. al. (32). The Franz diffusion cell described above was used for the experiments. On the day of experiment, a freshly excised, hairless rat abdominal skin membrane was prepared and hydrated in PBS (pH 7.4) for 1 hour. The skin was mounted between the donor and the receptor compartment with the stratum corneum facing the donor compartment. Q-MF (containing ~5 mg quercetin) or QPLC-MF (containing ~5 mg quercetin) was then placed on the skin surface (donor compartment). The diffusion cell was placed on a magnetic stirrer (200 RPM), and the temperature of
the receptor compartment maintained at 32.0 ± 0.5°C.
At predetermined intervals, aliquots of samples were retrieved from the receptor compartment, diluted and assayed at 381.2 nm on a UV-visible spectrophotometer (Model: V-630, JASCO International Co., Ltd., Tokyo, Japan) to determine the cumulative amount of quercetin permeated through the rat skin membrane.
In vivo anti-inflammatory studies
The prepared QPLC-loaded films were subjected to preliminary pharmacological evaluation using the carrageenan-induced rat paw edema model described by Arora et. al. (33). In-house bred Albino rats (Wistar strain, 200-250 g) of either sex were used for the experiments. The animals were housed in clean colony cages maintained at controlled temperature (25 ± 5°C) and humidity (50 ± 5% RH) conditions with 12-hour light/dark cycle. The food (Pellet chow, Brook Bond, Lipton, India) and water was provided ad libitum to all animals. The dorsal surface (back) of all animals was shaved 12 hours prior to the experiment. The Committee for the Purpose of Control and Supervision of Experiments on Animals (CPCSEA) ethical guidelines were followed when carrying out the experimental protocol. The experimental protocol (SKBCOP/IAEC/2016 -17, dated August 12, 2016) was approved by the Institutional Animal Ethical Committee (IAEC) of Smt. Kishoritai Bhoyar College of Pharmacy, New Kamptee, Nagpur, Maharashtra, India.
The animals were separated into three groups of six animals each. The Group I animals received injections of a homogenous suspension (0.1 mL, 1% w/v) of carrageenan in double-distilled water, in the left hind paw, and served as control. Q-MF (20 mg/kg quercetin) and QPLC-MF (20 mg/kg quercetin) films were applied to the back of group II and group III animals, respectively. These animals also received injections of carrageenan suspension in the left hind paw, half an hour after the treatment with the test formulations. The volume of paw edema was measured at 1, 2, 3, 4, 5, 6, 8, 10, and 12 hours using a digital plethysmometer (VJ
This Journal is © IPEC-Americas June 2018 J. Excipients and Food Chem. 9 (2) 2018 38
Original Article
InstrumentsTM, Washim, India). The inhibition (%) of rat paw edema by the test formulations was calculated using Equation 4.
Inhibitionedema control edema test drug
edema control(%)
( ) ( )( )
=−
xx 100 Eq. 4
Statistical analysis
The results are presented as mean ± standard deviation. ANOVA followed by post-hoc Dunnett’s or Student’s t-test was used to assess the significance of difference between groups. The value of p < 0.05 was considered to indicate the statistically significant difference between groups. RESULTS AND DISCUSSION
Formulation of quercetin-phospholipid complex (QPLC)
In the current study, a phospholipid-based complex of quercetin was prepared by solvent evaporation method to improve its aqueous solubility and physiological delivery. Several studies have reported the hydrophobic nature of flavonoids, resulting in sub-optimal aqueous solubility of such compounds (28, 34, 35). These studies recommended using dichloromethane, tetrahydrofuran or 1, 4-dioxane as a choice of solvent for preparing phospholipid-based complexes. However, the observations from preliminary studies showed that quercetin displayed poor solubility, and precipitated out of DCM, THF and 1, 4-dioxane. Hence, alternative solvents were explored to overcome this challenge. Anhydrous ethanol being a semi polar, class III solvent with low dielectric constant, was chosen as solvent of choice for the formulation of QPLC. For the preparation of the quercetin- or QPLC-loaded matrix films a binary solvent combination of methanol: chloroform (1:1) was found to be ideal.
Optimizing variables (central composite design)
The results of the quercetin inclusion efficiency
obtained from the 20 experimental trial formulations suggested by the central composite design are shown in Table 2. The prepared trial formulations showed a wide range of quercetin inclusion ranging from 65 to 97%. The data analyzing software (Design Expert®) displayed the results numerically in the form of ANOVA and a polynomial equation. For all the trial experiments, both quadratic and cubic mathematical models were displayed by the design. However, based on the analysis of significance, the quadratic model was found to be a more reliable description of the results. The obtained polynomial, equation (Equation 5), containing the magnitude of coefficients, together with the positive (+) or negative (-) signs associated with them was used to optimize the formulation.
Y X X X X X
X X
= + − + − − −
+
95 31 7 55 6 07 1 78 7 22 4 82
1 73 4 461 2 3 1
222
32
. . . . . .
. . 11 2 2 3 1 32 44 1 84X X X X X− −. .Eq. 5
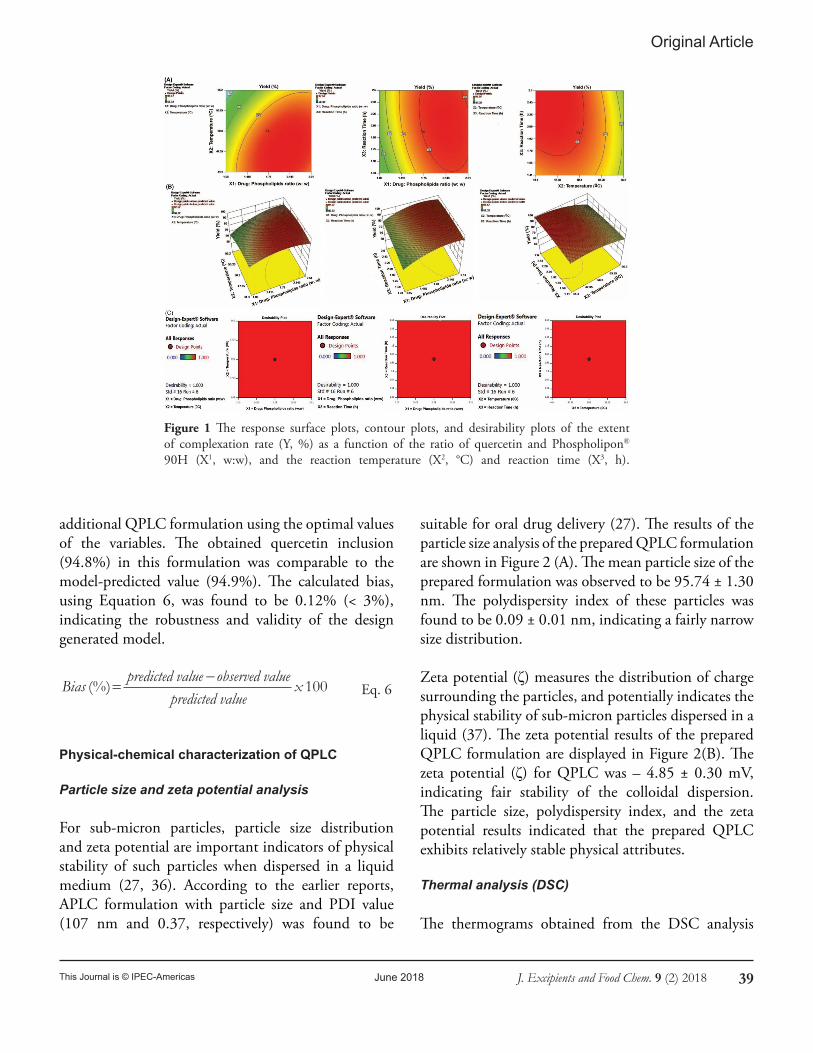
Where, the coefficients b0, b1, b2, b11, b12, and b22 exhibited values with p<0.05, indicating their significance. Whereas, the coefficients b3, b33, b23, and b13 showed p>0.05 indicating that these terms were non-significant. The summary statistics of the model also showed the correlation coefficient (R2 = 0.9908) and F-value (10.08) to be statistically significant (p<0.05). The signs (+ or –) associated with the coefficients indicated that quercetin inclusion in the prepared formulations increased with increasing X1 and X3, and decreased with increasing X2. Finally, using a numerical optimization method, the levels of independent variables used for trial formulation number 6 (Table 2) with a desirability value close to 1 was selected to optimize the formulation. The influence of the studied variables on the extent of quercetin inclusion is shown in the form of response surface, contour and desirability plots in Figure 1. The levels of independent variables for this formulation were quercetin: phospholipid at a ratio of 1:1.78, reaction temperature at 50°C and reaction time of 2 hours.
Validation of the optimized model
The above model was validated by preparing an
This Journal is © IPEC-Americas June 2018 J. Excipients and Food Chem. 9 (2) 2018 39
Original Article
Figure 1 The response surface plots, contour plots, and desirability plots of the extent of complexation rate (Y, %) as a function of the ratio of quercetin and Phospholipon® 90H (X1, w:w), and the reaction temperature (X2, °C) and reaction time (X3, h).
additional QPLC formulation using the optimal values of the variables. The obtained quercetin inclusion (94.8%) in this formulation was comparable to the model-predicted value (94.9%). The calculated bias, using Equation 6, was found to be 0.12% (< 3%), indicating the robustness and validity of the design generated model.
Biaspredicted value observed value
predicted valuex(%)=
−100 Eq. 6
Physical-chemical characterization of QPLC
Particle size and zeta potential analysis
For sub-micron particles, particle size distribution and zeta potential are important indicators of physical stability of such particles when dispersed in a liquid medium (27, 36). According to the earlier reports, APLC formulation with particle size and PDI value (107 nm and 0.37, respectively) was found to be
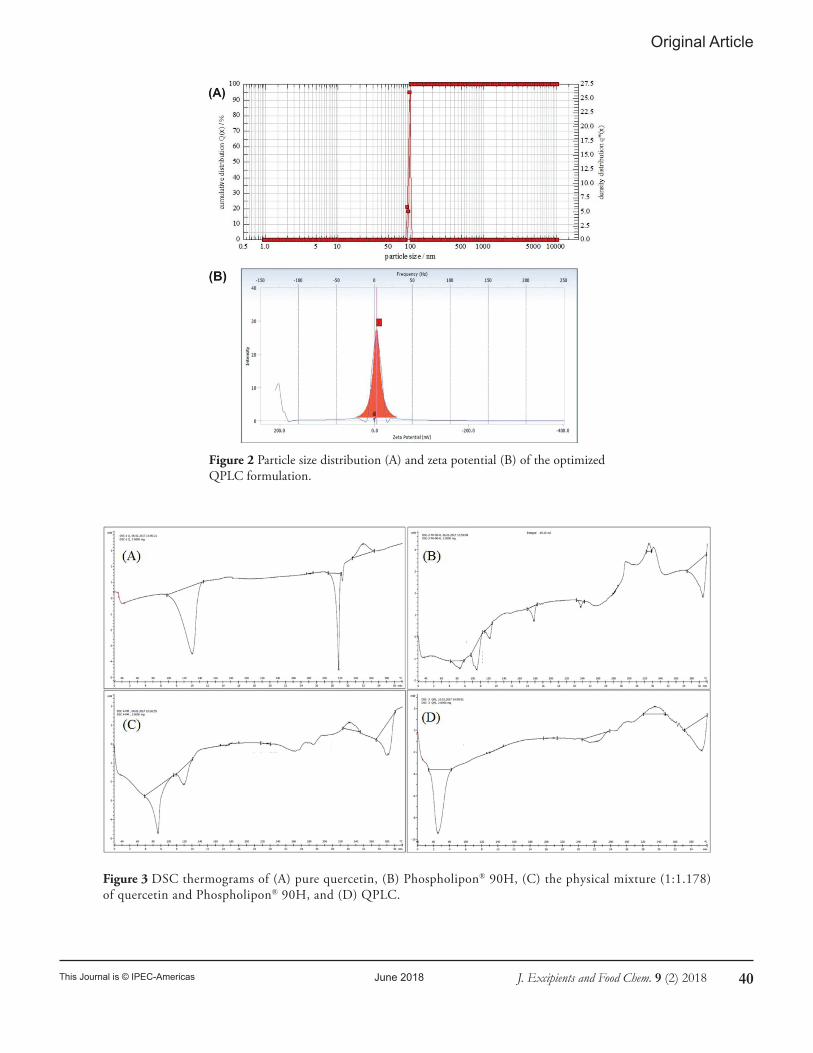
suitable for oral drug delivery (27). The results of the particle size analysis of the prepared QPLC formulation are shown in Figure 2 (A). The mean particle size of the prepared formulation was observed to be 95.74 ± 1.30 nm. The polydispersity index of these particles was found to be 0.09 ± 0.01 nm, indicating a fairly narrow size distribution.
Zeta potential (ζ) measures the distribution of charge surrounding the particles, and potentially indicates the physical stability of sub-micron particles dispersed in a liquid (37). The zeta potential results of the prepared QPLC formulation are displayed in Figure 2(B). The zeta potential (ζ) for QPLC was – 4.85 ± 0.30 mV, indicating fair stability of the colloidal dispersion. The particle size, polydispersity index, and the zeta potential results indicated that the prepared QPLC exhibits relatively stable physical attributes.
Thermal analysis (DSC)
The thermograms obtained from the DSC analysis
This Journal is © IPEC-Americas June 2018 J. Excipients and Food Chem. 9 (2) 2018 40
Original Article
Figure 2 Particle size distribution (A) and zeta potential (B) of the optimized QPLC formulation.
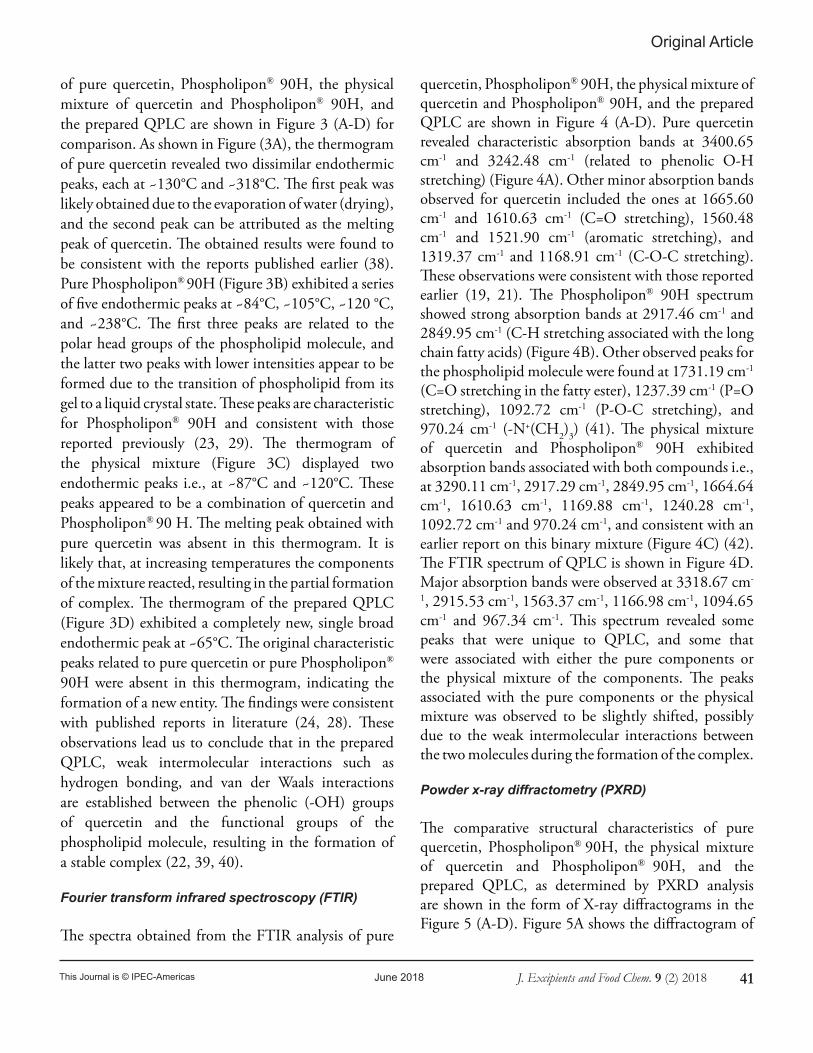
Figure 3 DSC thermograms of (A) pure quercetin, (B) Phospholipon® 90H, (C) the physical mixture (1:1.178) of quercetin and Phospholipon® 90H, and (D) QPLC.
This Journal is © IPEC-Americas June 2018 J. Excipients and Food Chem. 9 (2) 2018 41
Original Article
of pure quercetin, Phospholipon® 90H, the physical mixture of quercetin and Phospholipon® 90H, and the prepared QPLC are shown in Figure 3 (A-D) for comparison. As shown in Figure (3A), the thermogram of pure quercetin revealed two dissimilar endothermic peaks, each at ~130°C and ~318°C. The first peak was likely obtained due to the evaporation of water (drying), and the second peak can be attributed as the melting peak of quercetin. The obtained results were found to be consistent with the reports published earlier (38). Pure Phospholipon® 90H (Figure 3B) exhibited a series of five endothermic peaks at ~84°C, ~105°C, ~120 °C, and ~238°C. The first three peaks are related to the polar head groups of the phospholipid molecule, and the latter two peaks with lower intensities appear to be formed due to the transition of phospholipid from its gel to a liquid crystal state. These peaks are characteristic for Phospholipon® 90H and consistent with those reported previously (23, 29). The thermogram of the physical mixture (Figure 3C) displayed two endothermic peaks i.e., at ~87°C and ~120°C. These peaks appeared to be a combination of quercetin and Phospholipon® 90 H. The melting peak obtained with pure quercetin was absent in this thermogram. It is likely that, at increasing temperatures the components of the mixture reacted, resulting in the partial formation of complex. The thermogram of the prepared QPLC (Figure 3D) exhibited a completely new, single broad endothermic peak at ~65°C. The original characteristic peaks related to pure quercetin or pure Phospholipon®
90H were absent in this thermogram, indicating the formation of a new entity. The findings were consistent with published reports in literature (24, 28). These observations lead us to conclude that in the prepared QPLC, weak intermolecular interactions such as hydrogen bonding, and van der Waals interactions are established between the phenolic (-OH) groups of quercetin and the functional groups of the phospholipid molecule, resulting in the formation of a stable complex (22, 39, 40).
Fourier transform infrared spectroscopy (FTIR)
The spectra obtained from the FTIR analysis of pure
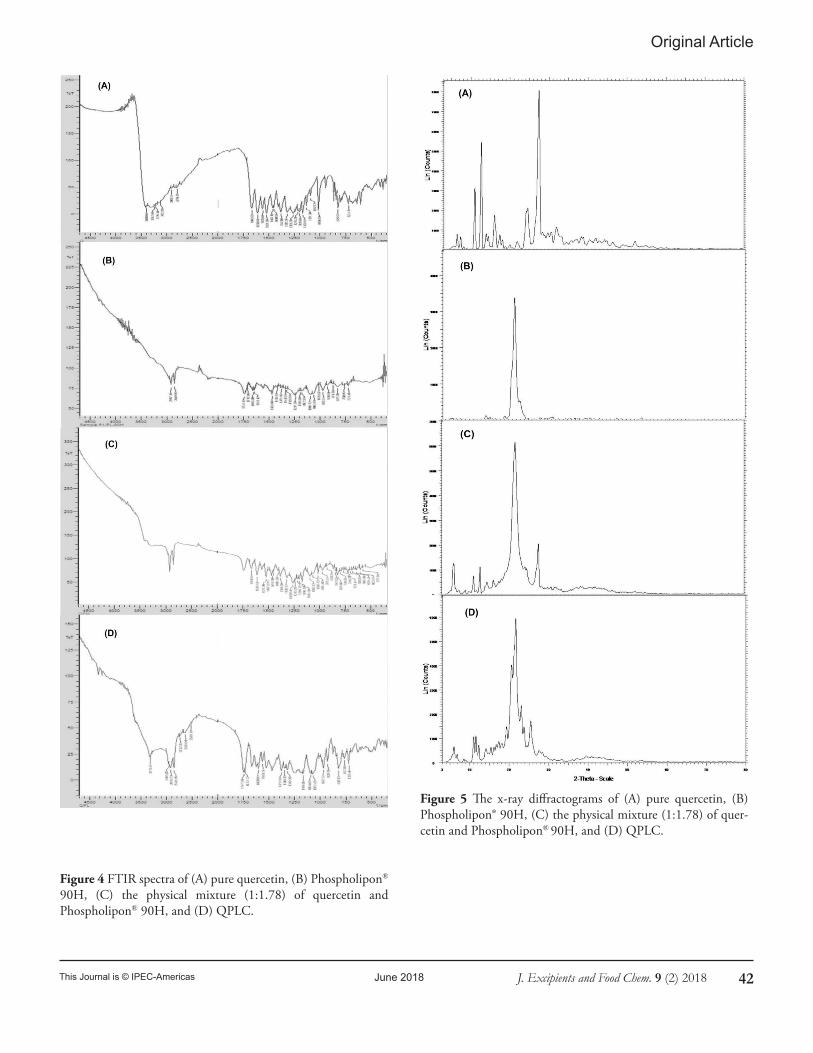
quercetin, Phospholipon® 90H, the physical mixture of quercetin and Phospholipon® 90H, and the prepared QPLC are shown in Figure 4 (A-D). Pure quercetin revealed characteristic absorption bands at 3400.65 cm-1 and 3242.48 cm-1 (related to phenolic O-H stretching) (Figure 4A). Other minor absorption bands observed for quercetin included the ones at 1665.60 cm-1 and 1610.63 cm-1 (C=O stretching), 1560.48 cm-1 and 1521.90 cm-1 (aromatic stretching), and 1319.37 cm-1 and 1168.91 cm-1 (C-O-C stretching). These observations were consistent with those reported earlier (19, 21). The Phospholipon® 90H spectrum showed strong absorption bands at 2917.46 cm-1 and 2849.95 cm-1 (C-H stretching associated with the long chain fatty acids) (Figure 4B). Other observed peaks for the phospholipid molecule were found at 1731.19 cm-1 (C=O stretching in the fatty ester), 1237.39 cm-1 (P=O stretching), 1092.72 cm-1 (P-O-C stretching), and 970.24 cm-1 (-N+(CH2)3) (41). The physical mixture of quercetin and Phospholipon® 90H exhibited absorption bands associated with both compounds i.e., at 3290.11 cm-1, 2917.29 cm-1, 2849.95 cm-1, 1664.64 cm-1, 1610.63 cm-1, 1169.88 cm-1, 1240.28 cm-1, 1092.72 cm-1 and 970.24 cm-1, and consistent with an earlier report on this binary mixture (Figure 4C) (42). The FTIR spectrum of QPLC is shown in Figure 4D. Major absorption bands were observed at 3318.67 cm-
1, 2915.53 cm-1, 1563.37 cm-1, 1166.98 cm-1, 1094.65 cm-1 and 967.34 cm-1. This spectrum revealed some peaks that were unique to QPLC, and some that were associated with either the pure components or the physical mixture of the components. The peaks associated with the pure components or the physical mixture was observed to be slightly shifted, possibly due to the weak intermolecular interactions between the two molecules during the formation of the complex.
Powder x-ray diffractometry (PXRD)
The comparative structural characteristics of pure quercetin, Phospholipon® 90H, the physical mixture of quercetin and Phospholipon® 90H, and the prepared QPLC, as determined by PXRD analysis are shown in the form of X-ray diffractograms in the Figure 5 (A-D). Figure 5A shows the diffractogram of
This Journal is © IPEC-Americas June 2018 J. Excipients and Food Chem. 9 (2) 2018 42
Original Article
Figure 4 FTIR spectra of (A) pure quercetin, (B) Phospholipon® 90H, (C) the physical mixture (1:1.78) of quercetin and Phospholipon® 90H, and (D) QPLC.
Figure 5 The x-ray diffractograms of (A) pure quercetin, (B) Phospholipon® 90H, (C) the physical mixture (1:1.78) of quer-cetin and Phospholipon® 90H, and (D) QPLC.
This Journal is © IPEC-Americas June 2018 J. Excipients and Food Chem. 9 (2) 2018 43
Original Article
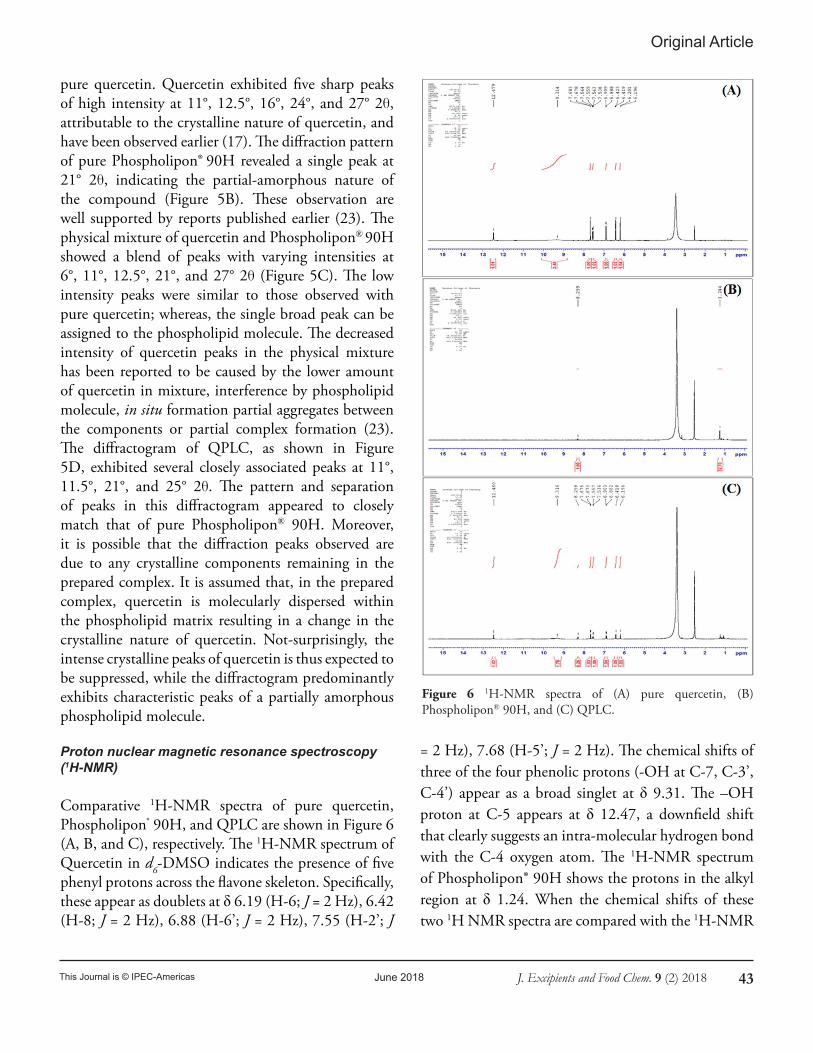
Figure 6 1H-NMR spectra of (A) pure quercetin, (B) Phospholipon® 90H, and (C) QPLC.
pure quercetin. Quercetin exhibited five sharp peaks of high intensity at 11°, 12.5°, 16°, 24°, and 27° 2θ, attributable to the crystalline nature of quercetin, and have been observed earlier (17). The diffraction pattern of pure Phospholipon® 90H revealed a single peak at 21° 2θ, indicating the partial-amorphous nature of the compound (Figure 5B). These observation are well supported by reports published earlier (23). The physical mixture of quercetin and Phospholipon® 90H showed a blend of peaks with varying intensities at 6°, 11°, 12.5°, 21°, and 27° 2θ (Figure 5C). The low intensity peaks were similar to those observed with pure quercetin; whereas, the single broad peak can be assigned to the phospholipid molecule. The decreased intensity of quercetin peaks in the physical mixture has been reported to be caused by the lower amount of quercetin in mixture, interference by phospholipid molecule, in situ formation partial aggregates between the components or partial complex formation (23). The diffractogram of QPLC, as shown in Figure 5D, exhibited several closely associated peaks at 11°, 11.5°, 21°, and 25° 2θ. The pattern and separation of peaks in this diffractogram appeared to closely match that of pure Phospholipon® 90H. Moreover, it is possible that the diffraction peaks observed are due to any crystalline components remaining in the prepared complex. It is assumed that, in the prepared complex, quercetin is molecularly dispersed within the phospholipid matrix resulting in a change in the crystalline nature of quercetin. Not-surprisingly, the intense crystalline peaks of quercetin is thus expected to be suppressed, while the diffractogram predominantly exhibits characteristic peaks of a partially amorphous phospholipid molecule.
Proton nuclear magnetic resonance spectroscopy (1H-NMR)
Comparative 1H-NMR spectra of pure quercetin, Phospholipon® 90H, and QPLC are shown in Figure 6 (A, B, and C), respectively. The 1H-NMR spectrum of Quercetin in d6-DMSO indicates the presence of five phenyl protons across the flavone skeleton. Specifically, these appear as doublets at δ 6.19 (H-6; J = 2 Hz), 6.42 (H-8; J = 2 Hz), 6.88 (H-6’; J = 2 Hz), 7.55 (H-2’; J
= 2 Hz), 7.68 (H-5’; J = 2 Hz). The chemical shifts of three of the four phenolic protons (-OH at C-7, C-3’, C-4’) appear as a broad singlet at δ 9.31. The –OH proton at C-5 appears at δ 12.47, a downfield shift that clearly suggests an intra-molecular hydrogen bond with the C-4 oxygen atom. The 1H-NMR spectrum of Phospholipon® 90H shows the protons in the alkyl region at δ 1.24. When the chemical shifts of these two 1H NMR spectra are compared with the 1H-NMR
This Journal is © IPEC-Americas June 2018 J. Excipients and Food Chem. 9 (2) 2018 44
Original Article
Table 3 Aqueous and non-aqueous solubility of pure quercetin, the physical mixture of quercetin with Phospholipon® 90H, and the optimized QPLC formulation.
SAMPLESAQUEOUS
SOLUBILITY(µg/mL)
n-OCTANOL SOLUBILITY
(µg/mL)
Pure quercetin 2.56 ± 0.45 857.28 ± 0.76
Quercetin: Phospholipon® 90H (1:1.78) 31.90 ± 1.12 890.73 ± 0.91
QPLC 58.50 ± 1.02 910.90 ± 1.15
Physical-chemical characterization of QPLC-MF
The results of physical-chemical characterization of the prepared QPLC-loaded matrix films are discussed below. The average thickness of the prepared films was found to be 160.9 ± 11.2 µm. The average weight of the films was observed to be 17.02 ± 1.4 mg. The folding endurance test results showed that the prepared QPLC films survived an average of 230 ± 1.45 strokes of folding/unfolding at the same location before demonstrating any appearance of racking/breaking. These observations are considered to be acceptable for similar formulations (30). These results showed that when applied on the skin surface the film would endure general movements and maintain its integrity. The average moisture content (% w/w) of the films maintained at controlled temperatures (25°C) was found to be 1.24 ± 0.65. This moisture level is not expected to influence the physical-chemical stability of the formulation. The average maximum moisture uptake (% w/w) of the films subjected to higher humidity (75% RH) was 8.51 ± 1.08. The increase in moisture uptake was possibly due to the presence of HPMC E15 as a component of the films, and has been reported earlier (30). These films may thus be required to be packaged/stored in moisture-free environment. The quercetin content of the films was 1.21 ± 0.031 mg.
Functional characterization of QPLC and QPLC-MF
In vitro dissolution studies
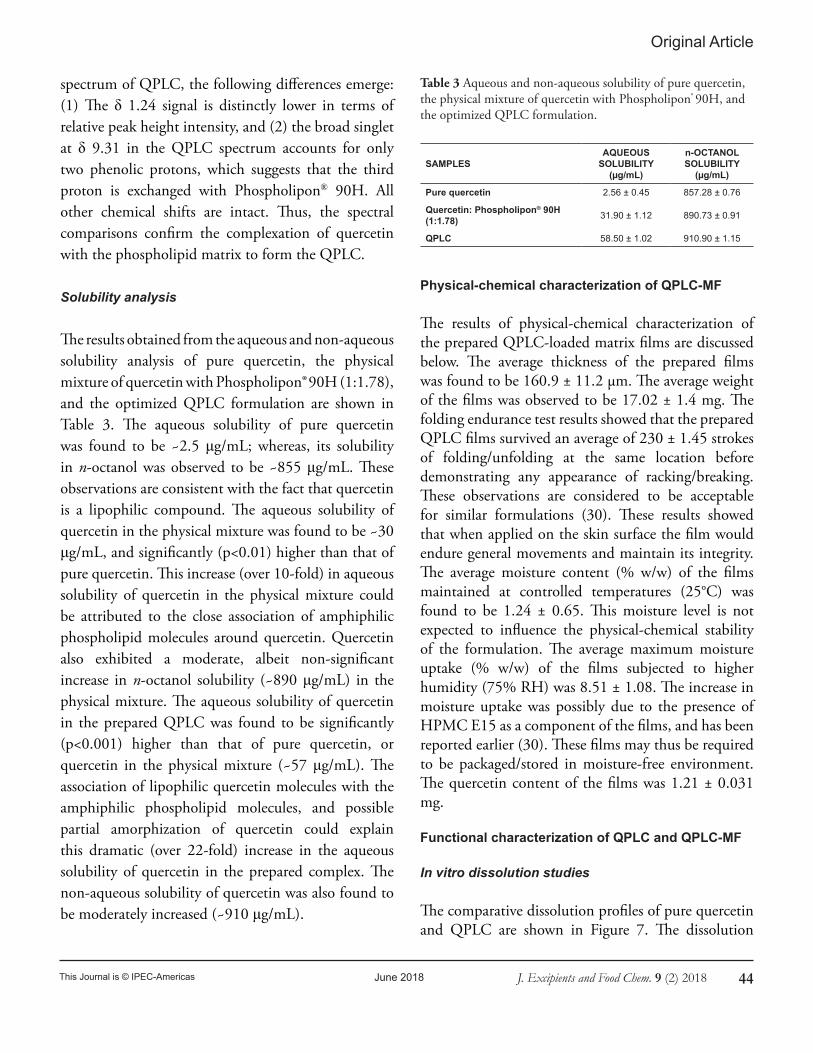
The comparative dissolution profiles of pure quercetin and QPLC are shown in Figure 7. The dissolution
spectrum of QPLC, the following differences emerge: (1) The δ 1.24 signal is distinctly lower in terms of relative peak height intensity, and (2) the broad singlet at δ 9.31 in the QPLC spectrum accounts for only two phenolic protons, which suggests that the third proton is exchanged with Phospholipon® 90H. All other chemical shifts are intact. Thus, the spectral comparisons confirm the complexation of quercetin with the phospholipid matrix to form the QPLC.
Solubility analysis
The results obtained from the aqueous and non-aqueous solubility analysis of pure quercetin, the physical mixture of quercetin with Phospholipon® 90H (1:1.78), and the optimized QPLC formulation are shown in Table 3. The aqueous solubility of pure quercetin was found to be ~2.5 μg/mL; whereas, its solubility in n-octanol was observed to be ~855 μg/mL. These observations are consistent with the fact that quercetin is a lipophilic compound. The aqueous solubility of quercetin in the physical mixture was found to be ~30 μg/mL, and significantly (p<0.01) higher than that of pure quercetin. This increase (over 10-fold) in aqueous solubility of quercetin in the physical mixture could be attributed to the close association of amphiphilic phospholipid molecules around quercetin. Quercetin also exhibited a moderate, albeit non-significant increase in n-octanol solubility (~890 μg/mL) in the physical mixture. The aqueous solubility of quercetin in the prepared QPLC was found to be significantly (p<0.001) higher than that of pure quercetin, or quercetin in the physical mixture (~57 μg/mL). The association of lipophilic quercetin molecules with the amphiphilic phospholipid molecules, and possible partial amorphization of quercetin could explain this dramatic (over 22-fold) increase in the aqueous solubility of quercetin in the prepared complex. The non-aqueous solubility of quercetin was also found to be moderately increased (~910 μg/mL).
This Journal is © IPEC-Americas June 2018 J. Excipients and Food Chem. 9 (2) 2018 45
Original Article
Figure 7 The in vitro dissolution profiles of pure quercetin and QPLC. Values are mean ± Standard Deviation (n = 3).
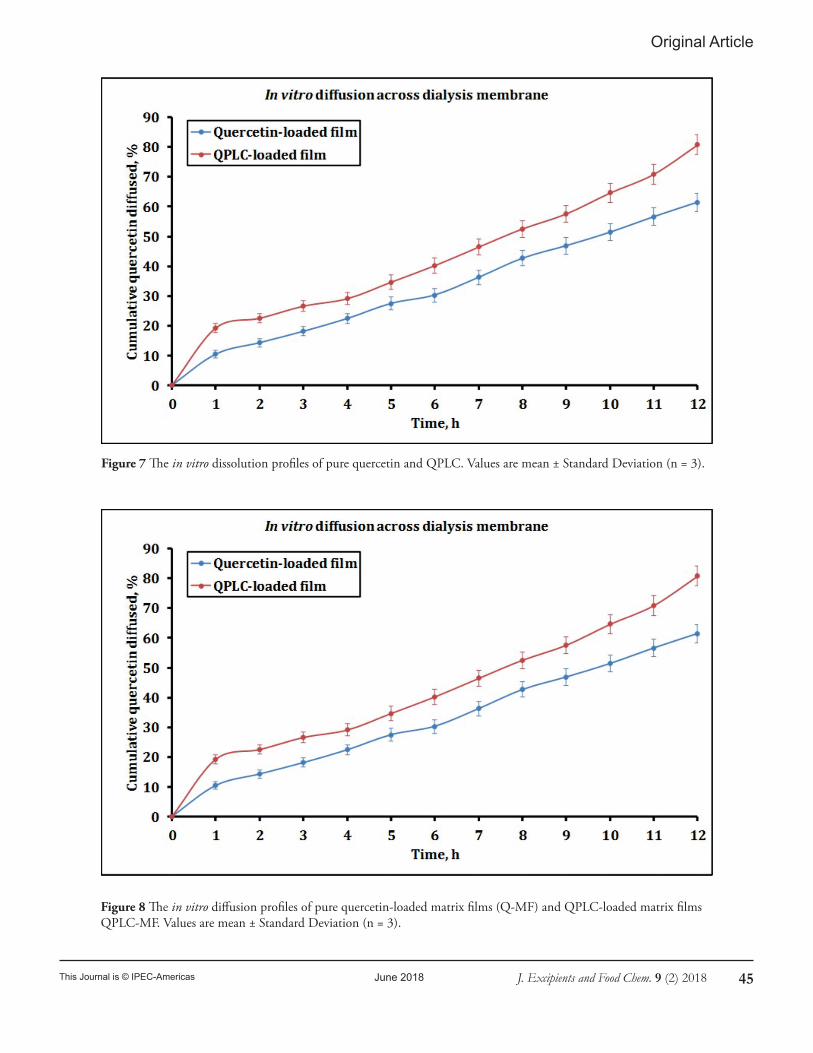
Figure 8 The in vitro diffusion profiles of pure quercetin-loaded matrix films (Q-MF) and QPLC-loaded matrix films QPLC-MF. Values are mean ± Standard Deviation (n = 3).

This Journal is © IPEC-Americas June 2018 J. Excipients and Food Chem. 9 (2) 2018 46
Original Article
rates of pure quercetin and quercetin in QPLC were found to be similar during the initial 3 hours, beyond which, QPLC exhibited a progressively increasing, and a significantly higher rate and extent of quercetin dissolution. At the end of 12 hours, pure quercetin showed ~69 % dissolution. In the same time period, over 90 % quercetin was released from QPLC. The observed increase in rate and extent of quercetin from QPLC can be attributed to the enhanced wettability and solubility of quercetin in the presence of amphiphilic phospholipid molecules, and is consistent with earlier reports (43). Various release-kinetics models such as zero order, first order, Higuchi, and Korsmeyer-Peppas, etc. were evaluated to describe the release mechanism of quercetin. Upon statistical evaluation of the models, Korsmeyer-Peppas model was observed to be the best-fitting kinetic model with a regression coefficient of R2 = 0.9979 and the release exponent n = 0.88. The model describes the dissolution as a ‘non-fickian’ release mechanism correlating with the diffusion process. This process is known to occur in two stages, i.e., dissociation of quercetin molecule from QPLC, and diffusion of quercetin molecules across the phospholipid matrix (22, 44).
In vitro diffusion studies
Figure 8 shows the comparative in vitro diffusion profiles of quercetin from Q-MF and QPLC-MF across dialysis membrane. QPLC-loaded films exhibited a significantly higher rate and extent of quercetin diffusion compared to that observed from pure quercetin-loaded films at all tested time points. At the end of the 12-hour testing period, only about 60% of quercetin was found to diffuse across the membrane from Q-MF, compared to over 80% diffusion of quercetin observed with QPLC-MF. As seen with the dissolution results, we assume that close proximity of quercetin to the phospholipid molecules in QPLC-MF was likely reason for the higher diffusivity of quercetin from these films. In addition, previous studies have reported that other film components, i.e., hydrophilic polymers, plasticizers, penetration enhancers etc. could also potentially influence the diffusion of drug through the films (32, 45, 46). Thus, the components
used to prepare the films in the current study, HPMC E15 (hydrophilic matrix forming polymer), dibutyl phthalate (plasticizer), and dimethyl sulfoxide (penetration enhancer) may have likely contributed to quercetin diffusion.
Ex vivo skin permeation studies
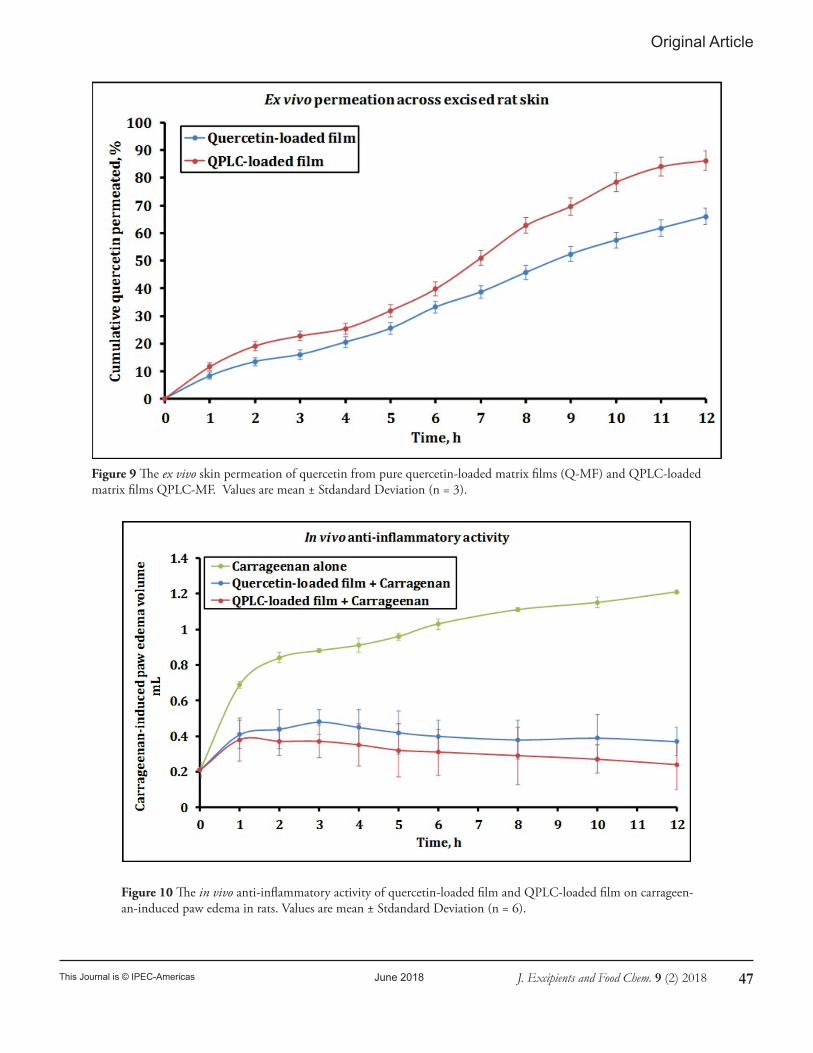
A comparison of quercetin permeability across isolated rat abdominal skin from Q-MF and QPLC-MF is shown in Figure 9. As observed with the diffusion results, QPLC-loaded films exhibited a significantly higher rate and extent of quercetin permeation compared to that observed from pure quercetin-loaded films at all tested time points. At the end of the 12-hour testing period, more than 85 % of the quercetin from the QPLC-MF was found to permeate across the skin, compared to only about 65% of quercetin permeability observed with Q-MF. The differences in the permeability profiles of Q-MF and QPLC-MF were statistically significant (p<0.01). As described above, a combination of phospholipid-complexation and permeation-promoting film components can be considered as contributing factors to the observed enhanced quercetin permeability from QPLC-loaded films.
In vivo anti-inflammatory studies
The preliminary pharmacological evaluation of the prepared films was conducted using carrageenan-induced paw edema in Wistar rats to assess the anti-inflammatory potential of quercetin. The results obtained are shown in Figure 10. The group I animals subjected to carrageenan-alone treatment showed a progressively increasing paw-edema (swelling of the paw), exhibited as increasing paw volume over a period of 12 hours. The animals receiving Q-MF (group II) or QPLC-MF (group III) before carrageenan injections showed a significant (p<0.05) protection against carrageenan-induced inflammatory swelling. This protection was found to be significant over the entire observation period of 12 hours. The difference between
This Journal is © IPEC-Americas June 2018 J. Excipients and Food Chem. 9 (2) 2018 47
Original Article
Figure 9 The ex vivo skin permeation of quercetin from pure quercetin-loaded matrix films (Q-MF) and QPLC-loaded matrix films QPLC-MF. Values are mean ± Stdandard Deviation (n = 3).
Figure 10 The in vivo anti-inflammatory activity of quercetin-loaded film and QPLC-loaded film on carrageen-an-induced paw edema in rats. Values are mean ± Stdandard Deviation (n = 6).
This Journal is © IPEC-Americas June 2018 J. Excipients and Food Chem. 9 (2) 2018 48
Original Article
the protective effects of Q-MF and QPLC-MF was not statistically significant. However, QPLC-MF appeared to be slightly more efficacious than Q-MF. These results supports the observations from the in vitro and ex vivo results showing increased solubility and permeability of quercetin from the prepared QPLC-loaded films. It can thus be inferred that phospholipid complexation, combined with incorporation of the complex in a film formulation enhanced the in vivo bioavailability of quercetin, resulting in pharmacological efficacy via transdermal route.
CONCLUSIONS
In this current study, a novel combined approach, i.e. quercetin-phospholipid complexation and incorporation of this complex into a transdermal film formulation, to enhance the solubility, permeability, and subsequently bioavailability of quercetin is presented. The quercetin-phospholipid complex (QPLC) was prepared using a solvent evaporation method. The formulation and process variables were optimized using a central composite design. The physical-chemical characterization of the prepared formulation supported the formation of a complex, and indicated involvement of weak intermolecular interactions between quercetin and phospholipid molecules. The QPLC-loaded films were prepared using a solvent casting method. The physical-chemical characterization studies supported the formation of acceptable transdermal films. Complexation with phospholipid resulted in a significant improvement in the solubilization and dissolution rate of quercetin. The permeability of quercetin across dialysis membrane and excised rat abdominal skin was also found to be enhanced in the prepared film formulation. Finally, the preliminary pharmacological evaluation of the prepared films confirmed the transdermal anti-inflammatory efficacy of quercetin. The study thus provides an alternative approach for efficient delivery of phytoconstituents and other pharmacoactive molecules with low bioavailability. Further studies are certainly warranted to better understand the formulation and other functional aspects of the system.
REFERENCES
1 Erlund, I., Review of the flavonoids quercetin, hesperetin, and naringenin. Dietary sources, bioactivities, bioavailability, and epidemiology. Nutr. Res., 2004. 24(10): p. 851-874.
2 Miean, K.H. and Mohamed, S., Flavonoid (Myricetin, Quer-cetin, Kaempferol, Luteolin, and Apigenin) Content of Ed-ible Tropical Plants. J. Agric. Food Chem., 2001. 49(6): p. 3106-3112.
3 Wach, A., Pyrzyńska, K., and Biesaga, M., Quercetin content in some food and herbal samples. Food Chem., 2007. 100(2): p. 699-704.
4 Zhao, L., Shi, Y., Zou, S., Sun, M., Lil, L., and Zhail, G., Formulation and in vitro evaluation of quercetin loaded poly-meric micelles composed of pluronic P123 and D-a-tocoph-eryl polyethylene glycol succinate. J. Biomed. Nanotechnol., 2011. 7(3): p. 358-65.
5 Comalada, M., Camuesco, D., Sierra, S., Ballester, I., Xaus, J., Gálvez, J., and Zarzuelo, A., In vivo quercitrin anti-inflam-matory effect involves release of quercetin, which inhibits in-flammation through down-regulation of the NF-KB pathway. Eur. J. Immunol., 2005. 35(2): p. 584-592.
6 Fang, X.-K., Gao, J., and Zhu, D.-N., Kaempferol and quer-cetin isolated from Euonymus alatus improve glucose uptake of 3T3-L1 cells without adipogenesis activity. Life Sci., 2008. 82(11): p. 615-622.
7 Hatahet, T., Morille, M., Hommoss, A., Dorandeu, C., Müller, R.H., and Bégu, S., Dermal quercetin smartCrystals®: Formulation development, antioxidant activity and cellular safety. Eur. J. Pharm. Biopharm., 2016. 102: p. 51-63.
8 Lin, C.-F., Leu, Y.-L., Al-Suwayeh, S.A., Ku, M.-C., Hwang, T.-L., and Fang, J.-Y., Anti-inflammatory activity and per-cutaneous absorption of quercetin and its polymethoxylat-ed compound and glycosides: The relationships to chemical structures. Eur. J. Pharm. Sci., 2012. 47(5): p. 857-864.
9 Ossola, B., Kaariainen, T.M., and Mannisto, P.T., The multi-ple faces of quercetin in neuroprotection. Expert Opin. Drug Saf., 2009. 8(4): p. 397-409.
10 Scambia, G., Ranelletti, F.O., Benedetti Panici, P., Piantelli, M., Bonanno, G., De Vincenzo, R., Ferrandina, G., Pierel-li, L., Capelli, A., and Mancuso, S., Quercetin inhibits the growth of a multidrug-resistant estrogen-receptor-negative MCF-7 human breast-cancer cell line expressing type II es-trogen-binding sites. Cancer Chemother. Pharmacol., 1991. 28(4): p. 255-8.
11 Yamamoto, Y. and Oue, E., Antihypertensive effect of quer-cetin in rats fed with a high-fat high-sucrose diet. Biosci. Bio-

This Journal is © IPEC-Americas June 2018 J. Excipients and Food Chem. 9 (2) 2018 49
Original Article
technol. Biochem., 2006. 70(4): p. 933-9.
12 Zhang, H., Zhang, M., Yu, L., Zhao, Y., He, N., and Yang, X., Antitumor activities of quercetin and quercetin-5’,8-di-sulfonate in human colon and breast cancer cell lines. Food Chem. Toxicol., 2012. 50(5): p. 1589-99.
13 Karadag, A., Ozcelik, B., and Huang, Q., Quercetin nano-suspensions produced by high-pressure homogenization. J. Agric. Food Chem., 2014. 62(8): p. 1852-9.
14 Fearn, R.A. and Hirst, B.H., Predicting oral drug absorption and hepatobiliaryclearance: Human intestinal and hepatic in vitro cell models. Environ. Toxicol. Pharmacol., 2006. 21(2): p. 168-178.
15 Gugler, R., Leschik, M., and Dengler, H.J., Disposition of quercetin in man after single oral and intravenous doses. Eur. J. Clin. Pharmacol., 1975. 9(2): p. 229-234.
16 Lauro, M.R., Torre, M.L., Maggi, L., De Simone, F., Conte, U., and Aquino, R.P., Fast- and slow-release tablets for oral administration of flavonoids: rutin and quercetin. Drug Dev. Ind. Pharm., 2002. 28(4): p. 371-9.
17 Gao, L., Liu, G., Wang, X., Liu, F., Xu, Y., and Ma, J., Prepa-ration of a chemically stable quercetin formulation using nanosuspension technology. Int. J. Pharm., 2011. 404(1): p. 231-237.
18 Gilley, A.D., Arca, H.C., Nichols, B.L.B., Mosquera-Giraldo, L.I., Taylor, L.S., Edgar, K.J., and Neilson, A.P., Novel cel-lulose-based amorphous solid dispersions enhance quercetin solution concentrations in vitro. Carbohydr. Polym., 2017. 157: p. 86-93.
19 Natarajan, V., Krithica, N., Madhan, B., and Sehgal, P.K., Formulation and Evaluation of Quercetin Polycaprolactone Microspheres for the Treatment of Rheumatoid Arthritis. J. Pharm. Sci., 2011. 100(1): p. 195-205.
20 Tan, Q., Liu, W., Guo, C., and Zhai, G., Preparation and evaluation of quercetin-loaded lecithin-chitosan nanoparti-cles for topical delivery. Int. J. Nanomedicine, 2011. 6: p. 1621-30.
21 Wang, Q., Hu, C., Zhang, H., Zhang, Y., Liu, T., Qian, A., and Xia, Q., Evaluation of a new solid non-aqueous self-dou-ble-emulsifying drug-delivery system for topical application of quercetin. J. Microencapsul., 2016. 33(8): p. 785-794.
22 Zhang, J., Tang, Q., Xu, X., and Li, N., Development and evaluation of a novel phytosome-loaded chitosan microsphere system for curcumin delivery. Int. J. Pharm., 2013. 448(1): p. 168-174.
23 Cai, X., Luan, Y., Jiang, Y., Song, A., Shao, W., Li, Z., and Zhao, Z., Huperzine A-phospholipid complex-loaded bio-
degradable thermosensitive polymer gel for controlled drug release. Int. J. Pharm., 2012. 433(1-2): p. 102-11.
24 Saoji, S.D., Belgamwar, V.S., Dharashivkar, S.S., Rode, A.A., Mack, C., and Dave, V.S., The Study of the Influence of For-mulation and Process Variables on the Functional Attributes of Simvastatin–Phospholipid Complex. Journal of Pharma-ceutical Innovation, 2016. 11(3): p. 264-278.
25 Saoji, S.D., Dave, V.S., Dhore, P.W., Bobde, Y.S., Mack, C., Gupta, D., and Raut, N.A.,The role of phospholipid as a solubility- and permeability-enhancing excipient for the im-proved delivery of the bioactive phytoconstituents of Bacopa monnieri. Eur. J. Pharm. Sci., 2016.
26 Saoji, S.D., Raut, N.A., Dhore, P.W., Borkar, C.D., Pop-ielarczyk, M., and Dave, V.S., Preparation and Evaluation of Phospholipid-Based Complex of Standardized Centella Ex-tract (SCE) for the Enhanced Delivery of Phytoconstituents. The AAPS Journal, 2016. 18(1): p. 102-114.
27 Telange, D.R., Patil, A.T., Pethe, A.M., Fegade, H., Anand, S., and Dave, V.S., Formulation and characterization of an apigenin-phospholipid phytosome (APLC) for improved sol-ubility, in vivo bioavailability, and antioxidant potential. Eur. J. Pharm. Sci., 2016.
28 Telange, D.R., Patil, A.T., Pethe, A.M., Tatode, A.A., Anand, S., and Dave, V.S., Kaempferol-phospholipid complex: for-mulation, and evaluation of improved solubility, in vivo bio-availability, and antioxidant potential of kaempferol. Journal of Excipients and Food Chemicals, 2016.
29 Bhattacharyya, S., Ahammed, S.M., Saha, B.P., and Mukher-jee, P.K., The Gallic Acid–Phospholipid Complex Improved the Antioxidant Potential of Gallic Acid by Enhancing Its Bioavailability. AAPS PharmSciTech, 2013. 14(3): p. 1025-1033.
30 Saoji, S.D., Atram, S.C., Dhore, P.W., Deole, P.S., Raut, N.A., and Dave, V.S., Influence of the Component Excipi-ents on the Quality and Functionality of a Transdermal Film Formulation. AAPS PharmSciTech, 2015. 16(6): p. 1344-1356.
31 Maiti, K., Mukherjee, K., Murugan, V., Saha, B.P., and Mukherjee, P.K., Exploring the Effect of Hesperetin–HSPC Complex—A Novel Drug Delivery System on the In Vitro Release, Therapeutic Efficacy and Pharmacokinetics. AAPS PharmSciTech, 2009. 10(3): p. 943.
32 Parhi, R. and Suresh, P., Transdermal delivery of Diltiazem HCl from matrix film: Effect of penetration enhancers and study of antihypertensive activity in rabbit model. Journal of Advanced Research, 2016. 7(3): p. 539-550.
33 Arora, P. and Mukherjee, B., Design, development, physi-

This Journal is © IPEC-Americas June 2018 J. Excipients and Food Chem. 9 (2) 2018 50
Original Article
modeling on drug release from controlled drug delivery sys-tems. Acta Pol. Pharm., 2010. 67(3): p. 217-23.
45 Patel, D.P., Setty, C.M., Mistry, G.N., Patel, S.L., Patel, T.J., Mistry, P.C., Rana, A.K., Patel, P.K., and Mishra, R.S., Devel-opment and Evaluation of Ethyl Cellulose-Based Transdermal Films of Furosemide for Improved In Vitro Skin Permeation. AAPS PharmSciTech, 2009. 10(2): p. 437-442.
46 Limpongsa, E. and Umprayn, K., Preparation and evaluation of diltiazem hydrochloride diffusion-controlled transdermal delivery system. AAPS PharmSciTech, 2008. 9(2): p. 464-70.
cochemical, and in vitro and in vivo evaluation of transder-mal patches containing diclofenac diethylammonium salt. J. Pharm. Sci., 2002. 91(9): p. 2076-89.
34 Karthivashan, G., Masarudin, M.J., Kura, A.U., Abas, F., and Fakurazi, S., Optimization, formulation, and characterization of multiflavonoids-loaded flavanosome by bulk or sequential technique. Int. J. Nanomedicine, 2016. 11: p. 3417-34.
35 Yue, P.-F., Yuan, H.-L., Li, X.-Y., Yang, M., and Zhu, W.-F., Process optimization, characterization and evaluation in vivo of oxymatrine–phospholipid complex. Int. J. Pharm., 2010. 387(1): p. 139-146.
36 Tan, Q., Liu, S., Chen, X., Wu, M., Wang, H., Yin, H., He, D., Xiong, H., and Zhang, J., Design and Evaluation of a Novel Evodiamine-Phospholipid Complex for Improved Oral Bioavailability. AAPS PharmSciTech, 2012. 13(2): p. 534-547.
37 Dhore, P.W., Dave, V.S., Saoji, S.D., Bobde, Y.S., Mack, C., and Raut, N.A., Enhancement of the aqueous solubility and permeability of a poorly water soluble drug ritonavir via lyo-philized milk-based solid dispersions. Pharm. Dev. Technol., 2017. 22(1): p. 90-102.
38 Jain, A.S., Shah, S.M., Nagarsenker, M.S., Nikam, Y., Gude, R.P., Steiniger, F., Thamm, J., and Fahr, A., Lipid colloidal carriers for improvement of anticancer activity of orally deliv-ered quercetin: formulation, characterization and establishing in vitro-in vivo advantage. J. Biomed. Nanotechnol., 2013. 9(7): p. 1230-40.
39 Lasonder, E. and Weringa, W.D., An NMR and DSC study of the interaction of phospholipid vesicles with some anti-in-flammatory agents. J. Colloid Interface Sci., 1990. 139(2): p. 469-478.
40 Venema, F.R. and Weringa, W.D., The interactions of phos-pholipid vesicles with some anti-inflammatory agents. J. Col-loid Interface Sci., 1988. 125(2): p. 484-492.
41 Semalty, A., Semalty, M., Singh, D., and Rawat, M.S.M., Phyto-phospholipid complex of catechin in value added herb-al drug delivery. J. Inclusion Phenom. Macrocyclic Chem., 2012. 73(1): p. 377-386.
42 Singh, D., S.M. Rawat, M., Semalty, A., and Semalty, M., Quercetin-Phospholipid Complex: An Amorphous Pharma-ceutical System in Herbal Drug Delivery. Curr. Drug Discov-ery Technol., 2012. 9(1): p. 17-24.
43 Perrut, M., Jung, J., and Leboeuf, F., Enhancement of disso-lution rate of poorly-soluble active ingredients by supercriti-cal fluid processes. Int. J. Pharm., 2005. 288(1): p. 3-10.
44 Dash, S., Murthy, P.N., Nath, L., and Chowdhury, P., Kinetic