Embed Size (px)
Citation preview

AUA Hellas
Christos A. Karavitis
Stavros Alexandris
Vassilia Fassouli
Dimitris Tsesmelis
Dimitris Stamatakos Nikos Skondras
Agricultural Agricultural UniversityUniversity of Athens of Athens
HellasHellas
Drought Vulnerability IndexDrought Vulnerability Index

AUA Hellas
Assessment MethodologyAssessment Methodology

AUA Hellas

AUA Hellas
Definition of DroughtDefinition of Drought
A creeping phenomenon, a “non-event”
• Operational definitions attempt to demarcate the severity, onset and termination point of droughts
• Conceptual definitions attempt to identify the boundaries of the drought event

AUA HellasCopyright © 2004 National Drought Mitigation Center

AUA Hellas
Water DeficienciesWater Deficiencies

AUA Hellas
Drought
• a usually unexpected and unpredicted time period of abnormal dryness which affects water supply" (Grigg, N.S., 1988).
• The state of adverse and wide spread hydrological, environmental, social and economic impacts due to less than generally anticipated water quantities (Karavitis, 1992)

AUA Hellas
Social and Economic Drought /Water resources Engineering
• Gap between supply and demand of economic goods such as – water,
– food,
– raw materials,
– hydroelectric power,
– transportation
• depends on the time and space processes of supply and demand
• Social Stresses – Economic impacts

AUA Hellas
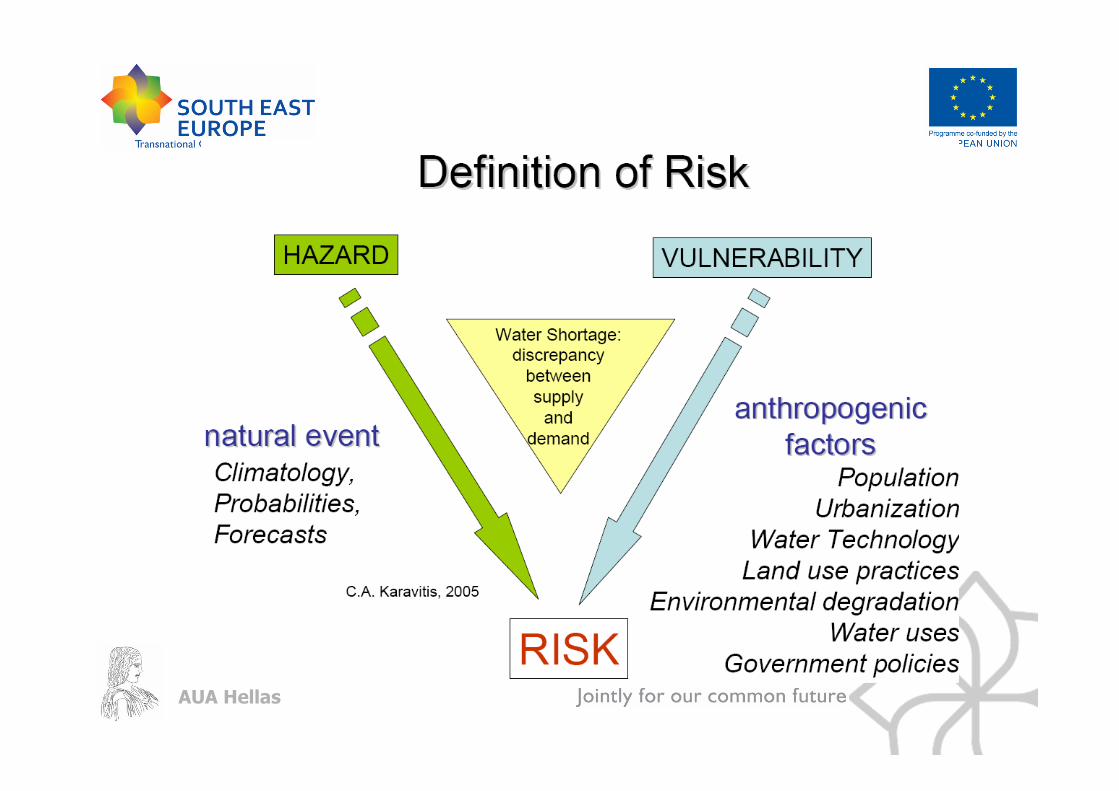
VULNERABILITYVULNERABILITY
[a][a] Fragile Physical EnvironmentFragile Physical Environment
= environmental degradation= environmental degradation
= lack of ecosystem resilience= lack of ecosystem resilience
= history of extreme hydrological events= history of extreme hydrological events
[b][b] Fragile EconomyFragile Economy
= economic inequalities/disparities= economic inequalities/disparities
= inadequate funding= inadequate funding
[c][c] Lack of Local InstitutionsLack of Local Institutions
= lack of social resilience= lack of social resilience
= poor social protection= poor social protection
= marginalization= marginalization
= capacity for recuperability= capacity for recuperability
[d][d] Lack of PreparednessLack of Preparedness
= inadequate warning systems= inadequate warning systems
= lack of training= lack of training
= lack of community mobilization= lack of community mobilization

AUA Hellas
DROUGHT FORECASTINGDROUGHT FORECASTING
• Statistical predictions: based on lagged relationships between regional meteorological patterns (i.e. rainfall) and actual data.
• Probabilistic predictions: by trying to estimate the mathematical probability of a given phenomenon in a certain time frame based usually on analysis of time series data.
• Deterministic predictions: which attempt to model important features of the existing system and provide a basis for contingency analysis through simulation

AUA Hellas

AUA Hellas
1890 1900 1910 1920 1930 1940 1950 1960 1970 1980 1990 2000
Years
0
2
4
6
8
10
12
14
16
18
20
22
Pe
rce
nta
ge
of
nu
mb
er
of
da
ys w
ith
pre
cip
ita
tio
n >
20
mm
Percentage of rain days with rain more than 20 Percentage of rain days with rain more than 20
mm from 1891 to 2004 over mm from 1891 to 2004 over Athens (NOA)Athens (NOA)

AUA Hellas
1890 1900 1910 1920 1930 1940 1950 1960 1970 1980 1990 2000
Years
0
2
4
6
8
10
12
14
Pe
rce
nta
ge
of
nu
mb
er
of
da
ys w
ith
pre
cip
ita
tio
n >
30
mm
Percentage of rain days with rain more than 30 Percentage of rain days with rain more than 30
mm from 1891 to 2004 over mm from 1891 to 2004 over Athens (NOA)Athens (NOA)

AUA Hellas
1890 1900 1910 1920 1930 1940 1950 1960 1970 1980 1990 2000
Years
0
1
2
3
4
5
6
Pe
rce
nta
ge
of
nu
mb
er
of
da
ys w
ith
pre
cip
ita
tio
n >
50
mm
Percentage of rain days with rain more than Percentage of rain days with rain more than
50 mm from 1891 to 2004 over 50 mm from 1891 to 2004 over Athens (NOA)Athens (NOA)

AUA Hellas

AUA Hellas

AUA Hellas
Cook et al., 2004Cook et al., 2004
Percent area affected by drought (PDSI) Percent area affected by drought (PDSI)

AUA Hellas
• Prevailing crisis management attitude
• Natural Hazards Emergency Response Procedures
• Protocols for Processes and Procedures
• Create a wider menu of options and alternatives
Why are Drought Contingency Why are Drought Contingency
Policies Needed?Policies Needed?
AUA Hellas

AUA Hellas

AUA Hellas
AUA Hellas
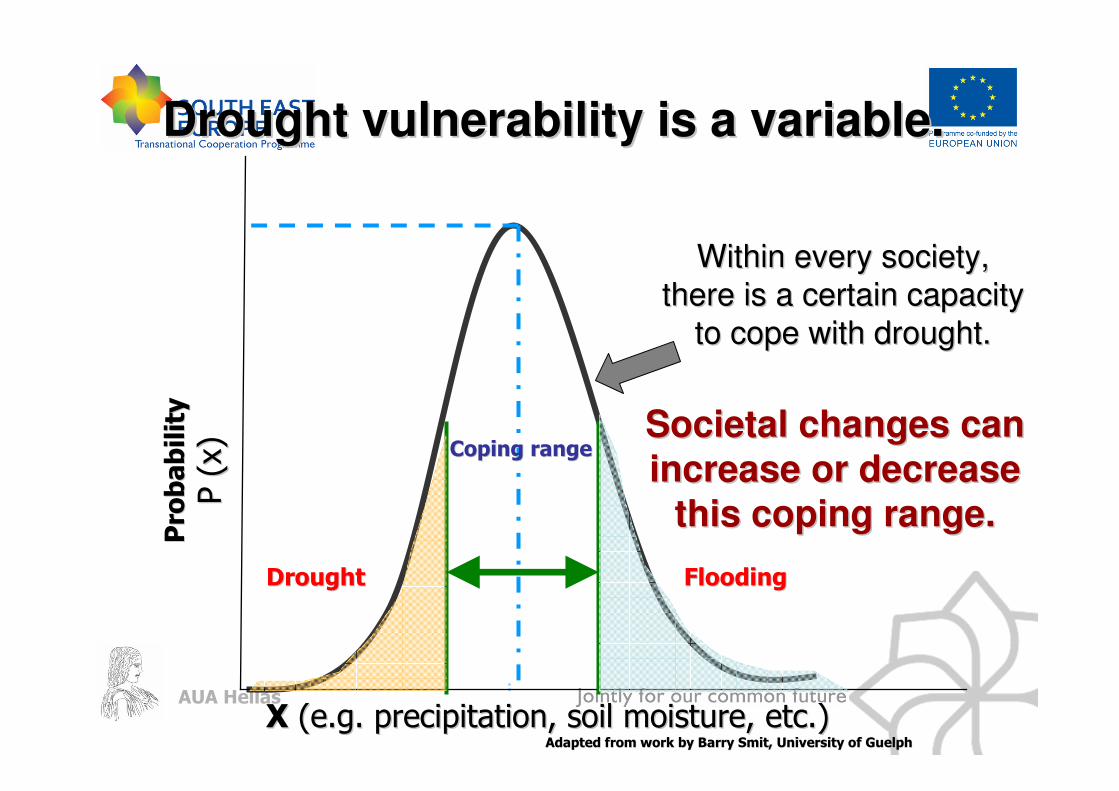
Drought Drought FloodingFlooding
Pro
ba
bil
ity
Pro
ba
bil
ity
P (
x)
P (
x)
XX (e.g. precipitation, soil moisture, etc.)(e.g. precipitation, soil moisture, etc.)
Coping rangeCoping range
Drought vulnerability is a variable.Drought vulnerability is a variable.
Adapted from work by Barry Smit, University of GuelphAdapted from work by Barry Smit, University of Guelph
Within every society, Within every society,
there is a certain capacity there is a certain capacity
to cope with drought.to cope with drought.
Societal changes can Societal changes can
increase or decrease increase or decrease
this coping range.this coping range.

AUA Hellas

AUA Hellas

AUA Hellas
Coordinator:Coordinator:
Ass. Ass. ProfProf.. Christos A. KaravitisChristos A. Karavitis
AAgricultural gricultural
UUniversity of niversity of
AAthens thens
EE--mailmail: : [email protected]@aua.gr
TECHNOLOGIES FOR WATER TECHNOLOGIES FOR WATER
RECYCLING AND REUSE IN LATIN RECYCLING AND REUSE IN LATIN
AMERICA CONTENT: ASSESSMENT, AMERICA CONTENT: ASSESSMENT,
DECISION TOOLS AND DECISION TOOLS AND
IMPLEMENTABLE STRATEGIES IMPLEMENTABLE STRATEGIES
UNDER AN UNCERTAIN UNDER AN UNCERTAIN FUTUREFUTURE
http://www.coroadohttp://www.coroado--project.euproject.eu

AUA Hellas

AUA Hellas
Methodological Framework
• Drought Impact database
• Impact assessment-Resilience
• Vulnerability assessment
• Vulnerability visualization

AUA Hellas
Interdependencies of Impacts
EcologyEcology EconomyEconomy SocietySociety
Ecological StateEcological State
Drought induced Changes of Water Quality and Water QuantityDrought induced Changes of Water Quality and Water Quantity
Ecological ContinuityEcological Continuity
Damage to animal speciesDamage to animal species
Damage to plant Damage to plant
communitiescommunities
Use Value of WaterUse Value of Water
Costs of Water SupplyCosts of Water Supply
Other economic effectsOther economic effects
HealthHealth
ConflictsConflicts
Quality of LiveQuality of Live
Demand for Evaluation Criteria (Indicators, Indices)Demand for Evaluation Criteria (Indicators, Indices)

AUA Hellas
Primary Meteorological, Agricultural or Hydrological Drought Indices
• Percent of Normal
• Deciles
• Palmer Drought Index– PDSI, PHDI, CMI
• Surface Water Supply Index
• Standardized Precipitation Index (PSI)
• Vegetation indices (NDVI, VCI, SVI)
• U.S. Drought Monitor– Composite index approach

AUA HellasFrom V. Yevyevich and E. Vlachos, 1983; C. A. Karavitis and N.SFrom V. Yevyevich and E. Vlachos, 1983; C. A. Karavitis and N.S. Grigg, 1992, 1999. Grigg, 1992, 1999

AUA Hellas
TOOLBOX FOR SUPPLY
MANAGEMENT RESPONSES

AUA Hellas
TOOLBOX FOR DEMANDMANAGEMENT RESPONSES

AUA Hellas
TOOLBOX FOR IMPACT MINIMIZATION RESPONSES

AUA Hellas

AUA Hellas
Synoptic table on mitigation practices
applied in drought periods
SEE Drought Impacts Policy Action
Countries Supply Enhancement Demand Reduction Impact Minimization infrastucture
Slovenia Drainage systems Irrigation Retention of snow infrastructure
Reservoirs, dams etc Tillage Establishment of the windbreakmaintance needs
GreeceReservoirs, dams etc
No irrigation possible in drought
periodsCrisis management
Improvement of the existing
maintenance procedures, conservation,
groundwater use, and emergency water
hauling by ships
WD -WS = DEFICIT COST
Announcement of master
plan 2008
Public information campaign on water
conservation, rationing water
new dams construction
FYROM
Albania

AUA Hellas
FeedbackFeedback……..

AUA Hellas

AUA Hellas
The relation between DVI components and drought aspectsThe relation between DVI components and drought aspects

AUA Hellas
Components:Components:
1. SPI 6 and SPI 12 1. SPI 6 and SPI 12 –– Agricultural and non Agricultural and non
agricultural useagricultural use
2. Supply and Demand 2. Supply and Demand –– Description of Supply Description of Supply
capacity and demand coveragecapacity and demand coverage
33. Impacts . Impacts –– Description of loses due to Supply Description of loses due to Supply ––
Demand deficitsDemand deficits
44. Infrastructure . Infrastructure –– Level of deficiencyLevel of deficiency

AUA Hellas
StepsSteps
1. SPI 6 and SPI 12 calculation and Kriging1. SPI 6 and SPI 12 calculation and Kriging
2. Supply and Demand Data2. Supply and Demand Data
33. Impact Data. Impact Data
44. Infrastructure Data on the Level of deficiency. Infrastructure Data on the Level of deficiency
5. Index Calculation5. Index Calculation
6. Index Visualization6. Index Visualization

AUA Hellas
Components Components
ClassificationClassification
Less Vulnerable 0 Wet ≥ 1,50 0 No Deficits 0 No Deficits 0 None 0 Complete
Vulnerable 1 Quite Wet 0 to 1,49 1 15% Deficits 1 15% Deficits 1 15% Losses 1 15% Deficiency
Highly Vulnerable 2 Quite Dry 0 to -1,49 2 16-50% Deficits 2 16-50% Deficits 2 16-50% Losses 2 16-50% Deficiency
Extremely Vulnerable 3 Dry ≤ -1,50 3 >50% Serious Deficits 3 >50% Serious Deficits 3 >50% Losses 3 >50% Deficiency
Vulneraility LevelSCALES
SPI Supply Demand Impact Infrastructure

AUA Hellas
Index ClassificationIndex Classification

AUA Hellas

AUA Hellas
Index VisualizationIndex Visualization

AUA Hellas

AUA Hellas
Questions ?Questions ?

AUA Hellas
Thank you for your attentionThank you for your attention