Embed Size (px)
Citation preview

Development and Function of the Drosophila Giant Fiber Neural Circuit
By
Tyler Joseph Kennedy
Dissertation
Submitted to the Faculty of the
Graduate School of Vanderbilt University
In partial fulfillment of the requirements
for the degree of
DOCTOR OF PHILOSOPHY
in
Biological Sciences
May 10, 2019
Nashville, Tennessee
Approved:
Douglas McMahon, Ph.D.
Kendal Broadie, Ph.D.
David Miller, Ph.D.
Manuel Ascano, Jr., Ph.D.
Todd Graham, Ph.D.

ii
Dedication
This dissertation is dedicated to Amanda, Finnegan, Janning, Scott and Jorie,
all of whom are quite simply the best.

iii
Acknowledgements
I first want to express my appreciation for the educational environment and wide range of
resources Vanderbilt University provides. It has been a pleasure to spend time on this beautiful campus,
interacting with the wonderful educators, students and staff that comprise this institution. The Biological
Sciences Department is a very special part of Vanderbilt and I am grateful for the broad scientific exposure
I received while here, especially the diversity of classes and seminars. Both department chairs during my
degree, Dr. Charles Singleton and Dr. Douglas McMahon have been incredibly kind and helpful with all
matters, especially in their support for the Graduate School Association activities. I would also like to thank
Dr. Kathy Friedman and Dr. Donna Webb for all of their work as Director of Graduate Studies. They were
always available to help with any issue relating to graduate work and unhesitating in offering guidance,
support and kind words. I also cannot express enough appreciation for the help I received from the
department’s front office. Alicia Goostree has been eternally patient and helped me with every problem
that came up, big and small. Carol Wiley knows everything there is to know about grant submission and I
cannot imagine having successfully completed mine without her. Leslie Maxwell was here when I began
the program and helped me get settled into Nashville and navigate my way through beginning a PhD.
LaDonna Smith has my enduring thanks for helping me with my endless questions about funding, traveling
for conferences, and finishing the PhD.
I want to give a special thanks to the Program in Developmental Biology. I credit this amazing
organization with a great deal of my scientific maturation. Their weekly journal club has broadened my
scientific knowledge, helped me understand how to critique a paper and shown me how to give high-
quality presentations. PDB would not be possible without a number of dedicated individuals, but I want
to especially thank Chris Wright for his impassioned dedication to this project and warm welcome to the
program.

iv
My personal scientific research has benefitted from a huge number of people. I first would like to
thank the innumerable individuals I called, emailed and spoke with over the years for sharing their advice
and reagents. It is always humbling and amazing to realize how large the scientific community around the
world is and to see how far people are willing to go to help a student with a strange science question.
Next, I would like to thank the incredible members of my committee. Dr. Douglas McMahon has been a
wonderful chair and helped me keep my proposals organized and concise. Dr. David Miller, Dr. Manual
Ascano Jr., and Dr. Todd Graham have been very supportive throughout the research process while also
keeping a sharp eye on my work and helping me identify potential weaknesses in my arguments. I would
like to thank Dr. Nick Reiter who has changed universities but was a highly valued member of my
committee before he left. I also wish to express my sincere gratitude to Dr. Donna Webb, who is no longer
with us. I was fortunate enough to take classes with Donna, rotate through her lab, and have her as a
member of my committee. She was passionate about science and her students and was always available
to help anyone who needed it. She gave extensive input on my dissertation proposal and was immensely
helpful in the organization of my experiments. I still think about her often and miss having her delightful
personality around the department.
Of key importance to all of the work that follows is the Broadie lab. I am grateful to Dr. Kendal
Broadie for accepting me into his lab and providing me guidance for all of these years. He is a tireless,
talented editor and his input on my work has made it immeasurably better. Our bi-monthly meetings have
been filled with extensive discussions about research, ideas, techniques and his inside view of the
academic and scientific worlds. I’ve learned a great deal from him and vastly improved my scientific
abilities by working in his lab. The members of the Broadie laboratory have been an unending well of
scientific knowledge and an incredible community. Meeting this group of people has changed me
fundamentally and helped shape the scientist I am today. I will always be grateful for the conversations
with, and input I received from Emma Rushton, Cheryl Gatto, Caleb Doll, James Sears, Neil Dani, Will

v
Parkinson, Mary Lynn Dear, Danielle Kopke, Dominic Vita, Randy Golovin and Qing Xia Chen. I would
especially like to thank Emma for being my rotation advisor when I first joined the lab and introducing me
to the world of Drosophila research. I also gained valuable lessons mentoring Moon Ryu, Ryan Moore and
Demi Ajao. I had no idea how to train someone to become a scientist when I arrived at Vanderbilt, and I
made a lot of mistakes along the way. I appreciate the patience my mentees had for me throughout the
process. It has been an absolute joy to work in the lab with this wonderful collection of scientists and I will
miss the spirited discussions during lab meeting and around the bench.
I also wish to acknowledge and thank my many mentors prior to arriving at Vanderbilt whose
dedication to teaching helped me make it into and through a PhD program. Pam Durkee, my high school
biology teacher was a powerful influence on my interest in the life sciences. She is a passionate and
dedicated teacher and her devotion to her craft stimulated my interest in learning and sent me down a
path towards biological research. I followed that path to the University of Redlands where I was given an
excellent education by teachers who truly care about their students and the pursuit of knowledge. I
especially want to thank Susan Blauth, Teresa Longin and David Soulsby, not only for leading fascinating
classroom discussions, but also for mentoring me during my first true research projects and helping me
learn how to read the scientific literature. After college, I took a job with Applied Speciation and
Consulting, where I met two of my greatest mentors to date: Russ Gerads and Hakan Gürleyük. Working
with Russ and Hakan changed the way I looked at science. They were willing to talk through anything,
dissect the methods and findings of any paper and attempt any research project that came their way.
They instilled a healthy sense of skepticism and critical thinking in me, which I think are among the most
important attributes a scientist can have.
Lastly, I could not have made it to this point without the unending support of my family. My
parents, Janning and Scott, have always made my education their highest priority and encouraged me in
everything I’ve done. My Mom was my first science teacher and is the source of my scientific curiosity.

vi
She always has a new science topic to discuss and I love hearing her insights on various findings. I couldn’t
ask for a better role model in work or life. My Dad has always pushed me to be the best I can be and given
endless encouragement to my pursuits. He has taken an interest in my work and asked detailed questions
about my projects. His passion for life is infectious and he has helped keep a proper perspective
throughout this program. My sister Jorie is one of my true inspirations and I am forever jealous of her
talents. She is devoted to helping others, creating a better world and seeing beauty in everything. Having
her in my life has reoriented my priorities and beliefs and I couldn’t ask for a better sister. The bulk of the
work in supporting me through this PhD has fallen on my partner in life, Amanda Clayton. She is the most
incredible and brilliant person I can imagine spending the beginning and end of every day with. Every time
I have run up against obstacles, she has been unendingly positive and uplifting. I can always discuss my
work with her and my writing has benefitted greatly from her sharp proofreading. She is always ready to
celebrate successes and talk through disappointments. She has worked hard to make sure we enjoy
everything life has to offer and ensures I do not spend all of my time working in. She has brought more
joy to me than I thought possible and I cannot thank her enough for choosing to share her life with me.
And, finally, the newest member of my support team is Finnegan Kennedy. He has perhaps been the most
disruptive person to my research program and has done everything he can to stop me from working on it
so that I can play with him. Regardless, he brings pure unbridled happiness to my life and just seeing his
little smile and hearing his little laugh is enough to prepare me for any trials the day may bring. Thank you,
everyone, from the bottom of my heart.
vii
Acknowledgement of Funding
This work was supported by National Institutes of Health Grants MH084989 (to K.B.), and NS092250 and
HD007502 (to T.K.).
Publications
Fragile X Mental Retardation Protein Restricts Small Dye Iontophoresis Entry into Central Neurons.
Kennedy T. and Broadie K. JNeuro. 2017 Sep 8; 0723—17.
Newly Identified Electrically Coupled Neurons Support Development of the Drosophila Giant Fiber
Model Circuit. Kennedy T. and Broadie K. eNeuro. 2018 Nov 26; 0346-18.

viii
Table of Contents
Page
Dedication ............................................................................................................................. ii
Acknowledgements .............................................................................................................. iii
Acknowledgement of Funding ............................................................................................. vii
Publications......................................................................................................................... vii
List of Figures and Tables ...................................................................................................... xi
List of Abbreviations ............................................................................................................ xiv
Chapter
I: Introduction ....................................................................................................................... 1
Fragile X Syndrome ................................................................................................................................... 3
FMRP: RNA-Binding Functions .............................................................................................................. 4
FMRP: Channel-Binding Functions ........................................................................................................ 8
FMRP Response to Activity ................................................................................................................. 10
Clinical Studies on FXS ......................................................................................................................... 12
The Drosophila Genetic Model System ................................................................................................... 16
Drosophila Giant Fiber Circuit ................................................................................................................. 18
Neural Circuit Mapping ........................................................................................................................... 23
Mechanisms of Synapse Localization ...................................................................................................... 27
Summary ................................................................................................................................................. 30
II: Fragile X Mental Retardation Protein Restricts Small Dye Iontophoresis Entry into Central
Neurons .............................................................................................................................. 32
Abstract ................................................................................................................................................... 32
Significance Statement ........................................................................................................................... 33

ix
Introduction ............................................................................................................................................ 33
Materials and Methods ........................................................................................................................... 35
Drosophila Genetics ............................................................................................................................ 35
Dye Iontophoresis ............................................................................................................................... 36
Dye Injection Manipulations ............................................................................................................... 37
Confocal Imaging ................................................................................................................................. 37
Protein Quantification ........................................................................................................................ 38
Data Analyses ...................................................................................................................................... 38
Results ..................................................................................................................................................... 39
FMRP Selectivity Limits Small Dye Iontophoresis into Neurons ......................................................... 39
FMRP-Dependent and Charge-Independent Dye Iontophoresis Defect ............................................ 43
Increased Dye Iontophoresis Persists in the Absence of Gap Junctions ............................................. 45
GFI Dendrites are Structurally Unaltered and Display Dye Loading Defect ........................................ 48
Intrinsic Neuronal Properties Unrelated to Dye Injection Defect ....................................................... 50
Ionic Manipulations Alter Dye Loading but do not Resolve dfmr1 Defect ......................................... 54
Elevated Intracellular Dye Iontophoresis Rate in dfmr1 Null Neurons ............................................... 57
Discussion................................................................................................................................................ 60
III: Newly Identified Electrically Coupled Neurons Support Development of the Drosophila
Giant Fiber Model Circuit ..................................................................................................... 65
Abstract ................................................................................................................................................... 65
Significance Statement ........................................................................................................................... 66
Introduction ............................................................................................................................................ 66
Materials and Methods ........................................................................................................................... 68
Drosophila Genetics ............................................................................................................................ 68
Dye Iontophoresis ............................................................................................................................... 69
Confocal Imaging ................................................................................................................................. 69
Data Analyses ...................................................................................................................................... 70
Results ..................................................................................................................................................... 71
The Giant Fiber Circuit Exhibits Extensive Dye-Coupled Connectivity ................................................ 71
Transgenic Gal4 Drivers for Newly Identified Giant Fiber Coupled Neurons ..................................... 72
Projection Architecture of GFC Neurons Within the Thoracic Ganglion ............................................ 75
The Inframedial Bridge Connectivity Site of GFI-GFC Intersection ..................................................... 77
Shaking-B Gap Junction Synapses Between GFI and GFC Neurons .................................................... 78

x
Pre- and Postsynaptic Polarity of Thoracic Ganglion GFC Neurons .................................................... 80
GFC Requirements for the Development of GF Circuit Architecture .................................................. 83
Discussion................................................................................................................................................ 87
IV: Genetic Background Mutation Causes Hyper-Connectivity Within the GF Circuit ............. 93
Abstract ................................................................................................................................................... 93
Introduction ............................................................................................................................................ 94
Materials and Methods ........................................................................................................................... 96
Drosophila Genetics ............................................................................................................................ 96
Dye Iontophoresis ............................................................................................................................... 96
Confocal Imaging ................................................................................................................................. 97
Western Blotting ................................................................................................................................. 98
Bulk Segregant Analysis and Whole Genome Sequencing ................................................................. 99
Data Analyses ...................................................................................................................................... 99
Results ................................................................................................................................................... 100
The dfmr150M Allele Causes Excess GFI Axonal Projections .............................................................. 100
Increased Axonal Projections Present During Early GFI Synaptogenesis .......................................... 102
Overgrown Axonal Projections Contain Chemical Synaptic Machinery ........................................... 104
Overgrown Axonal Projections Contain Electrical Synapses ............................................................. 107
GFI Synaptic Projections Target GFC Neurons to Cause Circuit Hyper-Connectivity ........................ 109
Background Mutation(s) in the FXS Disease Model Causes Synaptic Projections ............................ 113
Identifying Background Mutation(s) Causing Excess GFI Synaptic Projections ................................ 116
Discussion.............................................................................................................................................. 116
V: Conclusions and Future Directions ................................................................................. 122
Dye Injection ......................................................................................................................................... 122
Circuit Mapping the Giant Fiber System ............................................................................................... 131
Identification of Background Mutations in the dfmr150M Line .............................................................. 135
Further Experiments Not Included in Publications ............................................................................... 138
Western Blot Screen for FMRP Targets ............................................................................................ 138
Neuron-Specific Protein Labeling ...................................................................................................... 146
Conclusion ............................................................................................................................................. 150
References ............................................................................................................................................ 152

xi
List of Figures
Figure Page
1. FMRP’s Roles in the Neuron...................................................................................................................... 7
2. Map of the Known Giant Fiber Circuit .................................................................................................... 19
3. Gal4 Driven Expression of mCD8::GFP in the GFI ................................................................................... 21
4. Modulators of Synaptic Formation During Development....................................................................... 29
5. Selective Small Dye Iontophoresis is Increased in dfmr1 Null Neurons ................................................. 41
6. Dye Iontophoresis Defect is FMRP Dependent and Charge Independent .............................................. 44
7. Null dfmr1 Neurons Manifest Dye Injection Defect Without Gap Junctions .......................................... 46
8. Specific Small Dye Iontophoresis is Increased in dfmr1 GFI Dendritic Arbors ........................................ 49
9. Dye Injection Defect is not Related to Multiple GFI Neuron Properties................................................. 51
10. K+ Channel Block Reduces Dye Loading Without Correcting dfmr1 Defect .......................................... 55
11. Dye Iontophoresis Rate is Highly Elevated in dfmr1 Null Mutant Neurons .......................................... 59
12. Giant Fiber Interneuron Dye Injection Reveals Coupled Neurons ........................................................ 72
13. Transgenic Gal4 Drivers for the Newly Identified GFC Neurons ........................................................... 74
14. The GFI Interacts with the GFC Neurons at the Inframedial Bridge ..................................................... 79
15. GFCs Form Electrical Synapses with the GFI at the Inframedial Bridge ................................................ 81
16. Pre- and Postsynaptic Polarity of the Newly Identified GFC Neurons .................................................. 84
17. GFC Neurons Support GF Circuit Architectural Development .............................................................. 86
18. Presynaptic Projections From the Giant Fiber Interneuron Terminal Bend ....................................... 101
19. Supernumerary GFI Axonal Projections in dfmr150M Null Mutants ..................................................... 103
20. GFI Axonal Projection Overgrowth Begins Early in Synaptogenesis ................................................... 105
21. The GFI Axonal Projections Contain Chemical Synapse Markers ....................................................... 108

xii
22. The GFI Axonal Projections Contain Electrical Synapse Markers ........................................................ 110
23. GFI Axonal Projections Synapse Within the GF Circuit on GFC Neurons ............................................ 112
24. GFI Synaptic Projections Caused by dfmr150M Background Mutations ............................................... 115
25. Potential Mechanisms of Differential Dye Loading ............................................................................ 124
26. Brain Size is Increased in dfmr150M Animals ........................................................................................ 128
27. LY Dye Loading into Sucrose Droplets................................................................................................. 130
28. dfmr150M Causes Overgrowth in Dendrites ......................................................................................... 137
29. Csw Western Blot ................................................................................................................................ 142
30. The GLEAM Technique for Cell-Specific Labeling of Endogenously Expressed Proteins .................... 147
31. RNA Editing Mechanism to Cell-Specifically Label Proteins ................................................................ 149

xiii
List of Tables
Table Page
1. A Summary of Clinical Trials Performed for FXS. .................................................................................... 15
2. Summary of Circuit Mapping Methods ................................................................................................... 25
3. Transgenic Gal4 Driver Lines for the Giant Fiber Circuit ......................................................................... 73
4. Known FMRP Targets for Western Blot Screen .................................................................................... 139
5. Alternative Neuronal Targets Tested in FMRP Western Blot Screen.................................................... 139
6. Initial Results of FMRP Target Western Blot Screen. ............................................................................ 145

xiv
List of Abbreviations
4-AP 4-Aminopyridine
9-AC 9-Anthracenecarboxylic Acid
ACh Acetylcholine
AG Abdominal Ganglia
Ag Silver
AIS Axon Initial Segment
AMPA α-amino-3-hydroxy-5-methyl-4-isoxazolepropionic Acid
APF After Puparium Formation
ASD Autism Spectrum Disorder
ATR All-Trans Retinal
Bap Bagpipe
BC1 Bran Cytoplasmic RNA 1
BCA Bicinchoninic Acid
Ben Bendless
BK Big Potassium
BrdU Bromodeoxyuridine
Brp Bruchpilot
BSA Bulk Segregant Analysis
BSA Bovine Serum Albumin
Bsn Bassoon
CAM Cell Adhesion Molecule
CaMKII Calcium/Calmodulin-Dependent Protein Kinase Type II

xv
CC Cervical Connective
Ced-6 Cell Death Protein 6
Chmp4 Charged Multivesicular Body Protein 4A
ChR Channelrhodopsin
Cl Chloride
CNS Central Nervous System
CNV Copy Number Variant
CRISPR Clustered Regularly Interspersed Palindromic Repeats
Csw Corkscrew
DAG Diacylglycerol
DenMark Dendritic Marker
dfmr1 Drosophila Fragile X Mental Retardation 1
DgkK Diacylglycerol Kinase, Kappa
DLM Dorsal Longitudinal Muscle
DLMn Dorsal Longitudinal Motor Neuron
eIF4F Eukaryotic Initiation Factor Complex 4F
EM Electron Microscopy
ERK Extracellular-Signal Regulated Kinases
FIB/SEM Focused Ion Beam/Scanning Electron Microscopy
Flp Flippase
FMR1 Fragile X Mental Retardation 1
FMRP Fragile X Mental Retardation Protein
FRAP Fluorescence Recovery After Photobleaching
FRT Flp Recombination Target

xvi
FXPOI Fragile X-Associated Primary Ovarian Insufficiency
FXR1 Fragile X Mental Retardation Syndrome-Related Protein 1
FXR2 Fragile X Mental Retardation Syndrome-Related Protein 2
FXS Fragile X Syndrome
FXTAS Fragile X-Associated Tremor/Ataxia Syndrome
Fz Frizzled
GCI Giant Commissural Interneuron
GF Giant Fiber
GFC Giant Fiber Coupled
GFI Giant Fiber Interneuron
GFP Green Fluorescent Protein
Gig Gigas
GLEAM Gal4 Limited Enchainment Activated Marker
GOF Gain of Function
GRASP GFP Reconstruction Across Synaptic Partners
Hid Head Involution Defective
HITS-CLIP High-Throughput Sequencing of RNA Isolated by Crosslinking
Immunprecipitation
hnRNP Heterogeneous Nuclear Ribonucleoprotein
IB Inframedial Bridge
iBLINC in vivo Biotin Labeling of Intercellular Contacts
IHC Immunohistochemistry
Irk2 Inwardly Rectifying Potassium Channel 2
KAc Potassium Acetate
xvii
KCl Potassium Chloride
KH K Homology
LTD Long Term Depression
LTP Long Term Potentiation
LY Lucifer Yellow
MAP1B Microtubule Associated Protein 1B
MAPseq Multiplexed Analysis of Projections by Sequencing
MB Mushroom Body
MCFO Multicolor FlpOut
mGluR Metabotropic Glutamate Receptor
MiMIC Minos Mediated Integration Cassette
MIP Maximum Intensity Projection
MMP Matrix Metalloprotease
mTOR Mammalian Target of Rapamycin
Na Sodium
NATF Native and Tissue Specific Fluorescence
NB Neurobiotin
Nrg Neuroglian
Nrx Neurexin
NS Not Significant
PA Phosphatidic Acid
PBS Phosphate Buffered Saline
POI Protein of Interest
PSD-95 Postsynaptic Density 95

xviii
PSI Peripherally Synapsing Interneuron
PTEN Phosphatase and Tensin Homolog
Pum Pumilio
Rac Ras-Related C3 Botulinum Toxin Substrate
RBP RNA Binding Protein
RGG Arginine-Glycine-Glycine
Rho Ras Homolog
RNAi RNA Interference
ROI Region of Interest
RSD Relative Standard Deviation
SEM Standard Error of the Mean
Sema-1a Semaphorin-1a
ShakB Shaking B
Shaw Shaker Cognate W
Shh Sonic Hedgehog
SNP Single-Nucleotide Polymorphism
spGal4 Split-Gal4
STaR Synaptic Tagging with Recombination
Stau Staufen
Syb Synaptobrevin
SynCAM Synaptic Cell Adhesion Molecule
Syt Synaptotagmin
TDE 2, 2’ Thiodiethanol
TEA Tetraethylammonium

xix
TG Thoracic Ganglia
TRITC Tetramethylrhodamine Isothiocyanate
Trp Transient Receptor Potential
TTM Tergotrochanteral Muscle
TTMn Tergotrochanteral Motor Neuron
UAS Upstream Activating Sequence
UPR Unfolded Protein Response
UTR Untranslated Region
VNC Ventral Nerve Cord
WB Western Blot
WGA Wheat Germ Agglutinin
WGS Whole Genome Sequencing
Wnt Wingless/Integrated
1
Chapter I
Overview of Dissertation
The goal of this dissertation was to study Fragile X Mental Retardation Protein’s (FMRP) roles in
neural circuit development and to advance our understanding of Fragile X syndrome (FXS), the human
disorder caused by loss of this protein. FXS causes intellectual disability, autism spectrum disorder (ASD)
and other neurological impairments, and is therefore a useful model for uncovering treatments for a wide
variety of neuropathies (Harris et al., 2008). I performed my work in the Drosophila Giant Fiber (GF) neural
circuit, which coordinates the escape reflex in response to threatening stimuli (Allen et al., 2006; Boerner
and Godenschwege, 2011). More specifically, I used the central Giant Fiber Interneuron (GFI) as a model
for neuron development and function due to its large size and amenability to manipulation. My initial
experiments were intended to expand on research showing loss of FMRP causes overgrown synaptic
connectivity with reduced maturity (Comery et al., 1997; Irwin et al., 2001; Zhang et al., 2001). FMRP is
canonically known as an RNA-binding protein and my aim was to identify new target RNAs related to FXS
connectivity defects, as well as to study other RNA-binding proteins which may partner with FMRP, such
as Pumilio (Pum) and Staufen (Stau; Brown et al., 2001; Darnell et al., 2001, 2011; Dubnau et al., 2003;
Vessey et al., 2006; Olesnicky et al., 2012; Pai et al., 2013).
The GFI proved an amenable model neuron and I was able to identify a synaptic overgrowth
phenotype in mutants null for the FMRP gene, Drosophila fragile x mental retardation 1 (dfmr1; Wan et
al., 2000; Zhang et al., 2001). Pursuing this finding, I asked whether the overgrowth results from increased
connections to normal partners or new connections to inappropriate partners. In the process of
investigating this using dye injection to determine the GFI synaptic partners, I found that dfmr1 null
neurons take up far more dye than paired controls, a puzzling phenotype that has never been reported
2
before. This finding was the focus of my first paper, included in this dissertation as Chapter 2 (Kennedy
and Broadie, 2017). Another outcome of these dye filling experiments was the identification of several
dye-coupled members of the GF circuit which had been previously unreported. A recently published
library of Gal4 transgenic drivers, many of which provide near single-neuron resolution, allowed a fine-
scale mapping of this expanded GF circuit (Brand and Perrimon, 1993; Jenett et al., 2012; Tirian and
Dickson, 2017). The identification of these neurons was the subject of my second paper, included in this
dissertation as Chapter 3 (Kennedy and Broadie, 2018).
While publishing these two papers, I continued to study the connectivity overgrowth in the GFI,
looking for FMRP targets or RNA-binding proteins that might modulate the phenotype. However, a series
of control experiments eventually uncovered a surprising result: the phenotype was not caused by loss of
FMRP, but instead by a background mutation in the dfmr1 null line (dfmr150M; Zhang et al., 2001). As this
phenotype is central to an important aspect of developmental neurobiology, namely how a neuron
regulates synaptic connectivity, I pursued the mutation’s identity using whole genome sequencing (WGS).
This work is ongoing but is expected to identify a gene that controls synaptogenesis. This work is described
in Chapter 4 of this dissertation and is currently being finalized for publication.
While this dissertation work has deviated significantly from the original aims, it has remained true
to the broader intent of better understanding neurodevelopment and neuropathies. I discovered a new
phenotype caused by loss of FMRP, which may underlie some of the symptoms of the FXS disease state.
The expanded GF neural circuit described here characterizes numerous interconnected neurons, which
may prove useful for more complex neurodevelopmental studies than have been possible before. And
finally, the work on the synaptogenic gene mutation found in the background of the dfmr150M allele not
only may open up a new set of targets with which to study synaptic growth and regulation, but also
provides a cautionary tale on the background mutations that can accumulate in commonly used genetic
lines. The remainder of this introduction provides background on the extensive literature on FXS, the GF

3
neural circuit, and synapse localization mechanisms. I then conclude with an outline of the remaining
chapters.
Fragile X Syndrome
FXS is caused by the loss or inactivation of the fragile X mental retardation 1 (FMR1) gene and
occurs in approximately 1:7,000 males and 1:11,000 females (Hunter et al., 2014). FXS is the leading
known genetic cause of ASD and intellectual disability, and subsets of patients also present with attention
deficits, anxiety, hyperactivity, childhood seizures, depression, elongated facial features, large ears and
macroorchidism (Bailey et al., 2008). The FMR1 gene was first cloned in 1991 and has since been the
subject of enormous study (Dietrich et al., 1991; Willemsen and Kooy, 2017). The majority of FXS cases
are caused by a CGG triplicate expansion in the 3’ untranslated region (UTR) of the gene (Fu et al., 1991).
Unaffected members of the population have 50 or fewer of these repeats, while those with 200 or more
manifest the disorder, due to hypermethylation of the CGG repeats leading to gene silencing (Oberlé et
al., 1991). Intermediate numbers of repeats are considered a “pre-mutation condition,” and are
associated with disabilities, such as Fragile X-Associated Primary Ovarian Insufficiency (FXPOI) and Fragile
X-Associated Tremor/Ataxia Syndrome (FXTAS, Jacquemont et al., 2007; Hunter et al., 2008). Several point
mutations and deletions have also been uncovered that cause FXS by disrupting functional domains in the
protein (Feng et al., 1997a; Myrick et al., 2015).
Within neurons, FMRP localizes primarily to the cell body where it resides in the cytosol and
traffics to and from the nucleus (Feng et al., 1997b; Doll and Broadie, 2015; He and Ge, 2017). FMRP is
also observed in large protein/RNA granules trafficking along dendrites and into synaptic terminals (Fig.
1, Kanai et al., 2004; Antar et al., 2005). Axonal growth cones contain FMRP and some research suggests
FMRP is present in mature axons as well, though this remains contentious (Antar et al., 2006; Price et al.,
2006; Akins et al., 2017). FMRP expression in Glia has been observed to also play a role in neural

4
development, but this work is still in the early stages of research (Higashimori et al., 2013, 2016; Connor
et al., 2017). The primary model organisms used for FXS research are mice and Drosophila. Zebrafish and
Xenopus FXS models exist, but they are less well studied, with fewer than 10 total publications for each at
the close of 2018. C. elegans interestingly does not appear to contain an FMR1 homolog, suggesting FMRP
arose after brain evolution and specialization were well underway (Shtang et al., 1999).
The enormous amount of research into FMRP function can be categorized in different ways. For
this dissertation, I have summarized the research in four categories; 1) FMRP as an RNA-binding protein,
2) FMRP as a channel-binding protein, 3) activity-dependent FMRP roles, and 4) clinical FXS treatment.
FMRP: RNA-Binding Functions
FMRP was originally characterized as an mRNA-binding protein and is currently recognized to have
at least three RNA-binding domains: two heterogeneous nuclear ribonucleoprotein (hnRNP) K Homology
(KH) domains and an Arginine-Glycine-Glycine (RGG) box (Ashley et al., 1993; Siomi et al., 1993, 1994;
Darnell et al., 2005a). There is also reported to be a less well understood RNA-binding domain at the FMRP
N-terminus (Adinolfi et al., 2003; Zalfa et al., 2005). The initial discovery that FMRP binds mRNA set off a
search to determine target transcript(s), with the hope that misregulated expression could be corrected
in clinical treatments. Unfortunately, multiple studies using a range of techniques have shown FMRP binds
a long list of RNAs, with one early study showing up to 4% of brain RNAs are bound (Ashley et al., 1993).
More recent studies have identified upwards of 900 putative mRNA targets (Brown et al., 2001; Darnell
et al., 2011; Ascano et al., 2013). While overwhelming, these target lists provided candidates that could
be studied in model organisms missing the FMR1 gene. The initial model established was the mouse FMR1
knockout, generated in 1994 by a Dutch-Belgian consortium (The Dutch-Belgian Fragile X Consorthium et
al., 1994). A Drosophila FXS model was later developed in 2000 and has been instrumental in studying the
disease (Wan et al., 2000; Zhang et al., 2001). Humans and mice both have two FMRP paralogs, Fragile X

5
Mental Retardation Syndrome-Related Protein 1 and 2 (FXR1 and 2), which interact with FMRP and can
also bind RNA (Tamanini et al., 1997; Spencer et al., 2006; Darnell et al., 2009). Drosophila has only the
single dfmr1 gene and no known paralogs (Siomi et al., 1995; Zhang et al., 1995; Wan et al., 2000). The
genetics of FMRP are further complicated by splicing: humans have at least five coding isoforms of the
FMR1 gene, while flies have six, not including a large number of UTR isoforms (Flybase.org, 12/3/18;
NCBI.NLM.NIH.gov 12/3/18). The roles of these many isoform are largely unknown.
Over the course of nearly three decades of research on FMRP RNA-binding capabilities, three
major results have emerged. First, the vast majority of target genes studied show increased expression
when FMRP is lost, indicating FMRP acts primarily as a translational repressor (Brown et al., 2001; Darnell
et al., 2001, 2005a; Phan et al., 2011; Niere et al., 2012; Gkogkas et al., 2014). However, exceptions exist
including a list of very long RNAs, the postsynaptic scaffold Postsynaptic Density Protein 95 (PSD-95) and
Diacylglycerol Kinase, Kappa (DgkK), all of which are cases of FMRP promoting expression as a translational
activator (Zalfa et al., 2007; Bechara et al., 2009; Tabet et al., 2016; Greenblatt and Spradling, 2018).
Reduced DgkK expression in FMR1 nulls has been proposed as the actual culprit in the loss of translational
repression, as it acts in the Diacylglycerol (DAG) to Phosphatidic Acid (PA) conversion pathway thought to
control general protein translation (McMahon and Rosbash, 2016; Tabet et al., 2016). Importantly, this
argument suggests DgkK RNA is the primary FMRP target, and all others are false positives. However, this
contradicts observations that FMRP binds the ribosome and can impede its procession along RNA, which
has been suggested to be one mechanism of FMRP translational repression (Fig. 1, Darnell et al., 2011).
Moreover, a wide range of independent studies have shown FMRP binding transcript targets (Kim et al.,
2009; Yan and Denman, 2011; Braat et al., 2015).
The second result that has emerged is that FMRP uses a complex method to discriminate mRNA
targets, which has thus far eluded researchers (Veneri et al., 2004; Darnell et al., 2005b). No agreed
consensus binding sequence exists, although several motifs have been found, including UGGA, ACUK and

6
GAC (K = G or U). However, these motifs are not well agreed upon, nor complex enough to specifically
delineate FMRP targets. Some work suggests high numbers of these motifs recruit sufficient FMRP to
mediate its role in repression (Ascano et al., 2013; Ray et al., 2013; Suhl et al., 2014; Anderson et al., 2016).
G-quartets and uridine tracts have also been suggested as guiding sequences, but again these structures
are not specific to FMRP targets or present in all targets (Chen et al., 2003; Dolzhanskaya et al., 2003;
Ramos et al., 2003). One difficulty in these experiments is that the list of FMRP targets is still
indeterminate, thus preventing robust study. A consensus has also not been reached on the RNA region
bound by FMRP, with groups separately finding either the UTR or the coding sequence is the primary
target (Brown et al., 1998; Sung et al., 2003; Darnell et al., 2011; Ascano et al., 2013; Zhang et al., 2014b;
Anderson et al., 2016). The lack of a target sequence has created speculation that FMRP uses other
mechanisms to regulate transcripts. There is work showing FMRP acts via RNA interference (RNAi)
machinery, and other forms of untranslated RNA, such as Brain Cytoplasmic RNA 1 (BC1), to block
translation (Zalfa et al., 2003; Jin et al., 2004). Partner RNA-binding proteins (RBPs) such as Pum and Stau
have been suggested as well, and have been shown to interact with FMRP at genetic, cellular and
behavioral levels, but not yet in molecular terms (Barbee et al., 2006; Elvira et al., 2006; Wells, 2006;
Bolduc et al., 2008; Sialana et al., 2016; Zhang et al., 2017). It is known that FMRP coexists with several
RBPs in RNA granules, mobile conglomerations of RBPs, RNA, ribosomes and scaffolds which bind motor
proteins and are trafficked along the neuronal cytoskeleton (Fig. 1; Anderson and Kedersha, 2006; Thomas
et al., 2011).
The third result that has emerged is that restoring many presumptive FMRP targets corrects FXS
phenotypes. For example, corrected expression of Microtubule Associated Protein 1B (MAP1B, Drosophila
Futsch), Charged multivesicular body protein 4A (Chmp4, Drosophila Shrub), matrix metalloproteases
(MMPs), adenylyl cyclase, DAG kinase and others have ameliorated a range of phenotypes in mouse and
Drosophila FXS disease models (Zhang et al., 2001; Lu et al., 2004; Siller and Broadie, 2011; Tabet et al.,
7
2016; Sethna et al., 2017; Vita
and Broadie, 2017). Frequently
studied phenotypes include
brain morphology, synaptic
architecture, calcium signaling,
long term potentiation and
depression (LTP and LTD),
learning and memory, anxiety,
repetitive behavior,
hyperactivity and seizures
(Irwin et al., 2001; Nimchinsky
et al., 2001; Bear et al., 2004;
Bolduc et al., 2008; Gatto and
Broadie, 2008; Spencer et al.,
2011; Gholizadeh et al., 2014;
Koga et al., 2015; Ruby et al.,
2015; Doll and Broadie, 2016;
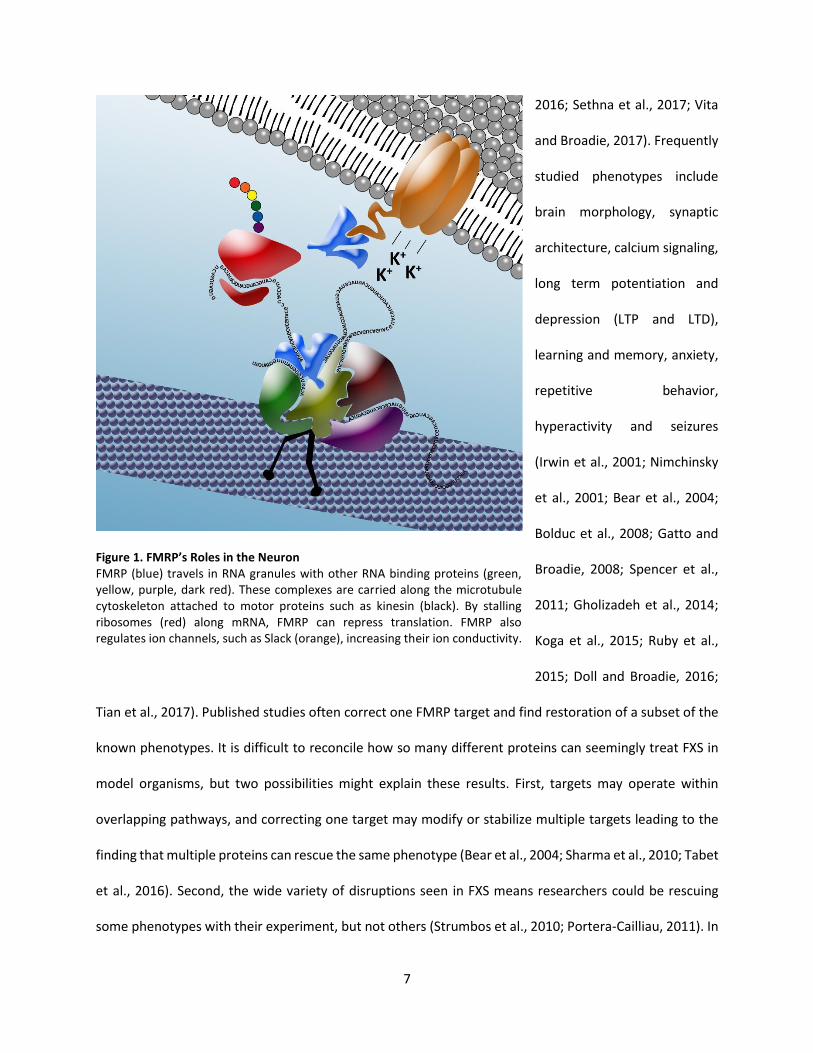
Tian et al., 2017). Published studies often correct one FMRP target and find restoration of a subset of the
known phenotypes. It is difficult to reconcile how so many different proteins can seemingly treat FXS in
model organisms, but two possibilities might explain these results. First, targets may operate within
overlapping pathways, and correcting one target may modify or stabilize multiple targets leading to the
finding that multiple proteins can rescue the same phenotype (Bear et al., 2004; Sharma et al., 2010; Tabet
et al., 2016). Second, the wide variety of disruptions seen in FXS means researchers could be rescuing
some phenotypes with their experiment, but not others (Strumbos et al., 2010; Portera-Cailliau, 2011). In
Figure 1. FMRP’s Roles in the Neuron FMRP (blue) travels in RNA granules with other RNA binding proteins (green, yellow, purple, dark red). These complexes are carried along the microtubule cytoskeleton attached to motor proteins such as kinesin (black). By stalling ribosomes (red) along mRNA, FMRP can repress translation. FMRP also regulates ion channels, such as Slack (orange), increasing their ion conductivity.

8
this case, the many FXS rescues in the literature are only partial, correcting a subset of the disrupted
pathways.
It is tempting to link all of the FXS symptoms together, suggesting, for example, that altered
neuronal activity is due to overelaborated synaptic connectivity and is the root of weakened memory,
seizures and hyperactivity; but it is worth remembering that FXS patients do not have homogenous
symptom profiles (Bailey et al., 2008). Correcting one misregulated pathway may partially or completely
fix one FXS phenotype, while leaving others uncorrected, and the total correction of the disorder may
require repair of many separate pathways. The range of FXS severity suggests a third possibility to explain
the disparate findings noted above: FXS is caused by the interaction of FMRP loss and other background
mutations. This idea is supported by findings that different mouse strains display different FMR1 null
phenotypes (Dobkin et al., 2000; Spencer et al., 2011). This could complicate the analysis of some of the
rescue experiments mentioned above: clean genetic backgrounds in the mice and flies carrying the rescue
construct could unintentionally mask background mutations, reducing phenotypes and emulating rescue
(Burgess, 2011; Chandler et al., 2013). Overall, the disparate findings across FXS research may be
reconcilable by attempting to place the many “verified” FMRP targets in common pathways and
identifying core proteins responsible for specific phenotypes. Furthermore, background effects must be
carefully accounted and controlled for to either remove modifiers or identify and bring them into the FXS
disease model as potential therapeutic targets themselves.
FMRP: Channel-Binding Functions
Compared to well established RNA-binding roles the FMRP channel-binding function is a relatively
new discovery, and the full implications have not yet been determined. FMRP has been shown to regulate
expression levels of ion channels by RNA-binding mechanisms, but in 2010 it was found that FMRP also
has a direct protein-protein interaction with the sodium-activated potassium channel Slack (Fig. 1, Brown
9
et al., 2010; Strumbos et al., 2010; Lee et al., 2011; Zhang et al., 2012). Later research showed that Big
Potassium (BK) calcium-activated potassium channels also directly interact with FMRP (Deng et al., 2013;
Zhang et al., 2014a). FMRP interaction with Slack causes an increase in the open state of the channel,
helping to hyperpolarize neurons through increased net conductance. Therefore, FMRP loss may leave
neurons more sensitive to stimulation, which is a phenotype often reported in FXS disease models (Zhang
et al., 2012; Contractor et al., 2015). FMRP is also known to increase BK channel conductance, though
researchers believe this is accomplished by increasing the sensitivity to calcium (Deng et al., 2013; Zhang
et al., 2014a). BK channels shape action potentials by releasing potassium in response to high calcium
levels (Contet et al., 2016). At presynaptic terminals they help end neurotransmitter release by
terminating action potentials and repolarizing the neuron. The loss of FMRP causes action potential
broadening as the BK channels are slower to respond to calcium influx, and thus delay repolarization (Deng
et al., 2013). Interestingly, there is little to no strong evidence showing FMRP exists in mature axon
terminals, indicating the interactions may be with somatic or dendritic BK channels, though several
experiments have suggested this is not the case (Deng et al., 2013). Future studies may require enhanced
imaging techniques to reveal FMRP at presynaptic sites or further examination of the FMRP-BK channel
interaction in other neuronal compartments (Bock and Stuart, 2016). Lastly, FMRP has been shown to
interact with the neuronal N-type voltage gated calcium channel, Cav2.2 (Ferron et al., 2014). Again, this
interaction is shown to be direct, rather than RNA mediated; however, in contrast to the potassium
channels, it appears FMRP does not regulate the biophysical properties of Cav2.2. Instead, FMRP
participates in escorting the channel to the proteasome for degradation. When FMRP is lost Cav2.2
degradation is diminished and levels increase. As Cav2.2 regulates synaptic vesicle release, one
consequence of FMRP loss is increased vesicle exocytosis, which could be one source of the
hyperexcitability seen in FXS models and patients (Turner et al., 1993; Bailey et al., 2008).
10
The FMRP-channel interaction raises the question of what role this function plays in the FXS
disease state. A recent paper suggests loss of the channel interaction is responsible for intellectual
disability and seizures in FXS patients. The authors identified a novel mutation in the FMRP coding
sequence in an FXS patient that disrupts the segment of the protein responsible for binding to BK
channels. Importantly, this FMRP single nucleotide polymorphism (SNP), R138Q, retains RNA binding
capabilities thus suggesting channel binding is a critical part of FMRP function (Myrick et al., 2015).
Separately, another human FMRP SNP, I367N, has been identified that blocks FMRP-ribosome interaction
but does not impair channel binding. The patient with this mutation also displayed severe intellectual
disability, seizures and other typical FXS symptoms. This suggests FMRP’s regulation of both RNA and
channels is required to avoid neurological disorders (De Boulle et al., 1993; Feng et al., 1997a). It remains
to be seen whether there is a functional association between the FMRP RNA-binding and channel-binding
roles. One possibility is that these roles exist in separate compartments (pre- vs. postsynaptic), and
separately impact cognitive development and function. Alternatively, these two functions may be linked,
and FMRP presence on channels positions it to sense activity and alter RNA translation in response
(Ferron, 2016). Such an interaction would be well in line with research on FMRP responses to neuronal
activity.
FMRP Response to Activity
Over time a consensus has emerged that the primary function of FMRP is to regulate protein
translation in response to neuronal activity, acting as an on-demand dispenser of new synaptic proteins
(Zalfa et al., 2003; Weiler et al., 2004; Price et al., 2006). As noted above, this seems at odds with the vast
bulk of FMRP concentration being in the soma rather than in neuronal processes or at synapses (Tang et
al., 2001; Doll and Broadie, 2015). In addition, FMRP binds a wide array of disparate transcripts, and the
majority of these target mRNAs are not localized to synapses or known to be involved in activity-

11
dependent processes. Moreover, several studies have identified roles for FMRP in the neuronal soma and
nucleus, albeit these studies are in the distinct minority (Shamay-Ramot et al., 2015; Filippini et al., 2017;
Guo et al., 2017; Zhou et al., 2017). It remains to be seen whether FMRP’s critical neurodevelopmental
functions take place at the soma or if this is simply a loading station for FMRP to pick up mRNAs and carry
them into processes for activity-dependent translation.
The metabotropic glutamate receptor (mGluR) theory posed in 2004 is the most studied
mechanism of FMRP activity-dependent translation (Bear et al., 2004). mGluRs respond to specific activity
patterns by enacting a protein synthesis dependent form of LTD which leads to the removal of excitatory
α-amino-3-hydroxy-5-methyl-4-isoxazolepropionic acid (AMPA) glutamate receptors from the
postsynaptic membrane (Snyder et al., 2001; Xiao et al., 2001). Removal of AMPA receptors weakens, and
can lead to removal of, synapses (Schikorski and Stevens, 1997; Nusser et al., 1998). According to the
mGluR theory, the translation of the proteins necessary for AMPA removal is regulated by FMRP. The
theory suggests activity triggers liberation of RNAs from FMRP control, permitting their translation and
beginning the process of synaptic degradation. Importantly, FMRP represses its own mRNA, which is
included in the liberated targets (Brown et al., 1998). The newly synthesized FMRP begins to repress the
mRNAs again and terminates AMPA receptor removal, which is termed end-product inhibition. When
FMRP is absent, the process becomes uncontrolled and excessive synaptic removal results, presumably
leading to the immature synapses seen in human patients (Hinton et al., 1991). It seems likely other
proteins are capable of at least partially regulating this process, otherwise no synapses would form in
FMRP’s absence. Studies have also suggested FMRP is an intermediary between mGluR signaling and
mammalian Target of Rapamycin (mTOR) and Extracellular-Signal Regulated Kinases (ERK). These proteins
control complex signaling pathways, including regulating RNA translation via members of the translation
machinery such as eukaryotic initiation factor complex 4F (eIF4F; Sharma et al., 2010; Sawicka et al., 2016;
Ehyai et al., 2018). Both pathways have been shown to be hyperactivated when FMRP is lost, and their
12
inhibition can correct FXS model phenotypes (Wang et al., 2012; Richter et al., 2015; Sawicka et al., 2016).
The overarching mGluR theory was supported by several studies in mouse and fly models, which show
genetic and pharmacological approaches to reduce mGluR activity can correct FXS phenotypes (McBride
et al., 2005; Yan et al., 2005; Pan and Broadie, 2007; Pan et al., 2008). However, clinical trials designed to
transition this theory into a human treatment have thus far been unsuccessful. The mGluR antagonist
Mavoglurant (AFQ056) failed to provide significant improvement in FXS patients (Jeste and Geschwind,
2016). This result is not necessarily a repudiation of the mGluR theory (see below), but does mirror a string
of failed clinical trials, suggesting the many roles of FMRP will not be so easily corrected (Erickson et al.,
2017).
How does FMRP respond to activity? The protein is regulated by several phosphorylation sites,
including the well-studied S500 site (S499 in mice, S406 in Drosophila; Ceman et al., 2003; Bartley et al.,
2016). Dephosphorylation of S500 permits translational activation and is accomplished through protein
phosphatase 2A, which can be activated by stimulated membrane receptors (Narayanan et al., 2007).
Phosphorylation of S500 is believed to trigger translational repression by FMRP (Coffee et al., 2012). This
function is controlled by the kinases Casein Kinase II and p70 S6 kinase 1, and possibly others (Narayanan
et al., 2008; Bhattacharya et al., 2012; Bartley et al., 2016). Recent research suggests sumoylation also
contributes to FMRP activation (Khayachi et al., 2018). Each of these identified interactions, while
complicating the picture of what FMRP does and how it functions, have provided potential therapeutic
targets for future FXS treatment drug development.
Clinical Studies on FXS
The complex interactions of FMRP identified thus far have suggested numerous targets that might
be susceptible to pharmacological treatment, resulting in many FXS clinical trials (Darnell and Klann,
2013). Targets have included mGluR antagonists (e.g. Mavoglurant, Basimglurant), GABA receptor

13
agonists (e.g. Arbaclofen, Riluzole), MMP inhibitors (e.g. Minocycline), and ERK/mTOR pathway
modulators (e.g. Lovastatin, Metformin; Bilousova et al., 2009; Erickson et al., 2011; Siller and Broadie,
2011; Osterweil et al., 2013; Ligsay and Hagerman, 2016; Gantois et al., 2017). While some FXS patients
have responded positively to treatments, often based on caregiver assessments, overall these trials have
been largely unsuccessful in providing statistical improvements in various parameters (Table 1, Davenport
et al., 2016; Erickson et al., 2017). It is unclear why successful treatments in model organisms have not
yet been replicated in human patients, though several proposals exist. Model organisms are limited in
their ability to replicate human-specific disease traits. Seizures, some forms of memory, and hyperactivity
can be assessed fairly well in FXS models, but social and mental disorders such as ASD and intellectual
disability are much harder to score. Thus some of the most crucial parts of the disorders scientists are
attempting to correct are relatively inaccessible to their research (Watson and Platt, 2012; Sestan and
State, 2018).
It can also be difficult to evaluate whether a drug has been effective in treating FXS. As noted
above, FMRP loss impinges on many pathways and causes a wide range of symptoms in FXS patients. If
these are mediated by separate pathways, distinct measurements may be needed for each symptom.
Further, some of these symptoms are part of broad categories. Within intellectual disability should spatial
learning or associative learning be monitored? For autistic children, which social or repetitive behavior
tests should be applied? As one cannot tell which outcomes the drugs might improve, it is difficult to know
what to assay when designing trials (Berry-Kravis et al., 2013). Another difficulty is determining when to
treat. For ethical reasons, very few clinical trials have been conducted on children under the age of 5, but
it could be that those are the only treatable timepoints for FXS (Caldwell et al., 2004; Jacquemont et al.,
2014). FMRP levels peak very early in development suggesting a specific role in brain formation (Lu et al.,
2004; Tessier and Broadie, 2008; Pacey et al., 2013). Much of the current FXS model research is conducted
using rescue treatments that are present from conception. Because of this, it is unclear whether FMRP

14
roles are developmental, during adult function or both, leaving drug developers with the question of when
treatment needs to be applied to maximally correct the disorder. Can pharmaceuticals applied to adults
correct FXS, or must the treatment be given in utero? Some studies have addressed this timing issue;
however, they are split on the answer with some suggesting correction is possible in adults (e.g. Michalon
et al., 2012; Dolan et al., 2013; Sun et al., 2016), and others showing intervention must come during
development (Doll and Broadie, 2016).
Perhaps a more promising approach than drug treatment is the emerging possibility of genomic
editing, which has the potential to clip away the excess FMR1 CGG repeats or correct SNPs to treat the
disorder. Such treatment would have to overcome numerous technical and ethical challenges, but is
making rapid progress (Park et al., 2015; Yrigollen and Davidson, 2019). Despite a single protein being the
root cause of FXS, research into treating the disorder has been stymied by the extraordinary degree of
complexity surrounding this protein. FMRP not only interacts with potentially hundreds of RNAs, but also
directly regulates channels, and perhaps sits within the inner circle of extremely complex signal
transduction pathways. Still, the field has made extraordinary gains in identifying FMRP roles in the brain
and has come to understand much about autism and intellectual disability along the way. Many new drugs
are in the pipeline which target newly identified FMRP pathways and researchers are optimistic that we
are nearing a viable treatment despite past disappointments.

15
Drug Mechanism of Action Test Subject
Age Clinical Trial
Status
Donepezil Acetylcholine esterase inhibitor 12+ Complete
Ampalex AMPA receptor positive allosteric modulator 18-50 Complete
Arbaclofen GABA receptor agonist 5-50 Complete
Ganaxolone GABA receptor positive allosteric modulator 13-22 Complete
Trofinetide Insulin like growth factor analog 12-45 Complete
Basimglurant mGluR5 negative allosteric modulator 5-50 Complete
Oxytocin Oxytocin receptor agonist 13-29 Complete
Aripiprazole Serotonin receptor agonist, Dopamine receptor
agonist/antagonist 5-35 Complete
Metadoxine Serotonin receptor antagonist, GABA transaminase
inhibitor 6-40 Complete
Zoloft Serotonin transporter inhibitor (SSRI) 2-6 Complete
Riluzole Sodium channel inhibitor 18+ Complete
ZYN002 Cannabinoid receptor agonist 3-18 Ongoing
Gaboxadol GABA receptor agonist 13-22 Ongoing
AZD7325 GABA receptor positive allosteric modulator 18-50 Ongoing
Acamprosate GABA receptor positive allosteric modulator, NMDA
receptor antagonist 5-55 Ongoing
Mavoglurant mGluR5 antagonist 3-45 Ongoing
Minocycline MMP9 inhibitor 3.5-55 Ongoing
Metformin MMP9 inhibitor, ERK signaling inhibitor 10-17 Ongoing
Lovastatin ERK signaling inhibitor 6-55 Ongoing
BPN14770 Phosphodiesterase allosteric modulator 18-45 Ongoing
Epigallocatechin Gallate (ECGC)
Undetermined 6-60 Ongoing
Vitamin C, E Undetermined 1-18 Ongoing
Table 1. A Summary of Clinical Trials Performed for FXS.
Clinical trials have been run for numerous drugs that target pathways associated with FMRP. Most studies have not resulted in beneficial outcomes for patients and have been abandoned. Some of the ongoing trials have shown promising results but are still in early stages. Pharmaceutical treatment has been attempted as early as 2 years of age to correct developmental disruptions. Data compiled from www.clinicaltrials.gov (accessed 2/1/19).

16
The Drosophila Genetic Model System
This dissertation research was performed using the Drosophila genetic model, which is simple
enough to assay single genes in single neurons, yet complex enough to have intricate brain organization
and sophisticated behavioral outputs. The ~10-day lifecycle and large populations of Drosophila permit a
wide range of genetic manipulations. The embryo develops for one day in the egg before hatching and
entering the larval stage. The larvae go through three developmental stages, termed instars, with the first
two instars lasting one day each and the third instar lasting two days. The larval stage is followed by a
four-day pupal stage after which the adult ecloses and becomes sexually mature within eight hours.
Drosophila genetics are relatively simple, with ~14,000 protein-coding genes on 4 chromosomes. Despite
having fewer proteins than humans, Drosophila has homologs for ~75% of human disease causing genes
(Reiter et al., 2001). One result of this slim genome is far fewer paralogs for each gene. For targets of
FMRP, the reduced paralogs make for easier manipulations. MMPs for example are represented by 2
genes in the fly, 24 in mice and 23 in humans (Page-McCaw et al., 2007; Dear et al., 2017). Similarly,
Drosophila have 8 gap junction genes, part of the innexin family, while humans have gap junctions from
two families: 3 genes for the closely related pannexins and 21 genes in the connexin family (Stebbings et
al., 2002; Söhl and Willecke, 2003; Baranova et al., 2004). These simplifications help in manipulations of
the nervous system such as, for example, determining and removing gap junctions expressed in a neuron
of interest.
The Drosophila genome is amenable to a myriad of manipulations. Mutagenesis was originally
carried out by chemical or physical assault on DNA but was later simplified by the discovery of P-element
transposons that can be inserted randomly into the genome (Spradling and Rubin, 1982; Price, 2005).
These transposons can be imprecisely excised to create small mutations, such as the dfmr150M mutation
used in this work (Rorth et al., 1998; Zhang et al., 2001; Kennedy and Broadie, 2017). P-elements have a
preference for 5’ insertion in genes and typically avoid introns (Bellen et al., 2004; Aleksic et al., 2009).

17
Other transposons, such as Minos elements, are helping to probe more of the genome (Venken et al.,
2011). Of course, the Clustered Regularly Interspersed Palindromic Repeats (CRISPR) technique has
obviated these strategies, making targeted Drosophila genome editing precise and routine (Jinek et al.,
2012; Gratz et al., 2013). Naturally, many mutations block viability or fertility, and balancer chromosomes
are used to circumvent this problem (Casso et al., 1999). A lethal or infertile mutation of interest is
maintained in a heterozygous state over a balancer which has its own lethal mutation. As neither
chromosome can propagate as a homozygote, the mutation of interest in maintained over generations.
Dominant markers make it easy to select for or against the balancer in genetic crosses. Balancer inversions
block genetic recombination by interfering with chromosome alignment, thus preventing the shedding of
deleterious mutations.
Another powerful Drosophila resource is the binary Gal4/Upstream Activating Sequence (UAS)
system, a yeast transcription factor/enhancer element pair that allows all manner of transgenic
manipulations (Brand and Perrimon, 1993). The Gal4 sequence downstream of an enhancer region of
interest drives expression in target cells (Mlodzik and Hiromi, 1992; Jenett et al., 2012). The UAS responder
is linked to a protein coding or RNAi sequence, both of which are available for a wide range of genes (Dietzl
et al., 2007; Ni et al., 2009). Endogenous genes, with or without tagged fluorophores, enable studies of
rescue, localization and function (Zhang et al., 2002; Christiansen et al., 2011; Chen et al., 2014).
Exogenous genes allow structural studies (membrane green fluorescent proteins (GFPs)), functional
manipulations (channelrhodopsins (ChRs)), and calcium recordings (GCaMP), permitting exquisite cellular
experiments (Nagel et al., 2003; Pfeiffer et al., 2010; Akerboom et al., 2012). Recently, two groups have
made an enormous effort to randomly insert small Gal4 enhancer elements into individual fly lines and
screen UAS-gfp expression patterns across the brain (Jenett et al., 2012; Tirian and Dickson, 2017). This
has resulted in a collection of Gal4 drivers that can express in small subsets of neurons, even single cells,
opening new avenues for circuit mapping, developmental studies and neuron-neuron interactions. This

18
technology was further expanded by creating split-Gal4 (spGal4) versions of many of these lines. spGal4s
operate by expressing the DNA binding half and RNA polymerase recruiting half of Gal4 under separate
enhancers, requiring an overlapping expression pattern to form a complete Gal4, thus greatly reducing
the neurons targeted (Luan et al., 2006; Pfeiffer et al., 2010).
In terms of neurodevelopment, the Drosophila brain provides an excellent model for research.
Drosophila have ~100,000 neurons, which is much more tractable than the ~70 million found in mice
(Herculano-Houzel et al., 2006; Chiang et al., 2011). Even with relatively few neurons, flies demonstrate a
diverse behavioral repertoire controlled by fairly complex, but accessible, neural circuits (O’Kane, 2011;
Kennedy and Broadie, 2018; Namiki et al., 2018). The high density of the central nervous system (CNS)
means flies still must solve complex developmental problems such as axon pathfinding and target
selection in a crowded arena, providing an accessible way to study such processes at high resolution.
Moreover, rapid development makes the Drosophila brain amenable to live imaging of neuron formation
and maturation. Drosophila is even beginning to challenge C. elegans, with a full mapping of all of the
brain neurons and their synapses in the works (Zheng et al., 2017). Hence Drosophila provides a
particularly attractive model for neurodevelopmental research and neurological disease modeling. Within
the Drosophila nervous system, one of the best models for studying individual neuron formation and
function is the Giant Fiber Circuit.
Drosophila Giant Fiber Circuit
The Drosophila GF neural circuit, first described by Maxwell Power in 1948, is an escape reflex arc
like those found in a range of invertebrates, from squid to cockroach (Hodgkin and Huxley, 1939; Power,
1948; Keegan and Comer, 1993). The circuit rapidly carries information about threatening stimuli from
sensory modalities to muscles, enabling a quick escape behavior (Pézier et al., 2014). GF neurons have
been used extensively to study neurodevelopment and model human neuropathies including FXS,
19
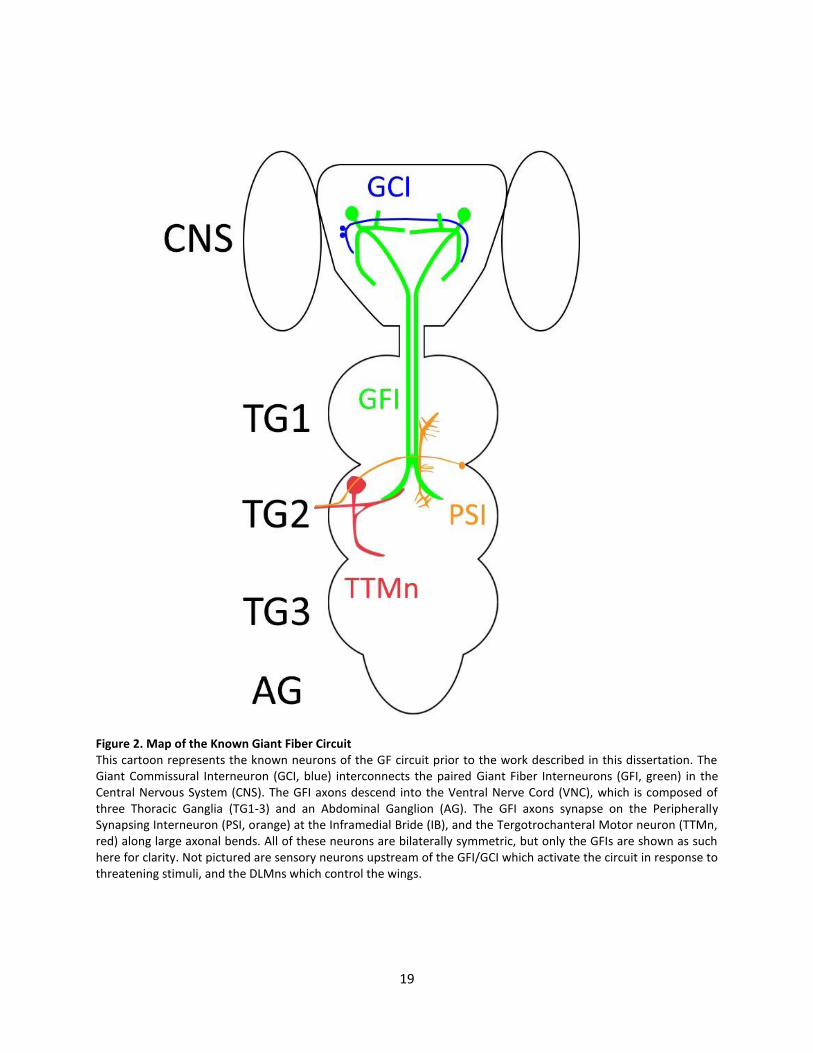
Figure 2. Map of the Known Giant Fiber Circuit This cartoon represents the known neurons of the GF circuit prior to the work described in this dissertation. The Giant Commissural Interneuron (GCI, blue) interconnects the paired Giant Fiber Interneurons (GFI, green) in the Central Nervous System (CNS). The GFI axons descend into the Ventral Nerve Cord (VNC), which is composed of three Thoracic Ganglia (TG1-3) and an Abdominal Ganglion (AG). The GFI axons synapse on the Peripherally Synapsing Interneuron (PSI, orange) at the Inframedial Bride (IB), and the Tergotrochanteral Motor neuron (TTMn, red) along large axonal bends. All of these neurons are bilaterally symmetric, but only the GFIs are shown as such here for clarity. Not pictured are sensory neurons upstream of the GFI/GCI which activate the circuit in response to threatening stimuli, and the DLMns which control the wings.

20
tauopathies and L1 syndrome (Tanouye et al., 1981; Martinez et al., 2007; Kudumala et al., 2013; Lee and
Godenschwege, 2014; Orr et al., 2014; Kadas et al., 2019). These studies take advantage of the known
synaptic connectivity, established electrophysiology recording paradigms, and large neuron size. The GF
circuit also contains numerous genetically tractable interneurons which permit the study of neuron-
neuron interactions at single cell resolution.
The GF circuit architecture begins with visual, auditory and mechanical sensory organs collecting
information on threatening stimuli, which is then passed to the central brain GFIs, the paired central
interneurons which conduct responses downstream (Fig. 2, Allen et al., 2006; Pézier et al., 2014). The GFIs
are interconnected by the Giant Commissural Interneurons (GCI) through mixed chemical/electrical
synapses, which are believed to create a balanced response on both sides of the body. Each GFI projects
an axon into the ventral nerve cord (VNC) where they come together at the posterior end of thoracic
ganglion segment 1 (TG1) to form the Inframedial Bridge (IB). The axons then move latterly apart to
terminate in large bends. These bends are the sites of synaptic output to the Tergotrochanteral motor
neuron (TTMn), which controls the jump reflex of the central legs. The IB is a site of multiple small
extensions from the GFI, and the location of mixed chemical and electrical synapses on the Peripherally
Synapsing Interneuron (PSI). The PSI connects through a cholinergic synapse to the Dorsal Longitudinal
Motor neurons (DLMns), which control the wing depressing muscles (Mejia et al., 2013).
Several characteristics of the GF circuit make it appealing for studying neurodevelopment,
including the large diameter neurons (Allen et al., 1998). As flies lack the myelin sheathing found in
vertebrates, they use large neuron calibers to increase transmission speed. The GFI neurons are so large
relative to the other Drosophila neurons that they can be individually recognized under a 10x microscope
objective. This size offers two benefits. First, the GF neurons are easily targeted and manipulable, allowing
access via glass electrodes which can deliver dye or other molecules. Dye injections rapidly label the entire
neuron, with no requirement of transgenic labels such as GFP. As the GFI contains electrical synapses,
21
small tracers can also be injected to map
connected neurons (Boerner and Godenschwege,
2011). Second, the size of the GF neurons makes
characterization and quantification much easier,
allowing for rapid and confident assessment of
diameters, synaptic sites, and structural
abnormalities (Mejia et al., 2010; Kudumala et al.,
2013; Borgen et al., 2017). These neurons are also
genetically tractable, and highly specific Gal4
drivers are available to manipulate each neuron in
the GF circuit. Early drivers (such as A307 and C17)
were less specific, but still enabled excellent
studies on GF circuit development (Phelan et al.,
1996; Allen et al., 1999). The Janelia Farms and
Vienna Drosophila Resource Center collectives
have since generated new drivers, which provide
near single neuron resolution for most members of
this circuit (Fig. 3; Jenett et al., 2012; Tirian and
Dickson, 2017). The motor outputs of the GF circuit
also allow electrophysiology characterization. A
simple recording can be taken from the two muscle
targets of the circuit, providing information on
how the circuit develops and functions (Tanouye
and Wyman, 1980; Augustin et al., 2011).
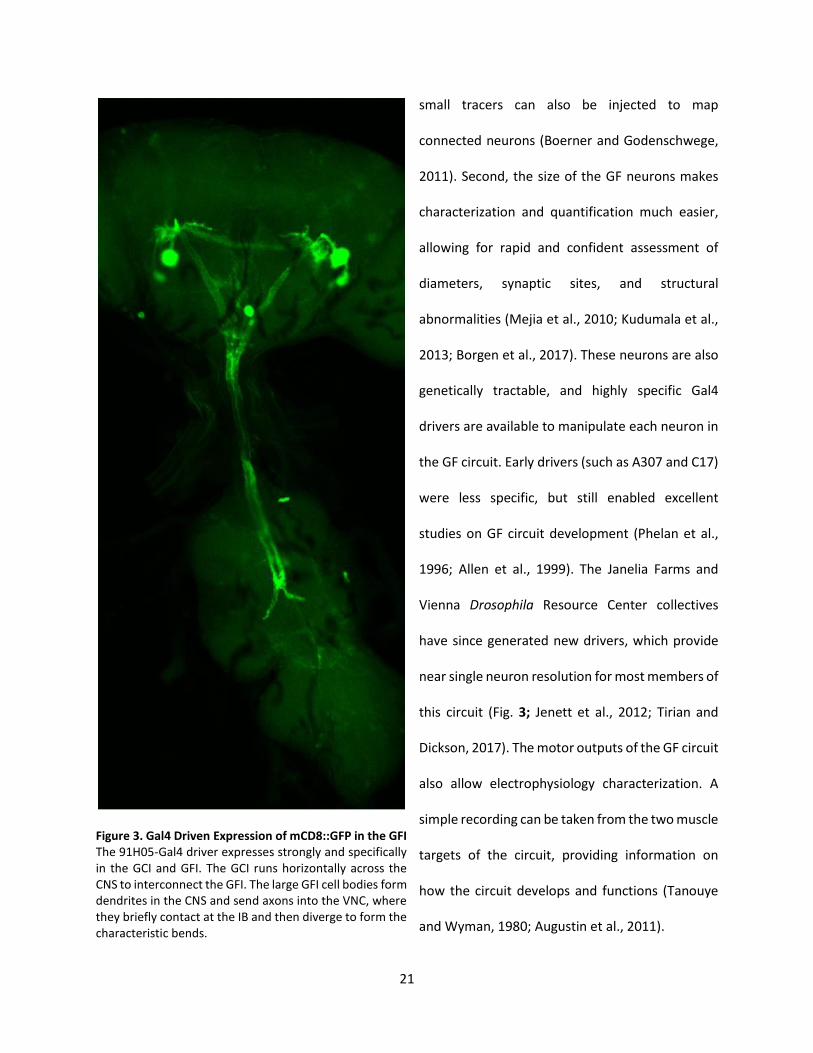
Figure 3. Gal4 Driven Expression of mCD8::GFP in the GFI The 91H05-Gal4 driver expresses strongly and specifically in the GCI and GFI. The GCI runs horizontally across the CNS to interconnect the GFI. The large GFI cell bodies form dendrites in the CNS and send axons into the VNC, where they briefly contact at the IB and then diverge to form the characteristic bends.
22
The GFI is the best studied GF circuit neuron and has been the central focus of the studies here
(Fig. 3). Bromodeoxyuridine (BrdU) labeling indicates the GFI is born during embryogenesis, although it
waits until pupation to begin forming its connections (Allen et al., 1998). Once outgrowth begins, GFI
axons reach their TTMn targets within about one day and then spend another day initiating synapse
formation. On the last day of pupation the GFI neurons stabilize and mature their synaptic connections.
The bendless (ben) mutation in an E2 ubiquitin-conjugating enzyme causes the GFI axon to terminate at
the IB during development, losing its characteristic bend along the TTMn (Thomas and Wyman, 1984;
Muralidhar and Thomas, 1993). This transition from axonal outgrowth to synaptogenesis is additionally
controlled by the transmembrane cell-adhesion molecule Semaphorin-1a (Sema-1a), which helps guide
the axon to postsynaptic partners (Murphey, 2003; Uthaman et al., 2008). Once the axon has arrived it
removes Sema-1a from the surface, allowing synaptogenesis to proceed (Godenschwege et al., 2002).
Further work indicated that the transmembrane cell adhesion molecule (CAM) Neuroglian (Nrg), located
presynaptically on the GFI and postsynaptically on the TTMn, interacts homophilically to signal for Sema-
1a removal from the membrane, thus ending pathfinding/target recognition and initiating synaptogenesis
(Godenschwege and Murphey, 2008). Interestingly, manipulating these targets only prevents TTMn
synapses from forming; PSI synapses at the IB develop normally. This indicates separate membrane
proteins dictate synapse formation, even within the same neuron.
The GF circuit also provides an important model for electrical synapse connectivity. As noted
above, the GFI connects to most of its targets through mixed chemical and electrical synapses. Electrical
synapses transmit an action potential across a synapse almost instantaneously, as compared to ~0.5
milliseconds for chemical synapses (Katz and Miledi, 1965, 1967; Wheatley, 1998). As noted above, the
invertebrate gap junction family is referred to as innexins, which are homologous to pannexins in
vertebrates (Baranova et al., 2004). Vertebrates also have a larger family of gap junctions known as
connexins, which share no sequence homology with the innexins/pannexins, though they are structurally

23
similar, with four transmembrane domains (Phelan, 2005; Beyer and Berthoud, 2018). Invertebrate gap
junctions are typically composed of six innexin subunits which create an innexon hemichannel, although
some examples of eight member hemichannels have been reported (Ambrosi et al., 2010). Innexins can
form homomeric or heteromeric hemichannels, and gap junctions can be homotypic or heterotypic,
depending on whether the pre- and postsynaptic neurons use the same or different innexons. The GF
circuit uses the Shaking-B (ShakB) innexin, which is spliced into three isoforms: ShakB(Neural (N)),
ShakB(N+16) and ShakB(Lethal (L)). The GFI exclusively expresses ShakB(N+16) to form heterotypic gap
junctions with the TTMn and PSI, which both use ShakB(L) (Phelan et al., 2008). These different
combinations allow gap junctions to have variable properties, such as restricting flow of certain sized or
charged molecules, and determining the direction of ionic flow (Nielsen et al., 2012). The pore size of gap
junctions is typically capable of passing up to 1kDa molecules, thus allowing secondary messengers such
as calcium and cyclic AMP through (Weber et al., 2004). Gap junctions can also pass dyes through their
pores, which has aided efforts to map the GF circuit and study the processes of synapse formation and
degradation (Bacon and Strausfeld, 1986; Jacobs et al., 2000; Pézier et al., 2014).
Neural Circuit Mapping
The innate behavior of animals is a result of the wiring pattern in their nervous system. Evolution
has long honed these systems to respond optimally to the local environment, creating a diverse repertoire
of hard-wired behaviors necessary for acquisition of nutrients, reproduction, and offspring rearing. These
innate behaviors contrast with learned behaviors, which are more evolutionarily recent and can be
modified throughout life (Tierney, 1986). Researchers have long pursued maps of the neural circuitry
responsible for a wide range of behaviors and taken many approaches to do so. An immense effort was
made to map of the entire C. elegans hermaphrodite brain, which was published in an extensive electron
microscopy (EM) study (White et al., 1986). More recently subsets of the Drosophila and mouse brain
24
have similarly been completely mapped (Chiang et al., 2011; Kasthuri et al., 2015; Eichler et al., 2017;
Zheng et al., 2017). These mapping projects have several goals, including enabling studies on how different
regions of the brain interconnect, how such connectivity has evolved, which circuits deteriorate in
neurological disorders, and how neural circuits are assembled and change over time.
Numerous lower resolution circuit maps have contributed greatly to neuroscience research in
model organisms. In mice, these circuits range from the hippocampal trisynaptic circuit, composed of the
dentate gyrus, CA1, and CA3 and thought to process and store memories, to the optic circuit in the retina,
which is responsible for pre-processing incoming visual information (Sanes and Masland, 2015; Stepan et
al., 2015). There are also circuits studied for their roles in disease, such as the dopamine neurons of the
Basal Ganglia, whose degeneration leads to Parkinson’s disease (Rizzi and Tan, 2017). In Drosophila,
alongside the work performed in the GF circuit, circuit maps connecting the olfactory system to the
learning and memory centers of the mushroom body (MB) have helped drive enormous amounts of
research on the mechanisms of synaptogenesis and activity-dependent synapse modification (Doll and
Broadie, 2015; Golovin and Broadie, 2016; Hige, 2018). Similar to work in the mouse, the circuits of the
fly visual system have allowed researchers to examine parallel neural pathways in neurons, and helped to
predict and understand the organization found in the more complex vertebrate brains (Lee et al., 2003b;
Sanes and Zipursky, 2010). As these circuits are increasingly mapped, more in depth experiments can be
performed, such as simultaneously imaging activity in all of the neurons in a circuit to understand
information flow (Chen et al., 2012; Prevedel et al., 2014; Streit et al., 2016). The C. elegans field is taking
advantage of its complete nervous system map in an ambitious project to sequence the RNA in every
neuron (Hammarlund et al., 2018). This project should enable comparative studies on individual neurons,
providing answers on the transcriptional programs that underlie identities and the specificity of synaptic
connectivity. Such experiments foreshadow what will be possible for higher order brains once their neural
circuit maps are complete.

25
Circuit mapping is accomplished through a number of means, with some of the most common
examples summarized in Table 2 (Lichtman et al., 2008). The most thorough but labor intensive and time-
consuming is EM reconstruction which reveals neuron architecture and chemical and electrical synapses.
As noted above, this was completed for the C. elegans hermaphrodite in 1986, while the male was
completed much later, in 2012, due to its more complex connectome (White et al., 1986; Jarrell et al.,
2012). This approach is accelerating thanks to new serial EM techniques, such as Focused Ion
Beam/Scanning Electron Microscopy (FIB/SEM), and automated reconstruction algorithms (Xu et al.,
2017; Zhao et al., 2018). While EM techniques can reconstruct the entire nervous system in an unbiased
fashion, other approaches typically start with one neuron and identify its synaptic partners, slowly
spiraling outwards through the circuit. Rabies virus can be expressed in a neuron of interest and then be
tracked as it travels retrogradely across mammalian synapses (Wickersham et al., 2007). Wheat germ
Method Mapping ability Advantages Disadvantages
EM Reconstruction
Neurons and their synapses
Complete circuit and synapse map
Expensive, slow
Rabies Virus Chemically connected
partners
Precise; genetically controlled
Mammalian only, slow
Wheat Germ Agglutinin
Chemically connected partners
Simple to use, genetically controlled
Imprecise, may not work
trans-tango Chemically connected
partners
Genetically encoded, reveals first degree
partners
Does not work in all neurons
Dye injection Electrically connected
partners Rapid, cheap
Requires gap junctions and large neurons
MAPSeq Neuron projection
pattern Rapid, large scale
Expensive, target neurons not identified
GRASP Confirms synaptic
partnerships
Genetically encoded, shows synapse location
Requires knowledge of potential partners
iBLINC Confirms synaptic
partnerships
Genetically encoded, shows synapse location
Requires knowledge of potential partners
Table 2. Summary of Circuit Mapping Methods Many methods are available for mapping neurons and their synapses, with several of the most commons approaches listed here. More thorough methods are often slower and more expensive, while partners and synapse locations can often be quickly determined by genetic manipulations.

26
agglutinin (WGA) is another trans-synaptic tracer that can reveal neuronal partners, though its
effectiveness is questionable (Braz et al., 2002). More recent techniques have utilized the Gal4/UAS binary
expression system to express pre- and postsynaptic transmembrane proteins that only interact in very
close proximity. One recent example is trans-tango, which is constructed such that interaction of two
contacting proteins across a synaptic cleft causes release of the QF transcription factor (which is similar
to Gal4) in downstream neurons. QF acts on the QUAS enhancer to turn on a fluorescent protein, thus
labeling partners of the neuron of interest (Talay et al., 2017). New partners can be identified by
expressing the presynaptic half of the tool in the neuron of interest and the postsynaptic half pan-
neuronally. Once the partner neurons’ structures are identified, they can be pursued by screening through
databases of known neurons (Akram et al., 2018; Otsuna et al., 2018).
Other recent mapping approaches include GFP Reconstruction Across Synaptic Partners (GRASP)
and in vivo Biotin Labeling of INtercellular Contacts (iBLINC). These techniques can test whether neurons
are in close enough proximity to form synapses, identifying neuronal partners. GRASP uses a split GFP
system with the two pieces of the protein expressed extracellularly on the membrane of the two potential
partners. Contact between the neurons allows the GFP to recombine and fluoresce, signifying closely
opposed membranes (Feinberg et al., 2008). iBLINC operates in a similar fashion, but uses a biotin-
conjugating enzyme to affix biotin to a proximal acceptor protein, priming it for avidin labeling (Desbois
et al., 2015). Both of these techniques have been modified to enhance synapse labeling by fusing them to
synaptic vesicle proteins, such as the v-SNARE Synaptobrevin (Syb; Macpherson et al., 2015). Another new
technique, Multiplexed Analysis of Projections by Sequencing (MAPseq), harnesses high-throughput
sequencing by creating randomly barcoded RNA expressing viral vectors, which are injected into a region
of interest (Kebschull et al., 2016). The individual RNA barcodes expressed in each individual cell are
trafficked out to axonal processes. The brain can then be dissected into regions of interest, each of which
is used to generate an RNA library. Sequencing the libraries from each brain region reveals where the
27
barcodes localized, thus mapping where each injected neuron projects (Kebschull et al., 2016). Circuit
mapping can also be accomplished through dye injection, albeit only in cases where the neurons share
gap junctions. Gap junctions are not common in most mature circuits, so this technique is not frequently
used; however, it is unparalleled in rapidly revealing connectivity. The original dyes consisted of colorful
heavy metals (e.g. cobalt), but much better tools have become available, including lucifer yellow (LY),
which is fluorescent, and neurobiotin (NB), which can be stained post-injection by fluorescently
conjugated avidin (Levine and Tracey, 1973; Huang et al., 1992; Hanani, 2012).
Mechanisms of Synapse Localization
Neural circuits are formed when neurons project to specific locations, find their targets and create
synapses. Integral to this process is the determination of how many synapses to make and how strongly
to establish the overall synaptic connection between partners. Each synaptic connection will be modified
throughout the life of the animal based on experiences, but the initial connection sets the stage for
communication between the neurons (Cline, 2001). Neurons are particular in their synapse placement,
restricting synapses to specific zones even if two partners contact multiple times or are in close proximity
over long distances (Lin et al., 2001; Ango et al., 2004; Kummer et al., 2006; Kurshan et al., 2018). The
reasons for this selectiveness are not entirely clear, but it may be for functional reasons, such as co-
localizing inputs from multiple neurons, placing synapses in range of modulatory neurotransmitters, such
as serotonin, or positioning postsynapses a certain distance from the soma to manage their signaling
strength (Koch et al., 1983; Arnth-Jensen et al., 2002; Williams and Stuart, 2003; Nadim and Bucher, 2014;
Boivin and Nedivi, 2018). Synaptic zones may also be determined by temporal coincidence, occurring only
at times when neurons are in contact and synaptogenesis occurs (Allen et al., 2006). There are likely many
mechanisms controlling synapse localization, and we are just beginning to understand a few basic
processes (Fig. 4).
28
Pruning is perhaps the best studied mechanism of determining synaptic localization. Neurons
typically build excessive synapses with appropriate and inappropriate partners during development and
later trim the excess away, often via activity-dependent synapse elimination (Tessier, 2009; Riccomagno
and Kolodkin, 2015; Borgen et al., 2017). This pruning is achieved internally by co-opting proteins from
the apoptosis pathway, including caspases (Unsain and Barker, 2015). Extracellularly, glia are recruited to
remove unwanted synapses by phagocytosis (Schafer and Stevens, 2013). This process is not easily
observable, making it difficult to parse out how much of the synaptic sculpting is due to pruning rather
than general retraction of failed axonal outgrowths (Corty and Freeman, 2013). Further, it is unclear how
synapses in appropriate partnerships are properly trimmed. It has been difficult to find markers that
identify which synapses are to be removed and which should be maintained. Glia can also function as
positive reinforcement for synapses. In vertebrate NMJs, glial Schwann cells are necessary for the
formation of synapses between the motor neuron and the muscle, thus dictating synaptic zones (Sugiura
and Lin, 2011; Darabid et al., 2014). Experiments with central interneurons have shown similar
synaptogenic roles for glia (Singh et al., 2016; Farhy-Tselnicker et al., 2017). in C. elegans, epithelial cells
can perform such roles by using trans-synaptic signaling to encourage synapse formation between
neuronal and muscle targets (Shen and Bargmann, 2003).
Synaptic sites can also be sculpted by extracellular morphogens. The extensive
Wingless/Integrated (Wnt) family plays important roles in transsynaptic signaling, helping pre- and
postsynaptic partners localize and grow their synapses (Budnik and Salinas, 2011; Park and Shen, 2012).
Signaling occurs through many receptors, including the canonical target Frizzled (Fz), and leads to
clustered synaptic components (e.g. PSD-95 and Bassoon (Bsn)), organized cytoskeletal architecture via
microtubule binding proteins (e.g. MAP1B), and activation of synaptogenic modulatory kinases (e.g.
Calcium /calmodulin-dependent protein kinase type II (CaMKII), Ciani et al., 2004; Ahmad-Annuar et al.,
2006; Farías et al., 2009). Wnts have also been shown to inhibit synapses in specific locations. In C. elegans

29
a high posterior Wnt gradient partially blocks synapse formation along the DA9 motor neuron which
controls a muscle used for tail movement. High levels of Wnt cause Fz receptors on the DA9 axon to be
endocytosed, which inactivates nearby neurexin (Nrx), a synaptic stabilization protein. Nearby synapses
in low Wnt concentrations are unaffected (Klassen and Shen, 2007; Kurshan et al., 2018). An extensive
array of other diffusible extracellular proteins are also at play in synapse patterning including
Neurotrophins, Cholesterol, TGF-beta and Sonic Hedgehog (Shh), which can act at the local and tissue
level (Vicario-Abejón et al., 2002; Salinas, 2003; Goritz et al., 2005; Harwell et al., 2012).
The simplest mechanism for synaptic site selection might be neuronal positioning of
transmembrane synaptogenic proteins on the extracellular membrane. However, it still remains unclear
how often neurons decide cell-autonomously where to localize their synapses on their own (Ribeiro et al.,
Figure 4. Modulators of Synaptic Formation During Development Neurons use a combination of mechanisms to localize their synapses and several examples are shown here. Morphogens can provide pro- or antisynaptic guidance, determining synaptic location by the concentration of the gradient. Phagocytic glia can prune away synapses by engulfing the neuronal contact sites. Prosynaptic cells, including glia and epithelial cells can promote synaptogenic contact between neurons. Neurons can also direct their own synapse formation by secreting diffusible signals or by directly contacting each other via cell adhesion molecules.
30
2018). One known mechanism is to have well-defined sub-regions within the membrane which contain
site-restricted synaptogenic proteins. This is the case at the axon initial segment (AIS) of Purkinje neurons,
where Spectrin is specifically localized to initiate synapses with GABAeric neurons (Ango et al., 2004).
Other proteins involved in synapse initiation, such as Liprin-alpha, Nrx and Synaptic Cell Adhesion
Molecule (SynCAM) are known to be a first step in synapse initiation, but there is not yet evidence for
them localizing to highly specific sites in neuronal membranes prior to synapse formation the way Spectrin
does at the AIS (Scheiffele et al., 2000; Biederer et al., 2002; Patel et al., 2006). In C. elegans, Nrx is
required for a motor neuron to form synapses with a muscle target, but not a neighboring GABA neuron
target. This suggests unique localization may occur to specify this synapse, but Nrx is widely expressed
and has not been demonstrated to transit to specific sites prior to synapse formation (Philbrook et al.,
2018). Evidence for such prepatterning does exist at muscles, where postsynaptic regions are prepared in
anticipation of the incoming neuron (Broadie and Bate, 1993; Jing et al., 2009). It remains to be seen
whether neural synaptogenic proteins can accumulate before the partner neuron has arrived, or whether
the arrival of the partner or support cells cause such proteins to aggregate.
In summary, neurons have a variety of mechanisms to coordinate where and how strongly to
synapse with their targets. The process can be controlled by extracellular morphogens, other cells (such
as glia and epithelial cells), and intrinsically by cell-autonomous mechanisms. In this dissertation work, I
have pursued new molecular mechanisms that control this process, which are detailed in Chapter 4.
Synaptic localization is a key part in neural circuit development, and one of the many steps in the
synaptogenic process that requires more intensive research.
Summary
In this dissertation, I studied neural development at single cell resolution using Drosophila genetic
approaches and the GF circuit. I particularly focused on probing the Drosophila FXS disease model and
31
testing how FMRP loss affects the properties of a single GF neuron. These results, which are presented in
Chapter 2, show a new phenotype wherein FMRP restricts dye entry into a neuron. While performing this
work, I identified several previously unreported dye-coupled neurons that connect with the GF circuit,
and characterized their structure, polarization and interactions with the central GFI. These findings are
reported in Chapter 3. Finally, during further studies of the implications of FMRP loss in the GF circuit, I
discovered a synaptic overgrowth phenotype caused by a background mutation in a commonly used FMRP
null allele, dfmr150M. Using bulk segregant analysis (BSA) paired with WGS, I have begun the process of
identifying the causative mutation and confirming its role in the overgrowth phenotype. These findings
are currently being prepared for publication and are presented in Chapter 4. A summary of all of these
results, and future directions for each project is contained in the concluding Chapter 5. Also included in
Chapter 5 is a summary of two projects that were not published due to time constraints and negative
data.

32
Chapter II
Fragile X Mental Retardation Protein Restricts Small Dye Iontophoresis Entry into Central Neurons
This paper has been published under the same title in Journal of Neuroscience, 2017
Tyler Kennedy1 and Kendal Broadie1,2,3
1Department of Biological Sciences, 2Department of Cell and Developmental Biology, 3Vanderbilt Brain
Institute, Vanderbilt University and Medical Center,
Nashville, TN 37235 USA
Abstract
Fragile X Mental Retardation Protein (FMRP) loss causes Fragile X syndrome (FXS), a major disorder
characterized by autism, intellectual disability, hyperactivity and seizures. FMRP is both an RNA- and
channel-binding regulator, with critical roles in neural circuit formation and function. However, it
remains unclear how these FMRP activities relate to each other and how dysfunction in their absence
underlies FXS neurological symptoms. In testing circuit level defects in the Drosophila FXS model, we
discovered a completely unexpected and highly robust neuronal dye iontophoresis phenotype in the
well-mapped Giant Fiber (GF) circuit. Controlled dye injection into the GF Interneuron (GFI) results in a
dramatic increase in dye uptake in neurons lacking FMRP. Transgenic wildtype FMRP reintroduction
rescues the mutant defect, demonstrating a specific FMRP requirement. This phenotype affects only
small dyes, but is independent of dye charge polarity. Surprisingly, the elevated dye iontophoresis
persists in shaking B mutants that eliminate gap junctions and dye coupling among GF circuit neurons.
We therefore used a wide range of manipulations to investigate the dye uptake defect, including timed
33
injection series, pharmacology and ion replacement, and optogenetic activity studies. The results show
FMRP strongly limits the rate of dye entry via a cytosolic mechanism. This study reveals an unexpected
new phenotype in a physical property of central neurons lacking FMRP that could underlie aspects of
FXS disruption of neural function.
Significance Statement
FXS is a leading heritable cause of intellectual disability and autism spectrum disorders. Although
researchers established the causal link with FMRP loss over 25 years ago, studies continue to reveal
diverse FMRP functions. The Drosophila FXS model is key to discovering new FMRP roles, owing to its
genetic malleability and individually-identified neuron maps. Taking advantage of a well-characterized
Drosophila neural circuit, we discovered that neurons lacking FMRP take up dramatically more current-
injected small dye. After examining many neuronal properties, we determined that this dye defect is
cytoplasmic and occurs due to a highly elevated dye iontophoresis rate. We also report several new factors
affecting neuron dye uptake. Understanding how FMRP regulates iontophoresis should reveal new
molecular factors underpinning FXS dysfunction.
Introduction
Fragile X syndrome (FXS), resulting from Fragile X Mental Retardation Protein (FMRP) loss, is the
leading heritable cause of autism and intellectual disability, and displays comorbidity with numerous other
neurological symptoms including attention deficit, hyperactivity and childhood seizures (Cowley et al.,
2016). FMRP is a complex protein with multiple neuronal functions. The canonical FMRP role is direct
RNA-binding translation control, regulating activity-dependent expression of a large but indeterminate
number of neuronal proteins (Darnell et al., 2011). Without FMRP, numerous proteins become
overexpressed, significantly altering the neuronal proteome (Zhang et al., 2001; Cvetkovska et al., 2013;
34
Ifrim et al., 2015). The major non-canonical FMRP role is direct channel-binding, which regulates
functional channel gating properties (Brown et al., 2010; Strumbos et al., 2010). Without FMRP, K+ and
Ca2+ channels are dysregulated, altering both action potentials and synaptic transmission (Deng et al.,
2013; Contractor et al., 2015). A number of other diverse functions have also been ascribed to FMRP, such
as miRNA regulation and chromatin stability control (Jin et al., 2004; Alpatov et al., 2014), expanding the
already complex involvement of FMRP in neuronal development and function. Targeted and effective
therapies for patients will require an understanding of how these diverse FMRP roles relate to FXS
symptoms.
Drosophila disease models provide a potent toolkit to discover novel neuronal mechanisms
underlying neurological symptoms. The well-established Drosophila FXS disease model exhibits
phenotypes analogous to human symptoms, including synaptic overgrowth, hyperactivity and
learning/memory deficits (Zhang et al., 2001; Dockendorff et al., 2002; Bolduc et al., 2008), and continues
to provide key new insights into FXS (Doll and Broadie, 2014, 2015, 2016; Golovin and Broadie, 2016).
Elegant Drosophila brain neural circuit maps reveal individual neurons with single-cell resolution, enabling
links between neuronal molecular changes and FXS circuitry defects. An excellent set of neurons for such
work is the Giant Fiber (GF) circuit, a well-characterized escape circuit comprised of five readily identifiable
neurons (King and Wyman, 1980; Allen et al., 1998), which require FMRP for proper circuit function
(Martinez et al., 2007). This circuit collects sensory information and relays it to motor neurons via the
large GF Interneuron (GFI), enabling rapid escape from aversive stimuli (Tanouye and Wyman, 1980). The
toolkit for this circuit includes highly specific genetic reporters (Sun and Wyman, 1996) and an array of
transgenic drivers that provide exquisite labeling and manipulation of individual GF neurons
(Godenschwege et al., 2002; Lee and Godenschwege, 2014). The large size and easy accessibility of the
GFI allows iontophoretic dye injection via sharp electrodes, a critical tool for circuit study (Boerner and
Godenschwege, 2011).

35
Dye iontophoresis represents a classic strategy for neural circuit mapping and uncovering genes
required for electrical synapse formation, with many studies in the extensively dye-coupled GF circuit
(Phelan et al., 1996; Kudumala et al., 2013; Lee and Godenschwege, 2014). Small ionic dyes, such as
neurobiotin and lucifer yellow, pass through gap junctions, labeling the electrically-coupled circuit (Lapper
and Bolam, 1991; Hanani, 2012). Most experiments assay simple dye transfer between coupled neurons;
however, a recent study tested quantitative relative dye transfer levels via gap junctions (Orr et al., 2014).
Expanding on this quantitative dye iontophoresis approach, we began exploring GF circuit dye coupling in
the FXS model to test hypothesized changes in circuit connectivity. Instead, we stumbled upon an
unexpected and robust dye injection phenotype: Drosophila fmr1 (dfmr1) null mutant neurons take up
dramatically more small, charged dyes injected via iontophoretic current. This defect is not related to a
multitude of neuronal properties, including size, porosity and circuit connectivity. Indeed, we found a
trend toward fewer gap junction electrical synapses in dfmr1 null neurons, and a persistent dye
iontophoresis defect in neurons completely lacking all gap junction connections. We conclude FMRP
regulates a cytosolic mechanism determining ionic uptake rates. This study provides new insights into
quantitative iontophoresis, broadens understanding of multiple factors modulating neuronal dye
injection, and identifies a new neurological disruption in this FXS disease model.
Materials and Methods
Drosophila Genetics
All animals were maintained on standard cornmeal/agar/molasses Drosophila food in a 12-hour light:dark
cycling incubator at 25oC. For channelrhodopsin experiments, food was made with 100µM all-trans retinal
(ATR) or EtOH vehicle as a control (Ataman et al., 2008), and animals were reared in constant darkness.
The following Drosophila lines were used for genetic crosses, with female offspring used for all
36
experiments: w1118 (RRID:BDSC_3605) | w1118; dfmr150M/TM6B, GFP, Hu (Zhang et al., 2001,
RRID:BDSC_6930) | w1118; dfmr12/TM6, Hu (Dockendorff et al., 2002) | w1118; UAS-dfmr1, dfmr150M/TM6B,
GFP, Hu (9557.3) (Zhang et al., 2001) | w1118; elav-Gal4/CyO (RRID:BDSC_8765) | w1118; elav-Gal4/CyO;
dfmr150M/TM6, Hu | shakB2 (Blagburn et al., 1999) | shakB2; dfmr150M/TM6, GFP | w1118; PGMR91H05-
Gal4attP2 (Jenett et al., 2012, RRID:BDSC_40594) | w1118; UAS-chr2-xxl (Dawydow et al., 2014) |w1118;
10XUAS-ivs-mcd8::rfp (RRID:BDSC_32219) | w1118; PUAS-shaw.RA.FLAG12B (Hodge et al., 2005,
RRID:BDSC_55719) | w1118; UAS-irk2A/CyO, GFP (Dahal et al., 2012). All genotypes were verified with
visible genotype markers when possible, and PCR when necessary. All crosses were allowed to lay eggs
for 2-3 days, with offspring rearing densities carefully matched between compared genotypes.
Dye Iontophoresis
Experimental animals were selected from age-matched rearing tubes 10-13 days after egg laying, yielding
staged adults 0-4 days in age. Genotyped animals were pinned submerged in physiological saline (Jan and
Jan, 1976), and then cut along the dorsal midline to access the cervical connective (CC), as previously
reported (Boerner and Godenschwege, 2011). Sharp glass electrodes (Kwik-Fil Borosilicate glass 1B100F-
4, World Precision Instruments) were pulled on a laser electrode puller (Model P-2000, Sutter Instrument
Company) to 10MΩ resistance (3M KCl). Electrodes were filled by capillary action with one of the following
dye solutions: 0.25% TRITC-Dextran (10kDa, Life Technologies) and 7% Neurobiotin (Vector Laboratories,
RRID:AB_2313575), or 1% Lucifer Yellow (LY) potassium salt (Thermo Fisher Scientific). Dyes were
dissolved in ddH2O or 2M potassium acetate (KAc), as indicated. Filled electrodes were placed on a silver-
chloride wire mounted on a PCS-5000 micromanipulator (Burleigh). The electrode tip was inserted into
the Giant Fiber Interneuron (GFI) at the CC, while a ground electrode was placed in the bath saline. Voltage
was manually controlled with a Grass square-pulse stimulator (S48, Astro-Med Inc), providing 7.5 100ms
pulses/second for 2 minutes, unless otherwise noted. Delivery of 20nA current was monitored by tracking

37
the voltage drop across a 1MΩ resistor in the electrode circuit with an AxoClamp2B amplifier, connected
to a Digidata 1320A data acquisition system (Axon Instruments), controlled by Clampex software (version
9.2). Reversed polarity was used for LY experiments.
Dye Injection Manipulations
For channelrhodopsin experiments, preparations were illuminated with filtered blue light (440-470nm)
from an EBQ100 isolated mercury lamp (Leistungselektronik Jena GmbH) for the duration of dye injection.
Channelrhodopsin function was tested by behavioral response to blue light. For K+ channel blocking, 4-
aminopyridine (4-AP, Sigma-Aldrich; 10mM) was added in physiological saline prior to imaging (Singh and
Singh, 1999). For cocktail experiments, tetraethylammonium chloride (TEA, Sigma-Aldrich; 10mM) was
combined with 10mM 4-AP in the bath, with cesium chloride (140mM) dissolved in KAc-free NB dye
injection solution. Drug was added at the beginning of the dissection, with exposure for >5 minutes prior
to dye injection. All drug trial preparations were rinsed 3X in physiological saline with a 3-minute rest
before fixation to prevent interaction between drug and fixative. Forced leak experiments were
performed following the standard dye injection, followed by a second electrode containing 0.25% TRITC
in 2M KAc that was placed into the dye-injected neuron. The order of genotypes assayed in all trials was
changed for experiments each day to avoid any possible ordering experimental artifacts.
Confocal Imaging
After dye injections, the entire CNS (brain and thoracic ganglion) was dissected out and fixed for 30 mins
in 4% paraformaldehyde (Electron Microscopy Services)/4% sucrose (Thermo Fisher Scientific) in
phosphate-buffered saline (PBS, pH 7.2, Life Technology). Fixed preparations were rinsed 3X with PBS, and
blocked for 1 hour with 1% bovine serum albumin (BSA, Sigma-Aldrich) in PBST (1X PBS, 0.2% Triton X-
100; Thermo Fisher Scientific). Labels were diluted in PBST with 0.2% BSA. The following labels were used:

38
Streptavidin::Cy5 (1:20, Life Technology), rabbit anti-ShakB (1:250, Phelan et al., 1996) and 633-
conjugated goat anti-rabbit (1:250; Life Technology, RRID:AB_141419). Neurobiotin was labeled with
streptavidin::Cy5. Incubations were conducted either overnight at 4oC or 2 hours at room temperature
(RT). Following antibody incubations, preparations were rinsed 3X for 30 minutes in PBST before a final
30-minute rinse in PBS. Preparations were mounted on glass slides (Probe On Plus 25 x 75 x 1.0mm,
Thermo Fisher Scientific) in 2, 2’-Thiodiethanol (TDE, Staudt et al., 2007). To prevent crushing, double-
sided poster tape (Scotch) was placed on each side of the brains. Coverslips (No. 1.5H, Zeiss) were sealed
with nail polish (Hard as Nails, Sally Hansen). Fluorescent images were collected using a ZEISS LSM 510
META laser-scanning confocal microscope with a 40X oil-immersion objective, focusing on the prothoracic
and mesothoracic ganglia regions (Mu et al., 2014). Imaging settings were maintained across all samples,
with the exception of GFI dendrites, which required increased brightness for the TRITC injection of w1118
and dfmr150M, and the NB injection of shakB2 and shakB2; dfmr150M. Images show maximum Z-stack
projections.
Protein Quantification
Brains were dissected in PBS from adult females (0-4 days at 25oC). 4 brains were collected on ice in lysis
buffer (50mM Tris, 100mM NaCl, 1mM EDTA, 1mM PMSF, Protease Inhibitor Cocktail; Sigma-Aldrich),
sonicated (Branson Model 102C, Sonifier 250 microtip) for 20 seconds, returned to ice for 20 minutes,
then centrifuged at 14,000 RPM for 10 minutes. Protein samples were prepared using a BCA kit
(ThermoFisher) and analyzed with a Nanodrop 2000c spectrophotometer (ThermoFisher).
Data Analyses
FIJI software was used for data quantification and processing (Schindelin et al., 2012, RRID:SCR_002285).
For dye injection intensity quantification, the number of pixels at each intensity (0-255) was calculated for

39
each 8-bit image stack. A pixel cutoff of 59 was empirically determined to remove background with
minimal signal loss. The total number of pixels above 59 in the full stack is reported as “dye injected.” GFI
dendrites were quantified in the same manner after masking cell bodies, axons and dye-coupled neurons.
A threshold of 90 was used for the TRITC dendrite quantification to offset changes in imaging brightness.
Intensity quantification was automated using an ImageJ Macro script to remove any experimenter
analytical bias. The dendritic structure was calculated by measuring the GFI primary branches using the
FIJI Simple Neurite Trace plugin (Longair et al., 2011). For w1118 and dfmr150M, the TRITC signal was used,
while for shakB2 and shakB2; dfmr150M NB signal was used for the structural comparisons. For anti-ShakB
fluorescence quantification, the TRITC dye injection signal was used to create the region of interest (ROI)
encompassing the GFI bend. This ROI was then overlaid onto the ShakB channel, and intensities of each
pixel above the background threshold (40) were summed for all optical slices containing the GFI bend. All
statistical analyses were performed using the Prism software (version 7, GraphPad, RRID:SCR_002798).
All single pairwise comparisons were performed by two-tailed student’s t test for Gaussian distributions,
and Mann-Whitney for non-Gaussian distributions. All multiple comparisons were performed using
unpaired one-way ANOVA, with Tukey-Kramer pairwise post-hoc tests. Slope comparisons were
performed using the ANCOVA test. In all figures, graphs show mean ± standard error of the mean (SEM)
with the statistical comparisons displayed as p>0.05 (not significant; NS), p<0.05 (*), p<0.01 (**) and
p<0.001 (***).
Results
FMRP Selectivity Limits Small Dye Iontophoresis into Neurons
While studying Drosophila neural connectivity changes in dfmr1 null mutants, we discovered a
surprising dye iontophoresis phenomenon (Fig. 5): neurons lacking FMRP accept far more neurobiotin

40
(NB, 287Da), but no more dextran-tetramethylrhodamine (TRITC, 10kDa), compared to matched genetic
background controls. We pursued this intriguing finding in the Giant Fiber (GF) circuit by delivering
controlled iontophoretic current to co-inject both NB and TRITC dyes into the GF Interneuron (GFI;
Boerner and Godenschwege, 2011). TRITC provides a real-time confirmation of neuron identity, but
cannot leave the neuron via gap junctions due to its large size (Phelan et al., 1996). In contrast, the much
smaller NB readily crosses gap junctions and labels all of the electrically-coupled neurons within the circuit
(Boerner and Godenschwege, 2010). Each brain hemisphere contains one GFI cell body and dendritic
arbor (not pictured), with a large descending axon into the thoracic ganglion (TG) terminating in the
mesothoracic ganglion with a characteristic bend visible by TRITC labeling (Fig. 5A, top, arrow). The GFI
axon forms electrical synapses with Peripherally Synapsing Interneurons (PSI), visible by NB dye-coupled
labeling (Fig. 5A, bottom, arrows), and the Tergotrochanteral Motor Neuron (TTMn), which projects to leg
muscles (King and Wyman, 1980; Allen et al., 1998). We compared dye labeling in dfmr1 null mutants
(w1118; dfmr150M) with genetic background controls (w1118). Representative images and data summaries
are shown in Figure 5.
Upon injection, TRITC distributes uniformly along the GFI axon to the distal terminating bend in
both controls (Fig. 5A, top left) and dfmr1 nulls (Fig. 5A, top right). Dimmer signal towards the bend results
from the axon moving progressively deeper into the semi-opaque tissue, which restricts light
transmission. There was no quantifiable difference in TRITC dye loading between the two genotypes (Fig.

41
5B). Mean TRITC signal was 2.8x10⁴±0.3x104 pixels in controls (n=36) versus 2.6x10⁴±0.3x104 pixels in
* Figure 5. Selective Small Dye Iontophoresis is Increased in dfmr1 Null Neurons A, Representative images of the Giant Fiber Interneuron (GFI) co-injected with 10kDa dextran conjugated tetramethylrhodamine isothiocyanate (TRITC, red; top) and 287Da neurobiotin (NB, yellow; bottom) dissolved in 2M KAc. Images show the thoracic ganglion for w1118 genetic background (control, left) and dfmr150M null mutant (right). TRITC-dextran is too large to escape the injected GFI neuron, while NB passes through gap junctions to dye-coupled neurons in the GF neural circuit. Arrows indicates GFI bend (top) and Peripherally Synapsing Interneuron (PSI, bottom). Arrowheads indicate coupled cell bodies. Scale bar: 20µm. B, Quantification of TRITC (red) and NB (yellow) dye injection displayed as mean ± SEM. TRITC: control n=36, dfmr1 n=33. NB: control n=37, dfmr1 n=36. C, Voltage required to deliver 20nA of current to the GFI neuron in control and dfmr1 null mutants. Voltage is shown at the start (left) and end (middle) of each two-minute injection, and also as the net voltage change after a two-minute injection (right). Control n=38, dfmr1 n=35. Significance determined from two-tailed unpaired t tests (B) or two-tailed Mann-Whitney tests (C): p***<0.001 and not significant (NS).

42
dfmr1 nulls (n=33), an indistinguishable difference in loading (p=0.64, two-tailed unpaired t test). In sharp
contrast, control GFIs contain visibly less NB dye in the axon, especially at the terminal bend (Fig. 5A,
bottom left), compared to dfmr1 null mutants (Fig. 5A, bottom right). Moreover, the mutants display
much more NB signal in the coupled PSI (arrows) and other labeled neurons, including their cell bodies
(arrowheads). Null dfmr1 GFIs are not visibly coupled to any neurons not labeled in controls and maintain
a normal circuit pattern. Upon quantification, we found dfmr1 null neurons take up nearly 3-fold more NB
dye than controls (Fig. 5B). Mean NB dye intensity in controls was 4.4x10⁴±1.1x10⁴ (n=37) compared to
12.8x10⁴±1.7x10⁴ in dfmr150M mutants (n=36), a very highly significant increase (p=6.2x10⁻⁵, two-tailed
unpaired t test). This selective dye iontophoresis defect is highly replicable and extremely robust,
providing an excellent new measure for the effects of FMRP loss. Furthermore, such a genotypic
difference in iontophoretic dye loading has never been reported for any mutant condition, to our
knowledge.
To test if current delivery differences might cause the differential dye loading between genotypes,
we next recorded the voltage required to deliver a constant current (Fig. 5C). Any voltage change must be
coupled with a resistance change to maintain a constant current. Differing voltage requirements between
genotypes would reveal altered conductivity throughout the dye delivery circuit, such as altered plasma
membrane permeability. Comparing genetic background controls to dfmr1 null mutants, we recorded the
voltage required to deliver 20nA currents over a 2-minute interval, but found no significant differences
between the two genotypes (Fig. 5C). The voltage did not differ at the onset of current injection (control:
8.0±0.9 volts, n=38; dfmr150M: 6.8±0.8 volts, n=35, p=0.21, two-tailed Mann-Whitney test; Fig. 5C) or at
the end of current injection (control: 7.1±0.7 volts; dfmr150M: 8.0±1.1 volts, p=0.66, two-tailed Mann-
Whitney test; Fig. 5C). The net voltage change also did not differ between the genotypes (control: 0.9±0.7
volts; dfmr150M: -1.2±1.0 volts, p=0.44, two-tailed Mann-Whitney test; Fig. 5C). Detailed analyses of instant
current readings (1kHz) throughout the injection period also revealed no differential fluctuations between
43
genotypes that could account for loading differences (not shown). These findings show the electrical
circuit resistance does not differ between dfmr1 nulls and background controls, and indicate that the
elevated NB loading in mutants must result from altered fundamental neuron properties in the absence
of FMRP.
FMRP-Dependent and Charge-Independent Dye Iontophoresis Defect
We next tested whether the altered neuronal properties were specifically due to loss of FMRP.
We first compared the w1118 genetic background control (Fig. 6A, top left) with a second, independent
dfmr1 null allele, dfmr12 (Fig. 6A, top right). To rule out recessive background effects, we tested the
heteroallelic combination with dfmr150M. This mutant replicated the specific NB dye loading defect
(control: 3.9x10⁴±1.3x10⁴, n=6; dfmr12/50M: 12.1 x10⁴±1.1x10⁴, n=6, p=0.0008, two-tailed unpaired t test;
Fig. 6B), supporting a causative FMRP role. We next tested if transgenic expression of wildtype dFMRP in
dfmr1 null neurons rescues the phenotype using neuron-specific elav-Gal4 as the driver (Brand and
Perrimon, 1993). Dye loading in the rescue condition was comparable to the paired control, and greatly
reduced compared to the dfmr1 null (Fig. 6A,B). Quantification supports the conclusion that wildtype
dFMRP reintroduction rescues the dye loading phenotype (elav-Gal4/+: 6.1x10⁴±1.3x10⁴, n=17; elav-
Gal4/+; dfmr150M, UAS-dfmr1/dfmr150M: 7.8x10⁴±1.5x10⁴, n=18; elav-Gal4/+; dfmr150M/dfmr150M:
13.4x10⁴±1.9x10⁴, n=13), with no significant difference between control and rescue conditions (p=0.68),
but a significant difference existing between the rescue and mutant (p=0.03) and persisting between the
control and mutant (p=0.005, unpaired ANOVA, Tukey-Kramer pairwise post-hoc test; Fig. 6B). Taken
together, these findings confirm that FMRP specifically regulates NB dye iontophoresis, ruling out genetic
background and non-specific effects.
We next tested whether the dye loading phenotype is NB-specific or occurs with other small dyes.
We repeated the dye injection studies with the commonly-used negatively charged small dye lucifer

44
Figure 6. Dye Iontophoresis Defect is FMRP Dependent and Charge Independent A, Representative NB images of GFI injections (2M KAc) for w1118 genetic background (control, top left), heteroallelic dfmr1 null (dfmr12/dfmr150M, top right), wildtype UAS-dfmr1 driven with neural elav-Gal4 (rescue, bottom left) in dfmr150M null background and the dfmr150M null alone (bottom right). Scale bar: 20µm. B, Quantification of dye injection in the above four genotypes. The heteroallelic combination and transgenic rescue experiment occurred independently and are displayed with their separate genetic controls. All graphs show data as mean ± SEM. Heteroallelic: control n=6, dfmr12/50M n=6. Rescue: control n=17, rescue n=18, dfmr150M n=13. C, Representative images of lucifer yellow dye injections (in ddH2O) into the GFI neuron in the w1118 genetic background (control, top) and dfmr150M null mutant (bottom). Scale bar: 20µm. D, Quantification of lucifer yellow injection in both genotypes. Control n=13, dfmr1 n=12. Significance determined from two-tailed unpaired t test (B, left; D) and unpaired ANOVA (B, right): p*<0.05, p**<0.01, p***<0.001 and not significant (NS).

45
yellow (LY, 430Da), which had the added benefit of testing for a role of charge polarity (Hanani, 2012). LY
is fluorescent and visible during injection, requiring no amplification prior to imaging. Utilizing the same
iontophoresis paradigm, but with reversed polarity, we again found a dramatic increase in dye uptake in
the dfmr1 mutants (Fig. 6C). Compared to w1118 genetic controls (top), dfmr1 nulls load far more LY dye
(bottom), with increased signal continuously along the descending axon and terminating bend (Fig. 6C). Y
passage to electrically coupled neurons is much slower than NB, thereby largely limiting analysis to the
injected GFI (Boerner and Godenschwege, 2011). Similar to NB dye, quantification shows controls
(1.6x10⁴±0.3x10⁴, n=13) loaded 3-fold less LY dye than dfmr1 null mutants (5.6x10⁴±0.5x10⁴, n=12), a very
highly significant difference (p=3.1x10⁻⁶, two-tailed unpaired t test; Fig. 6D). These results show the dfmr1
mutant defect is generalizable for small dyes, regardless of dye charge polarity. The selective elevation in
small dye iontophoresis, with large TRITC dye loading unchanged, strongly suggested the phenotype arises
from a gap junction mechanism.
Increased Dye Iontophoresis Persists in the Absence of Gap Junctions
The obvious factor that could determine dye loading based on dye size is gap junction electrical
synapses. FXS patients and models exhibit synaptic overgrowth (Comery et al., 1997; Irwin et al., 2000;
Zhang et al., 2001; Doll and Broadie, 2015), but these analyses have focused on chemical, not electrical,
synapses. We hypothesized that increased electrical connectivity mirrors increased chemical synapse
connectivity in the FXS disease state, promoting dye movement into electrically-coupled neurons and
thereby bringing more total dye into the GF circuit. All GFI electrical synapses require the Shaking B
(ShakB) N+16 isoform (Phelan et al., 2008), allowing tests of gap junction abundance between controls
and dfmr1 nulls. Using a ShakB N+16 antibody, TRITC injected neurons were assayed for fluorescence
intensity at TTMn synapses along the GFI bend (Fig. 7A). Contrary to our hypothesis, we found ShakB levels
in controls (top) trend higher than in dfmr1 nulls (bottom). ShakB punctae along the GFI bend (arrows)

46
Figure 7. Null dfmr1 Neurons Manifest Dye Injection Defect Without Gap Junctions A, Representative images of anti-ShakB labeling in the GFI for the w1118 genetic background (control, top) and dfmr150M null mutant (bottom). White outline indicates GFI bend as labeled by injected TRITC signal. ShakB signal intensity is represented as a heat map. Arrows indicate ShakB punctae. Scale bar: 5µm. B, Quantification of ShakB signal intensity in both genotypes, displayed as mean ± SEM. Control n=27, dfmr1 n=26. C, Representative NB injections into the GFI (2M KAc) for the shakB2 single mutant (left) and shakB2; dfmr150M double mutant (right). Scale bar: 10µm. D, Quantification of the injected dye levels in both genotypes, displayed as mean ± SEM. Control n=30, dfmr1 n=31. Significance was determined from two-tailed unpaired t tests: p**<0.01 and not significant (NS).
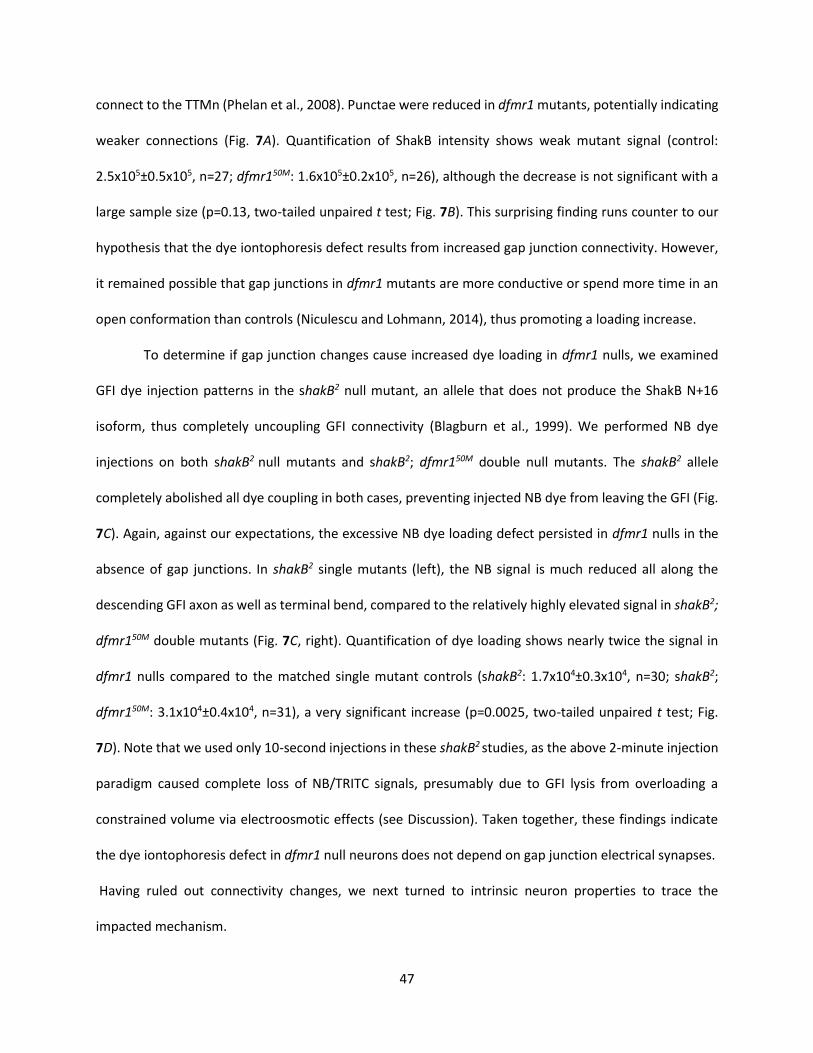
47
connect to the TTMn (Phelan et al., 2008). Punctae were reduced in dfmr1 mutants, potentially indicating
weaker connections (Fig. 7A). Quantification of ShakB intensity shows weak mutant signal (control:
2.5x10⁵±0.5x10⁵, n=27; dfmr150M: 1.6x10⁵±0.2x10⁵, n=26), although the decrease is not significant with a
large sample size (p=0.13, two-tailed unpaired t test; Fig. 7B). This surprising finding runs counter to our
hypothesis that the dye iontophoresis defect results from increased gap junction connectivity. However,
it remained possible that gap junctions in dfmr1 mutants are more conductive or spend more time in an
open conformation than controls (Niculescu and Lohmann, 2014), thus promoting a loading increase.
To determine if gap junction changes cause increased dye loading in dfmr1 nulls, we examined
GFI dye injection patterns in the shakB2 null mutant, an allele that does not produce the ShakB N+16
isoform, thus completely uncoupling GFI connectivity (Blagburn et al., 1999). We performed NB dye
injections on both shakB2 null mutants and shakB2; dfmr150M double null mutants. The shakB2 allele
completely abolished all dye coupling in both cases, preventing injected NB dye from leaving the GFI (Fig.
7C). Again, against our expectations, the excessive NB dye loading defect persisted in dfmr1 nulls in the
absence of gap junctions. In shakB2 single mutants (left), the NB signal is much reduced all along the
descending GFI axon as well as terminal bend, compared to the relatively highly elevated signal in shakB2;
dfmr150M double mutants (Fig. 7C, right). Quantification of dye loading shows nearly twice the signal in
dfmr1 nulls compared to the matched single mutant controls (shakB2: 1.7x10⁴±0.3x10⁴, n=30; shakB2;
dfmr150M: 3.1x10⁴±0.4x10⁴, n=31), a very significant increase (p=0.0025, two-tailed unpaired t test; Fig.
7D). Note that we used only 10-second injections in these shakB2 studies, as the above 2-minute injection
paradigm caused complete loss of NB/TRITC signals, presumably due to GFI lysis from overloading a
constrained volume via electroosmotic effects (see Discussion). Taken together, these findings indicate
the dye iontophoresis defect in dfmr1 null neurons does not depend on gap junction electrical synapses.
Having ruled out connectivity changes, we next turned to intrinsic neuron properties to trace the
impacted mechanism.

48
GFI Dendrites are Structurally Unaltered and Display Dye Loading Defect
The polarized structure of neurons provides one hypothesis for the mechanism underlying
increased dye loading: dye compartmentalization varies between genotypes. We therefore tested
whether increased dfmr1 null axonal dye levels result from reduced dendritic dye accumulation, due
either to inhibited retrograde dye movement or decreased dendrite architecture. We measured dendritic
dye loading, volume and coverage in both the w1118 and shakB2 genetic backgrounds to address dye-
coupled and -uncoupled circuits. Representative images in Figure 8A show the complete GFI dendritic
field, with a dorsal projection connecting the cell body (arrowhead), and the GFI axon projecting towards
the bottom right in each image (arrow). Control dendrites (e.g. shakB2, top left) load significantly less NB
dye than dfmr1 mutants (shakB2; dfmr150M, top right), in the absence of discernable structural differences.
Quantification of NB signal in w1118 controls versus dfmr1 nulls (Fig. 8B, left), and shakB2 versus shakB2;
dfmr150M (Fig. 8B, right), shows elevated dye loading in dendrites replicating axonal phenotypes. Both
conditions show significant increases in dfmr1 nulls (control: 0.1x10⁴±0.03x10⁴, n=20; dfmr150M:
1.6x10⁴±0.2x10⁴, n=20, p=2.7x10⁻⁷, two-tailed unpaired t test. shakB2: 2.1x10⁴±0.4x10⁴, n=27; shakB2;
dfmr150M: 3.4x10⁴±0.3x10⁴, n=30, p=0.009, two-tailed unpaired t test; Fig. 8B). This finding indicates there
is not a reduction in dye in dfmr1 null dendrites relative to controls that could offset the increase seen in
axons.
To determine whether the dfmr1 null GFI dendritic architecture is reduced, thereby forcing more
injected NB dye into axons, we measured dendritic length, volume and coverage. TRITC labeling in the GFI
dendrites shows no detectable changes in the GFI dendritic field comparing w1118 controls (left) and dfmr1
nulls (right; Fig. 8A, bottom). Quantification of the injected TRITC dye shows dendrite volume in the
controls (3.2x10⁴±0.5x10⁴, n=17) trends smaller than dfmr1 nulls (3.8x10⁴±0.8x10⁴, n=17), but the
difference is not significant (p=0.54, two-tailed unpaired t test; Fig. 8C). Measurement of the primary
dendritic branches also shows similar dendritic branch length between w1118 controls (148.2±7.1µm, n=17)

49
Figure 8. Specific Small Dye Iontophoresis is Increased in dfmr1 GFI Dendritic Arbors A, Representative images of the GFI dendritic arbors in shakB2 single mutant (top left) and shakB2; dfmr150M double mutants (top right) labeled with NB injection (yellow, ddH2O), and w1118 genetic control (bottom left) and dfmr150M null (bottom right) labeled with TRITC injection (red, ddH2O). Arrowheads indicate dendritic projections connected to the cell body (out of focus). Arrows indicate the descending axons. Scale bars: 5µm. B, NB injection quantification of GFI dendritic arbor for w1118 control versus dfmr150M null (left), and shakB2 versus shakB2; dfmr150M (right), displayed as the mean ± SEM. w1118 n=20, dfmr150M n=20, shakB2 n=27, shakB2; dfmr150M n=30. C, TRITC injection quantification of GFI dendritic arbor for w1118 control versus dfmr150M null, displayed as the mean ± SEM. w1118 n=17, dfmr150M n=17. D, Dendritic branch length quantification for w1118 control versus dfmr150M null (left), and shakB2 versus shakB2; dfmr150M (right), displayed as the mean ± SEM. w1118 n=17, dfmr150M n=18, shakB2 n=26, shakB2; dfmr150M n=28. Significance was determined from two-tailed unpaired t tests: p**<0.01, p***<0.001 and not significant (NS).

50
and dfmr1 null mutants (dfmr150M: 146.4±6.0µm, n=18, p=0.85, two-tailed unpaired t test; Fig. 8D, left).
Likewise, dendritic branching was similar in the dye-uncoupled circuit comparing shakB2 versus shakB2;
dfmr150M double mutants (shakB2: 166.6±3.3µm, n=26; shakB2; dfmr150M: 157.3±4.2µm, n=28, p=0.09,
two-tailed unpaired t test; Fig. 8D, right). Overall, dye loading is increased in dfmr1 null dendrites, similar
to our findings in axons, indicating the dye loading increase occurs throughout the neuron. Moreover,
gross dendritic arbor volume and branching is unchanged in dfmr1 mutants, ruling out the possibility that
smaller dfmr1 dendrites drive more dye entry into axons. It is worth noting that there is similarly elevated
dye loading in the dfmr1 null cell bodies relative to controls (not pictured). Given this global increase in
dye iontophoresis, we next tested multiple other neuronal properties that could impact dye uptake.
Intrinsic Neuronal Properties Unrelated to Dye Injection Defect
We first tested whether an increase in axon size could elevate NB dye loading in dfmr1 nulls,
despite unaltered TRITC uptake (Fig. 5). We hypothesized larger volume, could accommodate more
injected dye, causing the noticeable increase in signal along the GFI axon. We used the TRITC signal, an
internal control unchanged between genotypes, to measure GFI axon diameter in control (left) versus
dfmr1 null (right) neurons (Fig. 9A). We found no difference in diameter between genotypes over a GFI
axonal length of 40µm (Fig. 9B), with controls averaging 4.9±0.2µm (n=15) and dfmr1 nulls 5.0±0.2µm
(n=16) in diameter, a non-significant difference (p=0.79, two-tailed unpaired t test; Fig. 9B). We confirmed
this finding by labeling the GFI with membrane RFP (UAS-mcd8::rfp) driven with a GFI-specific Gal4 driver
(91H05-Gal4; Jenett et al., 2012). With this independent transgenic label (not shown), we again found
similar axonal diameters comparing dfmr1 nulls (5.9±0.4µm, n=12) versus controls (5.2±0.3µm, n=12;
p=0.16, two-tailed unpaired t test), showing FMRP loss does not impact size. We also tested dfmr1
mutants for elevated protein levels as a consequence of increased translation by extracting protein from
control versus dfmr1 null brains and comparing protein levels using the BCA assay. Quantified
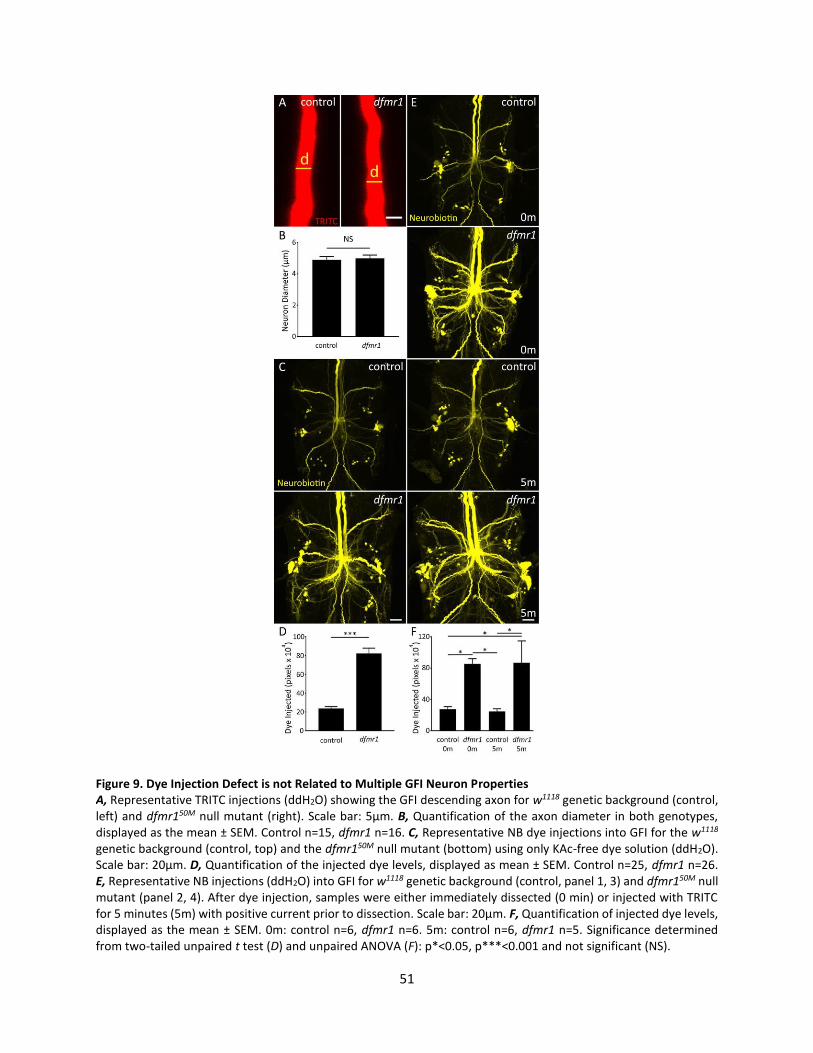
51
Figure 9. Dye Injection Defect is not Related to Multiple GFI Neuron Properties A, Representative TRITC injections (ddH2O) showing the GFI descending axon for w1118 genetic background (control, left) and dfmr150M null mutant (right). Scale bar: 5µm. B, Quantification of the axon diameter in both genotypes, displayed as the mean ± SEM. Control n=15, dfmr1 n=16. C, Representative NB dye injections into GFI for the w1118 genetic background (control, top) and the dfmr150M null mutant (bottom) using only KAc-free dye solution (ddH2O). Scale bar: 20µm. D, Quantification of the injected dye levels, displayed as mean ± SEM. Control n=25, dfmr1 n=26. E, Representative NB injections (ddH2O) into GFI for w1118 genetic background (control, panel 1, 3) and dfmr150M null mutant (panel 2, 4). After dye injection, samples were either immediately dissected (0 min) or injected with TRITC for 5 minutes (5m) with positive current prior to dissection. Scale bar: 20µm. F, Quantification of injected dye levels, displayed as the mean ± SEM. 0m: control n=6, dfmr1 n=6. 5m: control n=6, dfmr1 n=5. Significance determined from two-tailed unpaired t test (D) and unpaired ANOVA (F): p*<0.05, p***<0.001 and not significant (NS).
52
comparisons of total brain protein levels confirm a highly significant increase in dfmr1 nulls relative to
controls by 14.5% (w1118 control: 1.40±0.04µg/brain, n=11; dfmr150M: 1.61±0.03µg/brain, n=11, p=0.0003,
two-tailed unpaired t test). Thus, neuron size is unchanged in dfmr1 mutants but protein concentration is
elevated, consistent with expectations. We next explored the possibility that the standard 2M potassium
acetate (KAc) in the dye injection electrode (Phelan et al., 1996; Kudumala et al., 2013; Lee and
Godenschwege, 2014) is related to the iontophoretic differences between genotypes. We hypothesized
that dfmr1 mutants preferentially accept NB+ ions over K+ ions from the electrode due to intrinsic
differences in membrane K+ conductivity, characteristic of FXS disease models (Strumbos et al., 2010; Lee
et al., 2011). We repeated dye injections with NB/TRITC dissolved in ddH2O and found far more NB loaded
in both controls and mutants (Fig. 9C). Incredibly, KAc-free injection controls contained as much dye signal
as 2M KAc injected dfmr1 null mutants typically display (compare Figs. 9C and 5A). KAc-free injection in
dfmr1 nulls revealed far more dye-coupled neurons, showing the extraordinary degree of GF circuit
connectivity. In both genotypes, signal increased in GFIs and coupled neurons; however, the relative
difference between dfmr1 null and control remained unchanged (Fig. 9C,D). Mutants show a 3.5-fold
increase in NB signal over controls (control: 23.6x10⁴±2.1x10⁴, n=25; dfmr150M: 82.3x10⁴±5.7x10⁴, n=26),
a very significant elevation (p=6.2x10⁻¹¹, two-tailed unpaired t test; Fig. 9D). While this does not rule out
a role for neuronal [K+] or K+ channel function in the dye loading phenotype, we found K+ in the dye
solution has no demonstrable impact on relative dye loading between controls and dfmr1 nulls. We
further explore the role for K+ currents later (see below), but first we tested a simpler explanation: does
loss of FMRP reduce NB dye leakage from neurons?
Besides gap junctions, many neuronal membrane pores permit escape of small ionic molecules
(like NB) to the extracellular space, including innexin hemi-channels, transient receptor potential (TRP)
channels and purinergic receptors (Bennett et al., 2003; Meyers et al., 2003). The broad FMRP role in
mRNA translational regulation makes disruption of these protein levels a possibility in the FXS disease

53
state, although only tenuous links are currently known (Darnell et al., 2011; Naviaux et al., 2013; Kong et
al., 2014). We used multiple experiments to test the hypothesis that membrane pores cause controls to
leak more dye than dfmr1 null neurons. First, we modified our protocol to rapidly fix brains after 2M KAc
dye injection, dramatically shortening the potential NB dye leak period. When comparing the new rapid-
fix w1118 control and dfmr1 null neurons, we found no correction of the NB dye loading defect (control:
5.3x10⁴±1.7x10⁴, n=9; dfmr150M: 16.4x10⁴±2.1x10⁴, n=10), with a highly significant increase in mutants
(p=0.0007, two-tailed unpaired t test; not shown). Second, we performed above KAc-free injections and
then allowed preparations to sit for 5 minutes (5m) after injection, to intensify the effects of putative dye
leakage. Quantification of dye loading shows no difference in signal with increased time for leakage (no
delay (0m) w1118: 30.1x10⁴±4.8x10⁴, n=7; delay (5m) w1118: 38.8x10⁴±6.6x10⁴, n=8; p=0.32, two-tailed
unpaired t test; not shown). Together, these two studies do not support a passive dye leakage effect
causing the differential dye loading.
In a final trial, we tested the hypothesis that NB dye leakage occurs only during the actual current
injection. The hypothesis was that controls produce more membrane pores than dfmr1 nulls, but only
current can drive NB through these pores, permitting leakage solely during iontophoresis. We tested this
idea by performing KAc-free NB/TRITC injections for 2 minutes, and then injecting TRITC dissolved in 2M
KAc for another 5 minutes. We found no difference between standard injections (Fig. 9E, 0 min) and
additional current injections (Fig. 9E, 5 min) for either controls or dfmr1 mutants, clearly ruling out the
possibility of an electrically induced dye leak from the GFI. Moreover, the dye iontophoresis defect was
not modulated, with far more NB signal in dfmr1 mutants compared to controls (Fig. 9E). Quantification
shows that injected dye remains following prolonged post-injection current for 5 minutes (0m control
(c0): 27.6x10⁴±3.2x10⁴, n=6; 0m dfmr150M (d0): 85.5x10⁴±6.7x10⁴, n=6; 5m control (c5): 24.7x10⁴±3.4x10⁴,
n=6; 5m dfmr150M (d5): 86.8x10⁴±27.9x10⁴, n=5), with significant differences persisting in all comparisons
between controls and mutants (c0 v. d0: p=0.018, c0 v. c5: p=0.998, c0 v. d5: p=0.022, c5 v. d0: p=0.013,
54
c5 v. d5: p=0.015, d0 v. d5: p=1.00, unpaired ANOVA, Tukey-Kramer pairwise post-hoc test; Fig. 9F). After
ruling out the possibility that dye leaks from the circuit, we turned our attention to cation movement to
test whether changes in endogenous K+ conductance alters NB injection.
Ionic Manipulations Alter Dye Loading but do not Resolve dfmr1 Defect
A recent large body of work links FMRP to K+ channel expression and function (Brown et al., 2010;
Strumbos et al., 2010; Gross et al., 2011; Lee et al., 2011; Deng et al., 2013). We therefore hypothesized
that dfmr1 neurons more efficiently expel K+ ions, reducing charge buildup to permit accumulation of
more NB+ ions. The above work supports this hypothesis by showing that removing KAc from the injection
solution increases dye signal (Fig. 9C,D). We first used the K+ channel blocker 4-aminopyridine (4-AP,
10mM; Singh and Singh, 1999) to test whether reduced K+ conductance impairs NB dye loading (Fig. 10A).
Comparing control (top) and dfmr1 nulls (bottom) without (left) or with 4-AP (right), we found blocking K+
channels greatly reduced dye loading in both genotypes. Importantly, however, a significant difference
between drug-treated controls and dfmr1 null mutants remains despite the major reduction in dye uptake
(Fig. 10A). Quantification shows that 4-AP treatment strongly reduces NB loading, but also that the dfmr1
defect persists (control 0mM 4-AP (c-): 8.4x10⁴±1.2x10⁴, n=15; dfmr150M 0mM 4-AP (d-): 18.2x10⁴±1.7x10⁴,
n=15; control 10mM 4-AP (c+): 2.2x10⁴±0.7x10⁴, n=15; dfmr150M 10mM 4-AP (d+): 10.1x10⁴±1.2x10⁴,
n=15), with highly significant differences remaining (c- v. d-: p<0.0001, c- v. c+: p=0.004, c- v. d+: p=0.79,
c+ v. d-: p=0.0001, c+ v. d+: p=0.0002, d- v. d+: p=0.0001, unpaired ANOVA, Tukey-Kramer pairwise post-
hoc test; Fig. 10B). Thus, K+ channel function appears not to explain the dfmr1 defect.
To rule out the possibility that 4-AP was not fully blocking all K+ channels involved in the
phenotype, we assayed a cocktail consisting of both 4-AP (10mM) and tetraethylammonium (TEA, 10mM)
in the bath, and cesium chloride (140mM) in the injection pipette. We again found reduced NB dye
loading, but the expanded cocktail still does not correct the relative dfmr1 mutant phenotype (control

55
untreated (c-): 24.3x10⁴±3.4x10⁴, n=16; dfmr150M untreated (d-): 49.4x10⁴±5.4x10⁴, n=14; control K+
cocktail (c+): 6.3x10⁴±1.2x10⁴, n=17; dfmr150M K+ cocktail (d+): 19.4x10⁴±2.7x10⁴, n=16, c- v. d-: p<0.0001,
c- v. c+: p=0.0007, c- v. d+: p=0.29, c+ v. d-: p= p<0.0001, c+ v. d+: p=0.0124, d- v. d+: p<0.0001, unpaired
Figure 10. K+ Channel Block Reduces Dye Loading Without Correcting dfmr1 Defect A, Representative NB dye injections (2M KAc) into GFI in w1118 genetic background (control, top) and dfmr150M null mutant (bottom). Samples were bathed in standard saline (left) or standard saline + 10mM 4-AP (right). Scale bar: 20µm. B, Quantification of injected dye levels, displayed as mean ± SEM. 0mM 4-AP: control n=15, dfmr1 n=15. 10mM 4-AP: control n=15, dfmr1 n=15. C, Representative NB injections into GFI (ddH2O) for elav-Gal4 driven UAS-chr2-xxl animals raised on EtOH vehicle (top) or ATR co-factor (bottom). Scale bar: 20µm. D, Quantification of injected NB dye levels for both elav-Gal4 and 91H05-Gal4 (images not shown) driven UAS-chr2-xxl, displayed as mean ± SEM. elav: EtOH n=14, ATR n=14. 91H05: EtOH n=10, ATR n=12. E, Representative NB dye injections into GFI (ddH2O) using an internal ground also within the GFI for the w1118 genetic background (top) and dfmr150M null mutant (bottom). Scale bar: 20µm. F, Quantification of injected dye levels for both genotypes, displayed as mean ± SEM. Control n=9, dfmr1 n=10. Significance determined with two-tailed unpaired t test (F) and unpaired ANOVA (B, D): p**<0.01, p***<0.001 and not significant (NS).

56
ANOVA, Tukey-Kramer pairwise post-hoc test). We also repeated assays with the LY- dye to test whether
the reduced dye loading caused by K+ channel blockade is specific to cationic dyes. We found that 10mM
4-AP during LY injection also reduces dye uptake in both control and dfmr1 null neurons and maintains
the pattern of increased loading in the absence of FMRP (LY control 0mM 4-AP (c-): 1.0x10⁴±0.3x10⁴, n=35;
LY dfmr150M 0mM 4-AP (d-): 2.3x10⁴±0.4x10⁴, n=34; LY control 10mM 4-AP (c+): 0.5x10⁴±0.2x10⁴, n=36; LY
dfmr150M 10mM 4-AP (d+): 0.7x10⁴±0.2x10⁴, n=36, c- v. d-: p=0.017, c- v. c+: p=0.57, c- v. d+: p=0.85, c+ v.
d-: p=0.0002, c+ v. d+: p=0.96, d- v. d+: p=0.0012, unpaired ANOVA, Tukey-Kramer pairwise post-hoc test).
Note that the lowered dye injection levels following 4-AP application makes fluorescence readings more
variable and complicates determination of the significance of the LY effects. We conclude that 4-AP
reduces NB/LY dye loading in both genotypes, but blocking K+ channels does not alleviate differential dye
loading between dfmr1 and controls. To further test the role of ionic conductance, we next assayed
increased conductivity.
We increased K+ conductance via K+ channel overexpression, including Irk2 (Inwardly rectifying K+
channel 2; mammalian Kir2.1) and Shaw (Shaker cognate w; mammalian Kv3.2). Neural elav-Gal4 driven
Irk2A causes a trending but non-significant increase in NB dye loading (elav/+ control: 22.2x10⁴±2.5x10⁴,
n=25; elav/UAS-irk2: 30.9x10⁴±4.1x10⁴, n=22, p=0.08, two-tailed unpaired t test). Neural elav-Gal4 Shaw
overexpression proved to be lethal and therefore could not be examined, but targeted GFI-specific 91H05-
Gal4 driven Shaw expression has no discernable effect on dye loading (91H05/+: 57.5x10⁴±4.7x10⁴, n=14;
91H05/UAS-shaw: 58.4x10⁴±7.0x10⁴, n=14, p=0.91, two-tailed unpaired t test). We also used blue light-
gated channelrhodopsin with the all-trans retinal (ATR) co-factor (Nagel et al., 2003) to provide temporal
and pharmacological control over elevated cation conductivity. To maximize current, we used high-
conductance ChR2-XXL channels (Dawydow et al., 2014) both pan-neuronally (elav-Gal4) and targeted to
the GFI (91H05-Gal4). Both drivers show no difference in dye loading between controls fed the EtOH
vehicle (Fig. 10C, top) and experimentals fed the essential ATR co-factor (bottom). Quantification shows

57
ChR2-XXL activation causes no increase in dye loading for either driver (elav-Gal4 EtOH: 52.4x10⁴±5.5x10⁴,
n=14; elav ATR: 55.4x10⁴±8.9x10⁴, n=14, p=0.78, two-tailed unpaired t test; 91H05-Gal4 EtOH:
63.5x10⁴±8.4x10⁴, n=10; 91H05 ATR: 55.7x10⁴±7.9x10⁴, n=12, p=0.5, two-tailed unpaired t test; Fig. 10D).
These results show increased K+ permeability is unlikely to be the cause of increased dfmr1 dye loading.
To more broadly test if conductance across the membrane alters dye loading we inserted both
dye iontophoresis and ground electrodes into the GFI neuron, short-circuiting current flow across the
membrane. We hypothesized that this “closed circuit” should prevent the dye loading phenotype if the
dfmr1 dye defect arises from membrane conductivity differences. With this dye injection paradigm (KAc-
free), the dfmr1 dye defect persisted (Fig. 10E). Controls showed the normal basal labeling of the injected
GFI and dye-coupled neurons (top), whereas dfmr1 null mutants showed an elevated, intense dye signal
(bottom). Quantification of injected dye shows an internal ground maintains the iontophoresis defect
(control: 15.0x10⁴±3.0x10⁴, n=9; dfmr150M: 56.0x10⁴±6.3x10⁴, n=10), with a highly significant effect
(p=5.5x10⁻⁵, two-tailed unpaired t test; Fig. 10F). Thus, results from removing the plasma membrane from
the injection circuit suggest the defect does not arise from membrane ionic flux differences between the
genotypes. Taken together, blocking K+ channels with 4-AP reduces total dye loading dramatically, but
does not equalize signal in controls and dfmr1 mutants, dye loading is not impacted by introducing
Drosophila K+ or exogenous cation channels and removing membrane roles does not correct differential
dye loading. This suggests that cytoplasmic changes in the absence of FMRP must contribute to the rate
at which small charged dyes accumulate in neurons during iontophoresis.
Elevated Intracellular Dye Iontophoresis Rate in dfmr1 Null Neurons
To test how more NB dye enters the GF circuit over time in dfmr1 null mutants, we performed
KAc-free dye injections for a series of durations: 10 seconds, 30 seconds, 1 minute and 2 minutes (Fig. 11).
We hypothesized dye signal would increase linearly as a function of time in both genotypes, with a
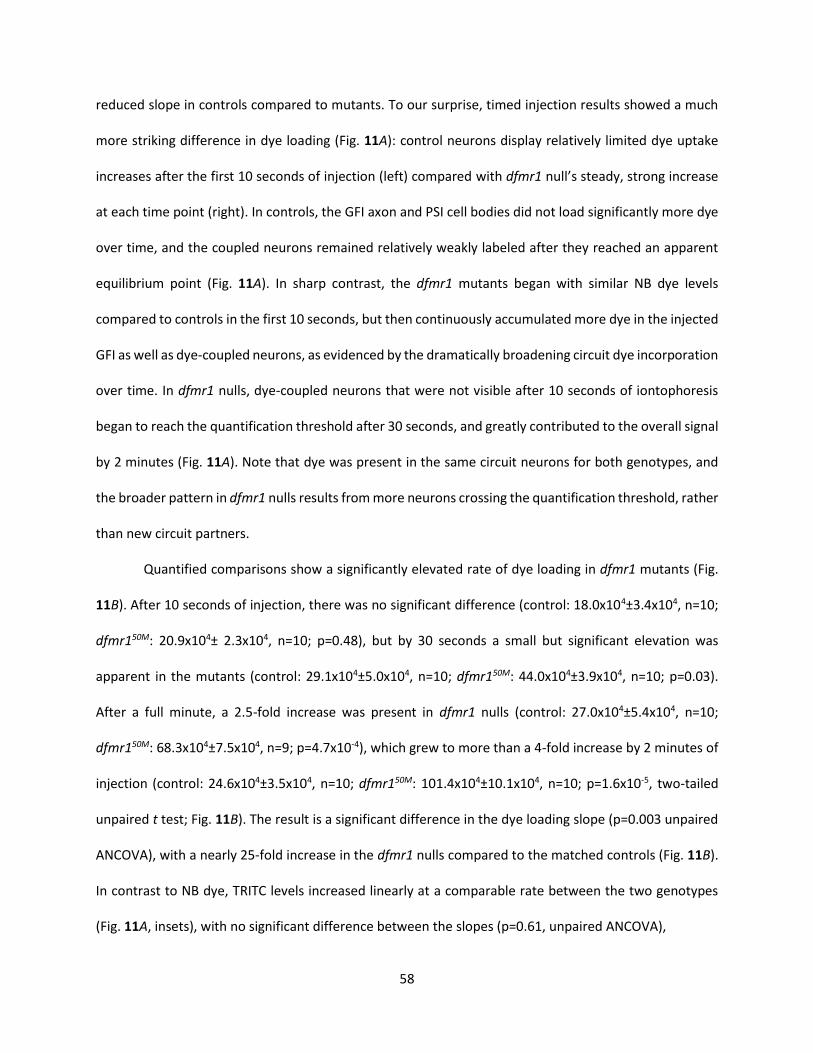
58
reduced slope in controls compared to mutants. To our surprise, timed injection results showed a much
more striking difference in dye loading (Fig. 11A): control neurons display relatively limited dye uptake
increases after the first 10 seconds of injection (left) compared with dfmr1 null’s steady, strong increase
at each time point (right). In controls, the GFI axon and PSI cell bodies did not load significantly more dye
over time, and the coupled neurons remained relatively weakly labeled after they reached an apparent
equilibrium point (Fig. 11A). In sharp contrast, the dfmr1 mutants began with similar NB dye levels
compared to controls in the first 10 seconds, but then continuously accumulated more dye in the injected
GFI as well as dye-coupled neurons, as evidenced by the dramatically broadening circuit dye incorporation
over time. In dfmr1 nulls, dye-coupled neurons that were not visible after 10 seconds of iontophoresis
began to reach the quantification threshold after 30 seconds, and greatly contributed to the overall signal
by 2 minutes (Fig. 11A). Note that dye was present in the same circuit neurons for both genotypes, and
the broader pattern in dfmr1 nulls results from more neurons crossing the quantification threshold, rather
than new circuit partners.
Quantified comparisons show a significantly elevated rate of dye loading in dfmr1 mutants (Fig.
11B). After 10 seconds of injection, there was no significant difference (control: 18.0x10⁴±3.4x10⁴, n=10;
dfmr150M: 20.9x10⁴± 2.3x10⁴, n=10; p=0.48), but by 30 seconds a small but significant elevation was
apparent in the mutants (control: 29.1x10⁴±5.0x10⁴, n=10; dfmr150M: 44.0x10⁴±3.9x10⁴, n=10; p=0.03).
After a full minute, a 2.5-fold increase was present in dfmr1 nulls (control: 27.0x10⁴±5.4x10⁴, n=10;
dfmr150M: 68.3x10⁴±7.5x10⁴, n=9; p=4.7x10⁻⁴), which grew to more than a 4-fold increase by 2 minutes of
injection (control: 24.6x10⁴±3.5x10⁴, n=10; dfmr150M: 101.4x10⁴±10.1x10⁴, n=10; p=1.6x10⁻⁵, two-tailed
unpaired t test; Fig. 11B). The result is a significant difference in the dye loading slope (p=0.003 unpaired
ANCOVA), with a nearly 25-fold increase in the dfmr1 nulls compared to the matched controls (Fig. 11B).
In contrast to NB dye, TRITC levels increased linearly at a comparable rate between the two genotypes
(Fig. 11A, insets), with no significant difference between the slopes (p=0.61, unpaired ANCOVA),

59
Figure 11. Dye Iontophoresis Rate is Highly Elevated in dfmr1 Null Mutant Neurons A, Representative NB dye injection (ddH2O) images of GFI for the w1118 genetic background (control, left) and dfmr150M null mutant (right) with progressively increasing periods of iontophoresis (10, 30, 60 and 120 seconds). The main images show NB dye loading, and insets show co-injected TRITC dye loading within the same neurons. All images display pixels above the threshold of 59. Scale bar: 20µm. B, Quantification of injected dye levels at each of the 4 time points for both genotypes, displayed as mean ± SEM. Control 10s n=10, control 30s n=10, control 1m n=10, control 2m n=10, dfmr1 10s n=10, dfmr1 30s n=10, dfmr1 1m n=9, dfmr1 2m n=10. Significance determined from two-tailed unpaired t test (points) and unpaired ANCOVA (slope): p*<0.05, p**<0.01, p***<0.001 and not significant (NS).
60
supporting our findings that FMRP loss does not affect TRITC dye loading (Fig. 5) Together, these results
show a highly selective FMRP-dependent dye iontophoresis rate defect, with dfmr1-null mutants losing a
temporal restriction on iontophoresis. We conclude the FXS model lacks a barrier to small charged dye
uptake, increasing dye loading in injected neurons and, consequently, signal throughout the electrically-
coupled circuit.
Discussion
We have discovered an unexpected new effect of FMRP loss in the Drosophila FXS model: dye
iontophoresis rates dramatically increase in neurons lacking FMRP, with the effect dependent on dye size
but not charge. The defect is gap junction independent, but also increases dye transfer to downstream
electrically-coupled neurons within the circuit. Evidence that genotype differences can affect neural dye
iontophoresis is totally unprecedented, to our knowledge, despite extensive dye injection studies over
many decades (Schofield, 2008; Lanciego and Wouterlood, 2011; Hanani, 2012). Both NB and LY dye
loading defects are striking, but the absence of loading differences for the larger TRITC dye complicates
the findings. Trans-dermal studies show electromigration primarily drives rapid electrophoretic ion
movement for small molecules, while the slower movement of larger molecules depends more on
electroosmosis (Marro et al., 2001; Kalia et al., 2004). Electroosmosis is an electric field dependent solvent
flow caused by bulk movement of ions that accumulate along solid-liquid interfaces (Pikal, 2001). Here,
this would result in ionic flux along the electrode sides, carrying a slow flow of solvent and larger dye
molecules into the neuron. This effect may explain why larger TRITC responds differently than smaller NB
and LY dyes: the slow electroosmotic solvent flow remains unchanged in dfmr1 mutants, while the rapid
electromigration rate becomes significantly disrupted.
Several tests show FMRP loss specifically causes dye iontophoresis elevation. First, we replicated
the defect with a second dfmr1 null allele, ruling out non-specific recessive effects. Second, we rescued
61
the phenotype with wildtype FMRP targeted to neurons, showing neuronal FMRP restricts dye uptake.
Third, we showed the defect in shakB2 mutants in the Oregon-R background, not only ruling out gap
junction connectivity defects (discussed below), but also showing persistence across genetic backgrounds.
We found the defect is not NB-specific by repeating with negatively charged LY, eliminating NB-specific
explanations, such as biotinidase degradation (Mishra et al., 2010), and positive charge specific theories,
such as anionic precipitation. Gap junction coupling only allows passage of small molecules (<1kDa),
regardless of charge, and seemed the obvious explanation here (Weber et al., 2004). Increased electrical
synapses appeared a predicted consequence of well-reported FXS synaptic overgrowth and hyper-
connectivity (Comery et al., 1997; Irwin et al., 2001; Zhang et al., 2001; Doll and Broadie, 2015). Indeed,
recent work hints that FXS models have elevated gap junctions (Kong et al., 2014). However, we found
dfmr1 nulls show a trending gap junction reduction (ShakB levels), and complete gap junction loss (shakB2
null) does not correct the dfmr1 dye loading phenotype. Likewise, LY loading was primarily limited to the
GFI under our injection conditions, similar to shakB2 results, further confirming that dye movement to
coupled neurons is not required for differential dye loading. Note the dye loading differences between
dfmr1 and control were reduced in the shakB2 background, suggesting partial rescue. The assay’s shorter
injection times may explain the difference, but it is possible that elevated interneuron connectivity is a
separable neuronal property causing dfmr1 nulls to increase dye uptake.
In our experiments, the only manipulation that increased dye loading was removing K+ from the
injection electrode, although the dfmr1 phenotype persisted. The likely explanation is that dye no longer
competes with smaller, more mobile, K+ ions and thus constitutes more of the injection current; a shift
well-known in trans-dermal iontophoresis (Pikal, 2001). K+-free injection allows lower currents to deliver
more dye over shorter periods, an advantage employed in subsequent experiments. The dfmr1 dye
loading defect holds for dyes of both polarities, so it remained possible, although not parsimonious, that
FMRP loss disrupts multiple ion channel classes, altering anionic and cationic flow. We first tested K+

62
channel function, known to be disrupted in FXS models (Brager and Johnston, 2014; Contractor et al.,
2015). Importantly, application of K+ channel blocker 4-AP (Singh and Singh, 1999) reduces dye loading,
although the relative dfmr1 phenotype persisted. A relationship between K+ currents and iontophoretic
loading has not been previously reported, to our knowledge, but suggests that increased dfmr1 dye
loading could result from elevated K+ currents (Contractor et al., 2015). However, we could not
significantly increase dye loading by elevating conductance with Irk2 or Shaw K+ channels, or transgenic
channelrhodopsin. Of course, changes to endogenous K+ conductance in dfmr1 nulls may not be
sufficiently replicated with channel manipulations. However, persistence of the phenotype after removal
of the plasma membrane from the injection circuit supports the conclusion that ion channels are not the
primary cause of altered dfmr1 null dye loading.
Another possibility is that dfmr1 null neurons have a shifted iontophoretic current composition
that does not affect net current flow. The current composition is the percent of charge carried by each
ion group in the system. Each ionic contribution is determined by its charge, concentration, size and
surrounding environment, represented by the transference number (Sackin and Boulpaep, 1981). FMRP
loss could shift current composition, making it more difficult for neuronal ions to enter the electrode,
favoring instead dye ions entering the neuron. This could be accomplished either by changing the ratio of
ion groups in the cytoplasm or the cytoplasmic viscosity ions experience. The importance of ion ratios was
demonstrated when we removed the small K+ ion from the dye injection electrode and caused more dye
to enter neurons without changing the iontophoretic current. A related change could occur in dfmr1 null
neurons, with the mutant cytoplasm containing a higher ratio of large ions than controls, thus reducing
average cytoplasmic ion speed and favoring dye transfer into the neuron. An increase in large ion
concentration may be a consequence of the known disruptions to multiple ion channel classes in the FXS
model, altering neuronal resting ionic concentrations (Contractor et al., 2015). Testing such a hypothesis
may require more sophisticated channel manipulations. Alternatively, the increased protein
63
concentrations in dfmr1 nulls, confirmed in this work, could shift current composition to favor dye uptake
if their charged residues alter the ionic composition of the cytosol (Qin et al., 2005; Tessier and Broadie,
2008). A similar shift could come from byproducts of disrupted enzymatic metabolism in the FXS condition
(Lima-Cabello et al., 2016). Importantly, correcting protein levels via slowing the elevated translation rate
ameliorates many FXS symptoms (Bolduc et al., 2008; Osterweil et al., 2013), and could prove equally
efficacious for the increased dfmr1 null dye loading.
In timed iontophoresis experiments, control neurons approach dye equilibrium after just 10
seconds of injection, whereas dfmr1 null neurons exhibit constant dye accumulation over minutes. The
limitation on dye loading is not caused by leakage, as fluorescence intensity remains constant regardless
of time between dye injection and fixation. Dye loading was increased in all regions of dfmr1 null neurons,
including dendrites and axons, showing that differential dye compartmentalization or preferential
subcellular filling does not explain the defect. We also rule out neuronal dye capacity, as both dendrite
and axon sizes are unaltered. Moreover, any internal capacity differences would similarly affect the larger
TRITC dye, which loaded equally in both genotypes. Further, iontophoretic differences based on neuronal
capacity would not permit the increased dye loading caused by removing K+ from the injection electrode.
It is possible that increased cytoplasmic viscosity in dfmr1 nulls shifts the ratio of incoming to outgoing
ions by altering ionic flux (Kühn et al., 2011). This defect could arise from increased cytosolic concentration
of proteins resulting from the loss of FMRP translational repression (Qin et al., 2005; Tessier and Broadie,
2008), Such a disruption would have wide-ranging developmental and functional effects on neural circuits
in the FXS disease state.
In conclusion, we have uncovered a robust new consequence of FMRP loss in Drosophila FXS model
neurons. Quantitative dye iontophoresis reveals dfmr1 null neurons selectively lack an impediment to
small charged dye entry. The FMRP mechanism limits iontophoretic rate, strictly capping the maximum
dye transfer. The dfmr1 mutant defect is limited to small NB+1 and LY-1 dyes, with no effect on the larger
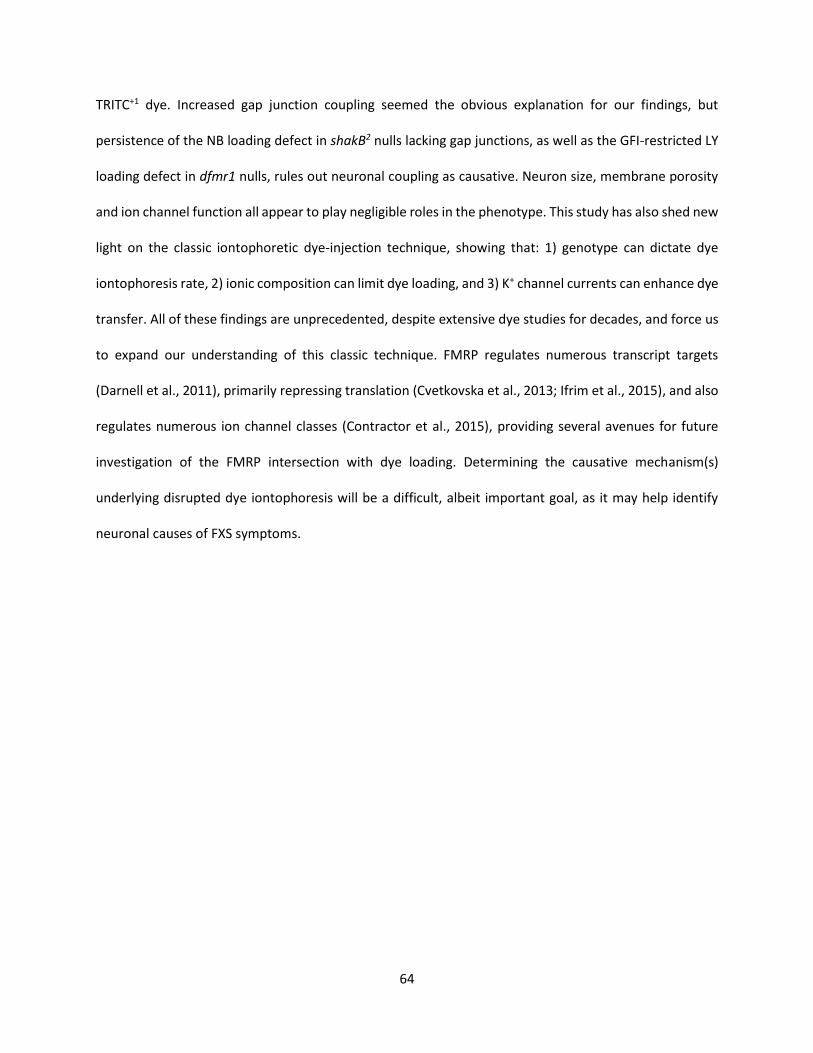
64
TRITC+1 dye. Increased gap junction coupling seemed the obvious explanation for our findings, but
persistence of the NB loading defect in shakB2 nulls lacking gap junctions, as well as the GFI-restricted LY
loading defect in dfmr1 nulls, rules out neuronal coupling as causative. Neuron size, membrane porosity
and ion channel function all appear to play negligible roles in the phenotype. This study has also shed new
light on the classic iontophoretic dye-injection technique, showing that: 1) genotype can dictate dye
iontophoresis rate, 2) ionic composition can limit dye loading, and 3) K+ channel currents can enhance dye
transfer. All of these findings are unprecedented, despite extensive dye studies for decades, and force us
to expand our understanding of this classic technique. FMRP regulates numerous transcript targets
(Darnell et al., 2011), primarily repressing translation (Cvetkovska et al., 2013; Ifrim et al., 2015), and also
regulates numerous ion channel classes (Contractor et al., 2015), providing several avenues for future
investigation of the FMRP intersection with dye loading. Determining the causative mechanism(s)
underlying disrupted dye iontophoresis will be a difficult, albeit important goal, as it may help identify
neuronal causes of FXS symptoms.

65
Chapter III
Newly Identified Electrically Coupled Neurons Support Development of the Drosophila Giant Fiber
Model Circuit
This paper has been published under the same title in eNeuro, 2018.
Nine movies were included as part of this work which can be found at
http://www.eneuro.org/content/early/2018/11/22/ENEURO.0346-18.2018
Tyler Kennedy1 and Kendal Broadie1,2,3
1Department of Biological Sciences, 2Department of Cell and Developmental Biology, 3Vanderbilt Brain
Institute, Vanderbilt University and Medical Center,
Nashville, TN 37235 USA
Abstract
The Drosophila Giant Fiber (GF) escape circuit is an extensively studied model for neuron connectivity and
function. Researchers have long taken advantage of the simple linear neuronal pathway, which begins at
peripheral sensory modalities, travels through the central GF Interneuron (GFI) to motor neurons, and
terminates on wing/leg muscles. This circuit is more complex than it seems however, as there exists a
complex web of coupled neurons connected to the GFI, which widely innervate the thoracic ganglion.
Here, we define four new neuron clusters dye-coupled to the central GFI, which we name GF Coupled
(GFC) 1-4. We identify new transgenic Gal4 drivers that express specifically in these neurons, and map
both neuronal architecture and synaptic polarity. GFC1-4 share a central site of GFI connectivity, the
Inframedial Bridge (IB), where the neurons each form electrical synapses. Targeted apoptotic ablation of

66
GFC1 reveals a key role for proper development of the GF circuit, including the maintenance of GFI
connectivity with upstream and downstream synaptic partners. GFC1 ablation frequently results in loss of
one GFI, which is always compensated for by contralateral innervation from a branch of the persisting GFI
axon. Overall, this work reveals extensively coupled interconnectivity within the GF circuit, and the
requirement of coupled neurons for circuit development. Identification of this large population of
electrically-coupled neurons in this classic model, and the ability to genetically manipulate these
electrically synapsed neurons, expands the GF system capabilities for the nuanced, sophisticated circuit
dissection necessary for deeper investigations into brain formation.
Significance Statement
Genetic model neural circuits with individually identifiable neurons help us understand how nervous
systems wire together during development, and then operate through coordinated chemical and
electrical signaling. The Drosophila Giant Fiber circuit has long served as such a model, due to large neuron
size, genetic malleability and easily visualized behavioral output: a jump in response to a threat. This study
unveils new members of this circuit, all of which synapse with the circuit at one site on the central Giant
Fiber Interneuron. We use new tools to identify and transgenically manipulate these neurons and show
that these neurons are required for proper circuit development. This study provides a detailed circuit map
for further dissection of neuronal connectivity and electrically-coupled communication.
Introduction
The Drosophila Giant Fiber (GF) circuit is particularly suitable for single-neuron resolution
neurodevelopmental studies for a number of reasons, all related to its role as an escape response circuit
(Allen et al., 2006; Boerner and Godenschwege, 2011). The need for rapid signal conduction from the
senses through brain to muscles promoted evolution of very large neurons throughout this circuit,

67
facilitating their visualization and manipulation (Power, 1948; Borgen et al., 2017). This enlargement is
most prominent in the long-distance Giant Fiber Interneuron (GFI), which consolidates sensory
information in the brain and projects through the neck into the thoracic ganglion (TG) via giant axons
(Allen et al., 1998; Pézier et al., 2014). To increase communication speed and fidelity between neurons,
the GF circuitry uses mixed chemical and electrical synapses (Thomas and Wyman, 1984; Blagburn et al.,
1999; Fayyazuddin et al., 2006). These electrical synapses, composed of the Shaking-B innexin, can pass
small tracer dyes to identify coupled partner neurons (Phelan et al., 1996).
The GF circuit targets two large muscle sets used for rapid escape behavior, the Tergotrochanteral
Muscle (TTM), which controls the legs for jumping, and the Dorsal Longitudinal Muscle (DLM), which
controls the wings (Tanouye and Wyman, 1980). The escape behavior is easily scored and muscles are
accessible to electrophysiological recordings, providing two outlets to study whole circuit function
(Martinez et al., 2007; Augustin et al., 2011; von Reyn et al., 2014). The GFI connects to the TTM via the
Tergotrochanteral Motor neuron (TTMn) and to the DLM via the Peripherally Synapsing Interneuron (PSI),
which in turn synapses onto the Dorsal Longitudinal Motor neuron (DLMn; Tanouye and Wyman, 1980;
Allen et al., 2006). While the GF circuit is reported to be quite simple, electrophoretic injections with small
dyes make it clear that the GFI is actually part of a much larger circuit network of undescribed neurons
(Boerner and Godenschwege, 2011; Enneking et al., 2013; Kennedy and Broadie, 2017).
This larger GF circuit should come as no surprise, as most classically studied circuits are
continuously being updated to include new neurons, increasing appreciation of the complexity and
interconnectivity within the brain (Lin et al., 2016; Talay et al., 2017; Zheng et al., 2017; Cande et al., 2018).
Describing the wiring diagrams of classic circuits within model brains is important for understanding how
local circuits accomplish processing tasks, while also overriding or promoting behaviors controlled by
separated but interconnected circuits (Gaudry and Kristan, 2009; Stensmyr et al., 2012; von Reyn et al.,
2014). More complex model circuits can better help answer questions about how circuits develop and

68
evolve over time (Ward et al., 2015; Tosches, 2017). Combining GF circuit manipulability with the full
complement of GFI-coupled neurons should enable robust new avenues for experimentation on how
neurons select partners, determine synaptic strength and regulate neighboring circuits.
In this study, we use neurobiotin dye injection to map previously uncharacterized GF Coupled
(GFC) neurons. We take advantage of the Flylight Gal4 library collection to identify transgenic drivers for
the GFCs (Brand and Perrimon, 1993; Jenett et al., 2012). This approach defined four new GFI-coupled
neuron clusters (GFC1-4) within the GF circuit, which we characterize for their architecture, neuronal
polarity and synaptic connectivity. We show that the Inframedial Bridge (IB; Allen et al., 1998) is the GFI
site where all the GFC neurons come together to synapse with the circuit. We ablate GF neurons by
transgenic expression of the apoptotic Head Involution Defective (Hid) protein (Zhou et al., 1997) to find
that GFC1 and PSI are required for proper GFI development. We also find GFI axons always compensate
for loss of their bilaterally symmetric partner through new contralateral innervation. Together, this work
broadens the known GF circuit and opens new avenues for studying electrically-coupled circuit
development, function and plasticity.
Materials and Methods
Drosophila Genetics
All animals were maintained on a standard cornmeal/agar/molasses Drosophila food in a 12-hour
light:dark cycling incubator at 25oC. Timed-lay eggs were collected for 2-3 days, and experimental animals
were selected from rearing tubes 10-14 days later. The following Drosophila lines were used for genetic
crosses: w1118 (RRID:BDSC_3605) | w1118; PGMR78A06-Gal4attP2 (Jenett et al., 2012) | w1118;
PGMR73C07-Gal4attP2 (RRID:BDSC_46689) | w1118; PGMR24H07-Gal4attP2 (RRID:BDSC_49317) |
w1118; PGMR42A06-Gal4attP2 (RRID:BDSC_41245) | w1118; R10B11-p65.ADattP40 (Dionne et al., 2018;

69
RRID:BDSC_68807) | w1118; PGMR14A06-Gal4.DBDattP2 (RRID:BDSC_68738) | w1118, y1; 10X UAS-ivs-
mcd8::gfp attP40 (Pfeiffer et al., 2010) | UAS-hid.Z/CyO (Zhou et al., 1997; RRID:BDSC_65403) | w1118;
UAS-denmark, UAS-syt::gfp (Zhang et al., 2002; Nicolai et al., 2010; RRID:BDSC_33064). Both females and
males were used in this study, with sex-specific selection stated in figure legends. All genotypes were
verified with visible markers.
Dye Iontophoresis
GFI dye injections were performed similar to the previously published methods (Boerner and
Godenschwege, 2011; Kennedy and Broadie, 2017). Briefly; glass electrodes (Kwik-Fil Borosilicate glass
1B100F-4, World Precision Instruments) were pulled on a laser electrode puller (Model P-2000, Sutter
Instrument Company) to 10MΩ resistance (3M KCl). Electrodes were filled with 0.25% TRITC-Dextran
(10kDa, Life Technologies) and 7% neurobiotin (Vector Laboratories, RRID:AB_2313575) in ddH2O. Filled
electrodes were placed on a silver-chloride wire mounted on a PCS-5000 micromanipulator (Burleigh).
Animals in physiological saline were cut along the dorsal midline to access the cervical connective (CC), at
which electrodes were inserted into the GFI. A square-pulse stimulator (Grass S48, Astro-Med) provided
7.5 100ms pulses/second for 2 mins with the 20nA injected current monitored by an AxoClamp2B
amplifier. A Digidata data acquisition system (1320A, Axon Instruments) was controlled with Clampex 9.2
software.
Confocal Imaging
Brains were fixed for 30 mins in 4% paraformaldehyde/sucrose (Electron Microscopy Services) in
phosphate-buffered saline (PBS, pH 7.2, Life Technology) and then rinsed 3X with PBS, and blocked for 1
hr with 1% bovine serum albumin (BSA, Sigma-Aldrich) in PBST (PBS + 0.2% Triton X-100; Thermo Fisher
Scientific). Labels were diluted in PBST with 0.2% BSA. The following labels were used: Streptavidin::Cy5

70
(1:20, Life Technology), rabbit anti-ShakB (1:250, Phelan et al., 1996), rabbit anti-GFP (1:2000; Abcam,
RRID:AB_303395), FITC Goat anti-GFP (1:500; Abcam, RRID:AB_305635), Rabbit anti-RFP (1:500; Rockland,
RRID:AB_2209751), Alexa 488-conjugated donkey anti-goat (1:250; Thermo Fisher, RRID:AB_2534102),
Alexa 488-conjugated donkey anti-rabbit (1:250; Thermo Fisher, RRID:AB_2556546), Alexa-568
conjugated donkey anti-rabbit (1:250; Thermo Fisher, RRID:AB_2534017), Alexa-647 conjugated donkey
anti-rabbit (1:250; Thermo Fisher, RRID:AB_2536183), and Alexa-633 conjugated goat anti-rabbit (1:250;
Thermo Fisher, RRID:AB_141419). Next, preparations were rinsed 3X for 30 mins in PBST, 1X in PBS, and
then mounted on glass microscope slides (Probe On Plus 25 x 75 x 1.0mm, Thermo Fisher Scientific) in 2,
2’-Thiodiethanol (TDE, Sigma-Aldrich; Staudt et al., 2007). To prevent crushing, double-sided poster tape
(Scotch) was placed on each side of the brains. Coverslips (No. 1.5H, Zeiss) were sealed with nail polish
(Hard as Nails, Sally Hansen). Fluorescent images were collected using a ZEISS LSM 880 confocal
microscope with an AiryScan module, which has increased lateral resolution (161nm) and signal-to-noise
ratio (Sivaguru et al., 2016). Images show maximum Z-stack projections under standard confocal mode,
unless otherwise noted in the figure legends.
Data Analyses
Data processing and image creation was done with FIJI software (version 2, RRID:SCR_002285;
Schindelin et al., 2012; Schneider et al., 2012). Neuronal models and movies were created using Imaris
(version 9.2, RRID:SCR_007370).

71
Results
The Giant Fiber Circuit Exhibits Extensive Dye-Coupled Connectivity
Small, gap junction permeable dyes used to study the Giant Fiber (GF) circuit have consistently
revealed an extensive, but uncharacterized, network of dye-coupled neurons (Boerner and
Godenschwege, 2011; Enneking et al., 2013; Kennedy and Broadie, 2017). In order to thoroughly study
the architecture and properties of these neurons, we iontophoretically injected the Giant Fiber
Interneuron (GFI) with the highly gap-junction permeable neurobiotin (NB) dye, and then labeled the
brains post-hoc with a streptavidin-conjugated fluorophore (Huang et al., 1992). Consistent with
previously published work, this intracellular dye injection reveals an extensive network of neurons dye-
coupled to the GFI (Fig. 12). This dye-coupling is the direct result of gap junction connectivity, as
eliminating gap junctions using shaking-B mutants (shakB2) prevents all NB dye transfer (data not shown;
Blagburn et al., 1999; Kennedy and Broadie, 2017). A summary of this newly identified GF circuitry is
shown in Figure 12.
Although there are a large number of dye-labeled processes widely distributed throughout the
thoracic ganglion (TG; Fig. 12A), all published GF circuit maps name only two GFI-coupled cells: 1)
Tergotrochanteral Motor neuron (TTMn) and 2) Peripherally Synapsing Interneuron (PSI; Fig. 12B, ‘old
circuit map’). Here, we map and characterize all of the dye-coupled neurons whose projections we can
trace back to an identifiable cell soma. We have named these neurons “Giant Fiber Coupled” (GFC)
followed by an identifying number (Fig. 12A, B). In this study, we report the characterization of 4 neuron
clusters (GFC1-4), each of which represents a bilaterally-symmetric set of 2-7 neurons (Fig. 12B, ‘new
circuit map’). The processes of these neurons contact the descending GFI axons and reach into all three
TG segments (TG1-3), but do not cross into the brain or abdominal ganglion (AG). To understand how the
GFCs integrate into the GF circuit, we began by obtaining selective genetic access to these neurons.
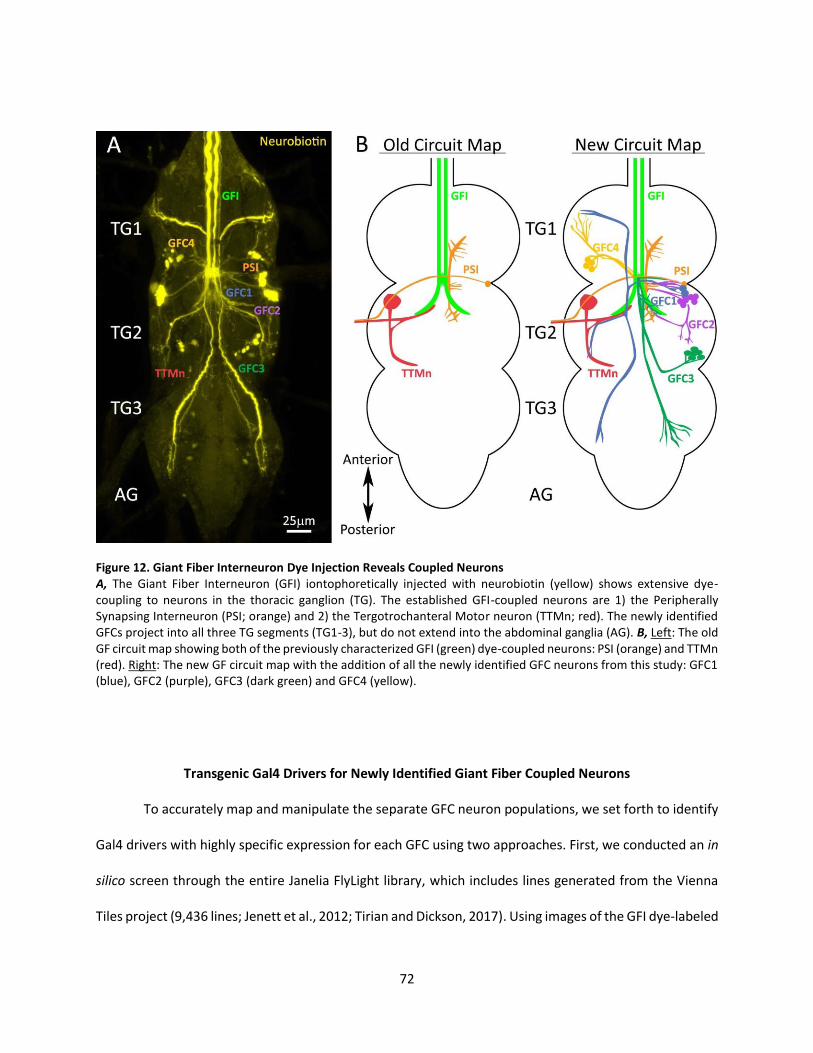
72
Transgenic Gal4 Drivers for Newly Identified Giant Fiber Coupled Neurons
To accurately map and manipulate the separate GFC neuron populations, we set forth to identify
Gal4 drivers with highly specific expression for each GFC using two approaches. First, we conducted an in
silico screen through the entire Janelia FlyLight library, which includes lines generated from the Vienna
Tiles project (9,436 lines; Jenett et al., 2012; Tirian and Dickson, 2017). Using images of the GFI dye-labeled
Figure 12. Giant Fiber Interneuron Dye Injection Reveals Coupled Neurons A, The Giant Fiber Interneuron (GFI) iontophoretically injected with neurobiotin (yellow) shows extensive dye-coupling to neurons in the thoracic ganglion (TG). The established GFI-coupled neurons are 1) the Peripherally Synapsing Interneuron (PSI; orange) and 2) the Tergotrochanteral Motor neuron (TTMn; red). The newly identified GFCs project into all three TG segments (TG1-3), but do not extend into the abdominal ganglia (AG). B, Left: The old GF circuit map showing both of the previously characterized GFI (green) dye-coupled neurons: PSI (orange) and TTMn (red). Right: The new GF circuit map with the addition of all the newly identified GFC neurons from this study: GFC1 (blue), GFC2 (purple), GFC3 (dark green) and GFC4 (yellow).
73
circuit (Fig. 12A), we screened for matching GFP expression patterns (Fig. 13). We identified highly specific
Gal4 drivers for GFC1 (78A06; Fig. 13A) and GFC2 (73C07; Fig. 13B), as well as less specific drivers for GFC3
and GFC4. Second, for cleaner GFC3 and GFC4 drivers, we used the recent automated Color-depth
Maximum Intensity Projection (MIP) tool for the Drosophila transgenic database (Otsuna et al., 2018).
Using the less specific driver lines as templates to search this library, we screened for specific Gal4 drivers
for GFC3 and GFC4. This complementary approach uncovered a highly specific driver for GFC3 (24H07;
Fig. 13C), and a combined driver for GFC3/4 (42A06; Fig. 13D). During our search with the MIP tool, we
identified many additional GF circuit drivers, aside from the ones used in this study. We selected the
cleanest drivers and report them in Table 3 for use in future experiments.
To confirm that the new Gal4 transgenic driver lines label the bona fide GFC components of the
GF circuit, we crossed each Gal4 line with the UAS-mcd8::gfp membrane reporter (Fig. 13, column 1) and
injected the GFI with NB (Fig. 13, column 2). The merged images show perfect overlap between each
transgenic driver line and the specified subset of the dye labeled neurons (Fig. 13, column 3). Cell bodies
are strongly labeled in all cases (arrowheads), and individual neuronal processes of GFC1-4 can be traced
for both the GFP and NB signals (arrows). However, in some cases, such as GFC2 (73C07-Gal4), the dye
injection signal is much dimmer than for other neurons, such as GFC1 (78A06-Gal4). Each GFC cluster is
schematically represented within the TG, with full color on one side (Fig. 12 color scheme) and dashed
GFI GCI TTMn PSI GFC1 GFC2 GFC3
R14A01 R32C04 R25D08 R26E04 R93E07 R13C08 R44D02
VT004455 R74E09 R88F07 R75E05 R87D02 R77C12 R58E04
VT042336 VT002209 VT038335 VT030598 VT059438 VT043662 R75D03 Table 3. Transgenic Gal4 Driver Lines for the Giant Fiber Circuit New Gal4 drivers (distinct from those used in this study) that express selectively within the GF circuit, as compiled from the Janelia Flylight and Vienna Tiles library collections. Selective lines for GFC4 have not been uncovered and thus are not reported here. Abbreviations: GFI: Giant Fiber Interneuron, GCI: Giant Commissural Interneuron, TTMn: Tergotrochanteral Motor neuron, PSI: Peripherally Synapsing Interneuron, GFC: Giant Fiber Coupled neurons.

74
Figure 13. Transgenic Gal4 Drivers for the Newly Identified GFC Neurons Gal4-driven expression of UAS-mcd8::gfp (green, column 1) overlapping with the GFI injection of neurobiotin dye (yellow, column 2) showing the identification of GFC drivers (merge, column 3). Arrows indicate processes with overlapping GFP and NB labeling, and arrowheads show the GFC cell bodies. The GFC neurons are drawn both in color (Fig. 12 color scheme) and perforated outlines to show their bilateral pattern (column 4). Thoracic ganglia (TG) segments are selected to best show GFC projection architecture. All injections were performed on females. A, 78A06-Gal4 labels GFC1. The driver strength is relatively weak, with a somewhat stochastic labeling of the GFC1 neurons. B, 73C07-Gal4 labels GFC2. This driver is moderately strong, but also labels other neurons. C, 24H07-Gal4 labels GFC3. This driver strength is moderate, with labeling of other neurons. D, 42A06-Gal4 labels both GFC3 and GFC4 neurons. The driver is relatively weak, with stochastic labeling of GFC4 neurons.

75
outlines on the other side, to show each individual GFC neuron as well as their bilaterally symmetrical
pattern (Fig. 13, column 4). Using these Gal4-driven GFP expression patterns, we are able to map each
GFC cluster within the TG.
Projection Architecture of GFC Neurons Within the Thoracic Ganglion
GFC1 is comprised of 2 bilaterally symmetrical neurons on each side of TG2 (Fig. 13A). Each soma
projects a process medially, which crosses the midline at the Inframedial Bridge (IB; Allen et al., 1998) and
then splits, sending one branch anteriorly and one posteriorly. The anterior process travels halfway up
TG1, then bends laterally and ventrally to terminate in the anterior corner of TG1, almost at the ventral-
most point of the TG (Fig. 13A). This process extends several thin terminals, beginning in the same plane
as the GFI bend. The posterior process splits halfway down TG2, just below the GFI bend. One branch
proceeds laterally, then turns posteriorly towards the TG2 edge, with a ventral dive and several thin
terminals, before terminating in the TG2 posterior lateral corner (Fig. 13A). The other process descends
into TG3, bends inward towards the midline, then laterally to the anterior edge. From here, the process
projects posteriorly and ventrally to end in a similar fashion to the other two terminals (Fig. 13A). All three
GFC1 projections appear to innervate the leg neuropils (Namiki et al., 2018).
The 7 bilaterally symmetric GFC2 neurons are largely restricted to TG2 (Fig. 13B). These cell bodies
neighbor GFC1 and similarly project fasciculating processes medially. However, two-thirds of the way to
the midline, the processes bend posteriorly and then laterally, to curve ventrally towards the lower edge
of TG2 in the region of the GFI axon bend (Fig. 13B). The processes then curve anteriorly back towards the
cell bodies, with a slight dorsal trajectory before termination, projecting several short, heavily-branched
termini in anterior and posterior directions. Another process doubles back towards the posterior
deflection, travels medially to the midline and then sends out two branches posteriorly (Fig. 13B). One
curves ventrolaterally to terminate along the first ventral spiral, and the other travels dorsolaterally along
76
the path of the original anterior process, terminating as it turns up towards the soma. There are two other
processes that depart from the midline: one travels dorsally and slightly posteriorly before terminating,
and one projects anteriorly and dorsolaterally to terminate in the lower central TG1 (Fig. 13B). These
processes both appear to innervate the wing neuropils (Namiki et al., 2018).
GFC3 is comprised of 5 bilaterally symmetrical neurons with the cell bodies positioned dorsally in
the posteriolateral corner of TG2 (Fig. 13C). These cells send out fasciculating processes that first proceed
ventrally in a medial-anterior direction up to the central IB connection with the GFI. At the IB, extensive
GFC3 branches are visible, extending laterally and dorsally, but no further in either anterior or ventral
directions (Fig. 13C). These processes also track along the large terminal bend of the GFI axon. Dorsal to
the IB, the main GFC3 processes reverse course to travel posteriolaterally, while remaining ipsilateral to
their cell bodies. The projection direction is ventral until TG3 is reached, at which point the processes
move dorsally once again (Fig. 13C). These processes terminate near the anterior portion of TG3 within
the leg neuropil, in a series of thin processes at approximately the same axial plane as the IB and GFI
axonal bends (Fig. 13C). Of note, both GFC1 and GFC3 were unintentionally captured in a recent screen
for descending neurons (Namiki et al., 2018).
The 4 bilaterally symmetric GFC4 neurons are largely restricted to TG1 (Fig. 13D). The GFC4 cell
bodies lie in the TG1 dorsal lateroposterior corner. The GFC4 processes first fasciculate to project
ventrally, then posterior-medially, running to the central IB (Fig. 13D). From the IB, the GFC4 processes
then reverse course, remaining ipsilateral to their cell bodies as they project dorsally, back the way they
came towards their cell bodies (Fig. 13D). When the GFC4 processes are directly below their cell bodies,
they turn ventrally, and then travel towards the TG1 anteriolateral corner to terminate in long finger-like
projects (Fig. 13D). Like the other GFCs, the GFC4 processes appear to innervate the leg neuropils (Namiki
et al., 2018). Overall, these transgenic driver lines allow detailed analysis of GFC architecture, and provide
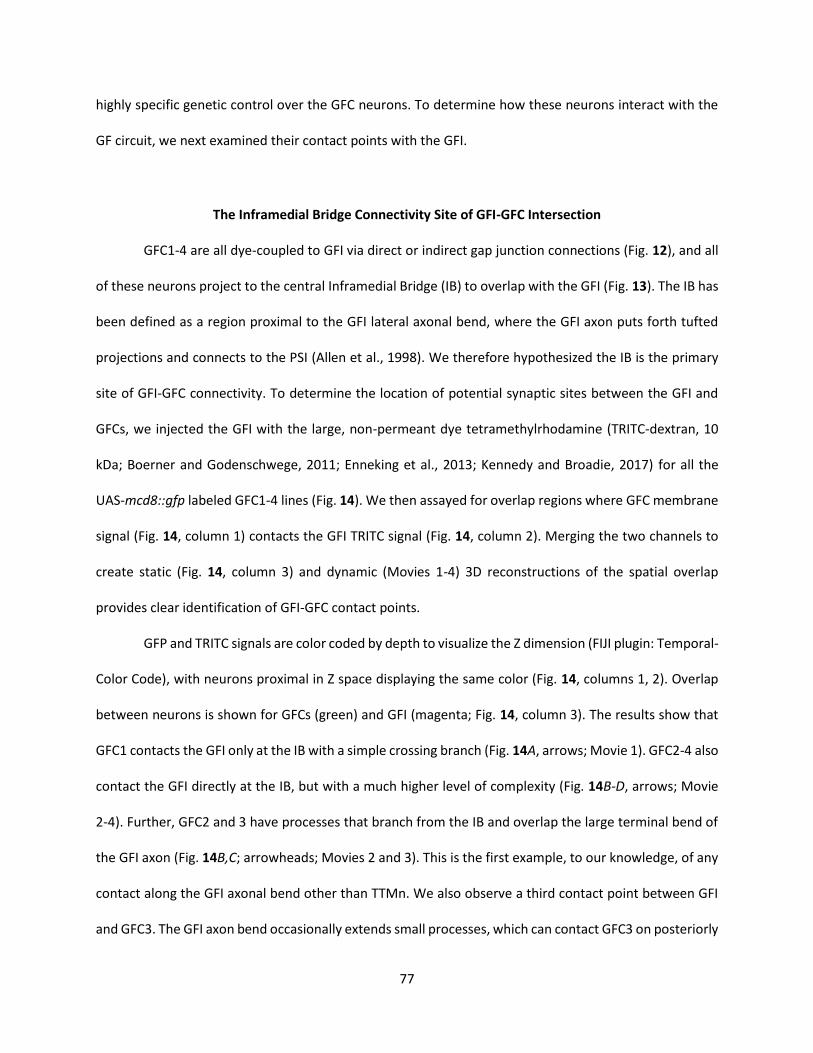
77
highly specific genetic control over the GFC neurons. To determine how these neurons interact with the
GF circuit, we next examined their contact points with the GFI.
The Inframedial Bridge Connectivity Site of GFI-GFC Intersection
GFC1-4 are all dye-coupled to GFI via direct or indirect gap junction connections (Fig. 12), and all
of these neurons project to the central Inframedial Bridge (IB) to overlap with the GFI (Fig. 13). The IB has
been defined as a region proximal to the GFI lateral axonal bend, where the GFI axon puts forth tufted
projections and connects to the PSI (Allen et al., 1998). We therefore hypothesized the IB is the primary
site of GFI-GFC connectivity. To determine the location of potential synaptic sites between the GFI and
GFCs, we injected the GFI with the large, non-permeant dye tetramethylrhodamine (TRITC-dextran, 10
kDa; Boerner and Godenschwege, 2011; Enneking et al., 2013; Kennedy and Broadie, 2017) for all the
UAS-mcd8::gfp labeled GFC1-4 lines (Fig. 14). We then assayed for overlap regions where GFC membrane
signal (Fig. 14, column 1) contacts the GFI TRITC signal (Fig. 14, column 2). Merging the two channels to
create static (Fig. 14, column 3) and dynamic (Movies 1-4) 3D reconstructions of the spatial overlap
provides clear identification of GFI-GFC contact points.
GFP and TRITC signals are color coded by depth to visualize the Z dimension (FIJI plugin: Temporal-
Color Code), with neurons proximal in Z space displaying the same color (Fig. 14, columns 1, 2). Overlap
between neurons is shown for GFCs (green) and GFI (magenta; Fig. 14, column 3). The results show that
GFC1 contacts the GFI only at the IB with a simple crossing branch (Fig. 14A, arrows; Movie 1). GFC2-4 also
contact the GFI directly at the IB, but with a much higher level of complexity (Fig. 14B-D, arrows; Movie
2-4). Further, GFC2 and 3 have processes that branch from the IB and overlap the large terminal bend of
the GFI axon (Fig. 14B,C; arrowheads; Movies 2 and 3). This is the first example, to our knowledge, of any
contact along the GFI axonal bend other than TTMn. We also observe a third contact point between GFI
and GFC3. The GFI axon bend occasionally extends small processes, which can contact GFC3 on posteriorly

78
descending processes (Fig. 14C, arrowhead; magnified in inset). As these overlaps are likely sites for gap
junction connectivity within the circuit, we investigated these membrane contacts for electrical synapses.
Shaking-B Gap Junction Synapses Between GFI and GFC Neurons
The GF circuit is characterized by mixed chemical and electrical synapses (Blagburn et al., 1999;
Allen et al., 2006). To map GFI-GFC electrical synapses, we labeled for the Shaking-B (ShakB) innexin, using
an antibody recognizing the “N+16” isoform present at GFI synapses (Phelan et al., 2008). Flies in which
GFC1-4 neurons are labeled with UAS-mcd8::gfp (Fig. 15, column 1, green) were GFI-injected with TRITC
(column 2, magenta) and co-labeled with ShakB antibody (column 3, cyan). All three channels were
modeled with 3D rendering software to visualize ShakB-positive GFI-GFC contacts (Fig. 15, column 4;
Movies 5-9). GFC1 (78A06-Gal4) exhibits a simple arborization, with a process coming across the IB, and
making a characteristic anterior-posterior split (Fig. 15A; Movie 5). ShakB is clearly visible in the 3D
models, localized between the GFI and GFC1 as the process exits the IB (arrows and inset). GFC1 projects
axons to all three TG segments, indicating that there is a set of outputs triggered by the GFI escape
response in parallel to TTM and DLM activation.
GFC2 neurons have a larger process field, forming a hemi-circle in front of the GFI (Fig. 15B; Movie
6). Multiple ShakB electrical synapses clearly occur between the GFI and GFC2, although due to the
complexity of these connections, it is not possible to determine if the GFI is contacting the GFC2 processes
that come from the contra- or ipsilateral sides of the TG, or both (Fig. 15B). GFC2 also contacts the GFI
along the distal axonal bend (Fig. 14B), so we also investigated these sites for ShakB co-localization. The
results show contact between the GFI and GFC2 near the tip of the bend, however ShakB punctae are
rarely seen co-localizing at these contacts (Fig. 15C; Movie 7), suggesting these are primarily chemical
synapse connections. GFC3 has the most extensive IB contacts among all the GFCs, as well as broad
interactions with surrounding neurons (Fig. 15D; Movie 8). GFC3 contacts the GFI with ShakB electrical
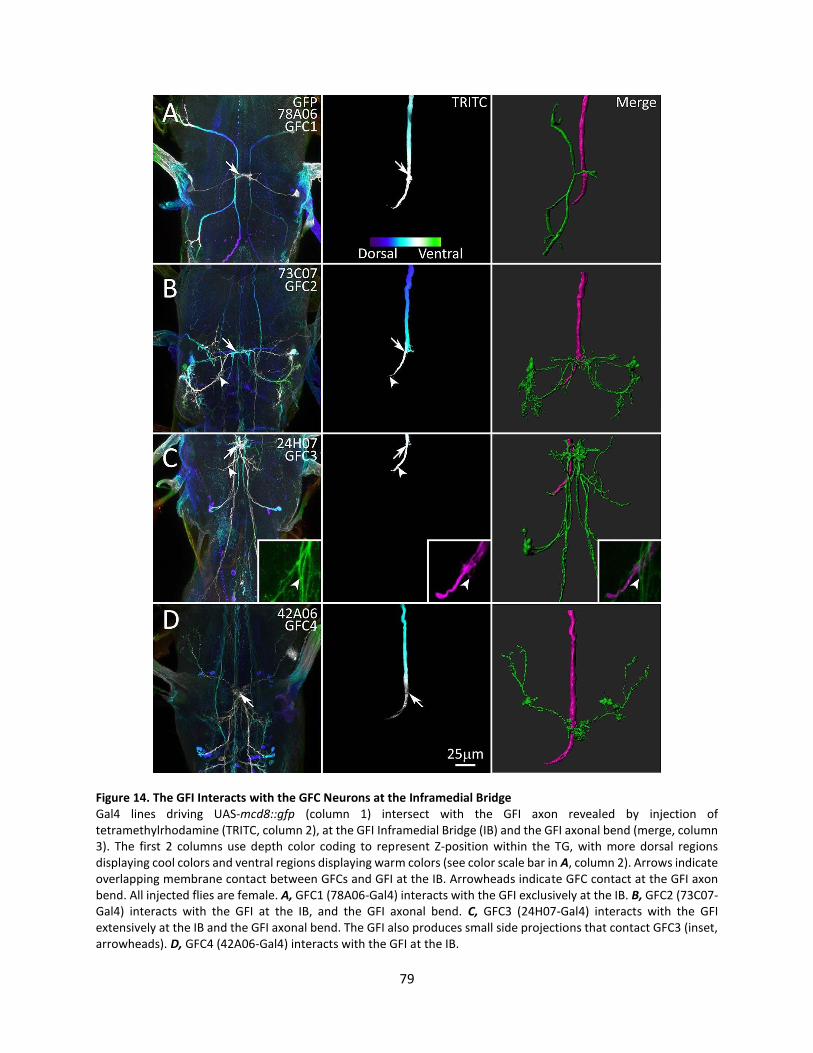
79
Figure 14. The GFI Interacts with the GFC Neurons at the Inframedial Bridge Gal4 lines driving UAS-mcd8::gfp (column 1) intersect with the GFI axon revealed by injection of tetramethylrhodamine (TRITC, column 2), at the GFI Inframedial Bridge (IB) and the GFI axonal bend (merge, column 3). The first 2 columns use depth color coding to represent Z-position within the TG, with more dorsal regions displaying cool colors and ventral regions displaying warm colors (see color scale bar in A, column 2). Arrows indicate overlapping membrane contact between GFCs and GFI at the IB. Arrowheads indicate GFC contact at the GFI axon bend. All injected flies are female. A, GFC1 (78A06-Gal4) interacts with the GFI exclusively at the IB. B, GFC2 (73C07-Gal4) interacts with the GFI at the IB, and the GFI axonal bend. C, GFC3 (24H07-Gal4) interacts with the GFI extensively at the IB and the GFI axonal bend. The GFI also produces small side projections that contact GFC3 (inset, arrowheads). D, GFC4 (42A06-Gal4) interacts with the GFI at the IB.
80
synapses (arrows), but GFC3 branches extending beyond the IB are mostly ShakB negative (Fig. 15D),
indicating few electrical synapses. GFC3 contacts the GFI axon bend even more extensively than GFC2, but
similarly has a small number of ShakB electrical synapse contacts (Fig. 15E; Movie 9). All images of GFI-
GFC3 IB contact sites exhibit ShakB-positive electrical synapses, but only one image of the GFI-GFC3 axonal
bend shows a synaptic connection (Fig. 15E, arrow). GFI axon bends are presynaptic to the TTMn, with
extensive ShakB electrical synapses (Phelan et al., 2008), but it appears only a small portion of this gap
junction connectivity is used for GFC2 and 3, with the primary GFI-GFC electrical connections in the IB (Fig.
15B,D). Without a GFC4-specific driver, we are unable to specifically test GFI-GFC4 ShakB synaptic
connections. To determine the direction of information flow across GFI-GFC synapses, as well as
connectivity in other regions of the TG, we next mapped the pre- and postsynaptic neuronal polarity of
GFC1-4 synapses.
Pre- and Postsynaptic Polarity of Thoracic Ganglion GFC Neurons
To investigate GFC postsynaptic domains, we used the UAS-denmark dendrite reporter,
composed of the exogenous mouse ICAM5 dendritic protein fused to RFP (Nicolai et al., 2010). For
presynaptic labeling, we used the UAS-synaptotagmin::gfp (Syt::GFP) reporter, composed of the
Synaptotagmin1 (Syt1) integral synaptic vesicle protein fused to GFP (Zhang et al., 2002). In GFC1, the
DenMark signal is absent from the finger-like projections at the process termini (Fig. 16A, column 1), and
Syt::GFP is strongly present in a punctate array, indicating these processes are presynaptic sites (Fig. 16A,
column 2). In contrast, DenMark strongly labels GFC1 within the IB (arrow), indicating this site is
postsynaptic to the GFI (Fig. 16A, image column 3, top). The Syt::GFP signal is absent (Fig. 16A, image
column 3, bottom), suggesting the IB site is solely for input. Together, these data indicate GFC1 neurons
receive presynaptic input onto their dendrites at the IB and then project their contralateral axons for
synaptic output into the leg neuropil (Namiki et al., 2018).

81
Figure 15. GFCs Form Electrical Synapses with the GFI at the Inframedial Bridge Electrical synapses between GFI and GFC neurons are shown in Gal4-driven UAS-mcd8::gfp animals (green, column 1) with TRITC dye injection into the GFI (magenta, column 2), while co-labeling with the Shaking-B antibody (cyan, column 3). Images were taken using the microscope’s AiryScan mode. The three merged channels (column 4) show the regions of shared ShakB contact between GFI-GFCs. Arrows indicate sites of the GFI-GFC ShakB synaptic contacts (magnified in insets). All injected flies are female. A, GFC1 (78A06-Gal4) makes ShakB electrical synapse contacts with the GFI at the IB. B, GFC2 (73C07-Gal4) forms several ShakB electrical synapse contacts with the GFI. C, GFC2 (73C07-Gal4) contacts the GFI along the axonal bend. D, GFC3 (24H07-Gal4) contacts the GFI with multiple ShakB electrical synapses. E, GFC3 (24H07-Gal4) minimally contacts the GFI along the axonal bend (arrow).
82
In contrast, GFC2 looped processes are strongly labeled by DenMark, including contacts at the GFI
axon bend (Fig. 16B, column 1), with strongly co-localizing Syt::GFP (column 2). Only the dorsolaterally
projecting processes in the wing neuropil display Syt::GFP without DenMark present. Similarly within the
IB, DenMark and Syt::GFP again co-localize, although DenMark is at a low level (Fig. 16B, image column
3). Thus, GFC2 neurons appear to have many co-localized pre- and postsynaptic domains. Note that it is
not possible to tell where in the loop GFC2 processes double back, and the pre- and postsynaptic
compartments may be in separate, adjacent processes (Fig. 16B). Based on our ShakB findings (Fig. 15B),
it is likely GFI and GFC2 directly synapse, but both appear presynaptic at the IB and they may also share
postsynaptic targets that mediate GFI-GFC2 coupling. Another possibility is that GFI-GFC2 dye transfer
does not occur at the IB, but instead they couple indirectly via an intermediary neuron. This could explain
why the GFC2 is relatively poorly labeled by NB dye injection into the GFI, compared to other GFCs.
GFC3 has pre- and postsynaptic domains similar to GFC1 (Fig. 16C). The GFC3 long finger-like
process projections in TG3 have very weak DenMark signal (column 1) and very clear Syt::GFP punctae
(column 2). Therefore, these sites are presumably presynaptic in leg neuropil (Namiki et al., 2018). At the
IB, GFC3 strongly expresses DenMark (Fig. 16C, image column 3), which is thus postsynaptic. However,
Denmark expression expands beyond the IB to include GFC3 branches that parallel the GFI axon bend and
descending processes (Fig. 16C, arrowheads). Syt:GFP is undetectable at all of these GFC3 sites, indicating
they are solely postsynaptic (Fig. 16C, image column 3). Surprisingly, DenMark/Syt::GFP expression is
lethal with the 42A06-Gal4 driver, and we were therefore unable to evaluate GFC4 pre- and postsynaptic
domains. Based on similarities to GFC3, we predict GFC4 has postsynaptic sites at the IB and presynaptic
sites in the TG1 leg neuropil. Overall, DenMark and Syt::GFP clearly distinguish pre- and postsynaptic
regions of all GFC neurons, except GFC2. As the GFCs are so intimately interconnected with the GFI, we
next tested if these coupled neurons play a role in GF circuit development or maintenance.

83
GFC Requirements for the Development of GF Circuit Architecture
We used Gal4-targeted expression of the Head Involution Defective (Hid) protein to drive
apoptosis in GFC neurons, in an attempt to eliminate each GFC and study the effects on the GF circuit
architecture (Zhou et al., 1997; Muthukumar et al., 2014). Unfortunately, all of the GFC drivers used above
(Fig. 13) are lethal in combination with UAS-hid. We repeated the study using split-Gal4 (spGal4) lines
10B11-AD ꓵ 14A06-DBD (Luan et al., 2006; Pfeiffer et al., 2010; Dionne et al., 2018) to eliminate the
apoptosis of off-target cells. These spGal4 lines were identified using the MIP search tool, and were
selected for their strong expression in GFC1 with minimal overlap in non-specific neurons. This spGal4
combination expresses strongly in GFC1, but also in PSI, as seen when crossed with UAS-mcd8::gfp (Fig.
17A, green) with injected TRITC (magenta) to label the GFI. In the brain (Fig. 17A, top), only TRITC dye is
present in the GFI, where the GFI cell bodies (arrow) and their dendrites (arrowheads) reside. Importantly,
no mCD8::GFP is present in the GFI (Fig. 17A, green). Similarly, the Giant Commissural Interneuron (GCI),
which interconnects the GFIs, displays no mCD8::GFP. In the TG, GFC1 (arrow) and PSI (arrowhead)
express mCD8::GFP (Fig. 17A, bottom).
NB dye injection into GFI in a UAS-hid/+ control animal shows both GFIs labeled in the brain (Fig.
17B, arrows). The GCI (arrowheads) interconnecting the GFI cell bodies (Allen et al., 1998) is also dye
labeled. In the TG, the intact dye-coupled GF circuit is present in all UAS-hid /+ control animals (Fig. 17B,
bottom). When the spGal4 driver is crossed to UAS-hid and the GFI injected with NB, GFC1 is ablated in
18/20 animals (90%); fully in 14/20, partially in 4/20 (Fig. 17C). Partial ablations are defined as several, but
not all, neurons within GFC1 clusters being killed. PSI is eliminated in 16/20 animals (80%). Two animals
had no visible cervical connective (CC) axons and could not be injected for analysis. The ablation of coupled
cells causes stronger dye labeling in the persisting neurons, as expected due to the reduced volume of the
GF circuit. As a consequence, the standard 2-minute NB dye injection can cause lysis of the GF circuit, and
therefore injection times were reduced to <30 seconds for these ablation experiments. This finding is

84
Figure 16. Pre- and Postsynaptic Polarity of the Newly Identified GFC Neurons GFC neuronal polarity is shown using the dendrite/soma label DenMark (magenta) and the presynaptic label Synaptotagmin::GFP (Syt::GFP, green). Substacks of the regions of interest for each GFC are shown for DenMark (column 1) and Syt::GFP (column 2), with above and below paired comparisons (image column 3). Arrows indicate the position of the Inframedial Bridge (IB). GFC schematic representations are shown (center column), with regions of interest outlined in black boxes. A, GFC1 (78A06-Gal4) processes are labeled by presynaptic Syt::GFP in both TG1 (top) and TG2 (bottom) segments, while the IB is labeled by postsynaptic DenMark. B, GFC2 (73C07-Gal4) processes in TG2 (column 1) are co-labeled by both DenMark (column 1) and the Syt::GFP marker (column 2). The IB is labeled by presynaptic Syt::GFP, but also has the DenMark signal (column 4). C, GFC3 (24H07-Gal4) has punctate Syt::GFP within the finger-like processes in TG3 (column 2). The IB is labeled by DenMark, with no Syt::GFP marker (column 4). GFC3 processes along the GFI axonal bend also express the DenMark label (arrowheads).
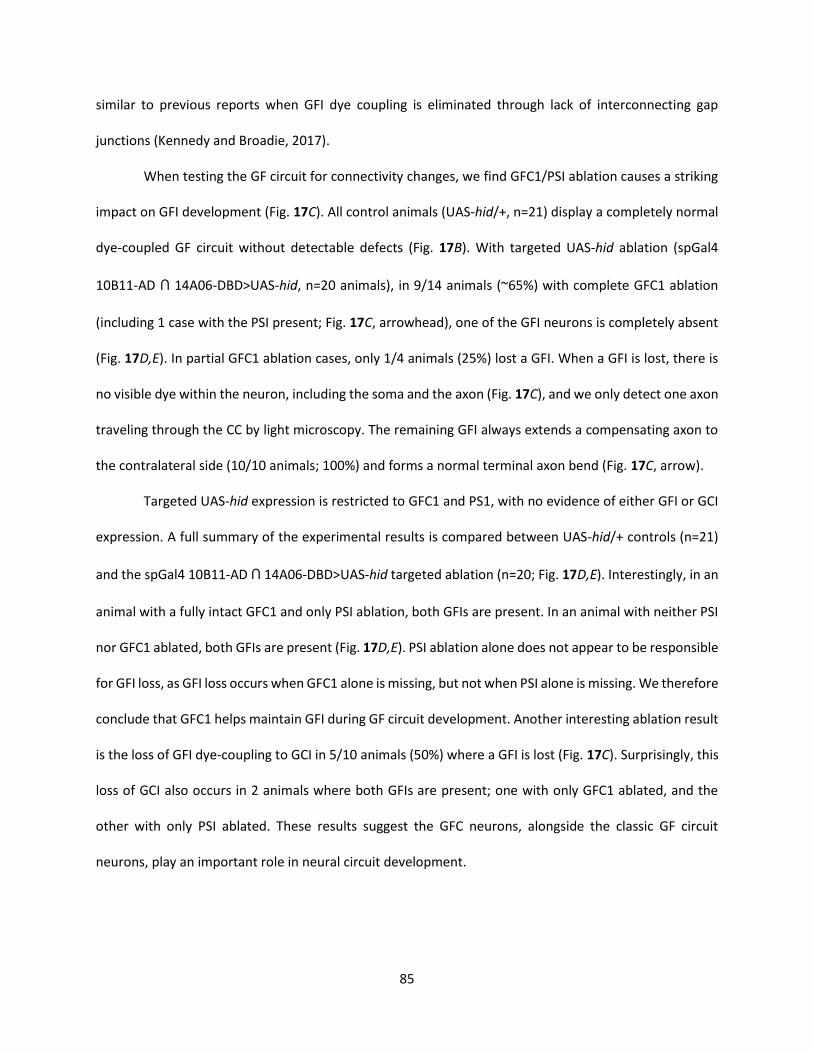
85
similar to previous reports when GFI dye coupling is eliminated through lack of interconnecting gap
junctions (Kennedy and Broadie, 2017).
When testing the GF circuit for connectivity changes, we find GFC1/PSI ablation causes a striking
impact on GFI development (Fig. 17C). All control animals (UAS-hid/+, n=21) display a completely normal
dye-coupled GF circuit without detectable defects (Fig. 17B). With targeted UAS-hid ablation (spGal4
10B11-AD ꓵ 14A06-DBD>UAS-hid, n=20 animals), in 9/14 animals (~65%) with complete GFC1 ablation
(including 1 case with the PSI present; Fig. 17C, arrowhead), one of the GFI neurons is completely absent
(Fig. 17D,E). In partial GFC1 ablation cases, only 1/4 animals (25%) lost a GFI. When a GFI is lost, there is
no visible dye within the neuron, including the soma and the axon (Fig. 17C), and we only detect one axon
traveling through the CC by light microscopy. The remaining GFI always extends a compensating axon to
the contralateral side (10/10 animals; 100%) and forms a normal terminal axon bend (Fig. 17C, arrow).
Targeted UAS-hid expression is restricted to GFC1 and PS1, with no evidence of either GFI or GCI
expression. A full summary of the experimental results is compared between UAS-hid/+ controls (n=21)
and the spGal4 10B11-AD ꓵ 14A06-DBD>UAS-hid targeted ablation (n=20; Fig. 17D,E). Interestingly, in an
animal with a fully intact GFC1 and only PSI ablation, both GFIs are present. In an animal with neither PSI
nor GFC1 ablated, both GFIs are present (Fig. 17D,E). PSI ablation alone does not appear to be responsible
for GFI loss, as GFI loss occurs when GFC1 alone is missing, but not when PSI alone is missing. We therefore
conclude that GFC1 helps maintain GFI during GF circuit development. Another interesting ablation result
is the loss of GFI dye-coupling to GCI in 5/10 animals (50%) where a GFI is lost (Fig. 17C). Surprisingly, this
loss of GCI also occurs in 2 animals where both GFIs are present; one with only GFC1 ablated, and the
other with only PSI ablated. These results suggest the GFC neurons, alongside the classic GF circuit
neurons, play an important role in neural circuit development.

86
Figure 17. GFC Neurons Support GF Circuit Architectural Development A, The GFI labeled by iontophoretically injected TRITC (magenta) reveals the soma (arrow) and dendritic branches (arrowheads) in the brain (top panel), and descending axon in thoracic ganglion (bottom panel). Split-Gal4 (spGal4) 10B11-AD ꓵ 14A06-DBD drives UAS-mcd8::gfp (green) in GFC1 (bottom, arrow) and PSI (bottom, arrowhead). B, Iontophoretic NB injection into the GFI (yellow) in the UAS-hid/+ control reveals the GFI (arrows) interconnected by the Giant Commissural Interneurons (GCI, arrowheads) in the brain (top panel), and normal dye-coupling in the thoracic ganglion (bottom panel). C, Driving UAS-hid with spGal4 10B11-AD ꓵ 14A06-DBD results in the loss of GFC1 with occasional PSI survival (arrowhead). When GFC1 is ablated, the GCI labeling is often lost (top), one of the GFI axons is typically absent, and the remaining GFI axon always extends a compensatory contralateral axon projection (arrow). All NB injections were performed on males. D, Schematic representations of GF circuit outcomes with UAS-hid/+ controls and spGal4 10B11-AD ꓵ 14A06-DBD driven UAS-hid cell ablation. Not pictured are instances where neither GFC1 or PSI are ablated, and instances where both GFIs are absent. E, Frequency of each GF circuit outcome with the targeted spGal4 10B11-AD ꓵ 14A06-DBD driven UAS-hid cell ablation. The pie chart color is coded to dots at the bottom of schematics in panel D. The sample size for UAS-hid/+ genetic controls is 21 animals, and for the spGal4 cell ablation is 20 animals.

87
Discussion
We describe here newly discovered neurons in the classic Drosophila Giant Fiber (GF) neural
circuit (Power, 1948; Sun and Wyman, 1997; Jacobs et al., 2000; Allen et al., 2006) by characterizing four
Giant Fiber Coupled (GFC) neuron clusters. We identify specific transgenic drivers to both label and
manipulate GFC1-4, and map neuronal architecture and polarity. We show these neurons couple to the
Giant Fiber Interneuron (GFI) via ShakB N+16 innexin (Phelan et al., 2008) primarily at the central
Inframedial Bridge (IB; Allen et al., 1998), but also at the downstream axonal bend. Alongside the already
well-established benefits of this circuit, including the large cell size, genetic malleability and accessible
functional/behavioral readouts (Power, 1948; Tanouye and Wyman, 1980; Phelan et al., 1996; Trimarchi
et al., 1999), this expanded set of coupled neurons can aid future experiments in neurodevelopment, such
as the study of axonal selection between multiple dendritic partners. This circuit map could be further
refined using advanced tools, such as MultiColor FlpOut (Nern et al., 2015), as was recently accomplished
for Drosophila brain descending neurons (Namiki et al., 2018).
This detailed circuit map is most useful for genetic analyses of electrical synapse partner
connectivity between individually defined neurons. The GFCs identified in this study are comprised of 2-7
bilaterally symmetrical neurons clustered on each side of the thoracic ganglion (TG) segments. Similar
clusters of repeated neurons with apparent connectivity redundancy have been recently identified in
Drosophila brain descending neurons, where it is also unclear why neurons have such tightly overlapping
projection patterns (Namiki et al., 2018). We have insufficient resolution to determine whether the GFC
neurons truly are duplicates, or if they have distinct, proximally adjacent synaptic targets, like the closely
overlapping Kenyon cells of the adult brain Mushroom Body (Crittenden et al., 1998). It has been proposed
that neuron duplication may allow for a sliding scale of response within a circuit, whereby more neurons
are activated to increase the strength of the response. Alternatively, if the neurons contact similar
88
proximal synaptic targets, their role may be to provide ultra-fine control of muscle movement in the GF
circuit escape response (Namiki et al., 2018).
Complex leg and wing movements are thought to be controlled by extensive TG neural circuits,
which are activated by a small number of descending neurons, including the GFI dedicated to rapid escape
behavior (Cardona et al., 2009; Hsu and Bhandawat, 2016; Cande et al., 2018; Namiki et al., 2018). The
roles of GFC neurons uncovered here have yet to be elucidated, although their electrical coupling to the
GFI strongly suggests a close relationship to behaviors promoting or otherwise facilitating the rapid escape
jump-and-flight response. Our preliminary attempts to optogenetically activate the GFC neurons through
blue-light stimulation of Gal4-targeted ChR2-H134R (Nagel et al., 2005) or ChOP-XXL (Dawydow et al.,
2014) channels did not produce behaviors. We suspect the stimulation paradigm was not strong enough,
that appropriate sensory co-stimulation conditions may not have been provided (von Reyn et al., 2014),
that behavioral scoring methods were not sensitive enough to detect subtle motor output changes (Cande
et al., 2018), or that these neurons modulate internal processes not directly manifest in rapid escape
behavior (Joseph et al., 2017).
Based on the very recently proposed ventral nerve cord (VNC) regional map (Namiki et al., 2018),
the most likely targets of the 4 GFCs identified here are the TG1-3 leg neuropils. GFC2 also appears to
target the TG2 wing neuropil. Both leg and wing outputs are integral to the GF circuit escape response
(von Reyn et al., 2014). GFC1 targets all three TG leg neuropil segments; GFC2 targets TG2; and GFC3 and
GFC4 target TG3 and TG1, respectively. This extensive leg neuropil connectivity may regulate tension in
the front and hind legs, allowing the central legs to execute a more effective escape jump (Trimarchi and
Schneiderman, 1993; von Reyn et al., 2014; Namiki et al., 2018). In support of this hypothesis, our work
indicates GFCs 1-3 are all directly gap junction coupled to the descending GFI, receiving input primarily at
the IB, and thus share in the rapid conduction speed of the GF circuit (Phelan et al., 2008). Further, GFC3

89
neurons extend postsynaptic processes that parallel the PSI processes, indicating GFC3 may collect input
from multiple neurons in the GF circuit.
Like the PSI, all 4 GFCs appear to synapse on their downstream targets via only chemical synapses,
based on Syt::GFP synaptic vesicle marker and lack of ShakB electrical synapse labeling at GFC termini
(Allen et al., 2006). It might appear possible that another innexin could mediate these GFC connections
(Stebbings et al., 2002; Phelan, 2005); however, the complete absence of dye-coupling to neurons
downstream of GFCs indicates electrical synapses are absent. In contrast to the other GFCs, GFC2 appears
both pre- and postsynaptic at the IB connectivity hub, suggesting it may share postsynaptic partners with
GFI, potentially including GFC1, 3, 4 and/or PSI. Given this circuit connectivity, GFC2 may trigger the rapid
escape jump reflex independently of the GFI, in a parallel circuit output long speculated to exist, but not
previously identified (Trimarchi and Schneiderman, 1995; Fotowat et al., 2009). Indeed, GFC2 extends
presynaptic processes into the Tergotrochanteral Motor neuron dendritic field, thus mimicking GFI
connectivity (King and Wyman, 1980).
DenMark and Syt::GFP reporters are extremely useful in defining neuron polarity (Zhang et al.,
2002; Nicolai et al., 2010; Bidaye et al., 2014; Frank et al., 2015), but they have limitations that can make
interpretation difficult. Both reporters preferentially mark appropriate synaptic regions, but can mis-
localize due to transgenic overexpression (Chen et al., 2014; Kanca et al., 2017). A likely example here is
dim DenMark signal near bright Syt::GFP punctae (Fig. 16C). DenMark signal-to-noise is much worse than
the IB labeling, while Syt::GFP signal-to-noise is much stronger; hence our conclusion this region is
presynaptic. A more problematic example may be the DenMark/Syt::GFP overlap in GFC2 (Fig. 16B). This
labeling likely shows adjacent pre- and postsynaptic processes, which we cannot distinguish; although
shared compartments have been reported in Mushroom Body Kenyon cells (Christiansen et al., 2011;
Zheng et al., 2018). It is also worth noting the 73C07-Gal4 line for GFC2 is the strongest driver employed
and may cause DenMark or Syt::GFP mis-localization via transgenic overexpression (Chen et al., 2014;

90
Kanca et al., 2017). The 42A06-Gal4 driver for GFC3/4 is lethal with UAS-denmark, syt::gfp, showing these
markers can also have detrimental effects.
Our targeted ablation studies indicate a role for GFCs in GF circuit development, and demonstrate
the ability of the circuit to compensate for the loss of a GFI, much like ocular dominance columns in Hubel
and Wiesel’s classic work (Hubel and Wiesel, 1970; Hubel et al., 1977). PSI ablation does not appear to be
responsible for the GFI loss, based on the fact that GFIs are present when PSI alone is ablated, and GFIs
are lost only when GFC1 is ablated. Another impact of ablation is lost GCI coupling when a GFI, GFC1 or
PSI is removed. As GCI coupling loss occurs both when GFC1 alone is lost and when PSI alone is lost, it
appears that complete GF circuit formation depends upon feedback from multiple circuit members
(Kandler and Katz, 1995; Hanganu et al., 2009; Maher et al., 2009; Belousov and Fontes, 2013). This finding
suggests neurons not directly coupled can feedback through an intermediary circuit neuron; an intriguing
but poorly studied hypothesis (Kandler and Katz, 1995; Belousov and Fontes, 2013). We note that the
TTMn only occasionally dye-couples with GFI, suggesting gap junction transitions between open and
closed states could also contribute.
Previous studies have shown ablation of the GFI using neurotoxins, such as ricin (Smith et al.,
1996), and have even found that single GFIs are lost at very low frequency in wildtype animals (Allen et
al., 1998). In the latter case, the authors also found midline crossing of a compensatory contralateral
process from the enduring GFI, as in our work. We hypothesize the GFI loss reported here results from
lost GFI stabilization by GFC1 due to loss of trophic/synaptic signaling or physical contact (Gorin and
Johnson, 1979; Pearson and Stoffler, 1992; Antonini and Stryker, 1993; Crowley et al., 1994; Uesaka, 2005;
Gibson and Ma, 2011). Other GFI postsynaptic targets (PSI, TTMn, GFC2-4) presumably also participate in
GFI stabilization, although Gal4 drivers tested thus far for these neurons have proved lethal in
combination with UAS-hid (Zhou et al., 1997; Muthukumar et al., 2014). These animals die early in
development, showing the need for spGal4 lines capable of avoiding off-target cells. Pursuing this

91
phenotype with more specific drivers and screening approaches could elucidate molecular mechanisms
these neurons use to stabilize synaptic partners (Cohen-Cory, 2002).
Other methods shown to cause GFI axonal retraction and neuronal loss include blocking
membrane endocytosis (e.g. using dominant negative shibire/Dynamin) and the overexpression of select
transmembrane receptors, such as Semaphorin-1A (Godenschwege et al., 2002; Murphey, 2003;
Godenschwege and Murphey, 2008). However, in these cases, GFI axon retraction is typically only to the
IB, rather than beyond the CC, or causing complete cell loss. The molecular pathways responsible for these
phenotypes may be shared with the axon retraction caused by loss of synaptic partners, with
Highwire/MYCBP2, Wallenda/DLK and Basket/JNK as prime candidates (Ghosh et al., 2011; Borgen et al.,
2017). While gap junctions play extensive roles in neuronal development (Elias and Kriegstein, 2008;
Belousov and Fontes, 2013; Baker and Macagno, 2017), it is unlikely that GFI loss results from loss of
electrical coupling only, as the total removal of gap junctions from the GFI does not cause axon retraction
or neuronal cell death (Blagburn et al., 1999).
The GFI axon split across the midline in response to the absence of its partner is reminiscent of
sensory neuron plasticity following input deprivation (Poirier et al., 2006; Collignon et al., 2009;
Rabinowitch et al., 2016) and motor circuit development changes in response to lost motor neurons
(Modney and Muller, 1994; Büschges et al., 2000). This corrective rewiring could stem from either normal
pathfinding and synaptogenesis, or new repair pathways activated in response to unpartnered neurons.
The axon split duplication with a GFI loss is different from the recent report on failed GFI pruning (Borgen
et al., 2017), as the new GFI axon path is always a perfect mirror-image of the normal axon bend, rather
than an untrimmed posteriorly branched axon outgrowth. This new circuit rewiring model could be used
in Drosophila genetic screens of GF circuit development (Mohr, 2014; Bassett et al., 2015; Heigwer et al.,
2018) to help answer a number of important questions. Such work will be greatly aided by single-cell
transgenic manipulation of pre- and postsynaptic neurons in the GF circuit.

92
In conclusion, we hope that the increase in manipulatable GFI coupled neurons reported here will
further enhance this genetic model circuit. The GF circuit is ideally suited to query a wide range of
important neurodevelopmental questions, including mechanisms of pathfinding, target recognition,
synaptogenesis and stabilization during neural circuit assembly and maintenance. Although the GF circuit
is rightly considered one of the most straightforward and accessible Drosophila circuits, the higher degree
of connectivity revealed in this study indicates a greater complexity, which is amenable to answering more
in-depth questions. The large number of inputs onto, and outputs from, this model circuit provides further
evidence that even the most basic circuits are deeply interconnected with the rest of the brain circuitry.
As the benefits of single-cell resolution studies cannot be overstated, we hope this enlarged GF circuit
model, and the transgenic tools characterized here, will help form part of the underpinning for future
work on neural circuit dynamics.

93
Chapter IV
dfmr150M Background Mutation Causes Hyper-Connectivity Within the GF Circuit
This manuscript is currently being prepared for publication
Abstract
Neural circuits are assembled during development when neurons synapse with selected partners,
though these initial contacts are often imprecise and need to be optimized by maturity. Connections with
appropriate partners are stabilized as mature synapses while others are retracted or pruned away.
Disruptions to synaptic formation and refinement impair circuit connectivity and are associated with a
range of neurological disorders. One of the best studied is Fragile X syndrome (FXS), a heritable cause of
intellectual disability and autism spectrum disorder (ASD) often characterized by excessive neuronal
overgrowth. Fragile X Mental Retardation Protein (FMRP) loss causes FXS, likely due to its many roles in
synapse development. In the well-characterized Drosophila FXS disease model, we identified
overelaborated synaptic connections in the central Giant Fiber (GF) circuit, with excessive filopodial
processes during synaptogenesis and overabundant synaptic projections at maturity in the GF Interneuron
(GFI) axon. The excess contacts contain both chemical and electrical synapse markers and target known
GF circuit neurons, causing circuit hyper-connectivity. Despite striking similarities to well-characterized
FXS synaptic defects, we discovered that a background mutation(s) in our disease model is responsible for
this phenotype. We are pursuing the mutation via bulk segregant analysis and whole-genome sequencing,
using dye injection to track the phenotype. This ongoing work is expected to reveal new proteins and
molecular mechanisms that regulate synaptic connectivity during neural circuit development, potentially
in concert with FMRP.

94
Introduction
During the early stages in neural circuit formation, axons and dendrites extend transitory synaptic
processes that contact local partners (Jontes et al., 2000; Tashiro et al., 2003; Waites et al., 2005). Nascent
synapses are formed in excess, overgrowing appropriate and inappropriate targets, only to be refined
over time through retraction or glial pruning, sculpting mature connectivity patterns (Riccomagno and
Kolodkin, 2015). With the onset of environmental input, this refinement process continues and is
mediated by sensory-driven synaptic activity (Penn, 2001). The overall synaptic pattern is coordinated by
an array of secreted morphogens, transmembrane receptors and cytoskeletal regulators (Salinas, 2003;
Favuzzi and Rico, 2018; Südhof, 2018). Disrupted synapse formation and maturation cause severe
neurological disorders, including ASD and intellectual disability (Melom and Littleton, 2011). Fragile X
syndrome (FXS) patients display both symptoms, making this monogenic disorder a key model to study
the link between impaired synaptic development and disease (Pfeiffer and Huber, 2009).
The FXS disease state is caused by loss of the mRNA- and channel-binding Fragile X Mental
Retardation Protein (FMRP; Darnell et al., 2011; Ferron, 2016). Overelaborated and immature synapses
are hallmark phenotypes in FXS patients and model systems. Most commonly the synaptic overgrowth
has been documented in dendritic branches and postsynaptic spines, although studies have also identified
overgrown axonal branches and supernumerary presynapses as well (Hinton et al., 1991; Comery et al.,
1997; Greenough et al., 2001; Lee et al., 2003a; Pan et al., 2004; Tessier and Broadie, 2008; Vita and
Broadie, 2017). While many mechanisms have been proposed for this synaptic overelaboration, including
enhanced metabotropic glutamate receptor (mGluR) signaling, elevated microtubule and actin
cytoskeleton stabilization and disrupted synapse pruning (Zhang et al., 2001; Bear et al., 2004; Tessier and
Broadie, 2008), core consensus pathways have been slow to emerge.

95
In the current study, we used the well-characterized Drosophila FXS model to pursue mechanisms
of synaptic connectivity defects. Specifically, we focused on the Giant Fiber (GF) neural circuit due to its
large size, well-mapped neurons and the availability of transgenic tools (Power, 1948; Allen et al., 2006).
We were seeking to model FXS synaptic connectivity defects in a simple, tractable neural circuit with single
cell resolution to test the numerous proposed disease mechanisms. We focused particularly on the central
GF Interneurons (GFI); a pair of bilaterally symmetric neurons, with cell bodies and dendrites in the central
brain and large axons that project into the thoracic ganglia (Koto et al., 1981). GFI axons synapse first onto
the Peripherally Synapsing Interneuron (PSI) and Giant Fiber Coupled 1-4 (GFC1-4) neurons at the
Inframedial Bridge (IB), and then diverge to form two large bends that synapse onto the Tergotrochanteral
Motor neuron (TTMn) and GFC2-3 (Tanouye and Wyman, 1980; Allen et al., 1998, 2006; Kennedy and
Broadie, 2018).
We initially set out to test whether the GFI displays an overgrowth phenotype using the common
FXS disease model null allele, dfmr150M (Zhang et al., 2001). Consistent with numerous published reports,
dfmr150M mutants displayed excess filopodia during GFI synaptogenesis and increased mature synaptic
projections at several timepoints relative to controls, suggesting GFI synaptic connectivity is sensitive to
FMRP loss as expected (Zhang et al., 2001; Michel, 2004; Kim et al., 2013; Doll and Broadie, 2015; Vita and
Broadie, 2017). The projections synapse on GFC2 and 3, indicating the overgrowth is redundant within the
GF circuit and inappropriate connections are not formed. However, subsequent experiments revealed
that FMRP loss alone does not cause the GFI synaptic defects and that a background mutation(s) in the
dfmr150M stock is the source. We are currently using bulk segregant analysis (BSA) with whole genome
sequencing to identify the nature of the genetic change (Pool, 2016). Once identified, we expect this
discovery will shed new light on the mechanisms of synaptogenesis.

96
Materials and Methods
Drosophila Genetics
All animals were maintained on a standard cornmeal/agar/molasses Drosophila food in a 12-hour
light:dark cycling incubator at 25oC. Timed-lay eggs were collected for 2-3 days, and experimental animals
were selected from rearing tubes 10-14 days later, unless otherwise noted. The following Drosophila lines
were used for genetic crosses: w1118 (RRID:BDSC_3605) | w1118; dfmr150M/TM6B, tb, hu, gfp (Zhang et al.,
2001, RRID:BDSC_6930) | w1118; dfmr12/TM6, hu (Dockendorff et al., 2002) | w1118; dfmr1B55 (Inoue et al.,
2002) | w1118; Df(3R)BSC621/TM6C, cu1 sb1 (dfmr1 deficiency, RRID:BDSC_25696, Cook et al., 2012) |
shakB2 (Blagburn et al., 1999) | shakB2; dfmr150M/TM6B, tb, hu, gfp | w1118; PGMR91H05-Gal4attP2
(RRID:BDSC_40594) | w1118; PGMR91H05-Gal4attP2; dfmr150M/TM6B, tb, hu, gfp | dfmr1.14/CyO, gfp;
dfmr150M/ TM6, tb, sb (Dockendorff et al., 2002) | w1118; PGMR73C07-Gal4attP2 (RRID:BDSC_46689) |
w1118; PGMR24H07-Gal4attP2 (RRID:BDSC_49317) | w1118; elav-Gal4 (RRID:BDSC_8765, Luo et al., 1994)
| w*; Pda.G32-Gal4UH1 (Wodarz et al., 1995) | w1118, y1; 10X UAS-ivs-mcd8::gfp attP40 (Pfeiffer et al.,
2010) | w*; PUAS-ivs-mcd8::rfpattP40 (RRID:BDSC_32219) | w1118, y1; 10X UAS-ivs-mcd8::gfp attP40;
dfmr150M/TM6B, tb, hu, gfp | y1, sc*, v1; TRiP.HMS00248 (RNAi1, Perkins et al., 2015, RRID:BDSC_34944)
| y1, sc*, v1; Py[+t7.7] v[+t1.8] TRiP.GL00075 (RNAi2, Perkins et al., 2015, RRID:BDSC_35200) | w*;
PBacbrp(FRT.Stop)gfp (Brp-FSF-GFP; Chen et al., 2014; RRID:BDSC_55753) | y1 w*; P UAS-flp1.D (Duffy
et al., 1998; RRID:BDSC_4539) | UAS-flp1.D/CyO, gfp; 91H05-Gal4 | UAS-rfp/CyO, gfp; Brp-FSF-GFP | UAS-
flp1.D; 91H05-Gal4, dfmr150M/TM6B, tb, hu, gfp | UAS-rfp; Brp-FSF, dfmr150M/TM6, tb, sb.
Dye Iontophoresis
GFI dye injection was performed similarly to previously published methods (Boerner and
Godenschwege, 2011; Kennedy and Broadie, 2017). Briefly, glass electrodes (Kwik-Fil Borosilicate glass

97
1B100F-4, World Precision Instruments) were pulled on a laser electrode puller (Model P-2000, Sutter
Instrument Company) to 10MΩ resistance (3M KCl). Electrodes were filled with 0.25% TRITC-dextran
(10kDa, Life Technologies) and 7% neurobiotin (Vector Laboratories, RRID:AB_2313575) in ddH2O. Filled
electrodes were placed on a silver-chloride wire mounted on a PCS-5000 micromanipulator (Burleigh).
Animals in Jans’ saline were cut along the dorsal midline to access the cervical connective, where
electrodes were inserted into the GFI axon (Jan and Jan, 1976). A square-pulse stimulator (Grass S48,
Astro-Med) provided 7.5 100ms pulses/second for 2 mins with 20nA injected current, monitored by an
AxoClamp2B amplifier. A Digidata data acquisition system (1320A, Axon Instruments) was controlled with
Clampex 9.2 software.
Confocal Imaging
Brains were fixed in 4% paraformaldehyde/sucrose (Electron Microscopy Services) in phosphate-
buffered saline (PBS, pH 7.2, Life Technology) for 30 mins, washed 3X with PBS, and then blocked for 1 hr
with 1% bovine serum albumin (BSA, Sigma-Aldrich) in PBST (PBS + 0.2% Triton X-100; Thermo Fisher
Scientific). Primary and secondary labeling was performed for either 2 hrs at room temperature or
overnight at 4oC. All probes were diluted in PBST with 0.2% BSA. The following probes were used:
Streptavidin::Cy5 (1:20, Life Technology), rabbit anti-ShakB (1:200, Phelan et al., 1996), rabbit anti-GFP
(1:2000; Abcam, RRID:AB_303395), FITC Goat anti-GFP (1:500; Abcam, RRID:AB_305635), Rabbit anti-RFP
(1:500; Rockland, RRID:AB_2209751), Alexa 488-conjugated donkey anti-goat (1:250; Thermo Fisher,
RRID:AB_2534102), Alexa 488-conjugated donkey anti-rabbit (1:250; Thermo Fisher, RRID:AB_2556546),
Alexa 568-conjugated donkey anti-rabbit (1:250; Thermo Fisher, RRID:AB_2534017), Alexa 647-
conjugated donkey anti-rabbit (1:250; Thermo Fisher, RRID:AB_2536183), and Alexa 633-conjugated goat
anti-rabbit (1:250; Thermo Fisher, RRID:AB_141419). Preparations were then washed 3X for 30 mins in
PBST, 1X in PBS, and mounted on glass microscope slides (Probe On Plus 25 x 75 x 1.0mm, Thermo Fisher

98
Scientific) in 2, 2’-Thiodiethanol (TDE, Sigma-Aldrich; Staudt et al., 2007). To prevent crushing, double-
sided poster tape (Scotch) was placed on each side of the brains. Coverslips (No. 1.5H, Zeiss) were sealed
with nail polish (Hard as Nails, Sally Hansen). Fluorescent images were collected using either a Zeiss LSM
510 META confocal microscope or a ZEISS LSM 880 confocal microscope with an Airyscan module. Images
show maximum Z-stack projections, unless otherwise noted in the figure legends. Occasionally
bidirectional scans were misaligned. Such instances were corrected using the FIJI plugin “Correct X Shift.”
Western Blotting
Brains were dissected from adult females in PBS with a protease inhibitor (cOmplete mini EDTA-free
protease inhibitor cocktail; Roche). Four brains were collected in RIPA buffer (150mM NaCl, 1% Triton X-
100, 50mM Tris, 0.5% Sodium deoxycholate, 0.1% SDS, 1mM EDTA, 50mM TRIS, 1mM PMSF, Protease
Inhibitor Cocktail; Sigma-Aldrich) on ice and sonicated for 20 secs (Branson Model 102C, Sonifier 250
microtip). Samples were mixed with 4X LDS buffer (ThermoFisher), brought to 5% beta-mercaptoethanol
(Sigma-Aldrich), allowed to incubate at room temperature for 20 mins, boiled at 100oC for 10 mins and
centrifuged at 14,000 RPM for 10 mins. The equivalent of two brains worth of protein was loaded on a
4%-16% Bis Tris SDS gel (ThermoFisher) in 1x MES buffer (ThermoFisher). After running, the protein was
transferred overnight in 1X transfer buffer/20% methanol (ThermoFisher). Following transfer, the
membrane was dried for 1 hr, blocked with 2% milk (Kroger) in TBS-T (150mM NaCl, 0.1% Tween, 5mM
KCl, 25mM Tris, pH7.6) for 1 hr at room temperature and then stained with primary antibody in 2%
milk/TBS-T for 2 hrs at room temperature (mouse anti-FMRP (1:3,000, Sigma-Aldrich F4554) Rabbit anti-
α-tubulin (1:40,000, AbCam Ab52866)). The primary was removed with six 5-min TBS-T washes and the
membrane was incubated with secondary (800 Goat anti-mouse (1:20,000, Rockland), Alexa 680 goat anti-
rabbit (1:20,000, ThermoFisher)) in 2% milk/TBS-T for 2 hrs at room temperature. The secondary was
washed 6 times in TBS-T for 5 mins and then imaged (LI-COR Odyssey).
99
Bulk Segregant Analysis and Whole Genome Sequencing
The bulk segregant lines were created with multiple generations of inbreeding. To begin, w1118
males were crossed with w1118; dfmr150M/ TM6B, tb, hu, gfp females, and the transheterozygous offspring
(w1118; dfmr150M/+) were interbred. The offspring of this cross were then interbred. This process was
repeated for a total of 12 generations. Flies from the 9th, 10th 11th, and 12th generations were GFI injected
according to the above dye iontophoresis protocol, with the body cryopreserved at -80oC. Upon
completion of GFI dye injection and projection quantification, bodies were combined into 3 pools based
on quantified GFI projection number; 0-3 projections were placed in the control pool, 5-6 projections in
the heterozygous pool and 7+ projections in the homozygous mutant pool. DNA was extracted from each
pool using the Qiagen DNeasy Blood and Tissue extraction kit (Qiagen, Cat # 69504). 150bp paired-end
read whole genome sequencing was performed on the samples (Hudson Alpha, Illumina NovaSeq).
Data Analyses
Data processing was done with FIJI software (version 2, RRID:SCR_002285; Schindelin et al., 2012;
Schneider et al., 2012). GFI projection number represents the projections from one GFI bend, below the
IB. If both GFI arms were visible, projection number was averaged. GFI projection lengths were quantified
using the FIJI Simple Neurite Trace plugin and were only included if their total length was greater than or
equal to 2µm (Longair et al., 2011). For branched projections, the longest continuous branch was followed
and the whole structure was counted as one projection. All statistical analyses were performed using
Prism software v7 (GraphPad, RRID:SCR_002798). All single pairwise comparisons were performed by
two-tailed student's t test. All multiple comparisons were performed using an unpaired one-way ANOVA,
with Tukey–Kramer pairwise post hoc tests. In all figures, graphs show the mean ± SEM with the statistical
comparisons displayed as: NS (not significant) p>0.05), (*) p<0.05, (**) p<0.01 and (***) p<0.001.
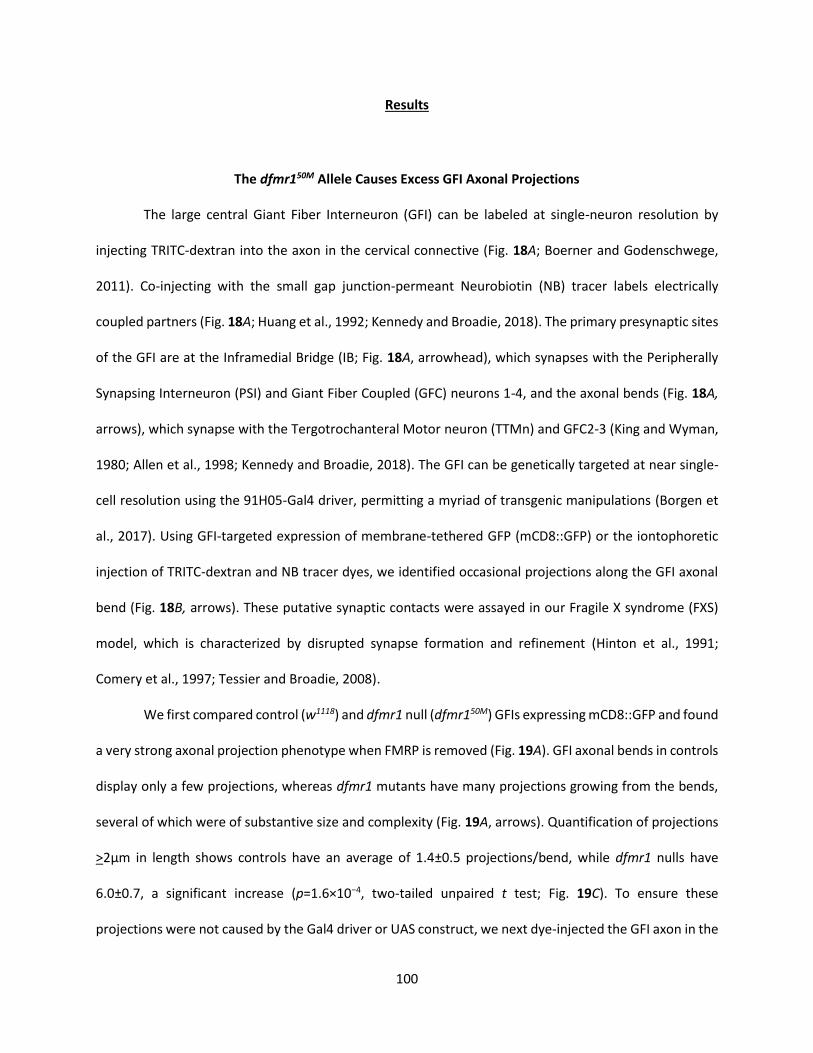
100
Results
The dfmr150M Allele Causes Excess GFI Axonal Projections
The large central Giant Fiber Interneuron (GFI) can be labeled at single-neuron resolution by
injecting TRITC-dextran into the axon in the cervical connective (Fig. 18A; Boerner and Godenschwege,
2011). Co-injecting with the small gap junction-permeant Neurobiotin (NB) tracer labels electrically
coupled partners (Fig. 18A; Huang et al., 1992; Kennedy and Broadie, 2018). The primary presynaptic sites
of the GFI are at the Inframedial Bridge (IB; Fig. 18A, arrowhead), which synapses with the Peripherally
Synapsing Interneuron (PSI) and Giant Fiber Coupled (GFC) neurons 1-4, and the axonal bends (Fig. 18A,
arrows), which synapse with the Tergotrochanteral Motor neuron (TTMn) and GFC2-3 (King and Wyman,
1980; Allen et al., 1998; Kennedy and Broadie, 2018). The GFI can be genetically targeted at near single-
cell resolution using the 91H05-Gal4 driver, permitting a myriad of transgenic manipulations (Borgen et
al., 2017). Using GFI-targeted expression of membrane-tethered GFP (mCD8::GFP) or the iontophoretic
injection of TRITC-dextran and NB tracer dyes, we identified occasional projections along the GFI axonal
bend (Fig. 18B, arrows). These putative synaptic contacts were assayed in our Fragile X syndrome (FXS)
model, which is characterized by disrupted synapse formation and refinement (Hinton et al., 1991;
Comery et al., 1997; Tessier and Broadie, 2008).
We first compared control (w1118) and dfmr1 null (dfmr150M) GFIs expressing mCD8::GFP and found
a very strong axonal projection phenotype when FMRP is removed (Fig. 19A). GFI axonal bends in controls
display only a few projections, whereas dfmr1 mutants have many projections growing from the bends,
several of which were of substantive size and complexity (Fig. 19A, arrows). Quantification of projections
>2µm in length shows controls have an average of 1.4±0.5 projections/bend, while dfmr1 nulls have
6.0±0.7, a significant increase (p=1.6×10⁻⁴, two-tailed unpaired t test; Fig. 19C). To ensure these
projections were not caused by the Gal4 driver or UAS construct, we next dye-injected the GFI axon in the

101
Figure 18. Presynaptic Projections From the Giant Fiber Interneuron Terminal Bend A, Co-injection of TRITC-dextran (magenta) and Neurobiotin (yellow) into the Giant Fiber Interneuron (GFI) labels the neuron and all the gap-junction connected GF circuit neurons. Visible are the Peripherally Synapsing Interneuron (PSI), the Tergotrochanteral Motor neuron (TTMn) cell body and Giant Fiber Coupled (GFC) 1-4. The GFI Inframedial Bridge (IB, arrowhead) and axonal bends (arrow) located in the second thoracic ganglion segment are the two presynaptic sites. B, Enlarged image of the GFI axonal bend (see box in A) showing outgrown projections of unknown connectivity (arrows). Scale bar represents 25µm in full image and 5µm in inset.

102
stock w1118 and dfmr150M lines with TRITC-dextran (Fig. 19B). When axonal projections are compared with
this labeling strategy, we again find supernumerary processes in dfmr150M relative to the w1118 background
control (Fig. 19B). Quantification shows control GFIs have an average of 3.3±0.2 projections/bend while
dfmr1 nulls have 7.8±0.4, again a significant elevation (p=4.7×10⁻²⁰, two-tailed unpaired t test; Fig. 19D).
Taken together, the findings suggest the GFI axonal projections would be ideal to study how FMRP loss
affects synaptic connectivity in the Drosophila FXS model. The projection phenotype is robust and
relatively easy to measure, so we sought to characterize the defect more fully before dissecting the
molecular mechanism responsible for the overgrowth.
Increased Axonal Projections Present During Early GFI Synaptogenesis
We first investigated when the overgrown axonal projections develop during GF circuit formation.
The GFI reaches its TTMn target approximately 24 hours after puparium formation (APF), at which point
synaptogenesis begins. Synapse formation lasts for approximately one day (24-48 hours APF; Allen et al.,
1998). In order to examine this synaptogenesis period, we collected animals at approximately 34-50 hours
APF by selecting for the “yellow body” localized between the Malpighian tubules on the dorsal side of the
pupae (Paul and Bownes, 1981). The GFI 91H05-Gal4 driver was used to express UAS-mcd8::gfp and
examine axonal bend projections over the developmental time course (Fig. 20A). Both control (w1118) and
dfmr1 null (dfmr150M) GFIs exhibit far more extensive projection outgrowth than what was seen in adults,
but the mutants show a much greater elevation (Fig. 20A, arrows). These early GFI projections are usually
far more slender than the ones found in adults suggesting they are immature filopodial processes
searching for synaptic partners (Tashiro et al., 2003; Armijo-Weingart and Gallo, 2017). Quantification
shows that controls have 7.8±1.0 projections/bend and dfmr1 nulls have 17.8±1.2 (p =1.3×10⁻⁶, two-tailed
unpaired t test; Fig. 20B, left). Thus, the FXS model defect is apparent at the early stages of
synaptogenesis.

103
Figure 19. Supernumerary GFI Axonal Projections in dfmr150M Null Mutants A, The Giant Fiber Interneuron (GFI) visualized with 91H05-Gal4 driving the membrane marker UAS-mcd8::gfp (green) in w1118 genetic control (left) and dfmr150M null (right). In controls the axonal bends have few detectable projections compared to an excess number of overgrown projections in the mutants. Arrows indicate the projections. B, Iontophoretic dye injection of TRITC-dextran (magenta) in w1118 (left) and dfmr150M (right) stocks show the same phenotype. Scale bars in both images: 5µm. C, Quantification of the GFP-labeled axonal projections. w1118, n=8; dfmr150M, n=8. D, Quantification of the TRITC labeled projections. w1118, n=62; dfmr150M, n=48.

104
We next assayed later stages in GF circuit development, testing two timepoints during synaptic
maturation (Fig. 20A): 73-78 hours APF and 75-90 hours APF, identified by gray and black colored pupal
wings, respectively. At each time point, dfmr1 nulls still display more GFI axonal projections compared to
matched controls, albeit with a progressive decrease in projection number over time (Fig. 20A,B). Note
the w1118 controls decreased their projection number by 73-78 hours APF but showed little decline at 75-
90 hours APF (Fig. 20A). Quantification supported these observations, showing 73-78 hour controls have
3.7±0.5 projections/bend, while dfmr1 nulls have 14.1±0.8 (p=2.7×10⁻⁹, two-tailed unpaired t test; Fig.
20B, middle). By 75-90 hours, controls exhibit 3.5±0.3 projections and dfmr1 mutants 9.2±0.9 (p=2.6×10⁻⁶,
two-tailed unpaired t test; Fig. 20B, right). Synaptic overgrowth in FXS models may occur during initial
synaptic formation or due to a failure to properly prune synapses (Antar et al., 2006; Gatto and Broadie,
2008; Patel et al., 2014; Connor et al., 2017). Our results indicate GFI overgrowth begins at early
synaptogenesis stages but does not rule out a role for faulty pruning later. Some FXS reports show that
early synaptic overgrowth is rectified in adults (Antar et al., 2006; Bilousova et al., 2009; He and Portera-
Cailliau, 2013), so we next assayed whether the excess GFI projections form mature, persistent synapses.
Overgrown Axonal Projections Contain Chemical Synaptic Machinery
Synaptic markers are notoriously difficult to image in dense neural regions such as the GFI thoracic
ganglia neuropil (Chen et al., 2014; Koles et al., 2016). Antibody labeling for presynaptic markers paired
with standard confocal microscopy does not provide sufficient resolution to distinguish whether the
synaptic marker is in a neuron of interest or neighboring neurons (Hiesinger et al., 2001; Urwyler et al.,
2015). Another commonly used approach, the Gal4/UAS transgenic expression of labeled presynaptic
markers in neurons of interest, often leads to overexpression which can cause mis-localization and protein
aggregation (Christiansen et al., 2011; Chen et al., 2014; Koles et al., 2016). To avoid these difficulties, we
employ here the Synaptic Tagging with Recombination (STaR) technique to label Bruchpilot (Brp), a well-

105
Figure 20. GFI Axonal Projection Overgrowth Begins Early in Synaptogenesis A, The Giant Fiber Interneuron (GFI) axonal bends visualized with 91H05-Gal4 driven UAS-mcd8::gfp (green) during development in genetic control (w1118, left) and dfmr1 null mutant (dfmr150M, right) at 34-50 hours after puparium formation (APF, top), 73-78 hours APF (center) and 75-90 hours APF (bottom). Arrows indicate projections. Scale bar: 10µm. B. Quantification of the axonal projections at all 3 timepoints for both genotypes. Sample sizes: 34-50h: w1118, n=12; dfmr150M, n=13. 73-78h: w1118, n=10; dfmr150M, n=10. 75-90h: w1118, n=12; dfmr150M, n=12.
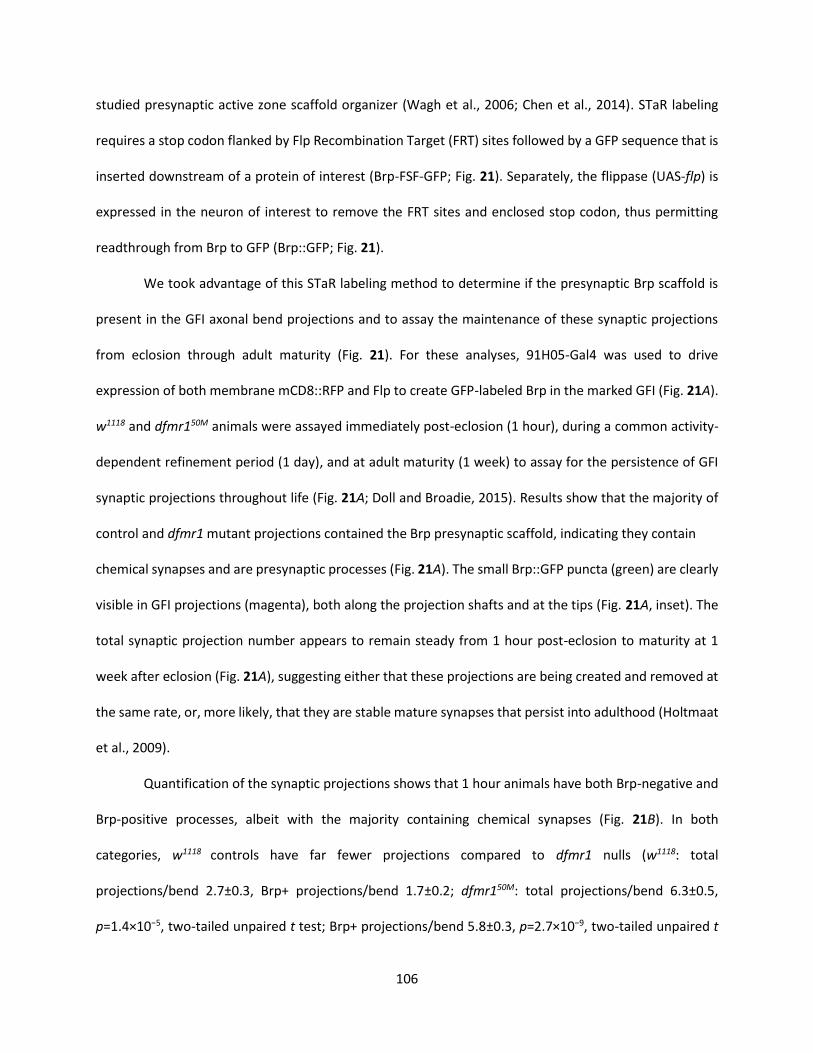
106
studied presynaptic active zone scaffold organizer (Wagh et al., 2006; Chen et al., 2014). STaR labeling
requires a stop codon flanked by Flp Recombination Target (FRT) sites followed by a GFP sequence that is
inserted downstream of a protein of interest (Brp-FSF-GFP; Fig. 21). Separately, the flippase (UAS-flp) is
expressed in the neuron of interest to remove the FRT sites and enclosed stop codon, thus permitting
readthrough from Brp to GFP (Brp::GFP; Fig. 21).
We took advantage of this STaR labeling method to determine if the presynaptic Brp scaffold is
present in the GFI axonal bend projections and to assay the maintenance of these synaptic projections
from eclosion through adult maturity (Fig. 21). For these analyses, 91H05-Gal4 was used to drive
expression of both membrane mCD8::RFP and Flp to create GFP-labeled Brp in the marked GFI (Fig. 21A).
w1118 and dfmr150M animals were assayed immediately post-eclosion (1 hour), during a common activity-
dependent refinement period (1 day), and at adult maturity (1 week) to assay for the persistence of GFI
synaptic projections throughout life (Fig. 21A; Doll and Broadie, 2015). Results show that the majority of
control and dfmr1 mutant projections contained the Brp presynaptic scaffold, indicating they contain
chemical synapses and are presynaptic processes (Fig. 21A). The small Brp::GFP puncta (green) are clearly
visible in GFI projections (magenta), both along the projection shafts and at the tips (Fig. 21A, inset). The
total synaptic projection number appears to remain steady from 1 hour post-eclosion to maturity at 1
week after eclosion (Fig. 21A), suggesting either that these projections are being created and removed at
the same rate, or, more likely, that they are stable mature synapses that persist into adulthood (Holtmaat
et al., 2009).
Quantification of the synaptic projections shows that 1 hour animals have both Brp-negative and
Brp-positive processes, albeit with the majority containing chemical synapses (Fig. 21B). In both
categories, w1118 controls have far fewer projections compared to dfmr1 nulls (w1118: total
projections/bend 2.7±0.3, Brp+ projections/bend 1.7±0.2; dfmr150M: total projections/bend 6.3±0.5,
p=1.4×10⁻⁵, two-tailed unpaired t test; Brp+ projections/bend 5.8±0.3, p=2.7×10⁻⁹, two-tailed unpaired t

107
test, Fig. 21B). By 1 day, nearly all projections were Brp positive in both genotypes, with far more in the
mutants (w1118: total projections/bend 2.1±0.4, Brp+ projections/bend 2.0±0.4; dfmr150M: total
projections/bend 5.1±0.6, p=2.0×10⁻⁴, two-tailed unpaired t test, Brp+ projections/bend: 5.0±0.5,
p=2.8×10⁻⁶, two-tailed unpaired t test, Fig. 21B). At 1 week, projection numbers were similar to 1 day, and
every projection had chemical synapses, with more in the mutants (w1118: Brp+ projections/bend 2.3±0.4;
dfmr150M: Brp+ projections/bend 5.5±0.5, p=1.1×10⁻⁴, two-tailed unpaired t test; Fig. 21B). Together,
these findings show axonal projections that extend from the GFI bend likely make synaptic connections
with postsynaptic partners. As the GFI uses mixed chemical and electrical synapses, we next tested
whether these axonal projections also contain electrical synapse markers.
Overgrown Axonal Projections Contain Electrical Synapses
Unlike most synaptic protein antibodies, the Shaking-B (ShakB) antibody specifically labels GF
electrical synapses, permitting simple imaging analyses (Phelan et al., 1996). To test whether GFI axon
projections electrically couple to partner neurons the GFI axon was injected with TRITC-dextran and
labeled with the ShakB antibody (Fig. 22A). Unlike Brp, we find ShakB present in a limited subset of
projections (Fig. 22A, insets), with many projections either negative or below detection limits (Fig. 22A,
arrowheads). Quantification shows that both w1118 controls and dfmr1 nulls have ShakB in less than half
the synaptic projections (Fig. 22B). The dfmr150M animals exhibit projection overgrowth, both for total and
ShakB+ projections (w1118: total projections/bend 3.0±0.4, ShakB+ projections/bend 1.2±0.2; dfmr150M:
total/bend 8.3±0.5, p=2.1×10⁻¹¹, two-tailed unpaired t test, ShakB+ projections/bend 3.0±0.3, p=6.1×10⁻⁶,
two-tailed unpaired t test; Fig. 22B). These results suggest that while axonal projections clearly form
electrical synapses, this is not a universal mode of connectivity. We also wanted to test whether the
projections depend on electrical synapses for formation or maintenance. Many vertebrate synapses have
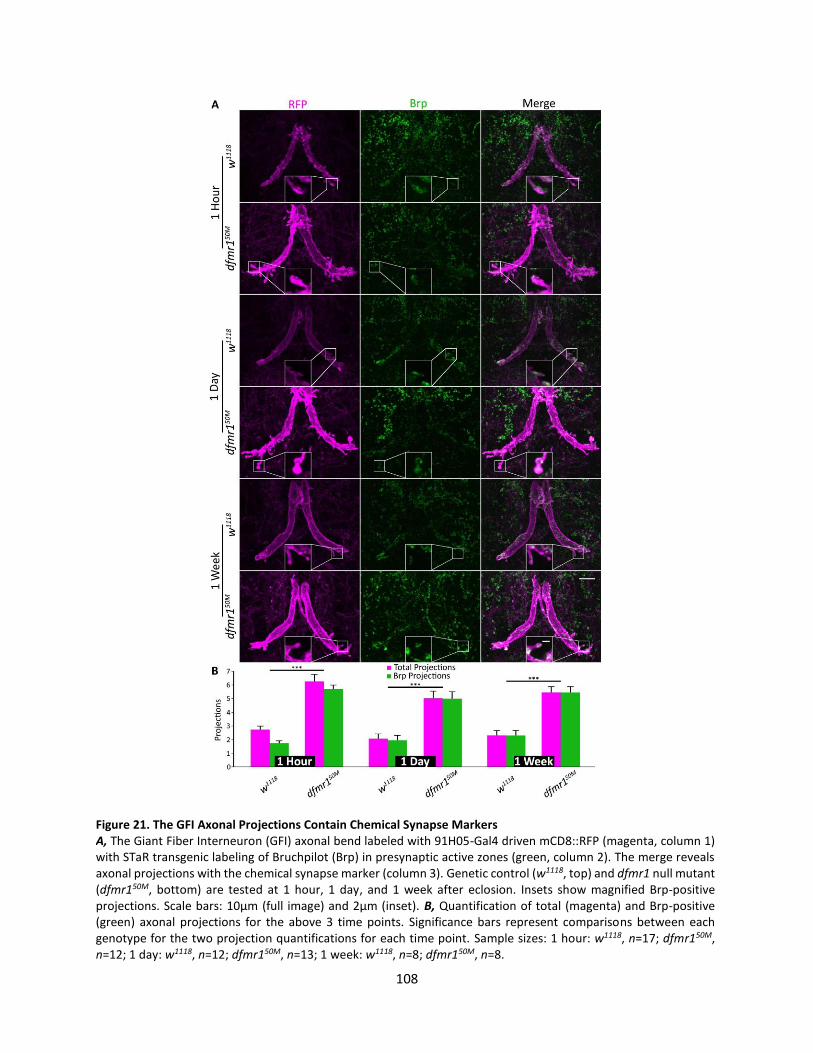
108
Figure 21. The GFI Axonal Projections Contain Chemical Synapse Markers A, The Giant Fiber Interneuron (GFI) axonal bend labeled with 91H05-Gal4 driven mCD8::RFP (magenta, column 1) with STaR transgenic labeling of Bruchpilot (Brp) in presynaptic active zones (green, column 2). The merge reveals axonal projections with the chemical synapse marker (column 3). Genetic control (w1118, top) and dfmr1 null mutant (dfmr150M, bottom) are tested at 1 hour, 1 day, and 1 week after eclosion. Insets show magnified Brp-positive projections. Scale bars: 10µm (full image) and 2µm (inset). B, Quantification of total (magenta) and Brp-positive (green) axonal projections for the above 3 time points. Significance bars represent comparisons between each genotype for the two projection quantifications for each time point. Sample sizes: 1 hour: w1118, n=17; dfmr150M, n=12; 1 day: w1118, n=12; dfmr150M, n=13; 1 week: w1118, n=8; dfmr150M, n=8.
109
been reported to use gap junctions during synaptogenesis, removing them when synapse formation is
complete (Niculescu and Lohmann, 2014; Jabeen and Thirumalai, 2018).
GFI electrical synapses can be eliminated using the shakB2 null mutant, which eliminates coupling
(Blagburn et al., 1999). We tested this mutant alone and combined with dfmr150M, injecting the GFI with
gap junction permeable NB (Fig. 22C). Dye injections were performed for 30 seconds, as longer injections
cause these neurons to rupture (Kennedy and Broadie, 2017). In these experiments, no neurons aside
from the GFI were labeled, indicating the successful removal of ShakB. Both single and double mutants
still produce projections (Fig. 22C, left), though shakB2; dfmr150M maintains overgrown projections relative
to the control (Fig. 22C, right). Quantification shows dfmr150M has a significant increase in projections
(shakB2: projections/bend 2.7±0.4; shakB2; dfmr150M: projections/bend: 5.2±0.4, p=5.2×10⁻⁵, two-tailed
unpaired t test; Fig. 22D). These results suggest that some dfmr150M projections could be ShakB electrical
synapse dependent, but not all of them. Taken together, the above findings show that the GFI axonal
projections contain both chemical and electrical presynaptic markers (Brp and ShakB). The distance that
these synaptic projections travel away from the GFI axonal bend suggests that they connect with
postsynaptic partners other than the TTMn, which lays tightly along the main GFI axon (Blagburn et al.,
1999). We therefore next pursued these partners to determine whether they were normal GF circuit
neurons, or new, inappropriate targets.
GFI Synaptic Projections Target GFC Neurons to Cause Circuit Hyper-Connectivity
GF circuit connectivity can be mapped by injecting small tracers that pass through gap junctions
to label partner neurons (Boerner and Godenschwege, 2011). We took advantage of this property by
injecting the GFI with NB to test whether any unexpected neurons partner with the dfmr150M projections
(Huang et al., 1992; Kennedy and Broadie, 2018). The w1118 control and dfmr150M null dye coupling
patterns, though complex, appeared similar, with no new labeled neurons standing out in the mutant (Fig.

110
Figure 22. The GFI Axonal Projections Contain Electrical Synapse Markers A, Giant Fiber Interneuron (GFI) dye injected with TRITC-dextran (magenta, left) and labeled for the ShakB innexin (cyan, center) reveals axonal bend projections containing electrical synapses (merge, right) in both w1118 (top) and dfmr150M (bottom). Arrowheads indicate ShakB-negative projections, insets show magnified ShakB-positive projections. Scale bars: 10µm (full image) and 2µm (inset). B, Quantification of total (magenta) and ShakB-positive (cyan) projections for both genotypes. Significance bars represent comparisons between each genotype for the two projection quantifications. Sample sizes: w1118, n=28; dfmr150M, n=26. C, GFI dye injected with Neurobiotin (yellow) in shakB2 null mutant (left) and shakB2; dfmr150M double mutant (right). Scale bar: 10µm. D, Quantification of projections for both genotypes. Sample sizes: shakB2, n=27; shakB2; dfmr150M, n=31.

111
23A). Moreover, upon close analyses of the dfmr150M projection locations, it appears that they contact
recently identified neurons within the GF circuit, specifically GFC2 (Fig. 23A, arrow) and GFC3 (Fig. 23A,
arrowhead; Kennedy and Broadie, 2018). Since transgenic tools are available to study these neurons, we
tested whether the mutant projections are overgrowing these normal GFI targets. We combined the GFC2
(73C07-Gal4) and GFC3 (24H07-Gal4) drivers with UAS-mcd8::gfp and crossed these animals with the
dfmr150M stock, since dfmr150M/+ increases projection number (see Fig. 24 below). We injected the GFI
with TRITC and found that the GFI projections frequently oppose GFC2 and GFC3 (Fig. 23B, arrows),
indicating putative connectivity. We next wished to test whether these direct contacts are incidental or
indicate synaptic pairing.
To test synaptic connectivity, we repeated the above experiment with labeling for ShakB to
identify electrical synapses. We find that ShakB is indeed present at the contact intersection of the GFI
projections and GFC2 and 3 neurons (Fig. 23C, insets). As above, there were frequently cases where ShakB
labeling is not present in projections contacting a GFC (Fig. 23C, arrowhead). Taken together these findings
suggest that the synaptic projections characterizing the dfmr150M mutant make redundant connections
onto known GF circuit neurons. It is unclear if GFC2 and 3 are the only targets of the excess projections,
or whether other partners remain to be uncovered. It is interesting to note that GFC2 and 3 extensively
contact the main axon shaft in both controls and dfmr1 nulls and occasionally form synapses there, making
the projections unnecessary (Kennedy and Broadie, 2018). This suggests either that the mutant condition
drives the axon to seek out more synapses with its partners than it normally would require, or that
developmental projections normally pruned away during GF circuit maturation are inappropriately
stabilized (Fig. 20). However, in the pursuit of this question we uncovered evidence that FMRP loss alone
may not cause the synaptic projection phenotype, so we pursued a series of control experiments.
112
Figure 23. GFI Axonal Projections Synapse Within the GF Circuit on GFC Neurons A, The Giant Fiber Interneuron (GFI) was co-injected with TRITC-dextran (magenta, left) and Neurobiotin (yellow, center) to examine downstream neurons (merge, right) in w1118 (top) and dfmr150M (bottom). A presumptive GFC2 (arrow) and GFC3 (arrowhead) are contacted by GFI projections. Scale bar: 10µm. B, The GFI injected with TRITC-dextran (magenta) in 73C07-Gal4 driving mCD8::GFP (green) in GFC2 (top) and 24H07-Gal4 driving mCD8::GFP (green) in GFC3 (bottom) in the dfmr150M/+ background. Arrows point to overlaps between the GFI and the GFCs. Scale bar: 5µm. C, GFI injected with TRITC-dextran (magenta, column 1) with mCD8::GFP (green, column 2) labeling GFC2 (73C07-Gal4, top) and GFC3 (24H07-Gal4, bottom) in the dfmr150M/+ background were co-stained for ShakB (cyan, column 3) to reveal electrical synapses. All three channels are combined in the merge (column 4). Insets show magnified sub-stacks of ShakB-positive projections contacting GFC neurons. The arrowhead shows a ShakB-negative GFI-GFC contact. Scale bars: 5µm (full image) and 2µm (inset).
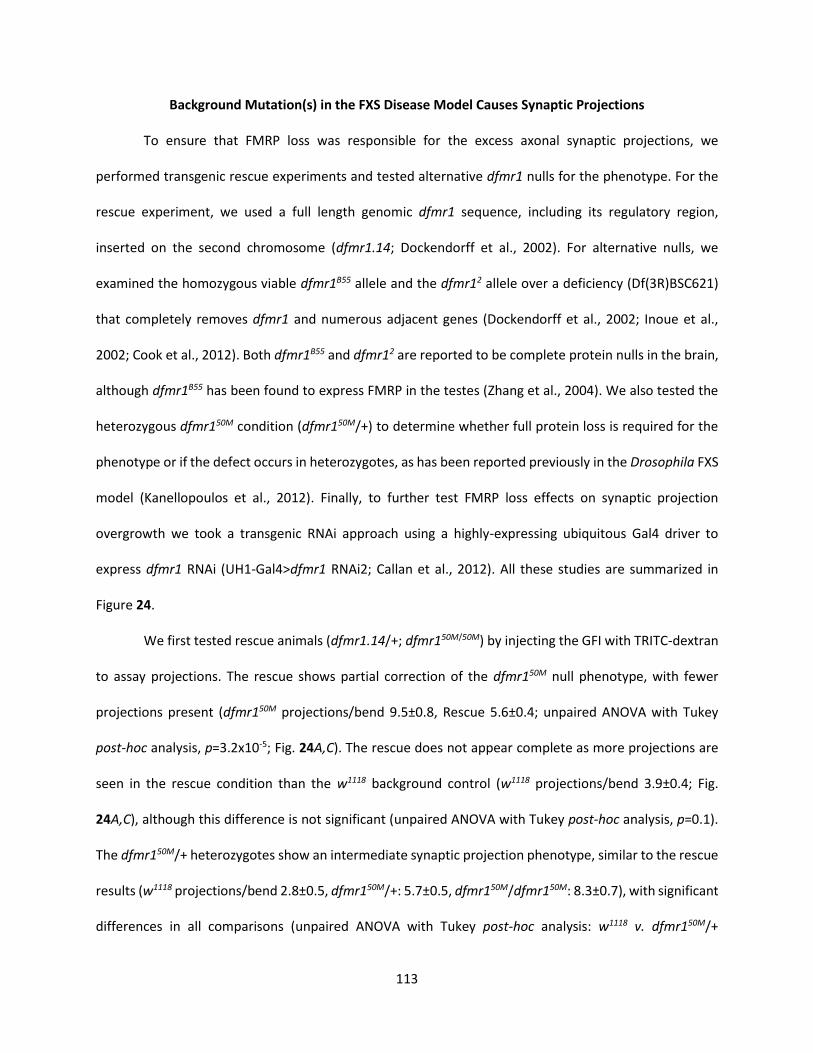
113
Background Mutation(s) in the FXS Disease Model Causes Synaptic Projections
To ensure that FMRP loss was responsible for the excess axonal synaptic projections, we
performed transgenic rescue experiments and tested alternative dfmr1 nulls for the phenotype. For the
rescue experiment, we used a full length genomic dfmr1 sequence, including its regulatory region,
inserted on the second chromosome (dfmr1.14; Dockendorff et al., 2002). For alternative nulls, we
examined the homozygous viable dfmr1B55 allele and the dfmr12 allele over a deficiency (Df(3R)BSC621)
that completely removes dfmr1 and numerous adjacent genes (Dockendorff et al., 2002; Inoue et al.,
2002; Cook et al., 2012). Both dfmr1B55 and dfmr12 are reported to be complete protein nulls in the brain,
although dfmr1B55 has been found to express FMRP in the testes (Zhang et al., 2004). We also tested the
heterozygous dfmr150M condition (dfmr150M/+) to determine whether full protein loss is required for the
phenotype or if the defect occurs in heterozygotes, as has been reported previously in the Drosophila FXS
model (Kanellopoulos et al., 2012). Finally, to further test FMRP loss effects on synaptic projection
overgrowth we took a transgenic RNAi approach using a highly-expressing ubiquitous Gal4 driver to
express dfmr1 RNAi (UH1-Gal4>dfmr1 RNAi2; Callan et al., 2012). All these studies are summarized in
Figure 24.
We first tested rescue animals (dfmr1.14/+; dfmr150M/50M) by injecting the GFI with TRITC-dextran
to assay projections. The rescue shows partial correction of the dfmr150M null phenotype, with fewer
projections present (dfmr150M projections/bend 9.5±0.8, Rescue 5.6±0.4; unpaired ANOVA with Tukey
post-hoc analysis, p=3.2x10⁻⁵; Fig. 24A,C). The rescue does not appear complete as more projections are
seen in the rescue condition than the w1118 background control (w1118 projections/bend 3.9±0.4; Fig.
24A,C), although this difference is not significant (unpaired ANOVA with Tukey post-hoc analysis, p=0.1).
The dfmr150M/+ heterozygotes show an intermediate synaptic projection phenotype, similar to the rescue
results (w1118 projections/bend 2.8±0.5, dfmr150M/+: 5.7±0.5, dfmr150M/dfmr150M: 8.3±0.7), with significant
differences in all comparisons (unpaired ANOVA with Tukey post-hoc analysis: w1118 v. dfmr150M/+
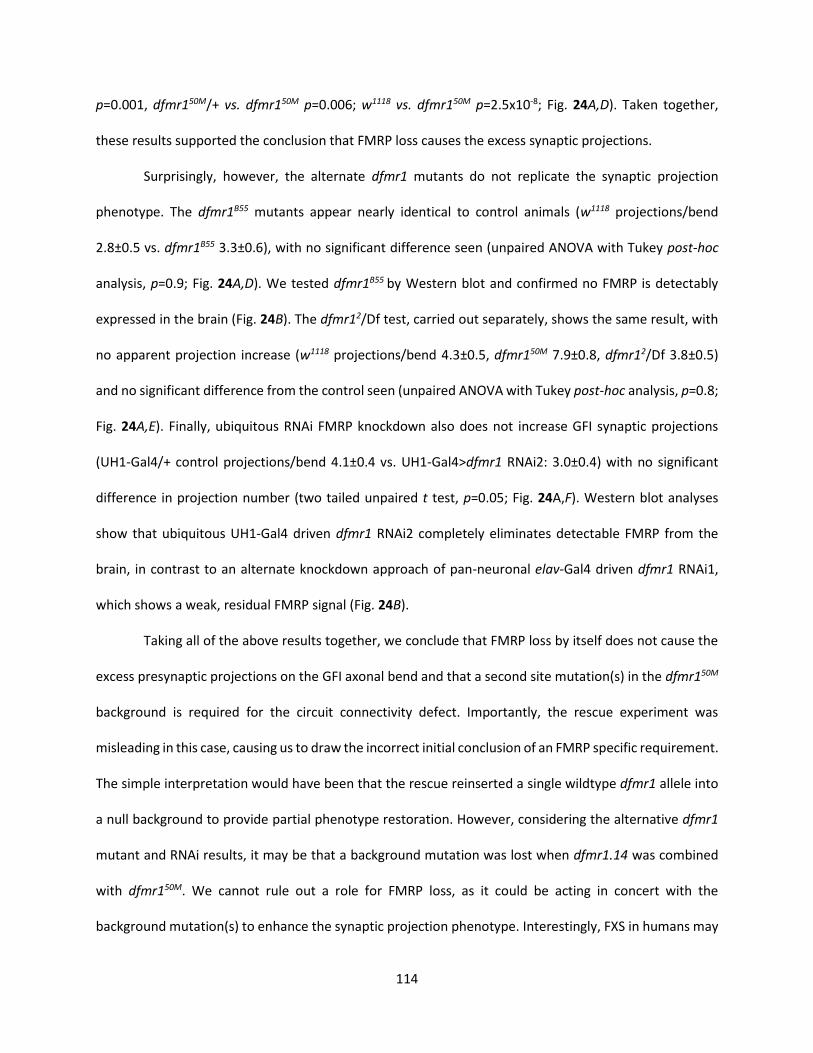
114
p=0.001, dfmr150M/+ vs. dfmr150M p=0.006; w1118 vs. dfmr150M p=2.5x10⁻⁸; Fig. 24A,D). Taken together,
these results supported the conclusion that FMRP loss causes the excess synaptic projections.
Surprisingly, however, the alternate dfmr1 mutants do not replicate the synaptic projection
phenotype. The dfmr1B55 mutants appear nearly identical to control animals (w1118 projections/bend
2.8±0.5 vs. dfmr1B55 3.3±0.6), with no significant difference seen (unpaired ANOVA with Tukey post-hoc
analysis, p=0.9; Fig. 24A,D). We tested dfmr1B55 by Western blot and confirmed no FMRP is detectably
expressed in the brain (Fig. 24B). The dfmr12/Df test, carried out separately, shows the same result, with
no apparent projection increase (w1118 projections/bend 4.3±0.5, dfmr150M 7.9±0.8, dfmr12/Df 3.8±0.5)
and no significant difference from the control seen (unpaired ANOVA with Tukey post-hoc analysis, p=0.8;
Fig. 24A,E). Finally, ubiquitous RNAi FMRP knockdown also does not increase GFI synaptic projections
(UH1-Gal4/+ control projections/bend 4.1±0.4 vs. UH1-Gal4>dfmr1 RNAi2: 3.0±0.4) with no significant
difference in projection number (two tailed unpaired t test, p=0.05; Fig. 24A,F). Western blot analyses
show that ubiquitous UH1-Gal4 driven dfmr1 RNAi2 completely eliminates detectable FMRP from the
brain, in contrast to an alternate knockdown approach of pan-neuronal elav-Gal4 driven dfmr1 RNAi1,
which shows a weak, residual FMRP signal (Fig. 24B).
Taking all of the above results together, we conclude that FMRP loss by itself does not cause the
excess presynaptic projections on the GFI axonal bend and that a second site mutation(s) in the dfmr150M
background is required for the circuit connectivity defect. Importantly, the rescue experiment was
misleading in this case, causing us to draw the incorrect initial conclusion of an FMRP specific requirement.
The simple interpretation would have been that the rescue reinserted a single wildtype dfmr1 allele into
a null background to provide partial phenotype restoration. However, considering the alternative dfmr1
mutant and RNAi results, it may be that a background mutation was lost when dfmr1.14 was combined
with dfmr150M. We cannot rule out a role for FMRP loss, as it could be acting in concert with the
background mutation(s) to enhance the synaptic projection phenotype. Interestingly, FXS in humans may
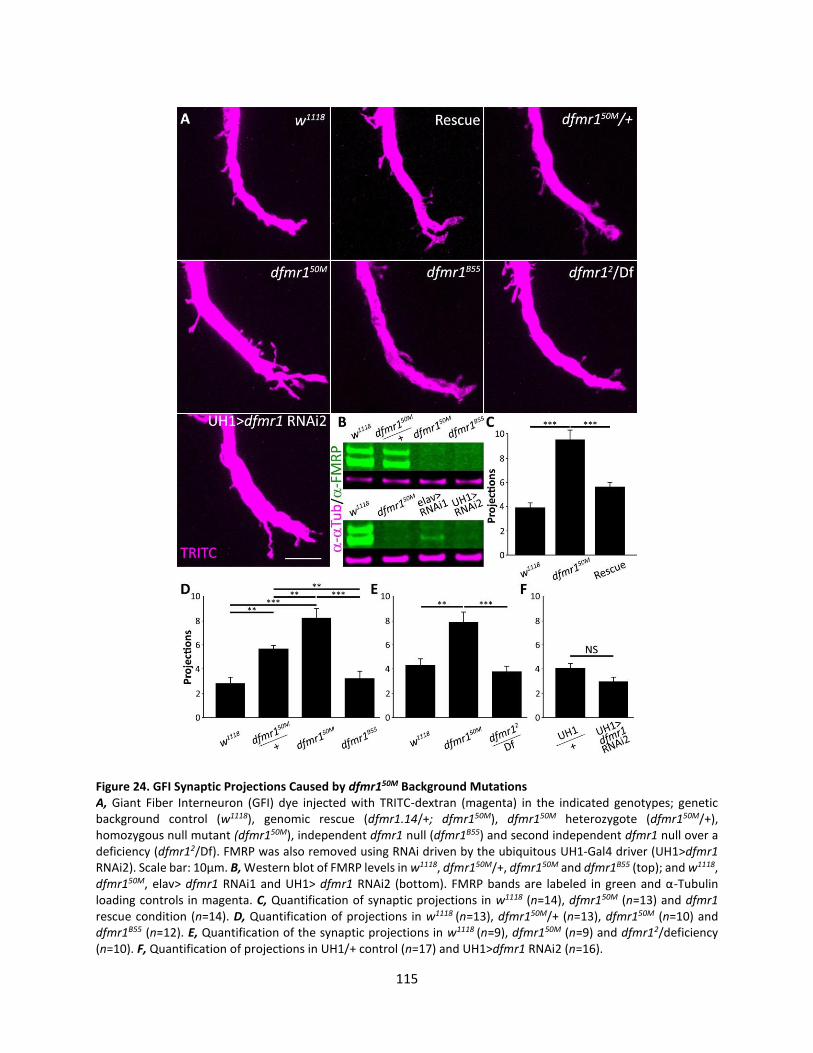
115
Figure 24. GFI Synaptic Projections Caused by dfmr150M Background Mutations A, Giant Fiber Interneuron (GFI) dye injected with TRITC-dextran (magenta) in the indicated genotypes; genetic background control (w1118), genomic rescue (dfmr1.14/+; dfmr150M), dfmr150M heterozygote (dfmr150M/+), homozygous null mutant (dfmr150M), independent dfmr1 null (dfmr1B55) and second independent dfmr1 null over a deficiency (dfmr12/Df). FMRP was also removed using RNAi driven by the ubiquitous UH1-Gal4 driver (UH1>dfmr1 RNAi2). Scale bar: 10µm. B, Western blot of FMRP levels in w1118, dfmr150M/+, dfmr150M and dfmr1B55 (top); and w1118, dfmr150M, elav> dfmr1 RNAi1 and UH1> dfmr1 RNAi2 (bottom). FMRP bands are labeled in green and α-Tubulin loading controls in magenta. C, Quantification of synaptic projections in w1118 (n=14), dfmr150M (n=13) and dfmr1 rescue condition (n=14). D, Quantification of projections in w1118 (n=13), dfmr150M/+ (n=13), dfmr150M (n=10) and dfmr1B55 (n=12). E, Quantification of the synaptic projections in w1118 (n=9), dfmr150M (n=9) and dfmr12/deficiency (n=10). F, Quantification of projections in UH1/+ control (n=17) and UH1>dfmr1 RNAi2 (n=16).
116
be related to such background effects, as severity of the disease symptoms present on a wide spectrum
(Spencer et al., 2006; Chonchaiya et al., 2009; Cordeiro et al., 2011). We have chosen to identify the
background mutation(s) as it may shed new light on the molecular players in synapse formation.
Identifying Background Mutation(s) Causing Excess GFI Synaptic Projections
As the w1118 background and dfmr150M mutant lines diverged many generations ago and have since
been subjected to an unknown number of crossing events, we suspected there would be a large number
of genetic differences between these two lines. We therefore chose to employ Bulk Segregant Analysis
(BSA) paired with whole genome sequencing (WGS) to identify the dfmr150M background mutation(s). BSA
has been successfully used to identify de novo mutations from divergent backgrounds in several
organisms, including yeast, flies, lettuce and apple trees (Michelmore et al., 1991; Lai et al., 2007;
Ehrenreich et al., 2010; Pool, 2016; Dougherty et al., 2018). We pursued this BSA strategy by inbreeding
the heterozygous offspring of a cross between w1118 and dfmr150M for 12 generations. We analyzed the
number of synaptic projections by GFI dye injection in the later generation animals and sorted them into
pools of low, medium and high phenotypes. A total of 239 animals were analyzed by single neuron dye
injection, from which 85 were selected for the low pool, 70 for the medium pool and 34 for the high pool.
The extracted DNA from these pools is currently undergoing WGS to identify enriched regions of the
genome in the medium and high pools relative to the low pool. Once the mutation(s) has been identified,
we intend to use lines from Drosophila stock centers to replicate and rescue the projection defects
identified here.
Discussion
We began this study by searching for neurons that could be used to probe mechanisms underlying
FXS excess synapse phenotypes (Comery et al., 1997; Zhang et al., 2001; Bilousova et al., 2009; Cruz-
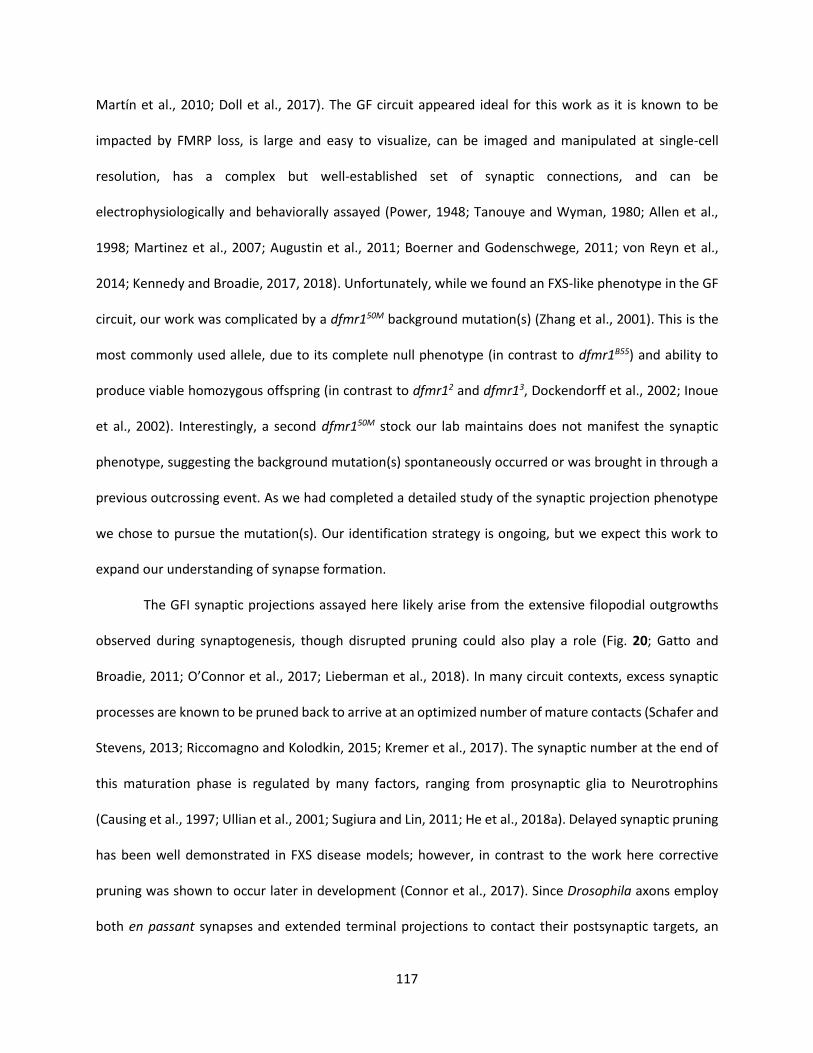
117
Martín et al., 2010; Doll et al., 2017). The GF circuit appeared ideal for this work as it is known to be
impacted by FMRP loss, is large and easy to visualize, can be imaged and manipulated at single-cell
resolution, has a complex but well-established set of synaptic connections, and can be
electrophysiologically and behaviorally assayed (Power, 1948; Tanouye and Wyman, 1980; Allen et al.,
1998; Martinez et al., 2007; Augustin et al., 2011; Boerner and Godenschwege, 2011; von Reyn et al.,
2014; Kennedy and Broadie, 2017, 2018). Unfortunately, while we found an FXS-like phenotype in the GF
circuit, our work was complicated by a dfmr150M background mutation(s) (Zhang et al., 2001). This is the
most commonly used allele, due to its complete null phenotype (in contrast to dfmr1B55) and ability to
produce viable homozygous offspring (in contrast to dfmr12 and dfmr13, Dockendorff et al., 2002; Inoue
et al., 2002). Interestingly, a second dfmr150M stock our lab maintains does not manifest the synaptic
phenotype, suggesting the background mutation(s) spontaneously occurred or was brought in through a
previous outcrossing event. As we had completed a detailed study of the synaptic projection phenotype
we chose to pursue the mutation(s). Our identification strategy is ongoing, but we expect this work to
expand our understanding of synapse formation.
The GFI synaptic projections assayed here likely arise from the extensive filopodial outgrowths
observed during synaptogenesis, though disrupted pruning could also play a role (Fig. 20; Gatto and
Broadie, 2011; O’Connor et al., 2017; Lieberman et al., 2018). In many circuit contexts, excess synaptic
processes are known to be pruned back to arrive at an optimized number of mature contacts (Schafer and
Stevens, 2013; Riccomagno and Kolodkin, 2015; Kremer et al., 2017). The synaptic number at the end of
this maturation phase is regulated by many factors, ranging from prosynaptic glia to Neurotrophins
(Causing et al., 1997; Ullian et al., 2001; Sugiura and Lin, 2011; He et al., 2018a). Delayed synaptic pruning
has been well demonstrated in FXS disease models; however, in contrast to the work here corrective
pruning was shown to occur later in development (Connor et al., 2017). Since Drosophila axons employ
both en passant synapses and extended terminal projections to contact their postsynaptic targets, an
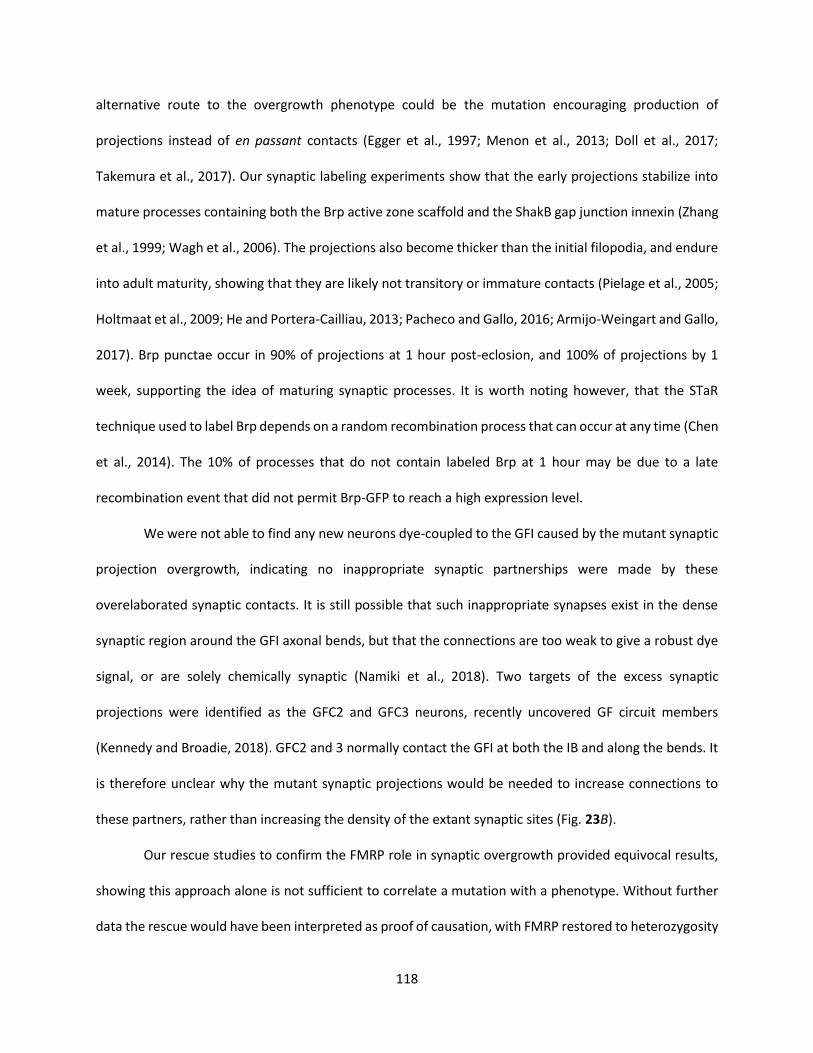
118
alternative route to the overgrowth phenotype could be the mutation encouraging production of
projections instead of en passant contacts (Egger et al., 1997; Menon et al., 2013; Doll et al., 2017;
Takemura et al., 2017). Our synaptic labeling experiments show that the early projections stabilize into
mature processes containing both the Brp active zone scaffold and the ShakB gap junction innexin (Zhang
et al., 1999; Wagh et al., 2006). The projections also become thicker than the initial filopodia, and endure
into adult maturity, showing that they are likely not transitory or immature contacts (Pielage et al., 2005;
Holtmaat et al., 2009; He and Portera-Cailliau, 2013; Pacheco and Gallo, 2016; Armijo-Weingart and Gallo,
2017). Brp punctae occur in 90% of projections at 1 hour post-eclosion, and 100% of projections by 1
week, supporting the idea of maturing synaptic processes. It is worth noting however, that the STaR
technique used to label Brp depends on a random recombination process that can occur at any time (Chen
et al., 2014). The 10% of processes that do not contain labeled Brp at 1 hour may be due to a late
recombination event that did not permit Brp-GFP to reach a high expression level.
We were not able to find any new neurons dye-coupled to the GFI caused by the mutant synaptic
projection overgrowth, indicating no inappropriate synaptic partnerships were made by these
overelaborated synaptic contacts. It is still possible that such inappropriate synapses exist in the dense
synaptic region around the GFI axonal bends, but that the connections are too weak to give a robust dye
signal, or are solely chemically synaptic (Namiki et al., 2018). Two targets of the excess synaptic
projections were identified as the GFC2 and GFC3 neurons, recently uncovered GF circuit members
(Kennedy and Broadie, 2018). GFC2 and 3 normally contact the GFI at both the IB and along the bends. It
is therefore unclear why the mutant synaptic projections would be needed to increase connections to
these partners, rather than increasing the density of the extant synaptic sites (Fig. 23B).
Our rescue studies to confirm the FMRP role in synaptic overgrowth provided equivocal results,
showing this approach alone is not sufficient to correlate a mutation with a phenotype. Without further
data the rescue would have been interpreted as proof of causation, with FMRP restored to heterozygosity

119
and giving an intermediate phenotype. However, knowing a background mutation is present, the result
can now be interpreted as the dfmr150M line creating a heterozygous phenotype with a “clean” rescue line
that lost the mutation. Even with homozygous rescue (i.e. dfmr1.14/dfmr.14; dfmr150M/50M), which
unfortunately is not possible due to inviability, we would likely have an uninterpretable result, as an
unintentionally “cleaned up” homozygous rescue would lack the background mutation and provide
apparent complete rescue. We ruled out FMRP as the sole mutation causing synaptic overgrowth through
three independent protein removal strategies: an alternative null, a null and deficiency transheterozygote
and an RNAi knockdown (Fig. 24). It is possible that FMRP loss interacts synergistically with the background
mutation and is required for the synaptic projection phenotype. If this is the case, we expect our BSA
results to show enriched dfmr150M mutation counts in medium and high projection pools (Michelmore et
al., 1991). Unidentified background mutations have been shown to interact with FMRP loss in mice,
creating learning defects and exacerbating autism-like behaviors (Paradee et al., 1999; Dobkin et al., 2000;
Spencer et al., 2011). Similarly, FXS patients show a range of symptom severities, believed to depend on
genetic modifiers (Hessl et al., 2001; Spencer et al., 2011). Thus, identifying interacting mutations here
may help explain some of the human FXS variability and provide novel therapeutic targets (Maurin et al.,
2014).
Based on the dfmr150M/+ results, we expect the background mutation operates via incomplete
dominance, with heterozygous expression leading to an intermediate phenotype (Muller, 1935; Crawford,
1976). Our experiments with recombined dfmr150M support the conclusion that the background mutation
is incompletely dominant. In each recombined case, synaptic projection number is lower than the pure
dfmr150M line (Fig. 19A, 21A, 22C vs. Fig. 19B, 22A, 24A). We suspect recombination events either removed
the mutation in one of the parental strains or diluted its frequency in the population, creating an
intermediate phenotype. It is also important to note that multiple background mutations could be causing
the phenotype, either additively or synergistically (Abrahams and Geschwind, 2008; Pérez-Pérez et al.,
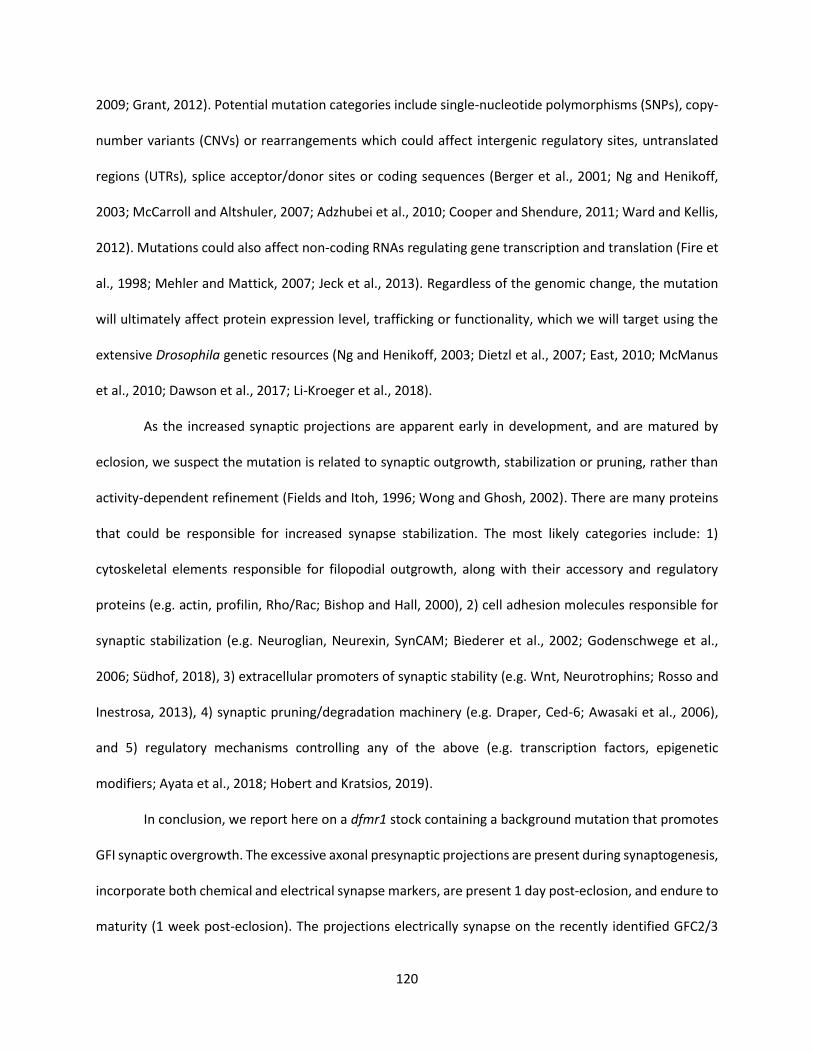
120
2009; Grant, 2012). Potential mutation categories include single-nucleotide polymorphisms (SNPs), copy-
number variants (CNVs) or rearrangements which could affect intergenic regulatory sites, untranslated
regions (UTRs), splice acceptor/donor sites or coding sequences (Berger et al., 2001; Ng and Henikoff,
2003; McCarroll and Altshuler, 2007; Adzhubei et al., 2010; Cooper and Shendure, 2011; Ward and Kellis,
2012). Mutations could also affect non-coding RNAs regulating gene transcription and translation (Fire et
al., 1998; Mehler and Mattick, 2007; Jeck et al., 2013). Regardless of the genomic change, the mutation
will ultimately affect protein expression level, trafficking or functionality, which we will target using the
extensive Drosophila genetic resources (Ng and Henikoff, 2003; Dietzl et al., 2007; East, 2010; McManus
et al., 2010; Dawson et al., 2017; Li-Kroeger et al., 2018).
As the increased synaptic projections are apparent early in development, and are matured by
eclosion, we suspect the mutation is related to synaptic outgrowth, stabilization or pruning, rather than
activity-dependent refinement (Fields and Itoh, 1996; Wong and Ghosh, 2002). There are many proteins
that could be responsible for increased synapse stabilization. The most likely categories include: 1)
cytoskeletal elements responsible for filopodial outgrowth, along with their accessory and regulatory
proteins (e.g. actin, profilin, Rho/Rac; Bishop and Hall, 2000), 2) cell adhesion molecules responsible for
synaptic stabilization (e.g. Neuroglian, Neurexin, SynCAM; Biederer et al., 2002; Godenschwege et al.,
2006; Südhof, 2018), 3) extracellular promoters of synaptic stability (e.g. Wnt, Neurotrophins; Rosso and
Inestrosa, 2013), 4) synaptic pruning/degradation machinery (e.g. Draper, Ced-6; Awasaki et al., 2006),
and 5) regulatory mechanisms controlling any of the above (e.g. transcription factors, epigenetic
modifiers; Ayata et al., 2018; Hobert and Kratsios, 2019).
In conclusion, we report here on a dfmr1 stock containing a background mutation that promotes
GFI synaptic overgrowth. The excessive axonal presynaptic projections are present during synaptogenesis,
incorporate both chemical and electrical synapse markers, are present 1 day post-eclosion, and endure to
maturity (1 week post-eclosion). The projections electrically synapse on the recently identified GFC2/3

121
neurons, causing hyper-connectivity within the GF circuit. The background mutation(s) identity is
currently being pursued and is expected to reveal a protein(s) involved in regulating synaptic connectivity
during circuit formation.

122
Chapter V
Conclusions and Future Directions
The work in this dissertation explores a number of GF circuit properties, from ionic flow in mature
neurons to synaptogenesis at the early stages of development. While these studies share a focus on the
same set of neurons, they are quite distinct from each other in subject matter. As such, they each have
their own set of conclusions and future directions, which will be laid out separately in this chapter. There
were also several supporting experiments and two uncompleted projects that were not published due to
time constraints or negative results. This data is included here either with the conclusions of the work it
was performed for, or in its own section if it was not tied to any published work.
Dye Injection
The finding that a single genetic mutation can alter neuronal dye loading properties is surprising
and appears to have no precedent in the literature. The only field that has considered electrically driven
ionic movement through biological tissues is trans-dermal electromigration, in which medicine is
delivered across the skin to the circulatory system (Marro et al., 2001; Pikal, 2001; Kalia et al., 2004).
However, no molecular level work has been done to explore the cellular properties that enhance or inhibit
this process. It still remains unclear how FMRP loss leads to increased dye loading, though the published
research reported here has narrowed down the possibilities. I took two parallel approaches to identify
the causative mechanisms underlying altered dye loading. First, I considered the known neuronal defects
caused by FMRP loss. This led to experiments on potassium channels, neuron size, and interneuronal
connectivity (Comery et al., 1997; Brown et al., 2010; Lee et al., 2011; Kong et al., 2014). Unfortunately,
none of these properties appears to play a role in the phenotype. The second approach was to identify

123
the physical cause of increased dye signal in the mutant neurons, and thus narrow down the potential
mechanisms involved in the phenotype. Three broad possibilities were considered: 1) dye leaked out of
neurons slower in mutants, 2) dye was destroyed or sequestered in controls, or 3) more dye leaves the
electrode to enter mutant neurons (Fig. 25A-C). My experiments effectively ruled out the first two options,
as applying more current or rest time after injection, did not alter the signal levels and there did not
appear to be any differential dye storage in the axons, dendrites or soma. The only remaining option was
that more dye leaves the electrode to enter mutant neurons than control neurons (Fig. 25C).
There are a range of physical properties that could alter dye release from the electrode. One
possibility is that there is simply more room for dye in the dfmr1 null neural circuit than in the control,
either because of larger neurons or a greater number of connected neurons. Similarly, there may be better
gap junction conductance between the neurons in dfmr1 mutants, allowing more dye to penetrate deeper
through the neural circuit during the injection (Fig. 25D). These hypotheses were ruled out in several ways.
First, no difference in neuron size was observed in dfmr1 mutants compared to controls. Axonal shafts
had no measurable size differences between the genotypes, nor did the primary dendritic branches.
Second, removing all gap junctions, leaving only the GFI to be injected did not correct the dfmr1
phenotype. Removal was accomplished with a mutant that lacks GFI specific isoforms of the ShakB gap
junction protein. We found that even when NB could not leave the GFI, more still accumulated in the
dfmr1 mutant than the control. Third removing KAc from the dye solution caused a major increase in dye
loading. This should not have been possible if the reduced dye loading in controls was caused by some
intrinsic “dye capacity” that was reached. Since more dye was easily loaded into control neurons when
KAc was removed we suspected that the rate of entry must be impacted rather than a threshold being
reached. We chose to explore what factors could limit the dye transfer speed, focusing first on cytosolic
ion movement as a potential mechanism.

124
Figure 25. Potential Mechanisms of Differential Dye Loading Many hypotheses for higher dye loading in mutants (dfmr150M) than controls (w1118) were tested. A. Dye leaks faster from controls than mutants. B. The dye is destroyed or sequestered away from the axon in controls. C. More dye enters mutants than controls. After A and B were ruled out, a number of hypotheses were tested to explain possibility C. These included D. the mutant neurons are larger or better connected to downstream neurons. E. Ion channel conductivity is altered in the mutant, with fewer chloride channels as an example here. Lower anion flow would favor cation flow, increasing neurobiotin (NB) transfer. F. Average anion size is increased in mutants, favoring cation flow out of the electrode. G. Viscosity in mutant neurons is increased through a denser network of inert molecules. This would slow ion flow and favor ion exit from the electrode.

125
To discuss this hypothesis, it is necessary to describe the electrochemistry of dye injection. The
work was conducted using two silver-chloride electrodes, one in the injection electrode and the other in
the bath. When these electrodes are connected to an electrical source one becomes positively charged
(cathode) and the other negatively charged (anode). This causes a reduction-oxidation reaction, with the
silver oxidized at the cathode, allowing it bind negatively charged chloride ions (Cl-), resulting in unpaired
positively charged sodium (Na+) ions (Ag0(S) + Cl-1(aq) + Na+1
(aq) -> AgCl(S) + Na+1(aq) + e-). At the anode, this
reaction happens in reverse (e- + Na+1(aq) + Cl-1(aq) + AgCl(S) -> Ag0
(S) + 2Cl-1(aq) + Na+1(aq)), with the difference
resolved as the ions migrate through the solution. For NB injection, the cathode was inserted in the GFI
with the anode in the bath. For LY injection, the polarity of the electrodes was switched, making the GFI
electrode an anode. Ions carry the charge between the electrodes and any impediment slows the ion flow,
raising the resistance. Similarly, if ions are larger, and thus less mobile, resistance is also increased. When
KAc was removed from the injection solution, the increased resistance of the circuit required a higher
voltage to keep the current constant due to the loss of the small potassium ions. However, without
potassium ions, NB carried more of the current, thus more moved into the neuron. The positive charge
generated in the injection electrode is offset either by anions (such as Cl-1) moving into the electrode or
cations (including NB) moving out. Typically, a mix of the two occurs, but if, for example, anion movement
toward the electrode were slowed, more cations would leave the electrode to compensate. Based on this
logic, there were two possibilities for elevated dye loading in dfmr1 null neurons: 1) a specific impediment
to the ions is present, such as restricted flux across the neuronal membrane’s channels (Fig. 25E), or 2)
ion speed through the aqueous environment is restricted, because of increased friction (Fig. 25F,G). The
bulk of my experiments tested the first option, as it was initially deemed more likely and had more ties to
FMRP loss. However, the data, as described below, seems to better support the second option.
I first applied a potassium channel blocker (4-AP) to determine whether potassium flow affects
dye loading. The drug reduced dye loading in both genotypes, albeit with maintained higher dye transfer

126
in dfmr1 mutants. This suggested potassium flow plays a role in dye loading. However, follow-up
experiments with 4-AP applied after the dye injection caused the same result of lowering dye transfer,
suggesting 4-AP interferes with a separate process. 4-AP contains a primary amine group, the target of
formaldehyde fixation, which could reduce the amount of NB covalently linked to the tissue (Thavarajah
et al., 2012). However, attempts to test this hypothesis, such as washing out 4-AP extensively before fixing
or using longer fix times, were unsuccessful in preventing this effect. The potassium channel blocker TEA
also reduced dye transfer across genotypes; however, rinsing prior to fixing corrected this effect, and the
drug showed no overall effect on either genotype. Importantly, TEA does not contain a primary amine and
it is unclear how it interferes with the dye signal. Together, these studies suggest potassium channels are
not related to the phenotype, despite extensive interactions with FMRP (Brown et al., 2010; Strumbos et
al., 2010; Lee et al., 2011). Consistently, both endogenous potassium channels (Shaker cognate w (Shaw),
and Inwardly rectifying potassium channel 2 (Irk2)) and exogenous cation-permeable ChR also had no
impact on the dfmr1 phenotype. However, it was not possible to test how effective any of these
manipulations were on decreasing or increasing potassium flow, thus the channel hypothesis cannot be
fully ruled out.
Restricted anion flow across the neuronal membrane could also increase dfmr1 mutant dye
loading, as it would increase the flow of cations out of the electrode through increased resistance. In
unpublished experiments, I attempted to modify the flow of the primary neuronal cation, chloride, across
the plasma membrane through various methods including replacing chloride with larger, less mobile
anions such as acetate, propionate or iodine, or applying the chloride channel blocker 9-
Anthracenecarboxylic acid (9-AC, Estévez et al., 2003; Ugarte et al., 2005). Replacing chloride with the
larger acetate ion increased dye loading in both genotypes, suggesting a role for ion mobility. A
mechanism similar to the removal of KAc may be at play here, where loss of the small chloride anion
increases average anion size, making it harder for anions to flow and favoring cationic NB leaving the
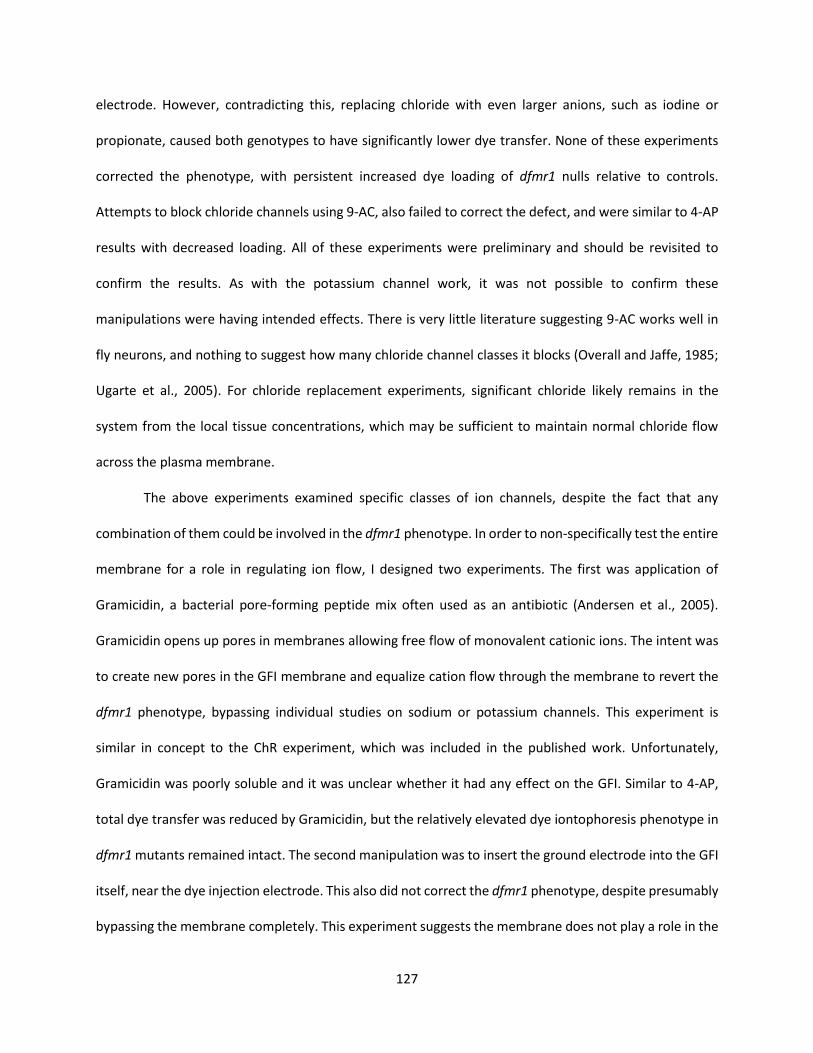
127
electrode. However, contradicting this, replacing chloride with even larger anions, such as iodine or
propionate, caused both genotypes to have significantly lower dye transfer. None of these experiments
corrected the phenotype, with persistent increased dye loading of dfmr1 nulls relative to controls.
Attempts to block chloride channels using 9-AC, also failed to correct the defect, and were similar to 4-AP
results with decreased loading. All of these experiments were preliminary and should be revisited to
confirm the results. As with the potassium channel work, it was not possible to confirm these
manipulations were having intended effects. There is very little literature suggesting 9-AC works well in
fly neurons, and nothing to suggest how many chloride channel classes it blocks (Overall and Jaffe, 1985;
Ugarte et al., 2005). For chloride replacement experiments, significant chloride likely remains in the
system from the local tissue concentrations, which may be sufficient to maintain normal chloride flow
across the plasma membrane.
The above experiments examined specific classes of ion channels, despite the fact that any
combination of them could be involved in the dfmr1 phenotype. In order to non-specifically test the entire
membrane for a role in regulating ion flow, I designed two experiments. The first was application of
Gramicidin, a bacterial pore-forming peptide mix often used as an antibiotic (Andersen et al., 2005).
Gramicidin opens up pores in membranes allowing free flow of monovalent cationic ions. The intent was
to create new pores in the GFI membrane and equalize cation flow through the membrane to revert the
dfmr1 phenotype, bypassing individual studies on sodium or potassium channels. This experiment is
similar in concept to the ChR experiment, which was included in the published work. Unfortunately,
Gramicidin was poorly soluble and it was unclear whether it had any effect on the GFI. Similar to 4-AP,
total dye transfer was reduced by Gramicidin, but the relatively elevated dye iontophoresis phenotype in
dfmr1 mutants remained intact. The second manipulation was to insert the ground electrode into the GFI
itself, near the dye injection electrode. This also did not correct the dfmr1 phenotype, despite presumably
bypassing the membrane completely. This experiment suggests the membrane does not play a role in the

128
dfmr1 defect, and that the source of the dye transfer phenotype is completely cytosolic. Aside from these
experiments, another complication for the channel hypothesis is that the anionic dye LY, also displays the
same dfmr1 null phenotype. If anion flow were impaired in dfmr1 nulls, then the LY dye should have
trouble getting out of the electrode, as the local neuronal anions need to be displaced out of the cell. One
could make the argument that both anion and cation flow into the cell is reduced in dfmr1 null mutants,
but this would require two separate channel defects, or one channel responsible for the movement of
both types of ion, which is not supported by any of the above evidence.
The experiments listed above ruled out a wide range of physical properties that could be causing
elevated dye loading in dfmr1 mutants, including neuron size and connectivity. The process of elimination
therefore suggests that altered ionic mobility is responsible (Fig. 25F, G). As noted, some of the above
experiments are not wholly conclusive; however, based on the
accumulated data, I believe the best route to pursue the differential
dye loading mechanism would be to study whether ion mobility
though the cytoplasm is responsible. Ion size could be tested by
preloading large anions such as LY into the GFI, followed by a normal
NB injection. If the presence of a large anion increases NB loading, this
would suggest cytosolic ion size impacts dye loading (Fig. 25F). Similar
experiments could be performed by modifying the amount of ionic
proteins within the GFI using the Gal4/UAS system. If the hypothesis
is correct, overexpression of negatively charged cytosolic proteins
should lead to increases in NB loading. The next step would be to
identify the large ions that have increased in concentration in the
dfmr1 nulls. Proteins are the obvious culprit, but it isn’t clear that proteins are generally overexpressed in
the Drosophila FXS model. It was suggested in my paper that the increased protein levels seen in dfmr1
Figure 26. Brain Size is Increased in dfmr150M Animals Quantification of brain size by whole-brain confocal imaging shows dfmr150M causes approximately a 20% increase in tissue volume.
129
nulls could be the cause of the dye loading phenotype; however, further experiments showed that while
dfmr1 nulls do indeed have increased protein over controls, their brains are also larger, at about the
proportion seen for the protein increase: ~20% (Fig. 26). This suggests that protein concentration in
neurons between the genotypes may be equivalent, but the tissue size is different, indicating increased
protein concentration is not at fault. Metabolites are another potential source of large ions. Metabolic
screening has become an advanced field in recent years and these techniques could be used to identify
differentiated product levels in the neuronal cytosol, which could then be traced back to an FMRP
pathway (Zampieri et al., 2017).
Another means of slowing ion movement could be increasing cytosolic viscosity (Fig. 25G). This is
an attractive solution to the differential dye transfer mechanism as it provides a simple answer to the
observation that both NB and LY are impacted. Viscosity would be non-specific to ionic charge, and thus
provides a parsimonious answer to how NB and LY are both impacted. To test for a viscosity role, I injected
LY into droplets of saline containing increasing concentrations of sucrose, and thus higher viscosities. I
live-imaged the process and quantified dye loading over one minute. The results show more viscous
solutions take up more dye, supporting the hypothesis that ion mobility in the receiving solution impacts
dye loading (Fig. 27). This work could be expanded by performing Fluorescent Recovery After
Photobleaching (FRAP) experiments, monitoring GFP diffusion in GFI neurons to determine if controls and
dfmr1 nulls alter protein mobility (Day et al., 2012). Longer recovery times would indicate slowed GFP
diffusion. Were this the case, it would be necessary to identify the cause for the altered mobility.
Cytoskeletal and macromolecular structures are known to play roles in cytosol viscosity, and would be
good targets for the next step in this research (Luby-Phelps, 1999; Yu et al., 2017). Interestingly, links
between FMRP and the microtubule stabilizing protein MAP1B/Futsch are well established, with FMRP
loss causing increased MAP1B/Futsch expression (Zhang et al., 2001; Zalfa et al., 2003; Lu et al., 2004).

130
Increased cytosolic viscosity would have serious implications for any cell, as they are highly dependent on
directed resource transport and diffusion of secondary messengers and metabolites (Periasamy et al.,
1992; Verkman, 2002). If these processes are slowed due to increased viscosity in dfmr1 null neurons,
there would be significant disruptions to their development and function, potentially explaining some FXS
symptoms.
Before leaving this topic, it is worth acknowledging that the dfmr150M line used in this work
contains background mutations not related to the target gene (dfmr1), as shown in Chapter 4. This raises
the question of whether the dye injection phenotype was truly caused by FMRP loss in the first place. The
published evidence, with trans-heterozygous null alleles for dfmr1 and a dfmr1 rescue experiment,
strongly suggest FMRP is the culprit; however, no experiments were performed where the dfmr150M allele
was not included. The recombination used to make the rescue line could theoretically have
unintentionally removed a background mutation. If the dye transfer phenotype turned out to be caused
by a background mutation, it would still be worthwhile to pursue, as it does seem that an important
Figure 27. LY Dye Loading into Sucrose Droplets Injected LY signal was measured over time in saline droplets with increasing concentrations of sucrose. The results suggest higher viscosity leads to higher dye transfer from the glass electrode into the saline. Each point represents the average of at least 9 experiments.

131
neuronal property is being probed by the dye injection protocol. Should alternative alleles fail to replicate
the results found here, a similar BSA-sequencing approach to that taken in Chapter 4 could be employed
to identify the causative mutation behind the altered dye loading.
Circuit Mapping the Giant Fiber System
Studying the dye injection pattern of the GF circuit revealed an extensively dye-coupled neuron
network. The GF circuit is likely reflective of most circuits in complex brains, where high degrees of
interconnectivity permit communication with, and modification of, neighboring circuits (Arber, 2012;
White et al., 2017; Kodama et al., 2018). The goal of my study was to identify single-neuron drivers for the
newly identified members of the GF circuit, which could then be used for future research on electrical
synapse formation and function. I was able to identify Gal4 drivers for four new neuron clusters within
the GF circuit, creating a new toolkit (Kennedy and Broadie, 2018). In this section, I describe the remaining
work in characterizing these neurons, and suggest questions they can be used to answer.
While the GFC neuron clusters are well defined in my work, the individual neuron structure is not
yet resolved. GFC1 appears to have a simple morphology with defined axonal and dendritic regions, while
GFC2 is more convoluted with apparently combined pre- and postsynaptic compartments. GFC3/4 seem
more straightforward, though they both have a number of intertwining neurons that made it difficult to
determine whether all neurons in the clusters share the same synaptic connections. GFC4 requires more
defined drivers to better image and manipulate these neurons, which may be available already in the
existing spGal4 driver collections. The best available strategy to image individual neurons within GFC
clusters is MultiColor FlpOut (MCFO; Nern et al., 2015). MCFO is a gene cassette with a UAS sequence
upstream of two Flippase (Flp) Recombination Targets (FRT) sites that flank a stop codon, and a
downstream fluorophore sequence. Low Flp expression randomly causes the FRT sites and the stop codon
to be removed, allowing fluorophore expression in subsets of Gal4 containing neurons. By combining the
132
GFC1-4 drivers with the MCFO cassette, single neurons within GFC clusters will be labeled, allowing their
structure to be independently visualized.
Characterizing the individual neurons in the GFC clusters would give more information on the
nervous system regions each neuron projects to, and thus suggest potential synaptic targets. However, in
order to identify the actual targets of these neurons, other connectivity tracing tools are also required.
The recently released trans-Tango transgenic system would be ideal for this purpose (Talay et al., 2017).
Trans-Tango uses several genetic elements to trigger expression of a fluorophore in cells downstream of
a neuron of interest. A presynaptic protein localizes a transgenic ligand to the membrane, which, when in
contact with a postsynaptic receptor, initiates RFP production in the downstream neuron (Talay et al.,
2017). Revealing the structure of the GFC neurons’ downstream targets would permit their identification
in the same manner as was used for the GFC neurons themselves (Kennedy and Broadie, 2018). While this
tool has performed well in others’ hands, my attempts to use trans-Tango in the GF circuit have not been
successful. Expression of the presynaptic component in the GFI and the postsynaptic components pan-
neuronally did not reveal any of the known GFI targets, instead labeling numerous uncharacterized
neurons. It is unclear why the tool was ineffective. One possibility is the protein used to presynaptically
localize the tool, Nrx, does not normally exist in the GFI, and cannot be properly trafficked. Another
possibility is that the pan-neuronal driver used does not express well in the GFI targets. While this seems
unlikely, it has been reported that the pan-neuronal nSyb-Gal4 driver does not express in the GFI,
suggesting GF neurons may differ from other neurons in some ways (Namiki et al., 2018). Regardless, this
tool may still be effective in some of the GFC neurons and could help complete the GF circuit map and
identify the role of the GFCs in the circuit by finding their targets.
The GFC target neurons likely control some aspect of Drosophila behavior and the next step after
identifying these neurons is the identification of the muscles they control. One approach is to activate GFC
neurons and assay behavioral outputs. My preliminary efforts at GFC stimulation via multiple ChR forms
133
were unsuccessful in eliciting behavior, suggesting these neurons may not have strong control over muscle
movement, or require specific stimulation paradigms or coincident activation. A first approach to
exploring the function of these neurons could be to stimulate them before, during or after GFI stimulation
to test for a modified escape response. For example, one could activate GFC neurons prior to the GFI to
see if this alters the strength of the jump response. Another approach would be to image GFC neuron
responses via GCaMP calcium reporters while triggering the GFI with electrical or ChR stimulation to
determine how these neurons respond to GF circuit activity (Nagel et al., 2003; Akerboom et al., 2012).
Taking the response pattern and replicating it with direct GFC ChR stimulation could trigger their
behavioral output. Alternatively, GFC neurons could be killed using UAS-hid apoptosis, and the GFI could
be triggered to test if any aspects of the behavior are diminished or enhanced (Kennedy and Broadie,
2018). Another approach to characterizing GFC roles would be to identify their neurotransmitters. The
primary excitatory neurotransmitter in Drosophila CNS is acetylcholine (ACh), in contrast to glutamate in
vertebrates (Yasuyama and Salvaterra, 1999; Liu and Wilson, 2013). If these neurons use ACh they may
function as excitatory interneurons, while glutamate would suggest they act as motor neurons. GABA
would suggest roles in silencing other neurons, and modulatory neurotransmitters such as dopamine,
would imply functions that adjust responsiveness in their targets (Kim et al., 2017). Staining the brains for
the enzymatic producers of these neurotransmitters and examining the GFC somas could quickly reveal
which neurotransmitters are expressed.
These newly identified neurons could also be used to study GF circuit development. Circuit
stabilization is believed to be mediated trans-synaptically, with synaptic activity maintaining neuronal
connections (Luo and O’Leary, 2005; Pielage et al., 2008). Curiously, my work showed loss of only 1 out of
the 6 GFI targets was sufficient for a GFI to retract and presumably die. Loss of the GFI often caused the
GCI to be lost or disconnected as well, despite numerous known GCI partners (Mu et al., 2014). This is in
contrast to NMJ retraction studies where the neuron only has one target and it is reasonable to expect
134
retraction when that target is lost (Valakh et al., 2012). It was not confirmed that GFI or GFC were killed,
only that they lost dye coupling (Phelan et al., 2008). Future experiments using GFI/GCI GFP expression
could test for neuronal survival. Regardless, this work suggests a single neuronal partner can control GFI
fate, or that all members of a circuit must be present for a central neuron to maintain itself. Follow up
experiments could test how the GFI responds to the loss of GFC2-4, the TTMn and the PSI. It would also
be appropriate to determine when the GFI retracts. If this occurred during development it would suggest
an anchoring mechanism was at play, while adulthood retraction could suggest an activity-based
mechanism. An RNAi screen could come from this work, with candidate genes knocked down in GFC1 or
the GFI to determine the proteins used in neuronal maintenance and identify new players in this process.
I also found that the GFI can compensate for a lost partner by contralateral extension of an axonal bend
but there is little research on the molecules involved in such compensation (Neuhaus-Follini and Bashaw,
2015). A complementary candidate screen could be designed to identify the molecular players in this
compensation process.
Another interesting use of these neurons would be a proteomic screen for molecules used in
target recognition during circuit formation. Now that six separate GFI targets are known, it may be
possible to isolate the proteins used for partner recognition. One way to go about this would be to label
the GFI and a specific partner with red and green fluorophore, respectively, and then track when these
two neurons first contact. At this timepoint, synaptosomes could be isolated and FACs sorted for particles
containing both fluorophores. The synaptosomes should contain both pre- and postsynaptic membranes
as they generally adhere during the extraction (Luquet et al., 2017). The synaptosomes could then be
analyzed via mass-spectrometry to identify the proteins contained in their membranes at this time point
(Schreiner et al., 2017). By repeating this process with each of the six GFI partners, a comparative
approach could be taken to identify the code used for each targeting event. If differences are seen,
fluorescently tagged versions of the proteins could be introduced into the GFI to determine whether these

135
proteins indeed localize specifically to one partner’s synaptic zone. For example, if the GFI used different
target recognition proteins for the PSI and TTMn, one would expect those proteins to localize specifically
to the IB or GFI bend during target recognition, respectively. Using these neurons for comparative
research on neural circuit development and function should prove fruitful in determining the range of
molecules different neurons use to accomplish different tasks.
Identification of Background Mutations in the dfmr150M Line
Genetic background is notoriously difficult to control, even in inbred lab strains, which can lead
to a misinterpretation of research findings (Bailey, 1982; Gerlai, 1996). In Drosophila, lines are usually
recombined and rebalanced many times throughout experimental work, bringing in new SNPs, deletions
and rearrangements (Platts et al., 2009). While most background changes have no impact on the
phenotype under study, it is critical to employ the proper controls and ensure this is the case. This means
using multiple mutant alleles, verifying results with alternate knockdown methods (such as RNAi), and
performing genetic rescue experiments (Chandler et al., 2013). Constant outcrossing with a control line
can remove most background mutations but this is extremely time consuming and usually impractical,
especially when working with many different genetic tools as is common in Drosophila. Another pernicious
possibility is that the phenotype under study comes from the control line rather than the mutant. Using
multiple alleles for the mutant will not be able to identify this problem, as they will incorrectly reinforce
that a mutant phenotype exists. This problem requires using alternate control lines (such as Oregon-R or
Canton-S as alternatives for w1118) or wild-caught strains (Spencer et al., 2003; Yuan et al., 2006). These
strategies should be implemented early to ensure a study is not following non-specific mutations and
wasting valuable time and resources.
In my study on GF circuit synaptogenesis, late implementation of these controls caused a
significant delay in work and many incorrect assumptions that changed the course of my research. It is

136
worth noting that the mutation I identified appeared to be present in only one of the dfmr150M lines our
lab maintains. Unfortunately, I did not have a chance to test the dfmr150M line that is stored in the
Drosophila Bloomington stock center, so I cannot be sure whether this mutation is being used by the
greater FXS community or arose through an event in our lab. It is important to make this distinction so
researchers can decide whether they should reevaluate some of the dfmr1 phenotypes they have
characterized (Pan et al., 2004; Tessier and Broadie, 2008; Yao et al., 2011; Liu et al., 2012; Coyne et al.,
2015; Doll and Broadie, 2015; Novak et al., 2015). Regardless of whether this particular mutation is in
other stocks, my work shows that it is possible for non-specific mutations to crop up unexpectedly in any
Drosophila line and confound results. In this unfortunate circumstance, it may still be worth pursuing the
unknown mutation causing the interesting phenotype. Sequencing has become cheap enough that most
labs can afford to pursue the BSA-WGS approach taken in Chapter 4 (Shendure et al., 2017). Phenotypes
that are correlated with novel genes and mutations can be cross referenced with large patient databases,
such as BioVU, to help identify new links to genetic disorders (Roden et al., 2008). In some instances, there
may even be benefits to the original field of study. As noted earlier, FXS may be exacerbated by
background mutations that have not been identified yet. If some of the phenotypic variability in FXS
models comes from background mutations that interact with FMRP, it should be possible to identify those
genes, and potentially target them pharmacologically in FXS patients to correct aspects of the disorder.
Unfortunately, the identity and properties of the dfmr150M background mutation(s) was not
determined in time to include in this dissertation. If the mutation can be successfully identified by BSA-
WGS there are a number of follow-up experiments that will be informative. This research focused solely
on synaptic outgrowths from the GFI axon bends; however, there did seem to be excessive growth at the
IB as well. While this wasn’t subjected to any formal analysis, due to the complexity of these outgrowths,
the IB region would be worth examining if this project is continued. Synaptic overgrowth in a second GFI
region would mean this phenotype is not specific to one set of synapses but affects multiple presynaptic

137
regions. From here, the extent of this phenotype throughout the nervous system should be evaluated. Is
this a GFI-specific effect or is it universal that alterations to the protein cause hyper-connectivity?
Interestingly, early in my graduate work I studied the GFI dendrites extensively for synaptic overgrowth
and found evidence that dfmr150M caused overgrowth there as well (Fig. 28). This suggests other synaptic
partners are also subject to the mutation’s effects. The dendritic arbor is much more complex and variable
than the axonal bends however, and I pursued the axon phenotype due to simpler quantification.
Many other experiments remain for the characterization of these background mutations. The
upcoming work involves confirming that this protein is the true cause of the synaptic overgrowth
phenotype. This will involve studying the identified mutation in isolation to confirm the phenotype. Ideally
such mutations already exist in the Drosophila stock centers, but new lines may have to be generated
through CRISPR if not (Port et al., 2014). A rescue experiment is also required to attempt to correct the
phenotype in dfmr50M by expressing a functional version of the protein at appropriate levels. There also
remains the possibility that the phenotype arises from multiple mutations working additively or
synergistically (Pérez-Pérez et al., 2009). If
this is the case, each of the mutations will
have to be tested on their own and in
combination to study how they interact.
The mechanisms underlying these proteins’
abilities to modify the localization of
synaptic connections also requires a much
deeper level of study. The localization of
this protein throughout development
should be tracked using CRISPR inserted
fluorophore tags (Baena-Lopez et al., 2013).
Figure 28. dfmr150M Causes Overgrowth in Dendrites GFP was expressed in the GFI dendrites via the 91H05-Gal4 driver. Quantification of processes extending from the main branches showed a significant increase in the mutant over the control.
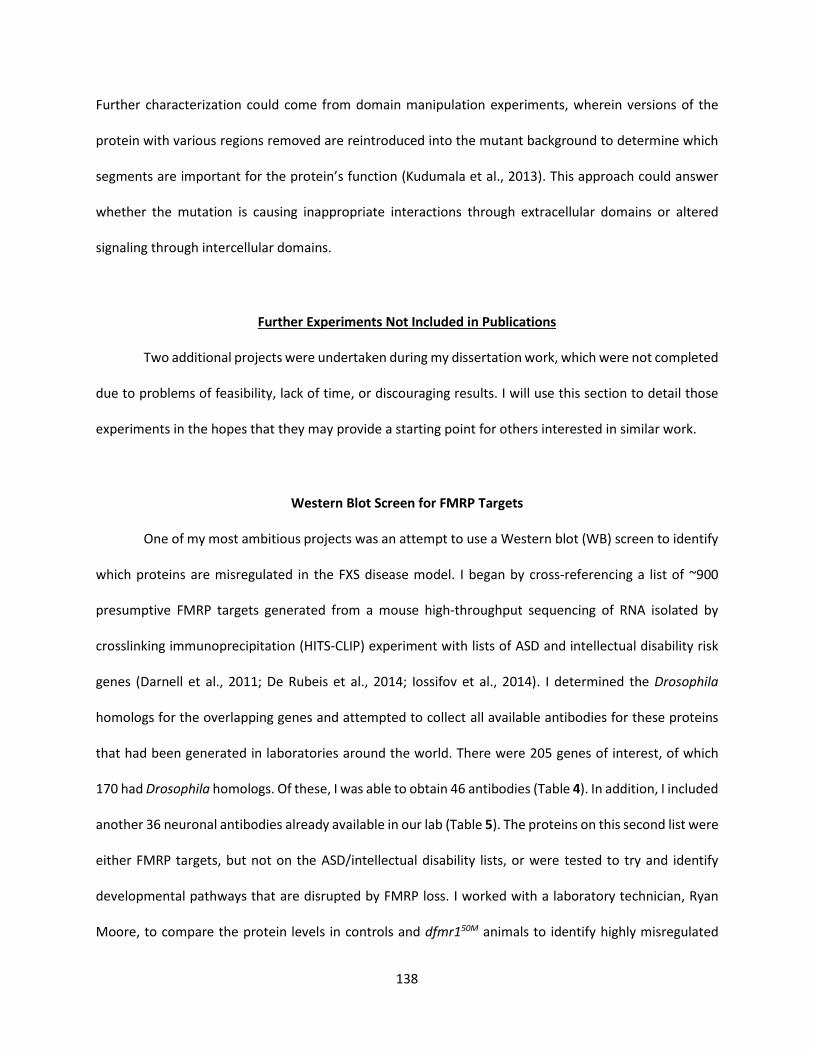
138
Further characterization could come from domain manipulation experiments, wherein versions of the
protein with various regions removed are reintroduced into the mutant background to determine which
segments are important for the protein’s function (Kudumala et al., 2013). This approach could answer
whether the mutation is causing inappropriate interactions through extracellular domains or altered
signaling through intercellular domains.
Further Experiments Not Included in Publications
Two additional projects were undertaken during my dissertation work, which were not completed
due to problems of feasibility, lack of time, or discouraging results. I will use this section to detail those
experiments in the hopes that they may provide a starting point for others interested in similar work.
Western Blot Screen for FMRP Targets
One of my most ambitious projects was an attempt to use a Western blot (WB) screen to identify
which proteins are misregulated in the FXS disease model. I began by cross-referencing a list of ~900
presumptive FMRP targets generated from a mouse high-throughput sequencing of RNA isolated by
crosslinking immunoprecipitation (HITS-CLIP) experiment with lists of ASD and intellectual disability risk
genes (Darnell et al., 2011; De Rubeis et al., 2014; Iossifov et al., 2014). I determined the Drosophila
homologs for the overlapping genes and attempted to collect all available antibodies for these proteins
that had been generated in laboratories around the world. There were 205 genes of interest, of which
170 had Drosophila homologs. Of these, I was able to obtain 46 antibodies (Table 4). In addition, I included
another 36 neuronal antibodies already available in our lab (Table 5). The proteins on this second list were
either FMRP targets, but not on the ASD/intellectual disability lists, or were tested to try and identify
developmental pathways that are disrupted by FMRP loss. I worked with a laboratory technician, Ryan
Moore, to compare the protein levels in controls and dfmr150M animals to identify highly misregulated

139
targets. Protein changes were tested in the head at three different time points: the early (tan) pupae stage
(25-60 hours pupation), the late (dark) pupae stage (60-90 hours pupation) and adult. The goal was to
identify proteins transiently misregulated in development as well as adult stages (Tessier and Broadie,
2012).
a-Spec Ato Cher Dlg Foxo Jim MMP1 Nr2 Rhea Scar Stau Timp
Arm Bap Cora Fas Gro Ken MMP2 Nrg Rho1 Shot Syn Toy
Atf-2 Cf2 Cut Fas2 Hts Lilli Nr1 Pum Scar Stan Tgo Zif
Table 5. Alternative Neuronal Targets Tested in FMRP Western Blot Screen These targets were selected due to their importance in neuronal development and function as well as the accessibility of the antibodies. Some of these proteins are FMRP targets but were not identified in ASD/intellectual disability gene lists. The remaining targets were expected to help identify the pathways disrupted by FMRP loss.
This project unfortunately suffered several setbacks and did not result in high quality targets. One
major shortcoming of this work was difficulties with protein extraction. Many WB protein extraction
protocols exist, but they are typically specific to the species, tissue and protein of interest, requiring
optimization for each new experiment. For example, membrane proteins are notoriously difficult to
extract and maintain in solution and typically require different extraction protocols from cytosolic proteins
(MacPhee, 2010). Unfortunately, during a screen, fully accommodating such specific requirements is not
possible, and a generic protocol must be applied due to time limitations. The extraction method used for
this screen, an LDS buffer combined with mechanical grinding, was chosen because it provided a relatively
A CaMKII Dcr-2 Her Kug Nej Nlg3 Nrv2 Pink1 RhoGEF2 Spg Trio
Als2 Csw Galphao Ih Lap Nf1 Nlg4 Nrv3 PlexA RyR Sti X11L
Ank2 Cv-c Gek Itp-r83a Lar Nlg1 Nmdar2 Nrx-1 PlexB Sbf Syt7
Calx Dcr-1 Gig Kis Ndae1 Nlg2 Nrv1 Pat Pten Sick Tor
Table 4. Known FMRP Targets for Western Blot Screen These targets were selected from a cross-referenced list between human FMRP targets and known autism/ intellectual disability associated genes. This final list of Drosophila homologs contains those targets for which an antibody was available.

140
swift protocol with some ability to extract and stabilize membrane proteins. While this method showed
strong yield during preparation for this project, I did not explore how reliable the extraction process was
before beginning the screen. During follow up work on favorable targets, I used more rigorous controls
and found that the technique had been giving highly variable extraction efficiencies, even for cytosolic
proteins. This unexpected source of variability made it impossible to trust the data from the screen as
differences in protein levels could either be due to differences in FMRP regulation or inefficient
extractions. I designed a more effective extraction protocol for later work, testing multiple extraction
buffers and cell disruption methods to maximize reproducibility. Interestingly, even using the best
protocol I could design based on the literature and available equipment (RIPA buffer and ultrasonic
sonicator), I still found replicates could be twice the value of other samples in the set. Such results suggest
that WB variability is too large to detect moderate protein changes and may only be appropriate for
quantifying much larger shifts.
There were other protocol issues in this work that should have been worked out prior to
implementation. Protein quantification was performed by radiometric quantitation of fluorescent signal
(measuring the net fluorescent signal coming from each band). This signal is linear over certain ranges but
becomes non-linear at low or high levels of protein. It is important to ensure that signal is within the linear
range when performing quantification experiments to ensure measurements are correct (e.g. a doubling
of loaded protein should cause a doubling of signal). This requires performing a calibration curve with
each antibody to determine the appropriate analysis range. Again, this would have been too much work
for all of the antibodies in this screen, but a rough approximation of proper loading levels could have been
performed for high and low level targets in order to avoid the extreme regions of signal loss. An issue at
the intersection of extraction efficiency and linear range is loading controls. The loading control is a
protein in the sample which is not expected to be affected by the treatment, typically a housekeeping
gene. Measuring the level of this protein can indicate whether the extraction efficiency and total protein

141
loaded onto a gel is equivalent between conditions. If not, the samples can be corrected against the
loading control to make them comparable. Alpha-tubulin is a commonly chosen loading control, especially
in FXS models as it is believed not to be regulated by FMRP (Zhang et al., 2001). However, alpha-tubulin
is a highly abundant protein and is typically saturated at the loading levels required for most other
proteins. Using a protein with saturated signal to correct the loading of other proteins is ineffective, as
altered levels of extraction or loading will not be faithfully reported by the control. I believe use of tubulin
here to normalize signal masked the variable protein extraction efficiencies and was not appropriate for
this work. Tests should have been done to determine if tubulin was in the linear range, and if not, a
separate, less abundant loading control should have been chosen. The difficulty with this is the long reach
of FMRP’s regulation. Few proteins have been proven not to be affected by FMRP loss, so finding an
appropriate loading control requires a significant investment of work. For later WBs, I switched to total
protein quantification assays, namely the Bicinchoninic Acid (BCA) assay, to confirm the same amount of
protein was extracted between experiments (Walker, 1996). I also began using reversible general protein
staining assays, such as MemCode, to measure total protein loaded onto the gel, avoiding the
complications of a single loading control (Antharavally et al., 2004). However, neither of these techniques
can correct for incomplete liberation, solubilization or depolymerization that can lead to individual
proteins not fully extracting into the buffer.
Another issue I routinely encountered was the non-specificity of published antibodies. Many of
the antibodies I received had not been rigorously tested to confirm the labeled bands were indeed due to
the protein of interest rather than an off-target protein. Often, they had been designed for tissues other
than the brain meaning neural isoforms and non-specific targets had not been studied or reported. It was
frequently unclear whether bands outside of predicted sizes were alternate isoforms, functionally
modified proteins or non-specific targets (Brion et al., 1991). There were often very dim bands at the

142
expected size and very bright bands at unexpected sizes, making it unclear whether we had successfully
extracted the target or were even quantifying the correct protein.
Finally, after this work was complete, I discovered the dfmr150M brain is larger than the w1118
control, a complicating factor for the WB screen results (Fig. 26). Since I was looking for major shifts in
target abundance, I had instituted a 25% cutoff for follow-up experiments, making the brain size less of
an issue. This effect could still act additively to make a change in protein level look higher than it truly is
and bring it above the threshold, or mask a drop in protein. The change in brain size deserves a deeper
investigation as it is unclear where the extra volume comes from. Increases in overall cell number or size
should be easy to correct for; however, if the increase is due to subpopulations of cells, such as glia or
dopaminergic neurons or retention of metabolites or water, this could make the data more difficult to
appropriately normalize.
Despite all of these limitations, several highly altered proteins were identified by this WB screen,
although most came from off-target bands. The strongest
changes were all off-target proteins seen in antibodies
against Corkscrew (Csw), Gigas (Gig), Phosphatase and
Tensin Homolog (Pten) and Bagpipe (Bap). Csw showed
two off-target bands at 250kDa and 160kDa, which were,
respectively, 125% and 309% of control on average. Csw
also had two bands at predicted sizes that showed
significant elevation of protein levels (Flybase). The 100kDa
band was approximately 183% of control, while the 75kDa
band was 157% of control (Fig. 29). The on-target Csw
result was an exciting finding since gain of function (GOF)
mutations in the human Csw homolog (PTPN11) result in
Figure 29. Csw Western Blot The blot demonstrates two off target bands at 250 and 160 kDa, as well as two bands that match predicted protein sizes of ~100 and ~75kDa. Signal is increased for all four proteins in the dfmr150M line. Each lane contains two brains.

143
Noonan syndrome, a heritable condition with some similarities to the FXS disease state, including reports
of ASD and mild to occasionally severe intellectual and learning deficits (Ghaziuddin et al., 1994; Lee et
al., 2005; Sinkey and Odibo, 2017). Unfortunately, rigorous testing of the FMRP-Csw association using
improved extraction and quantification methods at multiple timepoints eventually showed the increase
in Csw protein was due to extraction variability and the enlarged dfmr150M brain (this was not the case for
the off-target bands which still showed significant increases). While there may be overlapping and
interacting pathways between Csw and FMRP that are responsible for the similar natures of Noonan
syndrome and FXS, I felt the evidence for a direct FMRP-Csw interaction was too slim to pursue. I initially
hoped to follow up on the off-target bands of Csw, Gig, Pten and Bap, but the only way to do so was
through proteomic mass-spectroscopy methods. This would have required a significant resource
investment and large amounts of the antibodies to immunoprecipitate the unknown targets, which we
lacked. While these targets remain of great interest, some hesitation in pursuing them exists due to the
finding that the dfmr150M allele, with which this work was performed, has background mutations.
Alternate null alleles must be tested before these targets are pursued further.
Though there were a number of qualms about these data, the overall results suggested most
presumptive FMRP targets are not significantly disrupted in the FXS disease model, consistent with
published FMRP proteomic work (Table 6; Zhang et al., 2004, 2005; Monzo et al., 2010). This indicates
that protein misregulation is on a small scale (50% or less), which is perhaps not a surprising result from
the loss of one translational regulator. However, this interpretation must be viewed with some skepticism
based on the issues with sample preparation and analysis noted above. There were several cases where
proteins showed large changes in expression and low variability (Table 6). These were reanalyzed, but
only the targets mentioned above were consistent in altered expression. Unfortunately, the overall results
of these experiment were too variable to pursue or publish, and this large body of work was therefore
abandoned.
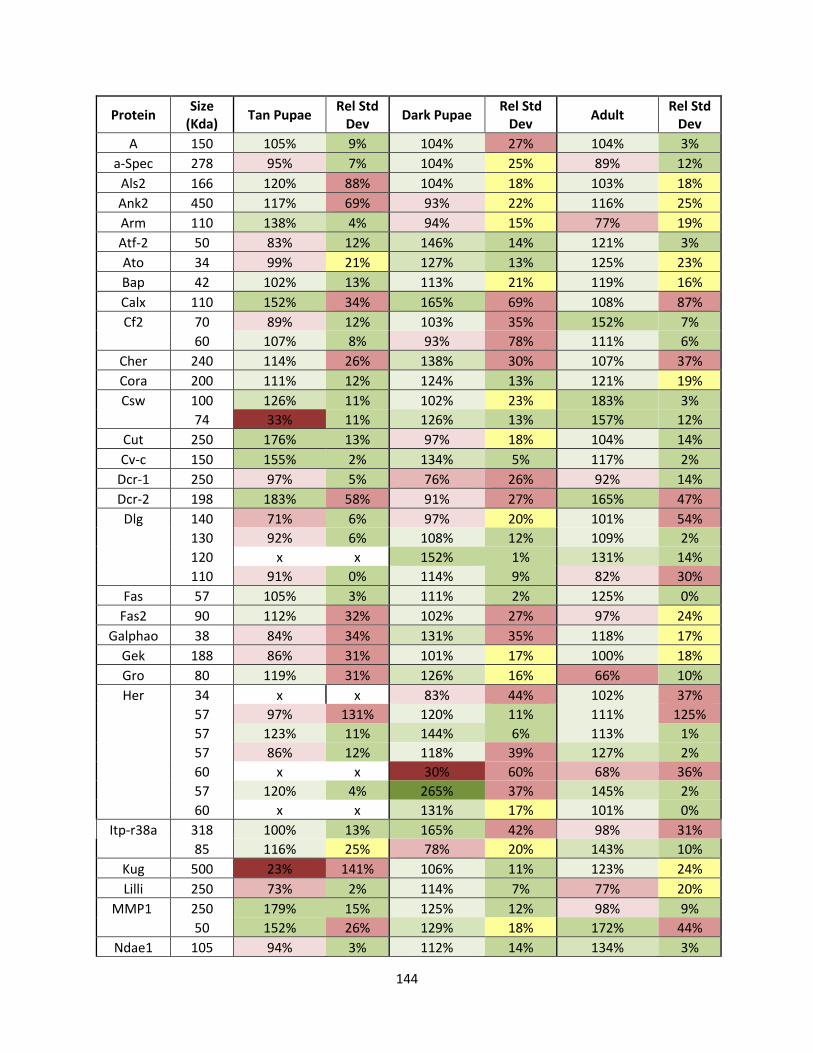
144
Protein Size
(Kda) Tan Pupae
Rel Std Dev
Dark Pupae Rel Std
Dev Adult
Rel Std Dev
A 150 105% 9% 104% 27% 104% 3%
a-Spec 278 95% 7% 104% 25% 89% 12%
Als2 166 120% 88% 104% 18% 103% 18%
Ank2 450 117% 69% 93% 22% 116% 25%
Arm 110 138% 4% 94% 15% 77% 19%
Atf-2 50 83% 12% 146% 14% 121% 3%
Ato 34 99% 21% 127% 13% 125% 23%
Bap 42 102% 13% 113% 21% 119% 16%
Calx 110 152% 34% 165% 69% 108% 87%
Cf2 70 89% 12% 103% 35% 152% 7%
60 107% 8% 93% 78% 111% 6%
Cher 240 114% 26% 138% 30% 107% 37%
Cora 200 111% 12% 124% 13% 121% 19%
Csw 100 126% 11% 102% 23% 183% 3%
74 33% 11% 126% 13% 157% 12%
Cut 250 176% 13% 97% 18% 104% 14%
Cv-c 150 155% 2% 134% 5% 117% 2%
Dcr-1 250 97% 5% 76% 26% 92% 14%
Dcr-2 198 183% 58% 91% 27% 165% 47%
Dlg 140 71% 6% 97% 20% 101% 54%
130 92% 6% 108% 12% 109% 2%
120 x x 152% 1% 131% 14%
110 91% 0% 114% 9% 82% 30%
Fas 57 105% 3% 111% 2% 125% 0%
Fas2 90 112% 32% 102% 27% 97% 24%
Galphao 38 84% 34% 131% 35% 118% 17%
Gek 188 86% 31% 101% 17% 100% 18%
Gro 80 119% 31% 126% 16% 66% 10%
Her 34 x x 83% 44% 102% 37%
57 97% 131% 120% 11% 111% 125%
57 123% 11% 144% 6% 113% 1%
57 86% 12% 118% 39% 127% 2%
60 x x 30% 60% 68% 36%
57 120% 4% 265% 37% 145% 2%
60 x x 131% 17% 101% 0%
Itp-r38a 318 100% 13% 165% 42% 98% 31%
85 116% 25% 78% 20% 143% 10%
Kug 500 23% 141% 106% 11% 123% 24%
Lilli 250 73% 2% 114% 7% 77% 20%
MMP1 250 179% 15% 125% 12% 98% 9%
50 152% 26% 129% 18% 172% 44%
Ndae1 105 94% 3% 112% 14% 134% 3%

145
Nej 341 113% 25% 66% 28% 69% 2%
Nf1 350 120% 27% 140% 45% 77% 76%
Nlg1 50-125 283% 45% 440% 70% 176% 7%
150 125% 7% 103% 12% 141% 7%
Nlg2 136 67% 8% 111% 89% 216% 47%
Nmdar1 112 120% 29% 149% 1% 183% 28%
Nmdar1 130 x x 113% 20% 149% 9%
130 135% 42% 100% 25% 151% 34%
130 x x 105% 5% 96% 10%
Nrg 190 105% 10% 71% 44% 97% 63%
Nrx-1 150 85% 30% 78% 3% 124% 18%
Pat 225 101% 15% 117% 24% 101% 34%
PlexA 225 102% 30% 111% 1% 88% 51%
PlexB 150 103% 28% 114% 36% 135% 27%
Pum 200 94% 10% 141% 19% 55% 39%
Rho1 21 182% 36% 119% 8% 111% 19%
Scar 85 101% 5% 113% 12% 157% 14%
Shot 600 148% 3% 113% 24% 101% 12%
Spg 200 118% 3% 100% 4% 129% 11%
Stan 200 130% 31% 86% 17% 72% 8%
Sti 230 105% 27% 132% 21% 117% 13%
Syn 150 125% 55% 79% 16% 104% 31%
70 218% 67% 118% 7% 116% 58%
Syt7 75 114% 16% 155% 14% 101% 6%
Tgo 72 152% 31% 124% 25% 115% 26%
Timp 28 76% 0% 135% 17% 121% 2%
Tor 281 104% 13% 105% 18% 106% 12%
Trio 257 68% 54% 63% 24% 95% 55%
110 89% 103% 80% 13% 107% 29%
70 70% 1% 89% 6% 115% 23%
X11L 120 106% 10% 113% 4% 102% 2%
Heat map for degree of change
> 200% 150% - 200% 125% - 150% 100% - 125% 100% - 80% 80% - 66% 66% - 50% < 50%
Heat map for degree of RSD
0% - 15% 15% - 25% > 25% Table 6. Initial Results of FMRP Target Western Blot Screen. This table represents the percent increase seen dfmr150M animals relative to w1118 controls for each protein listed. The first column gives the protein’s name and the second gives the predicted size(s) of that protein, according to Flybase.org. Sizes or proteins not shown here did not produce a band on the blots. Sizes listed more than once are due to a second antibody being tested. Three timepoints were analyzed: light pupae, dark pupae and adult. An “x” indicates no band was seen at that timepoint. The percent increase or decrease is color coded based on the heat map at the bottom of the table to indicate the degree of change in the mutant relative to the control. Next
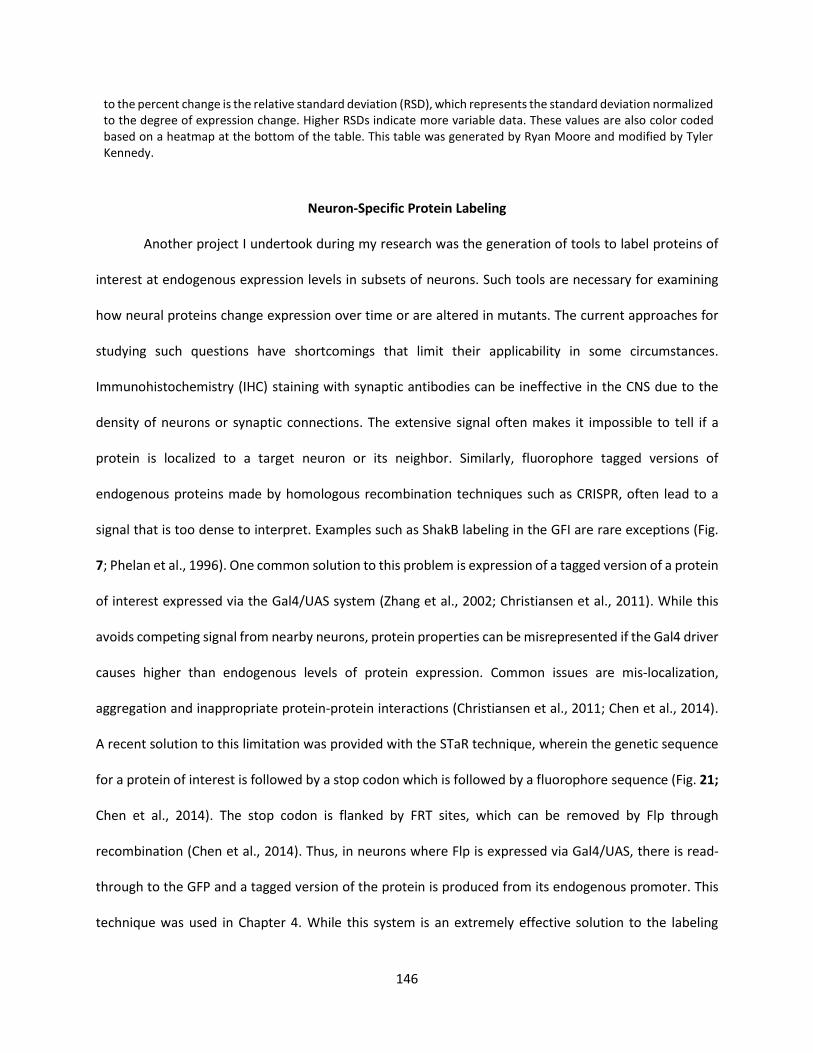
146
to the percent change is the relative standard deviation (RSD), which represents the standard deviation normalized to the degree of expression change. Higher RSDs indicate more variable data. These values are also color coded based on a heatmap at the bottom of the table. This table was generated by Ryan Moore and modified by Tyler Kennedy.
Neuron-Specific Protein Labeling
Another project I undertook during my research was the generation of tools to label proteins of
interest at endogenous expression levels in subsets of neurons. Such tools are necessary for examining
how neural proteins change expression over time or are altered in mutants. The current approaches for
studying such questions have shortcomings that limit their applicability in some circumstances.
Immunohistochemistry (IHC) staining with synaptic antibodies can be ineffective in the CNS due to the
density of neurons or synaptic connections. The extensive signal often makes it impossible to tell if a
protein is localized to a target neuron or its neighbor. Similarly, fluorophore tagged versions of
endogenous proteins made by homologous recombination techniques such as CRISPR, often lead to a
signal that is too dense to interpret. Examples such as ShakB labeling in the GFI are rare exceptions (Fig.
7; Phelan et al., 1996). One common solution to this problem is expression of a tagged version of a protein
of interest expressed via the Gal4/UAS system (Zhang et al., 2002; Christiansen et al., 2011). While this
avoids competing signal from nearby neurons, protein properties can be misrepresented if the Gal4 driver
causes higher than endogenous levels of protein expression. Common issues are mis-localization,
aggregation and inappropriate protein-protein interactions (Christiansen et al., 2011; Chen et al., 2014).
A recent solution to this limitation was provided with the STaR technique, wherein the genetic sequence
for a protein of interest is followed by a stop codon which is followed by a fluorophore sequence (Fig. 21;
Chen et al., 2014). The stop codon is flanked by FRT sites, which can be removed by Flp through
recombination (Chen et al., 2014). Thus, in neurons where Flp is expressed via Gal4/UAS, there is read-
through to the GFP and a tagged version of the protein is produced from its endogenous promoter. This
technique was used in Chapter 4. While this system is an extremely effective solution to the labeling

147
problem, two problems arose during my
use of this approach. First, the
recombination is a random process, and it
is impossible to know when it happens. If
one is trying to quantify the number of
synapses in a neuron with STaR, there may
be more variability than is tolerable due to
the marker turning on at different times
during development in animals from the
same experiment. Second, once
recombination has happened it is
irreversible. If the Gal4 line used in an
experiment turns on briefly in development and alters a progenitor cell, all of the offspring of that cell will
have a labeled version of the protein, even if the Gal4 line is no longer active. This can cause excessive
labeling in promiscuous Gal4 lines. This can be corrected for by using spGal4 lines to reduce the
unintentional signal, but this solution has not been perfect in my hands either (Pfeiffer et al., 2010).
I therefore attempted to create two tools to solve these problems: Gal4 Limited Enchainment
Activated Marker (GLEAM) and an RNA-editing technique based on the ER unfolded protein response
(UPR). GLEAM takes advantage of a split fluorophore, Venus (a GFP variant) in this case, which can form a
complete, functional protein if the two pieces encounter each other. The goal of this project was to tag
an endogenous protein with the small half of Venus, using the lines from the Minos Mediated Integration
Cassette (MiMIC) transgenic library, and express the large half of Venus cell-specifically using the
Gal4/UAS system (Hudry et al., 2011; Venken et al., 2011; Li-Kroeger et al., 2018). The MiMIC library
contains thousands of Drosophila lines, which have had a cassette randomly inserted into the genome,
Figure 30. The GLEAM Technique for Cell-Specific Labeling of Endogenously Expressed Proteins The GLEAM technique uses a split Venus protein, fusing the smaller, N-terminal half (NVenus) to the protein of interest, and expressing the larger C-terminal half (CVenus) cell-specifically with the Gal4/UAS system. The protein is only able to recombine and fluoresce when both halves are present, leading to fully functional Venus proteins only in Gal4 containing cells.
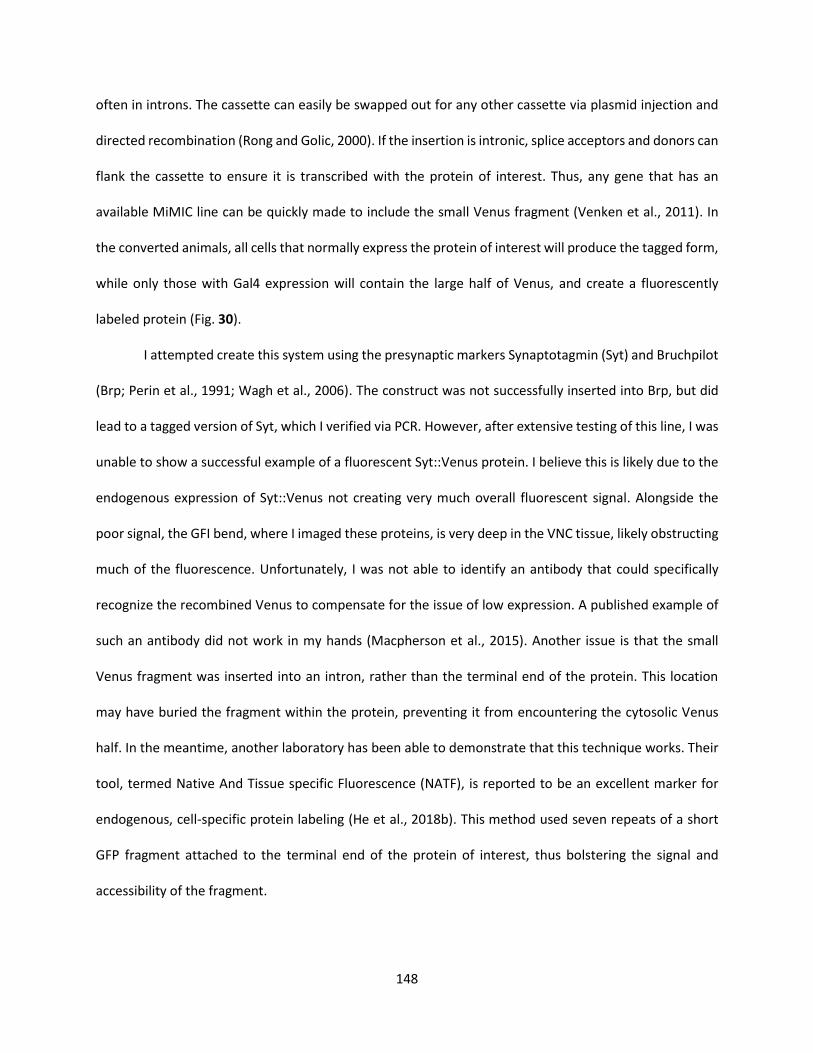
148
often in introns. The cassette can easily be swapped out for any other cassette via plasmid injection and
directed recombination (Rong and Golic, 2000). If the insertion is intronic, splice acceptors and donors can
flank the cassette to ensure it is transcribed with the protein of interest. Thus, any gene that has an
available MiMIC line can be quickly made to include the small Venus fragment (Venken et al., 2011). In
the converted animals, all cells that normally express the protein of interest will produce the tagged form,
while only those with Gal4 expression will contain the large half of Venus, and create a fluorescently
labeled protein (Fig. 30).
I attempted create this system using the presynaptic markers Synaptotagmin (Syt) and Bruchpilot
(Brp; Perin et al., 1991; Wagh et al., 2006). The construct was not successfully inserted into Brp, but did
lead to a tagged version of Syt, which I verified via PCR. However, after extensive testing of this line, I was
unable to show a successful example of a fluorescent Syt::Venus protein. I believe this is likely due to the
endogenous expression of Syt::Venus not creating very much overall fluorescent signal. Alongside the
poor signal, the GFI bend, where I imaged these proteins, is very deep in the VNC tissue, likely obstructing
much of the fluorescence. Unfortunately, I was not able to identify an antibody that could specifically
recognize the recombined Venus to compensate for the issue of low expression. A published example of
such an antibody did not work in my hands (Macpherson et al., 2015). Another issue is that the small
Venus fragment was inserted into an intron, rather than the terminal end of the protein. This location
may have buried the fragment within the protein, preventing it from encountering the cytosolic Venus
half. In the meantime, another laboratory has been able to demonstrate that this technique works. Their
tool, termed Native And Tissue specific Fluorescence (NATF), is reported to be an excellent marker for
endogenous, cell-specific protein labeling (He et al., 2018b). This method used seven repeats of a short
GFP fragment attached to the terminal end of the protein of interest, thus bolstering the signal and
accessibility of the fragment.
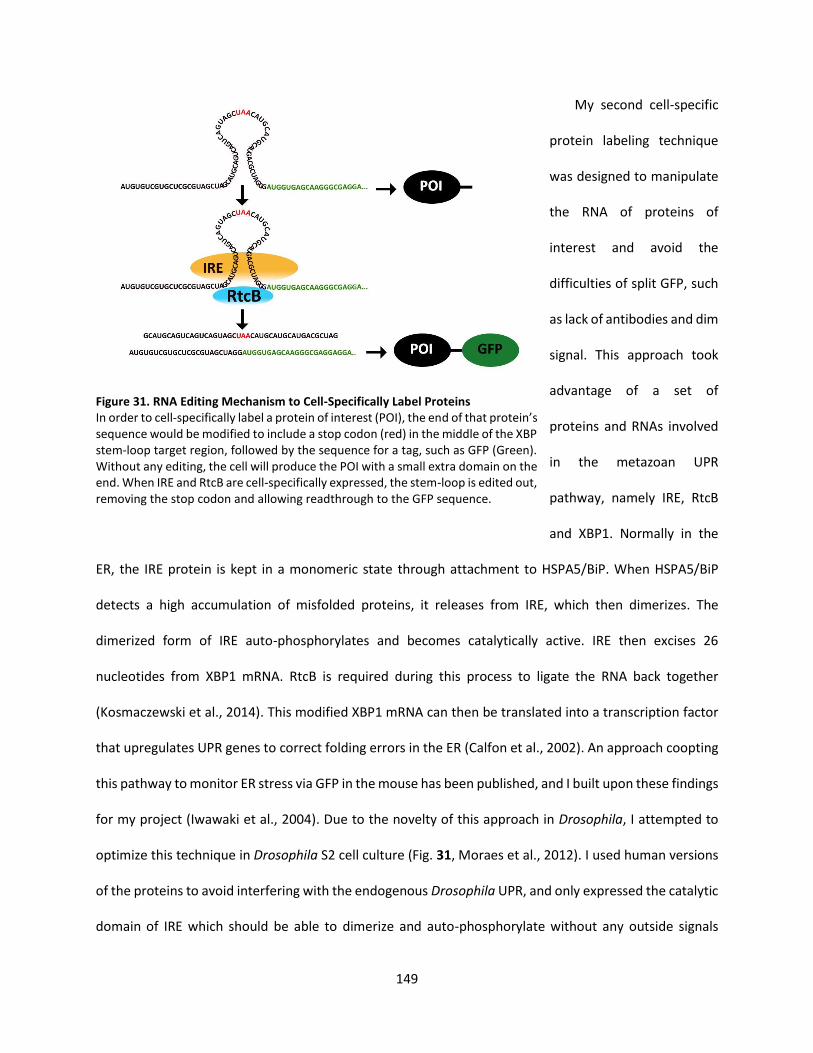
149
My second cell-specific
protein labeling technique
was designed to manipulate
the RNA of proteins of
interest and avoid the
difficulties of split GFP, such
as lack of antibodies and dim
signal. This approach took
advantage of a set of
proteins and RNAs involved
in the metazoan UPR
pathway, namely IRE, RtcB
and XBP1. Normally in the
ER, the IRE protein is kept in a monomeric state through attachment to HSPA5/BiP. When HSPA5/BiP
detects a high accumulation of misfolded proteins, it releases from IRE, which then dimerizes. The
dimerized form of IRE auto-phosphorylates and becomes catalytically active. IRE then excises 26
nucleotides from XBP1 mRNA. RtcB is required during this process to ligate the RNA back together
(Kosmaczewski et al., 2014). This modified XBP1 mRNA can then be translated into a transcription factor
that upregulates UPR genes to correct folding errors in the ER (Calfon et al., 2002). An approach coopting
this pathway to monitor ER stress via GFP in the mouse has been published, and I built upon these findings
for my project (Iwawaki et al., 2004). Due to the novelty of this approach in Drosophila, I attempted to
optimize this technique in Drosophila S2 cell culture (Fig. 31, Moraes et al., 2012). I used human versions
of the proteins to avoid interfering with the endogenous Drosophila UPR, and only expressed the catalytic
domain of IRE which should be able to dimerize and auto-phosphorylate without any outside signals
Figure 31. RNA Editing Mechanism to Cell-Specifically Label Proteins In order to cell-specifically label a protein of interest (POI), the end of that protein’s sequence would be modified to include a stop codon (red) in the middle of the XBP stem-loop target region, followed by the sequence for a tag, such as GFP (Green). Without any editing, the cell will produce the POI with a small extra domain on the end. When IRE and RtcB are cell-specifically expressed, the stem-loop is edited out, removing the stop codon and allowing readthrough to the GFP sequence.
150
(Welihinda and Kaufmant, 1996). I was able to generate plasmids that expressed each component of
interest in the S2 cells as well as a membrane protein, mCD8, with a stop codon flanked by the XBP1 edit
sequences and a GFP transcript at the C terminus. Despite repeated attempts and optimizations of the
XBP1 editing sequence, the expression of all of these pieces together in a S2 cell never led to the
production of a GFP tagged version of mCD8. Expression of each protein was confirmed by antibody
labeling, so It was not clear why the editing process did not proceed. Future work might require RT-PCR
amplification of the target sequences to see how far along the enzymes were proceeding, so that the
problematic step can be identified. While this tool has promise, the reactions involved are complicated
and may not be robust enough to function in all circumstances. As an alternative to this approach, a recent
report showed CRISPR machinery can be harnessed to an ADAR2 protein capable of swapping adenosine
for inosine on RNA molecules (Cox et al., 2017). This CRISPR RNA editing system could provide a more
straightforward method to edit transcripts. For example, a gene of interest could be modified to have a
GFP sequence after a UAG stop codon. The CRISPR system could be expressed in the cells of interest with
a targeting RNA aimed at the stop codon. This would result in A-to-I conversion, which is read by the
ribosome as a G. Thus, the UAG stop codon becomes UGG (tryptophan), allowing the ribosome to read
through to the GFP sequence. This would be a very powerful method, as the process would not affect the
genome, thus circumventing several of the STaR drawbacks. This approach also opens up a greater range
of labeling options than the GLEAM/NATF technique as any fluorophore or epitope tag, such as FLAG or
V5 could be used, making multicolor and pulldown experiments feasible (Fan et al., 2008).
Conclusion
Overall, the GF circuit has proved a reliable model for studying neuron development and function.
This is perhaps the only currently studied circuit in Drosophila where multiple connected neurons can be
imaged in series and parallel at single-neuron resolution. Analysis at the cellular and molecular level is

151
made easy by the large size of these neurons (Power, 1948; Bacon and Strausfeld, 1986). Gal4 drivers and
the similarly designed LexA drivers are available for multiple members of the circuit allowing different
UAS/LexAop transgenics to be expressed in connected neurons (Pfeiffer et al., 2010; Tirian and Dickson,
2017). While not reported here, I performed electrophysiology recordings from the two muscles the GF
circuit terminates on, the TTM and the DLM. The process is fairly simple, making activity recordings an
accessible parameter of study (Gu and O’Dowd, 2007). Interestingly, the synapses leading to the TTM are
all mixed electrical and ACh chemical synapses, with the exception of the NMJ, which is glutamatergic. In
contrast, the DLM pathway has one synapse (PSI-DLMn) which is solely cholinergic. By measuring these
two outputs separately, the impact of mutations on electrical or cholinergic synapses can be functionally
evaluated (Mejia et al., 2013). Jump reflex assays were not pursued in this work, but they can be rapidly
assayed with simple equipment, meaning these neurons can be studied from the molecular to the
behavioral level (Martinez et al., 2007; de Vries and Clandinin, 2013; von Reyn et al., 2014). While it is
unclear what the motor outputs of the GFCs are, once they have been identified, another behavioral assay
may become linked to this circuit. There has even been some work suggesting activity dependent
modulation of the GF circuit occurs, indicating habituation and potentiation can be studied in this
collection of neurons (Engel and Wu, 1996; Engel et al., 2000). The expansive protocols and tools available
for the GF circuit, make this an ideal model for studying how the brain assembles and operates in
Drosophila.
152
References
Abrahams BS, Geschwind DH (2008) Advances in autism genetics: On the threshold of a new neurobiology. Nat Rev Genet.
Adinolfi S, Ramos A, Martin SR, Dal Piaz F, Pucci P, Bardoni B, Mandel JL, Pastore A (2003) The N-terminus of the fragile X mental retardation protein contains a novel domain involved in dimerization and RNA binding. Biochemistry.
Adzhubei IA, Schmidt S, Peshkin L, Ramensky VE, Gerasimova A, Bork P, Kondrashov AS, Sunyaev SR (2010) A method and server for predicting damaging missense mutations. Nat Methods.
Ahmad-Annuar A, Ciani L, Simeonidis I, Herreros J, Fredj N Ben, Rosso SB, Hall A, Brickley S, Salinas PC (2006) Signaling across the synapse: A role for Wnt and Dishevelled in presynaptic assembly and neurotransmitter release. J Cell Biol.
Akerboom J et al. (2012) Optimization of a GCaMP Calcium Indicator for Neural Activity Imaging. J Neurosci 32:13819–13840.
Akins MR, Berk-Rauch HE, Kwan KY, Mitchell ME, Shepard KA, Korsak LIT, Stackpole EE, Warner-Schmidt JL, Sestan N, Cameron HA, Fallon JR (2017) Axonal ribosomes and mRNAs associate with fragile X granules in adult rodent and human brains. Hum Mol Genet 0:1–18.
Akram MA, Nanda S, Maraver P, Armañanzas R, Ascoli GA (2018) An open repository for single-cell reconstructions of the brain forest. Sci Data 5:180006.
Aleksic J, Lazic R, Müller I, Russell SR, Adryan B (2009) Biases in Drosophila melanogaster protein trap screens. BMC Genomics.
Allen M, Shan X, Caruccio P, Froggett S, Moffat K, Murphey R (1999) Targeted Expression of Truncated Glued Disrupts Giant Fiber Synapse Formation in Drosophila. J Neurosci.
Allen MJ, Drummond JA, Moffat KG (1998) Development of the giant fiber neuron of Drosophila melanogaster. J Comp Neurol 397:519–531.
Allen MJ, Godenschwege TA, Tanouye MA, Phelan P (2006) Making an escape: development and function of the Drosophila giant fibre system. Semin Cell Dev Biol 17:31–41.
Alpatov R et al. (2014) A chromatin-dependent role of the fragile X mental retardation protein FMRP in the DNA damage response. Cell 157:869–881.
Ambrosi C, Gassmann O, Pranskevich JN, Boassa D, Smock A, Wang J, Dahl G, Steinem C, Sosinsky GE (2010) Pannexin1 and pannexin2 channels show quaternary similarities to connexons and different oligomerization numbers from each other. J Biol Chem.
Andersen OS, Koeppe RE, Roux B (2005) Gramicidin channels. IEEE Trans Nanobioscience.
Anderson BR, Chopra P, Suhl JA, Warren ST, Bassell GJ (2016) Identification of consensus binding sites clarifies FMRP binding determinants. Nucleic Acids Res.
153
Anderson P, Kedersha N (2006) RNA granules. J Cell Biol.
Ango F, di Cristo G, Higashiyama H, Bennett V, Wu P, Huang ZJ (2004) Ankyrin-based subcellular gradient of neurofascin, an immunoglobulin family protein, directs GABAergic innervation at purkinje axon initial segment. Cell 119:257–272.
Antar LN, Dictenberg JB, Plociniak M, Afroz R, Bassell GJ (2005) Localization of FMRP-associated mRNA granules and requirement of microtubules for activity-dependent trafficking in hippocampal neurons. Genes, Brain Behav.
Antar LN, Li C, Zhang H, Carroll RC, Bassell GJ (2006) Local functions for FMRP in axon growth cone motility and activity-dependent regulation of filopodia and spine synapses. Mol Cell Neurosci 32:37–48.
Antharavally BS, Carter B, Bell PA, Mallia AK (2004) A high-affinity reversible protein stain for Western blots. Anal Biochem.
Antonini A, Stryker MP (1993) Rapid remodeling of axonal arbors in the visual cortex. Science 260:1819–1821.
Arber S (2012) Motor Circuits in Action: Specification, Connectivity, and Function. Neuron.
Armijo-Weingart L, Gallo G (2017) It takes a village to raise a branch: Cellular mechanisms of the initiation of axon collateral branches. Mol Cell Neurosci.
Arnth-Jensen N, Jabaudon D, Scanziani M (2002) Cooperation between independent hippocampal synapses is controlled by glutamate uptake. Nat Neurosci.
Ascano M, Mukherjee N, Bandaru P, Miller JB, Nusbaum J, Corcoran DL, Langlois C, Munschauer M, Dewell S, Hafner M, Williams Z, Ohler U, Tuschl T (2013) FMR1 targets distinct mRNA sequence elements to regulate protein expression. Nature 492:382–386.
Ashley CT, Wilkinson KD, Reines D, Warren ST (1993) FMR1 protein: Conserved RNP family domains and selective RNA binding. Science.
Ataman B, Ashley J, Gorczyca M, Ramachandran P, Fouquet W, Sigrist SJ, Budnik V (2008) Rapid activity-dependent modifications in synaptic structure and function require bidirectional wnt signaling. Neuron 57:705–718.
Augustin H, Allen MJ, Partridge L (2011) Electrophysiological Recordings from the Giant Fiber Pathway of D. melanogaster. J Vis Exp.
Awasaki T, Tatsumi R, Takahashi K, Arai K, Nakanishi Y, Ueda R, Ito K (2006) Essential Role of the Apoptotic Cell Engulfment Genes draper and ced-6 in Programmed Axon Pruning during Drosophila Metamorphosis. Neuron.
Ayata P, Badimon A, Strasburger HJ, Duff MK, Montgomery SE, Loh YHE, Ebert A, Pimenova AA, Ramirez BR, Chan AT, Sullivan JM, Purushothaman I, Scarpa JR, Goate AM, Busslinger M, Shen L, Losic B, Schaefer A (2018) Epigenetic regulation of brain region-specific microglia clearance activity. Nat

154
Neurosci.
Bacon JP, Strausfeld NJ (1986) The dipteran “Giant fibre” pathway: neurons and signals. J Comp Physiol A 158:529–548.
Baena-Lopez LA, Alexandre C, Mitchell A, Pasakarnis L, Vincent J-P (2013) Accelerated homologous recombination and subsequent genome modification in Drosophila. Development.
Bailey DB, Raspa M, Olmsted M, Holiday DB (2008) Co-occurring conditions associated with FMR1 gene variations: Findings from a national parent survey. Am J Med Genet Part A.
Bailey DW (1982) How pure are inbred strains of mice? Immunol Today.
Baker MW, Macagno ER (2017) Gap junction proteins and the wiring (Rewiring) of neuronal circuits. Dev Neurobiol 77:575–586.
Baranova A, Ivanov D, Petrash N, Pestova A, Skoblov M, Kelmanson I, Shagin D, Nazarenko S, Geraymovych E, Litvin O, Tiunova A, Born TL, Usman N, Staroverov D, Lukyanov S, Panchin Y (2004) The mammalian pannexin family is homologous to the invertebrate innexin gap junction proteins. Genomics.
Barbee SA, Estes PS, Cziko A, Hillebrand J, Luedeman RA, Coller JM, Johnson N, Howlett IC, Geng C, Ueda R, Brand AH, Newbury SF, Wilhelm JE, Levine RB, Nakamura A, Parker R, Ramaswami M (2006) Staufen-and FMRP-containing neuronal RNPs are structurally and functionally related to somatic P bodies. Neuron 52:997–1009.
Bartley CM, OKeefe RA, Blice-Baum A, Mihailescu M-R, Gong X, Miyares L, Karaca E, Bordey A (2016) Mammalian FMRP S499 Is Phosphorylated by CK2 and Promotes Secondary Phosphorylation of FMRP. eNeuro.
Bassett AR, Kong L, Liu JL (2015) A Genome-Wide CRISPR Library for High-Throughput Genetic Screening in Drosophila Cells. J Genet Genomics 42:301–309.
Bear MF, Huber KM, Warren ST (2004) The mGluR theory of fragile X mental retardation. Trends Neurosci 27:370–377.
Bechara EG, Didiot MC, Melko M, Davidovic L, Bensaid M, Martin P, Castets M, Pognonec P, Khandjian EW, Moine H, Bardoni B (2009) A novel function for fragile X mental retardation protein in translational activation. PLoS Biol 7:e16.
Bellen HJ, Levis RW, Liao G, He Y, Carlson JW, Tsang G, Evans-Holm M, Hiesinger PR, Schulze KL, Rubin GM, Hoskins RA, Spradling AC (2004) The BDGP gene disruption project: Single transposon insertions associated with 40% of Drosophila genes. Genetics.
Belousov AB, Fontes JD (2013) Neuronal gap junctions: Making and breaking connections during development and injury. Trends Neurosci 36:227–236.
Bennett MVL, Contreras JE, Bukauskas FF, Sáez JC (2003) New roles for astrocytes: Gap junction hemichannels have something to communicate. Trends Neurosci 26:610–617.

155
Berger J, Suzuki T, Senti KA, Stubbs J, Schaffner G, Dickson BJ (2001) Genetic mapping with SNP markers in Drosophila. Nat Genet.
Berry-Kravis E, Hessl D, Abbeduto L, Reiss AL, Beckel-Mitchener A, Urv TK (2013) Outcome measures for clinical trials in fragile X syndrome. J Dev Behav Pediatr.
Beyer EC, Berthoud VM (2018) Gap junction gene and protein families: Connexins, innexins, and pannexins. Biochim Biophys Acta - Biomembr.
Bhattacharya A, Kaphzan H, Alvarez-Dieppa AC, Murphy JP, Pierre P, Klann E (2012) Genetic Removal of p70 S6 Kinase 1 Corrects Molecular, Synaptic, and Behavioral Phenotypes in Fragile X Syndrome Mice. Neuron.
Bidaye SS, Machacek C, Wu Y, Dickson BJ (2014) Neuronal control of Drosophila walking direction. Science 344:97–101.
Biederer T, Sara Y, Mozhayeva M, Atasoy D, Liu X, Kavalali ET, Südhof TC (2002) SynCAM, a synaptic adhesion molecule that drives synapse assembly. Science.
Bilousova T V., Dansie L, Ngo M, Aye J, Charles JR, Ethell DW, Ethell IM (2009) Minocycline promotes dendritic spine maturation and improves behavioural performance in the fragile X mouse model. J Med Genet.
Bishop AL, Hall A (2000) Rho GTPases and their effector proteins. Biochem J.
Blagburn JM, Alexopoulos H, Davies JA, Bacon JP (1999) Null mutation in shaking-B eliminates electrical, but not chemical, synapses in the Drosophila giant fiber system: a structural study. J Comp Neurol 404:449–458.
Bock T, Stuart GJ (2016) The Impact of BK Channels on Cellular Excitability Depends on their Subcellular Location. Front Cell Neurosci.
Boerner J, Godenschwege TA (2010) Application for the Drosophila ventral nerve cord standard in neuronal circuit reconstruction and in-depth analysis of mutant morphology. J Neurogenet 24:158–167.
Boerner J, Godenschwege TA (2011) Whole mount preparation of the adult Drosophila ventral nerve cord for giant fiber dye injection. J Vis Exp 52:3080.
Boivin JR, Nedivi E (2018) Functional implications of inhibitory synapse placement on signal processing in pyramidal neuron dendrites. Curr Opin Neurobiol.
Bolduc F, Bell K, Cox H, Broadie K, Tully T (2008) Excess protein synthesis in Drosophila fragile X mutants impairs long-term memory. Nat Neurosci 11:1143–1145.
Borgen M, Rowland K, Boerner J, Lloyd B, Khan A, Murphey R (2017) Axon termination, pruning, and synaptogenesis in the giant fiber system of Drosophila melanogaster is promoted by highwire. Genetics 205:1229–1245.

156
Braat S, D’Hulst C, Heulens I, De Rubeis S, Mientjes E, Nelson DL, Willemsen R, Bagni C, Van Dam D, De Deyn PP, Kooy RF (2015) The GABA A receptor is an FMRP target with therapeutic potential in fragile X syndrome. Cell Cycle 14:2985–2995.
Brager DH, Johnston D (2014) Channelopathies and dendritic dysfunction in fragile X syndrome. Brain Res Bull 103:11–17.
Brand AH, Perrimon N (1993) Targeted gene expression as a means of altering cell fates and generating dominant phenotypes. Development 118:401–415.
Braz JM, Rico B, Basbaum AI (2002) Transneuronal tracing of diverse CNS circuits by Cre-mediated induction of wheat germ agglutinin in transgenic mice. Proc Natl Acad Sci.
Brion J-P, Hanger DP, Couck A-M, Anderton BH (1991) A68 proteins in Alzheimer’s disease are composed of several tau isoforms in a phosphorylated state which affects their electrophoretic mobilities. Biochem J.
Broadie K, Bate M (1993) Innervation directs receptor synthesis and localization in Drosophila embryo synaptogenesis. Nature.
Brown MR, Kronengold J, Gazula V-RR, Chen Y, Strumbos JG, Sigworth FJ, Navaratnam D, Kaczmarek LK (2010) Fragile X mental retardation protein controls gating of the sodium-activated potassium channel Slack. Nat Neurosci 13:819–821.
Brown V, Jin P, Ceman S, Darnell JC, O’Donnell WT, Tenenbaum S, Jin X, Feng Y, Wilkinson KD, Keene JD, Darnell RB, Warren ST (2001) Microarray identification of FMRP-associated brain mRNAs and altered mRNA translational profiles in fragile X syndrome. Cell 107:477–487.
Brown V, Small K, Lakkis L, Feng Y, Gunter C, Wilkinson KD, Warren ST (1998) Purified recombinant Fmrp exhibits selective RNA binding as an intrinsic property of the fragile X mental retardation protein. J Biol Chem.
Budnik V, Salinas P (2011) Wnt signaling during synaptic development and plasticity. Curr Opin Neurobiol 21:151–159.
Burgess DJ (2011) Model organisms: The dangers lurking in the genetic background. Nat Rev Genet.
Büschges A, Djokaj S, Bässler D, Bässler U, Rathmayer W (2000) Neuromuscular plasticity in the locust after permanent removal of an excitatory motoneuron of the extensor tibiae muscle. J Neurobiol 42:148–159.
Caldwell PH, Murphy SB, Butow PN, Craig JC (2004) Clinical trials in children. Lancet 364:803–811.
Calfon M, Zeng H, Urano F, Till JH, Hubbard SR, Harding HP, Clark SG, Ron D (2002) IRE1 couples endoplasmic reticulum load to secretory capacity by processing the XBP-1 mRNA. Nature.
Callan MA, Clements N, Ahrendt N, Zarnescu DC (2012) Fragile X Protein is required for inhibition of insulin signaling and regulates glial-dependent neuroblast reactivation in the developing brain. Brain Res.
157
Cande J, Berman GJ, Namiki S, Qiu J, Korff W, Card G, Shaevitz JW, Stern DL (2018) Optogenetic dissection of descending behavioral control in Drosophila. Elife 7.
Cardona A, Larsen C, Hartenstein V (2009) Neuronal fiber tracts connecting the brain and ventral nerve cord of the early Drosophila larva. J Comp Neurol 515:427–440.
Casso D, Ramírez-Weber FA, Kornberg TB (1999) GFP-tagged balancer chromosomes for Drosophila melanogaster. Mech Dev.
Causing CG, Gloster A, Aloyz R, Bamji SX, Chang E, Fawcett J, Kuchel G, Miller FD (1997) Synaptic innervation density is regulated by neuron-derived BDNF. Neuron.
Ceman S, O’Donnell WT, Reed M, Patton S, Pohl J, Warren ST (2003) Phosphorylation influences the translation state of FMRP-associated polyribosomes. Hum Mol Genet.
Chandler CH, Chari S, Dworkin I (2013) Does your gene need a background check? How genetic background impacts the analysis of mutations, genes, and evolution. Trends Genet.
Chen L, Yun SW, Seto J, Liu W, Toth M (2003) The fragile X mental retardation protein binds and regulates a novel class of mRNAs containing u rich target sequences. Neuroscience.
Chen Q, Cichon J, Wang W, Qiu L, Lee SJR, Campbell NR, DeStefino N, Goard MJ, Fu Z, Yasuda R, Looger LL, Arenkiel BR, Gan WB, Feng G (2012) Imaging Neural Activity Using Thy1-GCaMP Transgenic Mice. Neuron.
Chen Y, Akin O, Nern A, Tsui CYK, Pecot MY, Zipursky SL (2014) Cell-type-specific labeling of synapses in vivo through synaptic tagging with recombination. Neuron 81:280–293.
Chiang AS et al. (2011) Three-dimensional reconstruction of brain-wide wiring networks in drosophila at single-cell resolution. Curr Biol 21:1–11.
Chonchaiya W, Schneider A, Hagerman RJ (2009) Fragile X: A Family of Disorders. Adv Pediatr.
Christiansen F, Zube C, Andlauer TFM, Wichmann C, Fouquet W, Owald D, Mertel S, Leiss F, Tavosanis G, Farca Luna AJ, Fiala A, Sigrist SJ (2011) Presynapses in Kenyon Cell Dendrites in the Mushroom Body Calyx of Drosophila. J Neurosci 31:9696–9707.
Ciani L, Krylova O, Smalley MJ, Dale TC, Salinas PC (2004) A divergent canonical WNT-signaling pathway regulates microtubule dynamics: Dishevelled signals locally to stabilize microtubules. J Cell Biol.
Cline HT (2001) Dendritic arbor development and synaptogenesis. Curr Opin Neurobiol.
Coffee LR, Williamson AJ, Adkins CM, Gray MC, Page TL, Broadie K (2012) In vivo neuronal function of the fragile X mental retardation protein is regulated by phosphorylation. Hum Mol Genet.
Cohen-Cory S (2002) The developing synapse: Construction and modulation of synaptic structures and circuits. Science 298:770–776.
Collignon O, Voss P, Lassonde M, Lepore F (2009) Cross-modal plasticity for the spatial processing of
158
sounds in visually deprived subjects. Exp Brain Res 192:343–358.
Comery T, Harris J, Willems P, Oostra B, Irwin S, Weiler I, Greenough W (1997) Abnormal dendritic spines in fragile X knockout mice: maturation and pruning deficits. Proc Natl Acad Sci U S A 94:5401–5404.
Connor RMO, Stone EF, Wayne CR, Marcinkevicius E V, Ulgherait M, Delventhal R, Pantalia MM, Hill VM, Zhou CG, Mcallister S, Chen A, Ziegenfuss JS, Grueber WB, Canman JC, Hiza MMS (2017) A Drosophila model of Fragile X syndrome exhibits defects in phagocytosis by innate immune cells. 216:1–11.
Contet C, Goulding SP, Kuljis DA, Barth AL (2016) BK Channels in the Central Nervous System. In: International Review of Neurobiology.
Contractor A, Klyachko VA, Portera-Cailliau C (2015) Altered neuronal and circuit excitability in fragile X syndrome. Neuron 87:699–715.
Cook RK, Christensen SJ, Deal JA, Coburn RA, Deal ME, Gresens JM, Kaufman TC, Cook KR (2012) The generation of chromosomal deletions to provide extensive coverage and subdivision of the Drosophila melanogaster genome. Genome Biol 13:R21.
Cooper GM, Shendure J (2011) Needles in stacks of needles: Finding disease-causal variants in a wealth of genomic data. Nat Rev Genet.
Cordeiro L, Ballinger E, Hagerman R, Hessl D (2011) Clinical assessment of DSM-IV anxiety disorders in fragile X syndrome: prevalence and characterization. J Neurodev Disord.
Corty MM, Freeman MR (2013) Architects in neural circuit design: Glia control neuron numbers and connectivity. J Cell Biol.
Cowley B, Kirjanen S, Partanen J, Castren M (2016) Epileptic electroencephalography profile associates with attention problems in children with fragile X syndrome: Review and case series. Front Hum Neurosci 10:353.
Cox DBT, Gootenberg JS, Abudayyeh OO, Franklin B, Kellner MJ, Joung J, Zhang F (2017) RNA editing with CRISPR-Cas13. Science.
Coyne AN, Yamada SB, Siddegowda BB, Estes PS, Zaepfel BL, Johannesmeyer JS, Lockwood DB, Pham LT, Hart MP, Cassel JA, Freibaum B, Boehringer A V., Paul Taylor J, Reitz AB, Gitler AD, Zarnescu DC (2015) Fragile X protein mitigates TDP-43 toxicity by remodeling RNA granules and restoring translation. Hum Mol Genet.
Crawford RD (1976) Incomplete dominance of the gene for naked neck in domestic fowl. Poult Sci.
Crittenden JR, Skoulakis EMC, Han K-A, Kalderon D, Davis RL (1998) Tripartite Mushroom Body Architecture Revealed by Antigenic Markers. Learn Mem 5:38–51.
Crowley C, Spencer SD, Nishimura MC, Chen KS, Pitts-Meek S, Armaninl MP, Ling LH, McMahon SB, Shelton DL, Levinson AD, Phillips HS (1994) Mice lacking nerve growth factor display perinatal loss
159
of sensory and sympathetic neurons yet develop basal forebrain cholinergic neurons. Cell 76:1001–1011.
Cruz-Martín A, Crespo M, Portera-Cailliau C (2010) Delayed stabilization of dendritic spines in fragile X mice. J Neurosci 30:7793–7803.
Cvetkovska V, Hibbert AD, Emran F, Chen BE (2013) Overexpression of down syndrome cell adhesion molecule impairs precise synaptic targeting. Nat Neurosci 16:677–682.
Dahal GR, Rawson J, Gassaway B, Kwok B, Tong Y, Ptacek LJ, Bates E (2012) An inwardly rectifying K+ channel is required for patterning. Development 139:3653–3664.
Darabid H, Perez-Gonzalez AP, Robitaille R (2014) Neuromuscular synaptogenesis: Coordinating partners with multiple functions. Nat Rev Neurosci.
Darnell J, Van Driesche S, Zhang C, Hung K, Mele A, Fraser C, Stone E, Chen C, Fak J, Chi S, Licatalosi D, Richter J, Darnell R (2011) FMRP stalls ribosomal translocation on mRNAs linked to synaptic function and autism. Cell 146:247–261.
Darnell JC, Fraser CE, Mostovetsky O, Darnell RB (2009) Discrimination of common and unique RNA-binding activities among Fragile X mental retardation protein paralogs. Hum Mol Genet.
Darnell JC, Fraser CE, Mostovetsky O, Stefani G, Jones TA, Eddy SR, Darnell RB (2005a) Kissing complex RNAs mediate interaction between the Fragile-X mental retardation protein KH2 domain and brain polyribosomes. Genes Dev.
Darnell JC, Jensen KB, Jin P, Brown V, Warren ST, Darnell RB (2001) Fragile X mental retardation protein targets G quartet mRNAs important for neuronal function. Cell 107:489–499.
Darnell JC, Klann E (2013) The translation of translational control by FMRP: Therapeutic targets for FXS. Nat Neurosci.
Darnell JC, Mostovetsky O, Darnell RB (2005b) FMRP RNA targets: Identification and validation. Genes, Brain Behav.
Davenport MH, Schaefer TL, Friedmann KJ, Fitzpatrick SE, Erickson CA (2016) Pharmacotherapy for Fragile X Syndrome: Progress to Date. Drugs.
Dawson N, Sillitoe I, Marsden RL, Orengo CA (2017) The Classification of Protein Domains. In: Methods in molecular biology (Clifton, N.J.), pp 137–164.
Dawydow A, Gueta R, Ljaschenko D, Ullrich S, Hermann M, Ehmann N, Gao S, Fiala A, Langenhan T, Nagel G, Kittel RJ (2014) Channelrhodopsin-2-XXL, a powerful optogenetic tool for low-light applications. Proc Natl Acad Sci U S A 111:13972–13977.
Day CA, Kraft LJ, Kang M, Kenworthy AK (2012) Analysis of protein and lipid dynamics using confocal fluorescence recovery after photobleaching (FRAP). Curr Protoc Cytom Chapter 2:Unit2.19.
De Boulle K, Verkerk AJMH, Reyniers E, Vits L, Hendrickx J, Van Roy B, Van Den Bos F, de Graaff E, Oostra
160
BA, Willems PJ (1993) n in the FMR-1 gA point mutatioene associated with fragile X mental retardation. Nat Genet.
De Rubeis S et al. (2014) Synaptic, transcriptional and chromatin genes disrupted in autism. Nature.
de Vries SEJ, Clandinin T (2013) Optogenetic Stimulation of Escape Behavior in Drosophila melanogaster. J Vis Exp.
Dear ML, Shilts J, Broadie K (2017) Neuronal activity drives FMRP- and HSPG-dependent matrix metalloproteinase function required for rapid synaptogenesis. Sci Signal.
Deng PY, Rotman Z, Blundon JA, Cho Y, Cui J, Cavalli V, Zakharenko SS, Klyachko VA (2013) FMRP regulates neurotransmitter release and synaptic information transmission by modulating action potential duration via BK channels. Neuron 77:696–711.
Desbois M, Cook SJ, Emmons SW, Bülow HE (2015) Directional Trans-synaptic labeling of specific neuronal connections in live animals. Genetics.
Dietrich A, Kioschis P, Monaco AP, Gross B, Korn B, Williams S V., Sheer D, Heitz D, Oberie I, Toniolo D, Warren ST, Lehrach H, Poustka A (1991) Molecular cloning and analysis of the fragile X region in man. Nucleic Acids Res 19:2567–2572.
Dietzl G, Chen D, Schnorrer F, Su KC, Barinova Y, Fellner M, Gasser B, Kinsey K, Oppel S, Scheiblauer S, Couto A, Marra V, Keleman K, Dickson BJ (2007) A genome-wide transgenic RNAi library for conditional gene inactivation in Drosophila. Nature.
Dionne H, Hibbard KL, Cavallaro A, Kao JC, Rubin GM (2018) Genetic reagents for making split-GAL4 lines in Drosophila. Genetics 209:31–35.
Dobkin C, Rabe A, Dumas R, El Idrissi A, Haubenstock H, Ted Brown W (2000) Fmr1 knockout mouse has a distinctive strain-specific learning impairment. Neuroscience.
Dockendorff TC, Su HS, McBride SMJ, Yang Z, Choi CH, Siwicki KK, Sehgal A, Jongens TA (2002) Drosophila lacking dfmr1 activity show defects in circadian output and fail to maintain courtship interest. Neuron 34:973–984.
Dolan BM, Duron SG, Campbell DA, Vollrath B, Rao BSS, Ko H-Y, Lin GG, Govindarajan A, Choi S-Y, Tonegawa S (2013) Rescue of fragile X syndrome phenotypes in Fmr1 KO mice by the small-molecule PAK inhibitor FRAX486. Proc Natl Acad Sci.
Doll C, Broadie K (2014) Impaired activity-dependent neural circuit assembly and refinement in autism spectrum disorder genetic models. Front Cell Neurosci 8:1–26.
Doll C, Broadie K (2015) Activity-dependent FMRP requirements in development of the neural circuitry of learning and memory. Development 142:1346–1356.
Doll C, Broadie K (2016) Neuron class-specific requirements for fragile X mental retardation protein in critical period development of calcium signaling in learning and memory circuitry. Neurobiol Dis 89:76–87.

161
Doll CA, Vita DJ, Broadie K (2017) Fragile X Mental Retardation Protein Requirements in Activity-Dependent Critical Period Neural Circuit Refinement. Curr Biol.
Dolzhanskaya N, Sung YJ, Conti J, Currie JR, Denman RB (2003) The fragile X mental retardation protein interacts with U-rich RNAs in a yeast three-hybrid system. Biochem Biophys Res Commun.
Dougherty L, Singh R, Brown S, Dardick C, Xu K (2018) Exploring DNA variant segregation types in pooled genome sequencing enables effective mapping of weeping trait in Malus. J Exp Bot.
Dubnau J, Chiang A-S, Grady L, Barditch J, Gossweiler S, McNeil J, Smith P, Buldoc F, Scott R, Certa U, Broger C, Tully T (2003) The staufen/pumilio pathway is involved in Drosophila long-term memory. Curr Biol 13:286–296.
Duffy JB, Harrison DA, Perrimon N (1998) Identifying loci required for follicular patterning using directed mosaics. Development.
East JM (2010) Membrane trafficking. Mol Membr Biol.
Egger MD, Nowakowski RS, Peng B, Wyman RJ (1997) Patterns of connectivity in a Drosophila nerve. J Comp Neurol 387:63–72.
Ehrenreich IM, Torabi N, Jia Y, Kent J, Martis S, Shapiro JA, Gresham D, Caudy AA, Kruglyak L (2010) Dissection of genetically complex traits with extremely large pools of yeast segregants. Nature.
Ehyai S, Miyake T, Williams D, Vinayak J, Bayfield MA, McDermott JC (2018) FMRP recruitment of β‐catenin to the translation pre‐initiation complex represses translation. EMBO Rep.
Eichler K, Li F, Litwin-Kumar A, Park Y, Andrade I, Schneider-Mizell CM, Saumweber T, Huser A, Eschbach C, Gerber B, Fetter RD, Truman JW, Priebe CE, Abbott LF, Thum AS, Zlatic M, Cardona A (2017) The complete connectome of a learning and memory centre in an insect brain. Nature 548:175–182.
Elias LAB, Kriegstein AR (2008) Gap junctions: multifaceted regulators of embryonic cortical development. Trends Neurosci 31:243–250.
Elvira G, Wasiak S, Blandford V, Tong X-K, Serrano A, Fan X, del Rayo Sánchez-Carbente M, Servant F, Bell AW, Boismenu D, Lacaille J-C, McPherson PS, DesGroseillers L, Sossin WS (2006) Characterization of an RNA Granule from Developing Brain. Mol Cell Proteomics.
Engel J, Wu C (1996) Altered habituation of an identified escape circuit in Drosophila memory mutants. J Neurosci 76:3486–3499.
Engel JE, Xie XJ, Sokolowski MB, Wu CF (2000) A cGMP-dependent protein kinase gene, foraging, modifies habituation-like response decrement of the giant fiber escape circuit in Drosophila. Learn Mem.
Enneking E-M, Kudumala SR, Moreno E, Stephan R, Boerner J, Godenschwege TA, Pielage J (2013) Transsynaptic coordination of synaptic growth, function, and stability by the L1-type CAM Neuroglian. PLoS Biol 11:e1001537.
162
Erickson CA, Davenport MH, Schaefer TL, Wink LK, Pedapati E V., Sweeney JA, Fitzpatrick SE, Brown WT, Budimirovic D, Hagerman RJ, Hessl D, Kaufmann WE, Berry-Kravis E (2017) Fragile X targeted pharmacotherapy: Lessons learned and future directions. J Neurodev Disord.
Erickson CA, Weng N, Weiler IJ, Greenough WT, Stigler KA, Wink LK, McDougle CJ (2011) Open-label riluzole in fragile X syndrome. Brain Res.
Estévez R, Schroeder BC, Accardi A, Jentsch TJ, Pusch M (2003) Conservation of chloride channel structure revealed by an inhibitor binding site in ClC-1. Neuron.
Fan JY, Cui ZQ, Wei HP, Zhang ZP, Zhou YF, Wang YP, Zhang XE (2008) Split mCherry as a new red bimolecular fluorescence complementation system for visualizing protein-protein interactions in living cells. Biochem Biophys Res Commun.
Farhy-Tselnicker I, van Casteren ACM, Lee A, Chang VT, Aricescu AR, Allen NJ (2017) Astrocyte-Secreted Glypican 4 Regulates Release of Neuronal Pentraxin 1 from Axons to Induce Functional Synapse Formation. Neuron.
Farías GG, Alfaro IE, Cerpa W, Grabowski CP, Godoy JA, Bonansco C, Inestrosa NC (2009) Wnt-5a/JNK signaling promotes the clustering of PSD-95 in hippocampal neurons. J Biol Chem.
Favuzzi E, Rico B (2018) Molecular diversity underlying cortical excitatory and inhibitory synapse development. Curr Opin Neurobiol.
Fayyazuddin A, Zaheer MA, Hiesinger PR, Bellen HJ (2006) The nicotinic acetylcholine receptor Dalpha7 is required for an escape behavior in Drosophila. PLoS Biol 4.
Feinberg EH, VanHoven MK, Bendesky A, Wang G, Fetter RD, Shen K, Bargmann CI (2008) GFP Reconstitution Across Synaptic Partners (GRASP) Defines Cell Contacts and Synapses in Living Nervous Systems. Neuron.
Feng Y, Absher D, Eberhart DE, Brown V, Malter HE, Warren ST (1997a) FMRP associates with polyribosomes as an mRNP, and the I304N mutation of severe fragile X syndrome abolishes this association. Mol Cell.
Feng Y, Gutekunst C a, Eberhart DE, Yi H, Warren ST, Hersch SM (1997b) Fragile X mental retardation protein: Nucleocytoplasmic shuttling and association with somatodendritic ribosomes. J Neurosci.
Ferron L (2016) Fragile X mental retardation protein controls ion channel expression and activity. J Physiol 0:1–7.
Ferron L, Nieto-Rostro M, Cassidy JS, Dolphin AC (2014) Fragile X mental retardation protein controls synaptic vesicle exocytosis by modulating N-type calcium channel density. Nat Commun.
Fields RD, Itoh K (1996) Neural cell adhesion molecules in activity-dependent development and synaptic plasticity. Trends Neurosci.
Filippini A, Bonini D, Lacoux C, Pacini L, Zingariello M, Sancillo L, Bosisio D, Salvi V, Mingardi J, La Via L, Zalfa F, Bagni C, Barbon A (2017) Absence of the Fragile X Mental Retardation Protein results in
163
defects of RNA editing of neuronal mRNAs in mouse. RNA Biol.
Fire A, Xu S, Montgomery MK, Kostas SA, Driver SE, Mello CC (1998) Potent and specific genetic interference by double-stranded RNA in caenorhabditis elegans. Nature.
Flybase (n.d.) Flybase. Available at: http://flybase.org/ [Accessed March 12, 2018].
Fotowat H, Fayyazuddin A, Bellen HJ, Gabbiani F (2009) A Novel Neuronal Pathway for Visually Guided Escape in Drosophila melanogaster. J Neurophysiol 102:875–885.
Frank DD, Jouandet GC, Kearney PJ, MacPherson LJ, Gallio M (2015) Temperature representation in the Drosophila brain. Nature 519:358–361.
Fu YH, Kuhl DPA, Pizzuti A, Pieretti M, Sutcliffe JS, Richards S, Verkert AJMH, Holden JJA, Fenwick RG, Warren ST, Oostra BA, Nelson DL, Caskey CT (1991) Variation of the CGG repeat at the fragile X site results in genetic instability: Resolution of the Sherman paradox. Cell.
Gantois I et al. (2017) Metformin ameliorates core deficits in a mouse model of fragile X syndrome. Nat Med.
Gatto CL, Broadie K (2008) Temporal requirements of the fragile X mental retardation protein in the regulation of synaptic structure. Development.
Gatto CL, Broadie K (2011) Fragile X mental retardation protein is required for programmed cell death and clearance of developmentally-transient peptidergic neurons. Dev Biol.
Gaudry Q, Kristan WB (2009) Behavioral choice by presynaptic inhibition of tactile sensory terminals. Nat Neurosci 12:1450–1457.
Gerlai R (1996) Gene-targeting studies of mammalian behavior: Is it the mutation or the background genotype? Trends Neurosci.
Ghaziuddin M, Bolyard B, Alessi N (1994) Autistic disorder in Noonan syndrome. J Intellect Disabil Res.
Gholizadeh S, Arsenault J, Xuan IC on. Y, Pacey LK, Hampson DR (2014) Reduced phenotypic severity following adeno-associated virus-mediated Fmr1 gene delivery in fragile X mice. Neuropsychopharmacology.
Ghosh AS, Wang B, Pozniak CD, Chen M, Watts RJ, Lewcock JW (2011) DLK induces developmental neuronal degeneration via selective regulation of proapoptotic JNK activity. J Cell Biol 194:751–764.
Gibson DA, Ma L (2011) Developmental regulation of axon branching in the vertebrate nervous system. Development 138:183–195.
Gkogkas CG, Khoutorsky A, Cao R, Jafarnejad SM, Prager-Khoutorsky M, Giannakas N, Kaminari A, Fragkouli A, Nader K, Price TJ, Konicek BW, Graff JR, Tzinia AK, Lacaille J-C, Sonenberg N (2014) Pharmacogenetic Inhibition of eIF4E-Dependent Mmp9 mRNA Translation Reverses Fragile X Syndrome-like Phenotypes. Cell Rep:1–14.

164
Godenschwege T, Murphey R (2008) Genetic interaction of Neuroglian and Semaphorin1a during guidance and synapse formation. J Neurogenet 23:147–155.
Godenschwege TA, Hu H, Shan-Crofts X, Goodman CS, Murphey RK (2002) Bi-directional signaling by Semaphorin 1a during central synapse formation in Drosophila. Nat Neurosci 5:1294–1301.
Godenschwege TA, Kristiansen L V, Uthaman SB, Hortsch M, Murphey RK (2006) A conserved role for Drosophila Neuroglian and human L1-CAM in central-synapse formation. Curr Biol 16:12–23.
Golovin RM, Broadie K (2016) Developmental experience-dependent plasticity in the first synapse of the Drosophila olfactory circuit. J Neurophysiol 116:2730–2738.
Gorin PD, Johnson EM (1979) Experimental autoimmune model of nerve growth factor deprivation: effects on developing peripheral sympathetic and sensory neurons. Proc Natl Acad Sci U S A 76:5382–5386.
Goritz C, Mauch DH, Pfrieger FW (2005) Multiple mechanisms mediate cholesterol-induced synaptogenesis in a CNS neuron. Mol Cell Neurosci.
Grant SGN (2012) Synaptopathies: Diseases of the synaptome. Curr Opin Neurobiol.
Gratz SJ, Cummings AM, Nguyen JN, Hamm DC, Donohue LK, Harrison MM, Wildonger J, O’connor-Giles KM (2013) Genome engineering of Drosophila with the CRISPR RNA-guided Cas9 nuclease. Genetics.
Greenblatt EJ, Spradling AC (2018) Fragile X mental retardation 1 gene enhances the translation of large autism-related proteins. Science 361:709–712.
Greenough WT, Klintsova AY, Irwin SA, Galvez R, Bates KE, Weiler IJ (2001) Synaptic regulation of protein synthesis and the fragile X protein. Proc Natl Acad Sci.
Gross C, Yao X, Pong DL, Jeromin A, Bassell GJ (2011) Fragile X mental retardation protein regulates protein expression and mRNA translation of the potassium channel Kv4.2. J Neurosci 31:5693–5698.
Gu H, O’Dowd DK (2007) Whole cell recordings from brain of adult Drosophila. J Vis Exp:248.
Guo Y, Chen X, Xing R, Wang M, Zhu X, Guo W (2017) Interplay between FMRP and lncRNA TUG1 regulates axonal development through mediating SnoN-Ccd1 pathway. Hum Mol Genet.
Hammarlund M, Hobert O, Miller DM, Sestan N (2018) The CeNGEN Project: The Complete Gene Expression Map of an Entire Nervous System. Neuron.
Hanani M (2012) Lucifer yellow - an angel rather than the devil. J Cell Mol Med 16:22–31.
Hanganu IL, Okabe A, Lessmann V, Luhmann HJ (2009) Cellular mechanisms of subplate-driven and cholinergic input-dependent network activity in the neonatal rat somatosensory cortex. Cereb Cortex 19:89–105.

165
Harris SW, Hessl D, Goodlin-Jones B, Ferranti J, Bacalman S, Barbato I, Tassone F, Hagerman PJ, Herman K, Hagerman RJ, Herman H, Hagerman RJ (2008) Autism profiles of males with fragile X syndrome. Am J Ment Retard 113:427–438.
Harwell CC, Parker PRL, Gee SM, Okada A, McConnell SK, Kreitzer AC, Kriegstein AR (2012) Sonic Hedgehog Expression in Corticofugal Projection Neurons Directs Cortical Microcircuit Formation. Neuron.
He C-W, Liao C-P, Pan C-L (2018a) Wnt signalling in the development of axon, dendrites and synapses. Open Biol 8:180116.
He CX, Portera-Cailliau C (2013) The trouble with spines in fragile X syndrome: density, maturity and plasticity. Neuroscience 251:120–128.
He Q, Ge W (2017) The tandem Agenet domain of fragile X mental retardation protein interacts with FUS. Sci Rep.
He S, Cuentas-Condori A, Miller DM (2018b) NATF (Native And Tissue-specific Fluorescence): A strategy for bright, tissue-specific GFP labeling of native proteins. bioRxiv:1–29.
Heigwer F, Port F, Boutros M (2018) Rna interference (RNAi) screening in Drosophila. Genetics 208:853–874.
Herculano-Houzel S, Mota B, Lent R (2006) Cellular scaling rules for rodent brains. Proc Natl Acad Sci.
Hessl D, Dyer-Friedman J, Glaser B, Wisbeck J, Barajas RG, Taylor A, Reiss AL (2001) The Influence of Environmental and Genetic Factors on Behavior Problems and Autistic Symptoms in Boys and Girls With Fragile X Syndrome. Pediatrics.
Hiesinger PR, Scholz M, Meinertzhagen IA, Fischbach KF, Obermayer K (2001) Visualization of synaptic markers in the optic neuropils of Drosophila using a new constrained deconvolution method. J Comp Neurol.
Higashimori H, Morel L, Huth J, Lindemann L, Dulla C, Taylor A, Freeman M, Yang Y (2013) Astroglial FMRP-dependent translational down-regulation of mglur5 underlies glutamate transporter GLT1 dysregulation in the fragile X mouse. Hum Mol Genet 22:2041–2054.
Higashimori H, Schin CS, Chiang MSR, Morel L, Shoneye TA, Nelson DL, Yang Y (2016) Selective Deletion of Astroglial FMRP Dysregulates Glutamate Transporter GLT1 and Contributes to Fragile X Syndrome Phenotypes In Vivo. J Neurosci 36:7079–7094.
Hige T (2018) What can tiny mushrooms in fruit flies tell us about learning and memory? Neurosci Res 129:8–16.
Hinton VJ, Brown WT, Wisniewski K, Rudelli RD (1991) Analysis of neocortex in three males with the fragile X syndrome. Am J Med Genet 41:289–294.
Hobert O, Kratsios P (2019) Neuronal identity control by terminal selectors in worms, flies, and chordates. Curr Opin Neurobiol 56:97–105.
166
Hodge JJL, Choi JC, O’Kane CJ, Griffith LC (2005) Shaw potassium channel genes in Drosophila. J Neurobiol 63:235–254.
Hodgkin AL, Huxley AF (1939) Action potentials recorded from inside a nerve fibre. Nature.
Holtmaat A, Bonhoeffer T, Chow DK, Chuckowree J, De Paola V, Hofer SB, Hübener M, Keck T, Knott G, Lee W-CA, Mostany R, Mrsic-Flogel TD, Nedivi E, Portera-Cailliau C, Svoboda K, Trachtenberg JT, Wilbrecht L (2009) Long-term, high-resolution imaging in the mouse neocortex through a chronic cranial window. Nat Protoc 4:1128–1144.
Hsu CT, Bhandawat V (2016) Organization of descending neurons in Drosophila melanogaster. Sci Rep.
Huang Q, Zhou D, DiFiglia M (1992) Neurobiotin(TM), a useful neuroanatomical tracer for in vivo anterograde, retrograde and transneuronal tract-tracing and for in vitro labeling of neurons. J Neurosci Methods 41:31–43.
Hubel DH, Wiesel TN (1970) The period of susceptibility to the physiological effects of unilateral eye closure in kittens. J Physiol 206:419–436.
Hubel DH, Wiesel TN, LeVay S (1977) Plasticity of ocular dominance columns in monkey striate cortex. Philos Trans R Soc Lond B Biol Sci 278:377–409.
Hudry B, Viala S, Graba Y, Merabet S (2011) Visualization of protein interactions in living Drosophila embryos by the bimolecular fluorescence complementation assay. BMC Biol.
Hunter J, Rivero-Arias O, Angelov A, Kim E, Fotheringham I, Leal J (2014) Epidemiology of fragile X syndrome: A systematic review and meta-analysis. Am J Med Genet Part A.
Hunter JE, Epstein MP, Tinker SW, Charen KH, Sherman SL (2008) Fragile X-associated primary ovarian insufficiency: Evidence for additional genetic contributions to severity. Genet Epidemiol.
Ifrim MF, Williams KR, Bassell GJ (2015) Single-molecule imaging of PSD-95 mRNA translation in dendrites and its dysregulation in a mouse model of fragile X syndrome. J Neurosci 35:7116–7130.
Inoue SB, Shimoda M, Nishinokubi I, Siomi MC, Okamura M, Nakamura A, Kobayashi S, Ishida N, Siomi H (2002) A role for the Drosophila fragile X-related gene in circadian output. Curr Biol.
Iossifov I et al. (2014) The contribution of de novo coding mutations to autism spectrum disorder. Nature.
Irwin S, Galvez R, Greenough WT (2000) Dendritic spine structural anomalies in fragile-X mental retardation syndrome. Cereb Cortex 10:1038–1044.
Irwin S, Patel B, Idupulapati M, Harris JB, Crisostomo R, Larsen BP, Kooy F, Willems PJ, Cras P, Kozlowski PB, Swain R, Weiler IJ, Greenough WT (2001) Abnormal dendritic spine characteristics in the temporal and visual cortices of patients with fragile-X syndrome: a quantitative examination. Am J Med Genet 98:161–167.
Iwawaki T, Akai R, Kohno K, Miura M (2004) A transgenic mouse model for monitoring endoplasmic
167
reticulum stress. Nat Med.
Jabeen S, Thirumalai V (2018) The interplay between electrical and chemical synaptogenesis. J Neurophysiol.
Jacobs K, Todman MG, Allen MJ, Davies JA, Bacon JP (2000) Synaptogenesis in the giant-fibre system of Drosophila: interaction of the giant fibre and its major motorneuronal target. Development 127:5203–5212.
Jacquemont S, Berry-Kravis E, Hagerman R, Von Raison F, Gasparini F, Apostol G, Ufer M, Des Portes V, Gomez-Mancilla B (2014) The challenges of clinical trials in fragile X syndrome. Psychopharmacology (Berl).
Jacquemont S, Hagerman RJ, Hagerman PJ, Leehey MA (2007) Fragile-X syndrome and fragile X-associated tremor/ataxia syndrome: two faces of FMR1. Lancet Neurol.
Jan LY, Jan YN (1976) L-glutamate as an excitatory transmitter at the Drosophila larval neuromuscular junction. J Physiol 262:215–236.
Jarrell TA, Wang Y, Bloniarz AE, Brittin CA, Xu M, Thomson JN, Albertson DG, Hall DH, Emmons SW (2012) The connectome of a decision-making neural network. Science.
Jeck WR, Sorrentino JA, Wang K, Slevin MK, Burd CE, Liu J, Marzluff WF, Sharpless NE (2013) Circular RNAs are abundant, conserved, and associated with ALU repeats. RNA.
Jenett A et al. (2012) A gal4-driver line resource for Drosophila neurobiology. Cell Rep 2:991–1001.
Jeste SS, Geschwind DH (2016) Clinical trials for neurodevelopmental disorders: At a therapeutic frontier. Sci Transl Med.
Jin P, Zarnescu DC, Ceman S, Nakamoto M, Mowrey J, Jongens TA, Nelson DL, Moses K, Warren ST (2004) Biochemical and genetic interaction between the fragile X mental retardation protein and the microRNA pathway. Nat Neurosci 7:113–117.
Jinek M, Chylinski K, Fonfara I, Hauer M, Doudna JA, Charpentier E (2012) A programmable dual-RNA-guided DNA endonuclease in adaptive bacterial immunity. Science.
Jing L, Lefebvre JL, Gordon LR, Granato M (2009) Wnt Signals Organize Synaptic Prepattern and Axon Guidance through the Zebrafish unplugged/MuSK Receptor. Neuron.
Jontes JD, Buchanan JA, Smith SJ (2000) Growth cone and dendrite dynamics in zebrafish embryos: Early events in synaptogenesis imaged in vivo. Nat Neurosci.
Joseph RM, Sun JS, Tam E, Carlson JR (2017) A receptor and neuron that activate a circuit limiting sucrose consumption. Elife.
Kadas D, Papanikolopoulou K, Xirou S, Consoulas C, Skoulakis EMC (2019) Human Tau isoform-specific presynaptic deficits in a Drosophila Central Nervous System circuit. Neurobiol Dis 124:311–321.

168
Kalia YN, Naik A, Garrison J, Guy RH (2004) Iontophoretic drug delivery. Adv Drug Deliv Rev 56:619–658.
Kanai Y, Dohmae N, Hirokawa N (2004) Kinesin transports RNA: isolation and characterization of an RNA-transporting granule. Neuron 43:513–525.
Kanca O, Bellen HJ, Schnorrer F (2017) Gene tagging strategies to assess protein expression, localization, and function in Drosophila. Genetics 207:389–412.
Kandler K, Katz LC (1995) Neuronal coupling and uncoupling in the developing nervous system. Curr Opin Neurobiol 5:98–105.
Kanellopoulos AK, Semelidou O, Kotini AG, Anezaki M, Skoulakis EMC (2012) Learning and Memory Deficits Consequent to Reduction of the Fragile X Mental Retardation Protein Result from Metabotropic Glutamate Receptor-Mediated Inhibition of cAMP Signaling in Drosophila. J Neurosci.
Kasthuri N et al. (2015) Saturated Reconstruction of a Volume of Neocortex. Cell.
Katz B, Miledi R (1965) Release of acetylcholine from a nerve terminal by electric pulses of variable strength and duration. Nature.
Katz B, Miledi R (1967) The Release of Acetylcholine from Nerve Endings by Graded Electric Pulses. Proc R Soc B Biol Sci.
Kebschull JM, Garcia da Silva P, Reid AP, Peikon ID, Albeanu DF, Zador AM (2016) High-Throughput Mapping of Single-Neuron Projections by Sequencing of Barcoded RNA. Neuron.
Keegan AP, Comer CM (1993) The wind-elicited escape response of cockroaches (Periplaneta americana) is influenced by lesions rostral to the escape circuit. Brain Res.
Kennedy T, Broadie K (2017) Fragile X Mental Retardation Protein Restricts Small Dye Iontophoresis Entry into Central Neurons. J Neurosci:0723-17.
Kennedy T, Broadie K (2018) Newly Identified Electrically Coupled Neurons Support Development of the Drosophila Giant Fiber Model Circuit. eneuro 5:ENEURO.0346-18.2018.
Khayachi A et al. (2018) Sumoylation regulates FMRP-mediated dendritic spine elimination and maturation. Nat Commun.
Kim JH, Wang X, Coolon R, Ye B (2013) Dscam expression levels determine presynaptic arbor sizes in Drosophila sensory neurons. Neuron 78:827–838.
Kim M, Bellini M, Ceman S (2009) Fragile X Mental Retardation Protein FMRP Binds mRNAs in the Nucleus. Mol Cell Biol 29:214–228.
Kim SM, Su C-Y, Wang JW (2017) Neuromodulation of Innate Behaviors in Drosophila. Annu Rev Neurosci.
King DG, Wyman RJ (1980) Anatomy of the giant fibre pathway in Drosophila. I. Three thoracic

169
components of the pathway. J Neurocytol 9:753–770.
Klassen MP, Shen K (2007) Wnt Signaling Positions Neuromuscular Connectivity by Inhibiting Synapse Formation in C. elegans. Cell.
Koch C, Poggio T, Torre V (1983) Nonlinear interactions in a dendritic tree: localization, timing, and role in information processing. Proc Natl Acad Sci U S A.
Kodama NX, Feng T, Ullett JJ, Chiel HJ, Sivakumar SS, Galán RF (2018) Anti-correlated cortical networks arise from spontaneous neuronal dynamics at slow timescales. Sci Rep.
Koga K, Liu M-G, Qiu S, Song Q, O’Den G, Chen T, Zhuo M (2015) Impaired Presynaptic Long-Term Potentiation in the Anterior Cingulate Cortex of Fmr1 Knock-out Mice. J Neurosci.
Koles K, Yeh AR, Rodal AA (2016) Tissue-specific tagging of endogenous loci in Drosophila melanogaster. Biol Open.
Kong S, Sahin M, Collins CD, Wertz MH, Campbell MG, Leech JD, Krueger D, Bear MF, Kunkel LM, Kohane IS (2014) Divergent dysregulation of gene expression in murine models of fragile X syndrome and tuberous sclerosis. Mol Autism 5:1–11.
Kosmaczewski SG, Edwards TJ, Han SM, Eckwahl MJ, Meyer BI, Peach S, Hesselberth JR, Wolin SL, Hammarlund M (2014) The RtcB RNA ligase is an essential component of the metazoan unfolded protein response. EMBO Rep.
Koto M, Tanouye M, Ferrus A, Thomas J, Wyman R (1981) The morphology of the cervical giant fiber neuron of Drosophila. Brain Res 221:213–217.
Kremer MC, Jung C, Batelli S, Rubin GM, Gaul U (2017) The glia of the adult Drosophila nervous system. Glia.
Kudumala S, Freund J, Hortsch M, Godenschwege TA (2013) Differential effects of human L1CAM mutations on complementing guidance and synaptic defects in Drosophila melanogaster. PLoS One 8:e76974.
Kühn T, Ihalainen TO, Hyväluoma J, Dross N, Willman SF, Langowski J, Vihinen-Ranta M, Timonen J (2011) Protein diffusion in mammalian cell cytoplasm. PLoS One 6:e22962.
Kummer TT, Misgeld T, Sanes JR (2006) Assembly of the postsynaptic membrane at the neuromuscular junction: Paradigm lost. Curr Opin Neurobiol.
Kurshan PT, Merrill SA, Dong Y, Ding C, Hammarlund M, Bai J, Jorgensen EM, Shen K (2018) γ-Neurexin and Frizzled mediate parallel synapse assembly pathways antagonized by receptor endocytosis. Neuron.
Lai CQ, Leips J, Zou W, Roberts JF, Wollenberg KR, Parnell LD, Zeng ZB, Ordovas JM, Mackay TFC (2007) Speed-mapping quantitative trait loci using microarrays. Nat Methods.
Lanciego JL, Wouterlood FG (2011) A half century of experimental neuroanatomical tracing. J Chem
170
Neuroanat 42:157–183.
Lapper SR, Bolam JP (1991) The anterograde and retrograde transport of neurobiotin in the central nervous system of the rat: comparison with biocytin. J Neurosci Methods 39:163–174.
Lee A, Li W, Xu K, Bogert B, Su K, Gao F (2003a) Control of dendritic development by the Drosophila fragile X-related gene involves the small GTPase Rac1. Development.
Lee DA, Portnoy S, Hill P, Gillberg C, Patton MA (2005) Psychological profile of children with Noonan syndrome. Dev Med Child Neurol.
Lee HY, Ge W-P, Huang W, He Y, Wang GX, Rowson-Baldwin A, Smith SJ, Jan YN, Jan LY (2011) Bidirectional regulation of dendritic voltage-gated potassium channels by the fragile X mental retardation protein. Neuron 72:630–642.
Lee LH, Godenschwege TA (2014) Structure-function analyses of tyrosine phosphatase PTP69D in giant fiber synapse formation of Drosophila. Mol Cell Neurosci 64:24–31.
Lee RC, Clandinin TR, Lee CH, Chen PL, Meinertzhagen IA, Zipursky SL (2003b) The protocadherin Flamingo is required for axon target selection in the Drosophila visual system. Nat Neurosci.
Levine J, Tracey D (1973) Structure and function of the giant motorneuron ofDrosophila melanogaster. J Comp Physiol 87:213–235.
Li-Kroeger D, Kanca O, Lee P-T, Cowan S, Lee M, Jaiswal M, Salazar JL, He Y, Bellen H (2018) An expanded toolkit for gene tagging based on MiMIC and scarless CRISPR tagging in Drosophila. bioRxiv:337337.
Lichtman JW, Livet J, Sanes JR (2008) A technicolour approach to the connectome. Nat Rev Neurosci.
Lieberman OJ, McGuirt AF, Tang G, Sulzer D (2018) Roles for neuronal and glial autophagy in synaptic pruning during development. Neurobiol Dis.
Ligsay A, Hagerman RJ (2016) Review of targeted treatments in fragile X syndrome. Intractable Rare Dis Res.
Lima-Cabello E, Garcia-Guirado F, Calvo-Medina R, El Bekay R, Perez-Costillas L, Quintero-Navarro C, Sanchez-Salido L, De Diego-Otero Y (2016) An abnormal nitric oxide metabolism contributes to brain oxidative stress in the mouse model for the fragile X Syndrome, a possible role in intellectual disability. Oxid Med Cell Longev 2016.
Lin TY, Luo J, Shinomiya K, Ting CY, Lu Z, Meinertzhagen IA, Lee CH (2016) Mapping chromatic pathways in the Drosophila visual system. J Comp Neurol 524:213–227.
Lin W, Burgess RW, Dominguez B, Pfaff SL, Sanes JR, Lee KF (2001) Distinct roles of nerve and muscle in postsynaptic differentiation of the neuromuscular synapse. Nature.
Liu W, Jiang F, Bi X, Zhang YQ (2012) Drosophila FMRP participates in the DNA damage response by regulating G2/M cell cycle checkpoint and apoptosis. Hum Mol Genet.

171
Liu WW, Wilson RI (2013) Glutamate is an inhibitory neurotransmitter in the Drosophila olfactory system. Proc Natl Acad Sci.
Longair MH, Baker DA, Armstrong JD (2011) Simple neurite tracer: Open source software for reconstruction, visualization and analysis of neuronal processes. Bioinformatics 27:2453–2454.
Lu R, Wang H, Liang Z, Ku L, O’Donnell WT, Li W, Warren ST, Feng Y (2004) The fragile X protein controls microtubule-associated protein 1B translation and microtubule stability in brain neuron development. Proc Natl Acad Sci.
Luan H, Peabody NC, Vinson CR, White BH (2006) Refined Spatial Manipulation of Neuronal Function by Combinatorial Restriction of Transgene Expression. Neuron 52:425–436.
Luby-Phelps K (1999) Cytoarchitecture and Physical Properties of Cytoplasm: Volume, Viscosity, Diffusion, Intracellular Surface Area. Int Rev Cytol 192:189–221.
Luo L, Joyce Liao Y, Jan LY, Jan YN (1994) Distinct morphogenetic functions of similar small GTPases: Drosophila Drac1 is involved in axonal outgrowth and myoblast fusion. Genes Dev.
Luo L, O’Leary DDM (2005) Axon Retraction and Degeneration in Development and Disease. Annu Rev Neurosci.
Luquet E, Biesemann C, Munier A, Herzog E (2017) Purification of synaptosome populations using fluorescence-activated synaptosome sorting. In: Methods in Molecular Biology, pp 121–134.
MacPhee DJ (2010) Methodological considerations for improving Western blot analysis. J Pharmacol Toxicol Methods.
Macpherson LJ, Zaharieva EE, Kearney PJ, Alpert MH, Lin TY, Turan Z, Lee CH, Gallio M (2015) Dynamic labelling of neural connections in multiple colours by trans-synaptic fluorescence complementation. Nat Commun.
Maher BJ, McGinley MJ, Westbrook GL (2009) Experience-dependent maturation of the glomerular microcircuit. Proc Natl Acad Sci 106:16865–16870.
Marro D, Kalia YN, Delgado-Charro MB, Guy RH (2001) Optimizing iontophoretic drug delivery: Identification and distribution of the charge-carrying species. Pharm Res 18:1709–1713.
Martinez VG, Javadi CS, Ngo E, Ngo L, Lagow RD, Zhang B (2007) Age-related changes in climbing behavior and neural circuit physiology in drosophila. Dev Neurobiol 67:778–791.
Maurin T, Zongaro S, Bardoni B (2014) Fragile X Syndrome: From molecular pathology to therapy. Neurosci Biobehav Rev:1–14.
McBride SMJ, Choi CH, Wang Y, Liebelt D, Braunstein E, Ferreiro D, Sehgal A, Siwicki KK, Dockendorff TC, Nguyen HT, McDonald T V., Jongens TA (2005) Pharmacological rescue of synaptic plasticity, courtship behavior, and mushroom body defects in a Drosophila model of Fragile X syndrome. Neuron.
172
McCarroll SA, Altshuler DM (2007) Copy-number variation and association studies of human disease. Nat Genet.
McMahon AC, Rosbash M (2016) Promiscuous or discriminating: Has the favored mRNA target of Fragile X Mental Retardation Protein been overlooked? Proc Natl Acad Sci.
McManus CJ, Coolon JD, Duff MO, Eipper-Mains J, Graveley BR, Wittkopp PJ (2010) Regulatory divergence in Drosophila revealed by mRNA-seq. Genome Res.
Mehler MF, Mattick JS (2007) Noncoding RNAs and RNA Editing in Brain Development, Functional Diversification, and Neurological Disease. Physiol Rev.
Mejia M, Heghinian MD, Busch A, Armishaw CJ, Marí F, Godenschwege T a (2010) A novel approach for in vivo screening of toxins using the Drosophila Giant Fiber circuit. Toxicon 56:1398–1407.
Mejia M, Heghinian MD, Marí F, Godenschwege T a (2013) New tools for targeted disruption of cholinergic synaptic transmission in Drosophila melanogaster. PLoS One 8:e64685.
Melom JE, Littleton JT (2011) Synapse development in health and disease. Curr Opin Genet Dev.
Menon KP, Carrillo RA, Zinn K (2013) Development and plasticity of the Drosophila larval neuromuscular junction. Wiley Interdiscip Rev Dev Biol.
Meyers JR, MacDonald RB, Duggan A, Lenzi D, Standaert DG, Corwin JT, Corey DP (2003) Lighting up the senses: FM1-43 loading of sensory cells through nonselective ion channels. J Neurosci 23:4054–4065.
Michalon A, Sidorov M, Ballard TM, Ozmen L, Spooren W, Wettstein JG, Jaeschke G, Bear MF, Lindemann L (2012) Chronic Pharmacological mGlu5 Inhibition Corrects Fragile X in Adult Mice. Neuron.
Michel CI (2004) Defective Neuronal Development in the Mushroom Bodies of Drosophila Fragile X Mental Retardation 1 Mutants. J Neurosci.
Michelmore RW, Paran I, Kesseli R V. (1991) Identification of markers linked to disease-resistance genes by bulked segregant analysis: a rapid method to detect markers in specific genomic regions by using segregating populations. Proc Natl Acad Sci.
Mishra A, Dhingra K, Schüz A, Logothetis NK, Canals S (2010) Improved neuronal tract tracing with stable biocytin-derived neuroimaging agents. ACS Chem Neurosci 1:129–138.
Mlodzik M, Hiromi Y (1992) Enhancer Trap Method in Drosophila: Its Application to Neurobiology. Methods Neurosci.
Modney B, Muller KJ (1994) Novel synapses compensate for a neuron ablated in embryos. Proc R Soc B Biol Sci 257:263–269.
Mohr SE (2014) RNAi screening in Drosophila cells and in vivo. Methods 68:82–88.
173
Monzo K, Dowd SR, Minden JS, Sisson JC (2010) Proteomic analysis reveals CCT is a target of Fragile X mental retardation protein regulation in Drosophila. Dev Biol.
Moraes ÂM, Jorge SAC, Astray RM, Suazo CAT, Calderón Riquelme CE, Augusto EFP, Tonso A, Pamboukian MM, Piccoli RAM, Barral MF, Pereira CA (2012) Drosophila melanogaster S2 cells for expression of heterologous genes: From gene cloning to bioprocess development. Biotechnol Adv.
Mu L, Bacon JP, Ito K, Strausfeld NJ (2014) Responses of Drosophila giant descending neurons to visual and mechanical stimuli. J Exp Biol 217:2121–2129.
Muller HJ (1935) On the incomplete dominance of the normal allelomorphs of white in Drosophila. J Genet.
Muralidhar MG, Thomas JB (1993) The Drosophila bendless gene encodes a neural protein related to ubiquitin-conjugating enzymes. Neuron.
Murphey RK (2003) Targeted expression of shibirets and semaphorin 1a reveals critical periods for synapse formation in the giant fiber of Drosophila. Development 130:3671–3682.
Muthukumar AK, Stork T, Freeman MR (2014) Activity-dependent regulation of astrocyte GAT levels during synaptogenesis. Nat Neurosci 17:1340–1350.
Myrick LK, Deng P-Y, Hashimoto H, Oh YM, Cho Y, Poidevin MJ, Suhl J a., Visootsak J, Cavalli V, Jin P, Cheng X, Warren ST, Klyachko V a. (2015) Independent role for presynaptic FMRP revealed by an FMR1 missense mutation associated with intellectual disability and seizures. Proc Natl Acad Sci 112:949–956.
Nadim F, Bucher D (2014) Neuromodulation of neurons and synapses. Curr Opin Neurobiol.
Nagel G, Brauner M, Liewald JF, Adeishvili N, Bamberg E, Gottschalk A (2005) Light activation of Channelrhodopsin-2 in excitable cells of caenorhabditis elegans triggers rapid behavioral responses. Curr Biol.
Nagel G, Szellas T, Huhn W, Kateriya S, Adeishvili N, Berthold P, Ollig D, Hegemann P, Bamberg E (2003) Channelrhodopsin-2, a directly light-gated cation-selective membrane channel. Proc Natl Acad Sci U S A 100:13940–13945.
Namiki S, Dickinson MH, Wong AM, Korff W, Card GM (2018) The functional organization of descending sensory-motor pathways in Drosophila. Elife 7:50.
Narayanan U, Nalavadi V, Nakamoto M, Pallas DC, Ceman S, Bassell GJ, Warren ST (2007) FMRP Phosphorylation Reveals an Immediate-Early Signaling Pathway Triggered by Group I mGluR and Mediated by PP2A. J Neurosci.
Narayanan U, Nalavadi V, Nakamoto M, Thomas G, Ceman S, Bassell GJ, Warren ST (2008) S6K1 phosphorylates and regulates fragile X mental retardation protein (FMRP) with the neuronal protein synthesis-dependent mammalian target of rapamycin (mTOR) signaling cascade. J Biol Chem.

174
Naviaux RK, Zolkipli Z, Wang L, Nakayama T, Naviaux JC, Le TP, Schuchbauer MA, Rogac M, Tang Q, Dugan LL, Powell SB (2013) Antipurinergic therapy corrects the autism-like features in the poly(IC) mouse model. PLoS One 8:e57380.
Nern A, Pfeiffer BD, Rubin GM (2015) Optimized tools for multicolor stochastic labeling reveal diverse stereotyped cell arrangements in the fly visual system. Proc Natl Acad Sci 112:E2967–E2976.
Neuhaus-Follini A, Bashaw GJ (2015) Crossing the embryonic midline: Molecular mechanisms regulating axon responsiveness at an intermediate target. Wiley Interdiscip Rev Dev Biol.
Ng PC, Henikoff S (2003) SIFT: Predicting amino acid changes that affect protein function. Nucleic Acids Res.
Ni JQ, Liu LP, Binari R, Hardy R, Shim HS, Cavallaro A, Booker M, Pfeiffer BD, Markstein M, Wang H, Villalta C, Laverty TR, Perkins LA, Perrimon N (2009) A drosophila resource of transgenic RNAi lines for neurogenetics. Genetics.
Nicolai LJJ, Ramaekers A, Raemaekers T, Drozdzecki A, Mauss AS, Yan J, Landgraf M, Annaert W, Hassan BA (2010) Genetically encoded dendritic marker sheds light on neuronal connectivity in Drosophila. Proc Natl Acad Sci 107:20553–20558.
Niculescu D, Lohmann C (2014) Gap junctions in developing thalamic and neocortical neuronal networks. Cereb Cortex 24:3097–3106.
Nielsen MS, Axelsen LN, Sorgen PL, Verma V, Delmar M, Holstein-Rathlou NH (2012) Gap junctions. Compr Physiol.
Niere F, Wilkerson JR, Huber KM (2012) Evidence for a Fragile X Mental Retardation Protein-Mediated Translational Switch in Metabotropic Glutamate Receptor-Triggered Arc Translation and Long-Term Depression. J Neurosci.
Nimchinsky EA, Oberlander AM, Svoboda K (2001) Abnormal Development of Dendritic Spines in FMR1 Knock-Out Mice. J Neurosci.
Novak SM, Joardar A, Gregorio CC, Zarnescu DC (2015) Regulation of Heart Rate in Drosophila via Fragile X Mental Retardation Protein Bardoni B, ed. PLoS One 10:e0142836.
Nusser Z, Lujan R, Laube G, Roberts JDB, Molnar E, Somogyi P (1998) Cell type and pathway dependence of synaptic AMPA receptor number and variability in the hippocampus. Neuron.
O’Connor RM, Stone EF, Wayne CR, Marcinkevicius E V., Ulgherait M, Delventhal R, Pantalia MM, Hill VM, Zhou CG, McAllister S, Chen A, Ziegenfuss JS, Grueber WB, Canman JC, Shirasu-Hiza MM (2017) A Drosophila model of Fragile X syndrome exhibits defects in phagocytosis by innate immune cells. J Cell Biol.
O’Kane CJ (2011) Drosophila as a model organism for the study of neuropsychiatric disorders. Curr Top Behav Neurosci.
Oberlé I, Rousseau F, Heitz D, Kretz C, Devys D, Hanauer A, Boué J, Bertheas MF, Mandel JL (1991)

175
Instability of a 550-base pair DNA segment and abnormal methylation in fragile X syndrome. Science.
Olesnicky E, Bhogal B, Gavis E (2012) Combinatorial use of translational co-factors for cell type-specific regulation during neuronal morphogenesis in Drosophila. Dev Biol 365:208–218.
Orr BO, Borgen MA, Caruccio PM, Murphey RK (2014) Netrin and frazzled regulate presynaptic gap junctions at a Drosophila giant synapse. J Neurosci 34:5416–5430.
Osterweil EK, Chuang SC, Chubykin AA, Sidorov M, Bianchi R, Wong RKS, Bear MF (2013) Lovastatin corrects excess protein synthesis and prevents epileptogenesis in a mouse model of fragile X syndrome. Neuron 77:243–250.
Otsuna H, Ito M, Kawase T (2018) Color depth MIP mask search: a new tool to expedite Split-GAL4 creation. bioRxiv:318006.
Overall R, Jaffe LF (1985) Patterns of ionic current through Drosophila follicles and eggs. Dev Biol.
Pacey LKK, Xuan ICY, Guan S, Sussman D, Henkelman RM, Chen Y, Thomsen C, Hampson DR (2013) Delayed myelination in a mouse model of fragile X syndrome. Hum Mol Genet.
Pacheco A, Gallo G (2016) Actin filament-microtubule interactions in axon initiation and branching. Brain Res Bull.
Page-McCaw A, Ewald AJ, Werb Z (2007) Matrix metalloproteinases and the regulation of tissue remodelling. Nat Rev Mol Cell Biol.
Pai T, Chen C, Lin H, Chin A, Lai JS, Lee P, Tully T, Chiang A (2013) Drosophila ORB protein in two mushroom body output neurons is necessary for long-term memory formation. Proc Natl Acad Sci U S A 110:7898–7903.
Pan L, Broadie KS (2007) Drosophila Fragile X Mental Retardation Protein and Metabotropic Glutamate Receptor A Convergently Regulate the Synaptic Ratio of Ionotropic Glutamate Receptor Subclasses. J Neurosci.
Pan L, Woodruff E, Liang P, Broadie K (2008) Mechanistic relationships between Drosophila fragile X mental retardation protein and metabotropic glutamate receptor A signaling. Mol Cell Neurosci.
Pan L, Zhang YQ, Woodruff E, Broadie K (2004) The Drosophila fragile X gene negatively regulates neuronal elaboration and synaptic differentiation. Curr Biol.
Paradee W, Melikian HE, Rasmussen DL, Kenneson A, Conn PJ, Warren ST (1999) Fragile X mouse: Strain effects of knockout phenotype and evidence suggesting deficient amygdala function. Neuroscience.
Park CY, Halevy T, Lee DR, Sung JJ, Lee JS, Yanuka O, Benvenisty N, Kim DW (2015) Reversion of FMR1 Methylation and Silencing by Editing the Triplet Repeats in Fragile X iPSC-Derived Neurons. Cell Rep 13:234–241.
176
Park M, Shen K (2012) WNTs in synapse formation and neuronal circuitry. EMBO J.
Patel a B, Loerwald KW, Huber KM, Gibson JR (2014) Postsynaptic FMRP promotes the pruning of cell-to-cell connections among pyramidal neurons in the L5A neocortical network. J Neurosci 34:3413–3418.
Patel MR, Lehrman EK, Poon VY, Crump JG, Zhen M, Bargmann CI, Shen K (2006) Hierarchical assembly of presynaptic components in defined C. elegans synapses. Nat Neurosci.
Paul S, Bownes M (1981) Staging the metamorphosis of Drosophila melanogaster. Embryol exp Morph.
Pearson HE, Stoffler DJ (1992) Retinal ganglion cell degeneration following loss of postsynaptic target neurons in the dorsal lateral geniculate nucleus of the adult cat. Exp Neurol 116:163–171.
Penn AA (2001) Early brain wiring: Activity-dependent processes. Schizophr Bull.
Pérez-Pérez JM, Candela H, Micol JL (2009) Understanding synergy in genetic interactions. Trends Genet.
Periasamy N, Kao HP, Fushimi K, Verkman a S (1992) Organic osmolytes increase cytoplasmic viscosity in kidney cells. Am J Physiol.
Perin MS, Johnston PA, Ozcelik T, Jahn R, Francke U, Sudhof TC (1991) Structural and functional conservation of synaptotagmin (p65) in Drosophila and humans. J Biol Chem.
Perkins LA et al. (2015) The transgenic RNAi project at Harvard medical school: Resources and validation. Genetics.
Pézier A, Jezzini SH, Marie B, Blagburn JM (2014) Engrailed alters the specificity of synaptic connections of Drosophila auditory neurons with the giant fiber. J Neurosci 34:11691–11704.
Pfeiffer B, Huber K (2009) The state of synapses in fragile X syndrome. Neurosci 15:549–567.
Pfeiffer BD, Ngo TTB, Hibbard KL, Murphy C, Jenett A, Truman JW, Rubin GM (2010) Refinement of tools for targeted gene expression in Drosophila. Genetics 186:735–755.
Phan AT, Kuryavyi V, Darnell JC, Serganov A, Majumdar A, Ilin S, Raslin T, Polonskaia A, Chen C, Clain D, Darnell RB, Patel DJ (2011) Structure-function studies of FMRP RGG peptide recognition of an RNA duplex-quadruplex junction. Nat Struct Mol Biol.
Phelan P (2005) Innexins: members of an evolutionarily conserved family of gap-junction proteins. Biochim Biophys Acta 1711:225–245.
Phelan P, Bacon P, Moffat KG, Kane CJO, Davies JA (1996) Mutations in shaking-B prevent electrical synapse formation in the Drosophila giant fiber system. J Neurosci 6:1101–1113.
Phelan P, Goulding LA, Tam JLY, Allen MJ, Dawber RJ, Davies JA, Bacon JP (2008) Molecular mechanism of rectification at identified electrical synapses in the Drosophila giant fiber system. Curr Biol 18:1955–1960.
Philbrook A, Ramachandran S, Lambert CM, Oliver D, Florman J, Alkema MJ, Lemons M, Francis MM
177
(2018) Neurexin directs partner-specific synaptic connectivity in C. elegans. Elife.
Pielage J, Cheng L, Fetter RD, Carlton PM, Sedat JW, Davis GW (2008) A Presynaptic Giant Ankyrin Stabilizes the NMJ through Regulation of Presynaptic Microtubules and Transsynaptic Cell Adhesion. Neuron.
Pielage J, Fetter RD, Davis GW (2005) Presynaptic spectrin is essential for synapse stabilization. Curr Biol.
Pikal MJ (2001) The role of electroosmotic flow in transdermal iontophoresis. Adv Drug Deliv Rev 46:281–305.
Platts AE, Land SJ, Chen L, Page GP, Rasouli P, Wang L, Lu X, Ruden DM (2009) Massively parallel resequencing of the isogenic Drosophila melanogaster strain w1118; Iso-2; iso-3 identifies hotspots for mutations in sensory perception genes. Fly (Austin).
Poirier C, Collignon O, Scheiber C, Renier L, Vanlierde A, Tranduy D, Veraart C, De Volder AG (2006) Auditory motion perception activates visual motion areas in early blind subjects. Neuroimage 31:279–285.
Pool JE (2016) Genetic mapping by bulk segregant analysis in Drosophila: Experimental design and simulation-based inference. Genetics.
Port F, Chen H-M, Lee T, Bullock SL (2014) Optimized CRISPR/Cas tools for efficient germline and somatic genome engineering in Drosophila. Proc Natl Acad Sci U S A.
Portera-Cailliau C (2011) Which Comes First in Fragile X Syndrome, Dendritic Spine Dysgenesis or Defects in Circuit Plasticity? Neurosci 18:28–44.
Power ME (1948) The thoracico-abdominal nervous system of an adult insect, Drosophila melanogaster. J Comp Neurol 88:347–409.
Prevedel R, Yoon Y-G, Hoffmann M, Pak N, Wetzstein G, Kato S, Schrödel T, Raskar R, Zimmer M, Boyden ES, Vaziri A (2014) Simultaneous whole-animal 3D imaging of neuronal activity using light-field microscopy. Nat Methods 11:727–730.
Price JL (2005) Genetic screens for clock mutants in Drosophila. Methods Enzymol.
Price TJ, Flores CM, Cervero F, Hargreaves KM (2006) The RNA binding and transport proteins staufen and fragile X mental retardation protein are expressed by rat primary afferent neurons and localize to peripheral and central axons. Neuroscience.
Qin M, Kang J, Burlin T V, Jiang C, Smith CB (2005) Postadolescent changes in regional cerebral protein synthesis: an in vivo study in the FMR1 null mouse. J Neurosci 25:5087–5095.
Rabinowitch I, Laurent P, Zhao B, Walker D, Beets I, Schoofs L, Bai J, Schafer WR, Treinin M (2016) Neuropeptide-Driven Cross-Modal Plasticity following Sensory Loss in Caenorhabditis elegans. PLoS Biol 14.
Ramos A, Hollingworth D, Pastore A (2003) G-quartet-dependent recognition between the FMRP RGG

178
box and RNA. RNA.
Ray D et al. (2013) A compendium of RNA-binding motifs for decoding gene regulation. Nature.
Reiter LT, Potocki L, Chien S, Gribskov M, Bier E (2001) A systematic analysis of human disease-associated gene sequences in Drosophila melanogaster. Genome Res.
Ribeiro LF, Verpoort B, de Wit J (2018) Trafficking mechanisms of synaptogenic cell adhesion molecules. Mol Cell Neurosci.
Riccomagno MM, Kolodkin AL (2015) Sculpting Neural Circuits by Axon and Dendrite Pruning. Annu Rev Cell Dev Biol.
Richter JD, Bassell GJ, Klann E (2015) Dysregulation and restoration of translational homeostasis in fragile X syndrome. Nat Rev Neurosci.
Rizzi G, Tan KR (2017) Dopamine and Acetylcholine, a Circuit Point of View in Parkinson’s Disease. Front Neural Circuits.
Roden DM, Pulley JM, Basford MA, Bernard GR, Clayton EW, Balser JR, Masys DR (2008) Development of a large-scale de-identified DNA biobank to enable personalized medicine. Clin Pharmacol Ther.
Rong YS, Golic KG (2000) Gene targeting by homologous recombination in Drosophila. Science.
Rorth P, Szabo K, Bailey A, Laverty T, Tehm J, Rubin GM, Weigmann K, Milan M, Benes V, Ansorge W, Cohen SM, Rørth P, Rehm J, Milán M (1998) Systematic gain-of-function genetics in Drosophila. Development.
Rosso SB, Inestrosa NC (2013) WNT signaling in neuronal maturation and synaptogenesis. Front Cell Neurosci.
Ruby K, Falvey K, Kulesza RJ (2015) Abnormal neuronal morphology and neurochemistry in the auditory brainstem of Fmr1 knockout rats. Neuroscience.
Sackin H, Boulpaep EL (1981) Isolated perfused salamander proximal tubule: methods, electrophysiology, and transport. Am J Physiol 241:F39-52.
Salinas PC (2003) Synaptogenesis: Wnt and TGF-β take centre stage. Curr Biol.
Sanes JR, Masland RH (2015) The Types of Retinal Ganglion Cells: Current Status and Implications for Neuronal Classification. Annu Rev Neurosci.
Sanes JR, Zipursky SL (2010) Design Principles of Insect and Vertebrate Visual Systems. Neuron.
Sawicka K, Pyronneau A, Chao M, Bennett MVL, Zukin RS (2016) Elevated ERK/p90 ribosomal S6 kinase activity underlies audiogenic seizure susceptibility in fragile X mice. Proc Natl Acad Sci.
Schafer DP, Stevens B (2013) Phagocytic glial cells: Sculpting synaptic circuits in the developing nervous system. Curr Opin Neurobiol.

179
Scheiffele P, Fan J, Choih J, Fetter R, Serafini T (2000) Neuroligin expressed in nonneuronal cells triggers presynaptic development in contacting axons. Cell.
Schikorski T, Stevens CF (1997) Quantitative Ultrastructural Analysis of Hippocampal Excitatory Synapses. J Neurosci.
Schindelin J, Arganda-Carreras I, Frise E, Kaynig V, Longair M, Pietzsch T, Preibisch S, Rueden C, Saalfeld S, Schmid B, Tinevez J-Y, White DJ, Hartenstein V, Eliceiri K, Tomancak P, Cardona A (2012) Fiji: an open-source platform for biological-image analysis. Nat Methods 9:676–682.
Schneider CA, Rasband WS, Eliceiri KW (2012) NIH Image to ImageJ: 25 years of image analysis. Nat Methods 9:671–675.
Schofield BR (2008) Retrograde axonal tracing with fluorescent markers. Curr Protoc Neurosci 1.17:1–24.
Schreiner D, Savas JN, Herzog E, Brose N, de Wit J (2017) Synapse biology in the ‘circuit-age’—paths toward molecular connectomics. Curr Opin Neurobiol.
Sestan N, State MW (2018) Lost in Translation: Traversing the Complex Path from Genomics to Therapeutics in Autism Spectrum Disorder. Neuron.
Sethna F, Feng W, Ding Q, Robison AJ, Feng Y, Wang H (2017) Enhanced expression of ADCY1 underlies aberrant neuronal signalling and behaviour in a syndromic autism model. Nat Commun 8:14359.
Shamay-Ramot A, Khermesh K, Porath HT, Barak M, Pinto Y, Wachtel C, Zilberberg A, Lerer-Goldshtein T, Efroni S, Levanon EY, Appelbaum L (2015) Fmrp Interacts with Adar and Regulates RNA Editing, Synaptic Density and Locomotor Activity in Zebrafish. PLOS Genet 11:e1005702.
Sharma A, Hoeffer CA, Takayasu Y, Miyawaki T, McBride SM, Klann E, Zukin RS (2010) Dysregulation of mTOR Signaling in Fragile X Syndrome. J Neurosci.
Shen K, Bargmann CI (2003) The immunoglobulin superfamily protein SYG-1 determines the location of specific synapses in C. elegans. Cell.
Shendure J, Balasubramanian S, Church GM, Gilbert W, Rogers J, Schloss JA, Waterston RH (2017) DNA sequencing at 40: Past, present and future. Nature.
Shtang S, Perry MD, Percy ME (1999) Search for a Caenorhabditis elegans FMR1 homologue: Identification of a new putative RNA-binding protein (PRP-1) that hybridizes to the mouse FMR1 double K homology domain. Am J Med Genet.
Sialana FJ, Gulyassy P, Májek P, Sjöstedt E, Kis V, Müller AC, Rudashevskaya EL, Mulder J, Bennett KL, Lubec G (2016) Mass spectrometric analysis of synaptosomal membrane preparations for the determination of brain receptors, transporters and channels. Proteomics 16:2911–2920.
Siller SS, Broadie K (2011) Neural circuit architecture defects in a Drosophila model of Fragile X syndrome are alleviated by minocycline treatment and genetic removal of matrix metalloproteinase. Dis Model Mech 4:673–685.

180
Singh A, Singh S (1999) Unmasking of a novel potassium current in Drosophila by a mutation and drugs. J Neurosci 19:6838–6843.
Singh SK, Stogsdill JA, Pulimood NS, Dingsdale H, Kim YH, Pilaz LJ, Kim IH, Manhaes AC, Rodrigues WS, Pamukcu A, Enustun E, Ertuz Z, Scheiffele P, Soderling SH, Silver DL, Ji RR, Medina AE, Eroglu C (2016) Astrocytes Assemble Thalamocortical Synapses by Bridging NRX1α and NL1 via Hevin. Cell.
Sinkey RG, Odibo AO (2017) Noonan Syndrome. In: Obstetric Imaging: Fetal Diagnosis and Care: Second Edition.
Siomi H, Choi M, Siomi MC, Nussbaum RL, Dreyfuss G (1994) Essential role for KH domains in RNA binding: Impaired RNA binding by a mutation in the KH domain of FMR1 that causes fragile X syndrome. Cell.
Siomi H, Siomi MC, Nussbaum RL, Dreyfuss G (1993) The protein product of the fragile X gene, FMR1, has characteristics of an RNA-binding protein. Cell.
Siomi MC, Siomi H, Sauer WH, Srinivasan S, Nussbaum RL, Dreyfuss G (1995) FXR1, an autosomal homolog of the fragile X mental retardation gene. Eur Mol Biol Organ J.
Sivaguru M, Urban MA, Fried G, Wesseln CJ, Mander L, Punyasena SW (2016) Comparative performance of airyscan and structured illumination superresolution microscopy in the study of the surface texture and 3D shape of pollen. Microsc Res Tech.
Smith HK, Roberts IJH, Allen MJ, Connolly JB, Moffat KG, O’Kane CJ (1996) Inducible ternary control of transgene expression and cell ablation in Drosophila. Dev Genes Evol 206:14–24.
Snyder EM, Philpot BD, Huber KM, Dong X, Fallon JR, Bear MF (2001) Internalization of ionotropic glutamate receptors in response to mGluR activation. Nat Neurosci.
Söhl G, Willecke K (2003) An Update on Connexin Genes and their Nomenclature in Mouse and Man. Cell Commun Adhes.
Spencer CC, Howell CE, Wright AR, Promislow DEL (2003) Testing an “aging gene” in long-lived drosophila strains: increased longevity depends on sex and genetic background. Aging Cell.
Spencer CM, Alekseyenko O, Hamilton SM, Thomas AM, Serysheva E, Yuva-Paylor LA, Paylor R (2011) Modifying behavioral phenotypes in Fmr1KO mice: Genetic background differences reveal autistic-like responses. Autism Res.
Spencer CM, Serysheva E, Yuva-Paylor LA, Oostra BA, Nelson DL, Paylor R (2006) Exaggerated behavioral phenotypes in Fmr1/Fxr2 double knockout mice reveal a functional genetic interaction between Fragile X-related proteins. Hum Mol Genet.
Spradling AC, Rubin GM (1982) Transposition of cloned P elements into Drosophila germ line chromosomes. Science.
Staudt T, Lang MC, Medda R, Engelhardt J, Hell SW (2007) 2,2 ’-thiodiethanol: A new water soluble mounting medium for high resolution optical microscopy. Microsc Res Tech 70:1–9.
181
Stebbings LA, Todman MG, Phillips R, Greer CE, Tam J, Phelan P, Jacobs K, Bacon JP, Davies JA (2002) Gap junctions in Drosophila: Developmental expression of the entire innexin gene family. Mech Dev 113:197–205.
Stensmyr MC, Dweck HKM, Farhan A, Ibba I, Strutz A, Mukunda L, Linz J, Grabe V, Steck K, Lavista-Llanos S, Wicher D, Sachse S, Knaden M, Becher PG, Seki Y, Hansson BS (2012) A conserved dedicated olfactory circuit for detecting harmful microbes in drosophila. Cell 151:1345–1357.
Stepan J, Dine J, Eder M (2015) Functional optical probing of the hippocampal trisynaptic circuit in vitro: Network dynamics, filter properties, and polysynaptic induction of CA1 LTP. Front Neurosci.
Streit AK, Fan YN, Masullo L, Baines RA (2016) Calcium imaging of neuronal activity in Drosophila can identify anticonvulsive compounds. PLoS One.
Strumbos JG, Brown MR, Kronengold J, Polley DB, Kaczmarek LK (2010) Fragile X mental retardation protein is required for rapid experience-dependent regulation of the potassium channel Kv3.1b. J Neurosci 30:10263–10271.
Südhof TC (2018) Towards an Understanding of Synapse Formation. Neuron.
Sugiura Y, Lin W (2011) Neuron–glia interactions: the roles of Schwann cells in neuromuscular synapse formation and function. Biosci Rep.
Suhl JA, Chopra P, Anderson BR, Bassell GJ, Warren ST (2014) Analysis of FMRP mRNA target datasets reveals highly associated mRNAs mediated by G-quadruplex structures formed via clustered WGGA sequences. Hum Mol Genet.
Sun M-K, Hongpaisan J, Alkon DL (2016) Rescue of Synaptic Phenotypes and Spatial Memory in Young Fragile X Mice. J Pharmacol Exp Ther.
Sun Y, Wyman RJ (1997) Neurons of the Drosophila giant fiber system: I. Dorsal longitudinal motor neurons. J Comp Neurol 387:157–166.
Sun YA, Wyman RJ (1996) Passover eliminates gap junctional communication between neurons of the giant fiber system in Drosophila. J Neurobiol 30:340–348.
Sung YJ, Dolzhanskaya N, Nolin SL, Brown T, Currie JR, Denman RB (2003) The fragile X mental retardation protein FMRP binds elongation factor 1A mRNA and negatively regulates its translation in vivo. J Biol Chem.
Tabet R, Moutin E, Becker JAJ, Heintz D, Fouillen L, Flatter E, Krężel W, Alunni V, Koebel P, Dembélé D, Tassone F, Bardoni B, Mandel J-L, Vitale N, Muller D, Le Merrer J, Moine H (2016) Fragile X Mental Retardation Protein (FMRP) controls diacylglycerol kinase activity in neurons. Proc Natl Acad Sci:201522631.
Takemura S ya et al. (2017) A connectome of a learning and memory center in the adult Drosophila brain. Elife.
Talay M, Richman EB, Snell NJ, Hartmann GG, Fisher JD, Sorkaç A, Santoyo JF, Chou-Freed C, Nair N,

182
Johnson M, Szymanski JR, Barnea G (2017) Transsynaptic Mapping of Second-Order Taste Neurons in Flies by trans-Tango. Neuron:1–13.
Tamanini F, Willemsen R, Van Unen L, Bontekoe C, Galjaard H, Oostra BA, Hoogeveen AT (1997) Differential expression of FMR1, FXR1 and FXR2 proteins in human brain and testis. Hum Mol Genet.
Tang SJ, Meulemans D, Vazquez L, Colaco N, Schuman E (2001) A role for a rat homolog of staufen in the transport of RNA to neuronal dendrites. Neuron 32:463–475.
Tanouye M a, Ferrus A, Fujita SC (1981) Abnormal action potentials associated with the Shaker complex locus of Drosophila. Proc Natl Acad Sci U S A 78:6548–6552.
Tanouye MA, Wyman RJ (1980) Motor outputs of giant nerve fiber in Drosophila. J Neurophysiol 44:405–421.
Tashiro A, Dunaevsky A, Blazeski R, Mason CA, Yuste R (2003) Bidirectional regulation of hippocampal mossy fiber filopodial motility by kainate receptors: A two-step model of synaptogenesis. Neuron.
Tessier C, Broadie K (2008) Drosophila fragile X mental retardation protein developmentally regulates activity-dependent axon pruning. Development 135:1547–1557.
Tessier CR (2009) Activity-dependent modulation of neural circuit synaptic connectivity. Front Mol Neurosci.
Tessier CR, Broadie K (2012) Molecular and genetic analysis of the Drosophila model of fragile X syndrome. Results Probl Cell Differ 54:119–156.
Thavarajah R, Mudimbaimannar V, Rao U, Ranganathan K, Elizabeth J (2012) Chemical and physical basics of routine formaldehyde fixation. J Oral Maxillofac Pathol.
The Dutch-Belgian Fragile X Consorthium et al. (1994) Fmr1 knockout mice: A model to study fragile X mental retardation. Cell.
Thomas JB, Wyman RJ (1984) Mutations altering synaptic connectivity between identified neurons in Drosophila. J Neurosci 4:530–538.
Thomas MG, Loschi M, Desbats MA, Boccaccio GL (2011) RNA granules: The good, the bad and the ugly. Cell Signal.
Tian Y, Yang C, Shang S, Cai Y, Deng X, Zhang J, Shao F, Zhu D, Liu Y, Chen G, Liang J, Sun Q, Qiu Z, Zhang C (2017) Loss of FMRP Impaired Hippocampal Long-Term Plasticity and Spatial Learning in Rats. Front Mol Neurosci 10:1–14.
Tierney AJ (1986) The evolution of learned and innate behavior: Contributions from genetics and neurobiology to a theory of behavioral evolution. Anim Learn Behav.
Tirian L, Dickson B (2017) The VT GAL4, LexA, and split-GAL4 driver line collections for targeted expression in the Drosophila nervous system. bioRxiv:198648.

183
Tosches MA (2017) Developmental and genetic mechanisms of neural circuit evolution. Dev Biol.
Trimarchi JR, Jin P, Murphey RK (1999) Controlling the motor neuron. Int Rev Neurobiol 43:241–264.
Trimarchi JR, Schneiderman a M (1995) Different neural pathways coordinate Drosophila flight initiations evoked by visual and olfactory stimuli. J Exp Biol 198:1099–1104.
Trimarchi JR, Schneiderman AM (1993) Giant fiber activation of an intrinsic muscle in the mesothoracic leg of Drosophila melanogaster. J Exp Biol 177:149–167.
Turner T, Adams M, Dunlap K (1993) Multiple Ca2+ channel types coexist to regulate synaptosomal neurotransmitter release. Proc Natl Acad Sci U S A.
Uesaka N (2005) Activity Dependence of Cortical Axon Branch Formation: A Morphological and Electrophysiological Study Using Organotypic Slice Cultures. J Neurosci 25:1–9.
Ugarte G, Delgado R, O’Day PM, Farjah F, Cid LP, Vergara C, Bacigalupo J (2005) Putative ClC-2 chloride channel mediates inward rectification in Drosophila retinal photoreceptors. J Membr Biol.
Ullian EM, Sapperstein SK, Christopherson KS, Barres BA (2001) Control of synapse number by glia. Science.
Unsain N, Barker PA (2015) New Views on the Misconstrued: Executioner Caspases and Their Diverse Non-apoptotic Roles. Neuron.
Urwyler O, Izadifar A, Dascenco D, Petrovic M, He H, Ayaz D, Kremer A, Lippens S, Baatsen P, Guerin CJ, Schmucker D (2015) Investigating CNS synaptogenesis at single-synapse resolution by combining reverse genetics with correlative light and electron microscopy. Development.
Uthaman SB, Godenschwege T a, Murphey RK (2008) A mechanism distinct from highwire for the Drosophila ubiquitin conjugase bendless in synaptic growth and maturation. J Neurosci 28:8615–8623.
Valakh V, Naylor SA, Berns DS, DiAntonio A (2012) A large-scale RNAi screen identifies functional classes of genes shaping synaptic development and maintenance. Dev Biol.
Veneri M, Zalfa F, Bagni C (2004) FMRP and its target RNAs: Fishing for the specificity. Neuroreport.
Venken KJT, Schulze KL, Haelterman NA, Pan H, He Y, Evans-Holm M, Carlson JW, Levis RW, Spradling AC, Hoskins RA, Bellen HJ (2011) MiMIC: a highly versatile transposon insertion resource for engineering Drosophila melanogaster genes. Nat Methods 8:737–743.
Verkman AS (2002) Solute and macromolecule diffusion in cellular aqueous compartments. Trends Biochem Sci.
Vessey JP, Vaccani A, Xie Y, Dahm R, Karra D, Kiebler MA, Macchi P (2006) Dendritic localization of the translational repressor Pumilio 2 and its contribution to dendritic stress granules. J Neurosci 26:6496–6508.
184
Vicario-Abejón C, Owens D, McKay R, Segal M (2002) Role of neurotrophins in central synapse formation and stabilization. Nat Rev Neurosci.
Vita DJ, Broadie K (2017) ESCRT-III Membrane Trafficking Misregulation Contributes to Fragile X Syndrome Synaptic Defects. Sci Rep.
von Reyn CR, Breads P, Peek MY, Zheng GZ, Williamson WR, Yee AL, Leonardo A, Card GM (2014) A spike-timing mechanism for action selection. Nat Neurosci 17:962–970.
Wagh DA, Rasse TM, Asan E, Hofbauer A, Schwenkert I, Dürrbeck H, Buchner S, Dabauvalle MC, Schmidt M, Qin G, Wichmann C, Kittel R, Sigrist SJ, Buchner E (2006) Bruchpilot, a protein with homology to ELKS/CAST, is required for structural integrity and function of synaptic active zones in Drosophila. Neuron.
Waites CL, Craig AM, Garner CC (2005) Mechanisms of Vertebrate Synaptogenesis. Annu Rev Neurosci.
Walker JM (1996) The Bicinchoninic Acid (BCA) Assay for Protein Quantitation. In: The Protein Protocols Handbook.
Wan L, Dockendorff TC, Jongens TA, Dreyfuss G (2000) Characterization of dFMR1, a Drosophila melanogaster homolog of the fragile X mental retardation protein. Mol Cell Biol 20:8536–8547.
Wang X, Snape M, Klann E, Stone JG, Singh A, Petersen RB, Castellani RJ, Casadesus G, Smith MA, Zhu X (2012) Activation of the extracellular signal-regulated kinase pathway contributes to the behavioral deficit of fragile x-syndrome. J Neurochem.
Ward A, Hong W, Favaloro V, Luo L (2015) Toll Receptors Instruct Axon and Dendrite Targeting and Participate in Synaptic Partner Matching in a Drosophila Olfactory Circuit. Neuron 85:1013–1028.
Ward LD, Kellis M (2012) Interpreting noncoding genetic variation in complex traits and human disease. Nat Biotechnol.
Watson KK, Platt ML (2012) Of mice and monkeys: Using non-human primate models to bridge mouse- and human-based investigations of autism spectrum disorders. J Neurodev Disord.
Weber PA, Chang HC, Spaeth KE, Nitsche JM, Nicholson BJ (2004) The permeability of gap junction channels to probes of different size is dependent on connexin composition and permeant-pore affinities. Biophys J 87:958–973.
Weiler IJ, Spangler CC, Klintsova AY, Grossman AW, Kim SH, Bertaina-Anglade V, Khaliq H, de Vries FE, Lambers F a E, Hatia F, Base CK, Greenough WT (2004) Fragile X mental retardation protein is necessary for neurotransmitter-activated protein translation at synapses. Proc Natl Acad Sci USA.
Welihinda AA, Kaufmant RJ (1996) The unfolded protein response pathway in Saccharomyces cerevisiae. Oligomerization and trans-phosphorylation of Ire1p (Ern1p) are required for kinase activation. J Biol Chem.
Wells DG (2006) RNA-Binding Proteins: A Lesson in Repression. J Neurosci.

185
Wheatley D. (1998) Diffusion theory, the cell and the synapse. Biosystems 45:151–163.
White JG, Southgate E, Thomson JN, Brenner S (1986) The Structure of the Nervous System of the Nematode Caenorhabditis elegans. Philos Trans R Soc B Biol Sci.
White MG, Cody PA, Bubser M, Wang HD, Deutch AY, Mathur BN (2017) Cortical hierarchy governs rat claustrocortical circuit organization. J Comp Neurol.
Wickersham IR, Finke S, Conzelmann KK, Callaway EM (2007) Retrograde neuronal tracing with a deletion-mutant rabies virus. Nat Methods.
Willemsen R, Kooy F (2017) Fragile X syndrome: from genetics to targeted treatment. Academic Press.
Williams SR, Stuart GJ (2003) Role of dendritic synapse location in the control of action potential output. Trends Neurosci.
Wodarz A, Hinz U, Engelbert M, Knust E (1995) Expression of crumbs confers apical character on plasma membrane domains of ectodermal epithelia of drosophila. Cell.
Wong ROL, Ghosh A (2002) Activity-dependent regulation of dendritic growth and patterning. Nat Rev Neurosci.
Xiao MY, Zhou Q, Nicoll RA (2001) Metabotropic glutamate receptor activation causes a rapid redistribution of AMPA receptors. Neuropharmacology.
Xu CS, Hayworth KJ, Lu Z, Grob P, Hassan AM, García-Cerdán JG, Niyogi KK, Nogales E, Weinberg RJ, Hess HF (2017) Enhanced FIB-SEM systems for large-volume 3D imaging. Elife.
Yan QJ, Rammal M, Tranfaglia M, Bauchwitz RP (2005) Suppression of two major Fragile X Syndrome mouse model phenotypes by the mGluR5 antagonist MPEP. Neuropharmacology.
Yan X, Denman RB (2011) Conformational-dependent and independent RNA binding to the fragile x mental retardation protein. J Nucleic Acids 2011:246127.
Yao A, Jin S, Li X, Liu Z, Ma X, Tang J, Zhang YQ (2011) Drosophila FMRP regulates microtubule network formation and axonal transport of mitochondria. Hum Mol Genet.
Yasuyama K, Salvaterra PM (1999) Localization of choline acetyltransferase-expressing neurons in Drosophila nervous system. Microsc Res Tech.
Yrigollen C, Davidson B (2019) CRISPR to the Rescue: Advances in Gene Editing for the FMR1 Gene. Brain Sci 9:17.
Yu CC, Reddy BJN, Wortman JC, Gross SP (2017) Axonal Transport: A Constrained System. J Neurol neuromedicine 2:20–24.
Yu H-H, Yang JS, Wang J, Huang Y, Lee T (2009) Endodomain diversity in the Drosophila Dscam and its roles in neuronal morphogenesis. J Neurosci 29:1904–1914.
Yuan Q, Joiner WJ, Sehgal A (2006) A Sleep-Promoting Role for the Drosophila Serotonin Receptor 1A.

186
Curr Biol.
Zalfa F, Adinolfi S, Napoli I, Kühn-Hölsken E, Urlaub H, Achsel T, Pastore A, Bagni C (2005) Fragile X mental retardation protein (FMRP) binds specifically to the brain cytoplasmic RNAs BC1/BC200 via a novel RNA-binding motif. J Biol Chem.
Zalfa F, Eleuteri B, Dickson KS, Mercaldo V, De Rubeis S, Di Penta A, Tabolacci E, Chiurazzi P, Neri G, Grant SGN, Bagni C (2007) A new function for the fragile X mental retardation protein in regulation of PSD-95 mRNA stability. Nat Neurosci.
Zalfa F, Giorgi M, Primerano B, Moro A, Di Penta A, Reis S, Oostra B, Bagni C (2003) The Fragile X syndrome protein FMRP associates with BC1 RNA and regulates the translation of specific mRNAs at synapses. Cell.
Zampieri M, Sekar K, Zamboni N, Sauer U (2017) Frontiers of high-throughput metabolomics. Curr Opin Chem Biol.
Zhang M, Chen D, Xia J, Han W, Cui X, Neuenkirchen N, Hermes G, Sestan N, Lin H (2017) Post-transcriptional regulation of mouse neurogenesis by Pumilio proteins. Genes Dev.
Zhang Y, Bonnan A, Bony G, Ferezou I, Pietropaolo S, Ginger M, Sans N, Rossier J, Oostra B, LeMasson G, Frick A (2014a) Dendritic channelopathies contribute to neocortical and sensory hyperexcitability in Fmr1−/y mice. Nat Neurosci 17:1701–1709.
Zhang Y, Brown MR, Hyland C, Chen Y, Kronengold J, Fleming MR, Kohn AB, Moroz LL, Kaczmarek LK (2012) Regulation of neuronal excitability by interaction of fragile X mental retardation protein with slack potassium channels. J Neurosci 32:15318–15327.
Zhang Y, Connor JPO, Siomi MCMC, Srinivasan S, Dutra A, Nussbaum RL, Dreyfuss G, O’Connor JP (1995) The fragile X mental retardation syndrome protein interacts with novel homologs FXR1 and FXR2. EMBO J.
Zhang Y, Gaetano CM, Williams KR, Bassell GJ, Mihailescu MR (2014b) FMRP interacts with G-quadruplex structures in the 3 ′-UTR of its dendritic target shank1 mRNA. RNA Biol.
Zhang YQ, Bailey AM, Matthies HJ, Renden RB, Smith MA, Speese SD, Rubin GM, Broadie K (2001) Drosophila fragile X-related gene regulates the MAP1B homolog Futsch to control synaptic structure and function. Cell 107:591–603.
Zhang YQ, Friedman DB, Wang Z, Woodruff E, Pan L, O’Donnell J, Broadie K (2005) Protein Expression Profiling of the Drosophila fragile X Mutant Brain Reveals Up-regulation of Monoamine Synthesis. Mol Cell Proteomics.
Zhang YQ, Matthies HJG, Mancuso J, Andrews HK, Woodruff E, Friedman D, Broadie K (2004) The Drosophila fragile X-related gene regulates axoneme differentiation during spermatogenesis. Dev Biol.
Zhang YQ, Rodesch CK, Broadie K (2002) Living synaptic vesicle marker: Synaptotagmin-GFP. Genesis 34:142–145.
187
Zhang Z, Curtin KD, Sun Y a, Wyman RJ (1999) Nested transcripts of gap junction gene have distinct expression patterns. J Neurobiol 40:288–301.
Zhao T, Olbris DJ, Yu Y, Plaza SM (2018) NeuTu: Software for Collaborative, Large-Scale, Segmentation-Based Connectome Reconstruction. Front Neural Circuits 12:101.
Zheng Z et al. (2017) A Complete Electron Microscopy Volume Of The Brain Of Adult Drosophila melanogaster. bioRxiv:140905.
Zheng Z, Lauritzen JS, Perlman E, Saalfeld S, Fetter RD, Bock Correspondence DD (2018) A Complete Electron Microscopy Volume of the Brain of Adult Drosophila melanogaster. Cell 174:1–14.
Zhou L-T, Ye S-H, Yang H-X, Zhou Y-T, Zhao Q-H, Sun W-W, Gao M-M, Yi Y-H, Long Y-S (2017) A novel role of fragile X mental retardation protein in pre-mRNA alternative splicing through RNA-binding protein 14. Neuroscience 349:64–75.
Zhou L, Schnitzler A, Agapite J, Schwartz LM, Steller H, Nambu JR (1997) Cooperative functions of the reaper and head involution defective genes in the programmed cell death of Drosophila central nervous system midline cells. Proc Natl Acad Sci U S A 94:5131–5136.