Embed Size (px)
Citation preview
Driving Growth Through Product Innovation
Martijn Vogelzang
General Manager, Licensing
Basell Service Company B.V.,
a LyondellBasell company
IndianOil Petrochemical Conclave
Delhi, India, 16 March 2012
lyondellbasell.com 2
Outline
• Mega trends affect regional developments
• Growth driven by continuous process and catalyst innovation
• Some examples of how polyolefins serve evolution:
– Properties, application development and sustainability
• Prospects and future
• Fast facts on LyondellBasell

lyondellbasell.com 3
Global megatrends shape our market segments
Our society is challenged with population increases, climate and economic
changes which are creating unprecedented pressure on resource management
Economy
Infrastructure, communication,
transportation
Environment
Climate change, new energy
solutions, resource use
reduction
Society
Population increase, access to
water, food availability &
preservation, health

lyondellbasell.com 4
Global polyolefins market and per capita use
0 10 20 30 40 50
Other
Asia
WE
NA
kg / capita
Source: CMAI 2010
Asia Pacific per capita use of 13 kg is very low when compared to 47 kg and 45 kg in
North America and Western Europe respectively - High potential for future growth
2009 Global PP/PE 2009 Per Capita Use Of PP/PE
North America
19%
Western Europe
16%
Asia
44%
Other
21%
Global demand 2009: 110 Million Metric Tons

lyondellbasell.com 5
R&D is the engine for growth at LyondellBasell
Combined and integrated catalyst, process and product development
Product
Catalyst Process
R&DR&D
lyondellbasell.com 6
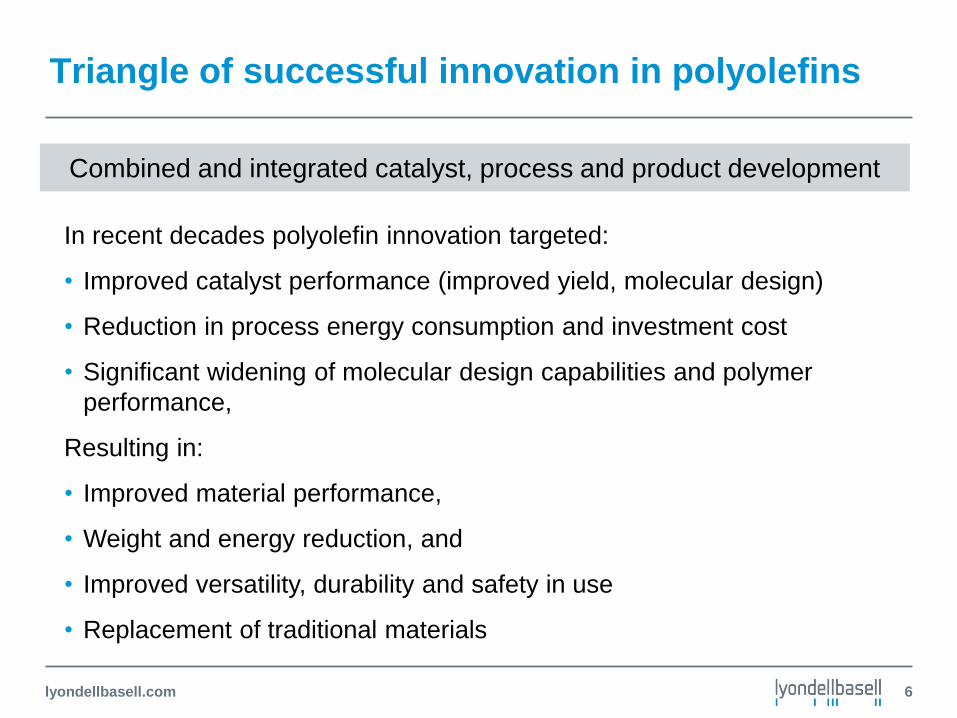
Triangle of successful innovation in polyolefins
Combined and integrated catalyst, process and product development
In recent decades polyolefin innovation targeted:
• Improved catalyst performance (improved yield, molecular design)
• Reduction in process energy consumption and investment cost
• Significant widening of molecular design capabilities and polymer
performance,
Resulting in:
• Improved material performance,
• Weight and energy reduction, and
• Improved versatility, durability and safety in use
• Replacement of traditional materials

lyondellbasell.com 7
Polyolefin technology portfolio developments by initial commercialization
2000 1990 1980
Spheripol Catalloy Spherizone
PP and advanced materials
platforms
Avant ZN Phthalate based
Avant catalysts
Hostalen ACP
Spherilene
PE platforms Lupotech T
Avant ZN Diether based
Avant ZN Succinate based
Avant Z
Avant M
Avant C
New
developments
Polybutene-1
2010
2000 1990 1980
2000 1990 1980
Hostalen bimodal
New
developments
Lupotech G
New
developments

lyondellbasell.com 8
Global plastic capacity growth vs. conventional materials
Source: Tecnon Database Source: *Stahl-Zentrum/International Iron and Steel
Institute (IISI)
Million
tons
0
1
2
3
4
5
6
7
8
9
10
1970 1975 1980 1985 1990 1995 2000 2005
Plastics Steel* Paper**
Index: 1970 = 100
0.0
50.0
100.0
150.0
200.0
250.0
1965 1970 1975 1980 1985 1990 1995 2000 2005
EVA
ABS
PS
PVC
PP
PE
PP/PE~0.3
PP/PE~0.4
PP/PE~0.6
PP/PE~0.7

lyondellbasell.com 9
The impact of plastics on energy consumption and CO2 emissions
Production Use End of life
Energ
y
CO
2
CO
2 C
O2
Energ
y
Energ
y
Raw
materials Products Packaging Housing Transportation
• Improved production efficiency
• Production emissions reduction
• Improved product design with plastics
• Lighter, more efficient products with
plastics
• Food preservation
• Reduced landfilling
• Recycling operations
• Energy reclamation
Recycle / Energy
conversion
Source: PlasticsEurope 2009
lyondellbasell.com 10
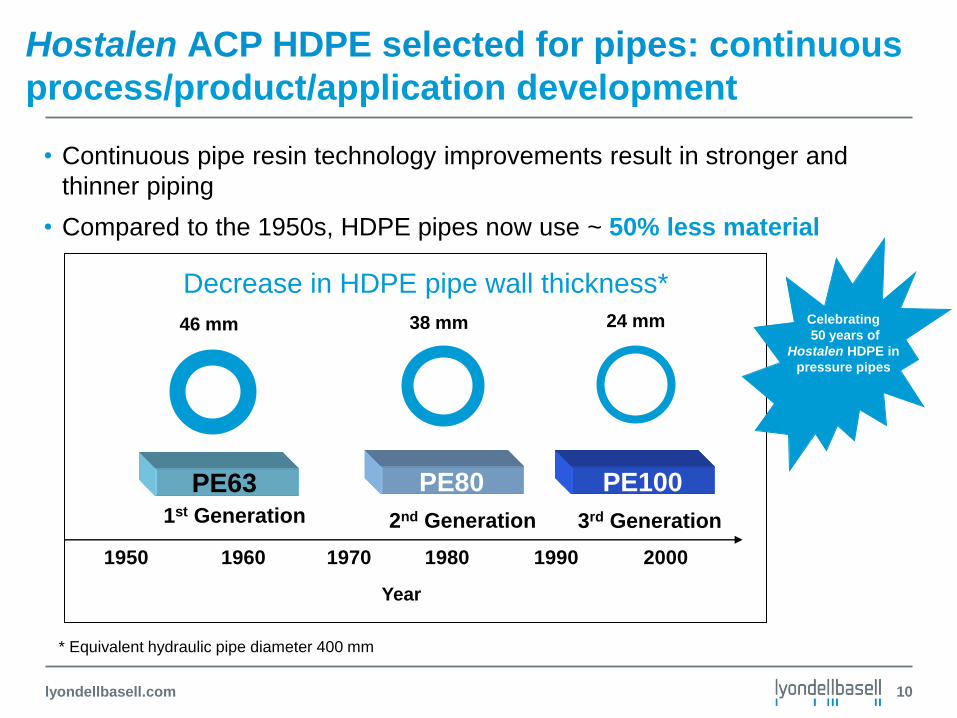
• Continuous pipe resin technology improvements result in stronger and
thinner piping
• Compared to the 1950s, HDPE pipes now use ~ 50% less material
* Equivalent hydraulic pipe diameter 400 mm
1st Generation 3rd Generation 2nd Generation
Year
PE63
46 mm 38 mm 24 mm
PE80 PE100
1950 1960 1970 1980 1990 2000
Decrease in HDPE pipe wall thickness* Celebrating
50 years of
Hostalen HDPE in
pressure pipes
Hostalen ACP HDPE selected for pipes: continuous
process/product/application development

lyondellbasell.com 11
HDPE pipes have gradually replaced traditional materials: C-footprint HDPE gas pipes
Feedstock Olefins Converters Consumers Recycle
Recover Polyolefins
0,3 kg CO2 from Resource prod. → Oil/naphtha, gas
0,9 kg CO2 from Cracking → Ethylen
0,4 kg CO2 from Polymerisation → HDPE
0,4 kg CO2 from Pipe extrusion → HDPE pipe
-11 kg CO2 from Benefit of saved prod.+waste-CO2 of alternative materials
-0,3 kg CO2 as Net effect of recycling/recovery
Savings
through
replacement
of other
materials
-12,0
-10,0
-8,0
-6,0
-4,0
-2,0
0,0
2,0
kg
CO
2 /
kg
pro
du
ct
Carbon
footprint in
total life-
cycle = -9,3
kg CO2 / kg
product
Source: GUA (Gesellschaft für umfassende Analysen)

lyondellbasell.com 12
Evolution of PP usage in automotive: bumper
Bumper Technical Data:
- Weight: kg 5.5
- Resisting to a 4 km/h crash @ -30°C
Bumper Technical Data:
- Weight kg 3.5
Resisting to a 7 km/h crash @ -30°C
Zero Gap, Good aesthetics
1979 Fiat Ritmo
2006 Fiat Grande Punto
Improved Processability:
design of more complex
structures…
Mechanical properties:
Reduction of thickness &
weight (40%), enhanced safety

lyondellbasell.com 13
C-Footprint: PP automotive bumpers
Feedstock Olefins Converters Consumers Recycle
Recover Polyolefins
0,3 kg CO2 from Resource prod. → Oil/naphtha, gas
0,9 kg CO2 from Cracking → Propylen
0,5 kg CO2 from Polymerisation → PP
2,2 kg CO2 from Injection moulding → PP injection moulding
-8,7 kg CO2 from Benefit of substitution of heavier materials (saved prod.+waste-CO2 + saved fuel)
0,2 kg CO2 as Net effect of recycling/recovery
-10,0
-8,0
-6,0
-4,0
-2,0
0,0
2,0
4,0
kg
CO
2 /
kg
pro
du
ct
Carbon
footprint in
total life-cycle
= -4,6 kg CO2
/ kg product
Source: GUA (Gesellschaft für umfassende Analysen)

lyondellbasell.com 14
Advances in transportation: From metal to PE plastic fuel tanks and to new car concept – battery train
Spherizone
Hostalen PP
Electric car
Battery train
Year Pen
etr
ati
on
/rep
lacem
en
t ra
te
(%
to
t. M
ark
et)
0
10
20
30
40
50
60
70
80
90
100
1980 1990 2000 2010
Metal
fuel tank
HDPE Plastic
Fuel tank
EU NAFTA Asia Japan China
Lupolen
2030
?
lyondellbasell.com 15
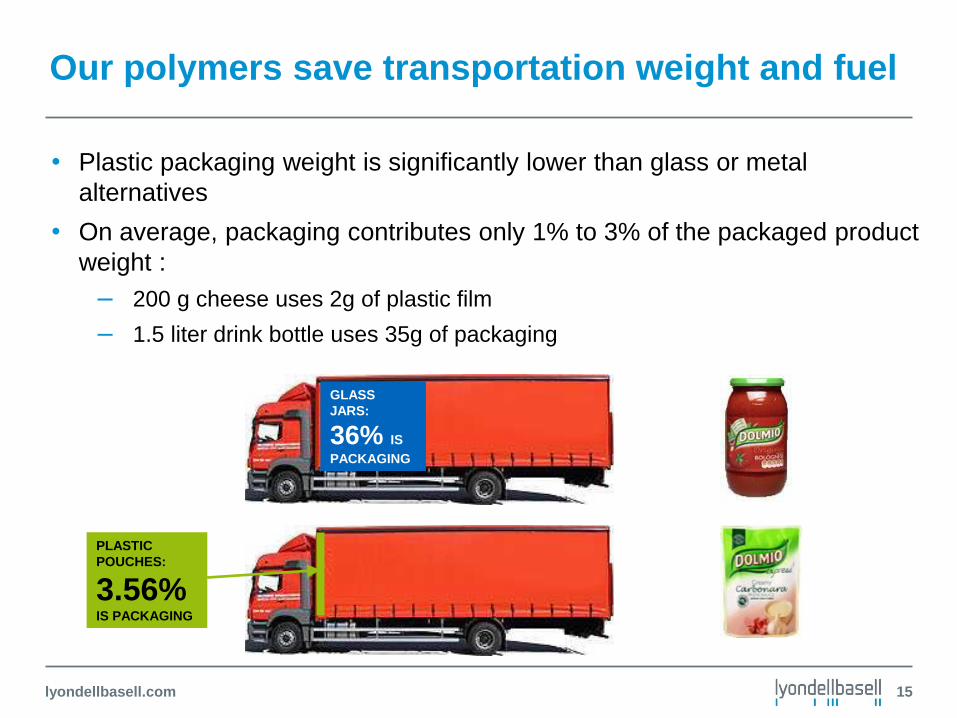
GLASS
JARS:
36% IS
PACKAGING
PLASTIC
POUCHES:
3.56%
IS PACKAGING
• Plastic packaging weight is significantly lower than glass or metal
alternatives
• On average, packaging contributes only 1% to 3% of the packaged product
weight :
– 200 g cheese uses 2g of plastic film
– 1.5 liter drink bottle uses 35g of packaging
Our polymers save transportation weight and fuel
lyondellbasell.com 16
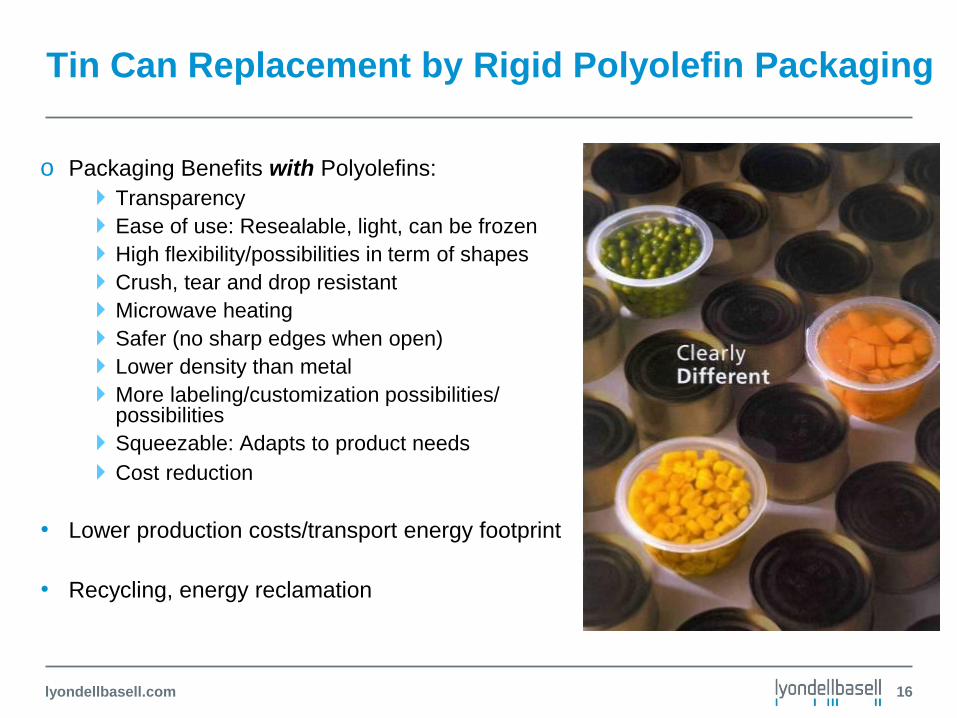
o Packaging Benefits with Polyolefins: Transparency
Ease of use: Resealable, light, can be frozen
High flexibility/possibilities in term of shapes
Crush, tear and drop resistant
Microwave heating
Safer (no sharp edges when open)
Lower density than metal
More labeling/customization possibilities/ possibilities
Squeezable: Adapts to product needs
Cost reduction
• Lower production costs/transport energy footprint
• Recycling, energy reclamation
Tin Can Replacement by Rigid Polyolefin Packaging

lyondellbasell.com 17
39 Mill t/a
144 Mill t/a A
ltern
ati
ve m
ate
rials
x 3,7
Total mass
for same funct. units
4.940 Mill
GJ/a
7.230 Mill
GJ/a
+46%
Alt
ern
ati
ve m
ate
rials
(i
ncl.
No
n-s
ub
st.
pla
sti
cs
)
Energy consumption
in total life cycle
All
pla
sti
c p
rod
ucts
Subst.
Plastics
46
,4 M
ill.
t in
cl. N
on
-su
bstitu
tab
le p
lastic p
rod
ucts
240 Mill t/a
360 Mill t/a
+50%
GHG emissions
in total life cycle
Alt
ern
ati
ve m
ate
rials
(i
ncl.
No
n-s
ub
st.
pla
sti
cs
)
All
pla
sti
c p
rod
ucts
Environmental benefits of plastics vs. alternative materials
Source Denkstatt 2009 (EU27+2)

lyondellbasell.com 18
CO2-Balance Plastics Market
"Carbon balance"
2007 2020Av. changes
until 2020
of EU27+2 plastics market Mt CO2-equ. Mt CO2-equ. Mt CO2-equ.
Production 160 180
production increase (2% p.a.) 47
increased material efficiency -21
20% PE from renewable resources? -6
Effects of recycling/recovery/disposal -1 -6 to +18 -5 to +19
Exemplary use effects:
substitution of less efficient materials -43 to -81 -56 to -104 -18
fuel savings -17 -34 -17
insulation -540 to -1.100 -1.200 to -1.800 -700
prevented food losses -100 to -200 -150 to -300 -75
wind power rotors & solar panels -60 -250 to -500 -310
Total carbon balance -600 to -1.300 -1.500 to -2.500
Ratio (Use+Recovery) vs. Production -5 to -9 -9 to -15
Saves over 9 tons throughout the lifecycle
1 ton
at Production
2007
1 ton
at Production
2020
Saves over 15 tons throughout the lifecycle
Source: Plastics Europe

lyondellbasell.com 19
Conclusions
• Megatrends require novel technologies and new approaches to
development
• New polyolefins offer options for sustainable developments
• Innovation is a joint effort and requires a strong customer culture
• Technology is key to driving growth!!

lyondellbasell.com 20
LyondellBasell is…
– One of the world’s largest olefins, polyolefins, chemicals and refining companies with revenues in the range of $50 billion
– The global leader in polyolefins technology, production and marketing
– A pioneer in propylene oxide and derivatives
– A producer of fuels and refined products, including biofuels
– Dedicated to ongoing research and development programs that meet the ever-changing requirements of our customers, including the creation of new catalysts, processes and products
– Participation in 16 significant manufacturing joint ventures, 11 of which are outside of Western Europe and the United States, primarily in regions that have cost-advantaged raw materials or high-growth rates
20

lyondellbasell.com
World-Class Scale with Leading Market Positions
21
O&P Americas40%
O&P EAI18%
Intermediates & Derivatives
20%
Refining & Oxyfuels
18%
Technology4%
$5.3 billion
Notes: Sales segment distribution excludes Other and Intersegment sales.
Source: Capital IQ and LYB.
2010 Revenues
2011 Sales 2011 EBITDA
$51 billion
($ in billions)
Channelview, Texas
0
20
40
60
80
$100
BASF Dow LYB SABIC DuPont
O&P Americas20%
O&P EAI29%
Intermediates & Derivatives
13%
Refining & Oxyfuels
37%
Technology1%

lyondellbasell.com
World-Class Scale with Leading Market Positions
Chemicals
Ethylene #5
Propylene #4
Propylene Oxide #2
Polymers
Polyolefins (PE + PP) #1
Polypropylene #1
Polyethylene #4
Polypropylene Compounds #1
Refining & Oxyfuels
Oxyfuels #1
Technology and R&D
Polyolefins Licensing #3
Polypropylene Catalysts #1
Products
Note: Positions based on LyondellBasell wholly owned capacity and pro rata share
of JV capacities as of December 31, 2010, except for Polypropylene
Catalysts position which is as of December 31, 2008.
Global
Position
Tarragona, Spain
22

lyondellbasell.com 23
Global reach
• 58 plants in
18 countries
• More than
14,000 employees
worldwide
• Sales in
more than
100 countries
lyondellbasell.com

lyondellbasell.com 24
Comprehensive portfolio of technologies for license
lyondellbasell.com
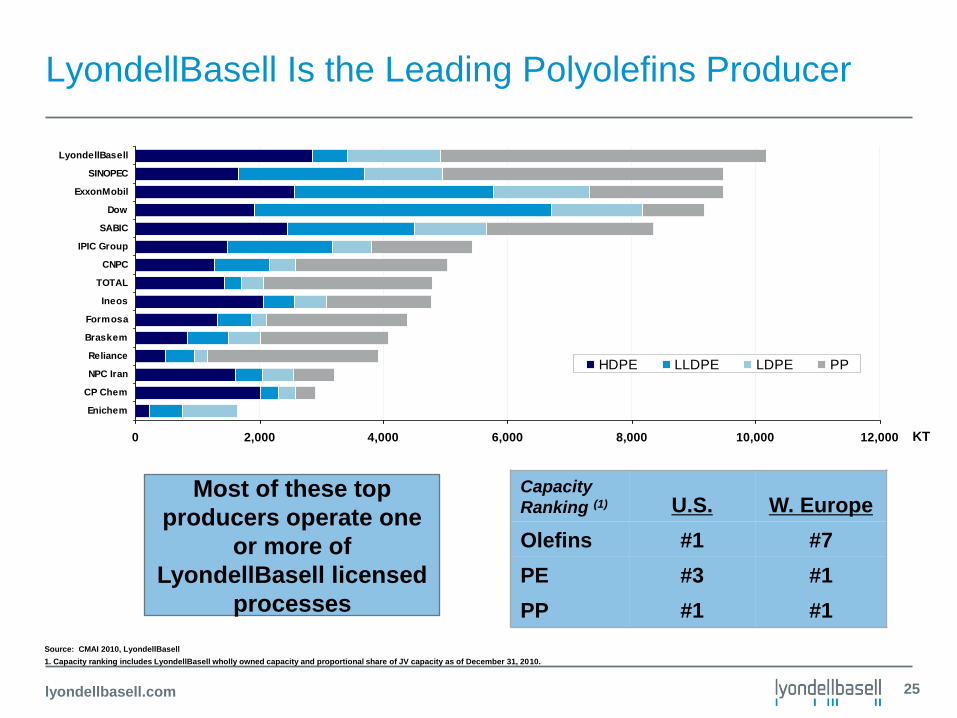
0 2,000 4,000 6,000 8,000 10,000 12,000
Enichem
CP Chem
NPC Iran
Reliance
Braskem
Formosa
Ineos
TOTAL
CNPC
IPIC Group
SABIC
Dow
ExxonMobil
SINOPEC
LyondellBasell
HDPE LLDPE LDPE PP
LyondellBasell Is the Leading Polyolefins Producer
Capacity
Ranking (1) U.S. W. Europe
Olefins #1 #7
PE #3 #1
PP #1 #1
Source: CMAI 2010, LyondellBasell
1. Capacity ranking includes LyondellBasell wholly owned capacity and proportional share of JV capacity as of December 31, 2010.
KT
Most of these top
producers operate one
or more of
LyondellBasell licensed
processes
25
lyondellbasell.com 26
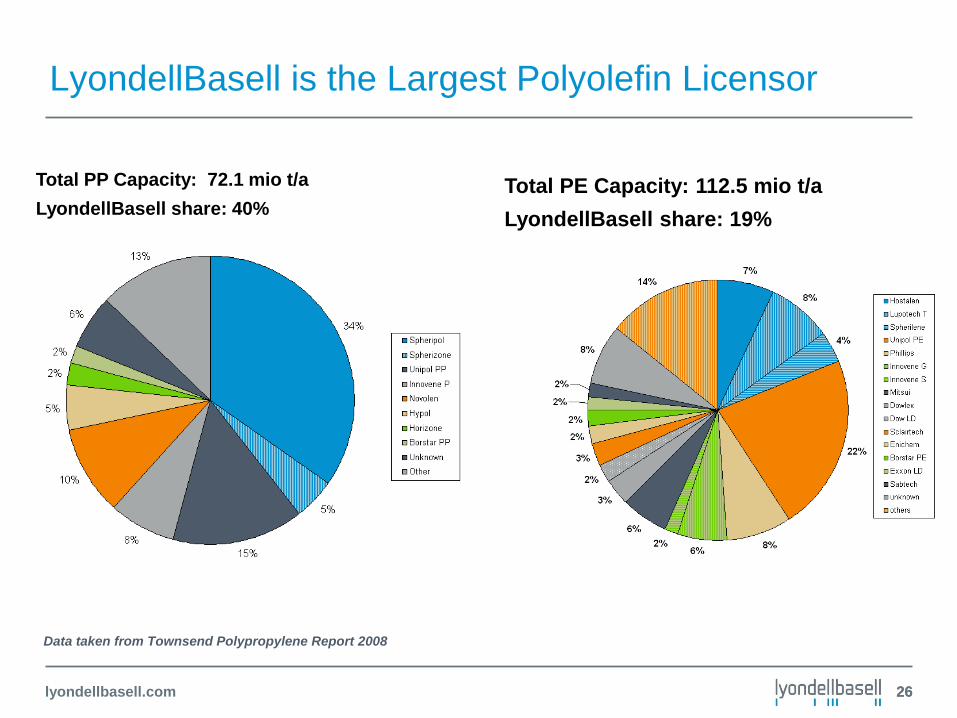
LyondellBasell is the Largest Polyolefin Licensor
Data taken from Townsend Polypropylene Report 2008
Total PP Capacity: 72.1 mio t/a
LyondellBasell share: 40%
Total PE Capacity: 112.5 mio t/a
LyondellBasell share: 19%
26

lyondellbasell.com 27
Trademarks
• Avant, Adsyl, Adstif, Catalloy, Spheripol, Spherizone, Hostalen,Lupotech,Spherilene, Metocene, Moplen, Lupolen, Stretchene, Clyrell, Softell, Superflex, Prodflex, Trans4M, Glacido and Vacido are trademarks owned and/or used by LyondellBasell group companies. Spheripol, Spherizone, Hostalen, Avant, Hifax, Moplen, Clyrell, Softell & Adsyl, are registered in the United States Patent and Trademark Office.
© LyondellBasell Industries Holdings, B.V. 2011
lyondellbasell.com 28
Disclaimer
• All information (“Information”) contained herein is provided without compensation and is intended to be general in nature. You should not rely on it in making any decision. LyondellBasell accepts no responsibility for results obtained by the application of this Information, and disclaims liability for all damages, including without limitation, direct, indirect, incidental, consequential, special, exemplary or punitive damages, alleged to have been caused by or in connection with the use of this Information. LyondellBasell disclaims all warranties, including, but not limited to, the implied warranties of merchantability and fitness for a particular purpose, that might arise in connection with this information.
• Before using a product sold by one of the LyondellBasell family of companies, users should make their own independent determination that the product is suitable for the intended use and can be used safely and legally. SELLER MAKES NO WARRANTY; EXPRESS OR IMPLIED (INCLUDING ANY WARRANTY OF MERCHANTABILITY OR FITNESS FOR A PARTICULAR PURPOSE) OTHER THAN AS SEPARATELY AGREED BETWEEN THE PARTIES IN WRITING. This product(s) may not be used in the manufacture of any US FDA Class III Medical Device or Health Canada Class IV Medical Device and may not be used in the manufacture of any US FDA Class II Medical Device or Health Canada Class II or Class III Medical Device without the prior written approval by Seller of each specific product or application. Users should review the applicable Material Safety Data Sheet before handling the product.
• LyondellBasell does not sell PB-1 for use in pipe applications intended for use in North America, and requires its customers not to sell products made from PB-1 into pipe applications for North America.


![The Driving Forces of Changes in CO2 Emissions in China: A ......and CO2 emissions using input–output method is feasible [5,6]. A first group of studies, called static input–output](https://img.dokumen.tips/doc/110x75/6069d45673d6d040a12b7249/the-driving-forces-of-changes-in-co2-emissions-in-china-a-and-co2-emissions.jpg)