Embed Size (px)
Citation preview

Drives Window


Drives Window
User’s Manual
Code:3AFY 61296123 R0401
EFFECTIVE: 25. April 1997SUPERSEDES: 18. November 1996
Library:\CDC-Project\Käsikirjat\61296123.doc
1997 ABB Industry Oy. All rights reserved.


Drives Window User’s Manual i
Table of Contents
Table of Contents ............................................................................................................................ i
Chapter 1 - Introduction to Drives Window Manual .................................................................. 1-1Overview............................................................................................................................................ 1-1Before You Start ................................................................................................................................ 1-1What This Manual Contains ............................................................................................................... 1-1Related Publications .......................................................................................................................... 1-2Conventions Used in This Manual ...................................................................................................... 1-2
Actual Signals .......................................................................................................................... 1-2Communication Driver.............................................................................................................. 1-2Communication Link................................................................................................................. 1-2DDCS Link ............................................................................................................................... 1-2Default Drive ............................................................................................................................ 1-3Parameters .............................................................................................................................. 1-3Reference ................................................................................................................................ 1-3Symbol Table ........................................................................................................................... 1-3Target Device........................................................................................................................... 1-3Target Driver............................................................................................................................ 1-3
Chapter 2 - Overview of Drives Window .................................................................................... 2-1Overview............................................................................................................................................ 2-1Program Structure.............................................................................................................................. 2-1
User Interface .......................................................................................................................... 2-1Target Driver............................................................................................................................ 2-1Communication Driver.............................................................................................................. 2-1
Drives Window Functions................................................................................................................... 2-1System Configuration Display................................................................................................... 2-2Drives Panel............................................................................................................................. 2-2Signals and Parameters Tool ................................................................................................... 2-2Monitoring Tool ........................................................................................................................ 2-2Data Logger Tool ..................................................................................................................... 2-3Event Logger Tool.................................................................................................................... 2-3Fault Logger Tool ..................................................................................................................... 2-3Application Tool........................................................................................................................ 2-3
Chapter 3 - Getting Started ......................................................................................................... 3-1Overview............................................................................................................................................ 3-1System Requirements........................................................................................................................ 3-1Installing the Drives Window Software................................................................................................ 3-1
Running Set-up ........................................................................................................................ 3-1Uninstall the Drives Window Program....................................................................................... 3-2
Communication Statistic..................................................................................................................... 3-2Starting the Program.......................................................................................................................... 3-2Using On-Line Documentation............................................................................................................ 3-2
Drives Window Help ................................................................................................................. 3-2

Table of Contents
ii Drives Window User’s Manual
Chapter 4 - User Interface ........................................................................................................... 4-1Overview............................................................................................................................................ 4-1
Titlebar ........................................................................................................................ 4-2Menubar ...................................................................................................................... 4-2Toolbar ........................................................................................................................ 4-2Statusbar ..................................................................................................................... 4-3
Using the Keyboard............................................................................................................................ 4-3Working with Multiple Windows .......................................................................................................... 4-3Customization .................................................................................................................................... 4-3
Confirmations........................................................................................................................... 4-3Device Status........................................................................................................................... 4-4Version Checking ..................................................................................................................... 4-4Workspace Saving and Loading ............................................................................................... 4-4
Chapter 5 - System Configuration .............................................................................................. 5-1Overview............................................................................................................................................ 5-1System Configuration Display ............................................................................................................ 5-1
Tree Line ..................................................................................................................... 5-1Status Icon .................................................................................................................. 5-2Status Text .................................................................................................................. 5-2
How To... ........................................................................................................................................... 5-2Expand and/or Collapse the Drive List...................................................................................... 5-2View Status Information ........................................................................................................... 5-3Update the Status Display ........................................................................................................ 5-3View Faults and Warnings Messages....................................................................................... 5-3Select Drives........................................................................................................................... 5-3Select the Default Drive............................................................................................................ 5-3Load a Saved File .................................................................................................................... 5-4Start Another Tool.................................................................................................................... 5-4Give a Name for the Drive........................................................................................................ 5-4File Upload............................................................................................................................... 5-4File Download .......................................................................................................................... 5-4Save System Configuration to a File......................................................................................... 5-4Reload Parameter and Signal Table ......................................................................................... 5-4Reidentify Network ................................................................................................................... 5-5
Chapter 6 - Drives Panel ............................................................................................................. 6-1Overview............................................................................................................................................ 6-1Using Drives Panel............................................................................................................................. 6-1Features... ......................................................................................................................................... 6-2
Drives Window Control ............................................................................................................. 6-2Operationals Commands.......................................................................................................... 6-3Setting Reference .................................................................................................................... 6-3Step Function........................................................................................................................... 6-4
Chapter 7 - Monitor Tool ............................................................................................................. 7-1Overview............................................................................................................................................ 7-1Starting the Monitor Tool.................................................................................................................... 7-1How To... ........................................................................................................................................... 7-2
Select Items for Monitoring....................................................................................................... 7-2Values type of packed boolean .................................................................................... 7-2
Monitor Settings ....................................................................................................................... 7-3Start and Stop the Monitoring Display....................................................................................... 7-4

Table of Contents
Drives Window User’s Manual iii
History Data ............................................................................................................................. 7-4Item Value................................................................................................................................ 7-4Display Modes ......................................................................................................................... 7-5Zoom on a Specific Viewing Area ............................................................................................. 7-5Save Data to a File................................................................................................................... 7-6Read Data from a File .............................................................................................................. 7-6Using a File as a Reference Graph........................................................................................... 7-6Print a Graph ........................................................................................................................... 7-7Copy to the Clipboard............................................................................................................... 7-7Clear the Graph Display ........................................................................................................... 7-7
Chapter 8 - Signals and Parameters Tool .................................................................................. 8-1Overview............................................................................................................................................ 8-1Starting Signals and Parameters Tool ................................................................................................ 8-1How To... ........................................................................................................................................... 8-2
Switch to the On/Off-Line Mode ............................................................................................... 8-2Off-line Mode............................................................................................................... 8-2On-line Mode ............................................................................................................... 8-2
Select a Parameter .................................................................................................................. 8-3Selecting a Signal or a Parameter Subset ................................................................................ 8-3Change the Parameter Values ................................................................................................. 8-4Upload and Download Parameter Values ................................................................................ 8-7
Upload Values ............................................................................................................. 8-7Download Values......................................................................................................... 8-7
Save a Signal and Parameter List to a File ............................................................................... 8-7Read Signals and Parameters from a File ................................................................................ 8-7
Download Values After Opening a File......................................................................... 8-8Print a Signal and Parameter List ............................................................................................. 8-8Compare the Parameters ......................................................................................................... 8-8Copy to the Clipboard............................................................................................................... 8-8Find a Parameter ..................................................................................................................... 8-8Copy a Parameter Set from a Drive to Another......................................................................... 8-9Customize the Display.............................................................................................................. 8-9Open Uploaded Groups............................................................................................................ 8-9Close All Groups ...................................................................................................................... 8-9Update Group .......................................................................................................................... 8-9
Chapter 9 - Data Logger Tool...................................................................................................... 9-1Overview............................................................................................................................................ 9-1Starting the Data Logger Tool ............................................................................................................ 9-1
Status of the Data Logger ........................................................................................................ 9-2How To... ........................................................................................................................................... 9-2
Select Variables for the Data Logger ........................................................................................ 9-2Adjust the Settings of the Data Logger ..................................................................................... 9-2Set the Data Logger Window Scaling ....................................................................................... 9-2Change the Display Mode ........................................................................................................ 9-2Start and Stop the Data Logger ................................................................................................ 9-3Upload the Values in the Data Logger ...................................................................................... 9-3Reset the Pointers of the Data Logger...................................................................................... 9-3Zoom on a Specific Viewing Area ............................................................................................. 9-3Numerical Values ..................................................................................................................... 9-4Save Data to a File................................................................................................................... 9-4Read Data from a File .............................................................................................................. 9-4

Table of Contents
iv Drives Window User’s Manual
Using a File as a Reference Graph........................................................................................... 9-4Print the Display....................................................................................................................... 9-4Copy the Display to the Clipboard ............................................................................................ 9-4
Data Logger Settings ......................................................................................................................... 9-4Variables ..................................................................................................................... 9-5Triggering conditions.................................................................................................... 9-5Setting the Samples Before Triggering......................................................................... 9-5Setting Sample Interval................................................................................................ 9-6Scaling......................................................................................................................... 9-6Open... ........................................................................................................................ 9-6Save As... .................................................................................................................... 9-6Help............................................................................................................................. 9-6Cancel ......................................................................................................................... 9-6Initialize ....................................................................................................................... 9-6
Chapter 10 - Event Logger Tool................................................................................................ 10-1Overview.......................................................................................................................................... 10-1Starting the Event Logger Tool................................................................................................ ......... 10-1The Event Logger of the ACS 600................................................................................................ .... 10-1How To... ......................................................................................................................................... 10-1
Refresh the Display................................................................................................................ 10-1Save the Event List to a File................................................................................................... 10-2Read Events from a File......................................................................................................... 10-2Copy the Event List to the Clipboard ...................................................................................... 10-2
Chapter 11 - Fault Logger Tool ................................................................................................. 11-1Overview.......................................................................................................................................... 11-1Starting the Fault Logger Tool ................................................................................................ .......... 11-1How To... ......................................................................................................................................... 11-1
Reset an Active Fault ............................................................................................................. 11-1Clear the Fault Logger............................................................................................................ 11-1Refresh the Display................................................................................................................ 11-2View Faults and Warnings...................................................................................................... 11-2Save the Fault List to a File.................................................................................................... 11-2Read Faults from a File .......................................................................................................... 11-2Copy the Event List to the Clipboard ...................................................................................... 11-2
Chapter 12 - Application Tool ................................................................................................... 12-1Overview.......................................................................................................................................... 12-1Starting the Application Tool............................................................................................................. 12-1How To... ......................................................................................................................................... 12-2
Select Subset of Symbols ...................................................................................................... 12-2Define the Mask ..................................................................................................................... 12-2Set Force Value ..................................................................................................................... 12-2Upload and Download Symbol Table. ..................................................................................... 12-4
Upload Values ........................................................................................................... 12-4Download Force Value(s)........................................................................................... 12-4
Delete Force Values............................................................................................................... 12-5Download an Application ........................................................................................................ 12-5On/Off-line Mode - Application Tool........................................................................................ 12-5
On-line Mode ............................................................................................................. 12-5Off-line Mode............................................................................................................. 12-6
Selecting Data/Columns to be Viewed.................................................................................... 12-6

Table of Contents
Drives Window User’s Manual v
Save a Symbol Table to a File................................................................................................ 12-6Read Symbols from a File ...................................................................................................... 12-6Compare the Symbol Tables .................................................................................................. 12-6Copy the Symbol Subset to the Clipboard .............................................................................. 12-6Print the Symbol Subset......................................................................................................... 12-6Get Information About the Target Device................................................................................ 12-7
APPENDIX A- Version Control ....................................................................................................A-1System Software v2.8 ..............................................................................................................A-1System Software v3.0 ..............................................................................................................A-1System Software v4.2 ..............................................................................................................A-1Previous Drives Window Files ..................................................................................................A-1
APPENDIX B- Drives Panels .......................................................................................................B-1System Software v3.0 ..............................................................................................................B-1System Software v4.x ..............................................................................................................B-1System Software v1.0 (ACP600) ..............................................................................................B-1
APPENDIX C - CDW.INI file .........................................................................................................C-1General ................................................................................................................................... C-1Target Identification................................................................................................................. C-1Special Target Names............................................................................................................. C-1Product Names ....................................................................................................................... C-1
APPENDIX D - DDCS Communication........................................................................................D-1DDCS Communication Channel Dialog.................................................................................... D-1Use the Communication Channel Dialog ................................................................................. D-1Communication Channel Dialog Caption.................................................................................. D-1Information Group ................................................................................................................... D-1Options Group......................................................................................................................... D-1Link Rate Group...................................................................................................................... D-2Beam Intensity Group ............................................................................................................. D-2Auto Node Numbering Checkbox ............................................................................................ D-2Auto Node Numbering with NDBU-91 Branching Units ............................................................ D-3Auto Node Numbering on DDCS loop...................................................................................... D-3
INDEX I........................................................................................................................................... I-1

Table of Contents
vi Drives Window User’s Manual
This page is intentionally left blank.

Drives Window User’s Manual 1 - 1
Chapter 1 - Introduction to Drives Window Manual
This chapter describes the purpose and the intended audience ofthis manual, explains conventions used in the manual, and listsrelated publications.
The purpose of this manual is to provide you with the informationnecessary to use the Drives Window program for commissioning andmaintaining ABB products.
The audience for this manual is expected to have
• basic knowledge of ABB drive names and terminology, and
• experience in commissioning and maintaining ABB drive followingthe applicable safety standards.
Here is a brief overview of the information in this manual:
Chapter 1 - Introduction to Drives Window Manual, the chapter youare reading now, introduces you to the Drives Window User Manualand the conventions used throughout the manual.
Chapter 2 - Overview of Drives Window provides a quick summary ofthe functions and operation of the program.
Chapter 3 - Getting Started describes how to install, set-up, and startthe Drives Window program. The hardware and computer systemrequirements for using Drives Window are also presented.
Chapter 4 - User Interface describes the working environment andthe main user display. How to access and begin the user functionsare also presented.
Chapter 5 - System Configuration explains the System ConfigurationDisplay and how to use the available functions.
Chapter 6 - Drives Panel explains the drive control principle used inDrives Window.
Chapter 7 - Monitor Tool explains how to monitor the signal andparameter values of an ABB drive.
Chapter 8 - Signals and Parameters Tools describes the availableSignal and Parameter handling functions of Drives Window. Detailedexamples are also given.
Overview
Before You Start
What This ManualContains

Chapter 1 - Introduction
1 - 2 Drives Window User’s Manual
Chapter 9 - Data Logger Tool describes how to set up the DataLoggers located in the ABB product. This chapter also details howto display the contents of the Data Loggers by using Drives Window.
Chapter 10 - Event Logger Tool describes how to upload thecontents of the event logger from an ABB drive and display thecontents with Drives Window.
Chapter 11 - Fault Logger Tool describes how to upload the contentsof the fault logger of the ABB product and display the contents withDrives Window.
Chapter 12 - Application Tool describes how to display the symbolsof an application and how to control the application programs of theABB drive.
Appendix A describes version control.
Appendix B describes different Drives Panels.
Appendix C describes use of CDW.INI profile file.
Appendix D describes use of DDCS channel, node autonumberingetc.
Index lists major topics and the pages they appear on.
In addition to this manual you can use documentation for productssupported by Drives Window. Supported products are listed inAppendix A.
Listed below are the terms and conventions which have specialmeaning throughout this manual.
Actual signals refer to the variables which the ABB productmeasures or calculates. These signals are also commonly termed‘feedback’ signals.
The communication driver is a part of the Drives Window programwhich handles all of the communications with a product. Thecommunication driver passes the data between Drives Window andthe ABB product through the communication link.
The communication link is the data bus which is used forcommunication between the Drives Window program and the ABBproduct.
The DDCS (Distributed Drive Communication System) link is a highspeed fibre optic data bus (communication link) dedicated for ABBdrives.
RelatedPublications
Conventions Usedin This Manual
Actual Signals
CommunicationDriver
CommunicationLink
DDCS Link

Chapter 1 - Introduction
Drives Window User’s Manual 1 - 3
The default drive is the active drive currently being used as thetargetdevice for Drives Window. The default drive can be set usingany of the drive selection commands in Drives Window.
Parameters are operating instructions for the drive program; they areorganized in logical parameter groups. Parameter values can bedownloaded, uploaded, saved to a file, viewed, and changed withthe use of Drives Window.
The reference is an operating instruction to define e. g. the rotationalspeed or torque at the shaft of the motor.
The Symbol Table is created by the AdvaBuild Function ChartBuilder (FCB) program. The items (symbols) of the symbol table canbe function block inputs or outputs in the drives application program.
The commands sent by Drives Window are sent to an ABB productwhich is called the target device. The Drives Panel and each toolhave designated target devices. The target device of a tool is thedefault product selected when the tool is started. For example, if youopen a new Signals and Parameters Tool window, it will display thesignals and parameters of the current default device. The targetdevice of the Drives Panel is always the current default.
The target driver is a part of the Drives Window program which takescare of all the target dependent parts of Drives Window.
Default Drive
Parameters
Reference
Symbol Table
Target Device
Target Driver

Chapter 1 - Introduction
1 - 4 Drives Window User’s Manual
This page is intentionally left blank.

Drives Window User’s Manual 2 - 1
Chapter 2 - Overview of Drives Window
This chapter provides a quick summary of the functions andoperation of the Drives Window program.
Drives Window consists of several independent parts: the UserInterface, the Target Drivers, and the Communication Drivers. Withthis component structure, enhanced flexibility is achieved to enableyou to work with several different types of products through differenttarget and communication drivers. The look and feel of the DrivesWindow program remains the same even when the product changes.
The User Interface of Drives Window allows you to access the mainfunctions of the program. The program follows the common userinterface guidelines for Windows program.
The Target Driver includes all of the target-dependent information.The program identifies the type of the target device and starts thecorresponding target driver automatically during initialization. Youcan even work with different types of products at the same time dueto the component structure of Drives Window.
Drives Window can be used with different communication links. Thetypes of communication drivers you can use are defined by thetarget device. All you need is the hardware for connecting the PC tothe communication link and the respective communication driver.
Drives Window offers you several functions for commissioning andmonitoring ABB products. All of the functions are available from themain Menubar or Toolbar of the program. This manual alsodescribes other access methods for the functions (See Chapter:User Interface).
In Drives Window there are two special displays and six tools:
Special Displays ToolsSystem Configuration Signals and Parameters ToolDrives Panel Monitoring Tool
Data Logger ToolEvent Logger ToolFault Logger ToolApplication Tool
You can work with several drives using several tools at the sametime. Each time a tool is started a new tool window is created.
Overview
Program Structure
User Interface
Target Driver
CommunicationDriver
Drives WindowFunctions

Chapter 2 - Overview of Drives Window
2 - 2 Drives Window User’s Manual
The System Configuration display provides you with an overview ofthe system as well as the type and status of each product on thecommunication link(s). Included in the System Configuration displayare also the previously saved files located on the hard disk of thecomputer. By double-clicking on a specific file, the correspondingDrives Window tool is started to display the contents of the file.
The Drives Panel is used for controlling the operation of a selecteddrive within the system. You can control different drives by changingthe target drive selection. Commands available with the DrivesPanel depend on the currently active target. Usually there are thefollowing commands with the Panel:
• Start and Stop
• Set the speed reference
• Change the reference direction (forward/reverse for AC-drives)
• Reset the active fault
• Change the control between Drives Window and external controllocation
• Step
In addition to these, there may be target dependant commandbuttons, for example Coast Stop (ACS 600 MultiDrive) and Homing(ACS 600 Motion Control). Different Drives Panels are described inthe Appendix B.
The Signals and Parameters Tool is used for selecting signals,parameters, and application symbols used for monitoring. You canalso set the parameter values in either off-line and on-line mode.Several Signal and Parameter Tool windows for one or multipledrives can be used at the same time. When started, either the wholeParameter table or only the group headings are loaded dependingon the option set.
The Monitoring Tool is used for trending the actual values of thetarget graphically. Also the following functions are supported:
• Zoom-In and Zoom-Out
• Scaling the graphs
• Setting the Sample Interval
• Setting the length of the visible screen
• Triggering on specific conditions
• Scrolling the Monitor History
• Adding a synchronized reference graph to the Monitor View
SystemConfiguration
Display
Drives Panel
Signals andParameters Tool
Monitoring Tool

Chapter 2 - Overview of Drives Window
Drives Window User’s Manual 2 - 3
• Saving the Monitor View and the History as it is
The Data Logger Tool provides facilities for viewing the contents ofthe data loggers in the drive. You can display the data in eithergraphical or numerical form. The contents of different data loggersare displayed in separate windows. Data loggers are useful for exactmeasurements with high frequencies.
The contents of the event logger in the drive can be viewed andcleared by using the Event Logger Tool.
The contents of the fault logger in the drive can be viewed andcleared using the Fault Logger Tool.
Application programs are developed by using a separateprogramming tool. AdvaBuild Function Chart Builder is used fordeveloping ABB drive application programs. Drives Window can beused for controlling, downloading, and debugging the applicationprograms. Controlling application programs refers to starting andstopping the execution of the program inside the target device.
Data Logger Tool
Event LoggerTool
Fault LoggerTool
Application Tool

Chapter 2 - Overview of Drives Window
2 - 4 Drives Window User’s Manual
This page is intentionally left blank.

Drives Window User’s Manual 3 - 1
Chapter 3 - Getting Started
This chapter provides you with the necessary information toinstall, connect, and start the Drives Window program. Generalinformation about using Drives Window is also provided.
To operate Drives Window, your computer must meet thefollowing requirements and have the following hardware andsoftware installed:
• Any IBM-compatible computer with an 80486 processor orhigher
• 8MB of RAM memory
• 3½” floppy drive
• VGA compatible display or better
• MS Windows 3.1, 3.11 or MS Windows 95.
• DOS version 5.0 or later.
• One or more communication adapters with the respectiveCommunication and Target drivers
The software installation copies all necessary files from the deliverydiskettes to the user specified drive and directory. The set-upprogram prompts you to install the software to a directory called\ABBTools\DRIWIN , but you can change the directory to whateveryou like. The set-up program also prompts for a working directory.The contents of this directory are displayed in the SystemConfiguration Display. The installation creates an ABB Tools groupin the Program Manager and the Drives Window icon can now befound in that group.
To start the set-up program:
1. If Windows is not running, start it now. Make the ProgramManager the active window.
2. Insert the Drives Window Disk 1 in the appropriate floppy drive.
3. To open the File Run Dialog Box, select the Run commandfrom the Program Manager’s File menu.
4. Type the drive letter of the floppy drive followed by“:\SETUP.EXE”. For example, if the diskette is in drive A, type“A:\SETUP.EXE ”. Click on the OK button, or press ENTER.
5. Follow the instructions given by the Set-up program.
Overview
SystemRequirements
Installing theDrives WindowSoftware
Running Set-up

Chapter 3 - Getting Started
3 - 2 Drives Window User’s Manual
The uninstaller allows the application to be easily uninstalled if youno longer want to keep the application on the hard disk and want toretrieve all the used disk space. You can launch the uninstallationprogram by clicking the Uninstall DRIWIN -icon from the ABBToolsgroup. This allows you to cleanly remove all the changes that weremade during the installation and set-up process. If you have createdyour own Drives Window files, e. g. Monitor files, they are notremoved; thus updating the program is easy.
The Drives Window offers the possibility to verify the operation of thecommunication link to the target. You can display a list of theavailable communication events and errors. This can be select byCommunication Statistics... command from the System menu.
The program is started by double-clicking the Drives Window icon inthe Program Manager. It is also possible to start the program byselecting the Run... command from the File menu and thenspecifying the complete path and name of the program. At start, ifthere is more than one communication driver, the Drives Windowasks you to select the communication protocol. You can select theprotocol from the drop-down menu. Then the welcome windowshown below in Figure 3-1 is displayed.
Figure 3 - 1 Welcome window.
Drives Window offers you on-line documentation the Drives Windowprogram. You can also see help information on the Statusbar (at thebottom of the Drives Window screen) while moving the mouse overthe control.
Drives Window Help includes information on how to use theprogram. You can access the Drives Window Help through the Helpmenu. There is also context-sensitive help available in many parts ofthe program. Context-sensitive means that you can get specific Helpon these parts without having to go through the main Help menu.Pressing F1 in any part of the software displays help informationabout that part.
Uninstall theDrives WindowProgram
CommunicationStatistic
Starting theProgram
Using On-LineDocumentation
Drives WindowHelp
1.2

Drives Window User’s Manual 4 - 1
Chapter 4 - User Interface
The Drives Window user interface provides a flexible yet standardviewing area for the user. Common toolbar commands allow theuser to select which tool is started or viewed. Figure 4-1 shows theUser Interface and the available functions.
Figure 4 - 1 User Interface
Throughout the Drives Window program, there are three commonmethods that can be used by the user to start or select the availablefunctions.
1. You can use menu commands. Open a menu by clicking on it,or by pressing Alt- key plus the letter that is underlined in themenu’s title. And then you choose a menu selection byclicking on it, by pressing its underlined letter, or by using thecursor keys to highlight it and the pressing ENTER.
2. You can click on the button on the toolbar. Toolbar buttonsperform an function, just like a menu selection. Statusbarshows the help text when you move the cursor on the button.
Select the function from the pop-up menu. Click the right mousebutton and a pop-up menu with the functions related to the specifictool will be presented. The Drives Window’s Main Window containssix regions: the Titlebar, the Menubar, the Toolbar, the ToolsEnviroment, the Drives Panel and the Statusbar.
Overview
Statusbar
Drives Panel
Tools Environment
Toolbar
Menubar
Titlebar

Chapter 4 - User Interface
4 - 2 Drives Window User’s Manual
Each region has specific uses and functions, which are explained onthe following pages.
The Main Window’s Titlebar displays “Drives Window v1.2 -”, thename of the tool,”:”, the number of the target, “:” the optional nameyou have set to the target and the name of the target device.Titlebar contains the standard Windows titlebar controls.
The Menubar contains Drives Window’s menus. Each menu listsgroup of selections, and each selection performs a specific function.You can select between long and short menus from the View menu.
The Toolbar provides quick access to commonly used commands inthe Drives Window environment. Toolbar buttons perform a function,just like a menu selection. To carry out the button’s function just clickon it. The Toolbar can be hidden or displayed from the View menu.
Table 4 - 1 Toolbar Icons
Icon Action Menu EquivalentDisplays the Drive Panel Tool. Drives Panel command under the View menu.
If there is a checkmark (√) by the command, thetool is visible.
Displays the Signals andParameters Tool.
Signals and Parameters command under theTools menu.
Displays the Monitoring Tool. Monitor command under the Tools menu.
Displays the Data LoggerTool.
DataLogger command under the Tools menu.
Displays the Event Logger ofthe Target Device.
Event Logger command under the Tools menu
Displays the Fault Logger ofthe Target Device.
Fault Logger command under the Tools Menu.
Displays the Application Tool. Application command under the Tools menu.
Opens a file. Open... command under File menu.
Saves the data from the activetool.
Save As... command under File menu.
Prints the data from the activetool.
Print... command under File menu.
Selects the defaulttarget.
Select... command under Drive menu
Titlebar
Menubar
Toolbar

Chapter 4 - User Interface
Drives Window User’s Manual 4 - 3
The Statusbar provides information about the active tool, such asstatus of the tool and information about the toolbar buttons. ThisStatusbar can be hidden or shown from the View Menu.
You can use Drives Window menu commands also from thekeyboard. You open a menu by pressing ALT -key plus the letterthat is underlined in the menu’s title. And then choose a menuselection by pressing its underlined letter, or by using the cursor keysto to highlight it and the pressing ENTER.
Also you can access the most frequently used Drives Window’sfunctions from the keyboard by using combination of keystrokes.These combinations are called short-cut keys. The short-cut key fora command appears to the right of the command in the menus.
With Drives Window, you can have more than one tool open at thesame time. You can open as many tools as you want, depending onhow much memory is available on your computer. Each tool that youopen is displayed in a separate window, which is listed on theWindow menu.
The window you are currently working in is called the active windowand the tool you are working in is called the active tool. Most of thecommands or actions you carry out affect only the active tool.
From the Window menu you can choose the window you want tomake active. Also you can use keyboard command (Ctrl+TAB ) tochange the active window. Window menu also offers functions fororganizing a set of open windows.
From the Options menu, the User Interface can be customized tothe users’ preference in two fashions: Confirmations and StatusMessages.
Drives Window can be configured to confirm the users' actions forthe following situations:
• Drive Start
• Drive Stop
• Drive Fault Resetting
• Drive Reference Change
• Parameter Download
• Switching to On-line Mode
• Parameter Value change in On-line Mode
Statusbar
Using theKeyboard
Working withMultiple Windows
Customization
Confirmations

Chapter 4 - User Interface
4 - 4 Drives Window User’s Manual
When selected, Drives Window will prompt the user to confirm thatthe action is to be taken before issuing the command.
Similar to the Confirmation configuration, the status of the drive canalert the user when certain conditions are detected. Theseconditions include:
• Faults
• Warnings
When selected, Drives Window will alert the user when a certaincondition is detected. Status query can also be turned off or usedonly with the Drives Panel. If the communication load is very high,status is automatically queried only for the default target.
The Drives Window checks whether the target version correspondswith the application version in the following cases,
• download parameter values
• compare parameter values
• reload saved data logger data
• open a symbol table
• download an application
if there is differences between the versions data the Drives Windowprompts a confirmation that you really want to continue.
Note: In some version conflict the Drives Window can totally preventthe action.
You can save open Tools with their settings using Save Workspacefunction in the File menu. A saved workspace can be read usingLoad Workspace.
Device Status
VersionChecking
WorkspaceSaving and
Loading

Drives Window User’s Manual 5 - 1
Chapter 5 - System Configuration
The System Configuration Display is the main window of the DrivesWindow program. This display is entered automatically when youfirst start the program. All the drives found on the communicationlinks are shown with their respective status information. Also,previously saved files that are located in your working directory areshown on the display under FILES directory.
This chapter describes the status information and symbols used inthe System Configuration Display. The functions of the SystemConfiguration Display are also explained.
The configuration of the drive system is displayed in the Tree List ofthe System Configuration Display. The available informationdisplayed depends on the communication link(s) used.
Figure 5 - 1 shows an example of a DDCS-communication link. Thetarget devices (drives) for each channel are displayed in hierarchicalorder.
Figure 5 - 1 System Configuration Display
The Tree line displays the hierarchy of the system. The plus orminus symbol indicates if the tree items are expanded (shown) orcollapsed (hidden).
Overview
SystemConfigurationDisplay
Tree Line
Status Text
Tree line
Status Icon

Chapter 5 - System Configuration
5 - 2 Drives Window User’s Manual
Status Icon represents the status of the target device.
Table 5 - 1 Status Icon Tables
Status Icon Meaning
RUNNING
Forward ⇒
Reverse ⇒
The Target Device is running.
STOPPED The Target Device is stopped.
FAULTED The Target Device has a fault.
WARNING:
Stopped ⇒
Running ⇒
The Target Device has an activewarning.
Unknown Status ⇒ The Status Query is not on and theStatus of the Target Device isunknown.
Status Text displays the station number, name, type, and status ofthe target device in text form. Colors also differ: red indicates a faultand yellow a warning.
Note: The state STOPPING uses the same icon as RUNNING andDISABLED uses the same icon as STOPPED (with the status text inred).
This section describes how to perform the functions of SystemConfiguration display.
A plus or minus before an item indicates that the item hassubordinate levels. A plus indicates that the subordinate list iscollapsed whereas a minus indicates that it is expanded. Thesubordinate levels can thus be displayed or hidden by clicking theplus (+) or minus (-) sign on the Drive List. In order to expand orcollapse the display, none of the individual items in the subordinatelist can be selected.
Status Icon
Status Text
How To...
Expand and/orCollapse the
Drive List

Chapter 5 - System Configuration
Drives Window User’s Manual 5 - 3
The status of each drive is displayed using an icon as well as a textstring. The Table 5 - 1 explains the icons and the texts used.
As the default, the Drives Window program updates the statusinformation for all connected devices periodically, e. g. with DDCSCommunication twice a second. You can, however, set only theDrives Panel status be updated or disable the status updatingaltogether by options on Device Status dialogue. To display theDrives Status dialogue select Device Status from the Options menu.
If a drive in the system declares a fault or warning, the user isinformed of the condition by a fault or warning message box. Thismessage box can be disabled by deselecting the Fault/Warningmessages option from the Options/Drive Status menu. From thefault/warning message box, you can reset the fault or view the faultlogger.
Note: If you want only the Drives Panel be updated, then only thecurrently active Target's faults and warnings are notified.
If you want to display only the drives that you are working with, youcan do that by selecting the Select Drives... command from theSystem menu. The following dialogue is displayed:
Figure 5 - 2 Select Drives dialogue.
Creating a set out of the connected Targets is useful when you havetoo many Targets connected to update the status of them all or youcan't see the Targets you want to observe at the same time in theSystem Configuration Window.
Before starting any of the tools you must first select the drive youwant work with, which is called the default drive. This is done byclicking on the drive in the System Configuration Display or by usingthe Select command from the Drive menu. As the default, the firstTarget of the first communication channel is chosen.
View StatusInformationUpdate the
Status Display
View Faults andWarningsMessages
Select Drives
Select theDefault Drive
Chapter 5 - System Configuration
5 - 4 Drives Window User’s Manual
You can view saved files from the System Configuration window byselecting the file name from the FILES directory. Drives Window willthen load the contents of the file and show it in the respective tool.
Any of the Drives Window tools can be started from the SystemConfiguration Display. A tool will be started for the default drive byusing the commands available in the Tools menu or by clicking atool button on the toolbar. Another way to start a tool is to click theright mouse button in the System Configuration window and thenselect a tool command from the pop-up menu.
You can give a specific name for each drive. The name aredisplayed next to the drive number in the status text.
By means of the File Upload command on the Drive menu you canupload the predefined files from the Target.
By means of the File Download command in the same menu you candownload a file to a selected Target.
Note: Always use this command according to instructions given inyour product ,anual.
You can save the System Configuration to a file by selecting theSave As. . . command from File menu while the SystemConfiguration window is active. If you have made changes to theconfiguration settings the Drives Window asks you to confirm thatyou want to save the changes when you quit the program. Choosethe Yes button to save the settings. The System Configuration fileextension is .dwc.
After a Target is connected, a Parameter and Signal table may beloaded for it. The loading of the table takes automatically place in thebeginning of the initialization of the first tool for the target (e.g.signals and parameters tool).
You can reload the contents of the Parameter and Signal table byusing Reload Parameter and Signal Table command from the Drivemenu.Reload the contents of the Parameter and Signal table isnecessary in the following cases:
• A new application is downloaded (the construction of the AMC table ischanged).
• The PASS CODE is changed.• A macro is changed.• The display language of the table is changed.• You have changed the option "Take the Whole Parameter Table"
Load a SavedFile
Start AnotherTool
Give a Name forthe Drive
File Upload
File Download
Save SystemConfiguration to
a File
ReloadParameter and
Signal Table

Chapter 5 - System Configuration
Drives Window User’s Manual 5 - 5
Note: When you reload the contents of the table all the open Signalsand Parameters tools, Monitors and Data Loggers of this Target willbe closed.
If you change the PC connection or remove a drive from the PCconnection, you must reidentify network. You must close all of theopen Tools before issuing this command. Network reidentificationalso takes automatically place if you reconfigure any of thecommunication links.
ReidentifyNetwork

Chapter 5 - System Configuration
5 - 6 Drives Window User’s Manual
This page is intentionally left blank.

Drives Window User’s Manual 6 - 1
Chapter 6 - Drives Panel
This chapter describes how to control the ABB product from theDrives Window with the Drives Panel. The Drives Panel may bedifferent with different Targets: refer to Appendix B to have moreinformation about different ABB drives.
The Drives Panel is used for controlling the operation of the drive.You can start and stop the drive, change the direction of rotation andstep and adjust the reference value. In case the drive trips on afault, you can reset the fault from the Drives Panel. It is possible tocontrol several drives from the Drives Panel.
The Drives Window helps you in controlling the drive by giving yousome warnings. For example, if you try to start a drive in faultcondition, the Drives Window prompts you to first reset the fault. Thewarnings depend on the type of the drive you are controlling.
Here is an example of the Drives Panel for the ACS 600 MultiDrive:
Figure 6 - 1 Drives Panel
You can display or hide the Drives Panel by selecting the DrivesPanel command from the View menu, by clicking the Drives Panel( ) button on the toolbar or by first clicking the right mouse buttonand then selecting the Drives Panel command from the pop-upmenu. Drives Window displays the Drives Panel of the default drive.
Overview
Using Drives Panel
Drives Panelbutton
STATUS REFERENCE STEP OPERATIONALCOMMANDS
Stop
StartLocal
Direction
Active Reference
Give stepsReset
CoastStop
Chapter 6 - Drives Panel
6 - 2 Drives Window User’s Manual
This section describes the features of this tool.
You can use the Drives Panel to give commands and monitor thestatus of the selected drive. In order to be able to give operationalcommands to the drive, first set the control location of the drive tothe computer. Refer to the manuals of the drive on how to set thecontrol location.
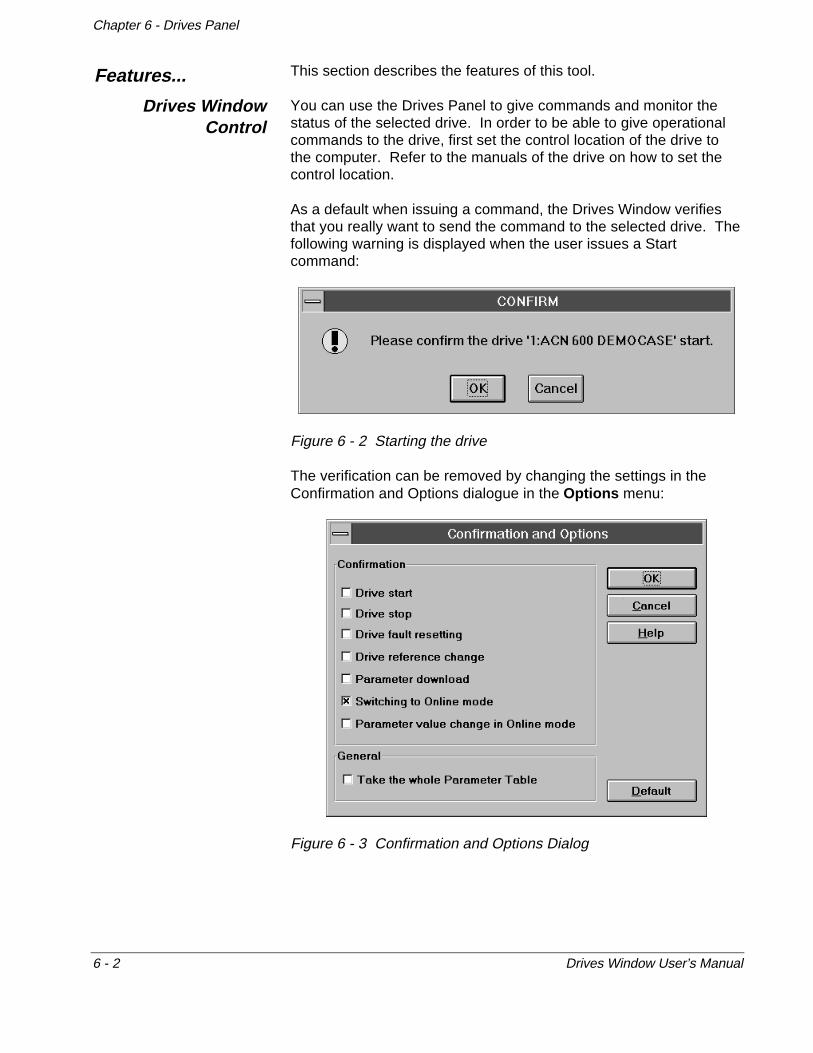
As a default when issuing a command, the Drives Window verifiesthat you really want to send the command to the selected drive. Thefollowing warning is displayed when the user issues a Startcommand:
Figure 6 - 2 Starting the drive
The verification can be removed by changing the settings in theConfirmation and Options dialogue in the Options menu:
Figure 6 - 3 Confirmation and Options Dialog
Features...
Drives WindowControl

Chapter 6 - Drives Panel
Drives Window User’s Manual 6 - 3
The start, stop, direction, reset and local commands of the DrivesPanel can be issued by clicking on the respective command buttonsor by selecting a command from the Drive menu. The table belowdescribes how to start and stop the drive, change the rotationdirection, reset a fault and change the control location.
Table 6 - 1 Operational Commands
Button Description Menu Equivalent
Stops the drive. Stop command under Drive menu.
Coast stops the drive. Not available, specific only for certainTargets
Starts the drive . Start command under Drive menu.
Resets an active fault from the drive. Reset Fault command under Drivemenu.
Changes the rotational direction of thedrive to Forward.
Forward command under Drivemenu.
Changes the rotational direction of thedrive to Reverse .
Reverse command under Drivemenu.
Changes the control location betweenDrives Window and External control.
Local command under Drive menu.
To set the reference of the drive, type the new value in the referencefield on the Drives Panel and then press the return key or the Send( ) button. Another way to set the reference is to use the SetReference... command from the Drive menu. It displays thefollowing dialogue:
Figure 6 - 4 Reference setting dialogue
Type the new value in the New Value field.
OperationalsCommands
SettingReference

Chapter 6 - Drives Panel
6 - 4 Drives Window User’s Manual
Note: Minimum and maximum values are given with signs indicatingForward / Reverse reference limits, but most Targets do not allowuser to give a signed reference and expect the direction be givenwith special Forward and Reverse commands after a new referencevalue is typed in.
In order to study the effect of step responses, Drives Window allowsyou to define a step function for the reference or a parameter. Stepitself is defined by selecting "Define Steps..." from the Drive menu.Rising and falling edges and active time are possible for the stepfunction.If you don't define any active time, a button with a rising edge imageappears on the Drives Panel.
By selecting an active time for the step, the setting of rising andfalling edges is automatic once the button with a pulse image on theDrives Panel is pressed.
Figure 6 - 5 Viewing and Defining Steps
Step Function

Drives Window User’s Manual 7 - 1
Chapter 7 - Monitor Tool
This chapter describes how to monitor the signal and parametervalues of the ABB drive.
The Monitor Tool is a graphical interface used to trend the actualparameters and signal values of the Target device. The MonitorTool is started by clicking the Monitor Tool button on the maintoolbar or by clicking the right mouse button on the SystemConfiguration window and selecting the Monitoring command fromthe pop-up menu. You can also start the Monitor Tool from the Toolsmenu.
You can select up to a maximum 6 different variables from differentTargets for trending. You can also open the Monitor Tool for viewingpreviously saved files.
Figure 7 - 1 Monitor Tool
The Monitor Toolbar provides you with quick access to the functionsof the Monitor Tool. Both the Monitor Toolbar and the Legend canbe hidden from the View menu.
Overview
Starting theMonitor Tool
Monitor Tool button
Settings
Start Monitoring
Item Name
Min Value
Max value
Monitor Toolbar
Legend
Stop Monitoring
Status
Graph
Online value
Numerical value line
History Scrollbar

Chapter 7 - Monitor Tool
7 - 2 Drives Window User’s Manual
The Monitor menu includes the Monitor Tool specific commands.You can access the Monitor menu either from the main DrivesWindow toolbar or by clicking the right mouse button on the Monitorwindow.
This section describes how to perform the functions of this tool.
When you start the Monitor Tool you are presented with the SelectVariables dialogue.
Figure 7 - 2 Select variables for the Monitor
You can select up to a maximum 6 different variables for the Monitor.You can select variables from different Targets by first selecting theTarget from the Selected Target drop-down list box and then thevariable from the Available variables field. Selected variables appearon the right hand side list box. Target the variable belongs to isindicated by the channel and node numbers given in brackets.
You can select up to a maximum 6 different variables type of packedboolean for the Monitor. When you have selected the variables theSelect Bits -dialog is displayed. The Select Bits -dialog shows all theselected variables in bit form. You can select up to a maximum 16bits from the different variables for the Monitor.
Note: If you select variables of other type with packed booleans,packed booleans are monitored as integers.
How To...
Select Items forMonitoring
Valuestype ofpacked
boolean

Chapter 7 - Monitor Tool
Drives Window User’s Manual 7 - 3
Once you have selected the variables you want to trend, press OKbutton in the Select Variables dialog and the Monitor Settings dialogappears instead. The dialog is as follows:
Figure 7 - 3 Monitor Settings
Each selected variable is shown in the list box with minimum andmaximum values. As the default, the first variable in the list is active.By clicking items in the list box you can view scalings of the othervariables. Autoscaling is variable specific: you can click it off for thevariables you want to scale yourself.
In the Monitor Settings dialog you can also adjust the samplinginterval and the length of the visible Monitor graph. In the samplinginterval combo box you have all the available intervals listed.Intervals are for one variable only: if you have selected more thanone variable, the smallest intervals may create too heavy a load.
The length of the X-axis sets the time you can see at one time on theMonitor screen. Remember: you can view the Monitor history, so youdo not have to worry about loosing data, if you want the X-axis beshort.
Pressing Trigger... button you can set triggering conditions. You cantrigger the actual values either in continuous or single triggeringmode.
Monitor Settings

Chapter 7 - Monitor Tool
7 - 4 Drives Window User’s Manual
In the continuous trigger mode, the actual values are measured untilyou stop the Monitor; while in single trigger mode, the display will bestopped once the triggering conditions for one or several signals aremet. The triggering point is displayed by a vertical line on thedisplay.
Figure 7 - 4 Setting Triggering Conditions.
You can define a triggering level and triggering condition for eachitem. The first triggering condition that occurs stops the Monitor.You can also define the number of samples which are displayedbefore the triggering point.
After the settings are done, press OK to close the Monitor Settingsdialog. If you want to change settings, select Settings... from theMonitor menu or press Settings ( ) button in the Monitor toolbar.
The monitoring is started when you press the Go ( ) button (short-cut key F2) on the Monitor toolbar or select the Go command fromthe Monitor menu. The Pause ( ) button (short-cut key F3)or thePause command of the Monitor menu stops the Monitor.
By using the history scroll bar just below the Monitor toolbar, you canview the history data back sample by sample. The scroll appearsonly if there is history data to be viewed and the Monitor is paused.
The Monitor Tool displays detailed information about the items. Inthe runtime an online numerical value between minimum andmaximum values is shown in the toolbar for the selected variable. Ifyou have paused the Monitor, you can see accurate numericalvalues of variables and X-axis by clicking a point in the Monitorscreen with the left mouse button.
Start and Stopthe Monitoring
Display
History Data
Item Value

Chapter 7 - Monitor Tool
Drives Window User’s Manual 7 - 5
A vertical red line appears with accurate, interpolated numericalvalues on its right side. You can also get the line in zoomed state(see later).
There are two different display modes, scroll and sweep, which canbe selected by the Graph Type command from the View menu.Sweep mode is recommended if fast monitoring is required.
Note: If you are using the sweep mode, history data is saved butavailable only from the file.
The Zoom In command lets you see the graph signals in greaterdetail. To zoom-in on a specific area of the graph, use the followingprocedure:
1. If the monitor is running, stop the monitor by clicking thePause ( ) button or by pressing the short-cut key F3.
2. There are two Zoom selections on the View menu: Zoom Inand Zoom Out (also on the pop-up menu). Select Zoom In orpress short-cut key F4. Point the cursor's crosshairs at anycorner of the retangular area that you want to enlarge.
3. To select a square, press and hold the left mouse button. Dragthe cursor to the opposite corner of the rectange.
Release the mouse button.
Display Modes
Zoom on aSpecific Viewing
Area

Chapter 7 - Monitor Tool
7 - 6 Drives Window User’s Manual
If you are using the keyboard:
1. If the monitor is running, stop the monitor by pressing theshort-cut key F3.
2. There are two Zoom selections on the View menu: Zoom Inand Zoom Out. Select Zoom In or press short-cut key F4.Point the cursor's crosshairs at any corner of the retangulararea that you want to enlarge. You can do that by thekeyboard cursor keys.
3. To select a square, press and hold the Shift -key and drag thecursor to the opposite corner of the rectange by the cursorkeys.
4. Release the Shift -key and press ENTER.
To continue monitoring, you have to first select Zoom Out commandfrom the View menu.
The actual values of the monitored signals or parameters along withtheir history data can be saved to a file for later use. Saving ispossible only when the monitor is stopped. The values are saved intext format so it is possible to import the data into any program whichsupports text format. To save the values use the Save As commandfrom File menu or click the Save( ) button on the toolbar. TheMonitor Tool file extension is .dwm.
Graphs which are saved to a file using the Drives Window format(.dwm) can be retrieved by using the Open command from the Filemenu or clicking the Open ( ) button on the Monitor toolbar. Selectthe file you want to retrieve, and a new monitor window is openedwith the contents of the file.
If you want to compare differencies between two events you have inthe Monitor screen, it is possible by displaying a file on the actualMonitor Tool. This is achieved as follows:
Create a file and save it.
1. Continue monitoring signals.
2. Pause the monitor to a position you find interesting.
3. Select a synchronizing point by clicking it with the left mousebutton. A red line appears. You can also zoom in the Monitorbefore settings the line.
4. Open the file and repeat step 3 for it.
Save Data to aFile
Read Data from aFile
Using a File as aReference Graph

Chapter 7 - Monitor Tool
Drives Window User’s Manual 7 - 7
5. Select Merge from the file's Monitor menu. Then click the filewindow with the left mouse button. Keep the button presseddown and move the file window onto the Monitor window.Release the mouse button.
6. File variable graphs are now displayed on the Monitor graphsso that the red lines were synchronized. The file's X-axis isautomatically scaled to be the same as that of the MonitorTool.
When there are reference variables in the Monitor, you can save thegraph, zoom in and see numerical values. Before other actions areavailable, you have to select Remove Reference Graph from theMonitor menu of the Tool.
The monitor display can be printed to the default printer using thePrint command from the File menu or by selecting the Print ( )button on the Monitor toolbar. The printer settings can be changedusing the File/Print Setup command.
The graphs on an active monitor window can be copied to theclipboard using the Edit/Copy command from the Menubar.
You can clear the graph of the Monitor Tool by using the ClearGraph command from the Monitor menu.
Print a Graph
Copy to theClipboard
Clear the GraphDisplay

Chapter 7 - Monitor Tool
7 - 8 Drives Window User’s Manual
This page is intentionally left blank.

Drives Window User’s Manual 8 - 1
Chapter 8 - Signals and Parameters Tool
This chapter describes the available Signal and Parameter handlingfunctions of Drives Window.
The Signals and Parameters Tool is started by selecting the Signalsand Parameters button on the toolbar or by clicking the right mousebutton on the System Configuration window and selecting theSignals and Parameters command from the pop-up menu. You canopen individual Signal and Parameter Tools for each drive in thesystem at the same time.
Figure 8 - 1 Signals and Parameters Tool
The Signal and Parameter information is displayed in a list as shownin Figure 8 - 1. As the default, only the group headings are loaded.By double-clicking a heading, the parameters or signals of the groupare loaded and displayed. By double-clicking the heading again, thegroup is closed, but not unloaded. If you open a closed group that isalready loaded, the contents are not reloaded, but displayed as theywere when last loaded.
Overview
Starting Signalsand ParametersTool
Signals andParameters
button
Set ParameterUpload
DownloadOff-line SelectOn-line

Chapter 8 - Signals and Parameters Tool
8 - 2 Drives Window User’s Manual
If you want to read the whole table at once, select Options andConfirmation from the Options menu and set option “Take thewhole parameter table” active. The following information is availablefor each signal and parameter:
• The identification number of the group or the parameter
• Name
• Actual Value
• Unit
• Minimum value
• Maximum value
This section describes how to perform the functions of this tool.
You can use the Signals and Parameters Tool either in on-line or off-line mode. The Signals and Parameters Tool is always started in off-line mode.
The selection between on-line and off-line modes is done byselecting the ON-LINE or OFF-LINE option button from the Signalsand Parameters toolbar or by selecting the command from theSignals and Parameters menu.
When Drives Window is in the off-line mode, the user can changevalues without having these changes effect the drive until the userperforms the download command or goes to the on-line mode.
When Drives Window is in the on-line mode, the signal andparameter values are continuously updated from the drive. If aparameter value is changed while in the on-line mode, the new valueis sent to the drive automatically.
When you select the on-line mode, Drives Windows will verify thatyou really want to proceed and shows the following message box:
Figure 8 - 2 Switching to ON-LINE
How To...
Switch to theOn/Off-Line
Mode
Off-lineMode
On-lineMode

Chapter 8 - Signals and Parameters Tool
Drives Window User’s Manual 8 - 3
You can now download selected parameters to drive, download onlythe changed parameters, download none of the parameters, orcancel the action.
A parameter can be selected from the signal and parameter list byclicking with the left mouse button on the parameter or by scrollingthrough the list using the up and down arrow keys. The selectedsignal or parameter is then highlighted for the user.
You can select a subset of the signals and parameters by clicking onthe Select command from the Signals and Parameters menu or byclicking the Select Subset ( ) button on the Signals andParameters toolbar. The following dialogue is displayed:
Figure 8 - 3 Signal and Parameter Selection dialogue.
At first, the left column shows all of the groups that are available. Bydouple-clicking a group or by selecting a group and choosing“Parameters” you can see the signals or parameters of the selectedgroup.
The Select button is used to move the signals and parameters fromthe “Available Variables’ list to the” Selected Variables’ list. TheRemove button removes a signal or parameter from the ‘SelectedVariables’ list. If you want to remove all of the signals andparameters use the Remove All command.
Select aParameter
Selecting aSignal or aParameter
Subset

Chapter 8 - Signals and Parameters Tool
8 - 4 Drives Window User’s Manual
The parameter values can be changed in the Change Value -dialogue. You can display the Change Value -dialogue by:
• clicking the Set Value button
• double-clicking the left mouse button on the item
• selecting the Set Value... command from the Signals andParameters menu or from the pop-up menu (the pop-up menu isdisplayed by clicking the right mouse button on the screen);
• selecting the item and pressing the ENTER-key.
The following information is available for numerical parameters:
• Group and Parameter ID Number
• Parameter Name
• Minimum and Maximum values
• Type
• Current value
• Unit
Figure 8 - 4 Change Value dialogue for Numerical Parameter
All numerical values can be changed by typing the new value in theValue field. With values of type real or integer it is also possible touse scrollbar below the value field to set the new value.
Change theParameter
Values

Chapter 8 - Signals and Parameters Tool
Drives Window User’s Manual 8 - 5
The following information is available for parameters type of boolean:
• Group and Parameter ID Number
• Parameter Name
• Type
• Current value
• Option buttons
Figure 8 - 5 Change Value dialogue for Parameter type of Boolean
The following information is available for parameters type of text:
• Group and Parameter ID Number
• Parameter Name
• Minimum and Maximum values
• Type
• Current value and list of possible selections

Chapter 8 - Signals and Parameters Tool
8 - 6 Drives Window User’s Manual
Figure 8 - 6 Change Value dialogue for Text Parameter
The text ON-LINE or OFF-LINE in the center of the dialogueindicates which mode you are working in. Pressing the Cancelbutton, cancels the parameter setting and closes the dialogue.A new parameter value is accepted when the OK button is selected.If the parameter value is changed in the on-line mode, DrivesWindow prompts the user for confirmation before sending the newparameter value to the drive. This confirmation can be removed bydeselecting the Parameter Change On-line option from the Optionsmenu.
Figure 8 - 7 Parameter change verification in on-line mode.
If you select YES, the new setting is sent to the drive; otherwise thechange is cancelled.
In off-line mode, the value is changed in the parameter list but it isnot sent to the drive. All of the changed values are marked with twoasterisks (**). When you try to close the Signals and ParametersTool without saving the changes to a file or downloading them to thedrive, the program confirms which action to perform:

Chapter 8 - Signals and Parameters Tool
Drives Window User’s Manual 8 - 7
Figure 8 - 8 Unsaved Parameter Handling
Upload and download commands are used for transferringparameter values between the Drives Window program and thedrive. You can begin the upload or download functions by selectingthe corresponding command from the Signals and Parametersmenu or by clicking the Upload Values ( ) or the Download Values( ) buttons on the toolbar.
The upload function is used to read all of the signal and parametervalues from the selected drive into the Drives Window program. Ifyou have selected a subset of signals and parameters, only theselected items are updated.
The download function is used to write the parameter values on theactive Signals and Parameters Tool of the Drives Window down tothe drive. After giving the download command the Drives Windowwill prompt the user to confirm which of the parameters will bedownloaded.
WARNING! The parameters can only be uploaded and downloadedbetween drives of the same type and with compatible softwareversions.
The displayed signal and parameter list can be saved to a file usingthe Save and Save As commands from the File menu. The typeand version of the drive are also saved to the file in order to maintaincompatibility in cases where the saved parameter set is downloadedto another drive. A header for the parameter file can be addedbefore saving. The Signals and Parameters Tool file extension is.dwp.
Previously saved parameter files can be opened by selecting theOpen ( ) button on the toolbar or by using the Open command fromthe File menu. The Signals and Parameters Tool file extension is.dwp.
Upload andDownloadParameter
Values
UploadValues
DownloadValues
Save a Signaland Parameter
List to a File
Read Signalsand Parameters
from a File

Chapter 8 - Signals and Parameters Tool
8 - 8 Drives Window User’s Manual
After selecting a file, a new Signals and Parameters Tool window isopened and the contents of the selected file are displayed in thiswindow. If you want to download the parameter values of the file toa drive, select the Download Values ( ) button or the commandfrom the Signals and Parameters menu. In the Download dialogbox, select the target which is to receive the new parameter list. Ifthe download function is selected, Drives Window first checks thecompatibility between the parameter set in the active window and theselected drive before starting the download function.
The displayed signal and parameter list can be printed to the defaultWindows printer by using the Print command [Ctrl+P] from the Filemenu or clicking the Print ( ) button on the toolbar. Printer settingscan be changed using the Print Setup command from the File menu.
The parameter set in the active signals and parameter tool can becompared to a parameter set in a saved file. First select theCompare command from the File menu. Drives Window thenprompts the user to choose the file which the signals and parametersare to be compared against. The results of the comparison are thendisplayed in a separate result window. You can print the results byselecting the Print command from the File menu or by selecting thePrint ( ) button on the toolbar. The result is always saved to a filedwpsdiff.log.
The signal and parameter list of the active window can be copied intext format to the Windows clipboard by using the Copy commandfrom the Edit menu.
When viewing the signal and parameter list, the user can search fora specific parameter by using the Find command from the Editmenu. The following dialogue is then displayed:
Figure 8 - 9 Find Dialog
The user can then type in a text string to be found. After enteringthe text string, the Find Next function searches for the next matchingtext from all of the cells in the active window.
DownloadValues
AfterOpening a
File
Print a Signaland Parameter
List
Compare theParameters
Copy to theClipboard
Find a Parameter

Chapter 8 - Signals and Parameters Tool
Drives Window User’s Manual 8 - 9
To copy a complete set or a subset of parameters from one drive(source) to another (destination), perform the following steps:
1. Select the source drive as the default drive.
2. Open the Signals and Parameters Tool. The complete signaland parameter list is uploaded automatically from the sourcedrive.
3. Select all or a subset of the signals and parameters.
4. Modify the parameter values if necessary.
5. Select the Download command from the Signals andParameters menu.
6. Chose the new target for downloading the parameter set.
You can select which columns you want to display from theView/Columns menu. If you don’t need all of the informationavailable, you can hide the unnecessary columns. The width of thecolumn can also be changed by first moving the mouse over thecolumn separator until the mouse icon changes. By holding downthe left mouse button, the user can drag the separator line to theright or left until the column is the desired width.
You can also customize the value viewing forms for integers andpacked booleans. First select a parameter from the list. Then bypressing keys 'h', 'd' and 'b' you can switch between hexadecimal,decimal and boolean forms.
All of the groups with uploaded parameters can be opened.Note: group parameters are not uploaded with this command!
A good way of having an overview of the AMC table is to close allgroups. Thus only group headings remain visible. Groups are notunloaded.
By updating a group you can have up-to-date information of thegroup: the group contents are reloaded.
Copy aParameter Set
from a Drive toAnother
Customize theDisplay
Open UploadedGroups
Close All Groups
Update Group

Chapter 8 - Signals and Parameters Tool
8 - 10 Drives Window User’s Manual
This page is intentionally left blank.

Drives Window User’s Manual 9 - 1
Chapter 9 - Data Logger Tool
This chapter describes how to set up the Data Loggers located in theABB product. This chapter also details how to display the contentsof the Data Loggers by using Drives Window.
The Data Logger Tool is used for controlling the data loggers of thedrive and for displaying their contents. The Data Logger Tool isstarted by clicking the Data Logger Tool button on the toolbar orusing the Data Logger command from the Tools menu.
You can open as many Data Logger Tools as there are DataLoggers in the applicable drive. Previously saved files can also beviewed with the Data Logger Tool.
Figure 9 - 1 Data Logger Tool
The Data Logger bar provides you with quick access to the functionsof the Data Logger Tool. Both the Data Logger bar and the Legendcan be hidden from the View menu. The Data Logger menuincludes the Data Logger Tool specific commands. If the DataLogger is initialized, the settings has been read from the drive.
Overview
Starting the DataLogger Tool
Data LoggerTool button
ResetGo
Pause
Upload
Scale
SettingsStatus
Legend
Data LoggerToolbar
Graph

Chapter 9 - Datat Logger Tool
9 - 2 Drives Window User’s Manual
Data Logger status string is present at the top-left corner of the DataLogger Tool window at all times.
UNINITIALIZED Data Logger has not been initialized. Select the variables and setthe triggering conditions.
READY Data Logger has been initialized and is ready for start command.
COLLECTING Data Logger is collecting samples.
TRIGGERED The triggering conditions have been fulfilled and the samples areready for upload. This is done automatically by the Drives Windowsoftware.
FILLED The reading buffer of the data logger has been filled after thetriggering.
This section describes how to perform the functions of this tool.
When you start the Data Logger Tool and the data logger isuninitialized, you are presented with the variable selection dialogue.See paragraph Selecting a Signal or a Parameter Subset in Chapter6 for more information. You can select up to a maximum of 4different variables for each Data Logger. After you have selectedthe variables you must adjust the settings of the Data Logger.
The Data Logger settings dialogue is displayed by clicking theSettings ( ) button on the Data Logger bar or by using the Settingscommand from the Data Logger menu. How to set the settings forthe specific drive is described later in this chapter.
You can scale the y-axis for each data logger window and also foreach variable separately. The scaling is done by setting theminimum and maximum values displayed at the top and the bottomof the graph, respectively. As a default, the monitor scaling is set toauto scale. The Auto scale command automatically determines theminimum and maximum value for each item, and sets the scale limitsto these values. To manually scale the data logger variables, clickthe Scale ( ) button on the Data Logger bar or use the Scalingcommand from the Data Logger menu.
The contents of the Data Logger can be presented in numerical formas well as the default graphical display. The actual sampled valuesof logged variables can be viewed by selecting the NumericalDisplay command from the Data Logger menu.
Status of theData Logger
How To...
Select Variablesfor the Data
Logger
Adjust theSettings of the
Data Logger
Set the DataLogger Window
Scaling
Change theDisplay Mode

Chapter 9 - Data Logger Tool
Drives Window User’s Manual 9 - 3
The Data Logger is started by clicking the Start ( ) button andstopped by clicking the Stop ( ) button on the Data Logger bar. Youcan also use the respective Start and Stop commands from theData Logger pop-up menu.
The current values in the Data Logger can be uploaded by clickingthe Upload ( ) button on the Data Logger bar or using the ReadFrom Drive command from the Data Logger menu.
The read and write pointers of the data logger can be reset byclicking the Reset ( ) button on the Data Logger bar or by using theReset command from the Data Logger menu.
The Zoom In command lets you see the graph signals in greaterdetail. To zoom-in on a specific area of the graph, use the followingprocedure:
1. If the monitor is running, stop the monitor by clicking thePause ( ) button or by pressing the short-cut key F3.
2. There are two Zoom selections on the View menu: Zoom Inand Zoom Out (also on the pop-up menu). Select Zoom In orpress short-cut key F4. Point the cursor's crosshairs at anycorner of the retangular area that you want to enlarge.
3. To select a square, press and hold the left mouse button. Dragthe cursor to the opposite corner of the rectange.
4. Release the mouse button.
If you are using the keyboard:
1. If the monitor is running, stop the monitor by pressing theshort-cut key F3.
2. There are two Zoom selections on the View menu: Zoom Inand Zoom Out. Select Zoom In or press short-cut key F4.Point the cursor's crosshairs at any corner of the retangulararea that you want to enlarge. You can do that by thekeyboard cursor keys.
3. To select a square, press and hold the Shift -key and drag thecursor to the opposite corner of the rectange by the cursorkeys.
4. Release the Shift -key.
To continue monitoring, you have to first select Zoom Out commandfrom the View menu.
Start and Stopthe Data Logger
Upload theValues in theData Logger
Reset thePointers of the
Data Logger
Zoom on aSpecific Viewing
Area

Chapter 9 - Datat Logger Tool
9 - 4 Drives Window User’s Manual
Numerical temporary values can be seen by clicking the Data LoggerTool window with the left mouse button.
The contents of the data logger can be saved to a file. To save thecontents, use the Save As... command from File menu or click theSave( ) button on the toolbar. You can also write a header line forthe data file before saving. The extension of the Data Logger Toolfile is .dwd.
Data logger files contain data in a scaled form. If you want to savethe data unscaled, you should copy the temporary DWDATLOG.TMPfile to your own directory after each data logger upload. You can alsoview this file by selecting Numerical Display... from the Data Loggermenu.
Note: The DWDATLOG.TMP file is rewritten after every upload.
You can restore saved data from a file by clicking the Open ( )button on the toolbar or by using the Open command from the Filemenu. The extension of the Data Logger Tool file is .dwd.
You can use saved Data Logger files as reference graphs with theactual Data Logger Tool in the same way as in the Monitor Tool (seeMonitor).
Note: You can not mix Monitor and Data Logger files.
To print the display of the Data Logger Tool click the Print ( ) buttonon the toolbar or select the Print command from the File menu.
The display on an active window can be copied to the clipboardusing the Edit/Copy command from the menu.
Data Logger Settings are Target specific. In this chapter the settingsfor the ACS 600 family are described.
When you want to view an initialized data logger, the current settingsare uploaded and a filled Data Logger Settings dialog is shown. Nowyou can change the settings yourself.
NumericalValues
Save Data to aFile
Read Data from aFile
Using a File as aReference Graph
Print the Display
Copy the Displayto the Clipboard
Data LoggerSettings

Chapter 9 - Data Logger Tool
Drives Window User’s Manual 9 - 5
Figure 9 - 2 Data Logger Settings dialogue
To change the variables which are logged, click the Select button onthe Data Logger Settings dialogue. In ACS 600, there can be up tofour different variables in the data logger. You can also view packedboolean bits.
The Data Loggers of ACS 600 can be set to trigger on faults,warnings, limits, or defined levels of the selected variable. Thedefault triggering is manual.
Table 9 - 1
Faults The Data Logger stops collecting samples when a fault occurs in thedrive. For more information on the faults refer to the ACS 600Programming Manual
Warnings The Data Logger stops collecting samples when a warning occurs in thedrive. For more information on the warnings refer to the ACS 600Programming Manual.
Limits The Data Logger stops collecting samples when the any of the set limitsis reached in the drive. For more information on the limits refer to theACS 600 Programming Manual.
Level If you select level triggering you must select a triggering variable. Youalso set level, hysteresis and select falling or rising edge of the variableto trigger the Data Logger.
The number of samples collected before triggering can be set byentering the value into the respective field in the Data LoggerSettings dialogue. The value entered signifies when the logging hasstopped (due to a triggered event), the logger will contain thespecified number of samples before the triggering moment and therest of the samples are after the triggering moment.
Variables
Triggeringconditions
Setting theSamples
BeforeTriggering

Chapter 9 - Datat Logger Tool
9 - 6 Drives Window User’s Manual
The sample interval can be set by entering the value in therespective field in the Data Logger Settings dialogue. The sampleinterval is set in multiples of 1 ms.
To scale the y-axis of the data logger window, click the Scaling...button.
The saved settings can be restored by clicking the Open button onthe Datalogger Settings dialogue.
To save the Datalogger settings to a file, click the Save As button onthe Datalogger Settings dialogue. The extension of the Data Loggersettings file is .dls.
The Help button opens the context-sensitive help file.
The Cancel button restores the situation as it was when the Settingsdialog was shown.
Note: If you have changed the variable set, it is not possible tocancel the Settings any more.
The Initialize button initializes the data logger with new settings.
SettingSampleInterval
Scaling...
Open...
Save As...
Help
Cancel
Initialize

Drives Window User’s Manual 10 - 1
Chapter 10 - Event Logger Tool
This chapter describes how to upload the contents of the eventlogger from the ABB product and display the contents with DrivesWindow.
The Event Logger Tool is used for displaying the contents of theEvent Logger of the selected drive. The information contained in theEvent Logger depends on the target drive. A description of theevent and the total power-on time before the event is available.
The Event Logger Tool is started by clicking the Event Logger Toolbutton on the toolbar or by selecting the Event Logger commandfrom the Tools menu. Drives Window displays the contents of theEvent Logger of the default drive.
Figure 10 - 1 Event Logger Tool
It depents on your application which events are written to the EventLogger. Faults and warnings are written to a separate fault logger.Refer to Chapter 11 - Fault Logger Tool in this manual. Thestandard application of ACS600 doesen’t write any events.
This section describes how to perform the functions of this tool.
The contents of the Event Logger Tool display can be refreshed byclicking the Refresh ( ) button on the Event Logger bar or by usingthe Refresh command from the Event Logger menu. DrivesWindow then reads the current contents of the Event Logger fromthe drive to the event list on the display.
Overview
Starting the EventLogger Tool
Event LoggerTool button
The Event Loggerof the ACS 600
How To...
Refresh theDisplay
Refresh

Chapter 10 - Event Logger Tool
10 - 2 Drives Window User’s Manual
To save the displayed event list, click the Save( ) button on thetoolbar or use the Save As.. command from File menu. A headerline can be added to this event file before saving. The Event LoggerTool file extension is .dwe.
You can reload an event list from a file by clicking the Open ( )button on the toolbar or by using the Open command from the Filemenu. The Event Logger Tool file extension is .dwe.
The event list of the active window can be copied to the clipboardusing the Copy command from the Edit menu.
Save the EventList to a File
Read Eventsfrom a File
Copy the EventList to theClipboard

Drives Window User’s Manual 11- 1
Chapter 11 - Fault Logger Tool
This chapter describes how to upload the contents of the fault loggerof the ABB product and display the contents with Drives Window.
The Fault Logger Tool is used for displaying the contents of the faultlogger of the selected drive. The fault logger of the ACS 600includes information of the fifteen most recent faults and warnings inthe drive. The name of the fault or warning and the total power-ontime before the fault or warning occurred is available. The typecolumn indicates whether the event described is a fault or a warning.
The Fault Logger Tool can be started by clicking the Fault LoggerTool button on the toolbar or using the Fault Logger command fromthe Tools menu. Drives Window displays the Fault Logger of thedefault drive.
Figure 11 - 1 Fault Logger Tool
This section describes how to perform the functions of this tool.
An active fault can be reset by pressing the Reset ( ) button eitheron the Drives Panel or on the Fault Logger toolbar. The Resetcommand can also be found from the Fault Logger menu.
The contents of the Fault Logger can be cleared by pressing theClear ( ) button on the Fault Logger toolbar or by selecting theClear All command from the Fault Logger menu.
Overview
Starting the FaultLogger Tool
Fault Logger Tool button
How To...
Reset an ActiveFault
Clear the FaultLogger
Refresh
Clear
Reset
Chapter 11 - Fault Logger Tool
11 - 2 Drives Window User’s Manual
The contents of the Fault Logger Tool display can be refreshed byclicking the Refresh ( ) button on the Fault Logger bar or by usingthe Refresh command from the Fault Logger or pop-up menu.Drives Window then reads the latest content of the Fault Logger fromthe drive to the fault list on the display.
You can select whether to display faults, warnings, or both on thefault list. This can be done from the View menu with the commandsFaults and Warnings. A check mark next to the respective menucommand indicates whether the item is shown or not.
To save the fault list to a file, click the Save( ) button on the toolbaror use the Save As command from File menu. A header line canalso be included for the fault list file before saving.
You can reload a fault list from a file by clicking the Open ( ) buttonon the toolbar or by using the Open command from the File menu.The Fault Logger Tool file extension is .dwf.
The fault list of the active window can be copied to the clipboardusing the Copy command from the Edit menu.
Refresh theDisplay
View Faults andWarnings
Save the FaultList to a File
Read Faults froma File
Copy the EventList to theClipboard

Drives Window User’s Manual 12- 1
Chapter 12 - Application Tool
This chapter describes how to display the symbols of an applicationand how to control the application programs located inside the ABBproduct.
The Application Tool is used for downloading and debuggingapplications created using AdvaBuild Function Chart Builder (FCB).You can view the application symbols (i.e. inputs and outputs offunction blocks) on-line and download new applications.
The Application Tool can be started for the selected target device byclicking the Application Tool ( ) button on the toolbar or by usingthe Application Tool command from the Tools menu.
Figure 12 - 1 Application Tool
Figure 12 -1 displays the Application Tool. The menu Applicationincludes commands used in handling applications.
After starting the Application Tool, Drives Window prompts you toselect the symbol file to be opened. This symbol file is a file (*.x01)which was created by the AdvaBuild Function Chart Builder whilegenerating target code for ACS600. For more information refer toAdvaBuild Function Chart Builder User’s Manual.
Overview
Starting theApplication Tool
ApplicationTool button
On-line
Download
Upload SelectOff-line
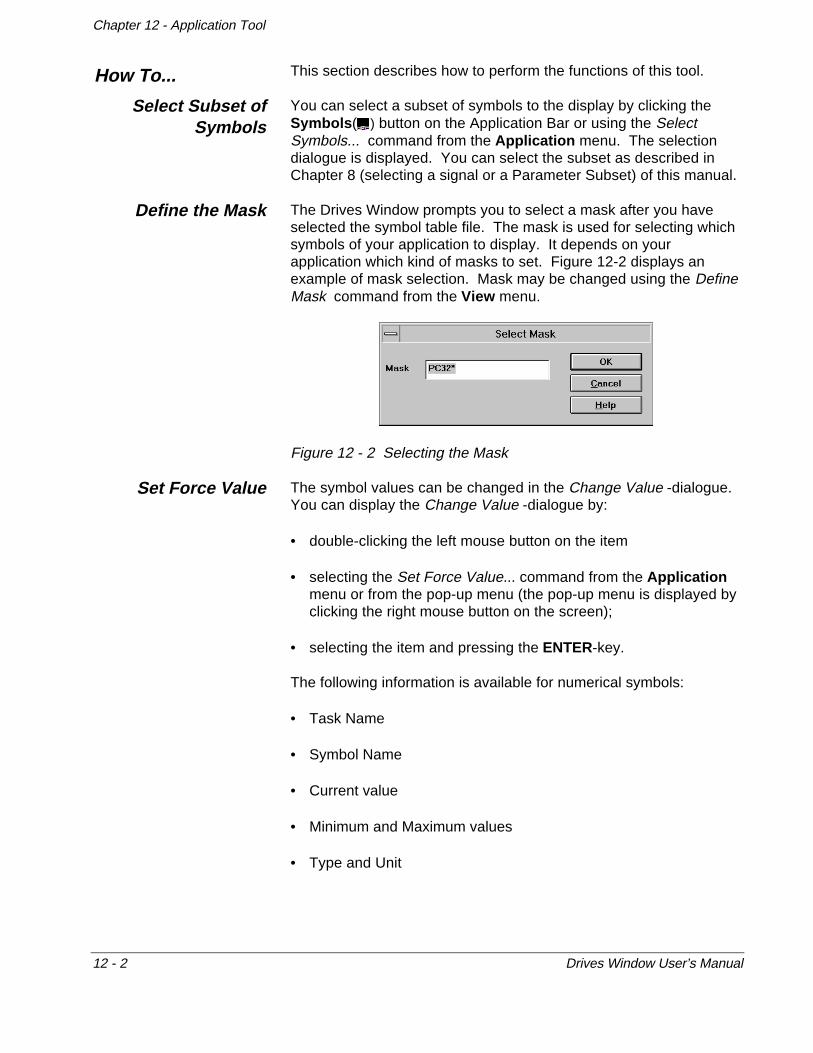
Chapter 12 - Application Tool
12 - 2 Drives Window User’s Manual
This section describes how to perform the functions of this tool.
You can select a subset of symbols to the display by clicking theSymbols ( ) button on the Application Bar or using the SelectSymbols... command from the Application menu. The selectiondialogue is displayed. You can select the subset as described inChapter 8 (selecting a signal or a Parameter Subset) of this manual.
The Drives Window prompts you to select a mask after you haveselected the symbol table file. The mask is used for selecting whichsymbols of your application to display. It depends on yourapplication which kind of masks to set. Figure 12-2 displays anexample of mask selection. Mask may be changed using the DefineMask command from the View menu.
Figure 12 - 2 Selecting the Mask
The symbol values can be changed in the Change Value -dialogue.You can display the Change Value -dialogue by:
• double-clicking the left mouse button on the item
• selecting the Set Force Value... command from the Applicationmenu or from the pop-up menu (the pop-up menu is displayed byclicking the right mouse button on the screen);
• selecting the item and pressing the ENTER-key.
The following information is available for numerical symbols:
• Task Name
• Symbol Name
• Current value
• Minimum and Maximum values
• Type and Unit
How To...
Select Subset ofSymbols
Define the Mask
Set Force Value

Chapter 12 - Application Tool
Drives Window User’s Manual 12 - 3
All numerical values can be changed by typing the new value in theValue field. With values of type real it is also possible to usescrollbar below the value field to set the new value.
The following information is available for symbols type of boolean:
• Task Name
• Symbol Name
• Current value
• Type
• Option buttons
The following information is available for symbols type of text:
• Task Name
• Symbol Name
• Minimum and Maximum values
• Current value
• Type and Unit
• List of possible selections.
The text ON-LINE or OFF-LINE in the center of the dialogueindicates which mode you are working in. Pressing the Cancelbutton, cancels the item setting and closes the dialogue. A newvalue is accepted when the OK button is selected. If the value ischanged in the on-line mode, Drives Window prompts the user forconfirmation before sending the new value to the target device. Thisconfirmation can be removed by deselecting the Parameter valuechange in online mode -option from the Confirmation dialog.
Figure 12 - 3 Parameter change verification in on-line mode.

Chapter 12 - Application Tool
12 - 4 Drives Window User’s Manual
If you select YES, the new value is sent down to the target device,otherwise the change is cancelled.
In off-line mode, the value is changed in the list but it is not sent tothe target device. All of the changed values are marked with twoasterisk (**). When you try to close the tool without saving thechanges to a file or downloading them to the target device, theprogram confirms which action to perform:
Figure 12 - 3 Unsaved Changes
Upload and download commands are used for transferring symbolvalues between the Drives Window program and the target device.
The Upload Values command is used for updating the values ofsymbols from the selected target device. For updating the valuesclick the Upload button on the Application Toolbar or choose theUpload Values command from the Application menu.
The download function is used to write all of the symbol values onthe active symbol table down to the target device. After giving thedownload command the following dialogue is displayed:
Figure 12 - 4 Verify Download
WARNING! The symbols can only be uploaded and downloadedbetween target devices of the same type and with compatiblesoftware versions. Otherwise Drives Window will display a warning(See: Chapter 4 - User Interface: Version Checking)
Upload andDownload
Symbol Table.
UploadValues
DownloadForce
Value(s)...
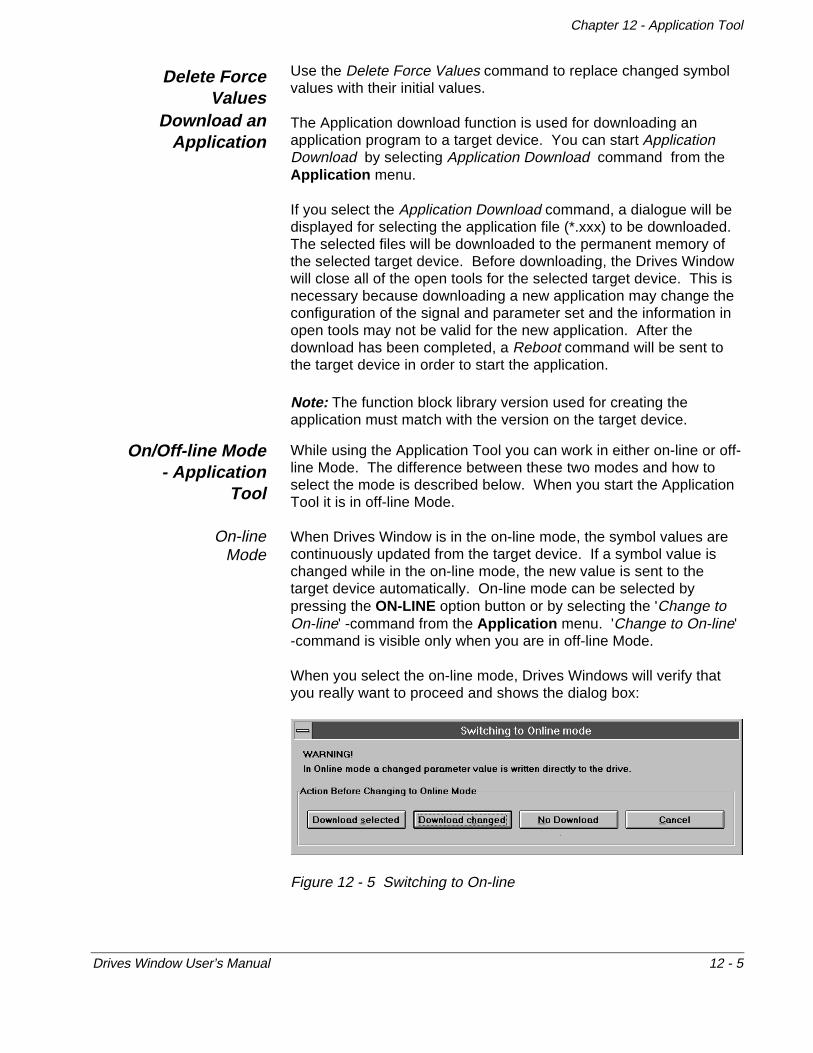
Chapter 12 - Application Tool
Drives Window User’s Manual 12 - 5
Use the Delete Force Values command to replace changed symbolvalues with their initial values.
The Application download function is used for downloading anapplication program to a target device. You can start ApplicationDownload by selecting Application Download command from theApplication menu.
If you select the Application Download command, a dialogue will bedisplayed for selecting the application file (*.xxx) to be downloaded.The selected files will be downloaded to the permanent memory ofthe selected target device. Before downloading, the Drives Windowwill close all of the open tools for the selected target device. This isnecessary because downloading a new application may change theconfiguration of the signal and parameter set and the information inopen tools may not be valid for the new application. After thedownload has been completed, a Reboot command will be sent tothe target device in order to start the application.
Note: The function block library version used for creating theapplication must match with the version on the target device.
While using the Application Tool you can work in either on-line or off-line Mode. The difference between these two modes and how toselect the mode is described below. When you start the ApplicationTool it is in off-line Mode.
When Drives Window is in the on-line mode, the symbol values arecontinuously updated from the target device. If a symbol value ischanged while in the on-line mode, the new value is sent to thetarget device automatically. On-line mode can be selected bypressing the ON-LINE option button or by selecting the 'Change toOn-line' -command from the Application menu. 'Change to On-line'-command is visible only when you are in off-line Mode.
When you select the on-line mode, Drives Windows will verify thatyou really want to proceed and shows the dialog box:
Figure 12 - 5 Switching to On-line
Delete ForceValues
Download anApplication
On/Off-line Mode- Application
Tool
On-lineMode

Chapter 12 - Application Tool
12 - 6 Drives Window User’s Manual
The confirmation can be removed by deselecting the Switching toOnline mode -option from the Confirmation dialog.
You can download all of the symbol values to target device,download only the changed values, download none of the values, orcancel the action.
In off-line mode the symbol values are not updated to the DrivesWindow display constantly. To update the values you have to useseparate Download Force Value(s)... command from theApplication menu.
Off-line mode can be selected by pressing the OFF-LINE optionbutton or by clicking the 'Change to Off-line' -command from theApplication menu. The 'Change to Off-line' -command is visibleonly when you are in on-line Mode.
The data of each symbol can be displayed in separate columns. Tohide/display data select or unselect items from the View/Columnsmenu.
To save the displayed symbol table and the symbol values click theSave button on the Toolbar or use the Save As... command fromFile menu. The Application Tool file extension is .dwa.
Symbol tables which are saved to a file using the Drives Windowformat (.dwa ) can be retrieved by using the Open command from theFile menu or clicking the Open button on the Application Toolbar.Select the file you want to retrieve, and a new application window isopened with the contents of the file displayed.
The symbol table in an active Application tool window can becompared to a symbol table in a saved file. First select the Comparecommand from the File menu. Drives Window then prompts theuser to choose the file which the parameters are to be comparedagainst. The results of the comparison are then displayed in aseparate result window. You can print the results by selecting thePrint... command from the File menu or clicking the Print button onthe Toolbar. The result is always saved to a file dwatdiff.log .
The display on an active window can be copied in text format to theclipboard by using the Copy command from the Edit menu.
The displayed symbol subset can be printed to the default printer byclicking the Print ( ) button or by using the Print... command fromthe File menu.
Off-lineMode
SelectingData/Columns to
be Viewed
Save a SymbolTable to a File
Read Symbolsfrom a File
Compare theSymbol Tables
Copy the SymbolSubset to the
Clipboard
Print the SymbolSubset

Chapter 12 - Application Tool
Drives Window User’s Manual 12 - 7
The About Target Device command gives you information on theselected target device. It lists:
• Version information of the application saved to the selected file.
• Version information of the current application of the selectedtarget device
• System software version
• Function block library version information
You find the About Target Device command from the Applicationmenu or from the pop-up menu displayed while clicking the rightmouse button.
Get InformationAbout the Target
Device

Chapter 12 - Application Tool
12 - 8 Drives Window User’s Manual
This page is intentionally left blank.
Drives Window User’s Manual A - 1
APPENDIX A- Version Control
Drives Window v1.2 does not support ACS600 with System Softwarev2.8 or earlier.
If you are using Drives Window v1.2 for ACS600 with SystemSoftware v3.0, you must note the following:
1. Local control from Drives Window is possible only if the ControlPanel is in Remote mode. Panel can still always get the control ofthe drive. The inactive local button of previous Drives Windowversions is removed.
2. Coast Stop is not available.
3. Application Tool is not available.
4. File Upload/Download is not available.
5. Actual direction is not shown.
6. Panel reference is not shown in the Drives Panel. Always stop thedrive before turning panel to Remote mode.
All features mentioned in this manual, if not otherwised stated, areavailable for ACC600, ACS600, ACF600, ACN600 and ACP600 withSystem Software v4.2 or corresponding version.
Previous Drives Window files are compatible with Drives Windowv1.2.
System Softwarev2.8
System Softwarev3.0
System Softwarev4.2
Previous DrivesWindow Files

APPENDIX A
A- 2 Drives Window User’s Manual
This page is intentionally left blank.

Drives Window User’s Manual B- 1
APPENDIX B- Drives Panels
Drives Panel for ACS600 Standard with System Software v3.0:
Drives Panel for ACS600 Freely Programmable with SystemSoftware v4.2, ACF600 Pump and Fan Drive with System Softwarev4.02 and ACS600 MultiDrive (ACN600) with System Software v4.2:
Drives Panel for ACP600 Motion Drive with System Software v1.0:
System Softwarev3.0
System Softwarev4.x
System Softwarev1.0 (ACP600)
Control
CoastStop
HomingTeach-In

APPENDIX B
B- 2 Drives Window User’s Manual
This page is intentionally left blank.

Drives Window User’s Manual C - 1
APPENDIX C - CDW.INI file
Drives Window v1.2 reads through, when started, the CDW.INI filewhich is during the Drives Window installation created in theWINDOWS directory. In the CDW.INI file there are two sectionshandling the Target identification
First, there is a section called [TargetDrivers] in which a TargetDriver DLL for each Target type is set. Names used must match thereal product names, i.e. if an ACS600 is renamed to be somethinglike GCC600 it must appear as an ACS600 in the [TargetDrivers]section. Each Target type must have its own line, like
ACS600=C:\ABBTOOLS\DRIWIN\DWACS600.DLL
In case a product is sold with a special name Drives Window mustbe made aware of the change before the Target can be identified.For this purpose there is a [TargetEquals] section in the CDW.INIfile. In this section specific names are identified with actual productnames. For example, previously mentioned GCC600 requires line
GCC600=ACS600
just under the [TargetEquals] heading.
As products following names are defined:
• ACS600 Standard or Freely Programmable
• ACN600 ACS600 MultiDrive Inverter
• ACF600 ACS600 Pump and Fan Drive
• ACP600 ACS600 Motion Drive
Of these names Drives Window uses only the first four (4) letters.Thus ACS601 and ACS602 would get the similar handling.
General
TargetIdentification
Special TargetNames
Product Names

APPENDIX C
C- 2 Drives Window User’s Manual
This page is intentionally left blank.

Drives Window User’s Manual D- 1
APPENDIX D - DDCS Communication
to see and change the communication channel settings
for automatic node numbering of the target devices on the channel
Logical channel number of the Communication Channel is shown onthe caption. Channels are numbered during initialization, startingfrom 0.
In the information group you can see the text which identifies thechannel hardware.
In the Options group you can see the DDCC chip settings; these arenot changeable.
DDCSCommunicationChannel Dialog
Use theCommunicationChannel Dialog
...CommunicationChannel Dialog
Caption
InformationGroup
Options Group
APPENDIX D
D- 2 Drives Window User’s Manual
In the Rate group you can see the baud rate used on the channel.
The speed may be set in steps 1/8, 1/4, 1/2, of the max speed, orthe max speed.
Currently the max speed is 8 MBPS, i.e. steps are 1, 2, 4, 8 MBPSrespectively. The default 1 MBPS is used.
Note : To change the actual communication speed, you have tochange the speed on each of the devices connected to the channel.Changing the Link Rate only from this dialog stops channeloperation.
In the Beam Intensity group you can see and change the opticaltransmitter beam intensity in 15 steps.
You may use the radiobuttons in the group “Default by cable length”to select intensity according to the length of the optical cableconnected to channel in PC.
Cable lengths on the dialog match lengths with plastic fibre:
• Short: length < 5m
• Medium: length 5 ... 10m
• Long: length 10 ... 15m
Note : Setting a too small Beam Intensity stops channel operation.
Two kinds of channel node configurations are supported:
1. All nodes in one Loop
2. A star built with NDBU-91 Branching Units on top of each otherchannels.
These two configurations cannot be mixed.
Check this box to perform an automatic node numbering for thechannel. Channel type will be searched, and numbering will proceedaccording to the detected hardware.
Link Rate Group
Beam IntensityGroup
Auto NodeNumberingCheckbox

APPENDIX D
Drives Window User’s Manual D- 3
Background and Preparations:
Node numbers of NDBU-91 Branching Units are set by DIP switcheson the boards. Numbers must be in descending order starting fromclosest one to PC. E.g. each NDBU-91 must have a number which issmaller than any other NDBU-91 higher in the hierarcy.
Max NDBU-91 node number set is 124, min 76. Each NDBU-91reserves two node numbers.
Node number in the area 76-127 is not allowed to be used for targetnodes. Auto Node Numbering will renumber target nodes to 2 ... 75,128 ... 254
The maximum count 25 of NDBU-91 units allow 24*8 + 9 = 201target nodes.
DDCS Communication will prompt you for confirmation to proceedand notify when done.
Nodes are renumbered to 2 ... 254
DDCS Communication will prompt you for confirmation to proceedand notify when done.
Note : After Auto Node Numbering, the count should always becompared to existing node count.
Note : Auto Node Numbering will take some time, depending on theconfiguration.
Note : Automatic node numbers are not permanent: number does notremain after power-down of the node.
ButtonsOK Use currently shown settings to configure channel.Cancel Configuring channel not performed, all changes
done on the dialog are cancelled.Get Defaults Get default settings.Load Load settings which were last stored by Save
button.Save Save currently shown settings into initialization file.
Auto NodeNumbering with
NDBU-91Branching Units
Auto NodeNumbering on
DDCS loop


Drives Window User’s Manual I- 1
INDEX I
A
about the target device, 12-7acs 600 data loggers, 9-5
open, 9-6sample interval, 9-6samples, 9-6save, 9-6scaling, 9-6triggering conditions, 9-5variables, 9-5
actual signals, 1-2amc table, 5-4application tool, 2-3
B
before you start, 1-1
C
change the parameter valuessignals and parameters tool, 8-4
clear the fault logger, 11-1clear the graph display
monitor tool, 7-5collapse the drive list, 5-2common commands, 5-4communication driver, 1-2; 2-1communication link, 1-2communication statistic, 3-2compare
application tool, 12-7signals and parameters tool, 8-8
confirmation, 6-2control
drives window, 6-2copy
application tool, 12-7data logger tool, 9-4event logger tool, 10-2fault logger tool, 11-2monitor tool, 7-5signals and parameters tool, 8-8
copy a parameter set from a drive to another,8-9
customization, 4-3confirmations, 4-3drive status, 4-4
customize the displaysignals and parameters tool, 8-9
D
data logger tool, 2-2ddcs link, 1-2default drive, 1-3define the mask, 12-2delete force values, 12-5display mode
data logger tool, 9-2monitor tool, 7-2
downloadapplication tool, 12-4
download an application, 12-5download values
signals and parameters tool, 8-7download values after opening a file
signals and parameters tool, 8-8drives panel, 2-2; 6-1
display and hide, 6-1drives window functions, 2-1

I - 2 Drives Window User’s Manual
E
event logger of the acs 600, 10-1event logger tool, 2-2expand the drive list, 5-2
F
faultview, 5-3
fault logger tool, 2-3file upload, 5-4find
signals and parameters tool, 8-8force value, 12-2
G
getting started, 3-1
H
help, 3-2
I
installing the drives window software, 3-1introduction to drives window manual, 1-1item value
monitor tool, 7-2
M
menubar, 4-2minimum and maximum values
monitor tool, 7-2monitor tool, 7-1monitoring tool, 2-2
N
name the drive, 5-4
O
on/off-line mode
application tool, 12-5signals and parameters tool, 8-2
on-line documentation, 3-2operationals commands, 6-3overview of drives window, 2-1
P
packed boolean, 7-2parameter, 1-3parameters
numerical, 8-4real, 8-4text, 8-5type of boolean, 8-5
printapplication tool, 12-7data logger tool, 9-4monitor tool, 7-5signals and parameters tool, 8-8
program structure, 2-1
R
read from a fileapplication tool, 12-7
read from a filedata logger tool, 9-4event logger tool, 10-2fault logger tool, 11-2monitor tool, 7-5signals and parameters tool, 8-8
reference, 1-3; 6-3refresh
fault logger tool, 11-2refresh the display
event logger tool, 10-1reload amc table, 5-4reset an active fault, 11-1reset the pointers of the data logger, 9-3running set-up, 3-1
S
saveapplication tool, 12-7data logger tool, 9-4event logger tool, 10-2

Drives Window User’s Manual I - 3
fault logger tool, 11-2monitor tool, 7-4signals and parameters tool, 8-7system configuration, 5-4
scalingdata logger tool, 9-2monitor tool, 7-2
select drives, 5-3select a parameter
signals and parameters tool, 8-3select items
data logger tool, 9-2monitor tool, 7-2
select subset of symbols, 12-2select the default drive, 5-3selecting a signal or a parameter subset
signals and parameters tool, 8-3selecting data/columns to be viewed, 12-6send common commands, 5-4set the sample time interval
monitor tool, 7-3set the time window
monitor tool, 7-3set triggering conditions
monitor tool, 7-3settings
data logger tool, 9-2signals and parameters tool, 2-2; 8-1start and stop the data logger, 9-3start and stop the monitoring display, 7-2start another tool, 5-3starting
application tool, 12-1data logger tool, 9-1event logger tool, 10-1fault logger tool, 11-1monitor tool, 7-1signals and parameters tool, 8-1
starting the program, 3-2status icon
system configuration display, 5-2status of the data logger, 9-2status text
system configuration display, 5-2statusbar, 4-2step responses, 6-4symbol table, 1-3system configuration, 5-1
load a file, 5-3system configuration display, 2-2; 5-1system requirements, 3-1
T
target device, 1-3target driver, 1-3; 2-1titlebar, 4-2toolbar, 4-2tree line
system configuration display, 5-1
U
uninstall, 3-2update the status display, 5-2upload and download symbol table, 12-4upload the values in the data logger, 9-3upload values
application tool, 12-4signals and parameters tool, 8-7
use menu commands, 4-1user interface, 2-1; 4-1using the keyboard, 4-3
V
version checking, 4-4view faults and warnings, 11-2view faults and warnings messages, 5-3view status information, 5-2
W
warningview, 5-3
working with multiple windows, 4-3
Z
zoomdata logger tool, 9-3monitor tool, 7-4


![Read the words : [w] wall washbasin wardrobe window [ei] table bookcase washbasin painting](https://img.dokumen.tips/doc/110x75/56649f4f5503460f94c71339/read-the-words-w-wall-washbasin-wardrobe-window-ei-table-bookcase-washbasin.jpg)

