Embed Size (px)
Citation preview

476 Emir. J. Food Agric ● Vol 29 ● Issue 6 ● 2017
Drip fertigation regime for potato on sandy soilZhiwen Feng1,2, Shuqin Wan1, Yaohu Kang1,3*, Shiping Liu1
1Key Laboratory of Water Cycle and Related Land Surface Processes, Institute of Geographic Science and Natural Resources Research, Chinese Academy of Sciences, Beijing 100101, China, 2University of Chinese Academy of Sciences, Beijing 100049, China, 3College of Resources and Environment, University of Chinese Academy of Sciences, Beijing 100190, China
INTRODUCTION
Potato (Solanum tuberosum L.) rates fourth among the world’s agricultural products in production volume, after wheat, rice and maize (Fabeiro et al., 2001). In China, the potato cultivation area was 5.65 million ha in 2014, accounts for 29% of world production (FAO, 2016). Of the cultivation area, 60%–70% is rain-fed and the rest is irrigated (Zhu, 2013), which accounts for over 50% of the total production in China. In the past 10 years, as center-pivot irrigation systems (LEPA) were introduced in China, and potatoes are intensively cultivated in large areas of desert soils in arid and semi-arid regions where the climate is suitable, such as Ulanqab in Inner Mongolia. However, due to receding groundwater levels and limited water resources, the Chinese Government recently provided funding to encourage and accelerate the development of drip irrigation in these regions to save water resources.
In these newly developed areas of cultivation in the desert, the soil type is mainly sandy, characterized by little capillary pores, low water- and nutrient-holding capacities, and high infiltration rates. These soils are vulnerable to leaching of water and soluble nutrients with heavy rain events or excessive irrigation (Selim et al., 2009; Zvomuya and Rosen, 2001). Therefore, careful fertilizer and water management is essential so as to achieve optimal potato productivity and quality. Due to lack of appropriate water and fertilizer management, potato yields with drip irrigation in these regions of sandy soils are even lower than with LEPA, and consequently research on drip fertigation regimes is urgently needed.
Drip irrigation scheduling for potato is critical, because the potato root system is relatively shallow with most roots concentrated in the wetted soil volume near emitters or along each lateral line (Wang et al., 2006). Excessive
Emirates Journal of Food and Agriculture. 2017. 29(6): 476-484doi: 10.9755/ejfa.2017-02-275http://www.ejfa.me/
R E G U L A R A R T I C L E
To establish the optimum fertilizer rate and propose an appropriate drip fertigation regime for potato (Solanum tuberosum L.) on sandy soil, a two-year field experiment comparing different fertigation levels on potato yield, irrigation water productivity (IWP) and partial fertilizer productivity (PFP) was carried out during 2012–2013. The treatments included five fertigation levels: 10%, 30%, 50%, 70% and 90% of the recommended fertilizer dose of 420:105:495 of N: P:K in kg ha–1 year–1 in 2012; and 10%, 35%, 60%, 85% and 110% of the recommended dose of 390:150:465 of N: P:K in kg ha–1 year–1 in 2013. The recommended fertilizer dose was estimated based on the method of nutrient balance for a target yield of 45.0 Mg ha–1. The soil matric potential at 20 cm depth beneath the emitters was controlled above –25 kPa for drip fertigation. Results showed the highest tuber yield was 38.0 Mg ha–1 for 90% NPK in 2012 and 45.8 Mg ha–1 for 60% NPK in 2013, which was significantly higher than that for 10% NPK. The highest IWP was for 70% NPK in 2012 and 60% NPK in 2013. The highest PFP values were 255.5 kg kg−1 in 2012 and 316.4 kg kg−1 in 2013, recorded in the 10% NPK plots and were significantly higher than for other fertigation treatments. High yield levels of potatoes and both high IWP and PFP could be reached by drip fertigation with 72% of the recommended fertilization dose. Compared with the recommended fertilizer dose, the yield and IWP of 72% NPK increased by 5.9% and 4.7%, respectively. It was possible to make average savings in one season alone of 136, 36 and 152 kg ha–1 N, P2O5 and K2O, respectively. In conclusion, drip fertigation with 72% NPK should be considered optimum for potato production on sandy soils. Each fertilizer amount based on irrigation interval was applied with irrigation quota at 5–6 mm when soil matric potential at soil depths of 20 cm immediately under drip emitters reached –25 kPa. Furthermore, drip fertigation was triggered when 10 consecutive days were without fertigation or rainfall in 24 h exceeded 10 mm.
Keywords: Drip fertigation; Fertilization rate; Irrigation water productivity; Potato; Yield
A B S T R A C T
*Corresponding author: Yaohu Kang, Key Laboratory of Water Cycle and Related Land Surface Processes, Institute of Geographic Science and Natural Resources Research, Chinese Academy of Sciences, 11A Datun Road, Anwai, Beijing 100101, China. E-mail: [email protected]
Received: 04 February 2016; Revised: 29 April 2017; Accepted: 30 April 2017; Published Online: 10 May 2017

Feng, et al.: Potato fertigation
Emir. J. Food Agric ● Vol 29 ● Issue 6 ● 2017 477
irrigation will reduce potato yield and quality, while inadequate irrigation will cause water stress and reduce production (Yuan et al., 2003). An irrigation schedule method for potato by measuring soil matric potential (SMP) has been widely adopted (Phene and Sanders, 1976; Shae et al., 1999; Waddell et al., 1999; Wang et al., 2011). Epstein and Grant (1973) found that potato plants exhibited water stress when SMP at 20–25 cm below the surface dropped below –25 kPa on a Caribou silt loam. Kang et al. (2004) and Wang et al. (2007) found that the highest potato yield and water use efficiency were achieved for SMP of –25 kPa at 20 cm depth immediately under drip emitters in a silt loam in the North China Plain.
Based on knowledge of plant nutrition and agricultural cultivation, the NPK recommended dose for potato under flood, furrow and sprinkle irrigation systems has been conventionally determined by scientists under different soil and climatic conditions. However, this method is very time-consuming and inefficient to determine drip fertigation scheduling for potato, because many multi-treatment trials are needed for the different nutrient application levels: Nitrogen (N), phosphorus (P) and potassium (K) (Chawla and Narda, 2001; Darwish et al., 2006; Janat, 2007; Kaur et al., 2005; Kumar et al., 2007; Mohammad et al., 1999; Papadopoulos, 1988; Singh et al., 2004). Due to variations in water movement, spatial and temporal distribution within the soil and fertilizer application method, nutrient transport and distribution in the wetted soil volume under drip irrigation differ from those under conventional irrigation (flood, furrow and sprinkle) (Gasser et al., 2002). However, the fertilization requirement for potato is mainly determined by its biological characteristics. Therefore, a field experiment using drip irrigation was conducted to obtain an optimal proportional coefficient of recommended fertilizer rate and then simply and efficiently determine drip fertigation scheduling for potato.
In recent years, this method has been proposed to determine drip fertigation schedules for maize (Ibrahim et al., 2016), cotton (Jayakumar et al., 2015), arecanut (Bhat and Sujatha, 2009), guava (Ramniwas et al., 2013), date palm (Al-Qurashi et al., 2016), strawberry (Kachwaya and Chandel, 2015), capsicum (Suman et al., 2016) and tomato (Rajan et al., 2014). Liu et al. (2014) evaluated the effects of five reduced doses of fertilizer with fertigation (10%–50% of the traditional fertilizer dose under rain-fed conditions) on N and P losses through runoff and leachate water on tea yield on silt loam soil. They found that fertigation with 33% of the traditional fertilizer dose should be considered for tea production, as it reduced N and P losses to the environment and increased yield by 1.4% while using 67% less fertilizer. Bhat et al. (2007) evaluated the effect
of four fertigation levels (25%, 50%, 75% and 100% of the recommended fertilizer dose under flood irrigation conditions) on productivity and resource use efficiency of arecanut in sandy clay loam and showed that kernel yield was significantly higher for 75% NPK fertigation than the other levels, and ensured higher efficiencies of water and nutrient use.
In this study, drip irrigation was scheduled based on SMP at soil depths of 20 cm immediately under drip emitters. Fertigation schedule was based on proportional coefficients and nutrient-balanced fertilizer recommendation. The objectives of this research were to (1) determine the effect of different fertigation levels on tuber yield and the productivity of fertilizer and irrigation water under drip irrigation, and get an optimal proportional coefficient for potatoes; (2) demonstrate the effectiveness of scheduling drip irrigation with SMP at soil depths of 20 cm immediately under drip emitters; and (3) determine optimal drip fertigation scheduling for sandy soil conditions in arid and semi-arid regions in the north of China.
MATERIALS AND METHODS
Experimental site and natural conditionsField experiments were conducted during 2012–2013 at Bainijing (110°28′E, 40°18′N, 1006 m above sea level), located in Inner Mongolia, China. The region has a typical temperate continental monsoon climate with annual precipitation of 306.8 mm, mainly concentrated during July–September. The average annual evaporation and temperature are about 2100 mm and 6.1°C–7.1°C, respectively. In order to avoid problems of continuous cropping, the experiment site was changed between the two years, with the two sites about 1.5 km apart. The dominant soils in this region are sand and loamy sand based on the U.S. Department of Agriculture system of soil texture classification in 2012 and 2013, respectively. Field soil water capacity (gravimetric content) and soil bulk density were 15.6% and 1.52 g cm–3 in the 0–40 cm soil layer in 2013, respectively. The soil texture, available nutrient content, ECe (electrical conductivity of saturated soil extract) and pH for the 0–120 cm soil layer during 2012–2013 are shown in Table 1. The groundwater table was approximately 15 m below the surface and the EC of irrigation water was < 0.6 dS m–1.
Experimental designThe field experiment consisted of five drip fertigation levels in a completely randomized block design with three replicates. In 2012, five treatments were 10%, 30%, 50%, 70% and 90% of the recommended fertilizer dose of 420:105:495 of N: P:K in kg ha–1 year–1. According to

Feng, et al.: Potato fertigation
478 Emir. J. Food Agric ● Vol 29 ● Issue 6 ● 2017
potato yield and plant growth in 2012, the fertilizer dose was adjusted to 10%, 35%, 60%, 85% and 110% of the recommended fertilizer dose of 390:150:465 of N: P:K in kg ha–1 year–1 in 2013. The recommended fertilizer dose was estimated using the nutrient balance method proposed by Truog (1960), which is generally used in China, and is also recommended by the United Nations Food and Agriculture Organization (FAO). The recommended fertilizer dose was calculated using equation (1).
W =W -WRfy s
f
(1)
where Wf is the recommended fertilizer dose (kg ha–1); Wy is the whole plant uptake rate of N, P and K for the objective yield (kg ha–1); Ws is the amount of available nutrient supply from initial soil (kg ha–1); Rf is fertilizer use efficiency (%) based on field experiments, with Rf of N, P and K being 45%, 35% and 50%, respectively. Wy was calculated according to equation (2).
W =Y×W100y
100 (2)
where Y is the objective yield (kg ha–1), which was set as 45 000 kg ha–1 depending on the average yield of the local potato production enterprises which apply fertilizer with furrow fertilization and fertigation under LEPA irrigation conditions. W100 is the uptake rate of N, P and K needed to produce tuber yield of 100 kg ha–1, and 0.5 kg N, 0.2 kg P2O5 and 0.8 kg K2O were measured for producing 100 kg ha–1 of tubers under local soil and climate condition. Ws was estimated according to equation (3).
W W 2.25 Rs t s= × × (3)
where Wt is the measured value of soil available nutrients (mg kg–1) (Table 1); 2.25 is a nutrient conversion factor; Wt × 2.25 (kg ha–1) is the amount of soil available nutrients in 0–20 cm soil layer; Rs is the soil nutrient correlation coefficient based on field experiments, with Rs of N, P and K being 0.7, 0.5 and 0.85, respectively. The actual amount of fertilizer was adjusted based on nutrient content (%) in fertilizer.
The fertilizers used were conventional compound fertilizer (16% N, 14% P and 15% K in 2012 and 18% N, 17% P and 10% K in 2013), urea (46% N) and potassium nitrate (13.9% N and 46.5% K). Fertilizers were applied in two ways: Furrow fertilization and drip fertigation. The conventional compound fertilizer was furrow-applied 10 cm from the potato row at a depth of 20 cm for all treatments as basal fertilizer respectively on 14 May 2012 and 4 May 2013, and the amount of fertilizer for each treatment was proportional (10%–110%) to the recommended P fertilizer dose (105 and 150 kg ha–1 P in 2012 and 2013, respectively). Urea and potassium nitrate were applied by mixing with irrigation water as topdressing fertilizer, and was added to the fertilizer tank from 20 June 2012 (38 d after planting, i.e. 38 DAP) and 22 June 2013 (50 DAP) to the beginning of September (10 d before harvesting), respectively. Urea and potassium nitrate were simultaneously applied in the vegetative growth and tuber set stage (about 40 d), potassium nitrate was applied from vegetative growth to tuber bulking stage (about 80 d). The fertigation and irrigation were stopped at 20 and 10 d before harvesting, respectively. Every day the amount of fertilizer was fixed,
Table 1: Basic properties and available nutrient contents of initial soil profileYears Soil
layers (cm)
Soil mechanical composition (%) Soil texture*
Available nitrogen (mg kg–1)
Olsen‑phosphorus(mg kg–1)
Available potassium (mg kg–1)
ECe pH<0.002 mm 0.002–0.05 mm 0.05–2 mm
2012 0–10 0.00 0.00 100.00 Sand 58.24 7.83 103.71 1.16 8.1610–20 0.00 2.97 97.03 Sand 40.96 6.86 92.67 0.90 8.1220–30 0.02 4.33 95.65 Sand 28.13 2.37 61.49 0.64 8.2230–40 0.88 8.94 90.18 Sand 37.86 2.26 51.06 0.87 8.1540–60 1.34 12.67 85.99 Sand 30.34 2.52 67.99 0.69 8.1960–80 0.66 8.05 91.29 Sand 29.04 1.91 59.02 0.61 8.20
80–100 0.00 0.00 100.00 Sand 15.65 1.44 48.42 0.54 8.26100–120 1.44 20.83 77.73 Loamy sand 20.75 1.25 56.10 0.62 8.25
2013 0–10 0.14 15.72 84.14 Loamy sand 20.00 6.37 86.77 0.22 8.5310–20 0.13 16.19 83.68 Loamy sand 23.17 4.28 78.73 0.41 8.7420–30 0.17 21.64 78.20 Loamy sand 23.29 2.57 53.57 0.25 8.8530–40 0.22 23.96 75.83 Loamy sand 16.88 0.62 46.35 0.30 8.7840–60 0.19 22.66 77.15 Loamy sand 17.24 0.45 48.55 0.29 8.8260–80 0.20 25.83 73.97 Loamy sand 14.13 0.50 56.37 0.18 8.93
80–100 0.21 23.78 76.00 Loamy sand 13.64 0.38 38.24 0.27 8.81100–120 0.23 27.17 72.60 Loamy sand 15.97 0.37 46.16 0.13 8.90
ECe=Electrical Conductivity of Saturated Soil Extract; *According to U.S. Department of Agriculture system of soil texture classification

Feng, et al.: Potato fertigation
Emir. J. Food Agric ● Vol 29 ● Issue 6 ● 2017 479
the total amount of fertilizer for each irrigation depended on irrigation interval. The details regarding designed fertilization in potato fields are shown in Table 2.
Irrigation and agronomic practicesEach plot was 5.5 m long by 5.4 m wide, and contained five raised beds. The spacing and length of raised beds were 1.1 and 5.4 m, respectively. On the raised beds, the shoulder width and height of the ridge was 0.5 and 0.2 m, respectively. Each ridge had two lines of potato plants. Seed pieces of potato were planted interlacedly in the raised beds at intervals of 0.3 m and depth of 0.1 m.
Each fertigation treatment was an independent unit with its own drip irrigation system, which consisted of one ball valve, one water meter, one pressure gauge, one sluice valve, one flow meter, one screen filter and one fertilizer tank with differential pressure. The water meter was used to measure the irrigation water volume. The valves and pressure gauge were used to control and adjust the operating pressure. The drip tubes with 0.3 m dripper spacing, and a flow rate of 1.38 L h–1 at 0.1 MPa working pressure were placed on the surface in the center of raised beds.
In 2012, the potatoes were sown on 13 May. Approximately 45 mm of water was applied after sowing to all plots. Seedling emergence occurred during 4–17 June. Fertigation was applied according to SMP after full emergence. Irrigation (fertigation) was applied when the SMP at 20 cm depth reached –25 kPa, and this SMP threshold was recommended by Kang et al. (2004) and Wang et al. (2007) in the scheduling of drip-irrigated potato. The amount for each irrigation event was about 6 mm. Irrigation was ceased on 7 September, and potatoes were harvested on 19 September.
In 2013, potatoes were sown on 3 May. Approximately 42 mm of water was applied after sowing to all plots. Seedling emergence occurred from 26 May to 14 June. Seed potatoes were blown out of the sandy soil with
five strong wind events during the period of 28 May to 4 June. The raised beds were then restored by hilling and all treatments were irrigated three times with respective amounts of 9.3, 6.7 and 5.3 mm to ensure full emergence. The fertigation was triggered according to SMP after full emergence. Irrigation (fertigation) was applied when the SMP at 20 cm depth reached –25 kPa. The amount of applied water used for each irrigation event was about 5.5 mm, and irrigation was ceased on 3 September. In the key growing period, fertilizer was applied to avoid nutrient deficiency when 10 consecutive days were without fertigation. Furthermore, drip fertigation was triggered when observed rainfall in 24 h was > 10 mm. In these cases, the amounts of water applied for each irrigation event was about 2.5 mm. Potatoes were harvested on 16 September.
Observations and calculationsMeteorological data were collected from an automatic weather station installed in the experimental field. A tensiometer was installed at soil depth of 20 cm directly under a drip emitter located in the center of each treatment to monitor the SMP. The tensiometers were observed twice daily (08:00 and 15:00 h) and irrigation was applied when SMP at 20 cm depth reached –25 kPa.
Potatoes in the middle one row of each plot were harvested for yield analysis. Irrigation water productivity (IWP) was defined as the final tuber yield per unit of applied water to the crop and expressed as kg ha−1 mm−1 (Van Cleemput, 2000). Partial factor productivity (PFP) was defined as total tuber yield per amount of the three fertilizers applied to the crop and expressed as kg kg−1 (Cassman et al., 1996).
Statistical analysisThe treatments were compared using single-factor analysis of variance (ANOVA) by SPSS 13.0 (SPSS Inc., Chicago, IL, USA). Means were compared using Duncan’s multiple range test (P < 0.05).
Table 2: Fertilization rates of different experimental treatmentsYears Treatments Basal fertilization rates*
(N–P–K, kg ha–1)Topdressing rates**
(N–P–K, kg ha–1)Total rates
(N–P–K, kg ha–1)2012 10% NPK 12–11–11 26–0–39 38–11–51
30% NPK 36–32–34 90–0–121 126–32–15550% NPK 60–53–57 145–0–242 206–53–29870% NPK 85–74–79 171–0–248 255–74–32790% NPK 109–95–102 276–0–368 384–95–470
2013 10% NPK 27–15–10 12–0–36 39–15–4635% NPK 95–53–37 46–0–139 140–53–17560% NPK 162–90–63 79–0–238 241–90–30185% NPK 230–128–89 112–0–338 341–128–427
110% NPK 297–165–116 143–0–432 440–165–548*Basal fertilization for all treatments was furrow-applied in early May; **Topdressing for all treatments was applied with drip fertigation from mid-June to mid-September

Feng, et al.: Potato fertigation
480 Emir. J. Food Agric ● Vol 29 ● Issue 6 ● 2017
RESULTS AND DISCUSSION
Rainfall and temperatureRainfall in the growth periods during 2012–2013 is shown in Fig. 1. Rainfall was mainly distributed in tuber set and bulking stages during June–August, which was favorable to potato growth. Total rainfall was 382 and 316 mm in 2012 and 2013, respectively, more than the local average of 265 mm. The total number of rainfall events was 45 and 38 in the two years, respectively, among which 36 and 28 were light (0–10 mm), and 6 and 3 were heavy (> 25 mm), respectively. The quantities of rainfall during heavy rain were 202 and 134 mm in 2012 and 2013, respectively, making nutrients leaching loss more probable, especially in this sandy soil (Gascho and Hook, 1991).
The monthly mean, minimum and maximum temperatures during the trials are shown in Table 3. The mean temperature was 0.6 and 1.4°C higher in the two years than for the same period during 1957–2011, respectively. The optimum daily mean temperature in the whole growth period of potatoes is 16°C–28°C (Benoit et al., 1983). Both years were generally suited to growth of potatoes in terms of the average temperature in all growth stages (Table 3). The average maximum temperature in 2012 was closer to that of 1957–2011, while average maximum temperature in 2013 was 2.4°C higher than that of 1957–2011. Note that the temperature exceeded 30°C for up to 6 h during 12:30–18:00 for 8–15 August 2013. In these conditions, tubers may grow slowly, or even stop, which may reduce potato yields (Manrique, 1992).
SMP distribution for different treatmentsThe SMP was recorded at 20 cm depth immediately under the drip emitters at 08:00 (a) and 15:00 (b) for the different fertigation treatments in 2012 and 2013 is shown in Figs. 2 and 3, respectively. The SMP at soil depths of 20 cm for each drip fertigation treatment were maintained above –25 kPa for most of the growing season in both years except for short periods during the tuber set and bulking stages, when potato grew vigorously and consumed a great amount of water (Kang et al., 2004). Therefore, it is reasonable to assume that potatoes grew under favorable
soil water conditions. The changes of SMP in 2013 differed from those in 2012, possibly because of differences in rain distribution between the two seasons.
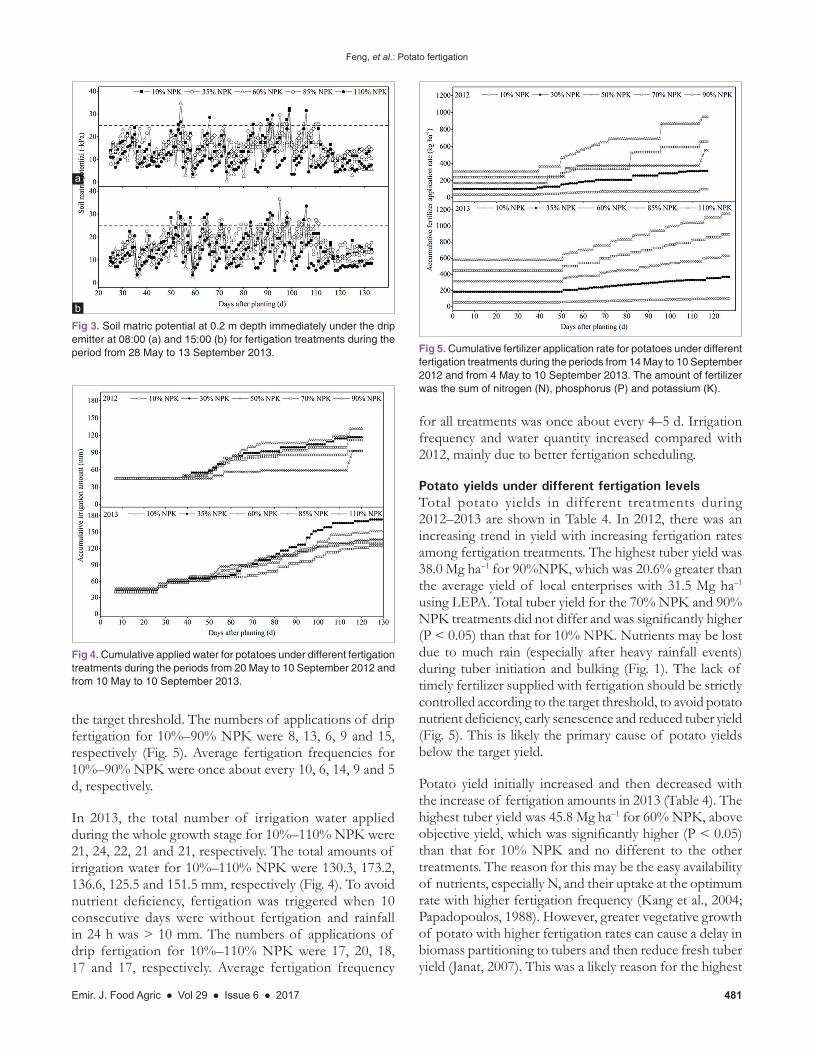
Irrigation and fertilization managementIn 2012, seasonal total irrigation times for 10%–90%NPK were 10, 15, 7, 11 and 18, respectively. The total irrigation amounts during all growth stages for the five treatments were 92.6, 116.5, 93.0, 111.6 and 131.1 mm, respectively (Fig. 4). Fertigation was strictly controlled according to
Table 3: Mean, maximum and minimum temperatures during the experimental period for 2012, 2013 and 1957–2011Air temperature (°C) Year Month
May June July August SeptemberMean 2012 16.6 19.1 22.0 20.0 12.9
2013 16.1 21.2 21.9 21.0 14.71957–2011 14.5 19.3 21.1 19.1 13.8
Maximum 2012 22.3 24.8 27.1 24.9 17.82013 22.1 27.9 28.3 27.6 23.2
1957–2011 20.9 25.3 26.9 24.6 19.5Minimum 2012 11.3 14.5 17.8 16.0 9.0
2013 10.7 14.6 16.4 15.0 7.51957-2011 8.6 13.4 16.1 14.5 9.0
Fig 1. Rainfall and cumulative rainfall during the experimental period in 2012–2013.
Fig 2. Soil matric potential at 0.2 m depth immediately under the drip emitter at 08:00 (a) and 15:00 (b) for fertigation treatments during the period from 5 June to 9 September 2012.
b
a
Feng, et al.: Potato fertigation
Emir. J. Food Agric ● Vol 29 ● Issue 6 ● 2017 481
the target threshold. The numbers of applications of drip fertigation for 10%–90% NPK were 8, 13, 6, 9 and 15, respectively (Fig. 5). Average fertigation frequencies for 10%–90% NPK were once about every 10, 6, 14, 9 and 5 d, respectively.
In 2013, the total number of irrigation water applied during the whole growth stage for 10%–110% NPK were 21, 24, 22, 21 and 21, respectively. The total amounts of irrigation water for 10%–110% NPK were 130.3, 173.2, 136.6, 125.5 and 151.5 mm, respectively (Fig. 4). To avoid nutrient deficiency, fertigation was triggered when 10 consecutive days were without fertigation and rainfall in 24 h was > 10 mm. The numbers of applications of drip fertigation for 10%–110% NPK were 17, 20, 18, 17 and 17, respectively. Average fertigation frequency
for all treatments was once about every 4–5 d. Irrigation frequency and water quantity increased compared with 2012, mainly due to better fertigation scheduling.
Potato yields under different fertigation levelsTotal potato yields in different treatments during 2012–2013 are shown in Table 4. In 2012, there was an increasing trend in yield with increasing fertigation rates among fertigation treatments. The highest tuber yield was 38.0 Mg ha–1 for 90%NPK, which was 20.6% greater than the average yield of local enterprises with 31.5 Mg ha–1 using LEPA. Total tuber yield for the 70% NPK and 90% NPK treatments did not differ and was significantly higher (P < 0.05) than that for 10% NPK. Nutrients may be lost due to much rain (especially after heavy rainfall events) during tuber initiation and bulking (Fig. 1). The lack of timely fertilizer supplied with fertigation should be strictly controlled according to the target threshold, to avoid potato nutrient deficiency, early senescence and reduced tuber yield (Fig. 5). This is likely the primary cause of potato yields below the target yield.
Potato yield initially increased and then decreased with the increase of fertigation amounts in 2013 (Table 4). The highest tuber yield was 45.8 Mg ha–1 for 60% NPK, above objective yield, which was significantly higher (P < 0.05) than that for 10% NPK and no different to the other treatments. The reason for this may be the easy availability of nutrients, especially N, and their uptake at the optimum rate with higher fertigation frequency (Kang et al., 2004; Papadopoulos, 1988). However, greater vegetative growth of potato with higher fertigation rates can cause a delay in biomass partitioning to tubers and then reduce fresh tuber yield (Janat, 2007). This was a likely reason for the highest
Fig 4. Cumulative applied water for potatoes under different fertigation treatments during the periods from 20 May to 10 September 2012 and from 10 May to 10 September 2013.
Fig 5. Cumulative fertilizer application rate for potatoes under different fertigation treatments during the periods from 14 May to 10 September 2012 and from 4 May to 10 September 2013. The amount of fertilizer was the sum of nitrogen (N), phosphorus (P) and potassium (K).
Fig 3. Soil matric potential at 0.2 m depth immediately under the drip emitter at 08:00 (a) and 15:00 (b) for fertigation treatments during the period from 28 May to 13 September 2013.
b
a

Feng, et al.: Potato fertigation
482 Emir. J. Food Agric ● Vol 29 ● Issue 6 ● 2017
tuber yield occurring for 60% NPK (Table 4). The average yield of local enterprises was 33.0 Mg ha–1 in 2013, 28.0% lower than that for 60% NPK. Note that potato plants suffered sustained high temperatures in August 2013, which likely reduced potato yield. In the absence of these high temperatures, yield should be improved.
The average yield in 2013 was 21.4% greater than that in 2012. Many heavy rainfall events may have led to greater vulnerability to nutrient leaching losses and so to decreased fertilizer use efficiency in 2012 (Table 1). In 2013, better fertigation scheduling was used to improve the nutrient uptake and growth of potato (Phene and Sanders, 1976) and promote the formation and translocation of assimilates from source to sink (Jayakumar et al., 2015). These are two possible reasons for yield differences in the two seasons.
The relative yield is defined as the ratio between the yield of fertigation treatment and yield of 10%NPK treatment; and the relationship between relative yield and relative fertilizer rate is shown in Fig. 6. The relative yields increased when the relative fertilizer rate was within 10%–72%; and for fertilization rates above 72%, the relative yield declined as the fertilizer rate increased. This relationship is similar to that for most potato varieties (Love et al., 2005; Porter and Sisson, 1991) and can be expressed as: y = 0.8902 + 1.4011x – 0.9751x2 (R2 = 0.7181). At the turning point of 72%, fertigation with 28% less fertilizer increased the yield by 5.9%.
IWP and PFP for different fertigation levelsIWP and PFP in different treatments during 2012–2013 are shown in Table 4. The highest IWP values were for 70% NPK plots in 2012 and 60% NPK in 2013. The effect of fertigation level on IWP was not significant (P > 0.05) in all plots in 2012. However, IWP for 60% NPK was significantly higher (P < 0.05) than for 10%
NPK and 35% NPK treatments in 2013. The relative IWP initially increased and then declined as relative fertilizer rate increased (Fig. 7). By contrast, the medium level of fertigation improved the IWP values compared with plots of high and low fertilization levels, which was consistent with results of Ierna et al. (2011). Adequate and timely availability of water and nutrients and their synergistic interaction might have promoted the plant growth, increased yield and ultimately resulted in greater IWP (Jayakumar et al., 2015).
In both years, the fertilizer productivity expressed by PFP significantly decreased as the fertigation level increased from 10% NPK to 110% NPK, which could be described by a power function with PFP decreasing slowly after fertigation level increased to about 50% of the recommended rate (Fig. 7). Similar observations for potato were made by Darwish et al. (2006) with drip fertigation and Ierna et al. (2011) under drip irrigation and split application fertilizer.
Table 4: Potato yield, irrigation water productivity and partial factor productivity of different fertigation levels from 2012 to 2013Years Treatments Potato yield
(Mg ha–1)IWP
(kg ha–1 mm–1)PFP
(kg kg–1)2012 10% NPK 25.3b* 273.2a 255.5a
30% NPK 32.6ab 279.7a 104.2b50% NPK 31.4ab 301.9a 56.3c70% NPK 35.0a 314.1a 53.4c90% NPK 38.0a 289.8a 40.0c
2013 10% NPK 31.7b 243.0b 316.4a35% NPK 41.5ab 239.4b 112.6b60% NPK 45.8a 335.6a 72.5c85% NPK 38.3ab 305.5ab 42.8cd
110% NPK 39.7ab 262.0ab 34.4dIWP=Irrigation water productivity; PFP=Partial factor productivity; *The values followed the same letters within each column in different years are not significantly different (P≤0.05)
Fig 6. Relationship between relative tuber yield and drip fertigation levels. The relative tuber yield is the ratio between yield of drip fertigation treatment and yield of 10% NPK treatment.
Fig 7. Relationships between relative partial factor productivity and relative irrigation water productivity with drip fertigation levels. The relative partial factor productivity or relative irrigation water productivity are the ratio between partial factor productivity or irrigation water productivity of drip fertigation treatment and that of 10% NPK treatment, respectively.

Feng, et al.: Potato fertigation
Emir. J. Food Agric ● Vol 29 ● Issue 6 ● 2017 483
The highest PFP values, 255.5 and 316.4 kg kg−1 in 2012 and 2013, respectively, were recorded in the 10% NPK plots and were significantly higher (P < 0.05) than for other fertigation treatments. The reason was that experimental soil had medium soil fertility (Table 1) and so better responses at lower fertilizer application rates were expected.
Analysis of the potato yield, IWP and PFP in the 2 years showed that fertilizer applied at 72% NPK under drip fertigation conditions would obtain the optimal yield and utilization efficiency of water and nutrients. These results are in accordance with the findings of Kachwaya and Chandel (2015), who obtained optimum fertilizer use efficiency and saved 25% of fertilizers without any adverse effect on growth, yield and fruit quality when strawberry was fertigated with 3/4 of the recommended dose of NPK. Similarly, Al-Qurashi et al. (2016) reported maximizing yield, quality and fertilizer use efficiency for date palm with applying 2/3 of the recommended dose of NPK fertilizers under drip fertigation. This may be the result of a higher nutrient availability due to higher uptake and lower losses.
Average yields of local potato enterprises using LEPA were 31.5 and 33.0 Mg ha–1, reduced by 10.7% and 25.2% relative to yield of 72% NPK for 2012 and 2013, respectively. The 72% NPK applied with drip fertigation would save 136, 36 and 152 kg ha−1 for N, P2O5 and K2O on average every year compared with the recommended fertilizer dose. Similarly, Ierna et al. (2011) showed that 200, 50 and 300 kg ha−1 for N, P2O5 and K2O were saved using the medium level of fertilization compared to high levels, respectively. This could be attributed to accurate adjustment of water and nutrient supplies to meet crop requirements (Narda and Chawla, 2002; Neeraja et al., 1999). Because the transport and migration of nutrients is mainly driven by the water cycle, which is closely related to precipitation, soil texture and moisture, therefore, this proportion coefficient can be used to guide the drip fertigation for potato on sandy soil.
This study clearly showed that potato farmers can accrue benefits like higher yields and resource use efficiencies (water and fertilizer) with adoption of drip fertigation with 72% NPK, which would reduce fertilizer leaching by 28%. Actual nutrient leaching losses depend on nutrient source and application rates, crop removal capacity and water displacement below the active root zone (Zotarelli et al., 2007). Strategies to reduce nutrient leaching have been developed to increase fertilizer use efficiency, reduce groundwater pollution and increase tuber yield, such as use of slow release fertilizer, nitrification inhibitors and soil organic matter (Alva et al., 2009; Bero et al., 2014; Shrestha et al., 2010; Wilson et al., 2009; Zvomuya and Rosen, 2001). Drip fertigation combined with these strategies will benefit sustainable potato production on sandy soils.
CONCLUSIONS
A two-year experiment demonstrated that high yield levels of potatoes and both high IWP and PFP were obtained by drip fertigation with 72% of the recommended fertilizer dose. Drip fertigation was applied with irrigation quota at 5–6 mm when SMP at soil depths of 20 cm immediately under drip emitters reached –25 kPa. Every day the amount of fertilizer was fixed, the total amount of fertilizer for each irrigation depended on irrigation interval. Furthermore, drip fertigation was triggered when 10 consecutive days were without fertigation or rainfall in 24 h was > 10 mm. Finally, drip fertigation with 72% of the recommended fertilization dose could be an effective method of maintaining yield and should be considered for potato production on sandy soils.
ACKNOWLEDGEMENTS
This study was supported by the National Key Technology R&D Program of China (Grant Nos. 2012BAD06B01, 2012BAD08B02 and 2013BAD05B08).
Author contributionsZhiwen Feng, Yaohu Kang, and Shuqin Wan conceived and designed the experiments; Zhiwen Feng and Shiping Liu performed the experiments and provided field data; Zhiwen Feng analyzed the data under the guidance of Yaohu Kang; Zhiwen Feng, Yaohu Kang and Shuqin Wan were involved in preparation of the manuscript.
REFERENCES
Al-Qurashi, A. D., M. A. Awad, and S. M. Ismail. 2016. Yield, fruit quality and nutrient uptake of ‘Nabbut-Ahmar’ date palm grown in sandy loam soil as affected by NPK fertigation. J. Plant Nutr. 39: 268-278.
Alva, A. K., H. P. Collins and R. A. Boydston. 2009. Nitrogen management for irrigated potato production under conventional and reduced tillage. Soil Sci. Soc. Am. J. 73: 1496.
Benoit, G., C. Stanley, W. Grant and D. Torrey. 1983. Potato top growth as influenced by temperatures. Am. Potato J. 60: 489-501.
Bero, N. J., M. D. Ruark and B. Lowery. 2014. Controlled-release fertilizer effect on potato and groundwater nitrogen in sandy soil. Agrom. J. 106: 359-368.
Bhat, R. and S. Sujatha. 2009. Soil fertility and nutrient uptake by arecanut (Areca catechu L.) as affected by level and frequency of fertigation in a laterite soil. Agric. Water Manag. 96: 445-456.
Bhat, R., S. Sujatha and D. Balasimha. 2007. Impact of drip fertigation on productivity of arecanut (Areca catechu L.). Agric. Water Manag. 90: 101-111.
Cassman, K., G. Gines, M. Dizon, M. Samson and J. Alcantara. 1996. Nitrogen-use efficiency in tropical lowland rice systems: Contributions from indigenous and applied nitrogen. Field Crops Res. 47: 1-12.
Chawla, J. and N. Narda. 2001. Economy in water and fertilizer use in

Feng, et al.: Potato fertigation
484 Emir. J. Food Agric ● Vol 29 ● Issue 6 ● 2017
trickle fertigated potato. Irrig. Drain. 50: 129-137.Darwish, T., T. Atallah, S. Hajhasan and A. Haidar. 2006. Nitrogen and
water use efficiency of fertigated processing potato. Agric. Water Manag. 85: 95-104.
Epstein, E. and W. Grant. 1973. Water stress relations of the potato plant under field conditions. Agron. J. 65: 400-404.
Fabeiro, C., F. M. de Santa Olalla and J. A. de Juan. 2001. Yield and size of deficit irrigated potatoes. Agric. Water Manag. 48: 255-266.
FAO. 2016. FAO, Rome. Available from: http://www.fao.org/faostat/en/#data/QC.
Gascho, G. and J. Hook. 1991. Development of a fertigation program for sprinkler-irrigated corn. J. Prod. Agric. 4: 306-312.
Gasser, M., J. Caron, M. Laverdiere and R. Lagace. 2002. Solute transport modeling under cultivated sandy soils and transient water regime. J. Environ. Qual. 31: 1722-1730.
Ibrahim, M. M., A. A. El-Baroudy and A. M. Taha. 2016. Irrigation and fertigation scheduling under drip irrigation for maize crop in sandy soil. Int. Agrophysics. 30: 47-55.
Ierna, A., G. Pandino, S. Lombardo and G. Mauromicale. 2011. Tuber yield, water and fertilizer productivity in early potato as affected by a combination of irrigation and fertilization. Agric. Water Manag. 101: 35-41.
Janat, M. 2007. Efficiency of nitrogen fertilizer for potato under fertigation utilizing a nitrogen tracer technique. Commun. Soil Sci. Plant Anal. 38: 2401-2422.
Jayakumar, M., U. Surendran and P. Manickasundaram. 2015. Drip Fertigation program on growth, crop productivity, water and fertilizer-use efficiency of bt cotton in semi-arid tropical region of India. Commun. Soil Sci. Plant Anal. 46: 293-304.
Kachwaya, D. S. and J. S. Chandel. 2015. Effect of fertigation on growth, yield, fruit quality and leaf nutrients content of strawberry (Fragaria × ananassa) cv Chandler. Indian J. Agric. Sci. 85: 1319-1323.
Kang, Y., F. X. Wang, H. J. Liu and B. Z. Yuan. 2004. Potato evapotranspiration and yield under different drip irrigation regimes. Irrig. Sci. 23: 133-143.
Kaur, M., N. Narda and J. Chawla. 2005. Irrigation and potassium management in trickle fertigated potato (Solanum tuberosum). Indian J. Agric. Sci. 75: 290-291.
Kumar, S., M. Imtiyaz and A. Kumar. 2007. Effect of differential soil moisture and nutrient regimes on postharvest attributes of onion (Allium cepa L.). Sci. Hortic. 112: 121-129.
Liu, R., Y. Kang, C. Zhang, L. Pei, S. Wan, S. Jiang, S. Liu, Z. Ren and Y. Yang. 2014. Chemical fertilizer pollution control using drip fertigation for conservation of water quality in Danjiangkou reservoir. Nutr. Cycl. Agroecosyst. 98: 295-307.
Love, S., J. Stark and T. Salaiz. 2005. Response of four potato cultivars to rate and timing of nitrogen fertilizer. Am. J. Potato Res. 82: 21-30.
Mohammad, M., S. Zuraiqi, W. Quasmeh and I. Papadopoulos. 1999. Yield response and nitrogen utilization efficiency by drip-irrigated potato. Nutr. Cycl. Agroecosyst. 54: 243-249.
Narda, N. and J. Chawla. 2002. A simple nitrate submodel for trickle fertigated potatoes. Irrig. Drain. 51: 361-371.
Neeraja, G., K. M. Reddy, I. Reddy and Y. Reddy. 1999. Effect of irrigation and nitrogen on growth, yield and yield attributes of rabi onion (Allium cepa L.) in Andhra Pradesh. Veg. Sci. 26: 64-68.
Papadopoulos, I. 1988. Nitrogen fertigation of trickle-irrigated potato. Fertil. Res. 16: 157-167.
Phene, C. and D. Sanders. 1976. High-frequency trickle irrigation and
row spacing effects on yield and quality of potatoes. Agron. J. 68: 602-607.
Porter, G. A. and J. A. Sisson. 1991. Response of Russet Burbank and Shepody potatoes to nitrogen fertilizer in two cropping systems. Am. Potato J. 68: 425-443.
Rajan, K., A. A. Haris, L. K. Prasad and Shivani. 2014. Efficacy of conventional, solid soluble and liquid fertilizers applied through drip-fertigation on tomato. Indian J. Hortic. 71: 217-221.
Ramniwas, R., A. Kaushik, S. Pareek, D. K. Sarolia and V. Singh. 2013. Effect of drip fertigation scheduling on fertilizer use efficiency, leaf nutrient status, yield and quality of ‘Shweta’ Guava (Psidium guajava L.) under meadow orcharding. Natl. Acad. Sci. Lett. 36: 483-488.
Selim, E., A. Mosa and A. El-Ghamry. 2009. Evaluation of humic substances fertigation through surface and subsurface drip irrigation systems on potato grown under Egyptian sandy soil conditions. Agric. Water Manag. 96: 1218-1222.
Shae, J., D. Steele and B. Gregor. 1999. Irrigation scheduling methods for potatoes in the Northern great plains. Trans. ASAE. 42: 351-360.
Shrestha, R. K., L. R. Cooperband and A. E. MacGuidwin. 2010. Strategies to reduce nitrate leaching into groundwater in potato grown in sandy soils: Case study from North Central USA. Am. J. Potato Res. 87: 229-244.
Singh, H., N. Narda and J. Chawla. 2004. Efficacy of phosphorus through trickle fertigation of potato (Solanum tuberosum). Indian J. Agric. Sci. 74: 476-478.
Suman, S., R. S. Spehia and V. Sharma. 2016. Productivity of capsicum as influenced by fertigation with chemical fertilizers and humic acid. J. Plant Nutr. 39: 410-416.
Truog, E. 1960. Fifty years of soil testing. In: Trans 7th International Congress of Soil Science, Madison, USA, pp. 46-53.
Van Cleemput, O. 2000. Final Annual Co-Ordination Meeting of Regional TC Project RAW/5/007 on Fertigation for Improved Water Use Efficiency and Crop Yield: November.
Waddell, J., S. C. Gupta, J. F. Moncrief, C. J. Rosen and D. Steele. 1999. Irrigation and nitrogen management effects on potato yield, tuber quality and nitrogen uptake. Agron. J. 91: 991-997.
Wang, F. X., Y. Kang and S. P. Liu. 2006. Effects of drip irrigation frequency on soil wetting pattern and potato growth in North China plain. Agric. Water Manag. 79: 248-264.
Wang, F. X., Y. Kang, S. P. Liu and X. Y. Hou. 2007. Effects of soil matric potential on potato growth under drip irrigation in the North China plain. Agric. Water Manag. 88: 34-42.
Wang, F. X., X. X. Wu, C. C. Shock, L. Y. Chu, X. X. Gu and X. Xue. 2011. Effects of drip irrigation regimes on potato tuber yield and quality under plastic mulch in arid Northwestern China. Field Crops Res. 122: 78-84.
Wilson, M. L., C. J. Rosen and J. F. Moncrief. 2009. Potato response to a polymer-coated urea on an irrigated, coarse-textured soil. Agrom. J. 101: 897-905.
Yuan, B. Z., S. Nishiyama and Y. Kang. 2003. Effects of different irrigation regimes on the growth and yield of drip-irrigated potato. Agric. Water Manag. 63: 153-167.
Zhu, C. 2013. Development course and current situation of potato production in China. J. Anhui Agric. Sci. 41: 11121-11123.
Zotarelli, L., J. M. Scholberg, M. D. Dukes and R. Muñoz-Carpena. 2007. Monitoring of nitrate leaching in sandy soils. J. Environ. Qual. 36: 953-962.
Zvomuya, F. and C. J. Rosen. 2001. Evaluation of polyolefin-coated urea for potato production on a sandy soil. HortScience. 36: 1057-1060.