Embed Size (px)
Citation preview

- iv -
U.S. Alcohol EpidemiologicData Reference ManualVolume 6, First Edition
DRINKING IN THE UNITED STATES:MAIN FINDINGS FROM THE 1992 NATIONAL LONGITUDINAL
ALCOHOL EPIDEMIOLOGIC SURVEY (NLAES)
November 1998
National Institutes of Health
National Institute on Alcohol Abuse and Alcoholism6000 Executive BoulevardBethesda, MD 20892-7003

Acknowledgments
This publication was developed by CSR, Incorporated, under Contract No. N01-AA-5-1001 forthe operation of the Alcohol Epidemiologic Data System (AEDS) for the Division of Biometryand Epidemiology (DBE) of the National Institute on Alcohol Abuse and Alcoholism (NIAAA),National Institutes of Health (NIH). Principal authors of this manual are Frederick S. Stinson,Ph.D., and Hsiao-ye Yi, Ph.D., of CSR; and Bridget F. Grant, Ph.D., Ph.D., Patricia Chou, Ph.D,Deborah A. Dawson, Ph.D., and Roger Pickering of DBE/NIAAA. Mary C. Dufour, M.D.,M.P.H., Deputy Director of NIAAA and Director of DBE, served as NIAAA's Project Officer onthe above-referenced contract and provided substantive review of this manual.
All material appearing in this manual is in thepublic domain and may be reproduced or copiedwithout the permission of NIAAA. Citation ofthe source is appreciated.
NIH Publication No. 99-3519Printed November 1998

- iii -
Table of Contents
List of Tables................................................................................................................................ v
List of Exhibits ...........................................................................................................................vii
Foreword ..................................................................................................................................... ix
1. Introduction ..............................................................................................................................1
2. Data Source ..............................................................................................................................2
3. Data Coverage ..........................................................................................................................3
3.1 NLAES Alcohol Items......................................................................................................3
3.1.1 Drinking Status .....................................................................................................33.1.2 Drinking Level ......................................................................................................33.1.3 Overall Beverage Preference ................................................................................63.1.4 Specific Beverage Preference ...............................................................................63.1.5 Drinking Onset......................................................................................................63.1.6 Patterns of Drinking..............................................................................................63.1.7 Hazardous Drinking..............................................................................................73.1.8 DSM-IV Alcohol Use Disorders...........................................................................73.1.9 Family History of Alcoholism ............................................................................103.1.10 Alcohol Treatment ..............................................................................................12
3.2 Other NLAES Items........................................................................................................12
3.2.1 Basic Demographic Information.........................................................................123.2.2 Cigarette Smoking Status ...................................................................................123.2.3 DSM-IV Major Depression ................................................................................123.2.4 Medical Conditions.............................................................................................16
4. Data Tables.............................................................................................................................18
4.1 Percent Distribution Tables ............................................................................................18
4.2 Health Condition Rates Tables .......................................................................................20
4.3 Population Tables ...........................................................................................................21
5. References ..............................................................................................................................23

List of Tables
1- Percent distribution of [variable], by sex and age group according to selected respondentcharacteristics, United States, 1992
Variables:
1. Drinking status in the past year..................................................................................... 25
2a. Usual drinking level in the past year among current drinkers ...................................... 34
2b. Usual drinking level in the past year among current drinkers combined withformer drinkers and lifetime abstainers ........................................................................ 45
3. Usual/heaviest drinking level in the past year among current drinkers ........................ 57
4. DSM-IV alcohol use disorders in the past year among current drinkers ...................... 68
5. Frequency of drinking 5 or more drinks in a single day in the past year amongcurrent drinkers ............................................................................................................. 79
6. Frequency of drinking enough to feel drunk in the past year amongcurrent drinkers ............................................................................................................. 90
7. Frequency of driving after drinking in the past year among current drinkers............. 101
8. Frequency of getting into potentially harmful situation after drinking in thepast year among current drinkers ................................................................................ 112
9. Age of starting to drink among current drinkers......................................................... 121
10. Drinking days of the week in the past year among current drinkers........................... 134
11. Alcoholic beverage preference in the past year among current drinkers .................... 145
12. Type of beer drunk in the past year among current drinkers ...................................... 158
13. Type of wine drunk in the past year among current drinkers ..................................... 171
14. Type of liquor drunk in the past year among current drinkers.................................... 184
15. Family history of alcoholism among current drinkers ................................................ 197
16. Having alcoholic parents among current drinkers ...................................................... 209
17. Having married/lived as if married with an alcoholic among current drinkers .......... 219
18. Any alcohol treatment in the past year among current drinkers ................................. 228
19. Any alcohol treatment in lifetime among current drinkers ......................................... 237
2- Rate per 1,000 population of selected past-year health conditions, by sex and age groupaccording to [variable], United States, 1992
Variables:
1. Drinking status in the past year................................................................................... 246

2. Usual drinking level in the past year among current drinkers .................................... 248
3. Usual/heaviest drinking level in the past year among current drinkers ...................... 250
4. DSM-IV alcohol use disorders in the past year among current drinkers .................... 252
5. Frequency of drinking 5 or more drinks in a single day in the past year amongcurrent drinkers ........................................................................................................... 254
6. Frequency of drinking enough to feel drunk in the past year amongcurrent drinkers ........................................................................................................... 256
7. Frequency of driving after drinking in the past year among current drinkers............. 258
8. Frequency of getting into potentially harmful situation after drinkingin the past year among current drinkers ...................................................................... 260
9. Age of starting to drink among current drinkers......................................................... 261
10. Drinking days of the week in the past year among current drinkers........................... 263
11. Alcohol beverage preference in the past year among current drinkers ....................... 265
12. Type of beer drunk in the past year among current drinkers ...................................... 267
13. Type of wine drunk in the past year among current drinkers ..................................... 269
14. Type of liquor drunk in the past year among current drinkers.................................... 271
15. Family history of alcoholism among current drinkers ................................................ 273
16. Having alcoholic parents among current drinkers ...................................................... 275
17. Having married/lived as if married with an alcoholic among current drinkers .......... 276
18. Any alcohol treatment in the past year among current drinkers ................................. 277
19. Any alcohol treatment in lifetime among current drinkers ......................................... 278
3-1. Population (in 1,000s) ages 18 years and older, by sex and age groupaccording to selected respondent characteristics, United States, 1992............................. 279
3-2. Population (in 1,000s) of current drinkers ages 18 years and older, by sex andage group according to selected respondent characteristics, United States, 1992 ............ 282

List of Exhibits
1. National Longitudinal Alcohol Epidemiologic Survey (Section 1): SelectedQuestions on Alcohol Consumption ...................................................................................... 4
2. National Longitudinal Alcohol Epidemiologic Survey (Section 2): SelectedQuestions on Alcohol Experiences ........................................................................................ 8
3. National Longitudinal Alcohol Epidemiologic Survey (Section 2): DSM-IV AlcoholAbuse and Dependence Diagnostic Criteria and Associated Questionnaire Items ................ 9
4. National Longitudinal Alcohol Epidemiologic Survey (Section 3): SelectedQuestions on Family History................................................................................................ 11
5. National Longitudinal Alcohol Epidemiologic Survey (Section 7): SelectedQuestions on Treatment Utilization ..................................................................................... 13
6. National Longitudinal Alcohol Epidemiologic Survey (Section 8): SelectedDemographic Questionnaire Items ....................................................................................... 14
7. National Longitudinal Alcohol Epidemiologic Survey (Section 5): SelectedQuestions on Tobacco, Medicines, and Drugs ..................................................................... 14
8. National Longitudinal Alcohol Epidemiologic Survey (Section 4): DSM-IV MajorDepressive Episode Diagnostic Criteria and Associated Questionnaire Items .................... 15
9. National Longitudinal Alcohol Epidemiologic Survey (Section 6): SelectedQuestions on Medical Conditions ........................................................................................ 17

- ii -
Foreword
This Alcohol Epidemiologic Data Reference Manual (AEDRM) is one of a series of manuals thatprovide extensive data and other information useful to researchers, health care planners, andothers interested in alcohol abuse, associated illnesses, and alcohol-related mortality. It is hopedthat these documents, prepared by the National Institute on Alcohol Abuse and Alcoholism(NIAAA), will serve as a useful reference for both researchers and others interested in thealcoholism field.
This manual is the first edition of Volume 6 of the AEDRM series, and provides an extensivecompilation of data from the National Longitudinal Alcohol Epidemiologic Survey, a 1992household survey designed and sponsored by NIAAA. Forthcoming editions of Volume 6 of theAEDRM series will focus on alcohol-related data from other national surveys.
Other volumes of the AEDRM series include information on per capita ethanol consumption,liver cirrhosis mortality, county alcohol-problem indicators, hospital discharges with alcohol-related conditions, and State trends in alcohol-related mortality.
Mary C. Dufour, M.D., M.P.H.Deputy Director, National Institute
on Alcohol Abuse and Alcoholism

1. Introduction
The National Institute on Alcohol Abuse and Alcoholism (NIAAA), a part of the NationalInstitutes of Health, is the primary Federal agency that conducts research on alcohol use and itsconsequences. The important task of assessing the scope and consequences of alcohol use iscarried out by NIAAA’s Division of Biometry and Epidemiology (DBE). One way in whichDBE accomplishes this goal is through the Alcohol Epidemiologic Data System (AEDS), whichserves as a repository of national-level data useful for alcohol epidemiology and as a resource foranalysis of such data.
Another way in which NIAAA and DBE meet the responsibility of assessing the scope andconsequences of alcohol use is by sponsoring and collaborating in the design of major datacollection efforts by other agencies. For example, three alcohol supplements to the NationalHealth Interview Survey (in 1979, 1983, and 1988) were partially funded by and designed withthe collaboration of NIAAA. NIAAA also provided funding and technical expertise to the 1993National Mortality Followback Survey. In addition, NIAAA has funded other data collectionefforts through various grants and contracts.
In 1992, NIAAA conducted the National Longitudinal Alcohol Epidemiologic Survey(NLAES)—at that time, the most ambitious and comprehensive survey of its type everconducted. The NLAES included extensive questions concerning alcohol consumption, as wellas items designed to provide psychiatric classification of alcohol use disorders. In addition, therewere a variety of other questions concerning family history of alcoholism, alcohol treatment,health conditions, major depressive disorder, and basic demographic information.This Data Reference Manual is the first in a series of AEDS manuals to provide detailed findingsfrom various national surveys addressing alcohol use and alcohol problems. The first manual inthis series focuses on data from the NLAES. The following sections describe the NLAES, aswell as the variables and data tables presented in this manual.

2. Data Source
All data in this manual came from the 1992 NLAES, a nationwide household survey designedand sponsored by NIAAA. The U.S. Bureau of the Census did fieldwork for this survey. For theNLAES, direct face-to-face interviews were conducted with 42,862 respondents, 18 years of ageand older, in the contiguous United States and the District of Columbia. The household-responserate for the NLAES was 91.9 percent, and the person-response rate was 97.4 percent.
The NLAES featured a complex multistage design (Massey, Parsons, and Tadros 1989). Primarysampling units (PSUs) were stratified according to sociodemographic criteria and were selectedwith probability proportional to size. Approximately 200 PSUs were in the 1992 NLAESsample; 52 of these were self-representing—that is, selected with certainty. Within PSUs,geographically defined secondary sampling units, referred to as segments, were selectedsystematically for each PSU. At this stage there was oversampling of the black population.
Segments were then divided into clusters of approximately four to eight housing units, and alloccupied housing units were included in the sampling frame. Within each household, onerandomly selected respondent, 18 years of age or older, was selected to participate in the survey.At this stage young adults (18-29) years of age were oversampled.
Readers should be aware that estimates for American Indians/Alaska Natives must be carefullyinterpreted for two reasons. First, because the NLAES did not include the State of Alaska in itssampling plan, estimates for this group may not be representative of Alaska Natives. Second, theestimates for American Indians/Alaska Natives are less reliable than similar estimates for otherrace groups. This is because of the relatively small numbers of this group in the U.S. population.All tables in this manual include estimates of standard errors to assist readers in assessing themeaning of the numbers presented.
Because of the complex survey design of the NLAES, variance estimation procedures thatassume a simple random sample cannot be employed. Research has shown that clustering andstratification of the NLAES sample may result in standard errors much larger than those thatwould be obtained with a simple random sample of equal size. The implication of this is thatvariance estimates that do not account appropriately for sample design effects can produceinaccurate estimates of statistical significance, making nonsignificant differences appear to besignificant. To take into account the NLAES sample design, all standard errors of estimatespresented in this manual were generated using SUDAAN (Research Triangle Institute 1997), acomputer program that uses appropriate statistical techniques to adjust for sample designcharacteristics.

3. Data Coverage
Data provided in this manual include items associated with alcohol. Other types of informationare also included, as described in the following sections.
3.1 NLAES Alcohol Items
The primary focus of the NLAES is alcohol, including amounts and patterns of consumption,experiences associated with drinking, classification of DSM-IV alcohol use disorders, and familyhistory of alcohol problems. The following sections describe the alcohol variables used in thismanual.
3.1.1 Drinking Status
Because the NLAES sampling frame included all household residents 18 years of age and olderin the contiguous United States, a substantial number of respondents were nondrinkers (eitherlifetime abstainers or former drinkers). For this reason, the first items in the NLAES werescreener questions designed to assess current drinking status and allow interviewers to select onlyappropriate questions for each person interviewed. Respondents reporting consumption of atleast 12 drinks in the past year were classified as current drinkers. Those who were not currentdrinkers but who reported drinking at least 12 drinks in any year prior to the past year wereclassified as former drinkers. All others were classified as lifetime abstainers. Most of the tablesin this manual are based on current drinkers only.
Questions used to determine drinking status (Items 1, 2, and 3 from Section 1 of the NLAES) areshown in Exhibit 1. The purpose of showing NLAES questionnaire items in this and otherexhibits is to assist the reader by providing the exact wording of questions. Responsealternatives and skip patterns are not shown in the exhibits.
3.1.2 Drinking Level
The NLAES contains detailed questions about past-year alcohol consumption. For each beveragetype (beer, wine, and liquor), there are questions about usual frequency of drinking, quantity ofdrinks consumed on drinking days, and size of drinks. The amount of ethanol in each drink canbe calculated by using an ethanol conversion factor—the proportion of each drink that is purealcohol. Ethanol conversion factors used in this manual were .045 for beer, .121 for wine, and.409 for liquor (DISCUS 1985; Kling 1989; Kling 1991; Modern Brewery Age 1992; Turner1990; Williams et al. 1996). From these items, it is possible to calculate estimates of totalethanol consumption during the past year. Dividing this annual total by 365 yields an estimate of“drinking level,” the average daily amount of ethanol consumed.
Responses to questions about frequency of drinking individual types of beverage (and alsofrequency of drinking 5 or more drinks in a single day or frequency of drinking to intoxication)were recorded categorically by interviewers. Estimates in the form of numbers were derived byconverting the midpoints of categorical frequency responses to days per year. For example:

- 4 -
Exhibit 1. National Longitudinal Alcohol Epidemiologic Survey (Section 1):Selected Questions on Alcohol Consumption
1. In your entire life, have you had at least 12 drinks of any kind of alcohol?
2. Over the past 12 months, did you have at least 12 drinks of any kind of alcohol?
3. Was there any one year period in your entire life when you had at least 12 drinks of any kind ofalcohol?
4a. During the last 12 months, did you drink any beer?
4j. On the days when you drank beer in the last 12 months, did you USUALLY drink regular beer,malt liquor beer, lite or reduced calorie beer, or low-alcohol beer? If more than one type, mark allthat apply.
5a. During the last 12 months, did you drink any wine coolers, champagne, or sparkling wine?
5j. On the days when you drank wine in the last 12 months, did you USUALLY drink regular wine,wine coolers, or fortified wine? If more than one type, mark all that apply.
6a. During the last 12 months, did you drink any liquor, including mixed drinks and liqueurs?
6j. On the days when you drank liquor in the last 12 months, did you USUALLY drink mixeddrinks, liqueurs, or did you drink your liquor, other than liqueurs, straight? If more than onetype, mark all that apply.
7a. Now I would like to ask you some questions about WHEN you USUALLY had something todrink during the last 12 months. Including all types of alcohol, on which days of the week didyou USUALLY have something to drink in a typical month in the past year? Any other days?Mark (X) all that apply.
9b. During the last 12 months, about how often did you have five or more drinks of any type ofalcohol in a single day?
11. About how often would you say you USUALLY drank enough to feel drunk during the last 12months? By drunk, I mean times when your speech was slurred, you felt unsteady on yourfeet, or you had blurred vision.
15. About how old were you when you first started drinking, not counting small tastes or sips ofalcohol?

every day = 365,nearly every day = 312,3–4 days a week = 182,1–2 days a week = 78,2–3 days a month = 30,once a month = 12,7–11 days in past year = 9,3–6 days in past year = 5,2 days in past year = 2,1 day in past year = 1, andnever = 0.
The usual (or unadjusted) daily volume of ethanol intake for each individual beverage type wasestimated using the following formula:
ethanol =(days)(quantity)(size)( factor)
365
where:ethanol = usual average daily ethanol for beverage type;days = total days when drank beverage;quantity = usual quantity of drinks of beverage consumed per day;size = size of drink in ounces; andfactor = ethanol conversion factor for beverage type.
The NLAES also includes questions about past-year consumption during periods when therespondent may have been drinking more than usual. The usual/heaviest (or adjusted) dailyvolume of ethanol intake for each beverage type was calculated with the following formula:
ethanol =[(tdays − hdays)(uquan)(usize)( factor )]+ [(hdays)(hquan)(hsize)( factor)]
365
where:ethanol = usual/heaviest average daily ethanol for beverage type;tdays = total days per year when drank beverage;hdays = days per year when drank heaviest quantity of beverage;uquan = usual quantity of drinks of beverage consumed per day;usize = size of drink associated with usual quantity in ounces;factor = ethanol conversion factor for beverage type;hdays = days per year when drank heaviest quantity;hquan = heaviest quantity of drinks of beverage per day when drank beverage; andhsize = size of drink in ounces associated with heaviest quantity.
The sum of daily ethanol consumption for beer, wine and spirits provided an estimate of theoverall average daily ethanol consumption.
Estimates of average drinking level (light, moderate, or heavier) were created from both the usualand usual/heaviest daily ethanol intakes. Regardless of which underlying volume measure wasused, the following categories defined average drinking level: light drinker = at least 12 drinks inpast year to <0.22 ounces of ethanol per day, moderate drinker = 0.22 to <1.00 ounces of ethanolper day, and heavier drinker = 1.00 or more ounces of ethanol per day.
3.1.3 Overall Beverage Preference
NLAES questions 4a, 5a, and 6a in Section 1 (see Exhibit 1) ask about past-year consumption ofbeer, wine, and liquor. There were relatively few respondents who consumed only one of thethree types of alcohol. Overall beverage preference in this manual was derived from calculationsof average daily ethanol in the form of beer, wine, and liquor, separately. Overall beveragepreference was assigned to a single type of alcohol if the respondent received at least 75 percentof past-year ethanol from a single type of beverage. If no beverage type predominated using thisrule, the respondent was assigned to a “no preference” category.
3.1.4 Specific Beverage Preference
For each beverage type, questions 4j, 5j, and 6j in Section 1 (see Exhibit 1) ask about types ofbeer (or wine or liquor) consumed in the past year. For beer the alternatives were regular beer,malt liquor beer, lite or reduced-calorie beer, or low-alcohol beer. For wine the alternatives wereregular wine, wine coolers, or fortified wine. The alternatives for liquor were mixed drinks,liqueurs, or straight (for liquor other than liqueurs). A respondent could indicate drinking morethan one type of beer, wine, or liquor. Categories used in this manual are: regular beer, lite orreduced-calorie beer, and malt liquor beer/low-alcohol beer/combinations for beer; regular wine,wine coolers, and fortified wine/combinations for wine; and mixed drinks, straight, orliqueurs/combination for liquor.
3.1.5 Drinking Onset
Question 15 in Section 1 (shown in Exhibit 1) asks respondents to report the age when they firststarted drinking (“not counting small tastes or sips”). Age categories used in this manual are: 16or younger; 17 or 18; 19 or 20; and 21 or older.
3.1.6 Patterns of Drinking
Question 7a in Section 1 (see Exhibit 1) asks about days of the week on which a respondentdrank any type of alcohol in the past year. For this variable, the categories used in this manualare: on holidays and special occasions only, on weekends only (Friday, Saturday, and Sunday),and on weekdays/weekends (no particular days).
As shown in Exhibit 1, question 9b in Section 1 asks directly about the frequency of therespondent’s drinking five or more drinks in a single day. The categories used for this variable in

this manual are: never; 1–11 times (less than once a month); and 12 or more times (at least oncea month).
Response categories are the same for another variable related to drinking pattern. Question 11 inSection 1 (see Exhibit 1) asks about the frequency with which the respondent drank enough tofeel drunk in the past year. In this manual, the response categories are: never; 1–11 times (lessthan once a month); and 12 or more times (at least once a month).
3.1.7 Hazardous Drinking
Question 1c(19) of Section 2 (shown in Exhibit 2) asks about the number of times in the pastyear when the respondent drove a vehicle (car, motorcycle, truck, boat, or other vehicle) afterhaving too much to drink. Responses were coded as not once, 1 or 2 times, or 3 or more times inthe past year.
Question 1b(20) of Section 2 (shown in Exhibit 2) asks about getting into a situation while orafter drinking that increased a respondent’s chances of getting hurt (e.g., swimming, usingmachinery, or walking in a dangerous area or around heavy traffic). Responses were coded notonce or at least once in the past year.
3.1.8 DSM-IV Alcohol Use Disorders
The NLAES includes questionnaire items designed to classify alcohol use disorders based oncriteria articulated in the Diagnostic and Statistical Manual, Fourth Edition: DSM-IV™(American Psychiatric Association 1994).
A diagnosis of DSM-IV alcohol abuse requires that a person show a maladaptive pattern ofalcohol use, leading to clinically significant impairment or distress, as demonstrated by at leastone of the following: (1) continued use despite a social or interpersonal problem caused orexacerbated by the effects of drinking; (2) recurrent drinking in situations in which alcohol use isphysically hazardous; (3) recurrent drinking resulting in a failure to fulfill major role obligations;or (4) recurrent alcohol-related legal problems. A diagnosis of alcohol dependence requires thata person meet at least three of seven criteria defined for dependence in any 12-month period.The criteria for alcohol abuse and dependence, along with the NLAES questionnaire items usedto determine whether a person meets a particular criterion, are shown in Exhibit 3.
The duration criterion for either alcohol use disorder defines the repetitiveness with which certaindiagnostic criteria must occur during a 12-month period for these criteria to be consideredpositive. As shown in Exhibit 3, duration criteria for alcohol abuse and dependence are notassociated with every diagnostic criterion and are defined by qualifiers such as “recurrent,”“often,” and “persistent” desire or unsuccessful “efforts.”

- 8 -
Exhibit 2. National Longitudinal Alcohol Epidemiologic Survey (Section 2):Selected Questions on Alcohol Experiences
1a. I’m going to read you a list of experiences that many people have reported in connection withtheir drinking. As I read each experience, please tell me if this has ever happened to you. Inyour entire life, did you EVER…
(19) Drive a car, motorcycle, truck, boat, or other vehicle afterhaving too much to drink?
(20) Get into a situation while drinking or after drinking thatincreased your chances of getting hurt—like swimming, usingmachinery, or walking in a dangerous area or around heavytraffic?
1b. Did this happen in the last 12 months? (Asked separately for each experience respondent everhad.)
1c. About how many times did this experience happen in the last 12 months? (Asked separately foreach experience respondent had in the past 12 months.)

- 9 -
Exhibit 3. National Longitudinal Alcohol Epidemiologic Survey (Section 2):DSM-IV Alcohol Abuse and Dependence Diagnostic Criteria and Associated Questionnaire Items
Diagnostic Criteria for Alcohol Abuse
Diagnostic Criterion: Continued to drink despite socialor interpersonal problem caused by drinking
Questionnaire Item:• Continued to drink even though you knew it was
causing you trouble with your family or friends.Diagnostic Criterion: Recurrent drinking in situationswhere alcohol use is physically hazardous*
Questionnaire Items:• Drive a car, motorcycle, truck, boat, or other vehicle
after having too much to drink.• Get into a situation while drinking or after drinking that
increased your changes of getting hurt—like swimming,using machinery, or walking in a dangerous area oraround heavy traffic.
Diagnostic Criterion: Recurrent alcohol-related legalproblems*
Questionnaire Item:• Get arrested or held at a police station because of your
drinking.Diagnostic Criterion: Recurrent drinking resulting infailure to fulfill major role obligations at work, school, orhome*
Questionnaire Items:• Get drunk or have a hangover when you were
supposed to be doing something important—like beingat work, school, or taking care of your home or family.
• Get drunk or have a hangover when you were actuallydoing something important—like being at work, school,or taking care of your home or family.
Diagnostic Criteria for Alcohol Dependence1
Diagnostic Criterion: Tolerance2
Questionnaire Items:• Find that your usual number of drinks had much less
effect on you than it once did.• Find that you had to drink much more than you once did
to get the effect you wanted.Diagnostic Criterion: Withdrawal syndrome3 orwithdrawal relief/avoidance
Questionnaire Items:• Have any of the following experiences happened when
the effects of alcohol were wearing off [Pause], severalhours after drinking [Pause], or the morning afterdrinking? For example did you ever:(a) Have trouble falling asleep or staying asleep.(b) Find yourself shaking when the effects of alcohol
were wearing off.(c) Feel depressed, irritable, or nervous.(d) Feel sick to your stomach or vomit when the effects
of alcohol were wearing off.(e) Have a very bad headache.(f) Find yourself sweating or your heart beating fast
when the effects of alcohol were wearing off.
(g) See, feel, or hear things that were not really there.(h) Have fits or seizures when the effects of alcohol
were wearing off.• Take a drink to get over any of the bad aftereffects of
drinking.• Take a drug other than aspirin, Tylenol™, or Advil™, to
keep from having a hangover or to get over the badaftereffects of drinking.
• Take a drink to keep from having a hangover to makeyourself feel better when you had one.
Diagnostic Criterion: Drinking larger amounts over alonger period of time than intended*
Questionnaire Items:• Start drinking even though you decided not to or
promised yourself you would not.• End up drinking more than you meant to.• Keep on drinking for a much longer period of time than
you had intended to.Diagnostic Criterion: Persistent desire or unsuccessfulefforts to cut down or control drinking*
Questionnaire Items:• Want to stop or cut down on your drinking.• Try to stop or cut down on your drinking but found you
could not do it.Diagnostic Criterion: Important social, occupational, orrecreational activities given up or reduced in favor ofdrinking
Questionnaire Items:• Give up or cut down on activities that were important to
you in order to drink—like work, school, or associatingwith friends or relatives.
• Give up or cut down on activities that you wereinterested in or that gave you pleasure in order to drink.
Diagnostic Criterion: Great deal of time spent inactivities to obtain alcohol, to drink, or to recover fromits effects
Questionnaire Items:• Spend so much time drinking that you had little time for
anything else.• Spend a lot of time being sick or with a hangover from
drinking.• Spend a lot of time making sure that you always had
alcohol available.Diagnostic Criterion: Continued to drink despiteknowledge of having a persistent or recurrent physicalor psychological problem caused or exacerbated bydrinking
Questionnaire Items:• Continued to drink even though you knew it was making
you feel depressed, uninterested in things, orsuspicious or distrustful of other people.
• Continued to drink even though you knew it wascausing you a health problem or making a healthproblem worse.
* In order for the criterion to be positive, either: (a) two or more symptoms must have occurred at least once, or (b) one or moresymptoms must have occurred at least twice during the past year.
1 Dependence diagnoses can be specified with physiological dependence (i.e., evidence of either tolerance or withdrawal) orwithout physiological dependence (i.e., no evidence of either tolerance or withdrawal).
2 Tolerance need have occurred only once during the past year for the criterion to be positive.3 Two or more symptoms of withdrawal must have occurred at least twice during the past year for the criterion to be positive.SOURCE: Grant et al. 1994

To satisfy the duration criterion for abuse, a respondent must have experienced two or moresymptoms of an abuse criterion associated with a duration qualifier at least once during the pastyear, or alternatively, at least one symptom of that diagnostic criterion must have occurred atleast twice during the past year. For those abuse criteria not associated with a duration qualifier,a related symptom need only have occurred once in the past year to be counted as positive towardan abuse diagnosis.
Similarly, to satisfy the duration criterion for dependence, at least one symptom of a diagnosticcriterion associated with a duration qualifier must have occurred at least twice over the course ofthe year preceding the interview, or alternatively, two or more symptoms related to these criteriamust have occurred at least once during the same time period.
For analyses presented in this manual, the classification of dependence was qualified further inan important way. Because the withdrawal criterion of alcohol dependence is defined in DSM-IV as a syndrome (i.e., a cluster of symptoms), at least two symptoms of withdrawal, which meetthe duration criterion, had to occur during the past 12 months for the withdrawal criterion to bemet.
3.1.9 Family History of Alcoholism
Section 3 of the NLAES asks questions about family history (see Exhibit 4). For these questions,an alcoholic or problem drinker is defined as: a person who has physical or emotional problemsbecause of drinking; problems with a spouse, family, or friends because of drinking; problems atwork because of drinking; problems with the police because of drinking—like drunk driving; or aperson who seems to spend a lot of time drinking or being hungover.
The type of relative who has been an alcoholic or problem drinker can be either a blood or non-blood relative. Blood relatives can be further classified as first-degree or second-degree relatives.First-degree relatives are biological parents or children, and full siblings. Second-degreerelatives are natural parents’ biological parents, full siblings of either natural parent, and halfsiblings of the respondent on either natural parent’s side. Non-blood relatives includestep/adoptive/foster parents, siblings and children, unrelated parents/guardians of either naturalparent, and relatives through marriage including domestic partners.
The NLAES items shown in Exhibit 4 provide a basis on which to categorize NLAESrespondents with regard to family history of alcoholism: no family history of alcoholism; second-degree relatives only alcoholic; first-degree relatives only alcoholic; both first- and second-degree relatives alcoholic. Respondents’ family members were included even if they weredeceased at the time of the interview; family members younger than 10 and deceased familymembers who died before they reached age 10 were excluded.
Questions 30 and 33 of Section 3 (see Exhibit 4) ask specifically about ever being married to analcoholic/problem drinker or ever living with an alcoholic/problem drinker as if married.Analyses in this manual include a variable that is coded yes if the answer to either Question 30 orQuestion 33 was positive.

- 11 -
Exhibit 4. National Longitudinal Alcohol Epidemiologic Survey (Section 3):Selected Questions on Family History
1. In your judgement, has your blood or natural father been an alcoholic or problem drinker atANY time in his life? By alcohol or problem drinker, I mean a person who has physical oremotional problems because of drinking (Pause); problems with a spouse, family, or friendsbecause of drinking (Pause); problems at work because of drinking (Pause); problems with thepolice because of drinking—like drunk driving (Pause); or a person who seems to spend a lotof time drinking or being hungover. (Repeat definition frequently.)
2. In your judgement, has your blood or natural mother been an alcoholic or problem drinker atANY time in her life?
6c. In your judgement has (your/any of your) full brother(s) been an alcoholic or problem drinker atANY time in his life?
11c. In your judgement has (your/any of your) full sister(s) been an alcoholic or problem drinker atANY time in her life?
20c. In your judgement, has (your/any of your) natural father’s full brother(s) been an alcoholic orproblem drinker at ANY time in his life?
21c. In your judgement, has (your/any of your) natural father’s full sister(s) been an alcoholic orproblem drinker at ANY time in her life?
22c. In your judgement, has (your/any of your) natural mother’s full brother(s) been an alcoholic orproblem drinker at ANY time in his life?
23c. In your judgement, has (your/any of your) natural mother’s full sister(s) been an alcoholic orproblem drinker at ANY time in her life?
24. In your judgement, has your natural grandfather on your father’s side been an alcoholic orproblem drinker at ANY time in his life? By natural grandfather on your father’s side, I meanyour father’s natural or blood father?
25. In your judgement, has your natural grandmother on your father’s side been an alcoholic orproblem drinker at ANY time in her life? By natural grandmother on your father’s side, I meanyour father’s natural or blood mother?
26. In your judgement, has your natural grandfather on your mother’s side been an alcoholic orproblem drinker at ANY time in his life? By natural grandfather on your mother’s side, I meanyour mother’s natural or blood father?
27. In your judgement, has your natural grandmother on your mother’s side been an alcoholic orproblem drinker at ANY time in her life? By natural grandmother on your mother’s side, I meanyour mother’s natural or blood mother?
30. In your judgement, have you EVER been married to an alcoholic or problem drinker (includecurrent spouse)?
33. In your judgement, have you EVER lived with someone as if married who was an alcoholic orproblem drinker?

3.1.10 Alcohol Treatment
As shown in Exhibit 5, Section 7 of the NLAES asks questions designed to assess a respondent’shistory of contact with various professionals, organizations, and/or programs that offer treatmentassistance with alcohol problems. For this manual, a respondent was classified as seekingalcohol treatment in his/her lifetime based on Question 2a and seeking alcohol treatment in thepast year based on Question 2b. A positive response to any of the different treatment providersor settings was counted as an indication of alcohol treatment.
3.2 Other NLAES Items
Other NLAES variables not directly related to alcohol, but used for analyses presented in thismanual, are described in the following sections.
3.2.1 Basic Demographic Information
Exhibit 6 shows demographic items from the NLAES that are included in this manual. Inaddition to the actual items, the exhibit shows response categories. Among the demographicitems in this manual are: sex, age, race, Hispanic origin, marital status, education, employmentstatus, personal annual income, occupation, industry of occupation, children under 14 inhousehold, and ever raised children.
3.2.2 Cigarette Smoking Status
Based on question 1a shown in Exhibit 7 from Section 5 of the NLAES, respondents werecategorized as lifetime cigarette smokers if they had smoked at least 100 cigarettes in their life.Respondents could also be classified as lifetime smokers based on smoking at least 50 cigars or50 pipes of tobacco. Any lifetime smoker (cigarette, cigar, or pipe) was asked question 3a andclassified as a current smoker of the particular tobacco type based on smoking at least onecigarette, cigar, or pipe in the past year. This manual looks only at current cigarette smokers andnot cigar or pipe smokers.
3.2.3 DSM-IV Major Depression
Section 4 of the NLAES contains questions that allow for a diagnosis of major depressivedisorder according to DSM-IV criteria. The pertinent criteria and associated NLAES questionsare shown in Exhibit 8. Diagnoses of major depression required the presence of at least fivedepressive symptoms (inclusive of depressed mood or loss of pleasure and interest) nearly everyday for most of the day for at least the same two-week period. In contrast to the earlierDSM-III-R definition of major depression, social and/or occupational dysfunction must also havebeen present during the disturbance, and episodes of DSM-IV major depression exclusively dueto bereavement and physical illness were ruled out.

- 13 -
Exhibit 5. National Longitudinal Alcohol Epidemiologic Survey (Section 7):Selected Questions on Treatment Utilization
1. Have you ever gone anywhere or seen anyone for a reason that was related in any way to yourdrinking—a physician, counselor, Alcoholics Anonymous, or any other community agency orprofessional? Include help for combined alcohol and other drug use if alcohol was the majorproblem for which you sought help.
2a. I’m going to read you a list of community agencies and professionals. For each one, please tellme if you have ever gone there for any reason related to your drinking. In you entire life, didyou EVER go to a/an… (Repeat phrase frequently)
(1) Alcoholics Anonymous meeting?(2) Narcotics or Cocaine Anonymous meeting?(3) Al-Anon meeting?(4) (ACOA) Adult Children of Alcoholics meeting?(5) Family or other social service agency?(6) Alcohol and/or drug detoxification ward or clinic?(7) Inpatient ward of a psychiatric general hospital?(8) Outpatient clinic? (Include outreach programs.)(9) Alcohol and/or other drug rehabilitation program?
(10) Methadone maintenance program?(11) Community mental health center or program?(12) Emergency room?(13) Day program or partial patient program?(14) Vocational rehabilitation?(15) Halfway house? (Include therapeutic communities.)(16) Crisis Center?(17) Employee Assistance Program (EAP)?(18) Private physician?(19) Psychiatrist?(20) Psychologist?(21) Social worker?(22) Natural therapist?(23) Clergyman, priest, or rabbi?(24) Any other agency or professional?
2b. Did you go to (Agency/professional) during the last 12 months, earlier than that, or both? (Askedseparately for each agency/professional ever seen for reason related to respondent’s drinking.)

Exhibit 6. National Longitudinal Alcohol Epidemiologic Survey (Section 8):Selected Demographic Questionnaire Items
SexMaleFemale
Age18–24 years25–44 years45–64 years65 years and older
RaceWhiteBlackAmerican Indian/Alaska NativeAsian/Pacific Islander
Hispanic OriginHispanicNonhispanic
Marital StatusMarriedLiving with someone as if marriedWidowedDivorcedSeparatedNever married
Education8 years or less9–11 yearsHigh school or GED equivalentAny college/graduate school
Currently Employed Full TimeYesNo
Personal annual incomeNone$1 to $9,999$10,000 to $24,999$25,000 or more
Current/Most Recent OccupationExecutive, administrative, managerialProfessional specialtyTechnician/related supportSalesAdministrative support, including clericalPrivate householdProtective serviceService, except protective and householdFarming, forestry, fishingPrecision production, craft, repairOperators, fabricators, laborersTransportation, material movingHandlers, equipment cleaners, helpers,
laborersMilitary
Current/Most Recent IndustryAgriculture, forestry, fisheriesMiningConstructionManufacturingTransportation, communications, other public
utilitiesWholesale tradeRetail tradeFinance, insurance, real estateServices: business and repairServices: personalServices: entertainment and recreationServices: public and relatedPublic administrationMilitary
Ever Raised ChildrenYesNo
Children Under 14 Living in HouseholdYesNo
Exhibit 7. National Longitudinal Alcohol Epidemiologic Survey (Section 5):Selected Questions on Tobacco, Medicines, and Drugs
1. In your entire life, have you ever smoked…
a. At least 100 cigarettes?
3.a Did you smoke (Name of tobacco category) in the last 12 months?
- 14 -

- 15 -
Exhibit 8. National Longitudinal Alcohol Epidemiologic Survey (Section 4):DSM-IV Major Depressive Episode Diagnostic Criteria and Associated Questionnaire Items
Diagnostic Criterion: Depressed mood most of the day,nearly every day, as indicated by either subjectivereports (e.g., feels sad or empty) or observation madeby others (e.g., appears tearful)
Questionnaire Item:• Have a time lasting at least 2 weeks when you felt sad,
blue, depressed, or down most of the time?Diagnostic Criterion: Markedly diminished interest orpleasure in all, or almost all, activities most of the day,nearly every day (as indicated by either subjectiveaccount or observation made by others)
Questionnaire Item:• Find that you didn’t care about things that you usually
cared about, or that you didn’t enjoy things that youusually enjoyed, most of the time for at least 2 weeks?
Diagnostic Criterion: Significant weight loss when notdieting or weight gain (e.g., a change of more then 5% ofbody weight in a month), or decrease or increase inappetite nearly every day
Questionnaire Items:• Lose at least 2 pounds a week for several weeks or at
least 10 pounds altogether within a month, other thanwhen you were physically ill or dieting?
• Lost your appetite nearly every day for at least 2weeks?
• Gain at least 2 pounds a week for several weeks or atleast ten pounds altogether within a month (other thanwhen you were pregnant)?
• Find that you wanted to eat a lot more than usual for nospecial reason, most days for at least 2 weeks?
Diagnostic Criterion: Insomnia or hypersomnia nearlyevery day
Questionnaire Items:• Have trouble sleeping nearly every day for at least 2
weeks?• Sleep more than usual nearly every day for at least 2
weeks?Diagnostic Criterion: Psychomotor agitation orretardation nearly every day (observable by others, notmerely subjective feelings of restlessness or beingslowed down)
Questionnaire Items:• Move or talk MUCH more slowly than usual, most days
for at least 2 weeks?• Become so restless that you fidgeted or paced most of
the time for at least 2 weeks?
Diagnostic Criterion: Fatigue or loss of energy nearlyevery day
Questionnaire Item:• Feel tired all the time or get tired easily most days for at
least 2 weeks, even though you weren’t doing morethan usual?
Diagnostic Criterion: Feelings of worthlessness orexcessive or inappropriate guilt (which may bedelusional) nearly every day (not merely self-reproach orguilt about being sick)
Questionnaire Items:• Feel worthless most of the time for at least 2 weeks?• Feel guilty about things you normally wouldn’t feel guilty
about, most of the time for at least 2 weeks?Diagnostic Criterion: Diminished ability to think orconcentrate, or indecisiveness, nearly every day (eitherby subjective account or as observed by others)
Questionnaire Items:• Have unusual trouble concentrating or keeping your
mind on things, most days for at least 2 weeks?• Find it harder than usual to make decisions, most of the
time for at least 2 weeks?Diagnostic Criterion: Recurrent thoughts of death (notjust fear of dying), recurrent suicidal ideation without aspecific plan, or a suicide attempt or a specific plan forcommitting suicide
Questionnaire Items:• Attempt suicide?• Think about suicide from time to time?• Feel like you wanted to die?• Think a lot about death, either your own, someone
else’s, or death in general?

Analyses presented here include the occurrence of a major depressive disorder in the past year ofthe respondent’s life and the occurrence of a major depressive disorder over the respondent’slifetime.
3.2.4 Medical Conditions
Section 6 of the NLAES contains a list of medical conditions (as shown in Exhibit 9).Respondents were categorized as having a particular medical condition in the past year if theanswer to Question 2b was “yes.” The decision concerning counting any medical condition forthe analyses in this manual also took into account Question 2d. In other words, a medicalcondition was not counted in this manual unless the respondent also indicated that a doctor orother health professional had diagnosed the condition.

- 17 -
Exhibit 9. National Longitudinal Alcohol Epidemiologic Survey (Section 6):Selected Questions on Medical Conditions
1a. Now I’m going to read you a list of medical conditions that you may have had. As I read eachone, please tell me whether you have ever had it. Have you EVER had…
(1) A stomach ulcer?(2) An enlarged liver?(3) Yellow jaundice?(4) Cirrhosis of the liver?(5) Hepatitis?(6) Some other liver disease?(7) High blood cholesterol, high blood fat, or high lipid content?(8) Diabetes?(9) Gastritis?
(10) Convulsions or epilepsy?(11) Hardening of the arteries or arteriosclerosis?(12) High blood pressure?(13) Chest pain or angina pectoris?(14) Rapid heartbeat or tachycardia?(15) Heart attack or myocardial infarction?(16) Other heart disease?(17) A stroke or cerebrovascular accident?(18) Emphysema?(19) Arthritis, osteoporosis, or any other joint or bone disease?(20) Vitamin deficiencies or anemia?(21) Pancreatitis or any other disease of the pancreas?(22) Cancer?
2b. Did (Read condition) cause you any problems during the last 12 months? (Asked separately foreach medical condition respondent ever had.)
2d. Did a doctor or other health professional tell you had (Condition)? (Asked separately for eachmedical condition respondent ever had.)
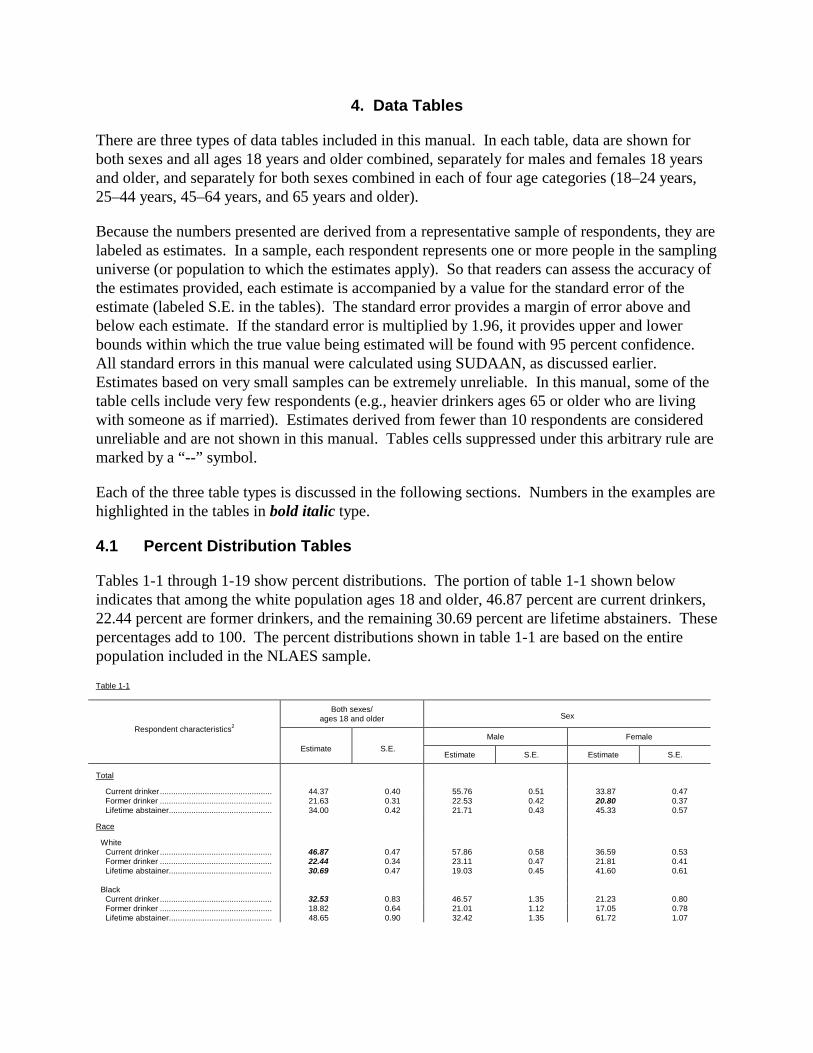
4. Data Tables
There are three types of data tables included in this manual. In each table, data are shown forboth sexes and all ages 18 years and older combined, separately for males and females 18 yearsand older, and separately for both sexes combined in each of four age categories (18–24 years,25–44 years, 45–64 years, and 65 years and older).
Because the numbers presented are derived from a representative sample of respondents, they arelabeled as estimates. In a sample, each respondent represents one or more people in the samplinguniverse (or population to which the estimates apply). So that readers can assess the accuracy ofthe estimates provided, each estimate is accompanied by a value for the standard error of theestimate (labeled S.E. in the tables). The standard error provides a margin of error above andbelow each estimate. If the standard error is multiplied by 1.96, it provides upper and lowerbounds within which the true value being estimated will be found with 95 percent confidence.All standard errors in this manual were calculated using SUDAAN, as discussed earlier.Estimates based on very small samples can be extremely unreliable. In this manual, some of thetable cells include very few respondents (e.g., heavier drinkers ages 65 or older who are livingwith someone as if married). Estimates derived from fewer than 10 respondents are consideredunreliable and are not shown in this manual. Tables cells suppressed under this arbitrary rule aremarked by a “--” symbol.
Each of the three table types is discussed in the following sections. Numbers in the examples arehighlighted in the tables in bold italic type.
4.1 Percent Distribution Tables
Tables 1-1 through 1-19 show percent distributions. The portion of table 1-1 shown belowindicates that among the white population ages 18 and older, 46.87 percent are current drinkers,22.44 percent are former drinkers, and the remaining 30.69 percent are lifetime abstainers. Thesepercentages add to 100. The percent distributions shown in table 1-1 are based on the entirepopulation included in the NLAES sample.
Table 1-1
Both sexes/ages 18 and older Sex
Male FemaleRespondent characteristics2
Estimate S.E.Estimate S.E. Estimate S.E.
Total
Current drinker .................................................. 44.37 0.40 55.76 0.51 33.87 0.47Former drinker .................................................. 21.63 0.31 22.53 0.42 20.80 0.37Lifetime abstainer.............................................. 34.00 0.42 21.71 0.43 45.33 0.57
Race
WhiteCurrent drinker .................................................. 46.87 0.47 57.86 0.58 36.59 0.53Former drinker .................................................. 22.44 0.34 23.11 0.47 21.81 0.41Lifetime abstainer.............................................. 30.69 0.47 19.03 0.45 41.60 0.61
BlackCurrent drinker .................................................. 32.53 0.83 46.57 1.35 21.23 0.80Former drinker .................................................. 18.82 0.64 21.01 1.12 17.05 0.78Lifetime abstainer.............................................. 48.65 0.90 32.42 1.35 61.72 1.07

In a like manner, the portion of table 1-2a shown below indicates that among black currentdrinkers ages 18 and older, 39.53 percent are light drinkers, 36.53 percent are moderate drinkers,and 21.31 percent are heavier drinkers. These percentages add to only 97.37 because for somesmall number of current drinkers drinking level is unknown. The fact that some number ofrespondents in any survey will be unable or unwilling to answer particular questions means thatpercent distributions in this manual will not always add to 100.
Table 1-2a
Both sexes/ages 18 and older Sex
Male FemaleRespondent characteristics3
Estimate S.E.Estimate S.E. Estimate S.E.
Total
Light drinker ...................................................... 43.73 0.44 36.86 0.59 54.18 0.67Moderate drinker............................................... 38.28 0.44 40.53 0.58 34.87 0.61Heavier drinker ................................................. 16.87 0.34 21.45 0.50 9.91 0.39
Race
WhiteLight drinker ...................................................... 43.83 0.47 36.82 0.62 54.19 0.72Moderate drinker............................................... 38.66 0.47 40.93 0.59 35.30 0.67Heavier drinker ................................................. 16.52 0.36 21.22 0.54 9.56 0.39
BlackLight drinker ...................................................... 39.53 1.41 32.01 1.85 52.79 1.97Moderate drinker............................................... 36.53 1.41 39.83 1.97 30.72 1.83Heavier drinker ................................................. 21.31 1.33 25.56 1.72 13.80 1.49
It is important to remember that most of the percent distribution tables in this manual are basedon the group of current drinkers. As noted above, 21.31 percent of black current drinkers ages 18and older are heavier drinkers. This is not the same as saying that 21.31 percent of blacks ages18 and older are heavier drinkers. As shown in table 1-2b, the percent of the black populationages 18 and older who are heavier drinkers is 6.93. The value of 6.93 can be obtained bymultiplying the percent of current drinkers (32.35 from table 1-1) by the percent of heavierdrinkers among current drinkers (21.31 from table 1-2a) and dividing by 100. The percents andstandard errors in table 1-2b can also be calculated by estimating the number of people in eachcell and recalculating the percentages. Section 4.3 describes how to use percent distributiontables in conjunction with population tables (tables 3-1 and 3-2) to calculate estimated numbersof people.

Table 1-2b
Both sexes/ages 18 and older Sex
Male FemaleRespondent characteristics3
Estimate S.E.Estimate S.E. Estimate S.E.
Total
Lifetime abstainer.............................................. 34.00 0.42 21.71 0.43 45.33 0.57Former drinker .................................................. 21.63 0.31 22.53 0.42 20.80 0.37Light drinker ...................................................... 19.41 0.25 20.55 0.38 18.35 0.33Moderate drinker............................................... 16.99 0.26 22.60 0.38 11.81 0.27Heavier drinker ................................................. 7.48 0.17 11.96 0.30 3.36 0.14
Race
WhiteLifetime abstainer.............................................. 30.69 0.47 19.03 0.45 41.60 0.61Former drinker .................................................. 22.44 0.34 23.11 0.47 21.81 0.41Light drinker ...................................................... 20.54 0.29 21.30 0.42 19.83 0.38Moderate drinker............................................... 18.12 0.29 23.68 0.41 12.92 0.32Heavier drinker ................................................. 7.74 0.19 12.28 0.34 3.50 0.15
BlackLifetime abstainer.............................................. 48.65 0.90 32.42 1.35 61.72 1.07Former drinker .................................................. 18.82 0.64 21.01 1.12 17.05 0.78Light drinker ...................................................... 12.86 0.56 14.91 1.00 11.21 0.58Moderate drinker............................................... 11.89 0.53 18.55 0.99 6.52 0.46Heavier drinker ................................................. 6.93 0.48 11.90 0.89 2.93 0.34
4.2 Health Condition Rates Tables
Tables 2-1 through 2-19 show rates per 1,000 population for selected past-year health conditions.In the portion of table 2-1 shown below, the rate for arthritis, osteoporosis, or any other joint orbone disease among women who are former drinkers is 108.7. This means that for every 1,000women 18 years or older in the contiguous United States who are former drinkers 108.7 (or 10.87percent) reported having that condition in the past year. The portion of table 2-2 (also shownbelow) indicates that 110.0 of every 1,000 women who are light drinkers reported having thathealth condition in the past year.
Table 2-1
Both sexes/ages 18 and older Sex
Male FemaleDrinking status and health condition
Estimate S.E.Estimate S.E. Estimate S.E.
Former drinker
Enlarged liver, yellow jaundice, cirrhosis,hepatitis or other liver disease ...................... 4.4 0.5 5.2 0.7 3.2 0.6
Emphysema ...................................................... 5.0 0.6 6.1 0.9 3.2 0.8Arthritis, osteoporosis or any other joint or
bone disease................................................. 87.2 2.5 73.1 2.9 108.7 4.3

Table 2-2
Both sexes/ages 18 and older Sex
Male FemaleUsual drinking level and health condition
Estimate S.E.Estimate S.E. Estimate S.E.
Light drinker
Enlarged liver, yellow jaundice, cirrhosis,hepatitis or other liver disease ...................... 3.2 0.7 3.7 1.1 2.7 0.8
Emphysema ...................................................... 3.8 0.7 5.4 1.4 2.1 0.6Arthritis, osteoporosis or any other joint or
bone disease................................................. 93.5 4.0 77.6 5.0 110.0 5.7
In the health-condition rates tables, respondents who were unwilling or unable to respond tospecific conditions were counted with those who said they did not experience a particular healthcondition.
4.3 Population Tables
Tables 3-1 and 3-2 show the populations (in thousands) to which the percent distribution and rateestimates in the earlier tables apply. Table 3-1 presents the total population of the contiguousUnited States ages 18 years and older and table 3-2 shows the portion of this population whowere current drinkers at the time the NLAES was conducted. Portions of each of these tables arereproduced below. Data in the population tables can be used in conjunction with percentdistribution tables and health-condition rates tables to provide estimates of the number of peoplein each cell of these types of tables.
As shown earlier in table 1-1, 30.69 percent of white men and women ages 18 years and olderwere lifetime abstainers in 1992. Table 3-1 indicates that the overall population for this cell was153,954 thousand. This means that there were an estimated 47,248 thousand lifetime abstainerswhen the NLAES was conducted. Table 1-2a shows that 21.31 percent of black current drinkersages 18 years and older were heavier drinkers. With an estimated 6,909 thousand black currentdrinkers ages 18 years and older (as shown in table 3-2), the estimated number of heavierdrinkers for this group is 1,472 thousand.
Table 3-1
Both sexes/ages 18 and older Sex
Male FemaleRespondent characteristics1
Estimate S.E.Estimate S.E. Estimate S.E.
Total ...................................................................... 185,844 1,548 89,172 1,020 96,672 887
Race
White................................................................. 153,954 1,484 74,411 918 79,543 859Black ................................................................. 21,237 697 9,472 407 11,765 381American Indian/Alaska Native ......................... 1,433 164 667 86 766 121Asian/Pacific Islander ....................................... 5,540 267 2,860 177 2,680 154

Table 3-2
Both sexes/ages 18 and older Sex
Male FemaleRespondent characteristics1
Estimate S.E.Estimate S.E. Estimate S.E.
Total ...................................................................... 82,464 1,111 49,723 764 32,741 565
Race
White................................................................. 72,153 1,045 43,051 709 29,101 532Black ................................................................. 6,909 276 4,411 222 2,498 110American Indian/Alaska Native ......................... 600 89 345 69 255 63Asian/Pacific Islander ....................................... 1,351 110 982 91 369 53
The population estimates in tables 3-1 and 3-2 can be used in a similar way with the health-condition rates in tables 2-1 through 2-19. As mentioned above, the rate per 1,000 population forformer drinkers who were women 18 years and older with past-year arthritis, osteoporosis, or anyother joint or bone disease was 108.7 (from table 2-1). Multiplying this rate by the percent offemale former drinkers (20.80 from table 1-1) and the number of thousands of women in this agegroup (96,672 from table 3-1) provides an estimate of 2,186 thousand persons with this conditionamong female former drinkers.
A similar calculation using data from table 2-2 (110.0 per 1,000 population of current light-drinking females with arthritis, osteoporosis, or any other joint or bone disease), table 3-2(32,741 thousand women who were current drinkers at the time of the NLAES), and table 1-2a(54.18 percent of the current female drinkers who were light drinkers) yields an estimate that1,951 thousand women who were light drinkers had some joint or bone disease in the year priorto the survey.

5. References
American Psychiatric Association (APA). Diagnostic and Statistical Manual of MentalDisorders, Fourth Edition. Washington, DC: APA, 1994.
Distilled Spirits Council of the United States (DISCUS). Annual Statistical Review 1984/1985.Washington, D.C.: DISCUS, 1985.
Grant, B.F., Harford, T.C., Dawson, D.A., Chou, P., Dufour, M.C., and Pickering, R. Prevalenceof DSM-IV Alcohol Abuse and Dependence, United States, 1992. Alcohol Health &Research World, 18(3):243–248, 1994.
Kling, W. Measurement of ethanol consumed in distilled spirits. Journal of Studies on Alcohol,50(5):456–460, 1989.
Kling, W. Measurement of ethanol consumed in distilled spirits: Revision. Journal of Studies onAlcohol, 52(5):503–504, 1991.
Massey, J.T., Parsons, V.L., and Tadros, W. Design and estimation for the National HealthInterview Survey, 1985–1994. Vital and Health Statistics Report Series 2(110).Hyattsville, MD: National Center for Health Statistics, 1989.
Modern Brewery Age. Beer analysis. Modern Brewery Age, 43(37):52–53, 1992.
Research Triangle Institute (RTI). Software for Survey Data Analyses (SUDAAN) Version 6.30.Research Triangle Park, NC: RTI, 1994.
Turner, C. How much alcohol is in a “standard drink”?: An analysis of 125 studies. BritishJournal of Addiction, 85, 1171–1175, 1992.
Williams, G.D., Stinson, F.S., Lane, J.D., Tunson, S.L., and Dufour, M.C. Surveillance Report#39: Apparent Per Capita Alcohol Consumption: National, State, and Regional Trends,1977–94. Rockville, MD: NIAAA, Division of Biometry and Epidemiology, AlcoholEpidemiologic Data System, December 1996.