Embed Size (px)
Citation preview

1
Drawing Contours based on your Field Work
So far you have recorded the data of a piece of land and produced a drawing showing spot heights at
regular grid intervals. While this drawing provides some information about the land it requires some
interpretation.
A contour drawing is prepared based from the grid drawing with the spot heights you prepared
previously. As discussed in the previous chapter a contour drawing allows us to get a quick view of
the “Lay of the land”.
The first step is to determine the contour interval. For a step site the contour interval should be
large e.g. 500mm. For a flatter site the contour interval should be e.g. 200mm.
In our example the highest part of the site is at grid A1 being RL 100.950. The lowest part of the site
is at grid G1 R.L. 100.040. The fall over the site is 910mm. A contour interval of 500mm would be
meaningless as there would only be 1 contour line on the drawing. For this task a contour interval of
200mm would be more suitable.
For this drawing we need to plot the following contour lines,
I. RL 100.800
II. RL 100.600
III. RL 100.400
IV. RL 100. 200

2
Plot Contour Line RL 100.800
If we recall when we set out the grid they were spaced evenly, so on our scaled drawings the
grids should be evenly spaced.
Firstly we need to measure the distance between the grids, we do not need to consider
scale. For the drawing in this example the distance is 50mm between the grids.
Firstly we must identify the grids that the 100.800 contour passes through.
Where the contour passes through a grid point it is quite easy to plot the contour line. At
grid point B1 the measured reduced level is 100.800. The contour line will pass through this
point.
We identified that the contour passes through the grid line between points B2 to C2. To
determine where the 100.800 contour line crosses the grid we must interpolate the
intersection point with the following formula,
Distance is measured from highest spot height to contour measured along the grid.
Contour does not
pass thru these grids
Contour passes thru
grid point B1
Contour passes
between grids
B2 & C2
A2 & A3
B2 & B3

3
To locate the 100.800 contour on the B2 to C2 grid we use the formula in the following
manner.
Distance = 14mm to be measured from grid point B2.
Mark position of the
contour 14mm from
B2 spot height
towards C2

4
We also determined that the contour passes through the grid B2 to B3 so we now
interpolate that grid.
Distance = 15mm
Mark position of the
contour 15mm from
B2 spot height
towards B3

5
We also determined that the contour passes through the grid A2 to A3 so we now
interpolate that grid.
Distance = 33mm
Mark position of the
contour 33mm from
A2 spot height
towards A3

6
If you are unsure what the contour does across the grid you can do the same process
diagonally across the grid. We can interpolate from A2 to B3 across the grid. As it is a
diagonal measurement across the grid the width will change. In this case it will increase to
71mm.
Distance = 42mm
Mark position of the
contour 42mm from
A2 spot height
towards B3
7
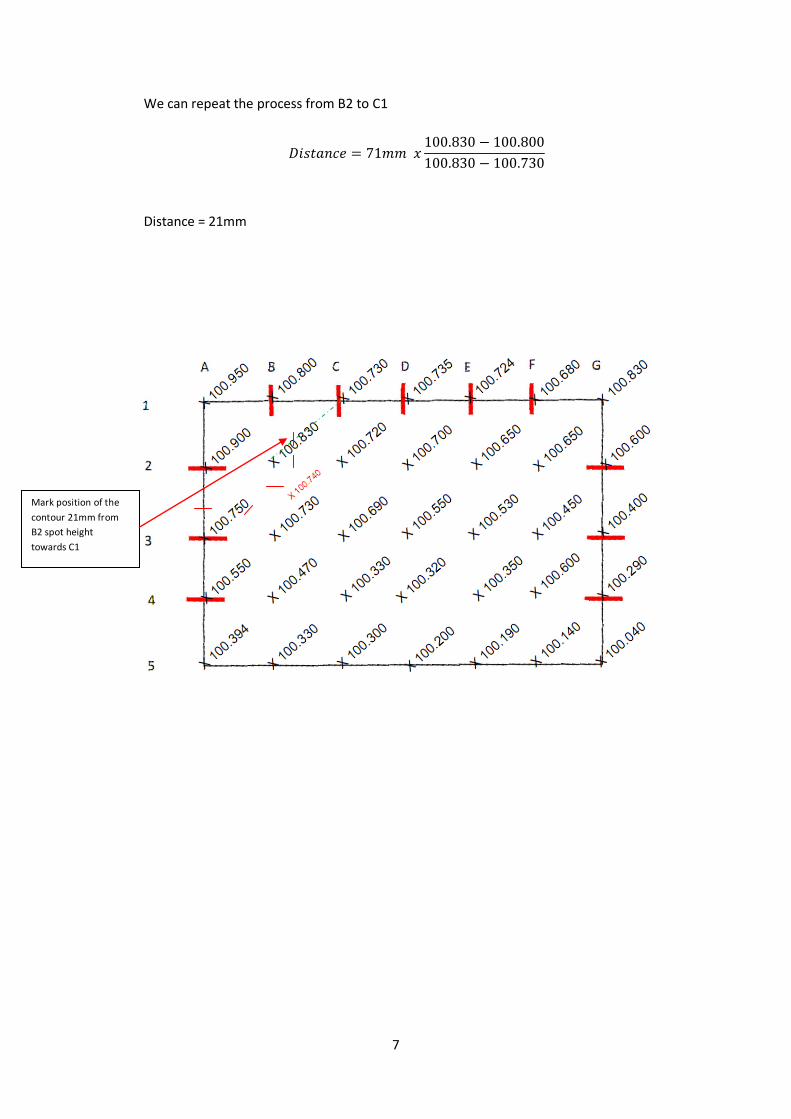
We can repeat the process from B2 to C1
Distance = 21mm
Mark position of the
contour 21mm from
B2 spot height
towards C1

8
You should also interpolate from the grid to items specifically recorded such as trees,
services etc. This is important as these items have been identified as items that may affect
the design. It will be important to measure the ground at this point. You will also need to
alter the grid distance.
Distance = 6mm
Mark position of the
contour 42mm from
A2 spot height
towards B3

9
Once you completed interpolating all the relevant grids you are ready to draw in the
contour. It is simply a matter of joining the dots keeping in mind some rules in relationship
to contour lines.
1. Contour Lines Never Cross each other – Ultimately a point can only have one height.
If contours cross each other it would mean it would have two heights above the
datum which is physically impossible (Remember Contours indicate a height above
the datum).
Contours at a vertical cliff face will sit on top of each other but each point of the cliff
face is a different piece of the land.
2. Contour Lines Never End – Ground will always meander up and down towards
creeks, rivers & sea level. Where the ground falls away a hill is formed and the
contour will join back on itself in a circular fashion.
3. Contour Lines never split – Contours indicate the transition of the ground level
passing through contour interval.
A contour may appear to split, but remember a ridge is formed by 2 sides of a hill
coming together so in fact there are 2 contour lines.

10
When joining the contour points you should curve the lines where appropriate instead of
just using straight lines as in nature it is very rare that straight lines are formed.
Compare against using rounded lines
100.800
Lines are
smoothed to
give a more
realistic fit
100.800
If lines are
not rounded
it still gives a
good
representati
on but it is
not realistic.
11
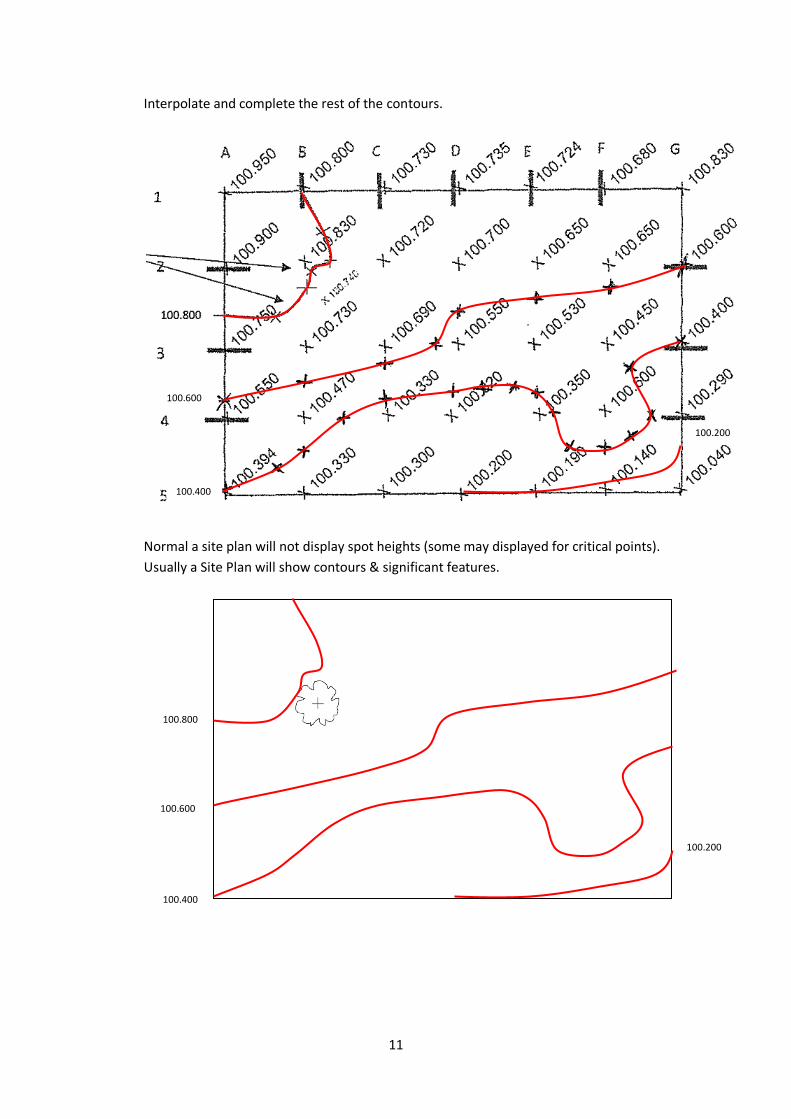
Interpolate and complete the rest of the contours.
Normal a site plan will not display spot heights (some may displayed for critical points).
Usually a Site Plan will show contours & significant features.
100.600
100.400
100.200
100.600
100.400
100.200
100.800

12
Drawing a grid drawing from a contour drawing
In the last section we looked at the situation we look at drawing a contour drawing from your grid
observations. As highlighted it is a useful tool to allow you to conduct feasibility studies.
As builders you may do this a few times but it is more likely you regular encounter with contour lines
will be when you are given drawings to price.
You are likely to be given a site plan to price a project. Contours on the plan will indicate the heights
of the land. From this you will determine the cut and fill requirements and form a price accordingly.
There are 2 methods to determine volumes in relation to earth works,
1. Grid method and sum of squares and
2. Longitude & Cross sections and Simpson’s rule.
In this section will be looking at the grid method.
The Grid Method
This method is simply a reverse of what we did in the lesson above. From the contour drawing we
recreate the grid.
Step 1
On our contoured drawing were place an even grid. Grid size is IMPORTANT. You must use a scale
ruler and select a dimension that is,
1. Relevant- A grid size of 100 metres will be too large and no reliable quantities will be
determined later.
2. Ease – Select a grid size that will make your later calculations easier when you need to do
the volume calculations e.g. uses a grid size of say 10m x 10m instead of 13m x 13m
Draw the grid as described and this time lightly draw in the grid lines.

13
Step 2
Identify grid intersections that the contour lines pass through.
100.600
100.400
100.200
100.800
100.600
100.200
100.800

14
Step 3
Using the following formula interpolate the grid spot heights.
r Contour) x (Distance from Higher Contour to Grid ÷ Distance Between Contours)

15

16