Embed Size (px)
Citation preview

Drainage Asset Management Plan
Ordinary Council Meeting - 24 July 2018 Attachments Attachment 10.2.1.1
City of Kalamunda 279
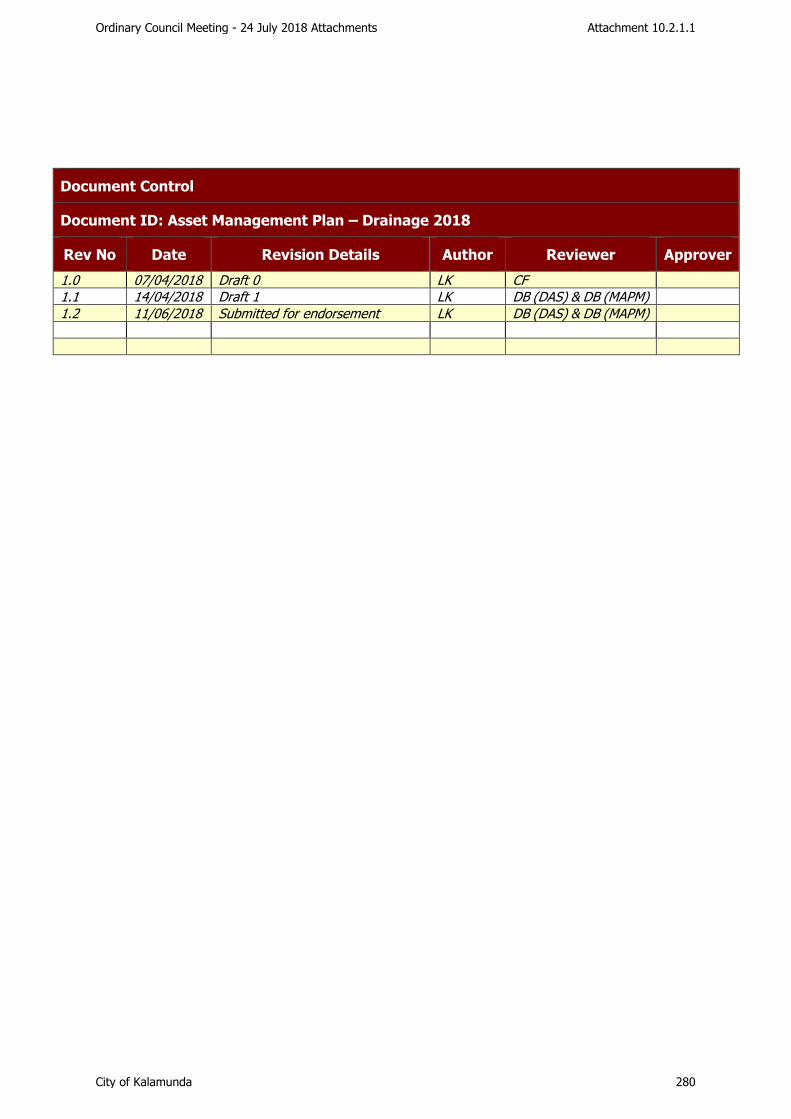
Document Control
Document ID: Asset Management Plan – Drainage 2018
Rev No Date Revision Details Author Reviewer Approver
1.0 07/04/2018 Draft 0 LK CF
1.1 14/04/2018 Draft 1 LK DB (DAS) & DB (MAPM)
1.2 11/06/2018 Submitted for endorsement LK DB (DAS) & DB (MAPM)
Ordinary Council Meeting - 24 July 2018 Attachments Attachment 10.2.1.1
City of Kalamunda 280

City of Kalamunda – Asset Management Plan – Drainage i
Con ten t s
CONTENTS I
LIST OF FIGURES II
LIST OF TABLES II
1. EXECUTIVE SUMMARY ..................................................................................................................... 3
2. INTRODUCTION ................................................................................................................................ 5
3. CURRENT STATUS OF DRAINAGE ASSETS ....................................................................................... 10
4. LEVELS OF SERVICE ......................................................................................................................... 16
5. LIFE CYCLE MANAGEMENT ............................................................................................................. 19
6. RISK MANAGEMENT ...................................................................................................................... 23
7. FUTURE DEMAND .......................................................................................................................... 25
8. FINANCIAL SUMMARY ................................................................................................................... 26
9. IMPROVEMENTS, MONITORING AND REVIEW ............................................................................... 32
REFERENCES ....................................................................................................................................... 33
GLOSSARY ....................................................................................................................................... 34
APPENDIX A: ASSET INFORMATION SUMMARY ............................................................................................. 38
APPENDIX B: CONDITION RATING METHODOLOGY ........................................................................................ 46
APPENDIX C: ASSET LEVELS OF SERVICE CONSULTATION AND ENGAGEMENT RESULTS ................................. 48
APPENDIX D: POPULATION FORECASTS.......................................................................................................... 52
APPENDIX E: STORMWATER MANAGEMENT PLAN ........................................................................................ 53
APPENDIX F: THE CITY OF KALAMUNDA ASSET MANAGEMENT PRACTICES .................................................... 54
Ordinary Council Meeting - 24 July 2018 Attachments Attachment 10.2.1.1
City of Kalamunda 281

ii City of Kalamunda – Drainage Asset Management Plan
L i s t o f F i gu re s
Figure 1: Typical urban stormwater system ................................................................................ 6 Figure 2: Categories within drainage assets ............................................................................... 7 Figure 3: Age profile of drains ................................................................................................. 10 Figure 4: Age profile of pits .................................................................................................... 11 Figure 5: Age profile of Basins ................................................................................................ 11 Figure 6: Expected Condition profile of drains .......................................................................... 12 Figure 7: Expected condition profile of pits .............................................................................. 13 Figure 8: Expected condition profile of constructed Basins ......................................................... 14 Figure 9: 2016 Community survey outcome summary for stormwater drainage ........................... 17 Figure 10: Asset Life Cycle ..................................................................................................... 19 Figure 11: Maintenance requests 2009 to 2016 by year ............................................................ 22 Figure 12: Maintenance requests 2009 to 2016 by month ......................................................... 22 Figure 13: Current drainage asset funding levels ...................................................................... 29 Figure 14: Comparison of renewal funding scenarios ................................................................ 31
L i s t o f Tab l e s
Table 1: Drainage asset summary ............................................................................................. 3 Table 2: Current funding for drainage assets 2018 – 2028 .......................................................... 3 Table 3: Drainage asset category details .................................................................................... 7 Table 4: Legislation and regulations related to drainage asset management ................................. 8 Table 5: Data confidence levels of Drainage AMP ....................................................................... 9 Table 6: Average age of drainage asset categories ................................................................... 10 Table 7: Average estimated condition of drainage asset categories ............................................ 12 Table 8: Drainage levels of service responses........................................................................... 17 Table 9: Drainage asset life cycle activities .............................................................................. 19 Table 10: Customer requests per suburb ................................................................................. 21 Table 11: Drainage assets risk assessment .............................................................................. 23 Table 12: Drainage assets demand factors ............................................................................... 25 Table 13: Drainage asset valuation results as at 30/06/2017 ..................................................... 26 Table 14: Key performance indicators ...................................................................................... 26 Table 15: Current Long Term Financial Plan allocations for drainage assets ................................ 28 Table 16: Drainage assets predictive modelling scenarios for renewal ........................................ 30 Table 17: Asset management improvement plan for drainage assets .......................................... 32
Ordinary Council Meeting - 24 July 2018 Attachments Attachment 10.2.1.1
City of Kalamunda 282

City of Kalamunda – Asset Management Plan – Drainage 3
1 . EXECUTIVE SUMMARY
1.1 Current Services and Costs
The City of Kalamunda (the City) has an extensive network of drainage assets for the safe
collection, conveyance and discharge of stormwater. These drainage assets are reported in the
following three categories:
• Drain - an underground pipe, culvert or lined open channel carrying stormwater,
• Pit - an inlet, outlet or a manhole where two or more pipes meet (junction pits), and
• Basin - a constructed or improved land area used to detain and / or retain stormwater.
The quantity, cost, value, condition and age details of these drainage assets are summarised in
Table 1:
Table 1: Drainage asset summary
Drainage
Asset Category
Quantity
Total
Replacement
Cost $,000 (as at
30/06/17)
Written Down Value
$,000 (as at
30/06/17)
Expected Condition
(1 – Excellent,
5 – Very Poor)
Average
Age (years)
Drains 220 km 69,615 13,238 1.9 22
Pits 15,708 pits 13,999 3,026 2.5 31
Basins 195,817 m2
(86 basins) 3,975 993 1.7 20
All
Categories
87,589 17,257 2.0 24
Note: Only 56% of the total Drains asset data has been collected to date. The above Total
Replacement Cost for Drains includes a management value for the 44% of Drain assets not yet
collected.
Funds currently allocated for new, renewal and maintenance of all drainage assets in the 2018
– 2028 Long Term Financial Plan (LTFP) are summarised in Table 2:
Table 2: Current funding for drainage assets 2018 – 2028
New ($,000) Renewals ($,000) Maintenance ($,000)
4,699 6,280 24,163
In the City’s 2016 Community Satisfaction Survey, 87% of respondents stated that they are
satisfied with the service provided by the City’s stormwater drainage assets.
The City also conducted a Community Assets Levels of Service survey in 2018 to understand
the expectations of residents. Generally, three quarters of respondents agreed that the City’s
drainage assets are working to an acceptable level.
Ordinary Council Meeting - 24 July 2018 Attachments Attachment 10.2.1.1
City of Kalamunda 283

4 City of Kalamunda – Drainage Asset Management Plan
The City, in the past, has identified specific drainage issues in several areas through engineering
flood studies and customer requests for works. These issues are being managed through
increased maintenance activities, asset upgrades and the installation of new assets.
1.2 Future Challenges
The key challenges in the future for the City in providing and maintaining drainage assets in
order to maintain current levels of service include:
• Providing adequate and sustainable assets for incremental development and subdivision
works, mainly in the foothills suburbs.
• Maintaining, replacing and upgrading of older drainage assets, mainly in hills suburbs.
• Provide adequate resilience and capacity for weather patterns and events arising from
climate change.
1.3 Recommendations
The financial predictive modelling for the renewal of drainage assets using current asset data
and maintaining current average condition indicates that an additional average renewal funding
of $265,200 per annum will be needed over the next 10 years.
Based on the confidence level of current data, it is considered premature to request additional
renewal funding at this stage and that funding for drainage assets renewals be maintained at
current levels.
The following key tasks are recommended to improve the City’s Drainage Asset Management:
• Development of a City wide Stormwater Management Plan (SMP) to identify actions for
better management of stormwater and to estimate current and future drainage
infrastructure needs.
• Completion of the Drains asset register by collecting and mapping of all individual
underground pipes and open channels and to conduct visual assessment to determine
the asset condition rating.
• Develop a Stormwater Maintenance Management Plan (SMMP) incorporating asset
criticality and risk.
Ordinary Council Meeting - 24 July 2018 Attachments Attachment 10.2.1.1
City of Kalamunda 284

City of Kalamunda – Asset Management Plan – Drainage 5
2 . INTRODUCTION
2.1 Background
The City has an Asset Management Policy that requires the creation of Asset Management Plans
for each asset class. This Asset Management Plan (AMP) for the drainage asset class is the first
major review from the original plan written in 2013.
The City is responsible for managing, operating and maintaining the infrastructure asset classes
for roads, pathways, drainage, parks, plant and equipment and buildings.
Asset Management Plans are developed for each asset class for the following purposes:
• Sustainable management of assets for the community,
• Provide input into the Long Term Financial Plan,
• Document existing practices and identify opportunities for improvement,
• Meet legislative and reporting requirements,
• Support business cases and funding applications, and
• Support community and organisational needs.
This document is to be read in conjunction with the following City documents:
• Asset Management Council Policy (Policy C-ASS01)
• Asset Management Strategy 2017 - 2021
• Strategic Community Plan 2017 - 2027 – “Kalamunda Advancing”
• Long Term Financial Plan to 2023 – “Kalamunda Accountable”
• Corporate Business Plan 2017 -2021 - “Kalamunda Achieving”
• Community Engagement Strategy 2017 – “Kalamunda Engages”
• 2016 Community Scorecard
• 2018 Asset Levels of Service Survey Community Engagement Results
• Stormwater Design Guidelines for Subdivisional and Property Development
• IPWEA, 2016. Local Government Guidelines for Subdivisional Development (Edition 2.3) –
This document has been adopted by the City as its guideline for subdivisional
developments.
A summary of the City’s current Asset Management practices are detailed in Appendix F.
Ordinary Council Meeting - 24 July 2018 Attachments Attachment 10.2.1.1
City of Kalamunda 285

6 City of Kalamunda – Drainage Asset Management Plan
2.2 Typical Urban Stormwater Drainage System
A typical urban stormwater system is shown in Figure 1:
Figure 1: Typical urban stormwater system
Source: Adapted from Monash University
2.3 Scope
This Drainage AMP addresses assets constructed for the purpose of safe collection, conveyance
and discharge of stormwater. The following drainage assets which are not a responsibility of
the City are excluded from this AMP:
• Pits and pipes located within private properties
• Pits and pipes located within road reserves of private roads and Main Roads WA roads
• Open channels and drains that belong to the Water Corporation
• Headwalls and pipes for crossover access to private properties in rural areas.
The management and monitoring activities of natural waterways within the City are also
excluded from this AMP. The City’s responsibilities for some drainage easements within private
properties for underground pipes and natural waterways may need clarification but do not
impact on this AMP.
[Grab your reader’s attention with a
great quote from the document or use
this space to emphasize a key point.
To place this text box anywhere on
the page, just drag it.] Basin
Junction pit
Inlet pits
Underground Pipes
Ordinary Council Meeting - 24 July 2018 Attachments Attachment 10.2.1.1
City of Kalamunda 286

City of Kalamunda – Asset Management Plan – Drainage 7
All constructed drainage assets are assigned into three groups and their related inventory and
financial data is recorded within the City’s corporate asset management system Assetic myData
(Figure 2 and Table 3). Further details of each asset category can be found in Appendix A.
Figure 2: Categories within drainage assets
Table 3: Drainage asset category details
Asset Category (standard
category name in Assetic myData)
Asset Details
Total Measure
(as recorded at 31/03/2018)
Data collection
status
Drains
(Stormwater Drains)
Underground pipes, culverts and
constructed open channels carrying stormwater.
220 km
56%
collected to date
Pits
(Stormwater Pits)
Pit asset portfolio is consist of
stormwater inlets (e.g. side entry pits),
locations where two or more pipes meet (junction pits) and stormwater
outlets (e.g. head wall).
15,708 pits Completed
Basins
(Lagoons)
Basin assets are defined as constructed
or improved (formed) land area used to detain and / or retain stormwater.
It should be noted that any water or
vegetation present within a basin is not a part of the basin infrastructure asset.
Also the value of a basin does not include the value of the land.
195,817 m2
(86 Basins) Completed
2.4 Alignment to Strategic Planning
The Drainage AMP is aligned with the following objectives and strategies of the City’s Kalamunda
Advancing: Strategic Community Plan 2017 -2027 (Shire of Kalamunda (a), 2017) as adopted
by the Council on 26th June 2017.
• Objective 1.2 - To provide safe and healthy environments for community to enjoy
▪ Strategy 1.2.1 – Facilitate a safe community environment
• Objective 3.2 – To connect community to quality amenities
▪ Strategy 3.2.1 – Optimal management of assets
Drainage Assets
Drains Pits Basins
Ordinary Council Meeting - 24 July 2018 Attachments Attachment 10.2.1.1
City of Kalamunda 287

8 City of Kalamunda – Drainage Asset Management Plan
2.5 Legislative Requirements
The City has to meet the requirements of various Federal and State legislation and regulations when constructing and maintaining infrastructure assets. The main legislation and regulations are detailed in Table 4:
Table 4: Legislation and regulations related to drainage asset management
Legislation Requirement
Local Government
Act, 1995 (WA)
The Act provides the principal legislative framework around which the roles, purpose, responsibilities and power of local government as set out. Under the
Act, regulations set out a minimum requirement for all WA local governments
to develop and maintain a Strategic Community Plan and Corporate Business Plan. This compels the local governments to establish long term service and
asset strategies through robust asset management practices.
Local Government
(Drainage
Management) Amendment Act
2007
Establishes the Drainage Management Authority which facilitates and
coordinates drainage management planning in councils.
Rights in Water and
Irrigation Act 1914)
Provides the statutory basis for planning and allocation of water in WA. The
objectives of the legislation include providing for the management, sustainable
use and development of water resources to meet the needs of current and future users, and for the protection of their ecosystems and the environment
in which water resources are situated.
Environment Protection Act 1986
(WA)
The Environmental Protection Act 1986 provides for the formation of the Environmental Protection Authority (EPA). It also provides for the prevention,
control and abatement of pollution and environmental harm and for the conservation, preservation, protection, enhancement and management of the
environment.
Planning and Development Act
2005
Provides an efficient system of land use planning and development in WA,
which promotes sustainable use.
Occupational Safety & Health Act 1984
and Regulations
1996
The Occupational Health and Safety Act is concerned with protecting the safety,
health and welfare of people engaged in work or employment.
Conservation and
Land Management
Act 1984
Regulations and requirements that the City must comply with in relating to the
use of land and vegetation.
Health Act 1911 Discharging causing pollution to waterways.
Wildlife Conservation Act
1950
Provides for the conservation and protection of native flora and fauna.
Ordinary Council Meeting - 24 July 2018 Attachments Attachment 10.2.1.1
City of Kalamunda 288

City of Kalamunda – Asset Management Plan – Drainage 9
Other Standards
and Regulations
Other relevant legal requirements include, but are not limited to:
• Local water management plans
• Contaminated Sites Act 2003 and Regulations 2006
• Agricultural & Related Resources Protection Act 1976
• All other relevant State and Federal Acts & Regulations
• All Local Laws and relevant policies of the organization
2.6 Asset Management Plan Framework
Key elements of this Drainage AMP are:
• Current Status of Assets – describes current condition and age profile of drainage assets.
• Levels of service – specifies the levels of service to be provided by drainage assets.
• Future demand – how this will impact on future service delivery.
• Life cycle management – summary on how the City manages its existing and future drainage
assets to provide the required services.
• Financial summary – what funds are required to provide the required services.
• Asset management improvement plan – key recommendations to improve City’s drainage
asset management processes.
2.7 Data Confidence
A qualitative assessment of the City’s overall confidence of the data used in this Drainage AMP is shown in Table 5. Table 5: Data confidence levels of Drainage AMP
Data Set
Confidence Level
(1- Certain - (5- Doubtful)
Comments
Asset age 3 Age of some assets has been assumed to be similar to the surrounding road pavement age
Asset condition 4 Condition is estimated based on asset age. Refer to Appendix B Condition Rating Methodology.
Asset inventory completeness (inclusion of all assets)
4 Inventory for Pits and Basins are completed. Underground pipe network 56% completed.
Asset inventory accuracy (dimensions, material, invert
levels, depths etc.)
3 No separate assessment or verification carried out
so far. Contains many estimated values
Replacement costs 3 As per the fair value valuation using industry
standards
Useful lives 3 As per the fair value valuation using industry
standards
Ordinary Council Meeting - 24 July 2018 Attachments Attachment 10.2.1.1
City of Kalamunda 289

10 City of Kalamunda – Drainage Asset Management Plan
3 . CURRENT STATUS OF DRAINAGE ASSETS
3.1 Age Profile
The average estimated age of each drainage asset category based on City’s asset register as at 31 May 2018 are summarised in Table 6:
Table 6: Average age of drainage asset categories
Asset Category Average Age (years)
Drains 22
Pits 31
Basins 20
All Asset Categories 24
The age of individual drainage assets have been assumed to be of similar age to the surrounding
road pavement age. As drainage assets are considered to be long life assets typically 80 years
plus, any inaccuracy in the age data will have minimal impact on this Drainage AMP.
The age distribution of each drainage asset category by suburb is shown graphically in Figures
3, 4 and 5.
Figure 3: Age profile of drains
0
10
20
30
40
50
60
70
80
90
<= 10 >10 to <= 20 >20 to <= 30 >30 to <= 40 >40
Len
gth
(km
)
Age (years)
Age Profile - Drains
FORRESTFIELD HIGH WYCOMBE WATTLE GROVE LESMURDIE MAIDA VALE KALAMUNDA OTHER
Ordinary Council Meeting - 24 July 2018 Attachments Attachment 10.2.1.1
City of Kalamunda 290

City of Kalamunda – Asset Management Plan – Drainage 11
Figure 4: Age profile of pits
Figure 5: Age profile of Basins
0
1000
2000
3000
4000
5000
6000
<= 10 >10 to <= 20 >20 to <= 30 >30 to <= 40 >40
No
. of
pit
s
Age (years)
Age Profile - Pits
FORRESTFIELD HIGH WYCOMBE LESMURDIE WATTLE GROVE
KALAMUNDA MAIDA VALE GOOSEBERRY HILL OTHER
0
20
40
60
80
100
120
140
<= 10 >10 to <= 20 >20 to <= 30 >30 to <= 40 >40
Surf
ace
area
(sq
. m ,0
00
)
Age (years)
Age Profile - Basins
FORRESTFIELD HIGH WYCOMBE WATTLE GROVE MAIDA VALE KALAMUNDA WALLISTON OTHER
Ordinary Council Meeting - 24 July 2018 Attachments Attachment 10.2.1.1
City of Kalamunda 291

12 City of Kalamunda – Drainage Asset Management Plan
The need for the additional basin capacity will be required within certain catchments due to an
increase in impervious areas (e.g. roofs, paving, and roads) as a result of higher density
residential and industrial development. This is evident in Figure 5 as the majority of the Basins
have been constructed in the last 20 years within the densely populated suburbs of Forrestfield,
High Wycombe and Wattle Grove.
3.2 Condition Profile
The condition of drainage assets has been estimated based on the age of the assets. The
methodology of condition relative to age is detailed in Appendix B.
Table 7: Average estimated condition of drainage asset categories
Asset Category Average Condition
(1 – Excellent, 5 – Very Poor)
Drains 1.9
Pits 2.5
Basins 1.7
All Asset Categories 2.0
The derived condition profile of each asset category in the City by suburb are shown in Figures
6, 7 and 8.
Figure 6: Expected Condition profile of drains
0
20
40
60
80
100
120
1 2 3 4 5
Pip
e le
ngt
h (
km)
Condition Rating
Condition Profile - Drains
FORRESTFIELD HIGH WYCOMBE WATTLE GROVE LESMURDIE
MAIDA VALE KALAMUNDA GOOSEBERRY HILL OTHER
Ordinary Council Meeting - 24 July 2018 Attachments Attachment 10.2.1.1
City of Kalamunda 292

City of Kalamunda – Asset Management Plan – Drainage 13
Most Drain assets currently in the register are recorded as being constructed more recently and
given their long useful life, their condition profile is mostly consistent with Condition 1 and 2
assets. Asset in Condition 2 are expected to have approximately 61% - 80% of its useful life
remaining.
Figure 7: Expected condition profile of pits
The condition profile of pits represents a reliable distribution of assets, where 15% and 5% of
assets are expected to be in Condition 4 and 5 respectively. As the oldest urban area of the
City, the suburb of Kalamunda is expected to have assets with the poorest condition.
One of the key recommendation of this AMP is to conduct condition assessment of a
representative drainage asset sample. It is further recommended that to prioritize the condition
assessment of assets with expected Condition Rating of 4 and 5 to verify the accuracy of this
condition profile.
Large number of pit assets with expected conditions of 1 and 2 is a result of most assets being
constructed in recent years with increased subdivision developments.
0
500
1000
1500
2000
2500
3000
3500
4000
4500
5000
1 2 3 4 5
No
. of
pit
s
Condition Rating
Condition Profile - Pits
FORRESTFIELD HIGH WYCOMBE LESMURDIE WATTLE GROVE
KALAMUNDA MAIDA VALE GOOSEBERRY HILL OTHER
Ordinary Council Meeting - 24 July 2018 Attachments Attachment 10.2.1.1
City of Kalamunda 293

14 City of Kalamunda – Drainage Asset Management Plan
Figure 8: Expected condition profile of constructed Basins
98% of the Basins are constructed by improving the natural ground or by using clay (Refer to
Basin Material graph in Appendix A). They are considered to have an indefinite useful life
provided that routine maintenance work (e.g. vegetation control, debris removal) is carried out
in a timely manner. Therefore, as per the condition matrix (Appendix B), a single condition
rating cannot be determined for those Basins. Only 10 individual Basins shown in Figure 8 above
are constructed using engineering materials (either polyethylene resin, limestone blocks or
concrete). The basin in Condition 4 is the concrete lined basin within Stirk Park and is listed in
the LTFP for upgrading in 2018/19.
3.3 Conclusions and Recommendations
The key recommendation pertaining to this section of the AMP is to collect data and map all
drains to complete the Drains asset register. Also it is recommended to conduct condition
assessment of a representative sample of assets. Both these recommendations involves
extensive works with a likely project duration of two years and a significant cost. The key tasks
of this project are:
1. Review historical drainage records (e.g. subdivision plans), and convert into digital data
formats and export in into Asset Management and Geographical Information System (GIS)
systems.
0
200
400
600
800
1000
1200
1 2 3 4 5
Surf
ace
area
(sq
.m)
Condition Rating
Condition Profile - Basins (constructed)
HIGH WYCOMBE KALAMUNDA WATTLE GROVE OTHER
Ordinary Council Meeting - 24 July 2018 Attachments Attachment 10.2.1.1
City of Kalamunda 294

City of Kalamunda – Asset Management Plan – Drainage 15
2. Collection of pipe inventory data (e.g. material, diameter, invert levels etc.) Opening of pit
lids involves significant manual handling effort and is time consuming due to the weight of
each lid and working adjacent to or in traffic. There are currently 15,708 pits throughout the
City’s drainage network. The most safe and efficient method of delivery will need to be
determine considering available in-house resources and / or funding for outsourcing.
3. Select a representative and statistically valid sample of drains and pits for condition
assessment considering different attributes such as age, location, material, criticality
(Section 6.1) etc. This task can be conducted together with task 2 above.
Ordinary Council Meeting - 24 July 2018 Attachments Attachment 10.2.1.1
City of Kalamunda 295

16 City of Kalamunda – Drainage Asset Management Plan
4 . LEVELS OF SERVICE
The level of service is the outcome received by users of a particular service which provides the basis
for all life cycle management activities. The International Infrastructure Management Manual (IPWEA,
2015) defines the level of service as “the parameters or combination of parameters that reflect social,
political, economic and environmental outcomes that the organization delivers”.
Community Levels of Service relate to how the community perceives the service in terms of safety,
quality, quantity, reliability, responsiveness, cost / efficiency, accessibility and legislative compliance.
Supporting the Community Levels of Service are operational or technical measures of performance
(Technical Levels of Service), which are developed to ensure that the minimum community levels of
service are met. These technical measures relate to service criteria such as quality, availability and
safety.
To deliver acceptable service standards for the drainage assets, the City needs to have a commitment
to annual funding. These funds provide for the regular maintenance, upgrade and timely replacement
or renewal of assets. The community is directly impacted if the assets are not maintained and renewed
at the accepted service levels.
The following two sections detail the City’s endeavours to gain an understanding of community’s
expectations of levels of service for drainage assets.
4.1 Community Scorecard 2016
In 2016, the City commissioned Catalyse Pvt Ltd. to conduct a community survey to evaluate community
priorities and measure City’s performance against key indicators in the Strategic Community Plan. The
outcomes of this survey can be considered as an indicator for community satisfaction of current levels
of service.
Figure 9 shows the summary of outcomes related to stormwater drainage (Catalyse Pty Ltd, May 2016).
87% of the respondents indicate a positive performance (excellent, good or okay) by the City in this
category. However, the Performance Index Score is below that average for other Western Australian
Councils, and the survey participants in non-built up areas have indicated a lower performance rating.
Ordinary Council Meeting - 24 July 2018 Attachments Attachment 10.2.1.1
City of Kalamunda 296

City of Kalamunda – Asset Management Plan – Drainage 17
Figure 9: 2016 Community survey outcome summary for stormwater drainage
4.2 Asset Levels of Service Consultation Results
In 2018, the City conducted a community asset level of service consultation through hard copy, online
questionnaire and community workshops. Details of the survey methodology and results can be found
in the Appendix C.
Table 8 details the percentages of respondents agreeing and disagreeing to various statements related
to the City’s drainage assets.
Table 8: Drainage levels of service responses
Statement %
Agreed
%
Disagreed
% Unsure/
no answer
Drainage pits, kerb and channels (on the side of the
road) are working to an acceptable level 64 26 10
Stormwater drainage flows where it should (through drain pipes, and along waterways and creeks).
60 26 14
The amount of water running onto and through
properties from storms is acceptable 58 18 24
The quality of the water in the drainage system is acceptable, for protecting the natural environment
46 8 46
Mosquitos are a problem where I live 44 50 6
Ordinary Council Meeting - 24 July 2018 Attachments Attachment 10.2.1.1
City of Kalamunda 297

18 City of Kalamunda – Drainage Asset Management Plan
Respondents were asked to allocate the City’s budgets for maintenance, renewals, and upgrade of all
major infrastructure asset classes (roads, footpaths, drainage, parks and buildings). In this question,
drainage scored the lowest priority. Respondents suggested spending on average only 14.9% of the
total budget for these asset classes on drainage.
It is also worth noting that despite the apparent concerns with drainage, no supporting comments or
specific problem sites were provided on drainage.
More than a quarter of survey respondents disagreed that the City’s drainage assets are working to an
acceptable level and that stormwater flows where it should and about one fifth believed that the amount
of water running onto and through properties from storms is unacceptable. The survey also provides
insight that the community may be unaware of the water quality matters (ie: almost half of respondents
were either unsure or did not provide an answer). Also, 44% of survey respondents indicated that
mosquitoes are a problem for them.
4.3 Conclusions and Recommendations
Some of the Asset Level of Service consultation responses indicated the possible need for increased
maintenance and asset upgrade works. To quantify these requirements and to propose suitable actions,
this Drainage AMP recommends developing a Stormwater Management Plan (SMP) for the City. Details
of a typical SMP can be found in Appendix E. The outcome of the SMP can be then used to develop
technical levels of service for the next revision of the Drainage AMP.
The initial consultation process is inconclusive in terms of understanding community’s willingness to
pay for increased level of service. Therefore, it is recommended to conduct a more detailed consultation
for the next revision of this AMP. The consultation will include a detailed analysis to establish the
relationship between various drainage service levels and associated costs. The consultation will also
form part of the SMP, being developed through 2018 to 2020.
Ordinary Council Meeting - 24 July 2018 Attachments Attachment 10.2.1.1
City of Kalamunda 298

City of Kalamunda – Asset Management Plan – Drainage 19
5 . L IFE CYCLE MANAGEMENT
Drainage assets are either gifted by the developers in new subdivisions or built by the City to address
specific Stormwater drainage system deficiencies. These assets are operated and maintained by the
City throughout their useful life and their performance and condition are monitored to ensure that they
deliver a satisfactory service to the community at an appropriate cost.
The ability to meet the defined levels of service is determined, in part, by how these assets are managed
through their useful life. When assets do not perform as required, they are renewed, upgraded or
disposed of. The recurrent maintenance works, the capital works of renewals and upgrades, and the
one-off creations and disposal work form part of the activities required to provide a satisfactory level
of service.
Figure 10: Asset Life Cycle (Source: IPWEA, 2015)
A summary of various activities undertaken during the life of drainage assets are detailed in the Table
9 below.
Table 9: Drainage asset life cycle activities
Creation/
Acquisition
Significant new drainage assets are generally gifted by private parties through subdivision
developments. The standard that guides the creation of drainage assets in the City is the
Local Government Guidelines for Subdivisional Development (IPWEA, 2016).
The City’s new Stormwater Design Guidelines for Subdivisional and Property Developments
(City of Kalamunda, 2018) for residential, commercial, and industrial developments will
manage the asset creation process for infill land developments.
Drainage asset creation for larger greenfield developments is managed on a case-by-case
basis. Most of these developments are required to produce detailed local stormwater
management strategies / plans as per the stipulated guidelines by the City for each project.
The City will then review and either approve or request changes as required.
Ordinary Council Meeting - 24 July 2018 Attachments Attachment 10.2.1.1
City of Kalamunda 299

20 City of Kalamunda – Drainage Asset Management Plan
Some of the current and future large developments are;
• Forrestfield North surrounding the proposed Forrestfield train station
• ‘The Hales’ development in Forrestfield
• New residential and commercial subdivisions in Wattle Grove
• Forrestfield/High Wycombe Industrial area
This AMP recommends development of a Stormwater Management Plan (SMP) (Appendix E)
for the City. One of the objectives of the proposed SMP will be to identify the need to
create new drainage assets in the overall context of optimum management of stormwater
within the City.
Operational/
Maintenance
Current operational and maintenance activities include;
- Clean open drains
- Pit and drain gully eduction and jetting
- Emergency cleaning and repairs
All open drains are inspected at intervals less than two years while critical areas are
inspected at shorter intervals. Any works identified during the inspections are then
programed and executed. A programmed gully eduction program is also carried out on a bi-
annual basis.
Renewal
Renewal consists of two main types of work;
- Re-lining
- Replacement
Presently renewal works are determined on a case by case basis to rectify identified
drainage deficiencies.
Upgrade/ Expansion
Drainage upgrades / expansions are mainly based on the outcomes of specific flood studies
carried out for the purpose of mitigating identified drainage issues. A recent such study
conducted for Kalamunda town centre resulted in an extensive pipe upgrade project in
2017/18.
Disposal Disposal requirements are assessed on an individual case-by-case basis.
5.1 Operational and Maintenance Planning
An often overlooked, but a critical aspect of asset management is operational and maintenance
planning. Most organizations will have comprehensive operational and maintenance procedures in place
but their link to overall asset management and service levels may not be explicitly described or
identified.
While the City currently has various maintenance programs and emergency response mechanisms for
the drainage asset network, it is recommended to develop and document a formal maintenance /
operational plan. This plan is required to address key service delivery risks (Section 6) and be able to
help meet community expectations (Section 4).
Operational and maintenance planning involves taking a structured approach in developing asset
operational plans and procedures and generally consists of following activities (IPWEA, 2015);
• Establishing operational objectives and intervention criteria
• Developing maintenance plans and procedures
Ordinary Council Meeting - 24 July 2018 Attachments Attachment 10.2.1.1
City of Kalamunda 300

City of Kalamunda – Asset Management Plan – Drainage 21
• Developing operational process plans
• Planning for emergencies, crises and incidents
• Operational structure and support requirements
• Operational improvements
The City’s work order and complaints recording system does not provide adequate information on
maintenance work types, costs and identification of asset on which the maintenance is carried out. This
is one of the key barriers for maintenance planning and for asset life-cycle costing, with this information
needed to identify optimum renewal intervention levels for the renewal of assets.
Table 10 and Figure 10 show the analysis of customer requests received by the City during the 2009 –
2016 period related to drainage issues. Suburbs have been ranked based on the number of requests
received per pit assets. Also, most requests are likely to be based on the inlet point of stormwater
which is usually a pit. It indicates that more customer requests can be anticipated in the four of the
older suburbs of the City, namely Lesmurdie, Walliston, Kalamunda and Maida Vale.
Table 10: Customer requests per suburb
Suburb Number of
requests
Number
of pits
Requests/
1000 pits
Lesmurdie 140 2116 66
Walliston 25 384 65
Kalamunda 114 1845 62
Maida Vale 68 1392 49
Forrestfield 118 2754 43
Gooseberry Hill 49 1191 41
High Wycombe 109 2737 40
Wattle Grove 76 1971 39
Other 52 1318 39
All 751 15,708 48
As generally expected, the number of requests per year closely follows the annual rainfall patterns for
the analysis period (Figure 11). Within the year, the critical period for maintenance is two months
before and one month after the peak rainfall in July (Figure 12). This will be included in the SMMP
being developed through 2018 to 2020.
Rainfall data source: Bureau of Meteorology station 009021 Perth Airport accessed through Climate Data Online
tool at http://www.bom.gov.au/climate/data/index.shtml accessed on 30/04/2017. Dates of customer requests
are not available for the suburb of Forrestfield and therefore omitted from Figures 11 and 12.
Ordinary Council Meeting - 24 July 2018 Attachments Attachment 10.2.1.1
City of Kalamunda 301

22 City of Kalamunda – Drainage Asset Management Plan
Figure 11: Maintenance requests 2009 to 2016 by year
Figure 12: Maintenance requests 2009 to 2016 by month
0
100
200
300
400
500
600
700
800
900
0
20
40
60
80
100
120
140
2009 2010 2011 2012 2013 2014 2015 2016
Rai
nfa
ll (m
m)
No
. of
req
ues
ts
Year
Maintenance Requests - By Year
Lesmurdie Kalamunda High Wycombe Wattle Grove Maida Vale
Other Goosebery Hill Walliston Annual Rainfall
0
20
40
60
80
100
120
140
160
0
10
20
30
40
50
60
70
80
90
1 2 3 4 5 6 7 8 9 10 11 12
Rai
nfa
ll (m
m)
No
. of
req
ues
ts
Month (January to December)
Maintenance Requests - By Month
No. of requests Average Rainfall (2009 - 2016)
Ordinary Council Meeting - 24 July 2018 Attachments Attachment 10.2.1.1
City of Kalamunda 302

City of Kalamunda – Asset Management Plan – Drainage 23
6 . RISK MANAGEMENT
An assessment of typical strategic risks associated with service delivery of drainage assets has been
undertaken in accordance with City’s risk matrix. This assessment has identified a number of inherent
high risks to the City.
The identified high risks are summarised in Table 11 below.
Table 11: Drainage assets risk assessment
Risk
Likelihood
(Almost certain, Rare)
Consequence
(What can happen?)
Risk Level
(Inherent)
Recommended Risk
Treatment
Risk Level
(Residual)
Isolated flooding of
roads and private properties due to
blocked drains, pits and gross pollutant
traps and silted
basins
Likely Moderate
(financial and reputation)
High Establish appropriate
maintenance inspection regime as part of the
Maintenance Management Plan (MMP)
Medium
Broad flooding of
roads and private properties due to
inadequate capacity
of the drainage network of larger
catchments
Possible Significant
(financial and reputation)
High Complete the drain asset
registry and conduct drainage capacity studies
as part of SMP.
Allocate funding for the works identified
Medium
Drainage Asset failures leading to
impediments in safe collection,
conveyance and
disposal of stormwater
Unlikely Significant (financial and
reputation)
Medium Conduct visual asset condition rating on a
representative sample of drainage network and
prioritise the renewals
Low
Health and safety risks –water
contamination
Unlikely Significant (environmental,
financial and
reputation
Medium Establish appropriate maintenance inspection
regime as part of the
MMP
Low
Health and safety risks – mosquitos
Possible Moderate (health and
safety)
Medium Develop larvicide spray and baiting programs as
part of the MMP
Low
Soil erosion due to
overflow
Possible Significant
(environmental, financial and
reputation
High Establish appropriate
maintenance inspection regime as part of the
MMP
Low
Assessment of job safety risks for the personnel involved in asset service delivery (for example
maintenance) are not included in this Asset Management Plan. Such job specific assessments are done
routinely according to City’s Occupational Health and Safety policies and procedures.
Ordinary Council Meeting - 24 July 2018 Attachments Attachment 10.2.1.1
City of Kalamunda 303

24 City of Kalamunda – Drainage Asset Management Plan
6.1 Asset Criticality
Identification of critical assets is essential for risk minimization and budget optimization. The proposed
method for assigning criticality to individual drainage assets is based on location and size of the drain.
All asset life cycle management activities can be prioritised based on the criticality of assets.
Once the City’s Drain asset data is completed, the criticality will be assigned to individual assets to
determine critical network for the entire City.
The following factors lead to a higher level of criticality:
• Pipes greater than 600mm
• Major culverts (width greater than 1200mm)
• Pipes and pits located within densely built up areas and along/under distributor roads
• Basins within built up areas
• Pipes and pits located on high gradients
• Drainage assets in impermeable soils where water will infiltrate very slowly and is more likely
to flow overland.
• Gross Pollutant Traps and other water sensitive urban design (WSUD) elements that require
regular inspection and maintenance work
6.2 Conclusions and Recommendations
There is no information on historical major events related stormwater or any major failures of drainage
assets. However, it is recommended that the City be proactive in formulating detailed risk assessment
as part of developing a Stormwater Management Plan.
Ordinary Council Meeting - 24 July 2018 Attachments Attachment 10.2.1.1
City of Kalamunda 304

City of Kalamunda – Asset Management Plan – Drainage 25
7 . FUTURE DEMAND
Changes that drive demand for drainage assets may include growth in population in built up areas, and
in the long term the effects of climate change. These drivers will have an impact on services provided
by the drainage assets and the asset life cycle activities detailed in Section 5. The demand is managed
through a combination of maintaining and upgrading existing assets, providing new assets and non-
asset solutions.
Table 12 details the key drivers of future demand for drainage assets of the City. However,
quantitative assessment of these drivers to identify specific asset needs has not yet been carried out.
There is also no demand management plan covering the whole of the City. Demand from new
residential, commercial, and industrial developments is managed according to the City’s Stormwater
Design Guidelines for Subdivisional and Property Development (City of Kalamunda, 2018)
Therefore, this Drainage AMP recommends the preparation of a comprehensive Stormwater
Management Plan for the entire City to estimate future asset requirements and to identify actions for
better management of stormwater (Appendix E).
Table 12: Drainage assets demand factors
Demand Factor Comments
Demographic changes and
higher service level
expectations
The population prediction conducted in September 2017 indicated an
increase in population for ages 70+. The prediction notes “The largest increase in persons between 2016 and 2026 is forecast to be in ages 75 to
79, which is expected to increase by 1,096 and account for 4.2% of the total
persons.” (See Appendix D for more details).
This will require increased safety for walking on road verges (e.g. new
footpaths, removal of open drains). To cater for this need, existing open
drains are required to be upgraded to piped drains.
Developments, re-zoning
and new land subdivisions
The following new developments are expected to add a significant number of drainage assets.
• Forrestfield North area surrounding the proposed Forrestfield train station
• ‘The Hales’ estate and surrounding developments in Forrestfield
• New residential and commercial subdivisions in Wattle Grove
The City will need a robust mechanisms in place to ensure gifted drainage
assets through the subdivision process are affordable in the longer term (i.e. rates revenue from new subdivision are sufficient to cover whole of life cost
of assets such as maintenance and renewal)
Climate change Effects of climate change can lead to disruptions in asset management
processes. Evidence suggests that the climate is changing with two key outcomes being observed:
• Average temperatures, rainfall and other climate related indicators are
changing from year-to year; and
• Extreme events are occurring more frequently than in past decades
(The World Bank, April 2017)
As the long term trend for WA, a continued decline in average annual rainfall
is expected and median stream flow is estimated to decline 25% by 2030 (The
Climate Commission , 2013)
However, drainage assets still need to be able to provide the required level of
service during frequent extreme rainfall events. This requires providing adequate resilience within the existing drainage network.
Ordinary Council Meeting - 24 July 2018 Attachments Attachment 10.2.1.1
City of Kalamunda 305

26 City of Kalamunda – Drainage Asset Management Plan
8 . F INANCIAL SUMMARY
This section contains the financial requirements resulting from all the information presented in the
previous sections of this Drainage AMP. The financial projections will be improved as further
information becomes available on the desired levels of service and future asset performance.
8.1 Fair Value
The City, through an external consultant, undertook a comprehensive Fair Value valuation of its
drainage assets for the 2014/15 financial year. The current fair values, as reported for the year
ended on 30th June 2017 are shown in Table 13.
These values include an estimation of the portion of Drain assets that have not yet been
collected. This method of estimation has been accepted by the City’s external auditors.
Table 13: Drainage asset valuation results as at 30/06/2017
Asset
Category
Total Replacement
Value ($,000)
Written Down
Value ($,000)
Annual Depreciation
($,000)
Drains 69,615 13,238 867
Pits 13,999 3,026 170
Basins 3,975 993 41
Total 87,589 17,257 1,078
8.2 Key Performance Indicators
The following key indicators are calculated for drainage assets as per the Local Government
Operational Guidelines. (DLGC (a), June 2013).
Table 14: Key performance indicators
Indicator Purpose (DLGC (a),
2013)
Current
Value Comments Calculations
Asset
Consumption Ratio
This ratio measures the extent to which
depreciable assets have been consumed
by comparing their
written down value (fair value) to their
replacement cost. Standard is met if the
ratio can be measured and is 0.50 or greater.
0.20
Value is as at 30/06/2017.
This ratio is low due to reducing balance consumption
curve used (shown below) in
the last comprehensive valuation in 2015. This curve
is depreciating assets at higher rate when the
condition (service potential) of assets is high.
Replacement cost = $87,589,000
Fair value = $17,257,000 (Table 13)
Asset Consumption Ratio = Fair value/ Replacement cost
=$17,257,000/$87,589,000 =0.20
Ordinary Council Meeting - 24 July 2018 Attachments Attachment 10.2.1.1
City of Kalamunda 306

City of Kalamunda – Asset Management Plan – Drainage 27
Asset
Sustainability Ratio
This ratio indicates
whether a Local Government is
replacing or renewing existing non-financial
assets at the same
rate that its overall asset stock is wearing
out. Standard is met if the
ratio can be measured and is 0.90 or greater.
0.58
Ratio is calculated for the
2018 – 2028 period using the current LTFP renewal budgets
for asset renewals and annual depreciation of 2015 fair value
valuation.
Annual Depreciation
= $1,078,000 (Table 13) Current LTFP funding for next 10
years = $6,280,000 (Table 15)
Asset Sustainability Ratio (for
next 10 year period) = Current LTFP funding for next
10 years/ Annual Depreciation * 10
=$6,280,000 /($1,078,000 * 10) =0.58
Asset
Renewal Funding Ratio
This ratio is a
measure of the ability of a Local
Government to fund its projected asset
renewal /
replacements in the future and can
continue to provide existing levels of
services in future. Standard is met if the
ratio is between 0.75
and 0.95.
0.70
Ratio is calculated for the
2018 – 2028 period using the current LTFP renewal budgets
and the funding required to maintain current average
drainage network condition.
Renewal cost excludes any asset upgrades.
Details of funding projections
can be found in the Section 8.4.
Current LTFP funding for next 10
years = =$6,280,000 (Table 15)
Funding required to maintain
current service levels =
$8,932,000 (
Table 16)
Asset Renewal Funding Ratio
= Current LTFP funding/
Funding required to maintain current service levels
=$6,280,000/$8,932,000 =0.70
Ordinary Council Meeting - 24 July 2018 Attachments Attachment 10.2.1.1
City of Kalamunda 307

28 City of Kalamunda – Drainage Asset Management Plan
8.3 Current Funding Levels
The City’s current LTFP funding allocations are detailed in the following Table 15 and Figure 12. The
City’s current LTFP lists fixed annual funding after 2018/19 and 2019/20 for asset renewals and new
asset creation respectively.
Table 15: Current Long Term Financial Plan allocations for drainage assets
Year
New/Upgrade
(LTFP capital
budget) ($,000)
Renewals (LTFP capital budget)
($,000)
Maintenance (LTFP operating
budget) ($,000)
2018/19 481 1205 1,921
2019/20 583 675 2,017
2020/21 485 550 2,118
2021/22 450 550 2,224
2022/23 450 550 2,335
2023/24 450 550 2,452
2024/25 450 550 2,575
2025/26 450 550 2,703
2016/27 450 550 2,838
2027/28 450 550 2,980
Total 4,699 6,280 24,163
Notes: • Values exclude income from grants and contributions. • Minor assets are renewed using maintenance funds if the cost is under the City’s $3,000
capitalisation threshold. • The following high value projects account for the higher than typical projected annual
expenditure over the 10 years in the above table and will be reviewed as part of the 2018/2019 budget deliberations. o New/upgrade capital expenditure
o Stanhope Road, extension of existing network to creek- 2018/19 -$220,000 o Hummerston Road, extension of piped drainage system and install additional
manholes - 2019/20 -$250,000 and 2020/21 - $200,000 o Renewal capital expenditure
o Kostera Oval stormwater drainage renewal Stage 2 - 2019/20 - $125,000 o Booligal Street drainage renewal/upgrade – 2018/19 - $100,000 and 2019/20 –
$125,000 o Stirk Park channel and pond improvements - 2018/19 -$760,000
Ordinary Council Meeting - 24 July 2018 Attachments Attachment 10.2.1.1
City of Kalamunda 308

City of Kalamunda – Asset Management Plan – Drainage 29
Figure 13: Current drainage asset funding levels
8.4 Funding Gap Analysis
The funding ‘gap’ is a measure of shortfall (or excess) in current funding compared to funding
required to provide desired levels of service. Clear direction was not provided through the 2018
Levels of Service Community Engagement Program on desirable levels of service by the
community. Therefore, funding levels required are determined on the basis of technical levels
of service for asset renewal.
Predictive financial modelling was carried out on the basis that drainage assets are generally
being renewed when their physical condition has become unacceptable (i.e. Condition 5 – Very
Poor measured against Condition Rating scale of 1-5). Currently the drainage assets have not
been visually inspected to assess the condition. Therefore, the Condition Rating of individual
assets has been assumed based on its age using the methodology detailed in Appendix A.
Further, predictions are inclusive of an allowance for the missing portion of Pipe network within
pipes asset register and the overall condition rating of the pit network has been used as an
indicator for all drainage assets in the modelling.
Three scenarios have been modelled as follows:
Scenario 1 (S1)
This scenario is modelled on the basis of renewing assets with Condition Rating of 5 (very poor)
and that the budget available is unlimited. The budget is spread evenly for the 10-year period.
$0
$500
$1,000
$1,500
$2,000
$2,500
$3,000
$3,500
2018/19 2019/20 2020/21 2021/22 2022/23 2023/24 2024/25 2025/26 2016/27 2027/28
$,0
00
Current funding levels 2018 - 2028
New Renewals Maintenance
Ordinary Council Meeting - 24 July 2018 Attachments Attachment 10.2.1.1
City of Kalamunda 309

30 City of Kalamunda – Drainage Asset Management Plan
Scenario 2 (S2)
In this scenario, assets are being renewed on the basis of maintaining current average overall
condition of the drainage network.
Scenario 3 (S3)
In this scenario, maintaining the current average annual funding levels has been used.
Table 16 summarises the outputs of these three scenarios.
Table 16: Drainage assets predictive modelling scenarios for renewal
Scenario
No. Scenario Name Description
10 year
predicted cost $,000
Current funding
allocation
$,000
10 year predicted
funding gap
$,000
Overall
average network
condition at
the end of 10th year
S1 S1: Unlimited
budget
All assets are renewed when their
Condition Rating reaches or have reached 5
11,567 6,280 5,287 2.10
S2 S2: Maintain current
average condition
Optimized budget to maintain the current average condition over
next 10 years 8,932 6,280 2,652 2.46
S3 S3: Current
funding
Current average annual funding
levels used to predict network
condition at the end of 10 years.
N/A 6,280 0 3.07
• Scenario 1 indicates a funding gap of 5.287 million over next 10 years, if unlimited funds
were available.
• Scenario 2 indicates a funding gap of $2.652 million over next 10 years to maintain the
current average network condition.
• Scenario 3 indicates at current funding level, the drainage assets are expected to
deteriorate below average condition of 3.00.
Ordinary Council Meeting - 24 July 2018 Attachments Attachment 10.2.1.1
City of Kalamunda 310

City of Kalamunda – Asset Management Plan – Drainage 31
Detailed annual funding for each of the three scenario is shown in Figure 14.
Figure 14: Comparison of renewal funding scenarios
8.5 Conclusions
• The financial predictive modelling for the renewal of drainage assets using current asset
data and maintaining current average condition recommends providing an additional
average renewal funding of $265,200 per annum over next 10 years (Table 16, Scenario
2).
• Modelling is based on the assumed condition for all drainage assets.
• Confidence level of the predictive modelling can be improved by completing the pipe asset
register and conducting visual condition rating of a representative asset sample.
• Based on the confidence level of current data, it is considered premature to request
additional renewal funding at this stage and it is recommended that funding for drainage
assets renewals be maintained at current levels.
8.6 Recommendations
• Maintain the funding for drainage asset renewals at current levels.
• Implement the Asset Management Improvement Plan Tasks as detailed in Section 9, Table
17.
0.00
0.50
1.00
1.50
2.00
2.50
3.00
3.50
0
200,000
400,000
600,000
800,000
1,000,000
1,200,000
1,400,000
Year 1 Year 2 Year 3 Year 4 Year 5 Year 6 Year 7 Year 8 Year 9 Year 10
Comparison of funding scenarios
S1 - Annual renewal funding S2 - Annual renewal funding S3 - Annual renewal funding
S1 - Overall network condition S2 - Overall network condition S3 - Overall network condition
Ordinary Council Meeting - 24 July 2018 Attachments Attachment 10.2.1.1
City of Kalamunda 311

32 City of Kalamunda – Drainage Asset Management Plan
9 . IMPROVEMENTS , MONITORING AND REVIEW
9.1 Performance Monitoring
The City’s Asset Management Steering Committee (AMSC) will monitor the performance of the City’s Asset Management activities through the progress of Asset Management Improvement Plan Tasks and the relevant Actions of the City’s Corporate Business Plan 2017 -2021 (CBP) (Shire of Kalamunda (e), 2017).
9.2 Improvement Plan
The asset management improvement plan for drainage assets is shown inTable 17 below.
Table 17: Asset management improvement plan for drainage assets
9.3 Review Procedures
The next review of this Drainage AMP is scheduled for 2020/2021.
Task No.
Task Responsible Department
Timeline
1
Complete drain asset register by collecting and mapping all City drains and conduct visual
condition rating for representative sample (with
priority given to assets with expected condition of 4 or 5) of all drainage assets
Asset Management
2018/19
and
2019/20
2
Develop a Stormwater Management Plan (SMP)
with the prime objective to determine; • Water quantity and quality targets
• asset and non-asset solutions meet the targets
• Critical assets • Intervention levels for asset upgrades
• Quantify future demand and link to
future asset needs (Further details about SMPs can be found in
Appendix E)
Asset Management
2018/19
and 2019/20
3 Develop a Stormwater Maintenance Management Plan based on asset criticality, risk
and maintenance service levels
Asset Maintenance
2018/19 and
2019/20
4 Develop an asbestos register for drainage assets
containing asbestos
Asset
Management 2019/20
5 Review Drainage Asset Management Plan and implement all associated actions
Asset Management
2020/21
Ordinary Council Meeting - 24 July 2018 Attachments Attachment 10.2.1.1
City of Kalamunda 312

City of Kalamunda – Asset Management Plan – Drainage 33
REFERENCES
Catalyse Pty Ltd, May 2016. 2016 Community Scorecard: Shire of Kalamunda, s.l.: s.n.
City of Kalamunda, 2018. Stormwater Design Guidlines for Subdivisional and Property Development, s.l.: s.n.
Department of Water and Swan River Trust, 2007. Stormwater management plans, Stormwater Management Manual for Western Australia, Perth, Western Australia: Department of Water and Swan River Trust.
DLGC (a), June 2013. Local Government Operational Guidelines: Number 18, s.l.: Department of Local Government and Communities.
DLGC (b), 2016. Integrated planning and reporting. [Online] Available at: https://www.dlgc.wa.gov.au/CommunityInitiatives/Pages/Integrated-Planning-and-Reporting.aspx [Accessed 21 12 2016].
DLGC (c), May 2011. Asset Management Framework and Guidlines, Perth: s.n.
GHD Pty Ltd, September 2015. Shire of Kalamunda Fair Valuation of Assets Valuation Report, s.l.: s.n.
IPWEA, 2015. IIMM (International Infrastructure Management Manual). 5th ed. s.l.:IPWEA.
IPWEA, 2016. Local Government Guidelines for Subdivisional Development (Edition 2.3), West Perth: Institute of Public Works Engineering Australasia Western Australia Incorporated.
IPWEA, 2017. Useful Life of Infrasructure Practice Note 12, s.l.: IPWEA.
Shire of Kalamunda (a), 2017. Kalamunda Advancing: Strategic Community Plan to 2027, s.l.: s.n.
Shire of Kalamunda (b), 2016. FINANCIAL REPORT: FOR THE YEAR ENDED 30TH JUNE 2016, s.l.: s.n.
Shire of Kalamunda (c), 2017. Kalamunda Achieving: Corporate Business Plan 2017 - 2021, s.l.: s.n.
The Climate Commission, 2013. The Critical Decade 2013: Climate change science, risks and response, s.l.: Climate Commission Secretariat (Department of Industry, Innovation, Climate Change, Science, Research and Tertiary Education).
The World Bank, April 2017. Integrating Climate Change into Road Asset Management, Washington DC: The World Bank.
Ordinary Council Meeting - 24 July 2018 Attachments Attachment 10.2.1.1
City of Kalamunda 313

34 City of Kalamunda – Drainage Asset Management Plan
GLOSSARY Source: IPWEA ACCRUAL ACCOUNTING Recognition of assets, liabilities, equity, income and expenses as they are incurred (and once they satisfy the definitions and recognition criteria inclusion on Financial Statements). ACTIVITY MANAGEMENT The coordinated management of activities of an organisation to deliver on its objectives. For asset-intensive activities, ACTIVITY MANAGEMENT is considered in this Manual to be synonymous with ASSET MANAGEMENT. ADVANCED ASSET MANAGEMENT Asset management which employs predictive modelling, risk management and optimised decision-making techniques to establish asset lifecycle treatment options and related long term cash flow predictions. ANNUAL PLAN A document produced annually by an organisation to inform stakeholders of its objectives, intended activities, performance, income and expenditure required for a period of one financial year. It may also indicate anticipated future short-term income and expenditure. APPROPRIATE ASSET MANAGEMENT PRACTICE The level of AM practice development (minimum-advanced) which is considered optimal for the specific organisation. ASSET An item that has potential value to an organisation such as plant, machinery, buildings, etc. ASSET HIERARCHY A framework for segmenting an asset base into appropriate classifications. The asset hierarchy can be based on asset function; asset type or a combination of the two. ASSET MANAGEMENT (AM) The systematic and coordinated activities and practices of an organisation to optimally and sustainably deliver on its objectives through the cost-effective lifecycle management of assets. ASSET MANAGEMENT COORDINATOR The person appointed by an organisation to ensure the corporate AM goals, objectives and legal obligations are met. The AM coordinator may also be required to lead the AM team. ASSET MANAGEMENT FRAMEWORK The overarching AM hierarchy including the AM Policy, Objectives, Strategy and the AM Plan. ASSET MANAGEMENT INFORMATION SYSTEM (AMIS) A combination of processes, data, software, and hardware applied to provide the essential outputs for effective AM. ASSET MANAGEMENT OBJECTIVES Specific outcomes required from the implementation of the AM Framework. ASSET MANAGEMENT PLAN (AM Plan) Long-term plans (usually 10-20 years or more for infrastructure assets) that outline the asset activities and programmes for each
service area and resources applied to provide a defined level of service in the most cost effective way. ASSET MANAGEMENT POLICY A document that broadly outlines the principles and mandated requirements for undertaking AM across the organisation in a systematic and coordinated way, consistent with the organisation’s strategic plan. It provides the framework for the AM Strategy and AM Plan. ASSET MANAGEMENT PRACTICES The AM processes and techniques that an organisation undertakes, as outlined in this Manual, such as demand forecasting, developing and monitoring levels of service, risk management. ASSET MANAGEMENT STRATEGY The high level long-term approach to AM including AM action plans and objectives for managing the assets. ASSET MANAGEMENT TEAM The team appointed by an organisation to review and monitor the corporate AM improvement programme and ensure the development of integrated AM information systems, processes and plans consistent with organisational goals and objectives. ASSET REGISTER A record of asset information, typically held in a spreadsheet, database or software system, including asset attribute data such as quantity, type and construction cost. BENEFIT-COST ANALYSIS (BCA) A decision technique that quantifies the benefits and costs in monetary terms over the life of the decision (often the life of the asset involved), discounting these to current monetary terms (where non-monetary terms are used, this is called ‘multi-criteria’ analysis). BENEFIT-COST RATIO (BCR) The sum of the present values of all benefits (including residual value, if any) over a specified period, or the lifecycle, of the asset or facility, divided by the sum of the present value of all costs. BUSINESS CONTINUITY PLAN Plans developed to ensure critical services can continue to function even during unexpected events. The plans typically detail critical services and functions, ways these can potentially fail, mitigation measures and processes or work-arounds to recover services if they do fail. BUSINESS PLAN A plan produced by an organisation (or business units within it) which translates the objectives contained in an Annual Plan into detailed work plans for a particular, or range of, business activities or programmes. CAPITAL EXPENDITURE (CAPEX) Expenditure used to create new assets or to increase the capacity of existing assets beyond their original design capacity or service potential. CAPEX increases the value of asset stock. CASH FLOW Inflows and outflows of cash and cash equivalents. COMPONENTS Specific parts of an asset having independent physical or functional identity and having specific attributes such as different life expectancy, maintenance regimes, risk or criticality.
Ordinary Council Meeting - 24 July 2018 Attachments Attachment 10.2.1.1
City of Kalamunda 314

City of Kalamunda – Asset Management Plan – Drainage 35
CONDITION The physical state of the asset. CONDITION GRADE (RATING) A measure of the physical integrity of an asset or component. CONDITION-BASED PREVENTIVE MAINTENANCE Preventive maintenance initiated as a result of an asset reaching a specified condition. CONDITION ASSESSMENT (CONDITION MONITORING) The inspection, assessment, measurement and interpretation of the resultant data, to indicate the condition of a specific component so as to determine the need for some preventive or remedial action. CORE ASSET MANAGEMENT (also called ‘BASIC AM’) Asset management which relies primarily on the use of an asset register, maintenance management systems, top-down condition assessment, simple risk assessment and defined levels of service, in order to establish a long-term cash flow projection. CORRECTIVE MAINTENANCE The remedial actions performed as a result of failure, to restore an asset or component to a specified condition. CURRENT ASSETS Those assets which are expected to be realised in cash or sold or consumed within one year of an organisation’s balance date. CURRENT REPLACEMENT COST See REPLACEMENT COST. CRITICAL ASSETS Those assets that are likely to result in a more significant financial, environment and social cost in terms of impact on organisational objectives. CROSS-ASSET OPTIMISATION The application of Optimised Decision Making techniques to compare and prioritise proposals across different assets or activities. CUSTOMER Any person who uses the asset or service, is affected by it or has in interest in it either now or in the future. This definition does not necessarily require that payment is made for use of the asset. CUSTOMER GROUP A set of customers that has been grouped for the purposes of levels of service review. Customers are generally grouped into those that have similar needs or wants in relation to the assets and services. DECOMMISSION Actions required to take an asset out of service. DEFERRED MAINTENANCE The shortfall in maintenance work required to maintain the service potential of an asset. DEMAND MANAGEMENT Actions taken to influence demand for services and assets, often undertaken as part of sustainability initiatives and/ or to avoid or defer required asset investment. Demand management may be ‘SUPPLY-SIDE’ demand Management (for example minimising wastage through pipe leak detection or
customer DEMAND-SIDE management, to reduce demand for over-utilised assets or vice versa (for example through pricing, regulation, education and incentives). DEPRECIATED REPLACEMENT COST (DRC) The Replacement Cost (RC) of an asset less accumulated depreciation calculated on the basis of such cost to reflect the already consumed or expired future economic benefits of the asset. DEPRECIATION (amortisation) The systematic allocation of the depreciable amount of an asset over its useful life. DETERIORATION RATE The rate at which an asset approaches failure (end of life). DISCOUNTED CASH FLOW A methodology whereby the future cash flows over the analysis period are discounted to present values and then summed to yield the present value (PV) of the time stream of costs or benefits. DISCOUNTING A technique for converting cash flows that occur over time to equivalent amounts at a common point in time. DISCOUNT RATE A rate used to relate present and future money values, e.g. to convert the value of all future dollars to the value of dollars at a common point in time, usually the present. DISPOSAL Actions necessary to decommission and dispose of assets that are no longer required. ECONOMIC LIFE The period from the acquisition of the asset to the time when the asset, while physically able to provide a service, ceases to be the lowest cost alternative to satisfy a particular level of service. The economic life is at the maximum when equal to the physical life, however obsolescence will often ensure that the economic life is less than the physical life. EMERGENCY RESPONSE PLANS (Also called Contingency Plans, Crisis Management Plans or Incident Response Plans) Detail the processes that an organisation will use to respond and recover from an incident. These plans typically include some type of escalation process to define when structures, communication and reporting lines may change as an incident escalates. ENABLERS (Asset Management) The organisational resources, structures, plans, systems and tools that enable the implementation of the AM framework. EQUITY The residual interest in the assets of the entity after deduction of its liabilities. FACILITY A complex comprising many assets (e.g. a hospital, water treatment plant, recreation complex, etc.) which represents a single management unit for financial, operational, maintenance or other purposes.
Ordinary Council Meeting - 24 July 2018 Attachments Attachment 10.2.1.1
City of Kalamunda 315

36 City of Kalamunda – Drainage Asset Management Plan
FAILURE MODES, EFFECTS AND CRITICALITY ANALYSIS (FMECA) FMECA and RCM are similar systematic, logical risk-based maintenance approaches aimed at maximising reliability of plant and equipment assets. FAIR VALUE The amount for which an asset could be exchanged, or a liability settled, between knowledgeable, willing parties in an arm’s length transaction. FINANCIAL STATEMENTS Balance sheets, profit and loss accounts, statements of changes in financial position, notes and other statements which collectively are intended to give a true and fair view of the state of affairs and profit or loss for an entity for a defined period. FOCUS GROUP A method of consulting with representative customers/ stakeholders. A focus group typically comprises 6 to 8 people, invited to participate in a discussion about a specified topic, product or service. GAP ANALYSIS A method of assessing the gap between an organisation’s current AM practices and the future desirable AM practices. Also called AM ‘needs analyses or ‘status assessment’. GENERALLY ACCEPTED ACCOUNTING PRACTICES (GAAP) Approved financial reporting standards so far as those standards apply to a particular entity; or, where there are no approved standards, accounting policies that are appropriate to the entity and have authoritative support within the accounting profession. INFRASTRUCTURE ASSETS Stationary systems forming a network and serving whole communities, where the system as a whole is intended to be maintained indefinitely at a particular level of service potential by the continuing replacement and refurbishment of its components. The network may include normally recognised ordinary assets as components. INTERNAL RATE OF RETURN (IRR) The discount (or interest) rate which will equate the present value of the net cash inflows from a project with its initial cash outlay. The internal rate of return is the true yield and is expressed as the average rate of return per annum or other chosen period. INTERVENTION LEVELS Identify the point where the performance against the level of service warrants intervention. KEY PERFORMANCE INDICATOR (KPI) A performance measure that is considered important to the organisation (see performance measure). LEVEL OF SERVICE Levels of service statements describe the outputs or objectives an organisation or activity intends to deliver to customers. LIFE A measure of the anticipated life of an asset or component; such as time, number of cycles, distance intervals, etc.
LIFECYCLE The time interval that commences with the identification of the need for an asset and terminates with the decommissioning of the asset or any liabilities thereafter. LIFECYCLE ASSET MANAGEMENT Encompasses all AM strategies and practices associated with an asset or group of assets that results in the lowest lifecycle cost. LIFECYCLE COST The total cost of an asset throughout its life including planning, design, construction, acquisition, operation, maintenance, rehabilitation and disposal costs. MAINTENANCE All actions necessary for retaining an asset as near as practicable to its original condition, but excluding rehabilitation or renewal. Maintenance does not increase the service potential of the asset or keep it in its original condition, it slows down deterioration and delays when rehabilitation or replacement is necessary. MAINTENANCE PLAN Details the specific planned and unplanned maintenance actions for an asset or facility. MAINTENANCE OBJECTIVES Objectives for what maintenance has to achieve to ensure the assets are in the right condition to meet the needs of the organisation. Maintenance performance measures and targets are the means of assessing whether the maintenance objectives are being met. MAINTENANCE STRATEGY Identifies the tactics and tools that will be used to deliver the maintenance plan, as well as defining the maintenance roles and responsibilities. MARKET VALUE The estimated amount at which an asset would be exchanged on the date of valuation, between a willing buyer and a willing seller, in an arm’s length transaction and when the parties have each acted knowledgeably, prudently and without compulsion. Market value is based on highest and best use of the asset and not necessarily the existing uses. MODERN EQUIVALENT ASSETS Assets that replicate what is in existence with the most cost- effective asset providing an equivalent level of service. MULTI-CRITERIA ANALYSIS (MCA) A decision technique where a selection of criteria are selected to represent the benefits provided from the proposal. Each attribute is scored and weighted for the different options and the results can be used to identify the preferred solution/s. NET PRESENT VALUE (NPV) The value of an asset to the organisation, derived from the continued use and subsequent disposal in present monetary values. It is the net amount of discounted total cash inflows arising from the continued use and subsequent disposal of the asset after deducting the value of the discounted total cash outflows. OPERATION The active process of utilising an asset which will consume resources such as manpower, energy, chemicals and materials.
Ordinary Council Meeting - 24 July 2018 Attachments Attachment 10.2.1.1
City of Kalamunda 316

City of Kalamunda – Asset Management Plan – Drainage 37
OPTIMISED DECISION-MAKING (ODM) Two definitions are: 1. ODM is a formal process to identify and prioritise all potential solutions with consideration of financial viability, social and environmental responsibility and cultural outcomes. 2. An optimisation process for considering and prioritising all options to rectify existing or potential performance failure of assets. The process encompasses NPV analysis and risk assessment. OPTIMISED DEPRECIATED REPLACEMENT COST (ODRC) IFRSs require the DRC to be optimised, therefore ODRC is synonymous with DRC. PERFORMANCE GRADE A measure of the ability of the asset to achieve levels of service. PERFORMANCE MEASURE A qualitative or quantitative measure used to measure actual performance against a standard or other target. Performance measures are used to indicate how the organisation is doing in relation to delivering levels of service. PERFORMANCE MONITORING Continuous or periodic quantitative and qualitative assessments of the actual performance compared with specific objectives, targets or standards. PLANNED MAINTENANCE Planned maintenance activities fall into three categories: a) Periodic - necessary to ensure the reliability or to sustain the design life of an asset. b) Predictive - condition monitoring activities used to predict failure.
c) Preventive - maintenance that can be initiated without routine or continuous checking (e.g. using information contained in maintenance manuals or manufacturers’ recommendations) and is not condition-based. PREDICTIVE MODELS Typically use condition and performance deterioration curves to project the lifecycle costs of each asset for different maintenance or renewal strategies and identify the optimal treatment strategy. PROCESS A structured, measured set of activities designed to produce a specific output. RECOVERABLE AMOUNT Is the greater of the amount recoverable from an asset’s further use and ultimate disposal, and its current net realisable value. REHABILITATION (REFURBISH) Works to rebuild or replace parts or components of an asset, to restore it to a required functional condition and extend its life, which may incorporate some modification. Generally involves repairing the asset to deliver its original level of service (i.e. heavy patching of roads, sliplining of sewer mains, etc.) without resorting to significant upgrading or renewal, using available techniques and standards. RELIABILITY CENTRED MAINTENANCE (RCM) A process for optimising maintenance based on the reliability characteristics of the asset. RENEWAL Works to replace existing assets or facilities with assets or facilities of equivalent capacity or performance capability
.
Ordinary Council Meeting - 24 July 2018 Attachments Attachment 10.2.1.1
City of Kalamunda 317

38 City of Kalamunda – Drainage Asset Management Plan
APPENDIX A : ASSET INFORMATION SUMMARY
Drains
The following graphs show the various aspects of the City’s Drain assets recorded within the City’s asset
register. The graphs show the classification group, total pipe length of the group in kilometres and %
of the group out of the total network. The total length of Drain assets in City’s asset register is
219.906km.
Drains are divided into the following 3 types:
• Piped system is an underground pipe with entry pits, junction pits and a outfall head wall.
• Culvert System is an underground pipe with headwalls at both ends, and
• Open Channel System is a lined open drain.
Piped System, 213, 96.8%
Culvert System, 7, 3.1%
Open Channel System, 0.2, 0.10%
Drain Type
Piped System Culvert System Open Channel System
Ordinary Council Meeting - 24 July 2018 Attachments Attachment 10.2.1.1
City of Kalamunda 318

City of Kalamunda – Asset Management Plan – Drainage 39
The Drain function indicates if the system allows detention or infiltration of stormwater. Drains with the
function “Stormwater Flow” do not allow detention or infiltration.
The main drain material is reinforced concrete. The City currently has 79m of asbestos drain pipes. This
Drainage AMP recommends to create a detailed register of drainage assets that contain asbestos.
Stormwater Flow, 206, 93.7%
Subsoil / Infiltration, 14, 6.3%
Soakage / Detention, 0.004,
0.002%
Drain Function
Stormwater Flow Subsoil / Infiltration Soakage / Detention
Reinforced Concrete, 204,
92.7%
PVC, 15, 6.8%
Fibre-Cement, 1, 0.2%
Steel/Aluminum, 0.3, 0.1%Vitreous Clay/Stone
Mortared/Asbestos, 0.3, 0.1%
Drain Material
Reinforced Concrete PVC
Fibre-Cement Steel/Aluminum
Vitreous Clay/Stone Mortared/Asbestos
Ordinary Council Meeting - 24 July 2018 Attachments Attachment 10.2.1.1
City of Kalamunda 319

40 City of Kalamunda – Drainage Asset Management Plan
More than half of the pipes and more than one third of box culverts have a diameter / width of
300mm or less.
Diameter =< 300mm, 122, 57.8%
Diameter > 300mm and =< 450mm, 49,
23.2%
Diameter > 450mm and =< 600mm, 22,
10.3%
Diameter > 600mm, 18, 8.7%
Pipe Diameter
Diameter =< 300mm Diameter > 300mm and =< 450mm
Diameter > 450mm and =< 600mm Diameter > 600mm
Width =< 300mm, 5.3, 69.0%
Width > 300mm and =< 600mm, 2.0,
26.1%
Width > 600mm, 0.4, 4.9%
Box Culvert Width
Width =< 300mm Width > 300mm and =< 600mm Width > 600mm
Ordinary Council Meeting - 24 July 2018 Attachments Attachment 10.2.1.1
City of Kalamunda 320

City of Kalamunda – Asset Management Plan – Drainage 41
Pits
The following graphs show the various aspects of the City’s Pit assets recorded within City’s asset
register. The graphs show the classification group, total number of pits in the group and the % of the
group out of the total number of pits in the network.
The number of pits in City’s asset register is 15,708.
Junction Pit , 5229, 33.3%
Side Entry Pit (single/double),
4220, 26.9%
Head Wall, 2900, 18.5%
Grated Side Entry Pit, 1709, 10.9%
Grated Pit (incl. grated gully pits),
1197, 7.6%Other, 453, 2.9%
Pit Type
Junction Pit Side Entry Pit (single/double)
Head Wall Grated Side Entry Pit
Grated Pit (incl. grated gully pits) Other
Ordinary Council Meeting - 24 July 2018 Attachments Attachment 10.2.1.1
City of Kalamunda 321

42 City of Kalamunda – Drainage Asset Management Plan
Ordinary Council Meeting - 24 July 2018 Attachments Attachment 10.2.1.1
City of Kalamunda 322

City of Kalamunda – Asset Management Plan – Drainage 43
The majority of pit assets are located within the road reserve. The pit assets located within private property are not a responsibility of the City and have not been included in the financial modelling scenarios.
Pre-Cast Concrete, 12,366 , 79%
Stone Mortared, 1,585 , 10%
Brick, 1,346 , 8%Cast In-situ
Concrete, 405 , 3%
Metal/ plastic, 6 , 0.04%
Pit Material
Pre-Cast Concrete Stone Mortared Brick Cast In-situ Concrete Metal/ plastic
Road Reserve, 13641, 87%
Private Property, 987, 6%
Reserve, 980, 6%
Public Access Way/ Right of Way, 65,
1%
Unknown, 32, 0.2%
Pit Location
Road Reserve Private Property Reserve Public Access Way/ Right of Way Unknown
Ordinary Council Meeting - 24 July 2018 Attachments Attachment 10.2.1.1
City of Kalamunda 323

44 City of Kalamunda – Drainage Asset Management Plan
Basins
The following graphs show the various aspects of the City’s Basin assets recorded within City’s asset
register. The graphs show the classification group, total area of Basins in each group and % of each
group against the total area of Basins in the City.
The City currently has 86 basins with a total area of 195,817 m2.
Retention basins collect and retain stormwater within a site and then discharge by infiltration into the
groundwater or by evaporation, whereas, detention basins collect, temporarily store and then
discharge at a controlled rate into a downstream drainage system or natural watercourse.
Basin, 125,280 , 64%
Sump, 68,021 , 35%
Infiltration Chamber, 1,343 ,
1%
Pond, 1,040 , 0.5%
Rain Garden, 134 , 0.1%
Basin Type
Basin Sump Infiltration Chamber Pond Rain Garden
Retention, 95,383 , 49%Detention and
Retention, 93,753 , 48%
Detention, 6,682 , 3%
Basin Function
Retention Detention and Retention Detention
Ordinary Council Meeting - 24 July 2018 Attachments Attachment 10.2.1.1
City of Kalamunda 324

City of Kalamunda – Asset Management Plan – Drainage 45
Natural Ground, 190,918 , 97%
Clay Lined, 2,383 , 1%
Polyethylene Resin, 1,343 , 1%
Concrete, 1,040 , 1%
Limestone Blocks, 134 , 0.1%
Basin Material
Natural Ground Clay Lined Polyethylene Resin Concrete Limestone Blocks
0-2500, 63, 73%
2500-5000, 11, 13%
5000-7500, 4, 4%
7500-10000, 4, 5%>10000, 4, 5%
Basin Size (m2)
0-2500 2500-5000 5000-7500 7500-10000 >10000
Ordinary Council Meeting - 24 July 2018 Attachments Attachment 10.2.1.1
City of Kalamunda 325

46 City of Kalamunda – Drainage Asset Management Plan
APPENDIX B : CONDITION RATING METHODOLOGY
The condition of the assets have been estimated based on the % of total useful life remaining as per
the following table:
Rating Score
Expected Condition
% of Total Useful Life Remaining
Description of Expected Condition
Expected Deterioration
Signs
Expected Serviceability
Problems
Expected Maintenance
Costs
1 Very Good >80
Asset is in near new condition. Only routine maintenance is required.
No visible signs.
None. No risk associated with the condition.
Low, if any.
2 Good 61 - 80
Asset has deteriorated slightly but only regular maintenance is required to maintain the rating.
Slight deterioration is evident that can readily be repaired to "As New" condition. Obviously no longer new.
None. Very low risk associated with the condition.
Low, if any.
3 Fair
(Average) 41 - 60
Asset is in satisfactory condition but showing signs of wear and tear. Moderate levels of periodic (programmed) maintenance are required to maintain the asset in this condition.
Deterioration is evident. Deterioration may either be localised, or to a minor degree spread over a wider part of the component. No structural or functional concerns, provided that maintenance or repairs are undertaken.
Impaired slightly. General user would not be aware of problems. Low risks may be associated with the condition.
Low to medium.
4 Poor 21 - 40
Asset is in below average condition with significant signs of wear and tear. High levels of periodic maintenance may require to maintain the rating of this asset. Partial or full replacement maybe required to improve the rating of this asset.
Deterioration is obvious. There may be structural or functional concerns and maintenance or repairs are necessary.
Medium loss. General user is aware the asset is performing poorly, and may have to adjust use of the asset accordingly. Low to medium risks may be associated with the condition.
Medium to high. Plan for renewal.
5 Very Poor =< 20
Asset is in very poor condition and needing full replacement.
Severe deterioration. Actual or potential failure to structural or functional components.
Significant effect on service, and can be unusable. General user avoids the asset or complains. Needs high priority renewal (rehabilitation or renovation or replacement or restoration). Medium to Extreme risks may be associated with the condition.
Very high, usually more effective to renew the asset.
Ordinary Council Meeting - 24 July 2018 Attachments Attachment 10.2.1.1
City of Kalamunda 326

City of Kalamunda – Asset Management Plan – Drainage 47
Condition Rating Example as follows:
If and underground pipe is constructed in year 1978 and the expected total useful life of the pipe is 80
years:
• Remaining total useful life in years = (80) – (age of pipe) = (80) – (2018-1978) = 40 years
• Remaining total useful life as a percentage of total useful life = 40/80% = 50%
• From above table 50% lies within the range (41% – 60%) of Condition 3; therefore, the
expected condition rating of the pipe is 3.
Ordinary Council Meeting - 24 July 2018 Attachments Attachment 10.2.1.1
City of Kalamunda 327

48 City of Kalamunda – Drainage Asset Management Plan
APPENDIX C : ASSET LEVELS OF SERVICE CONSULTATION
AND ENGAGEMENT RESULTS
Introduction
The Asset Levels of Service consultation was undertaken in accordance with a Communications and Engagement Plan, endorsed by the Council in December 2017.
The objectives of the consultation were: 1. Raise awareness of the Asset Management Strategy and consultation process among 70% of
all stakeholders,
2. Create an understanding of the major asset categories and level of service criteria among
60% of stakeholders,
3. Influence the perception and attitude in 50% of stakeholders that the City has obtained
equitable levels of feedback from residents across the districts in the City, and
4. Achieve uptake of the engagement process.
The media and methods used to undertake the consultation included: • Presentation of a marketing video on YouTube and through social media,
• Social media releases, paid and unpaid,
• Path stickers in public areas, and
• Notices on community notice boards.
The primary feedback method for the consultation was through a questionnaire, available in hard copy and online at the Engage.Kalamunda web site. When hard copies were received they were loaded in to the Engage.Kalamunda web site by staff.
Respondent Statistics
The City of Kalamunda consultation on Asset Levels of Service was open from 8 February 2018 to 23 March 2018. Over that time 50 surveys were completed, with the following key statistics:
• 54% of the responses were from females and 44% from males,
• 82% overall were residents,
• Residents from the hills suburbs made up 60% of respondents, and
• The age distribution was reasonable.
Workshops and Site Visits
Community workshops were conducted on 12 February 2018 at The City’s Function Room, and 27 February 2018 at the Woodlupine Community Centre. There were no attendees on 12 February. The second workshop received ten attendees, and proceeded well with valuable comments received.
The public was also asked for feedback at the Forrestfield Shopping Centre.
All feedback was entered into the engagement website.
Ordinary Council Meeting - 24 July 2018 Attachments Attachment 10.2.1.1
City of Kalamunda 328

City of Kalamunda – Asset Management Plan – Drainage 49
The workshop at the Woodlupine Community Centre is shown below:
Responses on Drainage
Drainage Questions
The questions asked about drainage were: • 22. Drainage pits, kerb and channels (on the side of the road) are working to an acceptable
level.
• 23. Stormwater drainage flows where it should (through drain pipes, and along waterways
and creeks).
• 24. The amount of water running onto and through properties from storms is acceptable.
• 25. The quality of the water in the drainage system is acceptable, for protecting the natural
environment.
• 26. Mosquitos are a problem where I live.
The survey was conducted during summer, so the answers may not reflect opinions during the winter. The nature of drainage is that issues are usually localised, so where one or two properties may be affected by a heavy rainfall event, the wider neighbourhood may not be aware of the problems. There is also a perception issue that when water ponds in the road this is a drainage problem, where the design may be working as expected.
Feedback is summarised as follows:
Question 22: 26% of respondents disagreed, and 64% agreed that drainage was working effectively.
Question 23: 26% of respondents disagreed that stormwater drainage flows where it should. 60% agreed.
Question 24: 18% of respondents disagreed that the amount of water was acceptable, while 58% agreed.
Question 25: 46% of respondents were unsure whether the quality of water in the drainage system was acceptable. This indicates a lack of awareness of the quality of stormwater in the City. 8% disagreed.
Ordinary Council Meeting - 24 July 2018 Attachments Attachment 10.2.1.1
City of Kalamunda 329

50 City of Kalamunda – Drainage Asset Management Plan
Question 26: Mosquitoes appear to either be a problem or not, with 44% agreeing that they are a problem, and 50% disagreeing.
It is worth noting that despite the apparent concerns with drainage, no comments or specific problem sites were given regarding drainage.
0 5 10 15 20 25 30
Strongly Disagree
Disagree
Unsure
Agree
Strongly Agree
2
11
5
30
2
22. Drainage pits kerb and channels on the side of the road are working to an acceptable level
0 5 10 15 20 25 30
Strongly DisagreeDisagree
UnsureAgree
Strongly Agree
310
727
3
23. Stormwater drainage flows where it should (through drain pipes and along waterways and
creeks)
0 5 10 15 20 25 30
Strongly Disagree
Disagree
Unsure
Agree
Strongly Agree
2
7
11
27
2
24. The amount of water running onto and through properties from storms is acceptable
Ordinary Council Meeting - 24 July 2018 Attachments Attachment 10.2.1.1
City of Kalamunda 330

City of Kalamunda – Asset Management Plan – Drainage 51
Responses on Budget Spend
The question asked was “If you had to allocate all the City’s maintenance, renewals, and upgrade budget for these assets, how much budget would you allocate? Enter a percentage against each asset class including Parks and Buildings, so that the total for the five asset classes equals 100%. Please note this includes all major asset classes.”
46 of the 50 respondents answered this question. In the following list, the first value is the average, with the following two values in brackets representing the range of responses:
• Roads 28.9% (20% to 40%)
• Footpaths 20.4% (10% to 30%)
• Drainage 14.9% (0% to 20%)
• Parks and Reserves 20.9% (10% to 30%)
• Buildings 16.0% (0% to 25%)
This means that (for example) the average percentage of budget that the community would like to allocate to roads is 28.9%. The responses from individuals ranged from allocating 20% up to allocating 40%. In the workshop, the attendees were shown a slide of the total value of assets in the different asset classes, however no maintenance or renewal expenditure was discussed. No financial information was provided to other respondents, and most respondents are probably not aware of the actual amount that is spent. Consequently the results should be interpreted as indications of preference rather than actual targets.
0 5 10 15 20 25
Strongly DisagreeDisagree
UnsureAgree
Strongly Agree
04
2320
3
25. The quality of the water in the drainage system is acceptable for protecting the natural
environment
0 5 10 15 20 25
Strongly Disagree
Disagree
Unsure
Agree
Strongly Agree
2
23
3
10
12
26. Mosquitos are a problem where I live
Ordinary Council Meeting - 24 July 2018 Attachments Attachment 10.2.1.1
City of Kalamunda 331

52 City of Kalamunda – Drainage Asset Management Plan
APPENDIX D : POPULATION FORECASTS
The City’s demographic information and analysis is provided by .id (http://profile.id.com.au/kalamunda) are based on results from the 2016, 2011, 2006, 2001, 1996 and 1991 Australian Bureau of Statistics Censuses of Population and Housing.
Population forecast to 2036
Age structure forecast
Ordinary Council Meeting - 24 July 2018 Attachments Attachment 10.2.1.1
City of Kalamunda 332

City of Kalamunda – Asset Management Plan – Drainage 53
APPENDIX E : STORMWATER MANAGEMENT PLAN
The Stormwater Management Manual for Western Australia (SMMWA) (Department of Water and
Swan River Trust, 2007) details how a Stormwater Management Plan (SMP) can be used to manage
urban stormwater quantity and quality to protect ecological, social/cultural and economic values.
A Stormwater Management Plan is used to aid with decision making to ensure that;
a. Remedial measures (asset and non-asset) in existing developed areas are undertaken
in a cost-effective, integrated and coordinated manner, and
b. Decisions in relation to new development (including redevelopment) are made with the
implications for stormwater impacts taken into account.
This will inform the City’s Drainage AMP on new, upgrading of drainage assets and maintenance plans.
The SMMWA recommends that stormwater management plans provide objectives for how stormwater
should be managed in an area. It also provides a process to manage stormwater in a considered and
coordinated manner that targets priority issues. Therefore, a SMP will help to prioritise the City’s LTFP
for new, upgrading, renewal and maintenance works for drainage assets.
The SMMWA also mentions that a SMP is particularly useful for improving stormwater management
in established urban areas, where the land use planning process for individual redevelopment sites is
often at an insufficient scale for stormwater management improvement.
The City has many areas that are being developed in stages and the development of a SMP will help
to identify the impact of subsequent developments within current catchments.
Ordinary Council Meeting - 24 July 2018 Attachments Attachment 10.2.1.1
City of Kalamunda 333

54 City of Kalamunda – Drainage Asset Management Plan
APPENDIX F : THE C ITY OF KALAMUNDA ASSET MANAGEMENT
PRACTICES
The City has a dedicated Asset Management (AM) team within its’ Asset Services directorate. The AM
team is led by the Coordinator Asset Management and reports directly to Manager Asset Planning and
Management. The AM team provides many AM services related to the City’s infrastructure and
community assets such as:
• Maintains the 10-year long tem financial plan for new, upgrades and renewal of assets
• Manages asset registries and inventory information
• Conducts periodic condition inspections and develops budget estimates for capital works
• Maintains asset geographical information
• Conducts asset financial tasks such as asset valuations and capitalisation of works
• Conducts predictive modelling to forecast future renewal demands
• Develops AM Plans
The City’s Asset Management Steering Group consisting of the Executive Management team monitors
the performance of the City’s Asset Management activities and the implementation of actions within
the AM Strategy and AM Plans.
The City’s current AM Policy and AM Strategy were adopted in September 2016 and July 2017
respectively. The key objective of City’s AM Strategy is to achieve a Core Level of maturity (as per
International Infrastructure Management Manual) of Asset Management by the end of 2021.
Since 2010, the City has used the Assetic suite of software as its main Corporate AM system to
maintain all asset inventory and financial information (within Assetic myData) and to conduct
predictive modelling (within Assetic Predictor).
The City’s Assetic myData system currently holds the data for all Infrastructure Assets, Land and
Buildings.
In 2014, the Australian Road Research Board (ARRB) conducted an independent assessment of 14 of
the most commonly available AM systems in Australia. The Assetic systems were rated to have the
availability of all technical and non-technical assessment criteria (Figure A).
The City’s asset geographical information is managed using open source software QGIS and data is
accessible to the entire organization through the corporate Geographical Information System (GIS)
Intrapmaps. The City also uses Intramaps Roam software and a suite of hardware for its’ mobile data
collection.
The City uses predictive modelling to estimate long term financial needs by forecasting the asset
renewal demand. This process involves modelling of several service level and funding scenarios
applicable to different asset classes to identify optimum funding levels.
Ordinary Council Meeting - 24 July 2018 Attachments Attachment 10.2.1.1
City of Kalamunda 334

City of Kalamunda – Asset Management Plan – Drainage 55
Figure A, Source: ARRB, 2014, Asset Management System Review
Ordinary Council Meeting - 24 July 2018 Attachments Attachment 10.2.1.1
City of Kalamunda 335