Embed Size (px)
Citation preview

North Coast Regional Water Quality Control Board
Surface Water Ambient Monitoring Program
Workplan for FY 2002-03
September, 2002
Page 1 of 1

Table of Contents I. Introduction 3 II. Sites to be Monitored 4 III. Site Identification, Monitoring Activities, and Objectives 5
Smith River Hydrologic Unit (103) 5 Klamath River Hydrologic Unit (105) 6 Trinity River Hydrologic Unit (106) 11 Redwood Creek Hydrologic Unit (107) 14 Mad River Hydrologic Unit (109) 15 Eel River Hydrologic Unit (111) 16 Mendocino Coast Hydrologic Unit (113) 20 Russian River Hydrologic Unit (114) 21 IV. Specific Sample Design and Sample Collection
Wadeable Stream and River Sites 24 Lake Sampling for MTBE 25 Vitellogenin Screening 25 Thermal Infrared Imaging 26 Bioassessment and Reference Site Development 26 Stream Gaging 26 Laboratory Analysis 27 Data Quality Evaluation and Data Reporting 27 Deliverable Products 27 Desired Milestone Schedule 28 Desired Sample Throughput Schedule 28 Budget 28
V. Working Relationships/Decision Matrix 28 VI. Other Information and Attachments 29
Page 2 of 2

I Introduction The Porter-Cologne Water Quality Control Act and the federal Clean Water Act (CWA) direct the water quality programs to implement efforts intended to protect and restore the integrity of waters of the State. California Assembly Bill (AB) 982 (Water Code Section 13192; Statutes of 1999) requires the State Water Resources Control Board (SWRCB) to assess and report on the State monitoring programs and to prepare a proposal for a comprehensive surface water quality monitoring program. Ambient monitoring is independent of the water quality programs and serves as a measure of (1) the overall quality of water resources and (2) the overall effectiveness of Regional Water Quality Control Boards’ (RWQCBs’) prevention, regulatory, and remedial actions. Pursuant to this directive, the SWRCB has developed the Surface Water Ambient Monitoring Program (SWAMP). SWAMP is a new and comprehensive program which will (1) integrate the existing water quality monitoring of the SWRCB and RWQCBs and (2) coordinate with monitoring programs of other agencies, dischargers, and citizens groups. Overview of the Surface Water Ambient Monitoring Program (SWAMP) SWAMP Program Goals SWAMP is intended to meet four goals as follows: 1. Create an ambient monitoring program that addresses all hydrologic units of the State using
consistent and objective monitoring, sampling and analytical methods; consistent data quality assurance protocols; and centralized data management. This will be an umbrella program that monitors and interprets those data for each hydrologic unit at least one time every five years.
2. Document ambient water quality conditions in potentially clean and polluted areas. The scale for these assessments ranges from the site-specific to statewide.
3. Identify specific water quality problems preventing the SWRCB, RWQCBs, and the public from realizing beneficial uses of water in targeted watersheds.
4. Provide the data to evaluate the overall effectiveness of water quality regulatory programs in protecting beneficial uses of waters of the State.
The Surface Water Ambient Monitoring Program (SWAMP) is a combination of (1) regional monitoring to provide a picture of the status and trends in water quality and (2) site-specific monitoring to better characterize problem and clean locations. This approach balances these two important monitoring needs of the SWRCB and serves as a unifying framework for the monitoring activities being conducted by the SWRCB and RWQCBs. The coordinated SWRCB and RWQCB involvement in study design and sampling is critical to providing comprehensive, effective monitoring. This document represents the North Coast Region’s workplan for the third year of the SWAMP program or FY02-03. The workplan for FY 01-02 is attached for reference as Attachment D. North Coast Region’s Goals and Objectives for FY2002-03 The watershed evaluation process employed by the North Coast Region (NCR) is responsive to the Watershed Management Initiative as called for in the State Water Resources Control Board Strategic Plan (June 22, 1995). It essentially involves designating Watershed Management Areas (WMAs) and performing steps as described below:
• assessing water quality related issues on a watershed basis, • developing prioritized water quality goals for watersheds from the issues, • addressing the issues with various programs through a multi-year implementation strategy, and • evaluating progress at the end of a specified time period.
Page 3 of 3

The NCR rotates through watersheds on a planned basis as resources allow. The NCR believes that this is the best use of resources at this time: to focus on a few WMAs at a time, cycling back through them every five to seven years. Having the cycle identified and the goals prioritized will make resource needs more apparent. The management areas are prioritized based on a number of factors, including the known water quality impairment, adequacy of existing data, the extent of development and/or land use change, likelihood for problems to increase, and the availability of management tools for the problems. The overall goal for SWAMP in FY02-03 is to continue this process by developing site-specific information on sites that are (1) known or suspected to have water quality problems and (2) known or suspected to be clean. It is intended that this portion of SWAMP will be targeted at specific locations in each WMA, and focus on collecting information from sites in water bodies of the State to support remedial actions as well as the potential listing or delisting under Clean Water Act Section 303(d). Information collected through this program will also be used in the development of TMDL’s as appropriate. For FY 02-03, the regional board has responsibility to develop nutrient and/or temperature TMDL Technical Support Documents (TSD’s) in the Klamath Basin for the Clear Lake Reservoir area and the Salmon River. TSD’s for the Lost River and Tule Lake area as well as the Scott and Shasta Rivers will follow in FY 03-04. (See North Coast Watershed Planning Chapter, Table 2.7-1, page 209). In addition to the SWAMP effort, there is another closely coordinated assessment effort in place in the North Coast Region called The North Coast Watershed Assessment Program (NCWAP) that will provide valuable assessment information to resource managers and to the Regional Board. The North Coast Watershed Assessment Program (NCWAP) is a multi-agency effort led by the California Resources Agency. The principal goal of NCWAP is to compile and develop baseline scientific information about existing biophysical conditions in north coast watersheds. The Resources Agency initiated this program in response to requests from landowners, industry and environmental groups, watershed groups, a Science Review Panel on Forest Practices, and other stakeholders that the state take a leadership role in conducting interdisciplinary watershed assessments which could be used for guiding decision making. The goals of this program are: • Provide a baseline of data for evaluating the effectiveness of various resource protection programs
over time; • Guide watershed restoration programs, e.g., targeting grant dollars to those projects that most
efficiently and effectively recover salmonid populations, and assisting local watershed groups, counties, etc., to develop successful projects;
• Guide cooperative interagency, nonprofit and private sector approaches to “protect the best” through stewardship, easement and other incentive programs;
• Help landowners and agencies implement laws that require specific assessments such as the State Forest Practice Act, Clean Water Act and State Lake and Streambed Alteration Act.
• The NCWAP is on a schedule to assess approximately one million acres a year for a 7-year period. Being largely dependent on existing information, NCWAP is closely integrated with SWAMP in both timing and site location. In the North Coast region, the SWAMP uses a two-component approach to address regional and site-specific monitoring: 1) long-term monitoring sites for trend analysis, and 2) rotating intensive basin surveys. The rotation schedule is closely coordinated with the NCWAP assessment schedule, and the TMDL schedule to provide additional and current information on water quality parameters to the NCWAP assessment and TMDL process. II Sites to be Monitored North Coast Region – Description and Water Quality Issues Please see Attachment D: “SWAMP Workplan for FY 2001-02”
Page 4 of 4

III Site Identification ,Monitoring Activities and Objectives This section of the workplan will address site identification organized by Basin Plan Hydrologic Unit Code (HUC) and further referenced to Watershed Management Areas as identified in the North Coast Regional Water Quality Control Board Watershed Planning Chapter. For each HUC a table is presented detailing the beneficial uses to be protected and the monitoring objectives for that particular site or station. Monitoring frequency and water quality indicators used for that site are also enumerated. For a complete description of the indicators used, please refer to Attachment C: “Site Specific Monitoring”, Table 3, Pgs 10 through 12. Smith River Hydrologic Unit (103). The Smith River is within the larger North Coast Rivers Watershed Management Area (WMA) within the Watershed Planning Chapter. Under the Federal Endangered Species Act (ESA), the Smith River watershed is wholly contained in the Northern California Coast Evolutionary Significant Unit (ESU) for Coho salmon. As such, it is designated as critical habitat for Coho salmon, listed as “threatened” under the ESA in 1997. The Smith River Plains area has not been comprehensively sampled for pesticides for nearly a decade and several new chemicals are in use. Expansion of agricultural practices such as lily fields and floral greenhouses has occurred at a rapid rate over the past several years and investigation of the impacts of pesticide and fertilizer use on surface and ground water is warranted. There is also a concern about dairies and the impact of manure on the lower Smith River. Surface Water Ambient Monitoring Program Monitoring Stations for the Smith River Hydrologic Unit (103)
Smith River Hydrologic Unit (103) – FY 2002-03 Monitoring Activities Station (Type) (1)
HUC Beneficial Use(s) Monitoring Objectives (2) Freq (3) Category Indicator(s) (4)
SMHFIS (P) 103.11
(Smith River – d/s Dr. Fine Bridge)
MUN,REC1,REC2,RARE, COLD,SPWN,MIGR,WILD
1,2,3,5,9,10,11,12,13
5 C 4 O 3 H
Contaminant Exposure, Biological Response, Pollutant Exposure, Habitat
Inorganic and Organic Water Chemistry, Herbicides, Chl-a, Nutrients, Total Organic Carbon, Dissolved Oxygen, Water Temperature, Vitellogenin
SMHSFK (P) 103.20
(Smith River – South Fork above
Hiouchi)
MUN,REC1,REC2,RARE, COLD,SPWN,MIGR,WILD
1,2,3,5,9,10,11,12,13
5 C 4 O
Contaminant Exposure, Biological Response, Pollutant Exposure, Habitat
Inorganic and Organic Water Chemistry, Chl-a, Nutrients, Total Organic Carbon, Dissolved Oxygen, Water Temperature, Vitellogenin
SMHMAN (P) 103.20
(Smith River – u/s South Fork)
MUN,REC1,REC2,RARE, COLD,SPWN,MIGR,WILD
1,2,3,5,9,10,11,12,13
5 C 4 O
Contaminant Exposure, Biological Response, Pollutant Exposure,
Inorganic and Organic Water Chemistry, Chl-a, Nutrients, Total Organic Carbon, Dissolved Oxygen,
Page 5 of 5

Smith River Hydrologic Unit (103) – FY 2002-03 Monitoring Activities Station (Type) (1)
Beneficial Use(s) Monitoring (2) Freq (3) Category Indicator(s) (4) HUC Objectives
Habitat Water Temperature, Vitellogenin
Notes: 1. Type: P = Permanent, R = Rotating 2. Monitoring Objectives: See Attachment C: Site-Specific Monitoring
3. Frequency: N = number of samples per FY, C= Conventional Water Chemistry O = Organic Water Chemistry H = Herbicides
4. Indicator: See Attachment C: Site-Specific Monitoring Klamath River Hydrologic Unit (105). Klamath River Hydrologic Unit is scheduled for more intensive investigation during this rotation cycle. Accordingly, monitoring at all the permanant stations will be augmented by the addition of a number of additional monitoring sites along the mainstem and tributaries. Klamath River Hydrologic Unit as addressed in Region One’s WMI Chapter as The Klamath River Watershed Management Area (most of that portion of the overall Klamath River Basin which is within the State of California), has been divided into three sub-basins: Lower Klamath, Middle Klamath and Upper Klamath. This division helps us recognize that the size of the overall basin, and its diversity in climatic and geologic facets and land uses affect water quality in different ways in different sub-areas of the basin. In addition to this for-convenience segmentation of the watershed area within California, we recognize that roughly half of the watershed is north (and mostly upstream) of the California -Oregon state border. This “segment” of the basin in Oregon has profound effects on the quality and quantity of the Klamath River in California. Each sub-basin is described below:
The Lower Klamath sub-basin encompasses that portion of the Klamath River and its tributary watershed downstream from the Scott River to the Pacific Ocean (excluding the Trinity River), and is 2,564 square miles in area. Included in the watershed are the Salmon River, Indian Creek, Clear Creek, Blue Creek and numerous smaller perennial streams, and the Klamath River delta/estuary. The area is largely rugged, steep forest land with highly erodable soils. The population of the area is small and scattered. Water quality issues have arisen as a result of unauthorized discharges or inadequately treated residential sewage. Current water quality issues in the sub-basin are related to the salmonid-habitat qualities of the mainstem river and the effects of silvicultural activities on both federal and private lands to the tributaries. These issues include high summertime temperatures, sedimentation, erosion, mass wasting and stream modifications which affect salmonid habitats, and forest land herbicide applications which threaten domestic water supplies. Under the Federal Endangered Species Act (ESA), the Lower Klamath sub-basin is wholly contained in the Southern Oregon/Northern California Coast Evolutionary Significant Unit (ESU) for Coho salmon. As such, it is designated as critical habitat for Coho salmon, listed as “threatened” under the ESA in 1997.
The Middle Klamath sub-basin is 2,850 square miles in area and encompasses that portion of the Klamath River and tributaries between the confluence of the Klamath and Scott Rivers and Iron Gate Dam. Included in the watershed are the mainstem Klamath, the Shasta and Scott River watersheds and lesser tributaries. The two major tributaries, the Shasta and Scott Rivers, receive localized precipitation as well as snow and glacial melt from nearby mountain ranges. The quality of water from Iron Gate reservoir (which is the sum total of the effects of reservoir limnology, up-river irrigation development and hydropower hydrology), agriculture in the Shasta and Scott Valleys and silvicultural activities in the remainder of the drainage are the major issues. Other
Page 6 of 6

water quality issues are related to surface water and ground water contamination from toxic chemical discharges in the Weed and the Yreka areas. Under the Federal Endangered Species Act (ESA), the Middle Klamath sub-basin is wholly contained in the Southern Oregon/Northern California Coast Evolutionary Significant Unit (ESU) for Coho salmon. As such, it is designated as critical habitat for Coho salmon, listed as “threatened” under the ESA in 1997. The Upper Klamath sub-basin includes watershed areas in California that are upstream of Iron Gate Dam. Many natural and human-altered watershed elements above Iron Gate and across the California -Oregon border affect the quality and quantity of water which exits Iron Gate Dam, supplies the mainstem flow, and affects (both supports and jeopardizes) the beneficial uses of the River within California. The complexity of this sub-basin is magnified by jurisdictional issues associated with water-delivery/utilization infrastructures (including the Federal Klamath Project irrigation), hydropower, endangered species, tribal rights, lake-level-management demands for Upper Klamath Lake, the waters criss-crossing the California -Oregon border, and minimum flow requirements in the Klamath below Iron Gate Dam. Most of the Upper Klamath watershed area is in Oregon. The primary sub-watershed in California is the Lost River watershed, which is 1,689 square miles in area. That sub-watershed, which is about half-and-half in California and Oregon, encompasses Clear Lake Reservoir and most of its tributaries in California, the agricultural and contributing areas in Oregon, and back in California, the agricultural and wildlife-refuge areas which were once the bottom of Tule Lake and the Lower Klamath Lake. The Lost River basin was, until Euroamerican settlement and development including farmland “reclamation” and construction of the railroad, periodically connected to the Klamath River via the marshes which occurred south of what is now the community of Klamath Falls, Oregon. Further south, the marsh-river systems dead-ended in Tule Lake that was a closed part of the basin with no natural outlet. The lower end of this basin has been modified to support agricultural crop production, and consequently an artificial outlet has been provided for Lost River water to be pumped into Lower Klamath Lake. Lower Klamath Lake was originally a backwater of the Klamath River, but has been extensively modified for agriculture and a wildlife refuge. Water leaving that system is discharged northward, back into Oregon to the Klamath River, via the Klamath Straits Drain. Much of the former wetlands in the basin are now intensively managed for wildlife as part of the Klamath Basin National Wildlife Refuges, with mingled and overlapping cropping and wildlife uses. Primary beneficial uses in the upper Klamath basin are domestic, agricultural and industrial water supply, cold and warm water fisheries, and recreation. The shortnosed sucker (Chamistes brevirostris) and Lost River sucker (Deltistes luxatus), native to the watershed, are listed as endangered under the federal Endangered Species Act of 1973.
Ground water is now part of the surface water system, since numerous high production wells were brought online in 2001 to augment surface flows. Additional wells are expected to be developed and will add to the surface water flow regime in 2002. The Regional Water Board expects to regulate these ground water discharges to surface water under the NPDES program Monitoring priorities and needs detail for the Klamath WMA The Surface Water Monitoring Program (SWAMP) will rotate intensive surveys into the Klamath WMA in FY 2002-03. The intensive survey will focus on overall assessment of water quality in the WMA, and address assessment of known problem areas.
Page 7 of 7
Additional assessment by Regional Water Board staff is needed to test hypotheses about support of beneficial uses MUN, REC1, COLD, RARE, or provide assessment information essential for program implementation.

1. Nutrient and Eutrophication Studies An intensive nutrient, temperature and dissolved oxygen monitoring and assessment program was funded for two years on the upper and middle Klamath River. The effort continues with some 205(j) funds, and by other agencies and entities in the upper and middle Klamath River without significant involvement by Regional Water Board staff. We should be collecting data specific to our needs for TMDL development and implementation of nonpoint source controls. We have established four permanent stations in the upper and middle Klamath in FY 2000-01. The intensive survey planned for FY 2002-03 will focus more intensively on problem areas. 2. Sedimentation – The Scott River watershed is 303(d) listed for sediment impacts. Assessment of sediment sources and impacts is needed to assist in developing a TMDL sedimentation reduction strategy for the watershed. A Section 205(j) project with the Siskiyou RCD is evaluating sediment sources in Moffett Creek. Additional assessment is needed in the lower Klamath River tributaries (Terwer, Blue, High Prairie, Hunter). For FY 01-02 we have established one permanent and four rotating stations on the Scott River. 3. Lake Shastina Toxics While cleanup activities continue on Beaughton and Boles creeks to eliminate metals, dioxins, and MtBE contamination, new sources have been identified. Additional assessment is needed to determine the extent of the problem in the tributaries and Lake Shastina. For FY01-02 three monitoring stations were planned in the Shasta River, at the Highway 3 crossing, at the Highway 263 crossing and near Big Springs, downstream from Parks Creek at East Louie Road. The intent was to address toxics as well as nutrient issues (#1 above). SWAMP was unable to obtain access at the both the Highway 3 crossing and at East Louis Road. New stations will be added for this rotation where access will not be restricted. 4. Chemicals in POTWs Petroleum products, including solvents, MTBE, and gasoline, as well as pesticides should be sampled in the influent and effluent of POTWs. The current SWAMP rotation will address this need if resources allow. 5. Pesticides in Tulelake The U.S. Geological Survey assessed pesticides in the basin some years ago. Additional assessment keyed to current agricultural chemical use should be performed. The current SWAMP rotation in FY 2002-03 may be able to partially address this need. 6. Yreka Creek Petroleum While groundwater contamination from solvents and other petroleum products are documented and being addressed to varying degrees, contamination of Yreka Creek from contiguous ground waters is a concern. To date no significant problems have been identified, however it remains a concern. For this rotation, a station has been added in Yreka Creek at Anderson Road Bridge. The SWAMP has addressed some monitoring issues in the WMA in FY 2000-01, and will continue to do for the rotation into the WMA in FY 2002-03. Listed below are the planned and proposed monitoring activities under the program: SWAMP plans to assist in the effort to obtain basin wide water temperature profiles using thermal infrared imaging. SWAMP funds will be used to fund the portion of the study that involves the Scott and Shasta rivers during the summer of FY 02-03. Long-term monitoring stations: Seven long-term stations will be maintained in the WMA as initiated in FY 2000-01: Klamath River at Klamathon, near Empire Creek, near Horse Creek, at Seiad Valley, at Weitchpec; Shasta River at the mouth; Scott River at the mouth. Other long-term stations in the WMA will be proposed if appropriate from the rotation in FY 2002-03.
Page 8 of 8

Short term stations: For the current rotation, four short-term stations have been established along the mainstem to provide additional data. The stations are located at Klamath Glenn, Martins Ferry, Orleans and at Shovel Creek. In addition to collecting the five grab samples scheduled for the various sites, continuously recording data loggers will be deployed at selected stations to capture water quality data on a much finer temporal scale. Commonly, sample intervals of 15 to 30 minutes are used to resolve weekly or diel fluctuations in dissolved oxygen, pH, specific conductivity and temperature. Surface Water Ambient Monitoring Program Monitoring Stations for the Klamath River Watershed Management Area – HUC 105
Klamath River Hydrologic Unit (105) - FY 2002-03 Monitoring Activities Station (Type) (1)
HUC Beneficial Use(s) Monitoring Objectives (2)
Freq (3) Category(s) Indicator(s) (4)
KLAMGL (R) 105.11
(Klamath River at Klamath Glenn)
MUN,REC1,REC2,RARE, COLD,SPWN,MIGR,WILD
1,2,3,9,10,11,12,13
5 C 4 O
Contaminant Exposure, Biological Response, Pollutant Exposure, Habitat
Inorganic and Organic Water Chemistry, Chl-a, Nutrients, Total Organic Carbon, Dissolved Oxygen, Water Temperature, Vitellogenin
KLAMWP (P) 105.12
(Klamath River at Weitchpec)
MUN,REC1,REC2,RARE, COLD,SPWN,MIGR,WILD
1,2,3,9,10,11,12,13 5 C
Contaminant Exposure, Biological Response, Pollutant Exposure, Habitat
Inorganic Water Chemistry, Chl-a, Nutrients, Total Organic Carbon, Dissolved Oxygen, Water Temperature, Vitellogenin
KLAMOR (R) 105.12
(Klamath River at Orleans)
MUN,REC1,REC2,RARE, COLD,SPWN,MIGR,WILD
1,2,3,9,10,11,12,13 5 C
Contaminant Exposure, Biological Response, Pollutant Exposure, Habitat
Inorganic Water Chemistry, Chl-a, Nutrients, Total Organic Carbon, Dissolved Oxygen, Water Temperature, Vitellogenin
KLAEVC (P) 105.33
(Klamath River below Horse
Creek)
MUN,REC1,REC2,RARE, COLD,SPWN,MIGR,WILD
1,2,3,9,10,11,12,13 5 C
Contaminant Exposure, Biological Response, Pollutant Exposure, Habitat
Inorganic Water Chemistry, Chl-a, Nutrients, Total Organic Carbon, Dissolved Oxygen, Water Temperature
KLAMSI (P) 105.33
(Klamath River at Seiad Valley)
MUN,REC1,REC2,RARE, COLD,SPWN,MIGR,WILD
1,2,3,9,10,11,12,13 5 C
Contaminant Exposure, Biological Response, Pollutant Exposure, Habitat
Inorganic Water Chemistry, Chl-a, Nutrients, Total Organic Carbon, Dissolved Oxygen, Water Temperature
KLARMP (P) 105.35
(Klamath River at Gottville River
Access)
MUN,REC1,REC2,RARE, COLD,SPWN,MIGR,WILD
1,2,3,9,10,11,12,13 5 C
Contaminant Exposure, Biological Response, Pollutant
Inorganic Water Chemistry, Chl-a, Nutrients, Total Organic Carbon, Dissolved
Page 9 of 9

Klamath River Hydrologic Unit (105) - FY 2002-03 Monitoring Activities Station (Type) (1)
Beneficial Use(s) Monitoring (2)
Freq (3) Category(s) Indicator(s) (4) HUC Objectives
Page 10 of 10
Exposure, Habitat
Oxygen, Water Temperature,
KLAMCO (P) 105.37
(Klamath River below Iron Gate)
MUN,REC1,REC2,RARE, COLD,SPWN,MIGR,WILD
1,2,3,9,10,11,12,13
5 C 4 O
Contaminant Exposure, Biological Response, Pollutant Exposure, Habitat
Inorganic and Organic Water Chemistry, Chl-a, Nutrients, Total Organic Carbon, Dissolved Oxygen, Water Temperature, Vitellogenin
KLAMSTL (R) 105.38
(Klamath River at State Line)
MUN,REC1,REC2,RARE, COLD,SPWN,MIGR,WILD
1,2,3,9,10,11,12,13
5 C 4 O
Contaminant Exposure, Biological Response, Pollutant Exposure, Habitat
Inorganic and Organic Water Chemistry, Chl-a, Nutrients, Total Organic Carbon, Dissolved Oxygen, Water Temperature
SCOTSH (P) 105.40
(Scott River at Steel Head)
MUN,REC1,REC2,RARE, COLD,SPWN,MIGR,WILD
1,2,3,9,10,11,12,13
5 C 4 O 3 H
Contaminant Exposure, Biological Response, Pollutant Exposure, Habitat
Inorganic and Organic Water Chemistry, Herbicides, Chl-a, Nutrients, Total Organic Carbon, Dissolved Oxygen, Water Temperature
SCOTJB (R) 105.42
(Scott River at Jones Beach)
MUN,REC1,REC2,RARE, COLD,SPWN,MIGR,WILD
1,2,3,9,10,11,12,13
5 C 4 O 3 H
Contaminant Exposure, Biological Response, Pollutant Exposure, Habitat
Inorganic and Organic Water Chemistry, Herbicides, Chl-a, Nutrients, Total Organic Carbon, Dissolved Oxygen, Water Temperature
SCOTET (R) 105.42
(Scott River u/s of Etna Creek)
MUN,REC1,REC2,RARE, COLD,SPWN,MIGR,WILD
1,2,3,9,10,11,12,13
5 C 4 O 3 H
Contaminant Exposure, Biological Response, Pollutant Exposure, Habitat
Inorganic and Organic Water Chemistry, Herbicides, Chl-a, Nutrients, Total Organic Carbon, Dissolved Oxygen, Water Temperature
SCOTCA (R) 105.42
(Scott River at Callahan)
MUN,REC1,REC2,RARE, COLD,SPWN,MIGR,WILD
1,2,3,9,10,11,12,13
5 C 4 O
Contaminant Exposure, Biological Response, Pollutant Exposure, Habitat
Inorganic and Organic Water Chemistry, Chl-a, Nutrients, Total Organic Carbon, Dissolved Oxygen, Water Temperature
YREAND 105.50
(Yreka Creek at Anderson Rd.)
MUN,REC1,REC2,RARE, COLD,SPWN,MIGR,WILD
1,2,3,9,10,11,12,13
5 C 4 O 3 H
Contaminant Exposure, Biological Response,
Inorganic and Organic Water Chemistry, Herbicides, Chl-a,

Klamath River Hydrologic Unit (105) - FY 2002-03 Monitoring Activities Station (Type) (1)
Beneficial Use(s) Monitoring (2)
Freq (3) Category(s) Indicator(s) (4) HUC Objectives
Pollutant Exposure, Habitat
Nutrients, Total Organic Carbon, Dissolved Oxygen, Water Temperature
SHA263 (P) 105.50
(Shasta River at Highway 263)
MUN,REC1,REC2,RARE, COLD,SPWN,MIGR,WILD
1,2,3,9,10,11,12,13
5 C 4 O 3 H
Contaminant Exposure, Biological Response, Pollutant Exposure, Habitat
Inorganic and Organic Water Chemistry, Herbicides, Chl-a, Nutrients, Total Organic Carbon, Dissolved Oxygen, Water Temperature
SHAMON (P) 105.50
(Shasta River at Montegue)
MUN,REC1,REC2,RARE, COLD,SPWN,MIGR,WILD
1,2,3,9,10,11,12,13
5 C 4 O 3 H
Contaminant Exposure, Biological Response, Pollutant Exposure, Habitat
Inorganic and Organic Water Chemistry, Herbicides, Chl-a, Nutrients, Total Organic Carbon, Dissolved Oxygen, Water Temperature
SHAEDG (R) 105.50
(Shasta River nr Edgewood)
MUN,REC1,REC2,RARE, COLD,SPWN,MIGR,WILD
1,2,3,9,10,11,12,13
5 C 4 O 3 H
Contaminant Exposure, Biological Response, Pollutant Exposure, Habitat
Inorganic and Organic Water Chemistry, Herbicides, Chl-a, Nutrients, Total Organic Carbon, Dissolved Oxygen, Water Temperature
Notes: 1. Type: P = Permanent, R = Rotating
2. Monitoring Objectives: See Attachment C: Site-Specific Monitoring 3. Frequency: N = number of samples per FY, C= Conventional Water Chemistry O = Organic Water Chemistry H = Herbicides
4. Indicator: See Attachment C: Site-Specific Monitoring Trinity River Hydrologic Unit (106). The Trinity River comprises the Trinity WMA as described in the Watershed Planning Chapter. The Trinity River, a wild and scenic river located in northwestern California, is the largest tributary to the Klamath River. Its basin drains an area of about 2900 square miles of mountainous terrain, with its headwater streams originating in the Klamath and Coast Ranges. From its headwaters, the river flows 172 miles south and west through Trinity County, then north through Humboldt County and the Hoopa Valley and Yurok Indian reservations. The confluence with Klamath River at Weitchpec is about 43 miles upstream from the Pacific Ocean. In the early 1950’s two major water-development features: Lewiston Dam and its reservoir and related facilities and Trinity Dam and its reservoir, known as Trinity Lake, which are jointly known as the Trinity River Division of the Bureau of Reclamation’s Central Valley Project (CVP) were installed above River-Mile 112 and the community of Lewiston. Water stored and released from the Trinity Dam reservoir is used for power generation and diverted to out-of-Basin multiple uses throughout the Central Valley of California.
Page 11 of 11

Since the installation of the Trinity River Division (TRD) works, the Lewiston Dam is the uppermost limit of natural salmon and steelhead fish-migration. A fish hatchery and rearing facilities were constructed and operate as part of the TRD to mitigate for the loss of upstream habitat. Trinity Lake has been stocked with a variety of nonnative fish, including Smallmouth and Largemouth bass and Kokanee (landlocked Sockeye salmon). Trinity River downstream of TRD is habitat for not only the anadromous salmonids and other native species, but also has populations of brown trout. Under the Federal Endangered Species Act (ESA), the Trinity River downstream of the Lewiston Dam is wholly contained in the Southern Oregon/Northern California Coast Evolutionary Significant Unit (ESU) for Coho salmon. As such, it is designated as critical habitat for Coho salmon, listed as “threatened” under the ESA in 1997. The public lands that adjoin the TRD facilities are managed for multiple uses as part of the Whiskeytown-Shasta-Trinity National Recreation Area; those in upper portions of the basin are managed as components of the US Shasta -Trinity and Six Rivers National Forests. Private timberlands, ranches and residential properties are mostly near the Highway 3-Highway 299 corridors in the southeastern part of the basin. The Hoopa Valley Reservation occupies about 170 square miles on both sides of the lowest 15 miles of the river. This WMA is mostly rural with human population centered near Trinity Center, Weaverville, Lewiston, Hayfork and Hyampom. The only large-scale agriculture is cattle grazing. Timber harvest continues but at a much reduced level than in the past on Federal lands. However, the intensity and scope of logging appears to be increasing in private lands. Toxicity concerns center around acid mine drainage from abandoned mines and past mining activities, sediment release from subdivision development and eroded roads in areas with unstable soil and decomposed granite, septic tank use, aboveground and underground tanks, and lumber mills. The U.S. Forest Service and the Bureau of Land Management federally manage approximately 80 percent of the land in the Trinity WMA. Of the remaining 20 percent of the basin, which is privately owned, approximately half are industrial timberlands. Old existing access roads that are not maintained or properly decommissioned are a continual source of sedimentation into the Trinity River and its tributaries. Tourism including boating and rafting, is a significant part of the economy of this area. Starting in 2000, in a cooperative endeavor with federal land management agencies including the U.S. Forest Service, Shasta-Trinity National Forest and the Bureau of Land Management, the U.S. Geological Service began collecting water and fish tissue samples in the Trinity River watershed upstream of Trinity Dam – an area having a long history of mining activity dating back to the early 1850s. Water samples analyzed to date (last two years) had low concentrations of mercury. Fish tissue samples had varying degrees of mercury contamination. Water Quality Goals and Actions The broad goals for the Trinity River WMA include improving the anadromous fishery through sediment reductions and habitat enhancements and maintaining the other high beneficial uses of both surface and ground water. Three specific goals for the Trinity River were identified in the Watershed Planning Chapter and are related through the beneficial uses they address: • GOAL 1: Protect and enhance salmonid resources (COLD, MIGR, SPWN, RARE) • GOAL 2: Protect and enhance ground water resources and attendant beneficial uses • GOAL 3: Protect all other surface water uses The protection of cold water fisheries (Goal 1) requires the protection of surface water (Goal 3) and ground water (Goal 2) along with additional concerns for siltation, habitat loss, temperature and low tributary flows. Actions for protecting the beneficial uses for Goal 1 (COLD) largely
Page 12 of 12

serve to protect all other uses, except MUN. Surface Water Monitoring Program Monitoring Stations for the Trinity River Watershed Management Area - HUC 106
Trinity River Hydrologic Unit (106) - FY 2002-03 Monitoring Activities Station (Type) (1)
HUC Beneficial Use(s) Monitoring Objectives (2) Freq (3) Category(s) Indicator(s) (4)
TRINHP (R) 106.11
(Trinity River at Hoopa)
MUN,REC1,REC2, COLD, SPWN, MIGR, WILD
1,2,3,9,10,11,12,13 5 C
Contaminant Exposure, Biological Response, Pollutant Exposure, Habitat
Inorganic Water Chemistry, Chl-a, Nutrients, Total Organic Carbon, Dissolved Oxygen, Water Temperature
TRINWP (P) 106.11
(Trinity River at Weitchpec)
MUN,REC1,REC2, COLD, SPWN, MIGR, WILD
1,2,3,5,9,10, 11,12,13 5 C
Contaminant Exposure, Biological Response, Pollutant Exposure, Habitat
Inorganic Water Chemistry, Chl-a, Nutrients, Total Organic Carbon, Dissolved Oxygen, Water Temperature, Vitellogenin
TRINSL (R) 106.13
(Trinity River at Salyer)
MUN,REC1,REC2, COLD, SPWN, MIGR, WILD
1,2,3,9,10,11,12,13
5 C 4 O 3 H
Contaminant Exposure, Biological Response, Pollutant Exposure, Habitat
Inorganic and Organic Water Chemistry, Herbicides, Chl-a, Nutrients, Total Organic Carbon, Dissolved Oxygen, Water Temperature
TRNNFH (R) 106.15
(Trinity River – North Fork at
Helena)
MUN,REC1,REC2, COLD, SPWN, MIGR, WILD
1,2,3,9,10,11,12,13
5 C 4 O 3 H
Contaminant Exposure, Biological Response, Pollutant Exposure, Habitat
Inorganic and Organic Water Chemistry, Herbicides, Chl-a, Nutrients, Total Organic Carbon, Dissolved Oxygen, Water Temperature, Vitellogenin
TRINSF (R) 106.21
(Trinity River – South Fork near
Salyer)
MUN,REC1,REC2, COLD, SPWN, MIGR, WILD
1,2,3,9,10,11,12,13
5 C 4 O 3 H
Contaminant Exposure, Biological Response, Pollutant Exposure, Habitat
Inorganic and Organic Water Chemistry, Herbicides, Chl-a, Nutrients, Total Organic Carbon, Dissolved Oxygen, Water Temperature
TRINDC (R) 106.31
(Trinity River at Douglas City)
MUN,REC1,REC2, COLD, SPWN, MIGR, WILD
1,2,3,9,10,11,12,13 5 C
Contaminant Exposure, Biological Response, Pollutant Exposure, Habitat
Inorganic Water Chemistry, Chl-a, Nutrients, Total Organic Carbon, Dissolved Oxygen, Water Temperature
TRINPB (R) 106.31
MUN,REC1,REC2, COLD, SPWN, MIGR, WILD
1,2,3,9,10,11,12,13 5 C Contaminant
Exposure, Inorganic Water Chemistry, Chl-a,
Page 13 of 13

Trinity River Hydrologic Unit (106) - FY 2002-03 Monitoring Activities Station (Type) (1)
Beneficial Use(s) Monitoring (2) Freq (3) Category(s) Indicator(s) (4) HUC Objectives
(Trinity River at Poker Bar – d/s
Grass Valley Creek)
Biological Response, Pollutant Exposure, Habitat
Nutrients, Total Organic Carbon, Dissolved Oxygen, Water Temperature
TRHTCH (P) 106.32
(Trinity River at Lewiston)
MUN,REC1,REC2, COLD, SPWN, MIGR, WILD
1,2,3,5,9,10,11,12,13 5 C
Contaminant Exposure, Biological Response, Pollutant Exposure, Habitat
Inorganic Water Chemistry, Chl-a, Nutrients, Total Organic Carbon, Dissolved Oxygen, Water Temperature, Vitellogenin
Notes: 1. Type: P = Permanent, R = Rotating 2. Monitoring Objectives: See Attachment C: Site-Specific Monitoring
3. Frequency: N = number of samples per FY, C= Conventional Water Chemistry O = Organic Water Chemistry
4. Indicator: See Attachment C: Site-Specific Monitoring Redwood Creek Hydrologic Unit (107). Redwood Creek comprises a portion of the Humboldt Bay Watershed Management Area and is largely National Park land in the lower section of the watershed and along the main stem. However, private industrial timberland comprises a significant portion of the upper watershed and tributary areas. Redwood Creek supports production of anadromous salmonids, including steelhead and cutthroat trout, and coho and chinook salmon. It appears that sedimentation has moved into the lower part of the watershed from past activities in the upper watershed. The National Park staff is conducting assessments of documented problem areas and follow-up coordination for implementing controls is being conducted. A Section 303(d) Water Quality Attainment Strategy (“TMDL”) will build upon the existing efforts to coordinate activities in the watershed to benefit enhancement of the salmonid resources. Redwood Creek is also a NCWAP assessment watershed for the calendar year 2001. Under the Federal Endangered Species Act (ESA), the Redwood Creek is wholly contained in the Northern California Evolutionary Significant Unit (ESU) for Steelhead, listed as “threatened” under the ESA in 2000. The National Marine Fisheries Service (NMFS) is currently developing Steelhead critical habitat status and description for this ESU. Redwood Creek is also wholly contained in the California Coastal Evolutionary Significant Unit (ESU) for Chinook salmon. As such, it is designated as critical habitat for Chinook salmon, listed as “threatened” under the ESA in 1999. Surface Water Monitoring Program Monitoring Stations for the Redwood Creek Hydrologic Unit (107).
Redwood Creek Hydrologic Unit (107) - FY 2002-03 Monitoring Activities Station (Type) (1)
HUC Beneficial Use(s) Monitoring Objectives (2)
Freq (3) Category(s) Indicator(s) (4)
RDWDOR (P) 107.10
(Redwood Creek at Orick)
MUN,REC1,REC2, COLD, SPWN, MIGR, WILD
1,2,3,9,10,11,12,13
5 C 4 O 3 H
Contaminant Exposure, Biological Response,
Inorganic and Organic Water Chemistry, Herbicides, Chl-a,
Page 14 of 14

Redwood Creek Hydrologic Unit (107) - FY 2002-03 Monitoring Activities Station (Type) (1)
Beneficial Use(s) Monitoring (2)
Freq (3) Category(s) Indicator(s) (4) HUC Objectives
Pollutant Exposure, Habitat
Nutrients, Total Organic Carbon, Dissolved Oxygen, Water Temperature
Notes: 1. Type: P = Permanent, R = Rotating 2. Monitoring Objectives: See Attachment C: Site-Specific Monitoring
3. Frequency: N = number of samples per FY, C= Conventional Water Chemistry O = Organic Water Chemistry
4. Indicator: See Attachment C: Site-Specific Monitoring Mad River Hydrologic Unit (109) The Mad River Hydrologic Unit comprises a portion of the Humboldt Bay Watershed Management Area as identified in the Watershed Planning Chapter. The Mad River watershed is mixed private and Forest Service timberland with a long history of timber harvest. Adding to the mix is gravel mining in the lower portions of the watershed. The Mad River is Section 303(d) listed for turbidity and temperature impacts. The primary issues for the watershed are forestry-related, with urbanization and associated industrial and public point sources. For the Mad River and its tributaries, discharge of waste is allowed only under NPDES permit during the period of October 1 through May 14 and at 1% of the flow of the receiving water. The McKinleyville Community Services District discharges municipal effluent to the Mad River in compliance with those restrictions. The City of Blue Lake does not discharge directly, disposing of effluent in percolation/evaporation ponds. Ruth Lake - a 48,000 acre foot reservoir on the Mad River is the primary water source for the Humboldt Bay Municipal Water District (HBMWD). The HBMWD is a wholesale water agency that serves the greater Humboldt Bay area - including the cities of Eureka, Arcata and Blue Lake, as well as Community Service Districts serving unincorporated areas such as McKinleyville, Cutten, Fairhaven, Fieldbrook and Manila. The population served via these agencies totals about 65,000 people. HBMWD's service area contains a large variety of business and industry; College of the Redwoods, a two year community college; and, Humboldt State University, a campus of the California State University System. MtBE was detected in Ruth Lake upstream of public and private water supplies. Additional sampling is needed to define the extent of the problem. Since sampling in FY 01-02 detected low concentrations of MtBE in Ruth Lake, monitoring is planned to continue for FY 02-03. Under the Federal Endangered Species Act (ESA), the Mad River is wholly contained in the Northern California Evolutionary Significant Unit (ESU) for Steelhead, listed as “threatened” under the ESA in 2000. The National Marine Fisheries Service (NMFS) is currently developing Steelhead critical habitat status and description for this ESU. The Mad River is also wholly contained in the California Coastal Evolutionary Significant Unit (ESU) for Chinook salmon. As such, it is designated as critical habitat for Chinook salmon, listed as “threatened” under the ESA in 1999. Surface Water Monitoring Program Monitoring Stations for the Mad River Hydrologic Unit (109).
Page 15 of 15

One permanent station and five rotating stations were established for this hydrologic unit for FY 01-02. Three stations have been specifically established in Ruth Lake to monitor the extent of MtBE and other fuel by-products including benzene, toluene, ethylbenzene and xylene (BTEX). The SWAMP has addressed some monitoring issues in the WMA in FY 2000-01 and intensified monitoring in the rotation into the WMA in FY 2001-02. For the FY 02-03, we will continue with the MtBE monitoring effort in Ruth Lake and maintain the permanent station established in FY 01-02.
Mad River Hydrologic Unit (109). - FY 2002-03 Monitoring Activities Station (Type) (1)
HUC Beneficial Use(s) Monitoring Objectives (2)
Freq (3) Category(s) Indicator(s) (4)
MADBLU (P) 109.10
(Mad River at Blue Lake)
MUN,REC1,REC2, WARM, COLD, SPWN, MIGR, WILD, RARE
1,2,3,9,10,11,12 5 C 4 O
Contaminant Exposure, Biological Response, Pollutant Exposure, Habitat
Inorganic and Organic Water Chemistry, Chl-a, Nutrients, Total Organic Carbon, Dissolved Oxygen, Water Temperature
RLOUT (R) 109.40
(Mad River at Ruth Lake Outlet
Works)
MUN,REC1,REC2, WARM, COLD, SPWN, MIGR, WILD, RARE
2, 3, 9 4 Pollutant Exposure, Habitat
MtBE, BTEX, Dissolved Oxygen, Water Temperature
RL01 (R) 109.40
(Ruth Lake Station #1)
MUN,REC1,REC2, WARM, COLD, SPWN, MIGR, WILD, RARE
2, 3, 9 4 Pollutant Exposure, Habitat
MtBE, BTEX, Dissolved Oxygen, Water Temperature
RLO2 (R) 109.40
(Ruth Lake Station #2)
MUN,REC1,REC2, WARM, COLD, SPWN, MIGR, WILD, RARE
2, 3, 9 4 Pollutant Exposure, Habitat
MtBE, BTEX, Dissolved Oxygen, Water Temperature
Notes: 1. Type: P = Permanent, R = Rotating 2. Monitoring Objectives: See Attachment C: Site-Specific Monitoring
3. Frequency: N = number of samples per FY, C= Conventional Water Chemistry O = Organic Water Chemistry
4. Indicator: See Attachment C: Site-Specific Monitoring Eel River Hydrologic Unit (111). The Eel River comprises the Eel River WMA as described in the Watershed Planning Chapter. The Eel River Watershed encompasses roughly 3,684 square miles in highly erodable soils in the steep coastal mountains of the NCR, supporting a variety of water uses including municipal and agricultural supply systems, salmonid fisheries, and recreation. Surface water in many areas is intimately connected with the ground water along the nearby alluvial valleys, thereby having a profound effect on local groundwater supplies. The Eel River Watershed is also a prime recreational area boasting numerous state and private campgrounds along its length with both contact and noncontact uses such as boating and swimming. The Eel River is the third largest producer of salmon and steelhead in the State of California and supports a large recreational fishing industry. The erodable soils, steep terrain, and timber production evoke a high level of concern for the anadromous fishery resource. Coho salmon were listed as endangered under the federal Endangered Species Act in 1997. It is heavily forested and as such, heavily utilized for timber production. Numerous activities occur within the watershed that may result in potential adverse effects to the beneficial uses of the Eel River Watershed. Municipal, agricultural, and recreational uses may be impaired through discharges to surface water bodies from chemical, biological, and sedimentary materials entering the surface water system. A few of the many activities threatening surface water beneficial uses include: illegal waste disposal, vehicle and railroad maintenance yard operations, herbicide application, gravel extraction, timber harvesting, road building, dairy operations, automotive wrecking yard activities, Page 16 of 16

historical mill operations, wood treatment facilities, publicly owned treatment works, and failing septic systems. Lake Pillsbury is a reservoir located on the Eel River in northwest Lake County in a relatively remote area. It is surrounded by Mendocino National Forest, and access is mainly via unpaved roads. The reservoir, operated by Pacific Gas and Electric Company (PG&E), was created by the impoundment of water on the Eel River by the Scott Dam, and is used for water storage and to provide water flows downstream for fish. Scott Dam is located on the southwest shore of the reservoir, and was completed in the early 1020’s. The reservoir has a drainage area of approximately 290 square miles and a surface area of approximately 2200 acres. Lake Pillsbury is a component of the Potter Valley Project which diverts approximately 160,000 acre-feet of water annually into the Russian River system through the Potter Valley diversion tunnel into the Potter Valley power plant for the generation of electricity. The water then flows through Potter Valley and into Lake Mendocino via the East Fork of the Russian River. Lake Pillsbury is a popular recreation and fishing lake. It is served by four campgrounds with over 153 campsites, all located on the waters edge. Mercury is a common element found in the soils in and around Lake Pillsbury. Some of this mercury has made its way into the food chain. High mercury concentrations have been detected in largemouth bass and pike minnow. As a consequence of these findings, the State of California, Office of Environmental Health Hazard Assessment, has issued a health advisory concerning the consumption of certain fish from Lake Pillsbury. Under the Federal Endangered Species Act (ESA), the Eel River system is wholly contained in the Northern California Evolutionary Significant Unit (ESU) for Steelhead, listed as “threatened” under the ESA in 2000. The National Marine Fisheries Service (NMFS) is currently developing Steelhead critical habitat status and description for this ESU. The Eel River system is also wholly contained in the California Coastal Evolutionary Significant Unit (ESU) for Chinook salmon. As such, it is designated as critical habitat for Chinook salmon, listed as “threatened” under the ESA in 1999. In general, the primary issues associated with water quality in the Eel River WMA are focused on the beneficial uses for drinking water supply, recreation, and the salmonid fishery. Four water quality goals for the Eel River WMA have been identified are related through the beneficial uses they address: • Goal 1: Protect and enhance the salmonid resources (COLD) • Goal 2: Protect other surface water uses (MUN, AGR, REC 1, REC-2) • Goal 3: Protect ground water uses (MUN, IND, AGR, REC-1, REC-2) • Goal 4. Protect warmwater fishery resources Protection of surface water (Goal 2) for the primary beneficial uses MUN, AGR, REC-1 and REC-2 will in most cases protect all other beneficial uses. The MUN (municipal and domestic supply) beneficial use designation is for uses of water for community, or individual water supply systems including, but not limited to, drinking water supply. It demands, therefore, the highest quality of water. The REC-1 (water contact recreation) beneficial use designation is for uses of water for recreational activities involving body contact with water, where ingestion is reasonably possible. This beneficial use also demands a high degree of water quality. If MUN and REC-1 beneficial uses are protected then it follows that agricultural and industrial supplies are also protected which relates Goal 2 to Goal 3. The protection of cold and warm water fisheries (Goals 1 and 4) requires the protection of surface and ground waters (Goals 2 and 3) along with additional concerns for siltation, habitat loss, low tributary flows and water temperature. Therefore, by protecting the beneficial uses that demand the highest quality waters most components supporting the other beneficial uses also will be protected. Surface Water Ambient Monitoring Program Monitoring Stations
Page 17 of 17

The SWAMP has addressed some monitoring issues in the WMA in FY 2000-01, and investigated more intensively in the rotation into the WMA in FY 2001-02. For this rotation, monitoring has been scaled back to include only the permanent stations. MtBE monitoring in Lake Pillsbury will continue as low concentrations of MtBE have been detected at both lake stations and the outlet works during the FY 01-02 monitoring effort. Listed below are the planned and proposed monitoring activities under that program: Long-term monitoring stations: Five long-term stations were established in the spring of 2001: South Fork at confluence, Bull Creek, and near Branscomb Creek; Eel River at Dos Rios; Middle Fork at Dos Rios.
Eel River Hydrologic Unit (111) - FY 2002-03 Monitoring Activities Station (Type) (1)
HUC Beneficial Use(s) Monitoring Objectives (2) Freq (3) Category(s) Indicator(s) (4)
EELHOL (P) 111.12
(Eel River at Holmes)
MUN,REC1,REC2, COLD, WARM, SPWN, MIGR, WILD, RARE
1,2,3,9,10,11,12,13
5 C 4 O
Contaminant Exposure, Biological Response, Pollutant Exposure, Habitat
Inorganic and Organic Water Chemistry, Chl-a, Nutrients, Total Organic Carbon, Dissolved Oxygen, Water Temperature,
EELSFK (P) 111.30
(Eel River – South Fork d/s of
Bull Creek)
MUN,AGR,REC1,REC2, COLD, WARM, SPWN, MIGR, WILD, RARE
1,2,3,9,10,11,12,13 5 C
Contaminant Exposure, Biological Response, Pollutant Exposure, Habitat
Inorganic Water Chemistry, Chl-a, Nutrients, Total Organic Carbon, Dissolved Oxygen, Water Temperature
EELBRN (P) 111.33
(Eel River – South Fork near
Branscomb)
MUN,AGR,REC1,REC2, COLD, WARM, SPWN, MIGR, WILD, RARE
1,2,3,9,10,11,12,13 5 C
Contaminant Exposure, Biological Response, Pollutant Exposure, Habitat
Inorganic Water Chemistry, Chl-a, Nutrients, Total Organic Carbon, Dissolved Oxygen, Water Temperature, Channel Morphology, Vitellogenin
ELDRCR (R) 111.33
(Elder Creek at Eel River)
MUN,REC1,REC2, COLD, WARM, SPWN, MIGR, WILD, RARE
1,2,3,9,10,11,12,13 5 C
Contaminant Exposure, Biological Response, Pollutant Exposure, Habitat
Inorganic and Organic Water Chemistry, Chl-a, Nutrients, Total Organic Carbon, Dissolved Oxygen, Water Temperature,
EELMDV (P) 111.41
(Eel River above Dyerville)
MUN,AGR,REC1,REC2, COLD, WARM, SPWN, MIGR, WILD, RARE
1,2,3,9,10,11,12,13
5 C
Contaminant Exposure, Biological Response, Pollutant Exposure, Habitat
Inorganic Water Chemistry, Chl-a, Nutrients, Total Organic Carbon, Dissolved Oxygen, Water Temperature,
EELMAN (P) 111.41
MUN,AGR,REC1,REC2, COLD, WARM, SPWN,
1,2,3,9,10,11,12,13, 5 C Contaminant
Exposure, Inorganic Water Chemistry, Chl-a,
Page 18 of 18

Eel River Hydrologic Unit (111) - FY 2002-03 Monitoring Activities Station (Type) (1)
Beneficial Use(s) Monitoring (2) Freq (3) Category(s) Indicator(s) (4) HUC Objectives
(Eel River above Dos Rios)
MIGR, WILD, RARE Biological Response, Pollutant Exposure, Habitat
Nutrients, Total Organic Carbon, Dissolved Oxygen, Water Temperature, Vitellogenin
NFELMI (P) 111.50
(Eel River – North Fork near
Mina)
MUN,AGR,REC1,REC2, COLD, WARM, SPWN, MIGR, WILD, RARE
1,2,3,9,10,11,12,13
5 C 3 H
Contaminant Exposure, Biological Response, Pollutant Exposure, Habitat
Inorganic Water Chemistry, Herbicides, Chl-a, Nutrients, Total Organic Carbon, Dissolved Oxygen, Water Temperature,
LP01 (R) 111.63
Lake Pillsbury, Station #1
MUN,REC1,REC2, WARM, COLD, SPWN, MIGR, WILD, RARE
2, 3, 9 4 Pollutant Exposure, Habitat
MtBE, BTEX, Dissolved Oxygen, Water Temperature
LP02 (R) 111.63
Lake Pillsbury, Station #2
MUN,REC1,REC2, WARM, COLD, SPWN, MIGR, WILD, RARE
2, 3, 9 4 Pollutant Exposure, Habitat
MtBE, BTEX, Dissolved Oxygen, Water Temperature
LPOUT (R) 109.40
MUN,REC1,REC2, WARM, COLD, SPWN, MIGR, WILD, RARE
2, 3, 9 4 Pollutant Exposure, Habitat
MtBE, BTEX, Dissolved Oxygen, Water Temperature
EELVAN (R) 111.63
(Eel River at Van Arsdale
Reservoir)
MUN,AGR,REC1,REC2, COLD, WARM, SPWN, MIGR, WILD, RARE
1,2,3,9,10,11,12,13
5 C 4 O
Contaminant Exposure, Biological Response, Pollutant Exposure, Habitat
Inorganic and Organic Water Chemistry, Chl-a, Nutrients, Total Organic Carbon, Dissolved Oxygen, Water Temperature, Vitellogenin
MFKEEL (P) 111.70
(Eel River – Middle Fork at
Dos Rios)
MUN,AGR,REC1,REC2, COLD, WARM, SPWN, MIGR, WILD, RARE
1,2,3,9,10,11,12,13 5 C
Contaminant Exposure, Biological Response, Pollutant Exposure, Habitat
Inorganic Water Chemistry, Chl-a, Nutrients, Total Organic Carbon, Dissolved Oxygen, Water Temperature
Notes: 1. Type: P = Permanent, R = Rotating 2. Monitoring Objectives: See Attachment C: Site-Specific Monitoring
3. Frequency: N = number of samples per FY, C= Conventional Water Chemistry O = Organic Water Chemistry
4. Indicator: See Attachment C: Site-Specific Monitoring Mendocino Coast Hydrologic Unit (113) Gualala Watershed Management Area (113.82) The Gualala River watershed in Sonoma and Mendocino counties is about 300 square miles in area. The Gualala River runs in a north-south direction flowing into the ocean at the town of Gualala. The watershed is in mountainous terrain and contains relatively erodible soils. The tributaries flow through
Page 19 of 19

steep valleys with narrow bottom lands and elevations range from sea level to over 2,650 feet. The steep slopes are forested mainly with Douglas fir and redwood interspersed with madrone and tan oak. Rainfall averages 38 inches per year at the coast and up to 100 inches per year on the inland peaks. Primary land use is forest production and some grazing. Hillside vineyard development is becoming an increasing threat to water quality as more and more steep land is converted to vineyards. The Gualala River is listed on California’s 303(d) list as a water quality limited water requiring the establishment of a Total Maximum Daily Load (TMDL), for sediment. The key stakeholder concern is the decline of the once healthy coho salmon and steelhead trout fisheries thought to be associated with excess sediment load and elevated water temperatures. A Consent Decree entered in settlement of a lawsuit against the USEPA assigned the date of December 31, 2001, for completion of TMDL allocations for the Gualala River. Under the Federal Endangered Species Act (ESA), the Gualala River is wholly contained in the Northern California Evolutionary Significant Unit (ESU) for Steelhead, listed as “threatened” under the ESA in 2000. The National Marine Fisheries Service (NMFS) is currently developing Steelhead critical habitat status and description for this ESU. The Gualala River is also wholly contained in the California Coastal Evolutionary Significant Unit (ESU) for Chinook salmon. As such, it is designated as critical habitat for Chinook salmon, listed as “threatened” under the ESA in 1999. In addition, the Gualala River is also wholly contained in the Central California Coast Evolutionary Significant Unit (ESU) for Coho salmon. As such, it is designated as critical habitat for Coho salmon, listed as “threatened” under the ESA in 1996. The primary water quality goals for the Gualala River center around protection of the beneficial uses associated with aquatic life and drinking water supplies. The development of the TMDL waste reduction strategy for sediment is the highest priority for action in the watershed. Surface Water Monitoring Program Monitoring Sites The SWAMP and NCWAP addressed water quality and some channel geometry monitoring issues in the WMA in FY 2000-01 at five rotating sites: • North Fork near Gualala • South Fork at Twin Bridges • Wheatfield Fork at Twin Bridges • South Fork near Plantation • Wheatfield Fork above House Creek A permanent station has been established at Gualala Regional Park and will be included in the FY 02-03 monitoring effort. Anticipated parameters are general water chemistry, nutrients, metals, and channel geometry and stream bed characteristics.
Mendocino Coast Hydrologic Unit (113) - FY 2002-03 Monitoring Activities Station (Type) (1)
HUC Beneficial Use(s) Monitoring Objectives (2)
Freq (3) Category(s) Indicator(s) (4)
GUAGRP (P) 113.62
MUN,REC1,REC2, COLD, SPWN, MIGR, WILD,
1,2,3, 9,10,11,12,13, 14,15
5 C
Contaminant Exposure, Biological Response, Pollutant Exposure, Habitat
Inorganic Water Chemistry, Chl-a, Nutrients, Total Organic Carbon, Dissolved Oxygen, Water Temperature,
Page 20 of 20

Mendocino Coast Hydrologic Unit (113) - FY 2002-03 Monitoring Activities Station (Type) (1)
Beneficial Use(s) Monitoring (2)
Freq (3) Category(s) Indicator(s) (4) HUC Objectives
Channel Morphology
Notes: 1. Type: P = Permanent, R = Rotating
2. Monitoring Objectives: See Attachment C: Site-Specific Monitoring 3. Frequency: N = number of samples per FY, C= Conventional Water Chemistry O = Organic Water Chemistry
4. Indicator: See Attachment C: Site-Specific Monitoring Russian River Hydrologic Unit (114) The Russian river comprises a major part of the Russian/Bodega WMA as described in the Watershed Planning Chapter. The Russian River hydrologic unit encompasses 1485 square miles in Mendocino and Sonoma counties, bounded by the Coast Ranges on both the east and west. The mainstem is about 110 miles long, flowing southward from Redwood and Potter valleys (north of Ukiah) to its confluence with Mark West Creek, where it turns west to cut through the coast range and empties into the Pacific Ocean at Jenner. The principal tributaries from the headwaters down are the East Fork Russian River, Feliz Creek, Pieta Creek, Big Sulfur Creek, Dry Creek, Mark West Creek (including the Laguna de Santa Rosa), Green Valley Creek, Willow Creek, Fife Creek, Austin Creek, and other small streams. Elevations range from sea level at the estuary near Jenner to 4,343 feet at the summit of Mt. St. Helena in the Mayacamas Mountains. The Russian River ground water basins are generally broad, alluviated valleys in the Coast Range physiographic province of California. The province is dominated by northwest trending mountain ranges and intervening valleys. Cotati Valley is the southern portion of the larger Santa Rosa Valley which is bounded on the east by the Sonoma Mountains and the west by the mountains of the Coast Range Franciscan Complex. The geologic materials in the unsaturated zone between the ground surface and the top of ground water generally consists of interbedded clays, silts and sands. Sediments underlying the valley are predominantly young, unconsoliated fluvial deposits of Quaternary age derived from the nearby Sonoma Mountains and are characterized by variable grain sizes, composed mainly of interbedded gravel, sand, silt, and silty clay. Sedimentary rocks of the Petaluma Formation and volcanic rocks of the Sonoma Group underlie the valley alluvium and are exposed in the hills to the east. Two reservoirs provide flood protection and water supply storage: 1) Coyote Dam and Lake Mendocino on the East Fork Russian River near Ukiah, and 2) Warm Springs Dam and Lake Sonoma on Dry Creek west of Healdsburg. A diversion from the Eel River through the Potter Valley powerhouse flows into the East Fork and Lake Mendocino. The Russian River hydrologic unit supplies drinking water, including ground water supply to over 500,000 people and an unknown amount of water for agricultural purposes. The State Division of Water Rights has declared the Russian River tributaries fully appropriated from April 1 through December 14. The Water Rights Division is in the process of developing a strategy to deal with additional diversions in the mainstem and tributaries outside of the fully appropriated period. The majority of flow in the Russian River is during the winter season, when rainfall ranges from 30-80 inches, depending on locale. The summer climate is moist and cool near the coast with temperatures increasing in the upper valley areas that are more isolated from the coastal influence. Ground water is found in shallow to deep aquifers. The water table aquifer is particularly vulnerable to contamination from nitrates and toxic chemicals, and drinking water wells often withdraw from this shallow aquifer, and may connect the shallow layers with deeper ground water bearing zones. Land Uses in the Russian River Hydrologic Unit The watershed is agriculturally based, with urban and industrial uses concentrated around the incorporated municipalities. The most notable are Ukiah, Cloverdale, Healdsburg, Guerneville, Windsor, Rohnert Park, Cotati, Sebastopol, and Santa Rosa. The largest concentration of urban and industrial use is Page 21 of 21

in the Santa Rosa Plain, with Ukiah and Windsor second and third. Industrial uses include electronics manufacturing industries, petroleum distribution plants, light manufacturing, wrecking and salvage yards, wineries, wood products, and industries related to the construction industry. Santa Rosa is the commercial distribution center for the North Coast. In the Potter Valley area north of Ukiah, irrigated agriculture and pasturing are common land uses. Rangeland and mixed coniferous forests (with minimal timber harvesting) are prevalent in the hills away from the farmed alluvial plains. Around Ukiah, irrigated orchard and vineyard are common land uses with light industry, several large wood products facilities associated with the timber industry, and gravel mining. Water quality issues in this part of the watershed are primarily associated with industrial areas, historical waste disposal practices, wastewater treatment plants, water use, erosion and sedimentation in the tributaries, destruction of riparian areas, and agricultural chemical uses in the alluvial areas. Moving down the watershed, the Hopland area is predominantly vineyard with rangeland grazing in the areas away from the mainstem. The river then cuts through a small canyon with rangeland grazing as the primary land use before reaching Cloverdale and more vineyards. Vineyards dominate the valley areas down to the Santa Rosa Plains. Vineyard development in the hillside areas adjacent to the alluvial terrace is an increasing concern from the standpoint of erosion and sedimentation. Gravel terrace pits are another feature interspersed in the alluvial plain. In addition to the water quality issues upstream, bank erosion, health of riparian areas, construction activities, and more industrial, commercial, household, and agricultural chemical uses rank high as concerns for this area. The Santa Rosa Plain and Healdsburg hydrogeologic areas contain large ground water basins, supplying water for municipal, domestic, industrial and agricultural uses. The Santa Rosa Plain and tributary uplands include a number of animal facility operations. There are currently 24 active dairies in the Mark West Creek (Laguna de Santa Rosa) watershed. Conversion of rangeland, pasture, and orchards to vineyard has increased in the last decade. The availability of reclaimed wastewater produced by the City of Santa Rosa operated sub-regional municipal wastewater treatment facility has resulted in conversion of about 6,500 acres of rangeland to irrigated pasture, cultivated fodder crops, and other uses. The Santa Rosa Plain is the most populated area in the North Coast Region with six incorporated communities and over 200,000 residents (1990 US Census). A number of large river terrace pit-type gravel mines are located downstream of Healdsburg. The trend appears to be towards continued conversion of range, pasture and forest lands to vineyards, and continued growth of the urban areas of Ukiah, Cloverdale, Guerneville, Healdsburg, Windsor, Santa Rosa, and Rohnert Park. In the future there will be a major expansion in the electronic industry. Associated with that growth are active construction sites and an increase in light industrial operations. A concerted effort is being made in the Santa Rosa Plains to retain the reclaimed wastewater irrigated crop and pastureland type of agriculture and maintain the viability of the dairy industry. However, significant conversion of rangeland and pasture to vineyards continues to occur . The market for premium North Coast wine grapes far outstrips supply. Therefore, the pressure for land conversion to vineyards probably will not diminish, and there could be a water supply issue in the future. The Laguna de Santa Rosa watershed drains the southern two-thirds of the Santa Rosa Plains. The Laguna de Santa Rosa, which is a major tributary of Mark West Creek, is listed for nutrient and dissolved oxygen impairment on the C W A section 303(d) list. Nutrient and dissolved oxygen impairments result from both point and nonpoint source discharges and the hydrology of the watershed. An active waste reduction strategy is underway per section 303(d) requirements, including the development of waste loading limitations.
Page 22 of 22
The Russian River turns to the west and cuts through the Coastal Range downstream from the confluence of the Laguna de Santa Rosa and Mark West Creek tributary area. This downstream physical structure of the river has a lower gradient and the summer base flow occupies most of the low flow channel. The lower Russian River hillsides are steep and forested with mixed conifers, redwoods being the major component. Residential areas are located periodically along the river with a number of them on the narrow flood plain itself. Land uses are consistent with the semi-rural setting with vineyards and pastures
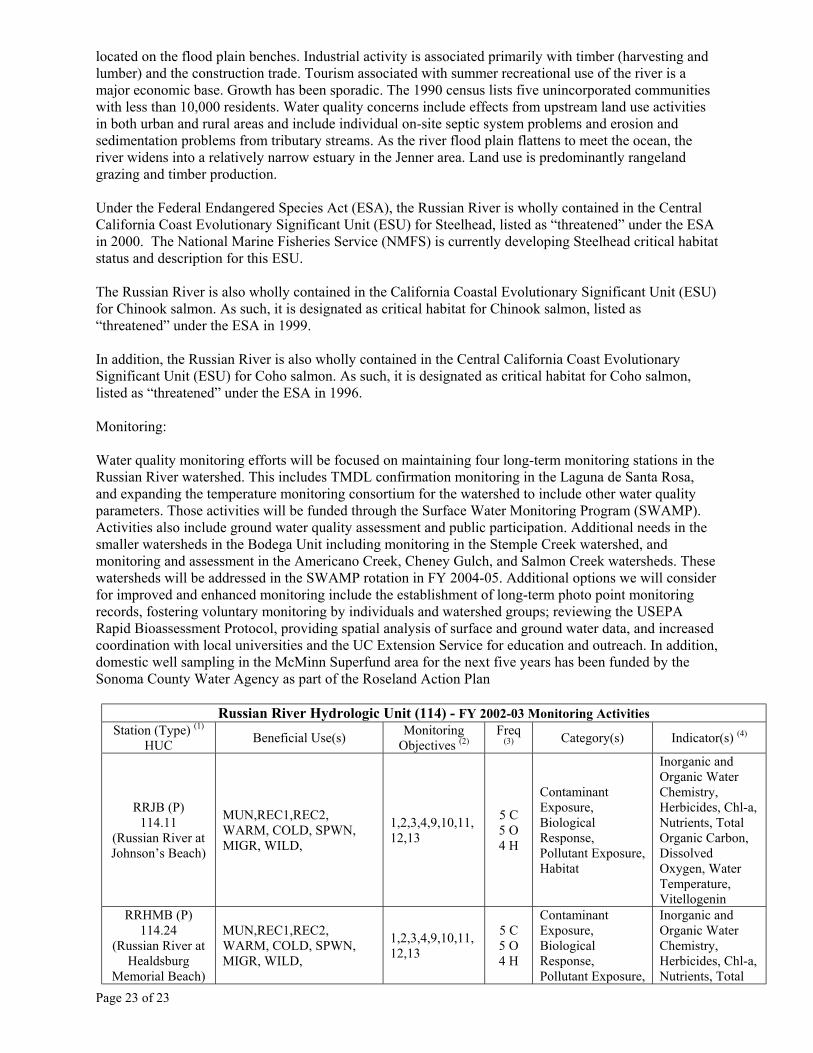
located on the flood plain benches. Industrial activity is associated primarily with timber (harvesting and lumber) and the construction trade. Tourism associated with summer recreational use of the river is a major economic base. Growth has been sporadic. The 1990 census lists five unincorporated communities with less than 10,000 residents. Water quality concerns include effects from upstream land use activities in both urban and rural areas and include individual on-site septic system problems and erosion and sedimentation problems from tributary streams. As the river flood plain flattens to meet the ocean, the river widens into a relatively narrow estuary in the Jenner area. Land use is predominantly rangeland grazing and timber production. Under the Federal Endangered Species Act (ESA), the Russian River is wholly contained in the Central California Coast Evolutionary Significant Unit (ESU) for Steelhead, listed as “threatened” under the ESA in 2000. The National Marine Fisheries Service (NMFS) is currently developing Steelhead critical habitat status and description for this ESU. The Russian River is also wholly contained in the California Coastal Evolutionary Significant Unit (ESU) for Chinook salmon. As such, it is designated as critical habitat for Chinook salmon, listed as “threatened” under the ESA in 1999. In addition, the Russian River is also wholly contained in the Central California Coast Evolutionary Significant Unit (ESU) for Coho salmon. As such, it is designated as critical habitat for Coho salmon, listed as “threatened” under the ESA in 1996. Monitoring: Water quality monitoring efforts will be focused on maintaining four long-term monitoring stations in the Russian River watershed. This includes TMDL confirmation monitoring in the Laguna de Santa Rosa, and expanding the temperature monitoring consortium for the watershed to include other water quality parameters. Those activities will be funded through the Surface Water Monitoring Program (SWAMP). Activities also include ground water quality assessment and public participation. Additional needs in the smaller watersheds in the Bodega Unit including monitoring in the Stemple Creek watershed, and monitoring and assessment in the Americano Creek, Cheney Gulch, and Salmon Creek watersheds. These watersheds will be addressed in the SWAMP rotation in FY 2004-05. Additional options we will consider for improved and enhanced monitoring include the establishment of long-term photo point monitoring records, fostering voluntary monitoring by individuals and watershed groups; reviewing the USEPA Rapid Bioassessment Protocol, providing spatial analysis of surface and ground water data, and increased coordination with local universities and the UC Extension Service for education and outreach. In addition, domestic well sampling in the McMinn Superfund area for the next five years has been funded by the Sonoma County Water Agency as part of the Roseland Action Plan
Russian River Hydrologic Unit (114) - FY 2002-03 Monitoring Activities Station (Type) (1)
HUC Beneficial Use(s) Monitoring Objectives (2)
Freq (3) Category(s) Indicator(s) (4)
RRJB (P) 114.11
(Russian River at Johnson’s Beach)
MUN,REC1,REC2, WARM, COLD, SPWN, MIGR, WILD,
1,2,3,4,9,10,11,12,13
5 C 5 O 4 H
Contaminant Exposure, Biological Response, Pollutant Exposure, Habitat
Inorganic and Organic Water Chemistry, Herbicides, Chl-a, Nutrients, Total Organic Carbon, Dissolved Oxygen, Water Temperature, Vitellogenin
RRHMB (P) 114.24
(Russian River at Healdsburg
Memorial Beach)
MUN,REC1,REC2, WARM, COLD, SPWN, MIGR, WILD,
1,2,3,4,9,10,11,12,13
5 C 5 O 4 H
Contaminant Exposure, Biological Response, Pollutant Exposure,
Inorganic and Organic Water Chemistry, Herbicides, Chl-a, Nutrients, Total
Page 23 of 23

Russian River Hydrologic Unit (114) - FY 2002-03 Monitoring Activities Station (Type) (1)
Beneficial Use(s) Monitoring (2)
Freq (3) Category(s) Indicator(s) (4) HUC Objectives
Habitat Organic Carbon, Dissolved Oxygen, Water Temperature, Vitellogenin
RRCLO (P) 114.26
(Russian River Cloverdale)
MUN,REC1,REC2, WARM, COLD, SPWN, MIGR, WILD,
1,2,3,4,9,10,11,12,13
5 C 5 O 4 H
Contaminant Exposure, Biological Response, Pollutant Exposure, Habitat
Inorganic and Organic Water Chemistry, Herbicides, Chl-a, Nutrients, Total Organic Carbon, Dissolved Oxygen, Water Temperature, Vitellogenin
RRTAL (P) 114.31
(Russian River at Tamadge -
Ukiah)
MUN,REC1,REC2, WARM, COLD, SPWN, MIGR, WILD,
1,2,3,4,9,10,11,12,13
5 C 5 O 4 H
Contaminant Exposure, Biological Response, Pollutant Exposure, Habitat
Inorganic and Organic Water Chemistry, Herbicides, Chl-a, Nutrients, Total Organic Carbon, Dissolved Oxygen, Water Temperature, Vitellogenin
Notes: 1. Type: P = Permanent, R = Rotating 2. Monitoring Objectives: See Attachment C: Site-Specific Monitoring
3. Frequency: N = number of samples per FY, C= Conventional Water Chemistry O = Organic Water Chemistry H = Herbicides
4. Indicator: See Attachment C: Site-Specific Monitoring IV. Specific Sample Design and Sample Collection Wadeable Stream and River Sites The field crew will collect the samples at sites where the geo-coordinates were previously recorded on the site reconnaissance form during past field work at these stations. If sampling work is being performed at a new station, the geo-coordinates and cross-referenced photographs, and other pertinent information shall be recorded on the field form for future reference. If there is confusion about locating a site, it shall be resolved in consultation with RWQCB staff member present in the field or via phone contact with the regional SWAMP program coordinator. Sufficient volume of sediment or tissue or water shall be collected in order to perform the analyses to be conducted at each station, as well as to allow for archiving of samples for future analysis, as shown on Attachment A “Services to be performed at each station/Budget”. Sample collection and subsequent processing and testing will be performed according to protocols specified in the most recent version of the SWAMP Quality Assurance Project Plan (QAPP) (currently in development) and region-specific QAPP’s/SOP’s.” Lake sampling for MTBE Sampling will be conducted from a boat powered by a 4-cycle outboard motor using MTBE-free fuel. In order to avoid contamination of the site by the sampling effort, when the boat is within 300 yards of the
Page 24 of 24

sampling station, the motor is turned off, raised out of the water, and securely wrapped in a 4 mil plastic bag. The fuel tank vent is secured, and the station is approached using an electric trolling motor. Lake sampling stations have been selected in deep, open-water locations that represent areas of general use by all types of watercraft. In order not to bias the sampling results, sampling near marina areas is avoided. In order to determine if any contamination is escaping the reservoir, samples will also be collected at each of the reservoir’s outlet works. Prior to sampling at each lake station, a vertical profile of temperature, dissolved oxygen, pH and specific conductivity will obtained using a multiparameter datasonde and the depth and thickness of the metalimnion, or thermocline, will be determined. Sample collections will then made at the surface, mid-epilimnion, approximately one meter below the thermocline and 6 meters below the thermocline. Lake surface samples are collected using a pre-cleaned stainless steel beaker and carefully decanted into VOA containers preserved with 1:1 HCL. Sub-surface samples are collected with a pre-cleaned 1.1L stainless steel Kemmerer bottle with poly-urathane end seals. For quality control purposes, one field replicate and one wash-water blank will be collected at each station. All sample collection and handling will accomplished pursuant to protocols published by the U. S Geological Survey (USGS) National Water-Quality Assessment Program, NAWQA (Shelton 1997). Vitellogenin Screening Vitellogenin (VTG) is a blood serum phospholipoglycoprotein precursor to egg yolk normally found in female fish. Although male fish also carry the gene for VTG synthesis, it is normally not expressed as male fish do not produce eggs. Exposure to endocrine disrupting compounds, however, can induce the synthesis of vitellogenin in male fish making it an ideal biomarker for indicating an organism’s exposure to these compounds in their environment. Fish and blood serum collection protocols are currently under development with California Department of Fish and Game in cooperation with the Core Biomarkers Facility at the University of Florida at Gainsville. This facility has developed considerable expertise using Enzyme-linked Immunospecific Assay (ELISA) procedures to identify VTG in blood serum and will be the initial sub-contractor responsible for VTG analysis for at least the first year of the screening effort. The Regional Board, with the assistance of CFG, will collect the fish and prepare the blood samples in the field. The blood will then be transported to UFLA for subsequent VTG analysis. We expect to begin fish collections this summer at selected sites. Funds allocated for FY 01-02 will be used for this effort. No additional funds are anticipated for FY 02-03. Thermal Infrared Imaging
Page 25 of 25
Traditional water temperature monitoring methods have relied on in-stream temperature monitors placed at discrete locations to gather data. While these monitors provide good temporally continuous data at that discrete point, no information is provided into the spatial variability of the system. With thermal infrared imaging, mapping of stream temperatures across an entire stream network at one point in time becomes possible. The integrated use of temporally and spatially contiguous temperature data provides a very powerful tool for understanding the dynamics of stream temperatures across multiple scales.

The process uses an aircraft mounted thermal infrared camera system employing a 6-band thermal infrared sensor. This technique has proven to be a cost effective and reliable method for measuring and evaluating stream temperatures from the scale of watersheds down to individual habitats. Bioasessment – Reference Site Development An Index of Biological Integrity (IBI) was developed by Department of Fish Game in 1997 for the Russian River watershed based on benthic macroinvertebrate (BMI) communities sampled in twenty-one first through third order tributaries of the Russian River. During FY02-03, we would like to modify and update the Russian River IBI in accordance with 1) improved taxonomic resolution of BMI communities during the five years since the development of the first Russian River IBI, and 2) modifications in calculation of community metrics that have taken place since 1997. In developing an ambient biomonitoring program, it is imperative that reference conditions be developed in the first stage of the program. This allows all subsequent data to be interpreted in a context (i.e., they allow the comparison of observed conditions with expected conditions), and ultimately provides the framework around which biocriteria may be built. During FY02-03, DFG will select reference sites based on objective criteria that reflect minimum human impact (e.g., low road density, low mine density, minimal or sustainable timber harvesting, minimal livestock grazing, etc.), and field evaluation (“ground truthing”) of sites pre-selected based on GIS data. We expect the reference site selection and sampling process to extend into FY 03-04 with approximately twenty sites sampled this FY and an additional twenty in FY 03-04. Stream Gaging Due to funding cutbacks and priority changes, a number of stream gages previously installed and maintained by the United States Geological Service (USGS) and the California Department of Water Resources (DWR) in North Coast watersheds are no longer operational. Some gages have been decommissioned and completely removed while others may be functional but are not maintained. Many of the rivers in the North Coast region are listed on the CWA 303(d) list of impaired water bodies as sediment impaired. River flow and sediment transport data necessary to support TMDL development are lacking in many of these watersheds. A master contract has been developed between the SWRCB and the United States Geological Service (USGS) and is, in part, funded by SWAMP dollars. Among other things, this contract provides a mechanism to construct and maintain the stream gages necessary to acquire the data needed for TMDL development. FY 2000-01 SWAMP funds were used to install three gages in the Eel River system. The gages were constructed in the North Fork Eel near Mina, the Middle Fork Eel upstream of Black Butte River and on Black Butte River at its confluence with the Middle Fork. Currently, all are fully operational. The gages measure stage height, discharge (flow) and water temperature and have satellite radio telemetry links. FY2002-03 funds will be used to maintain these gages. Laboratory Analysis The Regional Board staff shall oversee surface water sample collection. All serum vitellogenin sample collection shall be performed by Regional Board and/or CDFG staff pursuant to protocols developed through collaboration with the University of Florida Core Biomarkers Facility.
Page 26 of 26
Actual analytical services that will be performed on each sample are detailed in the attached table: “Services to be performed at Each Station/Budget (Attachment A).

A statewide SWAMP QAPP is in the process of development by CDFG. The QAPP will address issues of analytical methodology, detection limits and QA/QC criteria. The provisions of this plan will be adopted and consistently applied by all Regions. Data Quality Evaluation and Data Reporting Analytical results shall be reported in tabular format and in a timely manner by the laboratory. Appropriate QA/QC documentation should accompany each report pursuant to the SWAMP QAPP (in development). In addition, the data shall be provided electronically in EXCEL format. The California Stream Bioassessment protocol developed by CDFG will be followed until a SWAMP specific bioassessment protocol is developed. Stream gage data shall be provided in a manner consistent with the USGS QAPP. Deliverable Products The State Board shall receive the following deliverable products pursuant to this workplan: • CDFG Master Contract with amendments as appropriate. • Site reconnaissance data, sample collection information, and chemical, physical and biological
analysis as specified per contract task order. • Laboratory analysis and data reports as specified per contract task order.
The data report will include the following items, where applicable, but shall not necessarily be limited to the following items:
All station data including CDFG station name, station number, IDORG number, leg number, sample collection date, sample station longitude and latitude, sample GPS coordinates, sample station water depth, sample location characteristics, toxicity test endpoint mean and standard deviation, and all detection limits. In addition to the above data, the following will also be reported for all stations indicated on the attached “Services to be performed at each station/cost” spreadsheet for bioassessment: raw data and computed biological indices. Additionally, data from the bioaccumulation tests will be reported as tissue chemistry data for the specific chemical constituents shown on the attached “Services to be performed at each station/cost” spreadsheet. A map (and GIS shape file) should be included showing the locations of each sampling station and an indication of the overall integrity of that site as excellent, good, marginal, or poor. Another map (and GIS shape file) should further indicate the integrity of each site for biological, chemical, and toxicity data results expressed as a triad for each site.
• USGS Master Contract • Installation and maintenance of stream gages per USGS contract task order. • Reports as specified in USGS contract task order. Desired Milestone Schedule We plan five sampling episodes for most stations in this FY for the collection of conventional chemistry and metals. Three of these episodes will include sampling for water column organic chemicals and herbicides at selected stations.
Page 27 of 27

Currently, we plan to initiate sample collection in August 2002, with subsequent sampling episodes in September or November. For the following calendar year, we plan to collect samples in March, May and June of 2003. MTBE sampling is planned for August, September and October of 2002 and June 2003. Bioassessment sampling for the reference site study is planned for April and May, 2003 Desired Sample Throughput Schedule Ideally, provisional sample results for each sampling episode should be provided to the Regional Board prior to the subsequent sampling episode for the same set of stations. Actual schedule will be provided by CDFG. Budget Please see Attachment A: “Services to be Preformed at Each Station/Budget” V. Working Relationships – Decision Matrix
Responsible Organization Contractors Task
SWRCB RWQCB DFG USGS
Develop contract(s) for monitoring services. ♦ ♦ ♦ ♦ Identify water bodies or sites of concern and clean sites to be monitored.
♦
Identify site-specific locations with potential beneficial use impacts or unimpacted conditions that will be monitored.
♦
Decide if concern is related to objectives focused on location or trends of impacts.
♦
Select monitoring objective(s) based on potential beneficial use impact(s) or need to identify baseline conditions.
♦
Identify already-completed monitoring and research efforts focused on potential problem, monitoring objective, or clean conditions.
♦ ♦ ♦
Make decision on adequacy of available information.
♦ ♦
Prepare site-specific study design based on monitoring objectives, the assessment of available information, sampling design, and indicators.
(Work Plan Review Role)
♦ ♦ ♦
Implement study design. (Collect and analyze samples.) ♦ ♦ ♦
Page 28 of 28
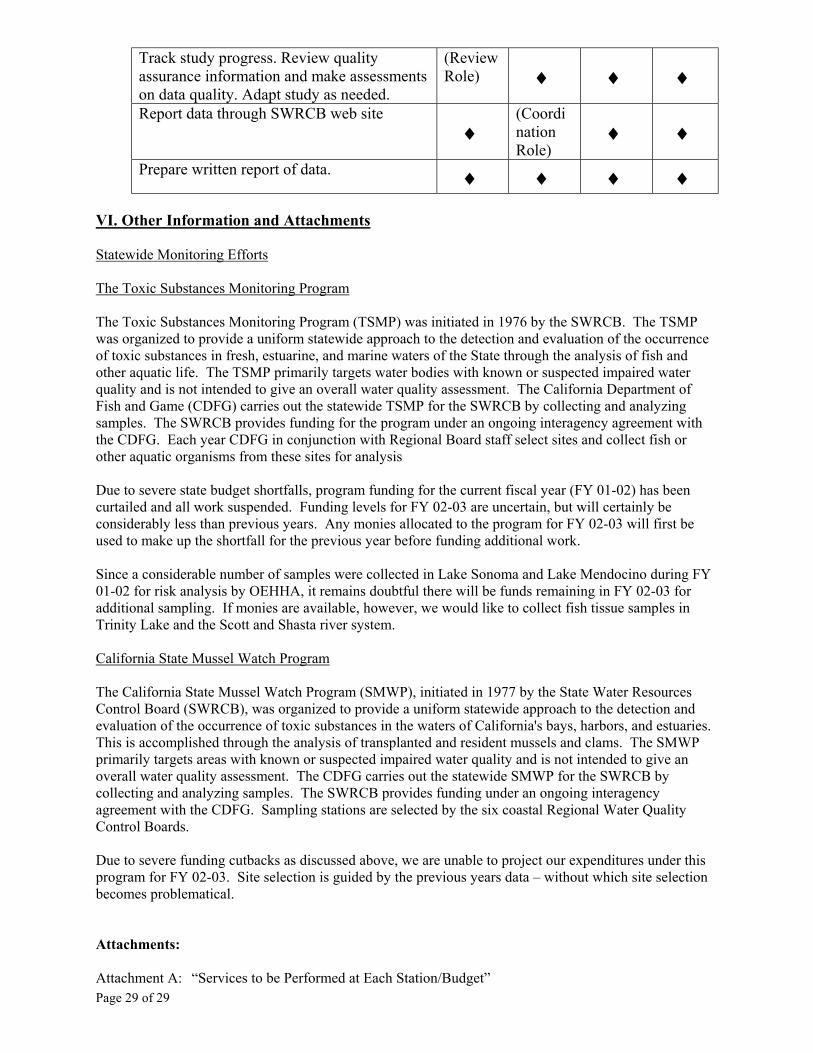
Track study progress. Review quality assurance information and make assessments on data quality. Adapt study as needed.
(Review Role) ♦ ♦ ♦
Report data through SWRCB web site ♦
(Coordination Role)
♦ ♦ Prepare written report of data. ♦ ♦ ♦ ♦
VI. Other Information and Attachments Statewide Monitoring Efforts The Toxic Substances Monitoring Program The Toxic Substances Monitoring Program (TSMP) was initiated in 1976 by the SWRCB. The TSMP was organized to provide a uniform statewide approach to the detection and evaluation of the occurrence of toxic substances in fresh, estuarine, and marine waters of the State through the analysis of fish and other aquatic life. The TSMP primarily targets water bodies with known or suspected impaired water quality and is not intended to give an overall water quality assessment. The California Department of Fish and Game (CDFG) carries out the statewide TSMP for the SWRCB by collecting and analyzing samples. The SWRCB provides funding for the program under an ongoing interagency agreement with the CDFG. Each year CDFG in conjunction with Regional Board staff select sites and collect fish or other aquatic organisms from these sites for analysis Due to severe state budget shortfalls, program funding for the current fiscal year (FY 01-02) has been curtailed and all work suspended. Funding levels for FY 02-03 are uncertain, but will certainly be considerably less than previous years. Any monies allocated to the program for FY 02-03 will first be used to make up the shortfall for the previous year before funding additional work. Since a considerable number of samples were collected in Lake Sonoma and Lake Mendocino during FY 01-02 for risk analysis by OEHHA, it remains doubtful there will be funds remaining in FY 02-03 for additional sampling. If monies are available, however, we would like to collect fish tissue samples in Trinity Lake and the Scott and Shasta river system. California State Mussel Watch Program The California State Mussel Watch Program (SMWP), initiated in 1977 by the State Water Resources Control Board (SWRCB), was organized to provide a uniform statewide approach to the detection and evaluation of the occurrence of toxic substances in the waters of California's bays, harbors, and estuaries. This is accomplished through the analysis of transplanted and resident mussels and clams. The SMWP primarily targets areas with known or suspected impaired water quality and is not intended to give an overall water quality assessment. The CDFG carries out the statewide SMWP for the SWRCB by collecting and analyzing samples. The SWRCB provides funding under an ongoing interagency agreement with the CDFG. Sampling stations are selected by the six coastal Regional Water Quality Control Boards. Due to severe funding cutbacks as discussed above, we are unable to project our expenditures under this program for FY 02-03. Site selection is guided by the previous years data – without which site selection becomes problematical. Attachments: Attachment A: “Services to be Performed at Each Station/Budget” Page 29 of 29

Attachment B: “Regional Monitoring” Attachment C: “Site-Specific Monitoring” Attachment D: “SWAMP Workplan for FY 2001-02”
Page 30 of 30