Embed Size (px)
Citation preview

DRAFT SILICON VALLEY COMMUNITY CHOICE ENERGY TECHNICAL STUDY
11/25/2015 Prepared by Pacific Energy Advisors, Inc.
This Technical Study was prepared for the Silicon
Valley Community Choice Energy (SVCCE)
Partnership for purposes of forming a Community
Choice Energy (CCE) program, which would
provide electric generation service to residential
and commercial customers located within Santa
Clara County. A detailed discussion of the
projected operating results related to the SVCCE
program is presented herein.


Draft Silicon Valley Community Choice Energy Technical Study
Draft Silicon Valley Community Choice Energy Technical Study P R E P A R E D B Y P A C I F I C E N E R G Y A D V I S O R S , I N C .
Table of Contents
EXECUTIVE SUMMARY ............................................................................................................................. 1
SECTION 1: INTRODUCTION .................................................................................................................... 9
SECTION 2: STUDY METHODOLOGY ...................................................................................................... 12
Supply Scenario Overview ........................................................................................................................................... 13
Key Assumptions.............................................................................................................................................................. 15
Multi-Phase Customer Enrollment ................................................................................................................................. 16
Indicative Renewable Energy Contract Portfolio ..................................................................................................... 16
Energy Production Options & Scenario Composition ............................................................................................... 20
Scenario 1: GHG Emissions Parity and Additional Renewable Energy Supply Relative to PG&E ............. 21
Scenario 2: 20% Annual GHG Emissions Reductions; Increased Renewable Energy Procurement ............. 24
Scenario 3: Maximize GHG Emissions Reductions while Maintaining General Rate Parity.......................... 27
Costs and Rates............................................................................................................................................................... 30
Greenhouse Gas Emissions ............................................................................................................................................ 32
Economic Development Impacts ................................................................................................................................... 33
Local Economic Development Benefits Potential .................................................................................................... 36
SECTION 3: SVCCE TECHNICAL PARAMETERS (ELECTRICITY CONSUMPTION) ..................................... 38
Historical and Projected Electricity Consumption ...................................................................................................... 38
Projected Customer Mix and Energy Consumption .................................................................................................. 40
Renewable Energy Portfolio Requirements ............................................................................................................... 41
Capacity Requirements ................................................................................................................................................. 43
SECTION 4: COST OF SERVICE ELEMENTS .............................................................................................. 45
Electricity Purchases........................................................................................................................................................ 45
Renewable Energy Purchases....................................................................................................................................... 45
Electric Generation ......................................................................................................................................................... 47
Transmission and Grid Services ................................................................................................................................... 47
Start-Up Costs ................................................................................................................................................................. 47
Financing Costs ................................................................................................................................................................ 49
Billing, Metering and Data Management .................................................................................................................. 49
Staff and Other Operating Costs ............................................................................................................................... 50
Uncollectible Accounts .................................................................................................................................................... 50
Program Reserves ........................................................................................................................................................... 50
Bonding and Security Requirements ........................................................................................................................... 50
PG&E Surcharges ........................................................................................................................................................... 50

Draft Silicon Valley Community Choice Energy Technical Study
SECTION 5: COST AND BENEFITS ANALYSIS ......................................................................................... 52
Scenario 1 Study Results ............................................................................................................................................... 52
Ratepayer Costs .......................................................................................................................................................... 52
GHG Impacts ................................................................................................................................................................ 54
Scenario 2 Study Results ............................................................................................................................................... 56
Ratepayer Costs .......................................................................................................................................................... 56
GHG Impacts ................................................................................................................................................................ 57
Scenario 3 Study Results ............................................................................................................................................... 59
Ratepayer Costs .......................................................................................................................................................... 59
GHG Impacts ................................................................................................................................................................ 60
SECTION 6: SENSITIVITY ANALYSES ...................................................................................................... 63
Power and Natural Gas Prices .................................................................................................................................... 63
Renewable Energy Costs ............................................................................................................................................... 63
Carbon-Free Energy Costs ............................................................................................................................................ 64
PG&E Rates ..................................................................................................................................................................... 64
PG&E Surcharges ........................................................................................................................................................... 65
Opt-Out Rates ................................................................................................................................................................. 65
Community Participation (Small JPA) .......................................................................................................................... 66
Perfect Storm ................................................................................................................................................................... 66
Sensitivity Results ............................................................................................................................................................ 66
SECTION 7: RISK ANALYSIS ................................................................................................................... 70
Financial Risks to SVCCE Members ............................................................................................................................. 70
Deviations between Actual Energy Use and Contracted Purchases ..................................................................... 71
Legislative and Regulatory Risk ................................................................................................................................... 72
Availability of Requisite Renewable and Carbon-Free Energy Supplies............................................................ 74
Market Volatility and Price Risk .................................................................................................................................. 75
SECTION 8: CCE FORMATION ACTIVITIES ............................................................................................. 77
CCE Entity Formation ...................................................................................................................................................... 77
Regulatory Requirements .............................................................................................................................................. 77
Procurement ..................................................................................................................................................................... 78
Financing .......................................................................................................................................................................... 78
Organization ................................................................................................................................................................... 78
Customer Notices ............................................................................................................................................................ 78
Ratesetting and Preliminary Program Development ............................................................................................... 78
SECTION 9: EVALUATION AND RECOMMENDATIONS .......................................................................... 80
APPENDIX A: SVCCE PRO FORMA ANALYSES ...................................................................................... 83

Draft Silicon Valley Community Choice Energy Technical Study
Executive Summary Page 1
EXECUTIVE SUMMARY
This Community Choice Energy (“CCE”) Technical Study (“Study”) was prepared for the Silicon Valley
Community Choice Energy (“SVCCE”) Partnership, by Pacific Energy Advisors, Inc. (“PEA”) under contract with
the City of Sunnyvale, for purposes of describing the potential benefits and liabilities associated with forming
a CCE program in Santa Clara County. Such a program would provide electric generation service to
residential and business customers located within the SVCCE Partner jurisdictions. The SVCCE Partnership is
sponsored by the Cities of Cupertino, Mountain View, and Sunnyvale and the County of Santa Clara. The
Partnership has expanded the scope of the study to include eight additional communities in Santa Clara
County including Campbell, Gilroy, Los Altos, Los Altos Hills, Los Gatos, Monte Sereno, Morgan Hill, and
Saratoga, Campbell, Los Gatos, Monte Sereno, Morgan Hill and Gilroy; these 12 communities comprise the
“CCE Study Partners.”
This Study addresses the potential benefits and liabilities associated with forming a CCE program over a ten-
year planning horizon, drawing from the best available market intelligence and PEA’s direct experience with
each of California’s operating CCE programs – PEA has unique experience with regard to California CCE
program evaluation, development and operation, having provided broad functional support to each
operating CCE, which include Marin Clean Energy (“MCE”), Sonoma Clean Power (“SCP”) and Lancaster
Choice Energy (“LCE”). PEA utilized this direct experience to generate a set of anticipated scenarios for
SVCCE operations as well as a variety of sensitivity analyses, which were framed to demonstrate how certain
changes in the base case scenarios would influence anticipated operating results for the SVCCE program.
SVCCE’s Prospective Customers
Currently, Pacific Gas & Electric (“PG&E”) serves approximately 240,000 customer accounts within
communities of the CCE Study Partners, representing a mix of residential (≈90%) and commercial (≈10%)
accounts. These customers consume nearly four (4) billion kilowatt hours (“kWh”) of electric energy each year.
While the majority of customers fall under the residential classification, such accounts historically consume only
34% of the total electricity delivered by PG&E while commercial accounts consume the remaining 66%. Peak
customer demand within communities of the CCE Study Partners, which represents the highest level of
instantaneous energy consumption throughout the year, occurs during the month of July, totaling 660
megawatts (“MW”). Under CCE service, each of these accounts would be enrolled in the SVCCE program
over a three-phase implementation schedule commencing in early 2017, as later discussed in this Study.
Consistent with California law, customers may elect to take service from the CCE provider or remain with
PG&E, a process known as “opting-out.” For purposes of the Study, PEA utilized current participatory statistics
compiled by the operating CCE programs to derive an assumed participation rate of 85% for the SVCCE
program; the remaining 15% of regional customers are assumed to opt-out of the SVCCE program and would
continue receiving generation service from PG&E. Customer and energy usage projections referenced
throughout this Study reflect such adjustment.
SVCCE Indicative Supply Scenarios
For purposes of the Study, PEA and the CCE Study Partners identified three indicative supply scenarios, which
were designed to test the viability of prospective CCE operations under a variety of energy resource
compositions, emphasizing the SVCCE Partnership’s interest in significantly reducing greenhouse gas emissions
(“GHGs”) through increased use of carbon-free electric energy sources. As described to PEA, many local
agencies within the region have adopted climate action plans, which recognize CCE formation as a viable
opportunity to promote the achievement of targeted GHG reductions. With these considerations in mind, the
following supply scenarios were constructed for purposes of completing this CCE Study:

Draft Silicon Valley Community Choice Energy Technical Study
Page 2 Executive Summary
Scenario 1: Match the incumbent investor-owned utility’s (“IOU”), Pacific Gas & Electric Company
(“PG&E”), projected greenhouse gas emissions (“GHGs”) profile while exceeding PG&E’s projected
renewable energy content.1
Scenario 2: Exceed applicable renewable energy procurement mandates by providing SVCCE
customers with a minimum 51% renewable energy content in year one of program operations, scaling
up to 66% in year 10, while also promoting a 20% reduction in electric energy sector GHG emissions
relative to PG&E’s projected emissions profile by procuring additional GHG-free energy products.2
Scenario 3: Maximize renewable energy and GHG-free power supplies while maintaining general
parity with PG&E’s projected electric rates throughout the Study period.3
When considering the prospective supply scenarios evaluated in this Study, it should be understood that
SVCCE would not be limited to any particular scenario assessed in this Study; the Study’s supply scenarios
were developed in cooperation with CCE Study Partner leadership for the purpose of demonstrating potential
operating outcomes of a new CCE program under a broad range of resource mixes, which generally reflect
key objectives of the Study participants. Prior to the procurement of any particular energy products, SVCCE
would have an opportunity to refine its desired resource mix, which may differ from the prospective scenarios
reflected herein.
When developing SVCCE’s indicative supply scenarios, PEA was directed to include additional assumptions. In
particular, all scenarios include the provision of a voluntary retail service option that would provide
participating customers with 100% renewable energy (presumably for a price premium); for purposes of this
Study, it was assumed that only a small percentage of SVCCE customers would select this service option (≈2%
of the projected SVCCE customer base), which is generally consistent with customer participation in other
operating CCE programs. In addition, all scenarios assume the availability of current solar development
incentives as well as an SVCCE-administered net energy metering (“NEM”) service option, which could be used
to further promote the development of local, customer-sited renewable resources. PEA was also directed to
exclude the use of: 1) unbundled renewable energy certificates (due to ongoing controversy focused on
environmental benefit accounting for such products); 2) specified purchases from nuclear generation, which is
generally unavailable to wholesale energy buyers, including CCE programs, but represents a significant
portion of PG&E’s energy resource mix4; and 3) coal generation,5 which is a cost-effective but highly polluting
domestic power source.
1 Consistent with California’s Renewables Portfolio Standard (“RPS”) laws, retail sellers of electric energy, including CCEs, must procure a minimum 33% of all electricity from eligible renewable energy sources by 2020; with the recent enrollment of Senate Bill 350, California’s RPS procurement mandate has been increased to 50% by 2030. 2 Industry accepted GHG accounting practices generally recognize eligible renewable energy sources as GHG-free. Under the Scenario 2 portfolio composition, incremental purchases of non-RPS-eligible GHG-free sources, specifically electricity produced by larger hydroelectric resources (with nameplate generating capacity in excess of 30 megawatts) would be procured by SVCCE to achieve the noted GHG emissions reductions. 3 Under Scenario 3, the proportion of RPS-eligible renewable energy would achieve specified procurement mandates throughout the Study period. Similar to Scenario 2, additional GHG-free energy purchases would be made, subject to the specified rate constraint, in an effort to maximize the proportion of clean energy (e.g., renewable energy plus additional GHG-free energy) delivered to SVCCE customers. 4 According to PG&E’s 2013 Power Content Label, 22% of total electric energy supply was sourced from nuclear generating facilities; in 2014, a similar proportion of PG&E’s total electric energy supply was sourced from nuclear generating facilities: 21%, as reflected in PG&E’s Power Source Disclosure Report for the 2014 calendar year. 5 According to the California Energy Commission, approximately 6% of California’s total system power mix is comprised of electric energy produced by generators using coal as the primary fuel source: http://energyalmanac.ca.gov/electricity/total_system_power.html.
Draft Silicon Valley Community Choice Energy Technical Study
Executive Summary Page 3
Projected Cost Impacts to SVCCE Customers
Based on current market prices and various operating assumptions, as detailed in Section 2: Study
Methodology, the Study indicates that SVCCE would be viable under a broad range of market conditions,
demonstrating the potential for customer cost savings and significant GHG reductions. In particular, Scenarios
1 and 2 demonstrate the potential for customer cost savings ranging from 1% to 5%, relative to projected
PG&E rates, over the ten-year study period. Scenario 3, which was designed to maximize clean energy
deliveries to SVCCE customers subject to general rate parity with PG&E, demonstrated that significant
environmental benefits could be achieved through such a procurement strategy: average GHG emissions
reductions approximating 73% and a renewable energy content of 76% were deemed achievable at rate
parity during the 10-year Study period. As previously noted, none of the prospective supply scenarios
include the use of unbundled renewable energy certificates; renewable energy products will be exclusively
limited to “bundled” deliveries produced by generators primarily located within: 1) California; 2) communities
of the SVCCE Study Partners; and 3) elsewhere in the western United States.
General Operating Projections
When reviewing the pro forma financial results associated with each of the prospective supply scenarios, as
reflected in Appendix A of this Study, the “Total Change in Customer Electric Charges” during each year of
the study period reflects the projected net revenues (or deficits) that would be realized by SVCCE in the event
that the program decided to offer customer electric rates that were equivalent to similar rates charged by
PG&E. To the extent that the Total Change in Customer Electric Charges is negative, SVCCE would have the
potential to offer comparatively lower customer rates/charges, relative to similar charges imposed by PG&E;
to the extent that such values are positive, SVCCE would need to impose comparatively higher customer
charges in order to recover expected costs. Ultimately, the disposition of any projected net revenues will be
determined by SVCCE leadership during annual budgeting and rate-setting processes. For example, in the
cases of Scenario 1 and Scenario 2, each year of the study period reflects the potential for net revenues.
Such net revenues could be passed through to SVCCE customers in the form of comparatively lower electric
rates/charges, as contemplated in this Study, utilized as working capital for program operations in an
attempt to reduce program financing requirements, or SVCCE leadership could strike a balance between
reduced rates and increased funding for complementary energy programs, such as Net Energy Metering,
customer rebates (to promote local distributed renewable infrastructure buildout or energy efficiency, for
example) as well as other similarly focused programs. SVCCE leadership would have considerable flexibility
in administering the disposition of any projected net revenues, subject to any financial covenants that may be
entered into by the program.
Environmental Impacts
With regard to SVCCE’s anticipated clean energy supply and resultant GHG emissions impacts, each
prospective supply scenario yielded progressively increasing environmental benefits, resulting from the
incremental addition of renewable and other GHG-free power sources. For example, Scenario 1, which was
specifically designed to match the incumbent utility’s projected GHG emissions profile (while marginally
exceeding proportionate renewable energy procurement of the incumbent utility), did not yield any expected
emissions savings. Supply Scenario 2, which was framed to achieve specified proportionate GHG emission
reductions relative to the incumbent utility, resulted in annual emissions reductions ranging from approximately
38,000 (Year 1 impact) to 82,000 (Year 10 impact) metric tons. Scenario 3 yielded the most significant
emissions benefits, as current market pricing for renewable and GHG-free power sources allowed for the
significant majority of SVCCE’s projected power resource portfolio to be sourced from these supply options
while still remaining at rate parity with PG&E throughout the 10-year Study period – annual projected
emissions reductions ranged from approximately 112,000 (Year 1 impact) to 352,000 (Year 10 impact)

Draft Silicon Valley Community Choice Energy Technical Study
Page 4 Executive Summary
metric tons, a proportionate annual GHG reduction ranging from 60% (Year 1 impact) to 86% (Year 10
impact) relative to PG&E’s projected emission profile. With regard to the anticipated GHG emissions impacts
reflected under each scenario, it is important to note that such estimates are significantly influenced by PG&E’s
ongoing use of nuclear generation, which is generally recognized as GHG-free. In particular, the Diablo
Canyon Power Plant (“DCPP”) produces approximately 20% of the utility’s total annual electric energy
requirements. During the latter portion of the Study period, DCPP will need to relicense the facility’s two
reactor units (in 2024 and 2025, respectively) and there is some uncertainty regarding PG&E’s ability to
successfully relicense these units under the current configuration, which utilizes once-through cooling as part of
facility operations – use of once-through cooling is no longer permissible within California, and affected
generators must reconfigure requisite cooling systems or face discontinued operation. To the extent that
PG&E’s use of nuclear generation is curtailed or suspended at some point in the future, SVCCE’s projected
emissions reductions would significantly increase under Scenarios 2 and 3. However, due to the timing of the
relicensing issue facing DCPP, substantive increases to projected environmental benefits (resulting from
prospective changes to PG&E’s nuclear power supply) should not be assumed during the Study period.
The various energy supply components underlying each scenario are broadly categorized as:
Conventional Supply (generally electric generation produced through the combustion of fossil fuels,
particularly natural gas within the California energy markets);
“Bucket 1” Renewable Energy Supply (generally renewable energy produced by generating
resources located within or delivering power directly to California);
“Bucket 2” Renewable Energy Supply (generally renewable generation imported into California);
and
Additional GHG-Free Supply (generally power from large hydro-electric generation facilities, which
are not eligible to participate in California’s RPS certification program).
For the sake of comparison, Table 1 displays PG&E’s proportionate use of various power sources during the
most recent reporting year (2014) as well as the aggregate resource mix within the state of California, as
reported by the California Energy Commission (“CEC”). During the Study period, planned increases in
California’s RPS procurement mandate and various other factors will contribute to periodic changes in the
noted resource mix. Such changes will affect projected GHG emissions comparisons between SVCCE and
PG&E.

Draft Silicon Valley Community Choice Energy Technical Study
Executive Summary Page 5
Table 1: 2014 PG&E and California Power Mix
Energy Resource 2014 PG&E Power Mix1
2014 California Power Mix2
Eligible Renewable 27% 20%
--Biomass & Waste 5% 3%
--Geothermal 5% 4%
--Small Hydroelectric 1% 1%
--Solar 9% 4%
--Wind 7% 8%
Coal 0% 6%
Large Hydroelectric 8% 6%
Natural Gas 24% 45%
Nuclear 21% 9%
Unspecified Sources of Power 21% 14%
Total3 100% 100%
1Source: PG&E 2014 Power Source Disclosure Report; 2Source: California Energy Commission; 3Numbers may not add due to rounding.
Projected Economic Development Benefits
SVCCE’s projected long-term power contract portfolio is also expected to have the potential to generate
substantial economic benefits throughout the state as a result of new renewable resource development. A
moderate component of this impact is expected to occur within the local economy as a direct result of
renewable infrastructure buildout to be supported by a SVCCE-administered Feed-In Tariff program, which
could be designed to promote the development of smaller-scale renewable generating projects that would
supply a modest portion of SVCCE’s total energy requirements. The prospective SVCCE long-term contract
portfolio, which is reflected in the anticipated resource mix for each supply scenario, includes approximately
340 MW of new generating capacity (all of which is assumed to be located within California and some of
which may be located within communities of the CCE Study Partners). Based on widely used industry models,
such projects are expected to generate up to 11,000 construction jobs and as much as $1.4 billion in total
economic output. Ongoing operation and maintenance (“O&M”) jobs associated with such projects are
expected to employ as many as 185 full time equivalent positions (“FTEs”) with additional annual economic
output approximating $30 million. SVCCE would also employ a combination of staff and contractors,
resulting in additional ongoing job creation (up to 30 FTEs per year) and related annual economic output
ranging from $3 to $9 million.
Consolidated Scenario Highlights
The following exhibit identifies the projected operating results under each supply scenario in Year 1 of
anticipated CCE operations. Additional details regarding the composition of each supply scenario are
addressed in Section 2.

Draft Silicon Valley Community Choice Energy Technical Study
Page 6 Executive Summary
The following exhibit identifies the projected operating results under each supply scenario in Year 10 of
anticipated CCE operations. Note that projected reductions in customer savings, which are reflected in Year
10 operating results, substantially relate to the increased use of renewable and other carbon-free resources
throughout the Study period. Such resources are generally more expensive that fossil-fueled power sources
and impose upward pressure on SVCCE’s projected power supply costs, resulting in reduced customer savings.
Key Considerations Scenario 1 Scenario 2 Scenario 3
General Environmental Benefits
Renewable energy and GHG content
36% Renewable63% Total GHG-Free
51% Renewable70% Total GHG-Free
76% Renewable85% Total GHG-Free
Rate Competitiveness
Incremental renewable/clean energy purchases will impose
upward pressure on SVCCE customer rates
Average 4% savings relative to PG&E rate projections
Average 3% savings relative to PG&E rate projections
Average savings of <1% relative to PG&E rate projections
Projected Residential Customer Cost Impacts1
Resource choices will influence monthly energy costs1Average monthly usage for SVCCE res. customers ≈ 510
kWh
Average $5.09 monthly cost savings relative to PG&E rate projections
Average $3.49 monthly cost savings relative to PG&E rate projections
Average $0.76 monthly cost savings relative to PG&E rate projections
Assumed SVCCE Participation
Projected rate savings/increases are assumed to impact
customer participation levels; medium and large commercial
customers are assumed to be highly cost sensitive
85% customer participation rate assumed across all customer groups
85% customer participation rate assumed across all customer groups
85% customer participation rate assumed across all customer groups
Comparative GHG Emissions Impacts
GHG emissions impact relative to assumed PG&E portfolio
0.158 metric tons CO2/MWh emissions rate is equivalent to PG&E, resulting in zero incremental GHG emissions impacts in Year 1
0.126 metric tons CO2/MWh emissions rate results in ≈38,000 metric ton GHG emissions reduction (20%) in Year 1
0.064 metric tons CO2/MWh emissions rate results in ≈112,000 metric ton GHG emissions reduction (60%) in Year 1
Silicon Valley CCE
Indicative Supply
Scenarios: Year 1
Bucket 1 RE Supply (In-State Supply)
Bucket 2 RE Supply (Imported Supply) Additional GHG-Free Supply
Conventional Supply
Year 1 Scenario 1 Year 1 Scenario 2 Year 1 Scenario 3

Draft Silicon Valley Community Choice Energy Technical Study
Executive Summary Page 7
Findings and Conclusions
Based on the results reflected in this Study and PEA’s considerable experience with California CCEs, the
SVCCE program has a variety of electric supply options that are projected to yield both customer rate
savings and environmental benefits. To the extent that clean energy options, including renewable energy and
hydroelectricity, are used in place of conventional power sources, which utilize fossil fuels to produce electric
power, anticipated SVCCE costs and related customer rates would be marginally higher. However, Scenarios
2 and 3 indicate that the potential exists for significant GHG emissions reductions and increased renewable
energy deliveries under a scenario in which SVCCE rates are equivalent (on a projected basis) to or below
similar rates charged by the incumbent utility.
Ultimately, SVCCE’s ability to demonstrate rate competitiveness (while also offering environmental benefits)
would hinge on prevailing market prices at the time of power supply contract negotiation and execution.
Depending on inevitable changes to market prices and other assumptions, which are substantially addressed
through the various sensitivity analyses reflected in this Study, SVCCE’s actual electric rates may be somewhat
lower or higher than similar rates charged by PG&E and would be expected to fall within a competitive
range needed for program viability.
As with California’s operating CCE programs, SVCCE’s ability to secure requisite customer energy
requirements, particularly under long term contracts, will depend on the program’s perceived creditworthiness
at the time of power procurement. Customer retention and reserve accrual, as well as a successful operating
track record, will be viewed favorably by prospective energy suppliers, leading to reduced energy costs and
customer rates. Operational viability is also based on the assumption that SVCCE would be able to secure the
Silicon Valley CCE
Indicative Supply
Scenarios: Year 10
Key Considerations Scenario 1 Scenario 2 Scenario 3
General Environmental Benefits
Renewable energy and GHG content
49% Renewable75% Total GHG-Free
66% Renewable80% Total GHG-Free
76% Renewable97% Total GHG-Free
Rate Competitiveness
Incremental renewable/clean energy purchases will impose
upward pressure on SVCCE customer rates
Average 3% savings relative to PG&E rate projections
Average 1% savings relative to PG&E rate projections
General rate parity results in minimal cost impact
Projected Residential Customer Cost Impacts1
Resource choices will influence monthly energy costs1Average monthly usage for SVCCE res. customers ≈ 510
kWh
Average $4.19 monthly cost savings relative to PG&E rate projections
Average $1.93 monthly cost savings relative to PG&E rate projections
Average $0.14 monthly cost increase relative to PG&E rate projections
Assumed SVCCE Participation
Projected rate savings/increases are assumed to impact
customer participation levels; medium and large commercial
customers are assumed to be highly cost sensitive
85% customer participation rate assumed across all customer groups
85% customer participation rate assumed across all customer groups
85% customer participation rate assumed across all customer groups
Comparative GHG Emissions Impacts
GHG emissions impact relative to assumed PG&E portfolio
0.109 metric tons CO2/MWh emissions rate is equivalent to PG&E, resulting in zero incremental GHG emissions impacts in Year 10
0.087 metric tons CO2/MWh emissions rate results in ≈82,000 metric ton GHG emissions reduction (20%) in Year 10
0.015 metric tons CO2/MWh emissions rate results in ≈352,000 metric ton GHG emissions reduction (86%) in Year 10
Year 10 Scenario 1 Year 10 Scenario 2 Year 10 Scenario 3
Bucket 1 RE Supply (In-State Supply)
Bucket 2 RE Supply (Imported Supply) Additional GHG-Free Supply
Conventional Supply

Draft Silicon Valley Community Choice Energy Technical Study
Page 8 Executive Summary
necessary startup funding as well as additional financing to satisfy program working capital estimates. As
previously noted, it is PEA’s opinion that SVCCE would be operationally viable under a relatively broad
range of resource planning scenarios, demonstrating the potential for customer savings as well as reduced
GHG emissions.

Draft Silicon Valley Community Choice Energy Technical Study
Section 1: Introduction Page 9
SECTION 1: INTRODUCTION
This Community Choice Energy (“CCE”) Technical Study (“Study”) was prepared for the Silicon Valley
Community Choice Energy (“SVCCE”) Partnership, by Pacific Energy Advisors, Inc. (“PEA”) under contract with
the City of Sunnyvale, for purposes of describing the potential benefits and liabilities associated with forming
a CCE program in Santa Clara County. Such a program would provide electric generation service to
residential and business customers located within the SVCCE Partner jurisdictions, which currently receive
electric service from the incumbent utility, Pacific Gas & Electric Company (“PG&E”). The SVCCE Partnership is
sponsored by the Cities of Cupertino, Mountain View, and Sunnyvale and the County of Santa Clara. The
Partnership has expanded the scope of the study to include eight additional communities in Santa Clara
County; the 12 communities comprise the “CCE Study Partners” and are identified below in Table 2.
Table 2: Prospective SVCCE Member Communities
City of Campbell City of Monte Sereno
City of Cupertino City of Morgan Hill
City of Gilroy City of Mountain View
City of Los Altos City of Saratoga
Town of Los Altos Hills City of Sunnyvale
Town of Los Gatos County of Santa Clara (unincorporated areas)
In consideration of its response to the Sunnyvale’s Request for Qualifications No. F15-49 for Professional
Services to the Environmental Services Department in Association with the Study of Community Choice
Aggregation, which was issued on November 21, 2014, PEA was retained by the City to conduct a technical
study focused on the prospective formation of a CCE program serving communities of the CCE Study Partners.
This Study reflects the results of a comprehensive analysis, which addresses prospective CCE operations under
a range of scenarios, including the identification of anticipated rate/cost impacts, environmental benefits,
resource composition and economic development amongst other considerations. When reviewing this Study, it
is important to keep in mind that the findings and recommendations reflected herein are substantially
influenced by current market conditions within the electric utility industry, which are subject to sudden and
significant changes.
PEA is an independent consulting firm specializing in providing strategic advice and technical support to
various organizations within the California electricity market, particularly aspiring and operating CCE
programs. PEA’s consultants have been assisting local governments with the evaluation and implementation of
CCE programs since 2004, including each of California’s operational CCE programs, which include Marin
Clean Energy (“MCE”), Sonoma Clean Power (“SCP”) and Lancaster Choice Energy (“LCE”). This Study reflects
operating projections that are based on the best available information, utilizing transparent, documented
assumptions to provide an objective assessment regarding the prospects of CCE operation within communities
of the CCE Study Partners. Such assumptions are later discussed in Section 2. However, due to the dynamic
nature of California’s energy markets, particularly market prices which are subject to frequent changes, the
SVCCE Partnership should confirm that the assumptions reflected in this Study generally align with future
market conditions (observed at the time of any decision by the SVCCE Partnership to move forward) to
promote the achievement of early-stage SVCCE operations that generally align with the operating projections
reflected in this Study. To the extent that future market price benchmarks materially differ from any of the
assumptions noted in Section 2 of this Study, PEA recommends updating pertinent operating projections to
ensure well-informed decision-making and prudent action.

Draft Silicon Valley Community Choice Energy Technical Study
Page 10 Section 1: Introduction
When reviewing this Study, note that the term Community Choice Aggregation (“CCA”), which is referenced
within applicable legislation and related regulations, is currently being used interchangeably with the term
Community Choice Energy (“CCE”)6, a term of art that has been adopted by the SVCCE Partnership to
identify its aggregation initiative. Use of the CCE acronym is becoming increasingly common when referring
to similar customer aggregation programs throughout the state. For purposes of this Study, the term
Community Choice Energy or “CCE” is used when referring to such aggregation programs.
Under existing rules administered by the California Public Utilities Commission (“CPUC”), PG&E would use its
transmission and distribution system to deliver the electricity supplied by SVCCE in a non-discriminatory
manner, as it currently does for its own “bundled service” customers (i.e., customers who receive both electric
generation and delivery services from a single provider) and for “direct access” customers who receive
electricity provided by competitive retail suppliers. PG&E would continue to provide all metering and billing
services, and customers would receive a single electric bill each month from PG&E – each customer’s bill would
show SVCCE charges for generation services as well as charges for PG&E delivery services. Money collected
by PG&E on behalf of SVCCE would be electronically transferred each day to SVCCE’s designated bank
account. Following enrollment in the CCE program, SVCCE customers would continue to be eligible for PG&E-
administered programs funded through distribution rates and public goods charges, including rebate and
subsidy programs focused on energy efficiency and distributed solar generation.
To fulfill the electric energy requirements of its customers and related compliance obligations, SVCCE would
participate in the electricity market to purchase various energy products from qualified generators, brokers,
and/or marketers. In the future, SVCCE may also produce electricity generated by its own power plants,
which could be independently developed or acquired by the CCE. Other programs and services may be
offered by SVCCE as well, such as new programs to promote conservation and/or energy efficiency, locally-
situated distributed renewable generation (e.g., photovoltaic solar systems that are installed by a customer
“behind the meter” to reduce reliance on offsite energy sources and/or reduce overall energy costs), electric
vehicle charging, and customer load shifting (also known as “demand response”).
PEA’s analysis quantifies the expected benefits and liabilities of the CCE program in terms of overall
operating margins, ratepayer costs, reductions in emissions of GHGs, which primarily entail carbon dioxide
(“CO2”) from electric generating resources used to supply customers within communities of the CCE Study
Partners, and economic development impacts arising from new job creation and local spending. The remaining
sections of this report are organized by subject matter as follows:
Section 2: Study Methodology – describes the approach used to conduct the Study.
Section 3: SVCCE Technical Parameters – describes the electric consumption patterns and electric
resource requirements of prospective SVCCE customers (i.e., electricity customers located within
communities of the CCE Study Partners).
Section 4: Cost of Service Elements – explains the various costs that would be involved in providing
electric service through a CCE program.
6 While it is generally understood that both terms refer to the same type of load serving entity, as provided for under the California Public Utilities Code, PEA is not aware of any current references to the term “Community Choice Energy” or “CCE” in such Code or applicable regulations. In consideration of this observation, SVCCE should remain aware of this terminology when communicating with jurisdictional regulatory entities or legislators regarding its prospective aggregation program to ensure that naming conventions conform with currently applicable laws and regulations which address such programs.

Draft Silicon Valley Community Choice Energy Technical Study
Section 1: Introduction Page 11
Section 5: Cost and Benefits Analysis – details the estimated benefits and financial liabilities associated
with a variety of potential resource scenarios with regard to ratepayer costs, GHG impacts, and local
economic development impacts.
Section 6: Sensitivity Analyses – describes the variables that are expected to have the largest impact
on customer rates and shows the range of impacts associated with key variables.
Section 7: Risk Analysis – highlights key risks associated with the formation and operation of a CCE
program, including recommended mitigation measures for such risks.
Section 8: CCE Formation Activities – summarizes the steps involved in forming a CCE program.
Section 9: Evaluation and Recommendations – summarizes Study results and provides recommendations
based on PEA’s analysis.
Appendix A: SVCCE Pro Forma Analyses – includes pro forma operating projections for each of the
three SVCCE supply scenarios addressed in this Study.
Draft Silicon Valley Community Choice Energy Technical Study
Page 12 Section 2: Study Methodology
SECTION 2: STUDY METHODOLOGY
The analytical framework for the Study is a cost-of-service model that estimates all costs and anticipated
revenues that would be incurred/received in providing CCE services. The Study examines projected CCE
operations over a ten-year study period, including the expected economic/financial impacts related thereto.
As detailed in Section 4 (Cost of Service Elements), CCE program costs include those associated with energy
procurement as well as administrative, financing and other costs that would be involved in the program’s
formation and ongoing operation. Total projected costs over each twelve-month period represent the amounts
that must be funded through program rates, also known as the “revenue requirement.” Average generation
rates of the CCE program, which are calculated by dividing total program costs (dollars) by total program
electricity sales (kilowatt hours, kWh; or megawatt hours, MWh), were determined for each year as well as
the entirety of SVCCE’s ten-year study period (ten-year averages were calculated on a levelized basis, as
further described below) to facilitate comparisons among potential electric supply mixes and against
projected PG&E rates.
The CCE program would have myriad choices with regard to the types of resources that may comprise its
electric supply portfolio. Such choices typically focus on the following portfolio attributes:
1) The proportion of renewable and non-renewable, or conventional, generation sources;
2) Specification of a portfolio GHG emissions rate;
3) Selection of specific generating technologies (solar photovoltaic, wind, geothermal, etc.);
4) Identification of resource locations (local, in-state, regional or a combination thereof);
5) Preferred power supply structure (power purchase agreement or, potentially, asset development/
acquisition);
6) Determination of resource scale (for example, larger “utility-scale” projects and/or smaller distributed
generating resources); and
7) Duration of supply commitments (short-, mid-, long-term).7
Each of these choices presents economic and/or environmental tradeoffs. Specification of initial supply
preferences, which is a fundamental component of the resource planning process, typically occurs during the
implementation and operation stages by those charged with leading and overseeing the CCE program. As
the CCE continues to operate over time, resource planning will remain an ongoing obligation, enabling the
CCE to adapt its planning principles to changing circumstances while promoting the CCE program’s
overarching policy objectives.
For purposes of this Study, PEA developed three representative supply portfolios that were evaluated on the
basis of ratepayer cost, renewable energy content, GHG emissions, and economic development impacts. The
objective of evaluating alternative supply scenarios is to obtain a robust set of analytical results that can be
used to inform decision-makers of the inherent trade-offs that exist among various resource choices while also
illustrating a reasonable range of outcomes that could be achieved through CCE implementation and
operation. It should be understood that SVCCE would not be limited to any particular supply scenario
assessed in this Study; the supply scenarios reflected in this Study have been developed for the sake of
example, taking into consideration key objectives of the aspiring CCE program.
7 For purposes of this Study, a “short-term” supply commitment generally refers to a contract term of one to three years in duration; a “mid-term” supply commitment generally refers to a contract term of three to ten years in duration; and a “long-term” supply commitment generally refers to a contract term of ten or more years in duration.

Draft Silicon Valley Community Choice Energy Technical Study
Section 2: Study Methodology Page 13
Supply Scenario Overview
The following supply scenarios are representative of different choices that could be made by SVCCE with
regard to overall renewable energy content, fuel sources and generator locations (of the electric resources
used to supply SVCCE’s customers). Each scenario embodies unique portfolio attributes and related ratepayer
impacts. Subject to compliance with prevailing law and applicable regulations, California CCEs have a broad
range of options when assembling supply portfolios. The three scenarios discussed in this Study also reflect
the inclusion of power supply from both existing generating sources, which may supply the majority of
SVCCE’s early stage energy requirements, and new renewable generation projects developed as a result of
long-term power purchase agreements entered into by the CCE program, which may play an increasingly
prominent role in SVCCE’s mid- and long-term resource planning efforts.
With regard to the specific sources of power supply that were considered as part of this Study, PEA was directed
to exclude the use of: 1) unbundled renewable energy certificates (due to ongoing controversy focused on
environmental benefit accounting for such products); 2) specified purchases from nuclear generation, which is
generally unavailable to wholesale energy buyers, including CCE programs, but represents a significant portion of
PG&E’s energy resource mix; and 3) coal generation, which is a cost-effective but highly polluting domestic
power source. Exclusion of the aforementioned energy products will not only avoid potential controversy
regarding the use of generally objectionable and/or environmentally damaging power sources, but it will
also ensure that SVCCE’s portfolio emissions reporting remains consistent with potential changes in California
law.8 In consideration of this direction, such products were omitted during SVCCE’s portfolio analysis.
It is also noteworthy that independent development and ownership of generating resources may also be an
available supply alternative for the CCE program over the longer-term planning horizon, following years of
successful operations, financial reserve accrual and establishment of general creditworthiness. Because the
timing of any significant CCE-sponsored resource development and ownership likely falls outside the planning
horizon addressed within this Study, PEA has not incorporated SVCCE-owned resources as a component of the
indicative supply scenarios discussed herein. This assumption is largely based on observations related to
California’s operating CCE programs, which have yet to pursue direct investment in generating resources; the
timeline for investment in such resources is likely consistent with PEA’s related assumptions reflected in this
Study.
With regard to the three prospective SVCCE supply scenarios addressed in this Study, such scenarios were
designed to evaluate a broad range of portfolio characteristics for purposes of demonstrating the inherent
tradeoffs that exist when deciding between available resource options. The prospective supply portfolios
were also constructed in consideration of certain key objectives that were communicated to PEA on behalf of
the CCE Study Partners. These objectives generally focused on the achievement of rate competitiveness, GHG
emissions reductions and increased use of renewable energy resources relative to the incumbent utility. Table
3 identifies key planning elements of each scenario addressed in this Study.
8 Assembly Bill 1110 (Ting), which has become a two-year bill, is intended to require the disclosure of portfolio emissions intensity to California’s retail electricity customers. The proposed methodology for such disclosures would not allow the inclusion of environmental benefits associated with unbundled renewable energy certificates.

Draft Silicon Valley Community Choice Energy Technical Study
Page 14 Section 2: Study Methodology
Table 3: Key Planning Elements of Each SVCCE Indicative Supply Scenario
SVCCE
Supply
Scenario
Primary Objectives of
Supply Portfolio
Total Renewable
Energy Content9 as %
of Total Supply (Year
1; Year 10)
Anticipated GHG
Emissions Savings10
(Year 1; Year 10)
Anticipated SVCCE
Customer Cost
Impacts11 (Year 1;
Year 10)
Scenario 1
Achieve GHG emissions
parity (with PG&E) on a
projected basis while
exceeding PG&E’s
expected proportion of
RPS-eligible procurement
YEAR 1 = 36%
YEAR 10 = 49%
YEAR 1 = No
Change
YEAR 10 = No
Change
YEAR 1 = 4%
average savings
YEAR 10 = 3%
average savings
Scenario 2
Increased RPS-eligible
renewable energy
procurement plus 20%
GHG emissions reductions
(relative to incumbent
utility)
YEAR 1 = 51%
YEAR 10 = 66%
YEAR 1 = 20%
reduction
YEAR 10 = 20%
reduction
YEAR 1 = 3%
average savings
YEAR 10 = 1%
average savings
Scenario 3
Maximize GHG-free
power procurement (RPS-
eligible renewable energy
plus additional GHG-free
supply) while maintaining
general rate/cost parity
YEAR 1 = 76%
YEAR 10 = 76%
YEAR 1 = 60%
reduction
YEAR 10 = 86%
reduction
YEAR 1 = “Zero”
impact
YEAR 10 = “Zero”
impact
Under each of the three supply scenarios, the CCE program would cause new renewable generation projects
to be developed through long-term power purchase agreements. It should be recognized that developing
generation in California is a difficult and time-consuming process, and developing generation within
communities of the CCE Study Partners and surrounding areas may be even more difficult than in other parts
of the state, such as California’s Central Valley. Major development challenges include siting, permitting,
financing and generator interconnection with the transmission system, all of which may take far longer (and
result in higher costs) than originally planned. Suitable sites must be identified and placed under control of
the developer, and the required land can be quite significant, particularly for photovoltaic solar projects.12 It
is also common for proposed generating projects to draw opposition from local residents and interest groups,
who may identify various objections to the project (e.g., habitat destruction/displacement, visual impacts and
species mortality). Once a suitable site is secured and the necessary permits are in place, the project must be
financed, and that financing will primarily depend upon the perceived creditworthiness of the CCE program,
which may take several years to build. As previously noted, PEA has assumed that during the ten year study
horizon, generation projects would be developed and financed by third parties under long-term power
purchase agreements with SVCCE without direct ownership of such projects by the CCE program.
9 All renewable energy volumes are assumed to be eligible for use in California’s Renewables Portfolio Standard (“RPS”) program. 10 Anticipated GHG emissions impacts were determined in consideration of the GHG emissions factor associated with SVCCE’s assumed resource mix as compared to the assumed emissions factor associated with PG&E’s supply portfolio, which is expected to decline throughout the ten-year study period. 11 Anticipated customer cost impacts were determined in consideration of the projected average SVCCE customer rate to be paid under each of the three prospective supply scenarios relative to the forecasted average PG&E rate. 12 Each MW of PV capacity requires approximately five to eight acres, depending upon the location and installation characteristics.

Draft Silicon Valley Community Choice Energy Technical Study
Section 2: Study Methodology Page 15
Key Assumptions
When preparing the Study, it was necessary for PEA to incorporate a variety of assumptions, which were
primarily based on current market observations and PEA’s direct experience with California’s operating CCE
programs. Such assumptions were instrumental in deriving SVCCE’s projected operating results, as many
actual data points, such as final contract energy pricing and future customer participation in the SVCCE
program, will not be known until immediately prior to or after service commencement. For purposes of this
Study, the key assumptions identified in Table 4 were incorporated to facilitate the development of SVCCE
operating projections:
Table 4: Key Assumptions Underlying the SVCCE Technical Study
Key Assumption Description
Power Supply Costs Prices for renewable energy and resource adequacy capacity are based on prices
observed for recent transactions and escalated for future periods.
Prices for conventional power supply utilize forward curves based on exchange
quoted futures prices for power, natural gas and GHG emissions allowances.
Fees associated with wholesale scheduling, balancing and settlement with the
California Independent System Operator are based on similar costs experienced by
existing CCE programs.
Capacity requirements and shaped energy requirements were estimated using
monthly customer load data by rate classification as adjusted by PG&E’s hourly class
load profiles.
PG&E Rates PG&E proposed 2016 rates (August Annual Electric True-up) and surcharges (e.g.,
PCIA) were applied to customer load data aggregated by major rate schedule to
form the basis for the PG&E rate forecast.
For future years, the forecast was derived using PG&E’s most recent resource plan,
adjusted for changes to renewable energy content mandated by SB 350.
Forecast of PCIA is based on projected PG&E power portfolio cost and forward
market prices.
It is assumed that CCE would provide similar rate designs and options as PG&E.
Community Participation All twelve municipalities are assumed to participate.
Customer Participation Service is assumed to be offered to all customers except those taking direct access
and standby service. Based on average customer retention experienced by
operating CCE programs, 85% of customers offered service across all customer
classes are assumed to enroll.
CCE Rates & Reserve CCE rates would be set to recover all program costs including power supply,
administration, and debt service as well as funding a reserve equivalent to 4% of
annual program costs.
CCE Operations Staffing and other operating costs were estimated by benchmarking to the three
currently operating CCE programs, with adjustment for differences in the number of
customers served.
Costs associated with administering net energy metering, demand response and
energy efficiency programs were included at $1,275,000 per year.
Bonds and Other Deposits CPUC Bond: $100,000 (Included in Startup Cost)
PG&E Deposit: $40,000 (Included in Startup Cost)
CAISO Deposit: $500,000 (Included in Working Capital)
Supplier Reserve: $2,500,000 (Included in Working Capital)
Startup Costs: $2,900,000
Working Capital: $9,000,000

Draft Silicon Valley Community Choice Energy Technical Study
Page 16 Section 2: Study Methodology
Key Assumption Description
Rate Comparisons Rate comparisons are based on the total delivered rate between CCE service and
PG&E service, with the CCE program offering a rate structure that generally parallels
that of PG&E including time-of-use rate differentials that may be applicable under
certain rate schedules (e.g., certain Net Energy Metered customers, which may take
service under rate schedules with time-of-use rate variants). For CCE service, the total
delivered rate includes the CCE charges, PG&E delivery charges, and PG&E
surcharges (e.g., PCIA). For PG&E service, the total delivered rate includes PG&E
generation charges and PG&E delivery charges.
Renewable Portfolio Standards Study assumes the currently applicable renewable energy requirements are
maintained through 2020 and increased to 50% renewable portfolio content by
2030 as mandated by SB 350.
Greenhouse gas emissions rates For PG&E, used its most recent forecast of portfolio emissions rates and adjusted the
rate downwards for future years for the effects of anticipated increase in renewable
energy content. Assumed continued operation of Diablo Canyon Nuclear Power Plant
throughout study period.
For CCE, used the CARB default emissions rate applied to power purchases other than
purchases from renewable and hydro-electric sources.
Voluntary 100% Renewable
Energy Program
Assumed 2% of enrolled customers elect this option.
Multi-Phase Customer Enrollment
For purposes of this Study, PEA assumed a three-phase customer implementation strategy through which that
would enroll customers in the following manner: 1) one-third of prospective SVCCE customers would be
enrolled during the first month of service, drawing from a broad, representative cross section of the entire
SVCCE customer base; 2) another third of the original customer population (i.e., half of the remaining customer
population which had yet to be enrolled) would be transitioned to CCE service during the thirteenth month of
operation, reflecting similar characteristics when compared with the first phase; and 3) all remaining customers
not previously enrolled would be transitioned to CCE service during the twenty fifth month of program
operations. Such a strategy will allow the CCE program to “walk before its runs,” gaining operational
experience while the initial customer base remains relatively small (when compared to the total prospective
customer population). This approach will also create an opportunity for the CCE program to “debug”
potential customer service and billing issues that may arise during initial operations and will also reduce
credit/collateral concerns during initial power contracting efforts. Furthermore, a multi-year phase-in strategy
will serve to minimize initial working capital requirements of the SVCCE program by reducing power contract
payment obligations during early operations, allowing the CCE program to build reserves for purposes of
self-funding future phase-in activities.
Indicative Renewable Energy Contract Por tfolio
For purposes of this Study, an indicative long-term renewable energy contract portfolio, which emphasizes
resource and delivery profile diversity in consideration of reasonably available project opportunities, was
assembled for the SVCCE program. For example, a contract portfolio exclusively focused on solar resources
would not provide for requisite energy requirements during the night; similarly, a portfolio focused on the
exclusive use of wind resources would not adequately address SVCCE customer energy requirements during
times of day when wind levels are low. In consideration of the unique generating characteristics associated
with various renewable energy technologies, PEA assembled SVCCE’s indicative renewable energy contract
portfolio for purposes of creating a composite energy delivery profile that would reasonably match the
manner in which SVCCE customers use electric energy. Considerable amounts of solar capacity were
incorporated in the indicative supply portfolio in consideration of robust resource availability throughout
Draft Silicon Valley Community Choice Energy Technical Study
Section 2: Study Methodology Page 17
California and SVCCE’s need for considerable amounts of electricity during peak times of day. Geothermal
and landfill gas-to-energy generating technologies were also incorporated in the supply portfolio, as such
resources have been successfully secured by other CCE programs and provide a stable (“basesload”) energy
delivery profile that only marginally varies over time. Wind generating capacity was also included due to its
availability and general cost effectiveness in serving CCE renewable energy requirements.
This indicative long-term contract portfolio was applied when analyzing each of the three supply scenarios for
purposes of determining the resource planning and financial impacts associated with long-term power supply
commitments that could be reasonably pursued by SVCCE. As reflected in the following table, the indicative
supply portfolio phases in a variety of contracting opportunities over time, allowing the CCE program to
incrementally increase long-term renewable supply commitments without unnecessarily exposing SVCCE to
renewable energy price risk at a single point in time – this is a prudent resource and risk management
practice in consideration of recent, ongoing price reductions that have been observed by California’s
renewable energy buyers. The incremental ramp up in contracted renewable energy volumes will also serve
the purpose of mitigating credit concerns that may impact the CCE program during early operations and limit
the pace at which new long-term resource commitments can be made.
Based on PEA’s experience, California’s three operating CCEs, MCE, SCP and LCE, have been successful in
pursuing small- (1 to 5 MWs in size) to mid-sized (5-40 MWs in size) renewable energy contracting
opportunities during early operations – the developers/owners of such projects have been able to reconcile
credit concerns in consideration of the CCE’s projected operating results and/or relatively nominal collateral
postings. PEA expects that SVCCE would have similar experiences when pursuing available renewable
project options. For example, prior to commencing operations and in the 24 to 36 months thereafter, it is
expected that SVCCE would be able to secure long-term contract commitments with both small- and mid-sized
renewable project opportunities on the basis of SVCCE’s projected operating results. California’s other
operating CCEs have generally been able to pursue similar opportunities with little to no collateral
obligations, utilizing the respective CCE’s pro forma operating projections as the basis for demonstrating
creditworthiness.
After establishing a successful operating track record, SVCCE should be effective in pursuing larger-scale
project opportunities, which may prove to be more cost competitive. PEA expects that larger-scale projects
may be available following the accrual of three or more years of successful operating history, including the
accumulation of prudent financial reserves and the demonstration of significant customer retention – in
general, the opt-out structure provided for by California’s CCE legislation is viewed as a risk by many
prospective project developers and energy sellers; however, the successful operating track record of
California’s existing CCEs and the ongoing compilation of data related to customer participation/retention
has provided compelling evidence that CCE customer counts and overall program operations will remain
stable over time – in general, California’s operating CCEs have each experienced customer retention rates in
excess of 80% with each successive CCE program observing increasing retention rates for its customers. This
trend seems to suggest that improved familiarity with the CCE business model, a growing track record of
success amongst California’s operating CCE programs, and effective marketing campaigns have contributed
to higher levels of customer retention over time.
The indicative portfolio of long-term renewable energy contracts also reflects a significant commitment to
renewable project development within communities of the CCE Study Partners – a total of 20 MWs of
anticipated feed-in tariff (“FIT”) projects has been included in the Study in consideration of the CCE Study
Partners’ interest in promoting local renewable infrastructure buildout and economic development. FIT projects
are typically smaller-scale renewable development opportunities, ranging from 50 kW to 1.5 MW in size, so
PEA has assumed that numerous projects will comprise the 20 MW allocation reflected in the indicative
resource mix.

Draft Silicon Valley Community Choice Energy Technical Study
Page 18 Section 2: Study Methodology
For purposes of the Study, PEA has assumed a uniform portfolio of long-term renewable energy contracts for
each of the three indicative supply scenarios. In practical terms, this means that each of the prospective
supply scenarios reflects the resource mix described below as well as varying amounts of additional
renewable and GHG-free energy procured under shorter-term contract arrangements. Such additional
energy volumes will be procured/applied to fulfill each scenario’s specified renewable resource mix.
Assumed prices for such long-term transactions as well as associated capacity factors, which reflect the amount
of energy produced by each resource relative to its total, potential generating capacity, were also
assembled by PEA in consideration of recent renewable energy transactions and typical operating
characteristics associated with the noted renewable resource types. It is also noteworthy that PEA’s pricing
assumptions reflect significant planned reductions in the federal investment tax credit (“ITC”), which is
expected to decrease from 30% to 10% for projects with initial delivery dates occurring after December 31,
2016, as well as growing demand for new renewable energy projects resulting from California’s RPS
procurement mandate increasing to 50% by 203013 – both of these considerations may impose upward
pressure on renewable energy pricing. PEA has addressed this possibility through relatively conservative
price assumptions when compared to the current market for renewable energy products. It is possible, of
course, that Congress could extend the ITC at its current level, which would mean prices for solar power would
be lower than the assumptions used in this study. It is also possible that increased demand, while applying
upward pricing pressure in the near term, may promote expanded supply capabilities, which would have the
effect of mitigating such price pressures over time. The specific contracting opportunities, which have been
incorporated in SVCCE’s indicative long-term renewable energy supply portfolio, are identified below in
Table 5.
Table 5: SVCCE’s Indicative Long-Term Renewable Energy Contract Portfolio
Resource Type Year of First
Delivery Capacity (MW) Capacity Factor**
Assumed Price
($/MWh)***
Solar PV, utility scale 2019 100* 30% $65
Solar PV, utility scale 2023 100* 30% $65
Wind 2020 100* 35% $70
Landfill Gas to Energy 2020 10* 90% $80
Landfill Gas to Energy 2025 10* 90% $80
Geothermal 2018 50 100% $80
Solar PV, multiple FIT (local)
projects 2018 5* 22% $100
Solar PV, multiple FIT (local)
projects 2020 5* 24% $90
Solar PV, multiple FIT (local)
projects 2021 5* 24% $90
Solar PV, multiple FIT (local)
projects 2022 5* 24% $90
Total 390 MW
*Denotes assumed new generating capacity to be developed as a result of long-term contracts between SVCCE and qualified renewable project
developers. 340 MW of potential new, California-based renewable generating capacity has been assumed in this Study.
13 On October 7, 2015, Governor Brown signed Senate Bill 350, the Clean Energy and Pollution Reduction Act of 2015. SB 350 increases California’s RPS to 50% by 2030 amongst other clean-energy initiatives. Many details regarding implementation of SB 350 will be developed over time with oversight by applicable regulatory agencies.
Draft Silicon Valley Community Choice Energy Technical Study
Section 2: Study Methodology Page 19
**Capacity factors quantify the proportionate amount of energy produced by each resource relative to its total, potential generating capacity.
For example, if a 10 MW landfill gas-to-energy generator produced 78,840 MWh per year (relative to its total generating potential of
87,600 MWhs), its capacity factor would be 90%. By comparison, solar generators have relatively low capacity factors (ranging from 20% -
30%, generally), as such generators produce no power at night and very little power during the early morning and late afternoon hours.
***Certain pricing assumptions reflect planned reductions to currently applicable incentives, which may result in increased renewable energy prices
during the ten-year planning period. To the extent that such incentives are continued at current levels and/or supply significantly increases, actual
prices could be lower than reflected herein. It is important to note that a broad range of considerations, including California’s recently increased
RPS (to 50% by 2030), may influence renewable energy pricing and product availability in future years.
Regarding the referenced local solar projects, which are assumed to be developed under an SVCCE-
administered FIT program, the pricing assumptions for such projects were set in consideration of three key
factors:
1) Prices currently available under PG&E’s Electric-Renewable Market Adjusting Tariff (“ReMAT”), which
represents the current construct of PG&E’s FIT program – local project developers would be
evaluating SVCCE’s FIT in consideration of other available alternatives, so it is assumed that SVCCE
would want to offer comparatively higher prices to attract such developers;
2) The assumption that project development costs within SVCCE’s participating jurisdictions generally
exceed project development costs in other locations; and
3) The general interest of the CCE Study Partners in providing meaningful price incentives to promote
local renewable infrastructure buildout.
If such a program is administered by SVCCE, FIT energy prices will need to be sufficiently high to compel
project sponsors to focus development efforts on locally situated project sites – this is the primary purpose of
locally-focused FIT programs. More specifically, PG&E’s ReMAT currently offers eligible, smaller-scale solar
projects a base energy price of $61.23 per MWh.14 This price is adjusted according to a schedule of Time of
Delivery, or “TOD”, factors which generally increase the annual average price paid to participating solar
generators, depending on the quantity of energy produced and delivered during peak times of day (e.g.
weekdays between the hours of 3:00 and 8:00 P.M.). In general terms, the aforementioned base energy
price may translate to a TOD-adjusted average price of more than $70 per MWh, depending on actual
power production. PEA also assumed that project development costs, particularly land costs within the SVCCE
service territory, would be higher than average development costs throughout PG&E’s service territory. With
these observations in mind, as well as the general concept that FIT programs are intended to incentivize local
renewable infrastructure buildout, the prices associated with FIT energy productions were set at comparatively
high levels, ranging from $90-$100 per MWh. Such prices reflect a premium ranging from $25-$35 per
MWh relative to larger projects within optimal development locations.15 While such prices seem sufficient to
promote local FIT interest, it is noteworthy that SVCCE could independently adjust such prices in the event that
actual FIT participation is below (or above) desired levels. In the event that the SVCCE FIT program generates
more interest and participation than originally anticipated, SVCCE could cap the program by implementing a
total capacity ceiling. The cap could always be modified, but implementing a participatory ceiling would
provide an additional layer of financial certainty for the FIT program.
14 PG&E’s Program Period 12 price for As-Available Peaking products, as noted on PG&E’s ReMAT website on October 29, 2015: http://www.pge.com/en/b2b/energysupply/wholesaleelectricsuppliersolicitation/ReMAT/index.page. 15 Note that MCE’s FIT tariff offers similar price incentives to attract local developers. According to MCE’s FIT tariff, applicable prices are scheduled to incrementally decrease over time (as successive FIT projects enter the project development queue).

Draft Silicon Valley Community Choice Energy Technical Study
Page 20 Section 2: Study Methodology
Energy Production Options & Scenario Composition
When considering the portfolio composition associated with SVCCE’s prospective supply scenarios, several
resource types, including clean (e.g., renewable and GHG-free) and conventional (e.g., fossil-fueled, which
typically entails the use of natural gas within California) energy sources, would be available to supply the
electric energy requirements of SVCCE customers. With regard to renewable energy product options,
California’s currently effective RPS program allows for the use of three distinct renewable energy products,
which are primarily differentiated by unique delivery attributes. In particular, certain RPS-eligible renewable
energy products are referred to as “bundled renewable energy,” meaning that the physical electricity and
renewable attributes (i.e., Renewable Energy Certificates, or “RECs”) are both delivered to the buyer,
whereas other RPS-eligible products are referred to as “unbundled,” meaning that the renewable attributes,
or RECs, are sold separately from the electric commodity. Under the nomenclature of California’s RPS,
bundled renewable energy products are categorized as Portfolio Content Category 1 (“PCC1” or “Bucket 1”)
or Portfolio Content Category 2 (“PCC2” or “Bucket 2”). In general terms, PCC1 products are the most costly,
least objectionable and offer the most flexibility when complying with California’s RPS procurement
mandates. Unbundled renewable energy, or Portfolio Content Category 3 (“PCC3” or “Bucket 3”), has usage
limitations under the RPS program and is also the subject of ongoing philosophical debate regarding
environmental impacts. For purposes of this Study, PEA was advised to exclude unbundled renewable energy
products from SVCCE’s prospective supply portfolios. For purposes of this Study, it was assumed that all
additional GHG-free energy (i.e., GHG-free energy obtained from sources that are not RPS-eligible due to
size limitations) would be produced/delivered by hydroelectric generators. In consideration of these product
options, SVCCE’s three prospective supply scenarios were constructed with the resource preferences reflected
in Table 6.

Draft Silicon Valley Community Choice Energy Technical Study
Section 2: Study Methodology Page 21
Table 6: SVCCE’s Scenario-Specific Energy Resource Preferences
SVCCE
Supply
Scenario
Primary Objectives
of Supply Portfolio
Total Renewable
Energy Content16
as % of Total
Supply (Year 1;
Year 10)
Total PCC1-
Eligible17
Renewable Energy
Content as % of
Total Supply (Year
1; year 10)
Total PCC3-
Eligible18
Renewable Energy
Content as % of
Total Supply (Year
1; year 10)
Total GHG-Free
Energy Content19
as % of Total
Supply (Year 1;
Year 10)
Scenario 1
Achieve GHG
emissions parity
(with PG&E) on a
projected basis
while exceeding
PG&E’s expected
proportion of RPS-
eligible
procurement
YEAR 1 = 36%
YEAR 10 = 49%
YEAR 1 = 27%
YEAR 10 = 44%
YEAR 1 = None
YEAR 10 = None
YEAR 1 = 63%
YEAR 10 = 75%
Scenario 2
Increased RPS-
eligible renewable
energy
procurement plus
20% GHG
emissions reductions
(relative to
incumbent utility)
YEAR 1 = 51%
YEAR 10 = 66%
YEAR 1 = 38%
YEAR 10 = 57%
YEAR 1 = None
YEAR 10 = None
YEAR 1 = 70%
YEAR 10 = 80%
Scenario 3
Maximize GHG-
free power
procurement (RPS-
eligible renewable
energy plus
additional GHG-
free supply) while
maintaining
general rate/cost
parity
YEAR 1 = 76%
YEAR 10 = 76%
YEAR 1 = 57%
YEAR 10 = 64%
YEAR 1 = None
YEAR 10 = None
YEAR 1 = 85%
YEAR 10 = 97%
Scenario 1: GHG Emissions Parity and Additional Renewable Energy Supply Relative to PG&E
Scenario 1 was structured for the primary purpose of matching the projected GHG emissions profile
associated with PG&E’s supply portfolio while also exceeding PG&E’s proportionate level of renewable
energy procurement. With regard to renewable energy procurement, resource preferences within Scenario 1
were generally selected to promote compliance with the legal requirements of California’s RPS in advance of
16 All renewable energy volumes are assumed to be RPS-eligible for purposes of this Study. 17 Portfolio Content Category 1, or “Bucket 1” eligible renewable energy resources, are typically located within California but may also be located outside California, delivering power to California delivery points via specified energy scheduling protocols. 18 Portfolio Content Category 3, or “Bucket 3” eligible renewable energy resources, are typically referred to as “unbundled renewable energy certificates” or “unbundled RECs”. Bucket 3 products are produced when metered renewable energy is delivered to the grid and represent the environmental and/or “green attributes” associated with such renewable energy production. However, Bucket 3 products are sold separately from the physical energy commodity without any associated energy delivery obligations for the seller(s) of such products. 19 Total GHG-free content equals the proportion of total supply produced by renewable energy resources plus the proportion of total supply produced by non-GHG emitting generating resources, namely non-RPS qualifying hydroelectric generators.

Draft Silicon Valley Community Choice Energy Technical Study
Page 22 Section 2: Study Methodology
applicable deadlines.20 In particular, Scenario 1 incorporates a 36% RPS-eligible renewable energy supply
from day one of CCE program operations, incrementally increasing after the 2020 calendar year in
consideration of California’s transition to a 50% RPS mandate. For purposes of Scenario 1, PCC3 and
nuclear volumes were excluded from the renewable energy supply portfolio, replacing such volumes with
additional PCC1 and PCC2 products. This substitution has the effect of increasing total renewable energy
supply costs but will likely minimize philosophical objections related to the use of unbundled renewable
energy products, which have become more prominent in recent years. Additional clean energy purchases,
which would have the effect of reducing overall GHG emissions associated with SVCCE supply portfolio, were
also incorporated, yielding a 63% GHG-free resource mix in Year 1, increasing to 75% in Year 10. A
supply portfolio reflecting such a resource mix would be expected to promote highly competitive customer
rates during the study period but also the lowest level of environmental benefits amongst the three
prospective supply scenarios. The expected clean energy content associated with Scenario 1 is identified in
Table 7, which reflects the proportionate share of purchases relative to SVCCE’s expected energy
requirements.
Table 7: Scenario 1 - Proportionate Share of Planned Energy Purchases Relative to SVCCE’s Projected
Retail Sales
Yr 1 Yr 2 Yr 3 Yr 4 Yr 5 Yr 6 Yr 7 Yr 8 Yr 9 Yr 10
PCC 1 Supply 27% 27% 27% 35% 35% 36% 42% 43% 44% 44%
PCC 2 Supply 9% 9% 9% 2% 4% 6% 1% 2% 2% 4%
PCC 3 Supply 0% 0% 0% 0% 0% 0% 0% 0% 0% 0%
Total Renewable
Energy Supply 36% 36% 36% 38% 39% 41% 43% 45% 47% 49%
Additional GHG-
Free Energy Supply 27% 29% 31% 32% 31% 30% 29% 28% 27% 26%
Total Clean Energy
Supply 63% 65% 68% 69% 70% 71% 72% 73% 74% 75%
Conventional
Energy Supply
(including CAISO*
market purchases)
37% 35% 32% 31% 30% 29% 28% 27% 26% 25%
*“CAISO” refers to the California Independent System Operator, the organization responsible for overseeing operation of California’s wholesale
electric transmission system and related energy markets. Energy purchases from the CAISO market are not associated with specific generating
resources. As such, CAISO purchases are also commonly referred to as “Unspecified Sources of Power” or “Market Purchases” due to the fact
that these purchases are made from a pool of generating resources administered by the CAISO. Note that it is very common for CCEs to
incorporate considerable quantities of Market Purchases in their respective supply portfolios (20% to 40%, for example). As previously
indicated, PG&E’s power supply portfolio included 21% Market Purchases in 2014. Note that numbers may not add due to rounding.
As previously noted, each indicative supply scenario reflects a uniform portfolio of long-term renewable
energy supply contracts, which incorporates a variety of generating technologies and related energy delivery
profiles. In consideration of the expected delivery start dates and energy quantities associated with each
prospective contract, SVCCE’s portfolio composition will somewhat change over time, reflecting increased
resource diversity.
20 State law requires PG&E to increase its renewable energy content to 33% by 2020. Based on PG&E’s recent Power Source Disclosure Report, which addressed power purchases and sales completed by the utility during the 2014 calendar year, its current renewable energy content is approximately 27%. An equivalent renewable supply percentage should be reflected in PG&E’s 2014 Power Content Label, which was provided to customers of the utility in a recent bill insert.

Draft Silicon Valley Community Choice Energy Technical Study
Section 2: Study Methodology Page 23
Snapshots of the Scenario 1, Year 1 resource mix as well as the related Year 10 resource mix are shown in
the following figures.
Figure 1: Scenario 1 Resource Mix, Year 1
Figure 2: Scenario 1 Resource Mix, Year 10
Figure 3 shows how composition of the Scenario 1 supply portfolio changes throughout the study period,
reflecting planned diversification of SVCCE’s renewable energy supply portfolio through long-term
contracting efforts and local infrastructure build out.
Conventional Energy Contracts
26%
CAISO Purchases11%
Short Term Renewable Energy Contracts
36%
Other Carbon Free Energy Contracts
27%
Conventional Energy Contracts
18%
CAISO Purchases8%
Other Carbon Free Energy Contracts
26%
Short TermRenewable
Energy Contracts10%
Small Solar PPA1%
Small Biogas (LFG) PPA
2%
Wind PPA8%
Solar PPA14%
Geothermal PPA12%

Draft Silicon Valley Community Choice Energy Technical Study
Page 24 Section 2: Study Methodology
Figure 3: Scenario 1 Load and Resource Projections
Scenario 2: 20% Annual GHG Emissions Reductions; Increased Renewable Energy Procurement
Scenario 2 reflects more aggressive procurement of renewable energy resources, starting out at a 51% RPS-
eligible renewable energy content, increasing to 66% by Year 10 of program operations. This renewable
energy procurement strategy ensures that SVCCE will continually exceed California’s RPS mandate, even
following recent adoption of the 50% renewable energy procurement requirement. In addition to the noted
renewable energy volumes, Scenario 2 assumes that SVCCE will procure additional GHG-free energy supply
in sufficient quantities to achieve 20% annual reductions throughout the Study period (relative to projected
emission rates of the incumbent utility). As with Scenario 1, the Scenario 2 supply portfolio excludes the use of
PCC3 products and nuclear power. Table 8 details the annual resource composition for Scenario 2 during the
10-year planning period.
0
500
1,000
1,500
2,000
2,500
3,000
3,500
4,000
1 2 3 4 5 6 7 8 9 10
GW
H
Year
SILICON VALLEY CCELoads and Resources
Renewable, Long Term Renewable, Short Term Other Carbon Free Conventional Contracts CAISO Purchases Loads

Draft Silicon Valley Community Choice Energy Technical Study
Section 2: Study Methodology Page 25
Table 8: Scenario 2 - Proportionate Share of Planned Energy Purchases Relative to SVCCE’s Projected
Retail Sales
Yr 1 Yr 2 Yr 3 Yr 4 Yr 5 Yr 6 Yr 7 Yr 8 Yr 9 Yr 10
PCC 1 Supply 38% 38% 38% 45% 46% 47% 53% 54% 57% 57%
PCC 2 Supply 13% 13% 13% 6% 7% 9% 5% 6% 6% 9%
PCC 3 Supply 0% 0% 0% 0% 0% 0% 0% 0% 0% 0%
Total Renewable
Energy Supply 51% 51% 51% 51% 53% 56% 58% 61% 63% 66%
Additional GHG-
Free Energy
Supply
19% 21% 23% 25% 23% 21% 19% 18% 16% 14%
Total Clean Energy
Supply 70% 72% 74% 76% 76% 77% 78% 78% 79% 80%
Conventional
Energy Supply
(including CAISO
market purchases)
30% 28% 26% 24% 24% 23% 22% 22% 21% 20%
Figure 4: Scenario 2 Resource Mix, Year 1
Conventional Energy Contracts
21%
CAISO Purchases9%
Short Term Renewable Energy Contracts
51%
Other Carbon Free Energy Contracts
19%

Draft Silicon Valley Community Choice Energy Technical Study
Page 26 Section 2: Study Methodology
Figure 5: Scenario 2 Resource Mix, Year 10
Conventional Energy Contracts
15%
CAISO Purchases6%
Other Carbon Free Energy Contracts
14%
Short Term Renewable Energy Contracts
28%
Small Solar PPA1%
Small Biogas (LFG) PPA2%
Wind PPA8%
Solar PPA14% Geothermal PPA
12%
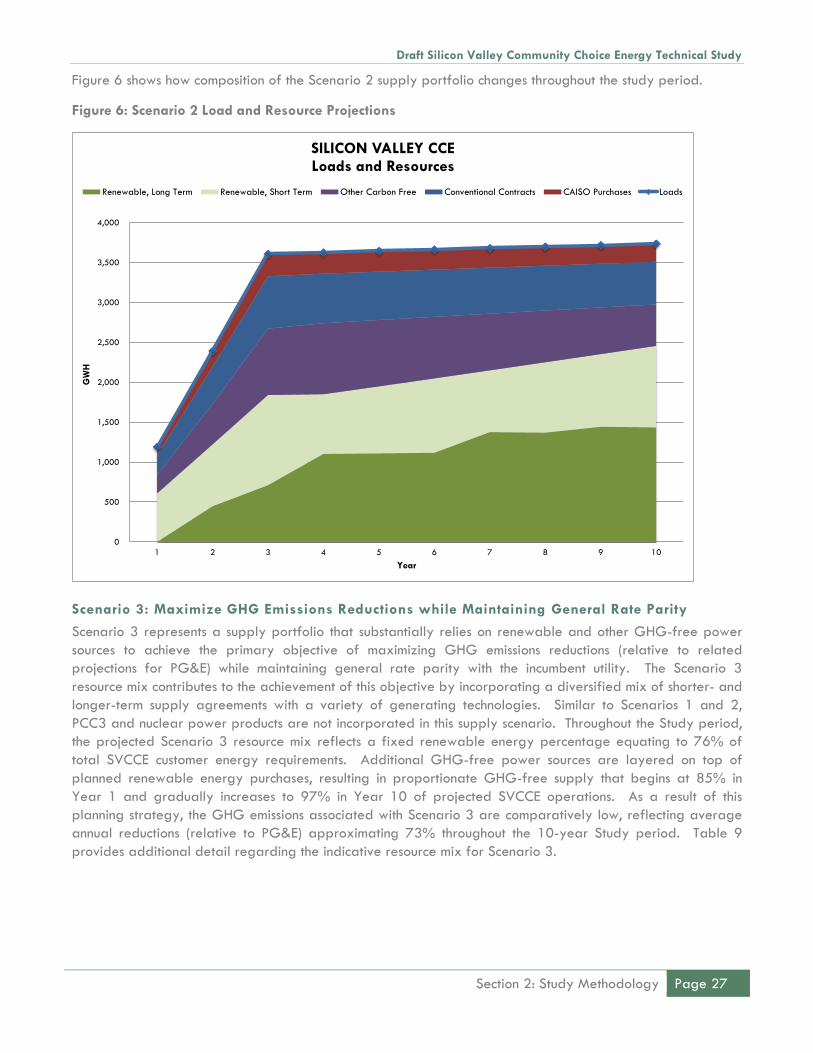
Draft Silicon Valley Community Choice Energy Technical Study
Section 2: Study Methodology Page 27
Figure 6 shows how composition of the Scenario 2 supply portfolio changes throughout the study period.
Figure 6: Scenario 2 Load and Resource Projections
Scenario 3: Maximize GHG Emissions Reductions while Maintaining General Rate Parity
Scenario 3 represents a supply portfolio that substantially relies on renewable and other GHG-free power
sources to achieve the primary objective of maximizing GHG emissions reductions (relative to related
projections for PG&E) while maintaining general rate parity with the incumbent utility. The Scenario 3
resource mix contributes to the achievement of this objective by incorporating a diversified mix of shorter- and
longer-term supply agreements with a variety of generating technologies. Similar to Scenarios 1 and 2,
PCC3 and nuclear power products are not incorporated in this supply scenario. Throughout the Study period,
the projected Scenario 3 resource mix reflects a fixed renewable energy percentage equating to 76% of
total SVCCE customer energy requirements. Additional GHG-free power sources are layered on top of
planned renewable energy purchases, resulting in proportionate GHG-free supply that begins at 85% in
Year 1 and gradually increases to 97% in Year 10 of projected SVCCE operations. As a result of this
planning strategy, the GHG emissions associated with Scenario 3 are comparatively low, reflecting average
annual reductions (relative to PG&E) approximating 73% throughout the 10-year Study period. Table 9
provides additional detail regarding the indicative resource mix for Scenario 3.
0
500
1,000
1,500
2,000
2,500
3,000
3,500
4,000
1 2 3 4 5 6 7 8 9 10
GW
H
Year
SILICON VALLEY CCELoads and Resources
Renewable, Long Term Renewable, Short Term Other Carbon Free Conventional Contracts CAISO Purchases Loads
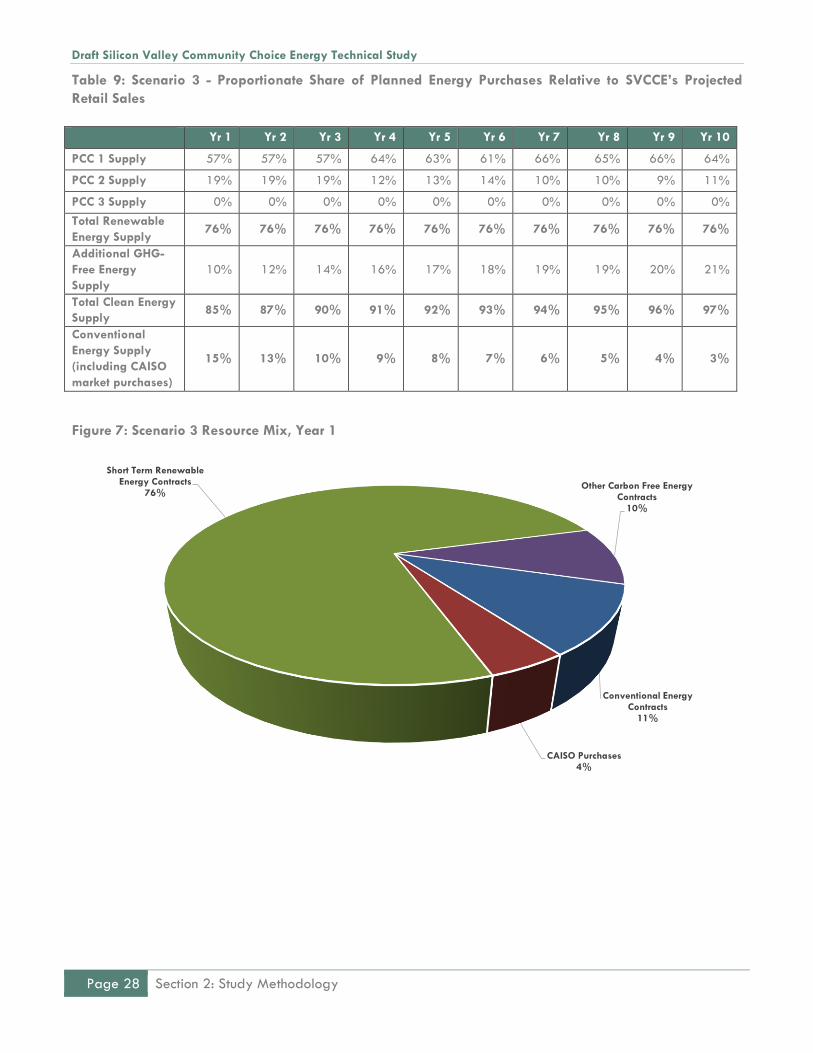
Draft Silicon Valley Community Choice Energy Technical Study
Page 28 Section 2: Study Methodology
Table 9: Scenario 3 - Proportionate Share of Planned Energy Purchases Relative to SVCCE’s Projected
Retail Sales
Yr 1 Yr 2 Yr 3 Yr 4 Yr 5 Yr 6 Yr 7 Yr 8 Yr 9 Yr 10
PCC 1 Supply 57% 57% 57% 64% 63% 61% 66% 65% 66% 64%
PCC 2 Supply 19% 19% 19% 12% 13% 14% 10% 10% 9% 11%
PCC 3 Supply 0% 0% 0% 0% 0% 0% 0% 0% 0% 0%
Total Renewable
Energy Supply 76% 76% 76% 76% 76% 76% 76% 76% 76% 76%
Additional GHG-
Free Energy
Supply
10% 12% 14% 16% 17% 18% 19% 19% 20% 21%
Total Clean Energy
Supply 85% 87% 90% 91% 92% 93% 94% 95% 96% 97%
Conventional
Energy Supply
(including CAISO
market purchases)
15% 13% 10% 9% 8% 7% 6% 5% 4% 3%
Figure 7: Scenario 3 Resource Mix, Year 1
Conventional Energy Contracts
11%
CAISO Purchases4%
Short Term Renewable Energy Contracts
76%Other Carbon Free Energy
Contracts10%

Draft Silicon Valley Community Choice Energy Technical Study
Section 2: Study Methodology Page 29
Figure 8: Scenario 3 Resource Mix, Year 10
Conventional Energy Contracts
3%
Other Carbon Free Energy Contracts
21%
Short Term Renewable Energy Contracts
38%
Small Solar PPA1%
Small Biogas (LFG) PPA2%
Wind PPA8%
Solar PPA14%
Geothermal PPA12%

Draft Silicon Valley Community Choice Energy Technical Study
Page 30 Section 2: Study Methodology
Figure 9 shows how composition of the Scenario 3 supply portfolio changes throughout the study period.
Figure 9: Scenario 3 Load and Resource Projections
Costs and Rates
For each supply scenario, detailed estimates were made for electric power supply costs and all other
program costs. Net ratepayer costs or benefits were calculated for each scenario as the difference between
the costs ratepayers would pay while taking service under the CCE program and the costs ratepayers would
pay under bundled service, as currently provided by PG&E. Competitive rates are a key metric for program
feasibility as SVCCE must offer competitive rates in order to retain customers that are automatically enrolled
in the program. Customer retention may also be affected by SVCCE offering customized rate choices such as
voluntary green pricing programs or market based rate options for large end users.21
Rate competiveness is particularly important during the first year, when opt out notices are being provided to
eligible customers and initial impressions are being formed in the community. Generally speaking, if the net
customer cost of SVCCE service is below what the customer would otherwise pay for PG&E bundled service,
the SVCCE program could be considered to offer competitive rates and would be viable with regard to this
important metric. Rates that provide for a modest cost increase may also be considered competitive, if the
“quality” of the retail electricity product offered by SVCCE was meaningfully higher than existing option(s)
21 Such customized rate options would require SVCCE design and administration, working collaboratively with customers and interested stakeholders. Green pricing participation may also improve SVCCE’s environmental benefits and overall renewable energy content.
0
500
1,000
1,500
2,000
2,500
3,000
3,500
4,000
1 2 3 4 5 6 7 8 9 10
GW
H
Year
SILICON VALLEY CCELoads and Resources
Renewable, Long Term Renewable, Short Term Other Carbon Free Conventional Contracts CAISO Purchases Loads
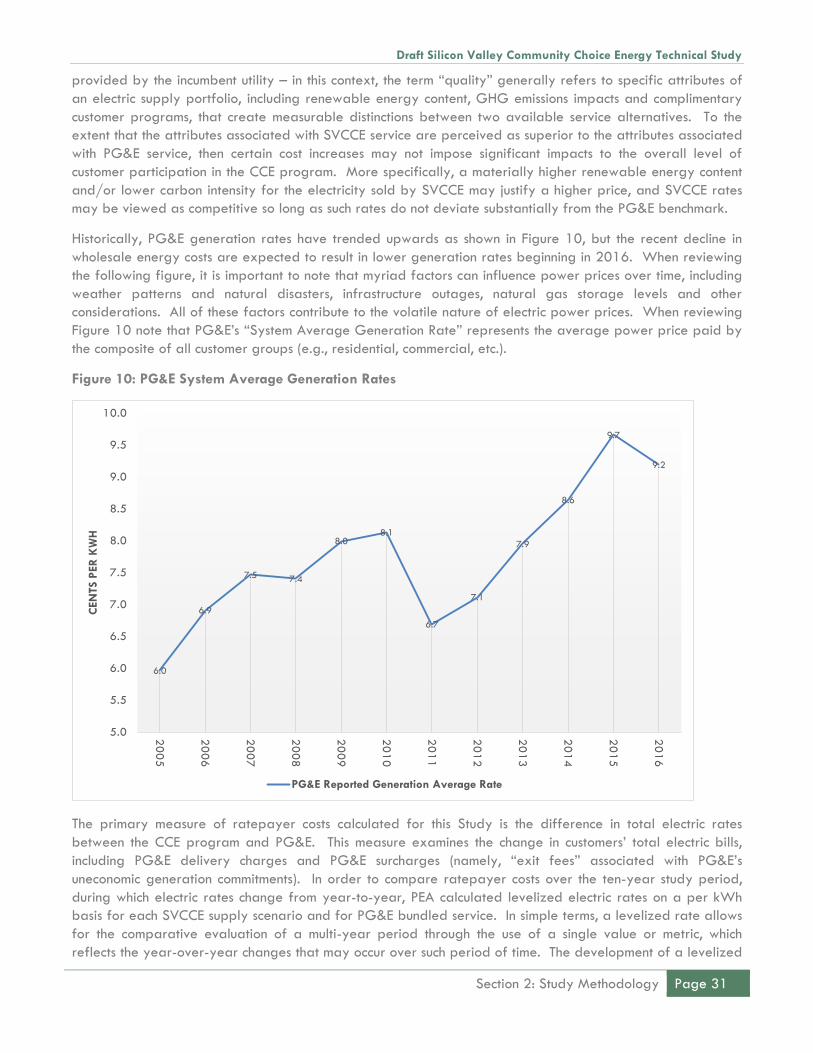
Draft Silicon Valley Community Choice Energy Technical Study
Section 2: Study Methodology Page 31
provided by the incumbent utility – in this context, the term “quality” generally refers to specific attributes of
an electric supply portfolio, including renewable energy content, GHG emissions impacts and complimentary
customer programs, that create measurable distinctions between two available service alternatives. To the
extent that the attributes associated with SVCCE service are perceived as superior to the attributes associated
with PG&E service, then certain cost increases may not impose significant impacts to the overall level of
customer participation in the CCE program. More specifically, a materially higher renewable energy content
and/or lower carbon intensity for the electricity sold by SVCCE may justify a higher price, and SVCCE rates
may be viewed as competitive so long as such rates do not deviate substantially from the PG&E benchmark.
Historically, PG&E generation rates have trended upwards as shown in Figure 10, but the recent decline in
wholesale energy costs are expected to result in lower generation rates beginning in 2016. When reviewing
the following figure, it is important to note that myriad factors can influence power prices over time, including
weather patterns and natural disasters, infrastructure outages, natural gas storage levels and other
considerations. All of these factors contribute to the volatile nature of electric power prices. When reviewing
Figure 10 note that PG&E’s “System Average Generation Rate” represents the average power price paid by
the composite of all customer groups (e.g., residential, commercial, etc.).
Figure 10: PG&E System Average Generation Rates
The primary measure of ratepayer costs calculated for this Study is the difference in total electric rates
between the CCE program and PG&E. This measure examines the change in customers’ total electric bills,
including PG&E delivery charges and PG&E surcharges (namely, “exit fees” associated with PG&E’s
uneconomic generation commitments). In order to compare ratepayer costs over the ten-year study period,
during which electric rates change from year-to-year, PEA calculated levelized electric rates on a per kWh
basis for each SVCCE supply scenario and for PG&E bundled service. In simple terms, a levelized rate allows
for the comparative evaluation of a multi-year period through the use of a single value or metric, which
reflects the year-over-year changes that may occur over such period of time. The development of a levelized
6.0
6.9
7.5 7.4
8.08.1
6.7
7.1
7.9
8.6
9.7
9.2
5.0
5.5
6.0
6.5
7.0
7.5
8.0
8.5
9.0
9.5
10.0
20
05
20
06
20
07
20
08
20
09
20
10
20
11
20
12
20
13
20
14
20
15
20
16
CEN
TS P
ER
KW
H
PG&E Reported Generation Average Rate

Draft Silicon Valley Community Choice Energy Technical Study
Page 32 Section 2: Study Methodology
electric rate utilizes net present value analysis to consolidate rate-related impacts, which occur over time, in a
single number. For purposes of this Study, a levelized rate represents the constant electric rate that would
yield equivalent revenues (in present value terms) if charged to customers in place of the projected series of
annual rates occurring throughout the ten-year study period. Levelized costs are commonly used in the electric
utility industry to provide an apples-to-apples comparative basis for projects that have cash flows occurring
at different points in time. Comparing levelized total electric rates for the CCE program against levelized
total electric rates for PG&E service provides a simple measure of ratepayer impacts over the entire ten-year
study period. Annual impacts are also provided for each scenario and provide a more detailed picture of
ratepayer impacts from year to year of program operations.
Greenhouse Gas Emissions
Each supply scenario was evaluated based on the emissions of greenhouse gases associated with electricity
production as compared to similar projections prepared by PG&E (for its own supply portfolio). Based on
PEA’s review of PG&E’s projected annual GHG emissions factors, which have been prepared through
calendar year 2020, consideration appears to have been given to the impacts of California’s increasing RPS
procurement mandates. PG&E’s projected emissions factor steadily declines through the 2020 calendar year
as additional renewable energy purchases and other prospective clean-energy purchases increase with time.
PG&E’s GHG emissions factor projections for the five-year period beginning in 2016 through 2020 are
identified in the Table 1022:
Table 10: PG&E GHG Emission Factor Projections (2016 through 2020)
Year Emission Factor (lbs
CO2/MWh)
Emission Factor (Metric
Tons CO2/MWh)
2016 370 0.168
2017 349 0.158
2018 328 0.149
2019 307 0.139
2020 290 0.131
For the balance of the ten-year study period, PEA assumed incremental emission reductions for the PG&E
supply portfolio in consideration of increases to California’s RPS procurement mandate and other factors, such
as the launch of other California-based CCE programs, which may have the effect of reducing PG&E’s GHG
emissions factor (via reductions in short-term conventional energy purchases due to declining retail sales).23
PEA’s assumed annual GHG emissions factors for the PG&E supply portfolio, over the balance of the ten-year
study period, are reflected in Table 11:
22 PG&E, Greenhouse Gas Emission Factors: Guidance for PG&E Customers, April 2013. 23 In practical terms, it is not likely that PG&E would materially adjust renewable energy purchases or reduce carbon-free generation (from its hydroelectric and/or nuclear generators) as a result of customer departure following SVCCE formation. These carbon-free resources would generally remain in the PG&E supply portfolio without near-term adjustments for departing load. Instead, it is more likely that PG&E would reduce the amount of conventional market purchases with comparatively high emissions intensities, which would have the effect of marginally reducing its portfolio emissions factor following customer departures as the relative proportion of clean energy sources in the PG&E supply portfolio would incrementally increase.

Draft Silicon Valley Community Choice Energy Technical Study
Section 2: Study Methodology Page 33
Table 11: PEA’s Projected GHG Emission Factors for the PG&E Supply Portfolio (2021 through 2025)
Year Emission Factor (lbs
CO2/MWh)
Emission Factor (Metric
Tons CO2/MWh)
2021 280 0.127
2022 272 0.123
2023 264 0.120
2024 256 0.116
2025 248 0.112
The PG&E emissions profile was selected as the benchmark for comparison to promote a conservative
assessment of direct emissions impacts related to CCE operations (on a head-to-head basis with PG&E’s
anticipated supply portfolio). The GHG impacts associated with SVCCE’s supply portfolio will likely be
evaluated (by members of the public and, potentially, through new emissions reporting requirements that may
be incorporated in annual Power Content Label, or “PCL”, reporting) relative to the PG&E benchmark, which
suggests that the aforementioned comparative methodology is appropriate.
For each supply scenario, the difference in GHG emissions produced by the scenario’s assumed resource mix
and the otherwise applicable PG&E supply portfolio were quantified during each year as well as the entirety
of the ten-year study period. The GHG impacts were quantified in terms of total tons of CO2 emissions.
Economic Development Impacts
A key potential benefit of a CCE program is its ability to promote economic development through investment
in and contracts with locally constructed renewable generating infrastructure. Such projects have the potential
to stimulate a significant level of new economic activity within California by creating new jobs and spending
activities during generator construction, ongoing operation and maintenance. Economic development impacts
may also be significant factors when comparing expected operating costs, including generation costs, of the
CCE program to electric generation costs under PG&E service, particularly when initial “head-to-head” cost
comparisons are comparable. When performing such comparisons, it is important to acknowledge the
difficulty in accurately quantifying actual economic benefits related to local project investment, particularly
induced economic impacts resulting from the effects of economic multipliers.
In qualitative terms, it is reasonable to assume that new development projects would stimulate new economic
activity. However, as with any capital project, quantifying the specific location in which such economic benefits
may occur, including job creation, is challenging due to numerous uncertainties affecting the proportion of
expenditures and employment that would occur within discretely defined geographic boundaries. Certain
tools, which rely on the application of industry-specific economic multipliers, have been developed to assist in
completing these projections, but decision makers should be aware of the broad range of outcomes that may
actually apply when interpreting analytical results.
To quantify the economic impacts associated with new renewable generation projects that were incorporated
in the indicative long-term renewable energy supply portfolio that was applied in each of the three energy
supply scenarios, PEA utilized the National Renewable Energy Laboratory’s (“NREL”) Jobs & Economic
Development Impact (“JEDI”) models. NREL is the principal research laboratory for the United States
Department of Energy (“DOE”) Office of Energy Efficiency and Renewable Energy and also provides
research expertise for the Office of Science, and the Office of Electricity Delivery and Energy Reliability.
NREL is operated for DOE by the Alliance for Sustainable Energy, LLC.24
24 National Renewable Energy Laboratory website, http://www.nrel.gov/about/, September 2, 2015.

Draft Silicon Valley Community Choice Energy Technical Study
Page 34 Section 2: Study Methodology
NREL JEDI models are publicly available, spreadsheet-based tools that were specifically designed to
“estimate the economic impacts of constructing and operating power plants, fuel production facilities, and
other projects at the local (usually state) level. JEDI results are intended to be estimates, not precise
predictions. Based on user-entered project-specific data or default inputs (derived from industry norms), JEDI
estimates the number of jobs and economic impacts to a local area that can reasonably be supported by a
power plant, fuel production facility, or other project.”25 Unique JEDI models have been developed for a
variety of resource types, including wind, solar, geothermal, biogas and various other generating
technologies. Each version of the model may be downloaded free of charge from NREL’s website:
http://www.nrel.gov/analysis/jedi/download.html.
According to NREL, the JEDI models are peer reviewed and are intended to project gross job estimates. NREL
also notes that it “performed extensive interviews with power generation project developers, state tax
representatives, and others in the appropriate industries to determine appropriate default values contained
within the models.” In PEA’s opinion, NREL’s JEDI models are the appropriate tools to forecast “order of
magnitude” local economic development impacts associated with a CCE program serving communities of the
CCE Study Partners.
Based on the aforementioned indicative long-term renewable energy contract portfolio that was assumed to
exist under each of the three supply scenarios, PEA downloaded, populated and ran the appropriate JEDI
models to derive estimates of the anticipated jobs and economic development impacts that could be created
in relation to the indicative long-term contract portfolio. PEA utilized each set of economic development
projections to assemble an aggregate economic impact analysis for the complete long-term contract portfolio.
However, all economic development estimates within this report are presented with the understanding that
subtle changes in certain expenditures (and jobs) may result in significant changes to actual economic
development impacts.
Key output from the JEDI models is presented within three specific categories: jobs, earnings and economic
output. Within each of these broadly defined categories, JEDI models approximate the impacts of economic
multipliers by quantifying the “ripple effect” that occurs as a result of new local economic activity. JEDI models
initially estimate direct economic impacts at the project site and apply economic multipliers, derived from the
U.S. Bureau of Economic Analysis, the U.S. Census Bureau and other sources, to approximate impacts within the
supply chain (manufacturing job creation, as an example) as well as induced economic impacts (spending that
occurs as a result of activity within the first two categories) related to the project. JEDI models also address
job creation and economic impacts on a temporal basis, quantifying related impacts during two specific
phases of the project lifecycle: 1) construction; and 2) ongoing operation and maintenance.
Forecasted economic impacts associated with the indicative long-term contract portfolio are presented in
aggregate form, inclusive of all anticipated development/contract opportunities, by summing the project-
specific impacts calculated by the JEDI models. This approach facilitates a high-level understanding of the
prospective economic impacts that could be created through such contracts but does not address temporal
nuance related to the timing and creation of economic benefits associated with specific projects. For example,
the unique economic impacts of projects that will begin operation/delivery during the period extending from
2018 through 2025 have been aggregated and presented within a single scenario-specific summary table.
When reviewing economic development projections within this Study, it is important to distinguish between
economic impacts related to the construction period and the ongoing operation and maintenance period. All
job creation estimates are presented as full time equivalent positions (“FTEs”). Projections related to the
25 National Renewable Energy Laboratory website: http://www.nrel.gov/analysis/jedi/about_jedi.html, September 2, 2015.
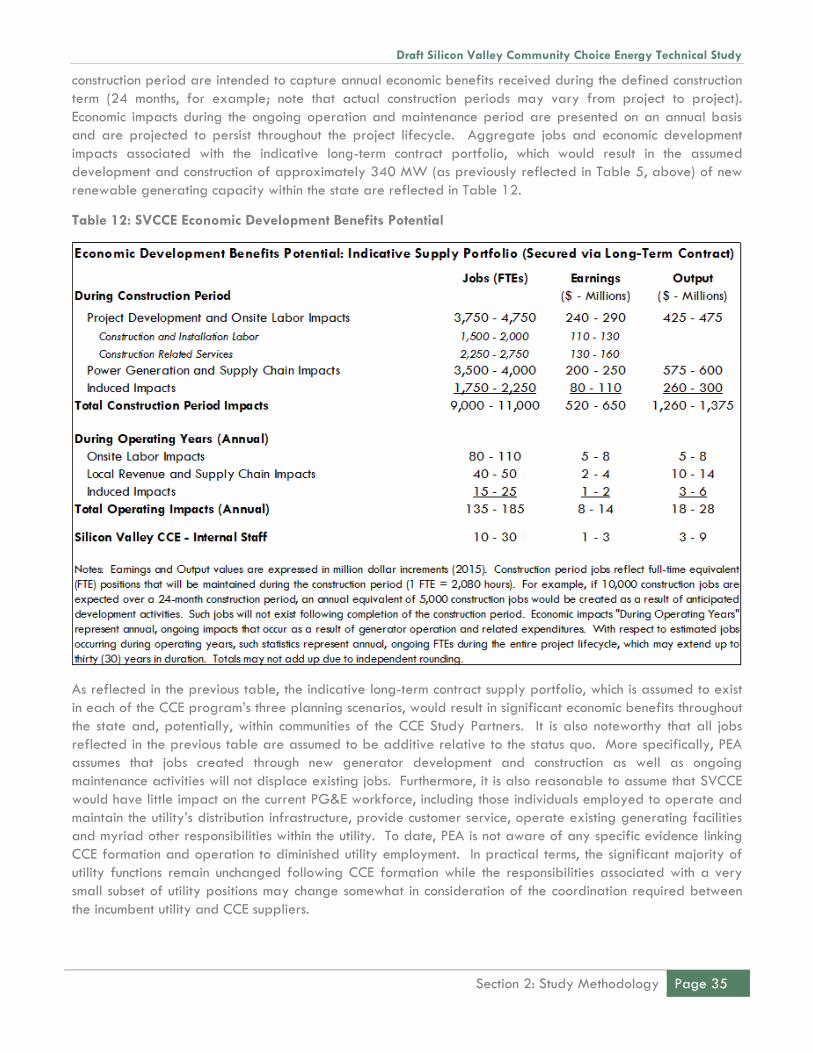
Draft Silicon Valley Community Choice Energy Technical Study
Section 2: Study Methodology Page 35
construction period are intended to capture annual economic benefits received during the defined construction
term (24 months, for example; note that actual construction periods may vary from project to project).
Economic impacts during the ongoing operation and maintenance period are presented on an annual basis
and are projected to persist throughout the project lifecycle. Aggregate jobs and economic development
impacts associated with the indicative long-term contract portfolio, which would result in the assumed
development and construction of approximately 340 MW (as previously reflected in Table 5, above) of new
renewable generating capacity within the state are reflected in Table 12.
Table 12: SVCCE Economic Development Benefits Potential
As reflected in the previous table, the indicative long-term contract supply portfolio, which is assumed to exist
in each of the CCE program’s three planning scenarios, would result in significant economic benefits throughout
the state and, potentially, within communities of the CCE Study Partners. It is also noteworthy that all jobs
reflected in the previous table are assumed to be additive relative to the status quo. More specifically, PEA
assumes that jobs created through new generator development and construction as well as ongoing
maintenance activities will not displace existing jobs. Furthermore, it is also reasonable to assume that SVCCE
would have little impact on the current PG&E workforce, including those individuals employed to operate and
maintain the utility’s distribution infrastructure, provide customer service, operate existing generating facilities
and myriad other responsibilities within the utility. To date, PEA is not aware of any specific evidence linking
CCE formation and operation to diminished utility employment. In practical terms, the significant majority of
utility functions remain unchanged following CCE formation while the responsibilities associated with a very
small subset of utility positions may change somewhat in consideration of the coordination required between
the incumbent utility and CCE suppliers.

Draft Silicon Valley Community Choice Energy Technical Study
Page 36 Section 2: Study Methodology
With respect to the prospective generating facilities that have been incorporated in SVCCE’s indicative long-
term contract portfolio, PEA assumed that the significant majority of such facilities would be developed in
optimal renewable resource areas throughout California. PEA also assumed the development of 20 MW of
locally situated renewable generating projects, which would be developed during the study period under
long-term contract arrangements between SVCCE and third-party project developers (under an assumed
SVCCE-administered FIT program) – such projects are discussed below. With regard to anticipated
development projects occurring in areas outside of jurisdictions comprising the CCE Study Partners, PEA
assumed that virtually all plant equipment, including turbines and other materials, would be procured outside
of the CCE Study Partners’ communities. This equipment typically represents the largest single line item
expenditure in generator construction. Requisite labor, including general site preparation and ancillary
facility construction activities (concrete footings and structures not directly involved in the generation process)
would also draw from California’s broader regional workforce. When considering the following economic
development benefits potential, note that virtually all impacts – other than those associated with the Local
Economic Development Benefits Potential, discussed in the similarly named subsection (below) – are assumed to
accrue in areas outside of Santa Clara County. With this in mind, only a relatively small portion of the total
potential economic development benefits are assumed to accrue within Santa Clara County.
In total, SVCCE’s indicative long-term contract portfolio is projected to result in the creation of approximately
9,000-11,000 new jobs during the aggregate construction period required to complete the assumed 340
MW of new generating projects. During the construction period, individuals working directly on the projects,
including electricians, engineers, construction workers and heavy equipment operators, attorneys and
permitting specialists, would be responsible for as much as $475 million in new economic output of which as
much as $290 million would be collected in the form of salaries and wages. Workers involved with supply
chain activities, such as turbine manufacturing and assembly, cement producers and heavy equipment rental
companies would be responsible for up to $600 million in new economic activity of which approximately
$250 million would be collected in the form of salaries and wages. Furthermore, spending by the
aforementioned individuals (as a result of salary and wage collection) would “induce” other local economic
impacts at local businesses, including restaurants, grocery stores, gas stations and other providers of goods
and services, totaling as much as $300 million of which approximately $110 million would be collected as
salaries and wages. In total, the locally developed generation projects identified under SVCCE’s indicative
long-term contract portfolio would result in approximately $1.26 to $1.38 billion in new economic output
throughout the state and local economy during the construction process.
During ongoing operation of the renewable generators, it is projected that as many as 185 new jobs would
be created with a total annual economic impact ranging from $18 to $28 million. It is anticipated that these
jobs would remain effective as long as the generating facilities remain operational, resulting in significant,
lasting impacts to the local economies of the CCE Study Partners.
Local Economic Development Benefits Potential
The primary source of local jobs and economic development impacts would be derived through projects
developed under SVCCE’s anticipated FIT program, which would promote the construction of locally situated,
smaller-scale (i.e., up to 1 MW of total generating capacity, per project) renewable generating projects over
a period of five to seven years (and beyond, should SVCCE choose to expand this program after initial
participatory limitations are achieved). Note that the 1 MW capacity limitation has been referenced in
consideration of the FIT programs currently administered by MCE and SCP. To the extent that SVCCE’s
governing board determines to specify different project limitations for its FIT program, this would be
permissible. However, SVCCE should be aware that projects in excess of 1 MW may result in additional
administrative complexities due to generator registration and scheduling requirements (with the CAISO)
imposed on projects in excess of the 1 MW capacity threshold. For purposes of this Study and in

Draft Silicon Valley Community Choice Energy Technical Study
Section 2: Study Methodology Page 37
consideration of a similar FIT program offered by MCE, PEA assumed that SVCCE would eventually (by year
five of program operation) support the development of approximately 20 MW of locally situated renewable
generating capacity, which will likely utilize the photovoltaic solar generating technology. PEA acknowledges
that a fairly aggressive FIT buildout schedule has been incorporated in the Study. However, growing
familiarity with the CCE business model and an increasing appreciation amongst project developers for the
financial viability of operating CCEs, as well as decreasing prices to be paid under PG&E’s FIT (or “ReMAT”)
program, have catalyzed recent interest in CCE-administered FIT programs. In fact, interest in MCE’s FIT has
jumped over the past year with more than 6 MW of locally situated renewable generating capacity (out of
MCE’s total FIT participatory cap of 10 MW) actively operating or under development (with related FIT
contracts in place between the developers of such projects and MCE). Ultimately, many factors may affect
SVCCE’s FIT buildout schedule, including the availability of project financing to interested project developers,
actual project interconnection timelines (for most projects, interconnection will be pursued under a PG&E-
administered process, which is subject to delays), price competitiveness and other factors. To the extent that
SVCCE’s FIT buildout schedule is delayed, noted economic development benefits will be deferred until such
projects can be completed.
Based on applicable JEDI modeling results, the prospective SVCCE FIT program would result in the creation of
more than 370 local jobs during generator construction with as many as 500 additional jobs created through
supply chain and induced (during the construction period) economic activity over a period ranging from five to
seven years, depending on the actual period of time required to complete construction activities. As
previously noted, these construction jobs are temporary, but there is also a nominal level of ongoing support
for jobs supporting requisite operation and maintenance activity, which is projected to be approximately six
full-time equivalent employees during each year of facility operation (which may continue for 25-30 years).
Project development would also generate nearly $23 million in earnings for those working on the FIT projects,
which is expected to create a total economic stimulus approximating nearly $40 million (in consideration of
economic multiplier effects created by the spending of earnings/wages). Supply chain and induced impacts
would also be significant totaling approximately $26 million and $71 million, respectively.
It is also anticipated that SVCCE would employ 10 to 30 internal staff, depending on decisions related to
outsourcing/insourcing of requisite activities, during program implementation and ongoing operation. These
estimates were derived by PEA in consideration of direct experience working with California’s operating CCE
programs. Depending on staffing levels, aggregate direct salaries for such staff are estimated to range from
$1 to $3 million per year with a total of $3 to $9 million in total annual local economic activity generated by
SVCCE staff.
These local economic development impacts are subsumed in the aggregate economic development impact
totals reflected in the previous table. It is also noteworthy that PEA attempted to contact NREL regarding
certain wage-related assumptions that are included in the various JEDI models, specifically whether or not
prevailing wages are reflected in such assumptions. In spite of PEA’s efforts, NREL has been non-responsive.
To the extent that prevailing wage requirements are imposed in any project-specific power purchase
agreement, it is reasonable to assume that earnings and related economic development impacts may
somewhat increase to the extent that NREL’s wage assumptions are lower than applicable prevailing wages.
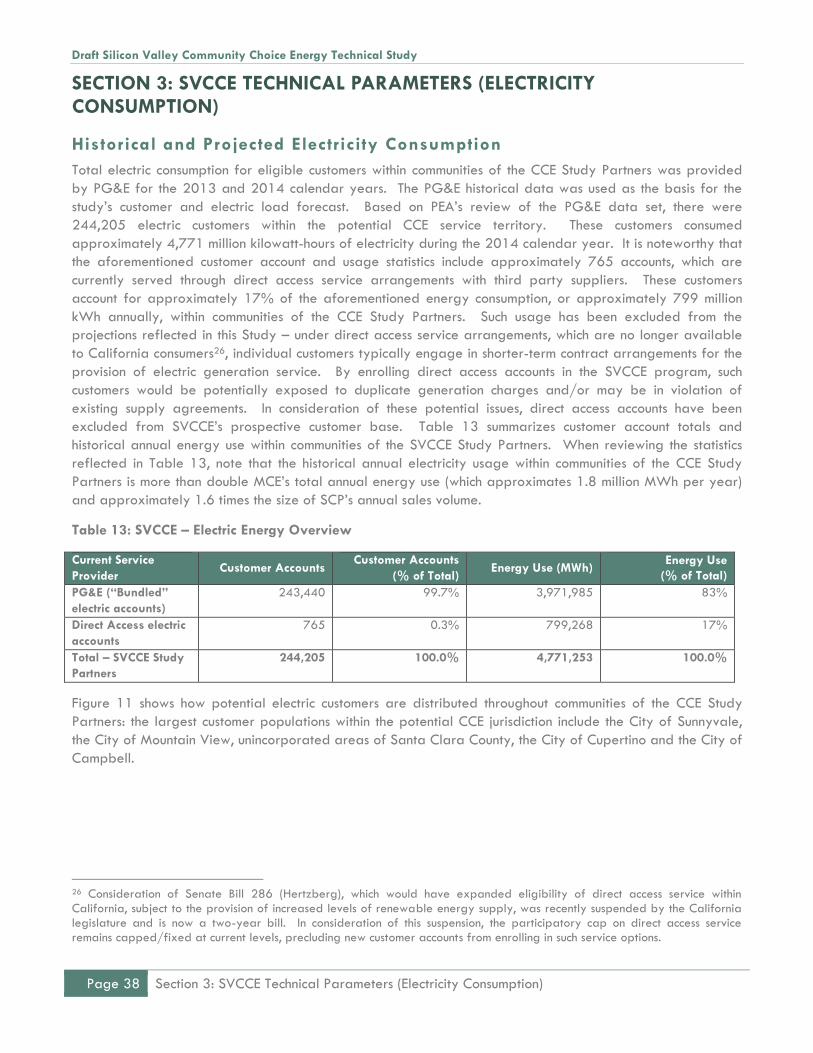
Draft Silicon Valley Community Choice Energy Technical Study
Page 38 Section 3: SVCCE Technical Parameters (Electricity Consumption)
SECTION 3: SVCCE TECHNICAL PARAMETERS (ELECTRICITY CONSUMPTION)
Historical and Projected Electricity Consumption
Total electric consumption for eligible customers within communities of the CCE Study Partners was provided
by PG&E for the 2013 and 2014 calendar years. The PG&E historical data was used as the basis for the
study’s customer and electric load forecast. Based on PEA’s review of the PG&E data set, there were
244,205 electric customers within the potential CCE service territory. These customers consumed
approximately 4,771 million kilowatt-hours of electricity during the 2014 calendar year. It is noteworthy that
the aforementioned customer account and usage statistics include approximately 765 accounts, which are
currently served through direct access service arrangements with third party suppliers. These customers
account for approximately 17% of the aforementioned energy consumption, or approximately 799 million
kWh annually, within communities of the CCE Study Partners. Such usage has been excluded from the
projections reflected in this Study – under direct access service arrangements, which are no longer available
to California consumers26, individual customers typically engage in shorter-term contract arrangements for the
provision of electric generation service. By enrolling direct access accounts in the SVCCE program, such
customers would be potentially exposed to duplicate generation charges and/or may be in violation of
existing supply agreements. In consideration of these potential issues, direct access accounts have been
excluded from SVCCE’s prospective customer base. Table 13 summarizes customer account totals and
historical annual energy use within communities of the SVCCE Study Partners. When reviewing the statistics
reflected in Table 13, note that the historical annual electricity usage within communities of the CCE Study
Partners is more than double MCE’s total annual energy use (which approximates 1.8 million MWh per year)
and approximately 1.6 times the size of SCP’s annual sales volume.
Table 13: SVCCE – Electric Energy Overview
Current Service
Provider Customer Accounts
Customer Accounts
(% of Total) Energy Use (MWh)
Energy Use (% of Total)
PG&E (“Bundled”
electric accounts)
243,440 99.7% 3,971,985 83%
Direct Access electric
accounts
765 0.3% 799,268 17%
Total – SVCCE Study
Partners
244,205 100.0% 4,771,253 100.0%
Figure 11 shows how potential electric customers are distributed throughout communities of the CCE Study
Partners: the largest customer populations within the potential CCE jurisdiction include the City of Sunnyvale,
the City of Mountain View, unincorporated areas of Santa Clara County, the City of Cupertino and the City of
Campbell.
26 Consideration of Senate Bill 286 (Hertzberg), which would have expanded eligibility of direct access service within California, subject to the provision of increased levels of renewable energy supply, was recently suspended by the California legislature and is now a two-year bill. In consideration of this suspension, the participatory cap on direct access service remains capped/fixed at current levels, precluding new customer accounts from enrolling in such service options.

Draft Silicon Valley Community Choice Energy Technical Study
Section 3: SVCCE Technical Parameters (Electricity Consumption) Page 39
Figure 11: Geographic Distribution of Customers
Figure 12 shows the distribution of electric consumption by municipality. The geographic distribution of
energy consumption is somewhat different when compared to the service account data in Figure 11 above,
indicating disproportionately higher use in certain communities (as a result of differentiated account
composition, particularly higher concentrations of larger commercial and/or industrial account types, within
such jurisdictions).
Figure 12: Geographic Distribution of Electric Consumption
In deriving the load projections used for the Study, adjustments to the base forecast were made to remove
customers identified as taking service under direct access27 as it was assumed that direct access customers
would remain with their current electric service provider. Further adjustments were made to estimate customer
27 Direct access allows customers to choose to receive generation service from competitive electricity providers. Currently, direct access service is not available to new customers within California. Proposed legislation may lead to the reopening of this service option at some point in the future.
0% 5% 10% 15% 20% 25% 30%
Sunnyvale
Mountain View
Unincorporated Santa Clara
Cupertino
Campbell
Gilroy
Morgan Hill
Los Gatos
Los Altos
Saratoga
Los Altos Hills
Monte Sereno
0% 5% 10% 15% 20% 25% 30% 35% 40%
Sunnyvale
Mountain View
Unincorporated Santa Clara
Gilroy
Cupertino
Morgan Hill
Campbell
Los Gatos
Los Altos
Saratoga
Los Altos Hills
Monte Sereno
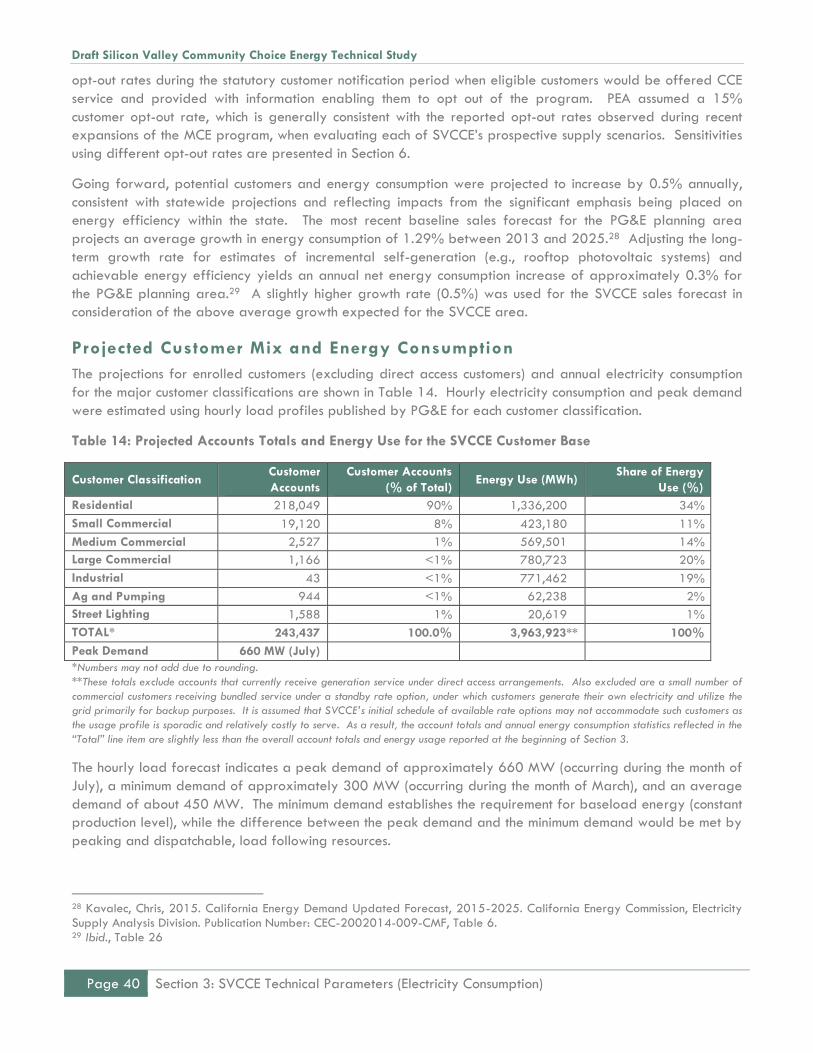
Draft Silicon Valley Community Choice Energy Technical Study
Page 40 Section 3: SVCCE Technical Parameters (Electricity Consumption)
opt-out rates during the statutory customer notification period when eligible customers would be offered CCE
service and provided with information enabling them to opt out of the program. PEA assumed a 15%
customer opt-out rate, which is generally consistent with the reported opt-out rates observed during recent
expansions of the MCE program, when evaluating each of SVCCE’s prospective supply scenarios. Sensitivities
using different opt-out rates are presented in Section 6.
Going forward, potential customers and energy consumption were projected to increase by 0.5% annually,
consistent with statewide projections and reflecting impacts from the significant emphasis being placed on
energy efficiency within the state. The most recent baseline sales forecast for the PG&E planning area
projects an average growth in energy consumption of 1.29% between 2013 and 2025.28 Adjusting the long-
term growth rate for estimates of incremental self-generation (e.g., rooftop photovoltaic systems) and
achievable energy efficiency yields an annual net energy consumption increase of approximately 0.3% for
the PG&E planning area.29 A slightly higher growth rate (0.5%) was used for the SVCCE sales forecast in
consideration of the above average growth expected for the SVCCE area.
Projected Customer Mix and Energy Consumption
The projections for enrolled customers (excluding direct access customers) and annual electricity consumption
for the major customer classifications are shown in Table 14. Hourly electricity consumption and peak demand
were estimated using hourly load profiles published by PG&E for each customer classification.
Table 14: Projected Accounts Totals and Energy Use for the SVCCE Customer Base
Customer Classification Customer
Accounts
Customer Accounts
(% of Total) Energy Use (MWh)
Share of Energy
Use (%)
Residential 218,049 90% 1,336,200 34%
Small Commercial 19,120 8% 423,180 11%
Medium Commercial 2,527 1% 569,501 14%
Large Commercial 1,166 <1% 780,723 20%
Industrial 43 <1% 771,462 19%
Ag and Pumping 944 <1% 62,238 2%
Street Lighting 1,588 1% 20,619 1%
TOTAL* 243,437 100.0% 3,963,923** 100%
Peak Demand 660 MW (July)
*Numbers may not add due to rounding.
**These totals exclude accounts that currently receive generation service under direct access arrangements. Also excluded are a small number of
commercial customers receiving bundled service under a standby rate option, under which customers generate their own electricity and utilize the
grid primarily for backup purposes. It is assumed that SVCCE’s initial schedule of available rate options may not accommodate such customers as
the usage profile is sporadic and relatively costly to serve. As a result, the account totals and annual energy consumption statistics reflected in the
“Total” line item are slightly less than the overall account totals and energy usage reported at the beginning of Section 3.
The hourly load forecast indicates a peak demand of approximately 660 MW (occurring during the month of
July), a minimum demand of approximately 300 MW (occurring during the month of March), and an average
demand of about 450 MW. The minimum demand establishes the requirement for baseload energy (constant
production level), while the difference between the peak demand and the minimum demand would be met by
peaking and dispatchable, load following resources.
28 Kavalec, Chris, 2015. California Energy Demand Updated Forecast, 2015-2025. California Energy Commission, Electricity Supply Analysis Division. Publication Number: CEC-2002014-009-CMF, Table 6. 29 Ibid., Table 26
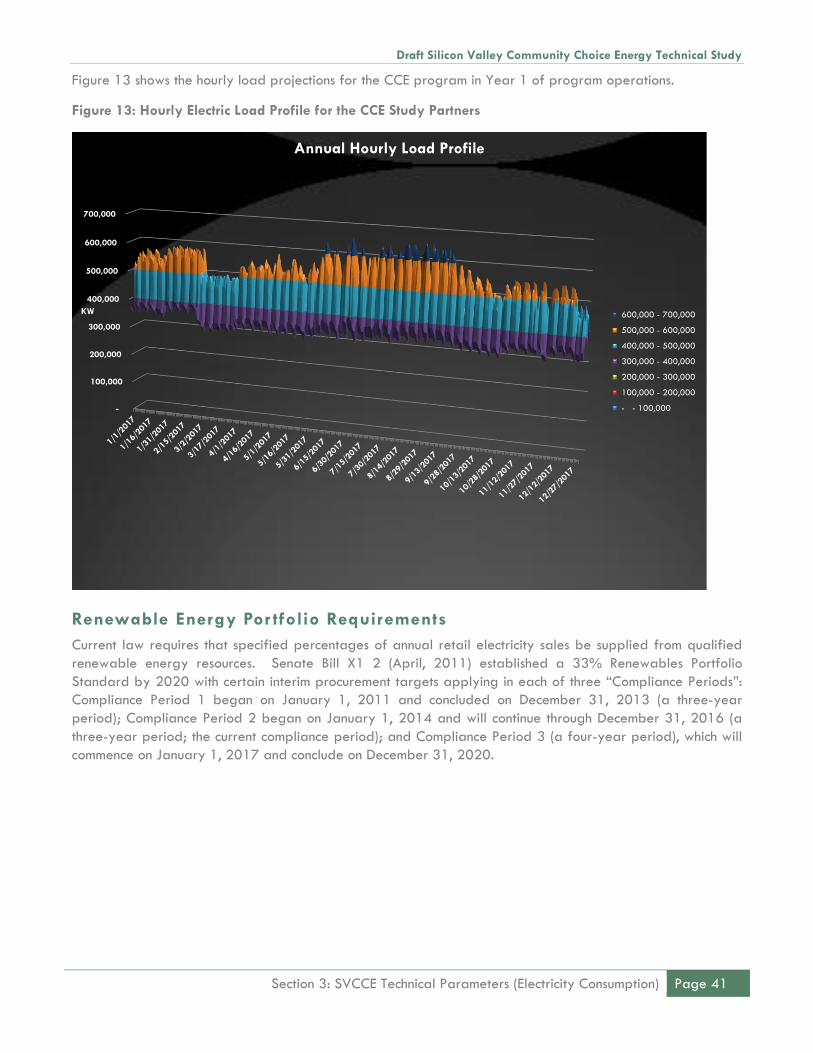
Draft Silicon Valley Community Choice Energy Technical Study
Section 3: SVCCE Technical Parameters (Electricity Consumption) Page 41
Figure 13 shows the hourly load projections for the CCE program in Year 1 of program operations.
Figure 13: Hourly Electric Load Profile for the CCE Study Partners
Renewable Energy Por tfolio Requirements
Current law requires that specified percentages of annual retail electricity sales be supplied from qualified
renewable energy resources. Senate Bill X1 2 (April, 2011) established a 33% Renewables Portfolio
Standard by 2020 with certain interim procurement targets applying in each of three “Compliance Periods”:
Compliance Period 1 began on January 1, 2011 and concluded on December 31, 2013 (a three-year
period); Compliance Period 2 began on January 1, 2014 and will continue through December 31, 2016 (a
three-year period; the current compliance period); and Compliance Period 3 (a four-year period), which will
commence on January 1, 2017 and conclude on December 31, 2020.
-
100,000
200,000
300,000
400,000
500,000
600,000
700,000
KW
Annual Hourly Load Profile
600,000 - 700,000
500,000 - 600,000
400,000 - 500,000
300,000 - 400,000
200,000 - 300,000
100,000 - 200,000
- - 100,000
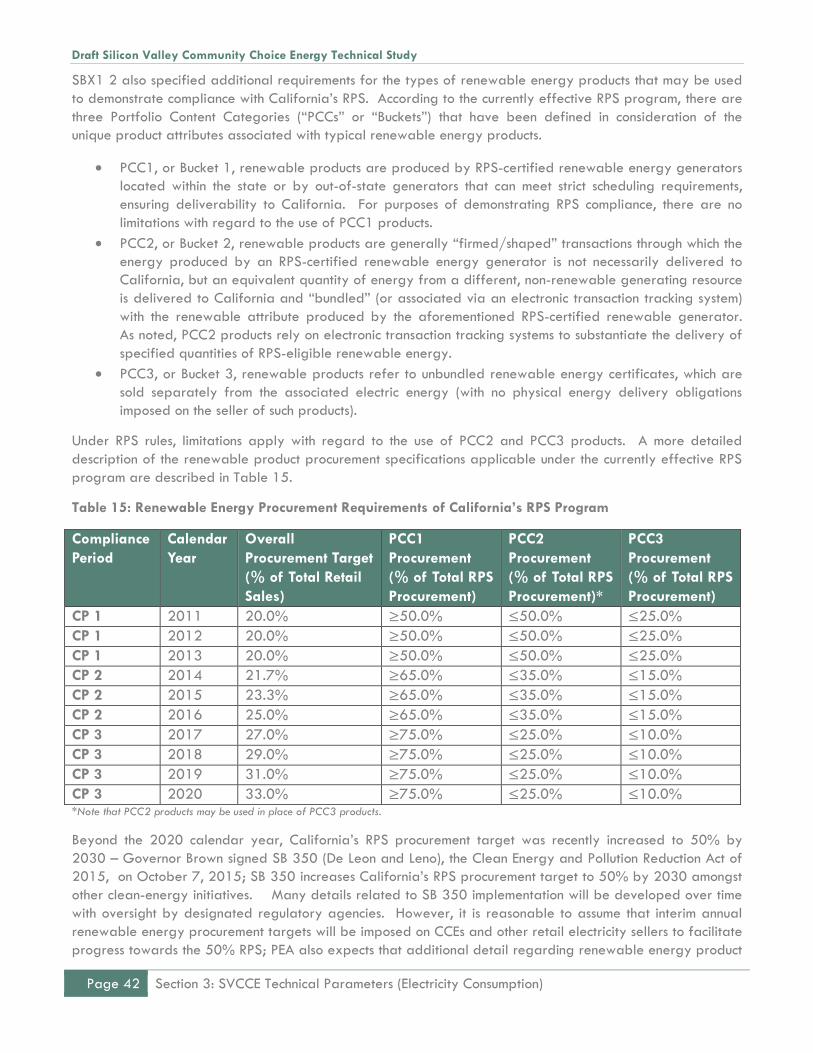
Draft Silicon Valley Community Choice Energy Technical Study
Page 42 Section 3: SVCCE Technical Parameters (Electricity Consumption)
SBX1 2 also specified additional requirements for the types of renewable energy products that may be used
to demonstrate compliance with California’s RPS. According to the currently effective RPS program, there are
three Portfolio Content Categories (“PCCs” or “Buckets”) that have been defined in consideration of the
unique product attributes associated with typical renewable energy products.
PCC1, or Bucket 1, renewable products are produced by RPS-certified renewable energy generators
located within the state or by out-of-state generators that can meet strict scheduling requirements,
ensuring deliverability to California. For purposes of demonstrating RPS compliance, there are no
limitations with regard to the use of PCC1 products.
PCC2, or Bucket 2, renewable products are generally “firmed/shaped” transactions through which the
energy produced by an RPS-certified renewable energy generator is not necessarily delivered to
California, but an equivalent quantity of energy from a different, non-renewable generating resource
is delivered to California and “bundled” (or associated via an electronic transaction tracking system)
with the renewable attribute produced by the aforementioned RPS-certified renewable generator.
As noted, PCC2 products rely on electronic transaction tracking systems to substantiate the delivery of
specified quantities of RPS-eligible renewable energy.
PCC3, or Bucket 3, renewable products refer to unbundled renewable energy certificates, which are
sold separately from the associated electric energy (with no physical energy delivery obligations
imposed on the seller of such products).
Under RPS rules, limitations apply with regard to the use of PCC2 and PCC3 products. A more detailed
description of the renewable product procurement specifications applicable under the currently effective RPS
program are described in Table 15.
Table 15: Renewable Energy Procurement Requirements of California’s RPS Program
Compliance
Period
Calendar
Year
Overall
Procurement Target
(% of Total Retail
Sales)
PCC1
Procurement
(% of Total RPS
Procurement)
PCC2
Procurement
(% of Total RPS
Procurement)*
PCC3
Procurement
(% of Total RPS
Procurement)
CP 1 2011 20.0% ≥50.0% ≤50.0% ≤25.0%
CP 1 2012 20.0% ≥50.0% ≤50.0% ≤25.0%
CP 1 2013 20.0% ≥50.0% ≤50.0% ≤25.0%
CP 2 2014 21.7% ≥65.0% ≤35.0% ≤15.0%
CP 2 2015 23.3% ≥65.0% ≤35.0% ≤15.0%
CP 2 2016 25.0% ≥65.0% ≤35.0% ≤15.0%
CP 3 2017 27.0% ≥75.0% ≤25.0% ≤10.0%
CP 3 2018 29.0% ≥75.0% ≤25.0% ≤10.0%
CP 3 2019 31.0% ≥75.0% ≤25.0% ≤10.0%
CP 3 2020 33.0% ≥75.0% ≤25.0% ≤10.0% *Note that PCC2 products may be used in place of PCC3 products.
Beyond the 2020 calendar year, California’s RPS procurement target was recently increased to 50% by
2030 – Governor Brown signed SB 350 (De Leon and Leno), the Clean Energy and Pollution Reduction Act of
2015, on October 7, 2015; SB 350 increases California’s RPS procurement target to 50% by 2030 amongst
other clean-energy initiatives. Many details related to SB 350 implementation will be developed over time
with oversight by designated regulatory agencies. However, it is reasonable to assume that interim annual
renewable energy procurement targets will be imposed on CCEs and other retail electricity sellers to facilitate
progress towards the 50% RPS; PEA also expects that additional detail regarding renewable energy product

Draft Silicon Valley Community Choice Energy Technical Study
Section 3: SVCCE Technical Parameters (Electricity Consumption) Page 43
eligibility, including any restrictions and/or requirements regarding the use of such products, will also become
clearer during upcoming implementation efforts.
For purposes of this Study, PEA assumed straight-line progress when moving from the 33% RPS mandate in
2020 to the 50% RPS mandate in 2030, or 1.7% annual increases in California’s renewable energy
procurement target during the ten-year transition period. With respect to the applicability of various
renewable energy products that may be eligible under the prospective 50% RPS, PEA assumed a similar
product mix to that which will be allowed under the current RPS program in calendar year 2020: minimum
75% PCC1 content; maximum 10% PCC3 content. Again, final details related to the implementation of SB
350 will not be certain until implementation of this legislation commences in coordination with assigned
regulatory agencies. With regard to any voluntary (above-RPS) renewable energy procurement activities,
PEA has assumed that the CCE program would have discretion in how it meets such voluntary, internally
imposed targets reflected in the prospective planning scenarios. Table 16 illustrates PEA’s assumed RPS
procurement rules as California transitions to a 50% RPS by 2030.
Table 16: Projected Renewable Energy Procurement Requirements Following SB350 Implementation
Compliance
Period
Calendar
Year
Overall
Procurement Target
(% of Total Retail
Sales)
PCC1
Procurement
(% of Total RPS
Procurement)
PCC2*
Procurement
(% of Total RPS
Procurement)*
PCC3
Procurement
(% of Total RPS
Procurement)
TBD 2021 34.7% ≥75.0% ≤25.0% ≤10.0%
TBD 2022 36.4% ≥75.0% ≤25.0% ≤10.0%
TBD 2023 38.1% ≥75.0% ≤25.0% ≤10.0%
TBD 2024 39.8% ≥75.0% ≤25.0% ≤10.0%
TBD 2025 41.5% ≥75.0% ≤25.0% ≤10.0%
TBD 2026 43.2% ≥75.0% ≤25.0% ≤10.0%
TBD 2027 44.9% ≥75.0% ≤25.0% ≤10.0%
TBD 2028 46.6% ≥75.0% ≤25.0% ≤10.0%
TBD 2029 48.3% ≥75.0% ≤25.0% ≤10.0%
TBD 2030 50.0% ≥75.0% ≤25.0% ≤10.0% *Note that PCC2 products may be used in place of PCC3 products.
Capacity Requirements
The CCE program would be required to demonstrate it has sufficient physical generating capacity to meet its
projected peak demand (660 MW) plus a 15% planning reserve margin, in accordance with resource
adequacy regulations administered by the CPUC and the CEC. A specified portion of generating capacity
must be located within certain local reliability areas and the remaining capacity requirement can be met with
generating plants anywhere within the CAISO system. Presently, there are two local reliability areas (as
defined in the CPUC’s annual Resource Adequacy Guide) that would apply to the CCE program: the “Greater
Bay Area” and the “Other PG&E Areas.” Additionally, the CPUC and CAISO impose a flexible capacity
requirement, which must be satisfied by all California load serving entities, including CCEs, to ensure that
certain quantities of reserve capacity are capable of increasing generation levels within specified time
periods (to promote system reliability when the production from certain grid-connected generators quickly
changes as is becoming increasingly common as a result of California’s buildout of intermittent renewable
energy resources).
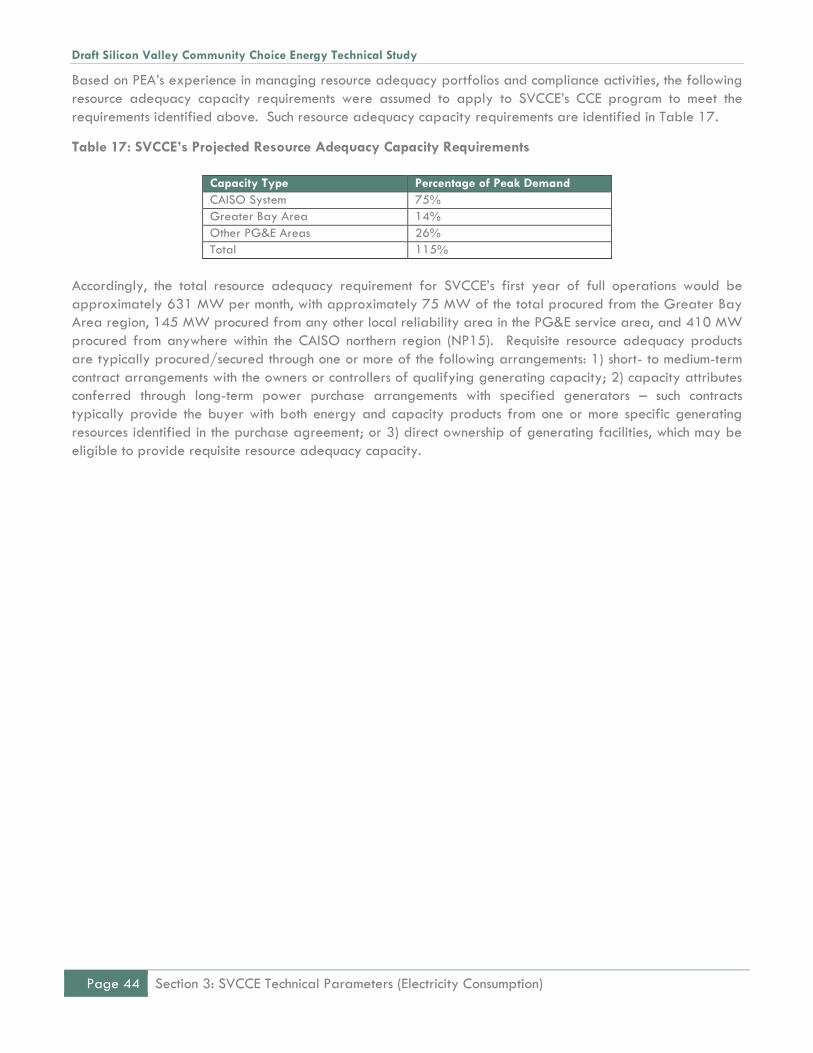
Draft Silicon Valley Community Choice Energy Technical Study
Page 44 Section 3: SVCCE Technical Parameters (Electricity Consumption)
Based on PEA’s experience in managing resource adequacy portfolios and compliance activities, the following
resource adequacy capacity requirements were assumed to apply to SVCCE’s CCE program to meet the
requirements identified above. Such resource adequacy capacity requirements are identified in Table 17.
Table 17: SVCCE’s Projected Resource Adequacy Capacity Requirements
Capacity Type Percentage of Peak Demand
CAISO System 75%
Greater Bay Area 14%
Other PG&E Areas 26%
Total 115%
Accordingly, the total resource adequacy requirement for SVCCE’s first year of full operations would be
approximately 631 MW per month, with approximately 75 MW of the total procured from the Greater Bay
Area region, 145 MW procured from any other local reliability area in the PG&E service area, and 410 MW
procured from anywhere within the CAISO northern region (NP15). Requisite resource adequacy products
are typically procured/secured through one or more of the following arrangements: 1) short- to medium-term
contract arrangements with the owners or controllers of qualifying generating capacity; 2) capacity attributes
conferred through long-term power purchase arrangements with specified generators – such contracts
typically provide the buyer with both energy and capacity products from one or more specific generating
resources identified in the purchase agreement; or 3) direct ownership of generating facilities, which may be
eligible to provide requisite resource adequacy capacity.

Draft Silicon Valley Community Choice Energy Technical Study
Section 4: Cost of Service Elements Page 45
SECTION 4: COST OF SERVICE ELEMENTS
This section summarizes the different types of costs that would be incurred by the CCE program in providing
electric service to its customers. For each supply scenario, a detailed pro forma was developed that
delineates the applicable cost of service elements. These pro forma are shown in Appendix A.
Electricity Purchases
The CCE program would be financially responsible for supplying the net electric demand of all enrolled
customers, and it would be able to source that supply from a variety of markets and/or through the
program’s own generation resources. Energy requirements are ultimately financially settled by the CAISO.
The CAISO plays a critical role in balancing supply and demand on a significant portion of California’s
electric grid and operates short-term markets for energy as well as real-time balancing services to cover
inevitable moment-to-moment fluctuations in electricity consumption (resulting from circumstances including but
not limited to weather, unexpected changes in customer energy use, unexpected variances in generator
operation, infrastructure outages and other situations). The CCE program would interact with the CAISO
through an intermediary known as a “Scheduling Coordinator”, periodically reporting usage data for its
customers and settling with the CAISO for any imbalances (i.e., instances in which the load forecast and/or the
planned generator operation differs from expectations, requiring the CAISO to balance any variances
through the operation of other system resources) or transactions in the CAISO markets.
Bilateral markets exist for longer term purchases, which allow hedging (i.e., contractual protection via
specified/fixed product pricing over a mutually agreed upon delivery term) against the fluctuations in CAISO
market prices. Longer term purchases can span many years, with the most active trading being for contracts
with terms of less than three years in duration. Contracts for new generation resources typically have contract
term lengths of twenty (20) years or more, allowing the project developer/owner to utilize the contract’s
expected revenue stream to support project financing.
Electric purchase costs were estimated using the projected energy demand during the industry-defined peak
and off-peak time periods. Assumed renewable energy contracts of the CCE program, as reflected in the
previously described indicative long-term contract portfolio, were subtracted from SVCCE’s expected peak
and off-peak energy demands, resulting in a residual energy requirements, or “net short”, which was assumed
to be met with short and mid-term contract purchases of system energy (produced by conventional generating
technologies; within California, the majority of system energy is produced by generators using natural gas as
a primary fuel source).
Renewable Energy Purchases
Renewable energy purchases may take two forms: 1) physical electric energy bundled with associated
renewable/environmental attributes; or 2) unbundled renewable/environmental attributes, which are sold
separately from the physical energy commodity. As described in Section 2, unbundled RECs were not
incorporated in any of the supply scenarios addressed in this Study; only bundled renewable energy
resources, which were assumed to meet the product delivery specifications associated with the PCC1 and
PCC2 product designations were incorporated in the indicative SVCCE supply portfolios.
Purchases of renewable energy from new resources are typically made under bundled, long-term contract
arrangements of 20 years or more. Shorter term purchases are common for existing renewable resources and
for unbundled renewable energy certificates.

Draft Silicon Valley Community Choice Energy Technical Study
Page 46 Section 4: Cost of Service Elements
Renewable energy currently sells for a premium relative to the cost of conventional power. However, when
compared to the cost of new, natural gas-fueled generation, renewable resources tend to have lower
levelized costs.30
Renewable energy purchase costs were estimated using predominantly long-term contracts for new renewable
energy projects as specified in the indicative long-term contract portfolio. Short-term market purchases of
bundled renewable energy were assumed to fulfill SVCCE’s remaining renewable energy needs.
With regard to the term renewable energy certificates, or “RECs”, it is important to understand that a REC is
the only mechanism by which ownership of renewable energy can be demonstrated/substantiated. One REC
is created for every whole MWh of metered electricity produced by a registered renewable generating
facility. Within the Western United States, a tracking system known as the Western Renewable Energy
Generation Information System (“WREGIS”) has been developed to facilitate the management of RECs,
providing a platform through which RECs can be transferred between buyers and sellers of renewable energy
products and also “retired” (meaning, removed from the marketplace) for purposes of demonstrating
legal/regulatory compliance or achievement of certain voluntary procurement objectives. All renewable
energy production is substantiated via the creation of a REC, which occurs following WREGIS’ verification of
metered energy production by a registered renewable generating resource. Use of the WREGIS system for
purposes of REC accounting serves to minimize concerns regarding double-counting during compliance
demonstration and public reporting – in the event that a renewable energy buyer does not possess a REC, it
cannot make claims with regard to the associated environmental benefits.
Again, some RECs are bundled with the associated electric energy; other RECs are sold apart from the electric
commodity – such RECs are appropriately referred to as “unbundled RECs”. The transaction documentation
associated with each renewable energy purchase should outline applicable product specifications, including
whether or not RECs are being sold with or apart from the electric commodity. In selecting its renewable
energy product mix, the CCE program should be aware that California law permits the use of a limited
quantity of unbundled RECs, or PCC3 product volumes, for purposes of demonstrating RPS compliance –
applicable limitations were previously described in Section 3. Such products currently represent lower-cost
options when compared to PCC1 and PCC2 products due to the administrative simplicity associated with such
transactions.
In recent years, there has been robust philosophical debate regarding the advantages and pitfalls of
unbundled REC use, particularly the environmental benefits associated with such products. Significant research
and documentation has been prepared regarding this topic, and SVCCE is encouraged to review such
information prior to engaging in unbundled REC transactions. Organizations including the Center for
Resources Solutions (the program administrator for the Green-e Energy program), the United States
Environmental Protection Agency, the United States Federal Trade Commission and The Climate Registry,
amongst others, have all completed research and/or issued positions regarding the use of unbundled RECs.
Furthermore, Assembly Bill 1110 (Ting), which was introduced to the California legislature on February 27,
2015 but is now a two-year bill, was intended to promote the inclusion of GHG emissions intensity reporting
by retail electricity suppliers (in annual Power Content Label communications). If AB 1110 moves forward
next year, it could impose a retail-level emissions calculation methodology that may eliminate all GHG
emissions benefits associated with unbundled RECs. In consideration of the CCE Study Partners’ preliminary
planning decision to exclude the use of unbundled RECs from all prospective supply scenarios, the potential
change in GHG reporting conventions contemplated under AB 1110 would not present any issues for SVCCE.
30 See for example, Table 62, Estimated Cost of New Renewable and Fossil Generation in California, California Energy Commission, March 2015.

Draft Silicon Valley Community Choice Energy Technical Study
Section 4: Cost of Service Elements Page 47
However, if SVCCE chooses to reconsider the use of unbundled RECs at some point in the future, it should be
aware that such a practice may result in the reporting of higher than anticipated portfolio emission levels. As
previously discussed and in light of the perceived risks and general controversy associated with the use of
unbundled RECs, the CCE Study Partners advised PEA to exclude Bucket 3 products from each of the
prospective supply scenarios.
Electric Generation
Generation projects developed or acquired by the CCE program could also supplement energy purchases.
Generation costs would include development costs, capital costs for land, plant and equipment, operations
and maintenance costs, and, if applicable, fuel costs. Capital costs for publicly owned utilities such as a CCE
are typically financed with long-term debt, and the annual debt service would be an element of annual CCE
program costs. For purposes of this Study, PEA’s analysis did not contemplate the utilization of CCE-
owned/developed generating resources during the ten-year study period for reasons previously described.
Transmission and Grid Services
The CAISO charges market participants, including CCEs (via the CCE’s selected scheduling coordinator) for a
number of transmission and grid management services that it performs. These include costs of managing
transmission congestion, acquiring operating reserves and other “ancillary services”, and conducting CAISO
markets and other grid operations. The CAISO charges are both directly related to SVCCE’s operations, but
there are other grid charges that are shared across all load serving entities on a pro rata basis. These costs
would be assessed to the Scheduling Coordinator for the CCE program, and are assumed to be directly
passed through to the CCE program with no markup.
Star t-Up Costs
Start-up costs are estimated to be nearly $2.9 million, which would provide necessary program funding
during the approximate twelve-month period immediately preceding service commencement to SVCCE
customers. Start-up costs include SVCCE staffing and requisite professional services, security deposits, the CCE
bond/financial security requirement, communications and customer notices, data management, and other
activities that must occur before the program begins providing electricity to its customers. These costs would be
recovered through SVCCE rates after service commences. A breakdown of estimated start-up costs is shown in
Table 18.

Draft Silicon Valley Community Choice Energy Technical Study
Page 48 Section 4: Cost of Service Elements
Table 18: Estimated SVCCE Program Start-Up Costs
Cost Item Amount
Internal Staff $730,000
Technical Consulting and Legal Services $620,000
Marketing and Communications $280,000
Customer Noticing and Mailers $120,000
Security Deposits $40,000
Miscellaneous Administrative and General $95,000
CCE Bond $100,000
Debt Service $720,000
Other Pre-launch Activities $180,000
Total $2,885,000
SVCCE start-up cost estimates are based on expenses incurred during the pre-launch activities of California’s
operating CCE programs. More specifically, PEA developed a start-up cost profile in consideration of the
actual experiences of California’s operating CCE programs, then scaled SVCCE start-up cost estimates based
on relative size (electric energy requirements) and customer composition when compared to the representative
start-up cost profile. A detailed description of each cost item is provided below.
Internal Staffing: As an independently operating JPA, it is assumed that the SVCCE program will begin to
hire its own staff (on an interim or full-time basis, depending on specific job responsibilities) twelve months
prior to service commencement.
Technical Consulting and Legal Services: Includes services provided by experienced firms and/or
individuals to support the following pre-launch activities: contract negotiations (with data management
providers and energy suppliers), regulatory and compliance reporting, load forecasting, rate design and
ratesetting, customer rate analysis, joint mailer content development, pro forma and budget development,
and other portfolio management services. Costs also include discussions, technical analysis, and negotiations
(with banking and financial institutions) related to securing financing for Program operations. This line item
generally addresses related costs that will be incurred during the twelve-month period immediately preceding
SVCCE launch.
Marketing and Communications: Includes costs specific to marketing, communications and customer outreach,
which are assumed to be outsourced services for purposes of this Study. Additional costs include the design
and printing of marketing materials, advertising across various media, and sponsorship of community events.
Customer Noticing and Mailers: Includes costs associated with the first two customer mailers (printing and
postage), which will be sent to prospective customers prior to service commencement – these notices are also
commonly referred to as “opt-out notices.” Estimates are based on costs incurred by existing CCE programs.
Security Deposits: Includes amounts required to satisfy the PG&E security deposit, which equates to the
monthly average PG&E service fee to be incurred by SVCCE during its first year of operation. The security
deposit is typically posted around the same time as the CCE Bond (which will be posted with the CPUC).
Miscellaneous Administrative and General: Includes additional overhead during the twelve-month period
immediately preceding service commencement. Some of these costs include travel, office supplies, and rent
for office space.

Draft Silicon Valley Community Choice Energy Technical Study
Section 4: Cost of Service Elements Page 49
CCE Bond: An amount equal to $100,000, which SVCCE would be required to post with the CPUC prior to
launching the Program. For purposes of this Study, it is assumed that the CCE Bond is posted upon certification
of the Implementation Plan.
Debt Service: Includes interest and principal payments associated with initial program financing. Such
payment obligations are expected to commence four months prior to service commencement. Depending on
SVCEE’s final credit structure, SVCCE could potentially negotiate terms that are more closely aligned with the
anticipated timing of rate revenue receipt. SVCCE’s “bridge-financing”, which is required to ensure that the
Program has adequate working capital at the time of launch and during the months immediately thereafter, is
the basis for assumed debt service payments.
Other Pre-Launch Activities: Includes costs related to Implementation Plan development, product and
portfolio design (i.e., the compilation and description of default and voluntary retail service options as well as
requisite portfolio accounting activities to ensure that all customer commitments are satisfactorily addressed),
and Request for Proposal development and administration (to secure requisite data manager services, energy
products and scheduling coordinator services). Costs would be incurred by SVCCE during the twelve-month
period immediately preceding service commencement.
Financing Costs
SVCCE would need access to capital for the primary purposes of covering anticipated start-up costs and
working capital requirements as well as any other project financing needs that may arise. Working capital
requirements are estimated at $9 million (with related debt service reflected in Table 18 above), which would
cover cash flow needs, primarily arising from the timing lag between power purchase payment deadlines and
the receipt of customer revenues. The noted $9 million in working capital requirements is additive to the $2.9
million in start-up costs (discussed above in the “Start-Up Costs” sub-section). Typical invoicing timelines for
wholesale power purchase contracts require payment (for the prior month’s energy deliveries) by the 20th of
each month. Customer payments (revenues) are typically received within sixty to ninety days following
electricity delivery. The timing difference between cash outflows and inflows represents SVCCE’s working
capital requirement. The possibility exists to negotiate payment timelines with power suppliers in order to
reduce SVCCE’s initial working capital requirement. For example, both SCP and LCE have negotiated an
additional 30 days in the supplier payment timeline, which significantly reduces each organization’s working
capital need.
Billing, Metering and Data Management
PG&E provides billing and metering services for all CCE programs and charges the CCE for such services in
accordance with applicable tariffs, which are regulated by the CPUC. PG&E posts the meter data to a data
server that the CCE program would be able to access for its power accounting and settlements. PG&E uses
systems to exchange billing, payment, and other customer data electronically with competitive retail electric
providers such as CCEs. While PG&E issues customer bills and processes customer payments, the CCE
program will have a large amount of data to manage and must be able to exchange data with PG&E using
automated processes. PEA included costs for third party data management as well as PG&E charges for
billing and metering in this cost of service category.
Draft Silicon Valley Community Choice Energy Technical Study
Page 50 Section 4: Cost of Service Elements
Staff and Other Operating Costs
Internal staffing and/or contractors would be required to manage SVCCE’s day-to-day operations. These
activities include program management, financial administration, resource planning, marketing and
communications, regulatory compliance and advocacy, and other general administration. Such costs were
estimated for SVCCE based on a review of the publicly available budgets adopted by the currently
operating CCE programs: Marin Clean Energy, Sonoma Clean Power, and Lancaster Choice Energy.
Additional costs were included for administration of certain demand side programs anticipated to be offered
by SVCCE. These programs may include customer self-generation (net energy metering) program incentives,
electric vehicle charging programs, energy efficiency and demand response programs. Included in the pro
forma projections for this cost element is an assumed $1,275,000 annual budget to support the administration
of such programs, which is assumed to include the funding of various customer incentives that may be offered
by SVCCE. SVCCE may also qualify for additional funding for administration of energy efficiency programs
through application to the CPUC.
Uncollectible Accounts
CCE rates must account for the small fraction of customers who do not pay their electric bill. PG&E attempts
to collect the CCE’s charges, but some accounts must be written off as uncollectible. An allowance for
uncollectible accounts has been included as a program cost element.
Program Reserves
A reasonable revenue surplus was factored in to estimated SVCCE rates to fund a reserve account that would
be used for contingencies or as a rate stabilization tool. Financing also requires generation of net revenues
that accumulate as reserves, as lenders typically require maintenance of debt service coverage ratios that
would necessitate setting rates to yield revenues in excess of program costs.
Bonding and Security Requirements
SVCCE would be required to provide a security deposit to PG&E and post a bond or other form of financial
security with the CPUC as part of its registration process. The security deposit covers approximately one
month of PG&E charges for billing and metering services. The CCE bond or financial security requirement,
which is posted with the CPUC, is intended to cover the potential reentry costs if customers were to be
involuntarily returned to PG&E.
The currently effective financial security requirement is $100,000, but PG&E and other investor owned utilities
have advocated changes to the methodology that could, under certain market conditions, result in extremely
large financial security requirements. PEA’s estimate of the CCE Bond amount reflects the currently applicable
specification ($100,000). However, the CCE program should actively monitor applicable regulatory
proceedings, which may result in changes to this bond amount. Risks associated with such changes are
discussed in additional detail within Section 7 of this Study.
PG&E Surcharges
SVCCE customers will pay the CCE’s rates for generation services, PG&E’s rates for non-generation services
(transmission, distribution, public purpose, etc.), and two surcharges that are currently included in PG&E’s
generation rates: the Franchise Fee Surcharge and the Power Charge Indifference Adjustment (“PCIA”). These
surcharges are not program costs per se, but they do impact how a customer’s bill will compare between
PG&E bundled service and CCE service.

Draft Silicon Valley Community Choice Energy Technical Study
Section 4: Cost of Service Elements Page 51
The franchise fee surcharge is a minor charge that ensures PG&E collects the same amount of franchise fee
revenues whether a customer takes generation service from a CCE or from PG&E. The PCIA is a substantial
charge that is intended to ensure that generation costs incurred by PG&E before a customer transitions to CCE
service are not shifted to remaining PG&E bundled service customers (following a customer’s departure from
PG&E to CCE service). For purposes of this Study, PEA’s assumed surcharges reflect the most recent advice
provided by PG&E and assumed changes to the PG&E supply portfolio over time.

Draft Silicon Valley Community Choice Energy Technical Study
Page 52 Section 5: Cost and Benefits Analysis
SECTION 5: COST AND BENEFITS ANALYSIS
This section contains a quantitative description of the estimated costs and benefits for each representative
supply scenario. Each scenario was evaluated using the three criteria described in Section 2. Ratepayer costs
and benefits are evaluated on the basis of the total electric rates customers would pay under CCE service as
compared to PG&E bundled service. Total electric rates include the rates charged by the CCE program plus
PG&E’s delivery charges and other surcharges. Environmental benefits are evaluated on the basis of
reductions in GHG (CO2) emissions relative to the reference case. Local economic benefits are evaluated on
the basis of jobs and economic activity created by the CCE program’s investments in local generation
resources.
When assessing the comparative environmental impacts associated with each of SVCCE’s prospective supply
scenarios, it is important to consider the potential changes that could result from PG&E’s reduced or
discontinued use of nuclear electricity produced by the Diablo Canyon Power Plant (“DCPP”). DCPP currently
produces approximately 18,000 GWh, or more than 20% of PG&E’s total power content, per year, but
licenses for the facility’s two reactor units expire in 2024 and 2025, respectively. At this point in time, there is
uncertainty regarding PG&E’s ability to successfully relicense these units under the current configuration, which
utilizes once-through cooling as part of facility operations. Environmental concerns regarding the use of once-
through cooling may present relicensing challenges for PG&E, which could result in temporary or permanent
discontinued operation of DCPP. Under this scenario, which falls towards the outer years of the study period,
SVCCE’s actual GHG emissions impact would dramatically improve under each of the prospective supply
scenarios. It is also noteworthy, that discontinued DCPP operation (without the addition of equivalent
generating capacity within the region) may also impose upward pressure on market energy prices and
resource adequacy products. PEA recommends that the CCE Study Partners continue to monitor the relicensing
status of DCPP as expiration of the existing licenses approaches.
As previously discussed (in Section 2), it is important to keep in mind the planned phase-in strategy for the
prospective SVCCE customer base, which is expected to occur over a three-year period. The projected
operating results reflected in the Study demonstrate the impacts of a phase-in strategy that would enroll
customers in the following manner: 1) one-third of prospective SVCCE customers would be enrolled during the
first month of service, drawing from a broad, representative cross section of the entire SVCCE customer base;
2) another third of the original customer population (i.e., half of the remaining customer population which had
yet to be enrolled) would be transitioned to CCE service during the thirteenth month of operation, reflecting
similar characteristics when compared with the first phase; and 3) all remaining customers not previously
enrolled would be transitioned to CCE service during the twenty fifth month of program operations.
Scenario 1 Study Results
Ratepayer Costs
The primary objective of Scenario 1 is to match the GHG emissions intensity of PG&E’s projected supply
portfolio while also exceeding the incumbent utility’s proportionate renewable energy supply without the use
of unbundled RECs. Consistent with PEA’s expectations, projected SVCCE customer rates in Scenario 1 are
lower than similar rate projections for PG&E throughout the ten-year study period, with annual comparative
benefits ranging from 3% to 5%. Levelized rates over the study period are projected to be 4% lower than
projected PG&E rates. For a typical household using 510 kWh per month, a 4% rate difference would result
in a cost reduction of approximately $5.09 per month in Year 1 of program operations.
Projected average rates for the SVCCE customer base are shown in Figure 14 and Table 19, comparing total
ratepayer impacts under the PG&E bundled service and CCE service options.

Draft Silicon Valley Community Choice Energy Technical Study
Section 5: Cost and Benefits Analysis Page 53
Figure 14: Scenario 1 Annual Ratepayer Costs
Table 19: Scenario 1 - Annual Total Delivered Rate Comparison
Year
PG&E
Total
(₵/kWh)
SVCCE
Total
(₵/kWh)
Percent
Difference
Levelized 22.27 21.49 -4%
1 19.51 18.64 -4%
2 19.94 19.08 -4%
3 20.59 19.48 -5%
4 21.29 20.35 -4%
5 21.90 21.19 -3%
6 22.42 21.80 -3%
7 23.14 22.49 -3%
8 23.78 23.14 -3%
9 24.49 23.84 -3%
10 25.19 24.47 -3%
14.0
16.0
18.0
20.0
22.0
24.0
26.0
1 2 3 4 5 6 7 8 9 10
Cents
Per
KW
h
Year
AVERAGE TOTAL COST COMPARISON
SVCCE Service
PG&E Service

Draft Silicon Valley Community Choice Energy Technical Study
Page 54 Section 5: Cost and Benefits Analysis
GHG Impacts
Consistent with the primary Scenario 1 planning objective, SVCCE’s anticipated GHG emissions are equivalent
to projected GHG emissions of the PG&E supply portfolio. A combination of renewable and other GHG-free
energy purchases is assumed to achieve this environmental outcome. The following figures and tables provide
additional detail regarding the respective GHG emissions profile associated with the assumed SVCCE and
PG&E supply portfolios.
Figure 15: Scenario 1 – Annual GHG Emissions Comparison
Table 20: Scenario 1 - Annual GHG Emissions Factor Comparison (Metric Tons CO2/MWh)
Year PG&E SVCCE
1 0.158 0.158
2 0.149 0.149
3 0.139 0.139
4 0.131 0.131
5 0.127 0.127
6 0.123 0.123
7 0.120 0.120
8 0.116 0.116
9 0.112 0.112
10 0.109 0.109
-
100,000
200,000
300,000
400,000
500,000
600,000
1 2 3 4 5 6 7 8 9 10
CO
2 E
mis
sion
s (M
etr
ic T
ons)
Year
ATTRIBUTED PORTFOLIO EMISSIONS
PG&E SVCCE

Draft Silicon Valley Community Choice Energy Technical Study
Section 5: Cost and Benefits Analysis Page 55
Figure 16: Scenario 1 – Annual Renewable Energy Content Comparison
Table 21: Scenario 1 - Annual Renewable Energy Portfolio Content
Year PG&E SVCCE
1 27% 36%
2 27% 36%
3 30% 36%
4 33% 38%
5 35% 39%
6 36% 41%
7 38% 43%
8 40% 45%
9 42% 47%
10 43% 49%
0%
10%
20%
30%
40%
50%
60%
1 2 3 4 5 6 7 8 9 10
Renew
able
Po
rtfo
lio
Con
tent
Year
RENEWABLE ENERGY CONTENT
SVCCE RENEWABLE PORTFOLIO PG&E RENEWABLE PORTFOLIO

Draft Silicon Valley Community Choice Energy Technical Study
Page 56 Section 5: Cost and Benefits Analysis
Scenario 2 Study Results
Ratepayer Costs
The primary objective of Scenario 2 is to increase the use of renewable energy resources while also
promoting overall annual GHG emissions reductions of 20% relative to the incumbent utility. For purposes of
the Study, this objective is achieved through the inclusion of renewable energy purchases that significantly
exceed applicable compliance mandates (doing so without the use of unbundled RECs) as well as additional
GHG-free energy purchases, which would be produced by non-RPS-eligible hydroelectric generators located
within California and/or the Pacific Northwest. Under Scenario 2, projected CCE customer rates are initially
lower than similar rate projections for PG&E and maintain that general relationship throughout the study
period – the relationship between SVCCE and PG&E rates demonstrates marginal customer savings ranging
from 1% to 4%. Levelized rates over the study period are projected to be 2% lower than projected PG&E
rates. However, in consideration of typical market volatility within the electric power sector and eminent
PG&E rate volatility, these results should be reasonably interpreted as reflecting only minimal rate savings
throughout the study period. For a typical household using 510 kWh per month, a 2% rate difference would
result in a cost reduction of approximately $2.46 per month.
Projected average rates for the SVCCE customer base are shown in Figure 17 and Table 22, comparing total
ratepayer impacts under the PG&E bundled service and CCE service options.
Figure 17: Scenario 2 Annual Ratepayer Costs
14.0
16.0
18.0
20.0
22.0
24.0
26.0
1 2 3 4 5 6 7 8 9 10
Cents
Per
KW
h
Year
AVERAGE TOTAL COST COMPARISON
SVCCE Service
PG&E Service

Draft Silicon Valley Community Choice Energy Technical Study
Section 5: Cost and Benefits Analysis Page 57
Table 22: Scenario 2 - Annual Total Delivered Rate Comparison
Year PG&E
Total
(₵/kWh)
SVCCE
Total
(₵/kWh)
Percent
Difference
Levelized 22.27 21.80 -2%
1 19.51 18.91 -3%
2 19.94 19.36 -3%
3 20.59 19.77 -4%
4 21.29 20.62 -3%
5 21.90 21.47 -2%
6 22.42 22.11 -1%
7 23.14 22.82 -1%
8 23.78 23.49 -1%
9 24.49 24.21 -1%
10 25.19 24.86 -1%
GHG Impacts
As a result of the significant proportion of GHG-free resources that were incorporated in Scenario 2, the CCE
program is able to demonstrate the desired GHG emissions reduction target of 20% when compared to
PG&E’s projected emissions profile. The following figures and tables provide additional detail regarding the
respective GHG emissions profile associated with the assumed SVCCE and PG&E supply portfolios.
Figure 18: Scenario 2 – Annual GHG Emissions Comparison
-
100,000
200,000
300,000
400,000
500,000
600,000
1 2 3 4 5 6 7 8 9 10
CO
2 E
mis
sion
s (M
etr
ic T
ons)
Year
ATTRIBUTED PORTFOLIO EMISSIONS
PG&E SVCCE

Draft Silicon Valley Community Choice Energy Technical Study
Page 58 Section 5: Cost and Benefits Analysis
Table 23: Scenario 2 - Annual GHG Emissions Factor Comparison (Metric Tons CO2/MWh)
Year PG&E SVCCE
1 0.158 0.126
2 0.149 0.119
3 0.139 0.111
4 0.131 0.105
5 0.127 0.102
6 0.123 0.099
7 0.120 0.096
8 0.116 0.093
9 0.112 0.090
10 0.109 0.087
Figure 19: Scenario 2 – Annual Renewable Energy Content Comparison
0%
10%
20%
30%
40%
50%
60%
70%
1 2 3 4 5 6 7 8 9 10
Renew
able
Po
rtfo
lio
Con
tent
Year
RENEWABLE ENERGY CONTENT
SVCCE RENEWABLE PORTFOLIO PG&E RENEWABLE PORTFOLIO

Draft Silicon Valley Community Choice Energy Technical Study
Section 5: Cost and Benefits Analysis Page 59
Table 24: Scenario 2 - Annual Renewable Energy Portfolio Content
Year PG&E SVCCE
1 27% 51%
2 27% 51%
3 30% 51%
4 33% 51%
5 35% 53%
6 36% 56%
7 38% 58%
8 40% 61%
9 42% 63%
10 43% 66%
Scenario 3 Study Results
Ratepayer Costs
It is generally appropriate to characterize Scenario 3 as an “optimized” supply scenario under which SVCCE’s
projected clean energy purchases are maximized subject to the imposition of a rate constraint, which required
that SVCCE’s rates remain equivalent to projected PG&E rates on a levelized basis throughout the Study
period. During individual years of the Study period, projected SVCCE and PG&E rates minimally differ within
a range demonstrating periods of moderate customer savings (2% savings in Year 3 of projected program
operations, for example) as well as negligible cost increases (which do not exceed 0.7% in any year of the
Study). Consistent with the imposed rate constraint, projected SVCCE customer rates remain generally
equivalent to similar rate projections for PG&E throughout the study period and typical residential customers
are expected to incur monthly charges that would be approximately $0.05 below similar PG&E charges on a
levelized basis.
Projected average rates for the SVCCE customer base are shown in Figure 20 and Table 25, comparing total
ratepayer impacts under the PG&E bundled service and CCE service options.

Draft Silicon Valley Community Choice Energy Technical Study
Page 60 Section 5: Cost and Benefits Analysis
Figure 20: Scenario 3 Annual Ratepayer Costs
Table 25: Scenario 3 - Annual Total Delivered Rate Comparison
Year PG&E
Total
(₵/kWh)
CCE Total
(₵/kWh)
Percent
Difference
Levelized 22.27 22.26 0%
1 19.51 19.38 -1%
2 19.94 19.85 0%
3 20.59 20.27 -2%
4 21.29 21.15 -1%
5 21.90 21.97 0%
6 22.42 22.58 1%
7 23.14 23.26 1%
8 23.78 23.91 1%
9 24.49 24.59 0%
10 25.19 25.21 0%
GHG Impacts
Through the substantial use of renewable and other GHG-free energy resources, Scenario 3 suggests that the
CCE program could achieve substantial GHG emissions reductions when compared to PG&E’s projected
emissions profile. The following figures and tables provide additional detail regarding the respective GHG
emissions profile associated with the assumed SVCCE and PG&E supply portfolios.
14.0
16.0
18.0
20.0
22.0
24.0
26.0
1 2 3 4 5 6 7 8 9 10
Cents
Per
KW
h
Year
AVERAGE TOTAL COST COMPARISON
SVCCE Service
PG&E Service

Draft Silicon Valley Community Choice Energy Technical Study
Section 5: Cost and Benefits Analysis Page 61
Figure 21: Scenario 3 – Annual GHG Emissions Comparison
Table 26: Scenario 3 - Annual GHG Emissions Factor Comparison (Metric Tons CO2/MWh)
Year PG&E SVCCE
1 0.158 0.064
2 0.149 0.055
3 0.139 0.045
4 0.131 0.037
5 0.127 0.033
6 0.123 0.029
7 0.120 0.025
8 0.116 0.022
9 0.112 0.018
10 0.109 0.015
-
100,000
200,000
300,000
400,000
500,000
600,000
1 2 3 4 5 6 7 8 9 10
CO
2 E
mis
sion
s (M
etr
ic T
ons)
Year
ATTRIBUTED PORTFOLIO EMISSIONS
PG&E SVCCE
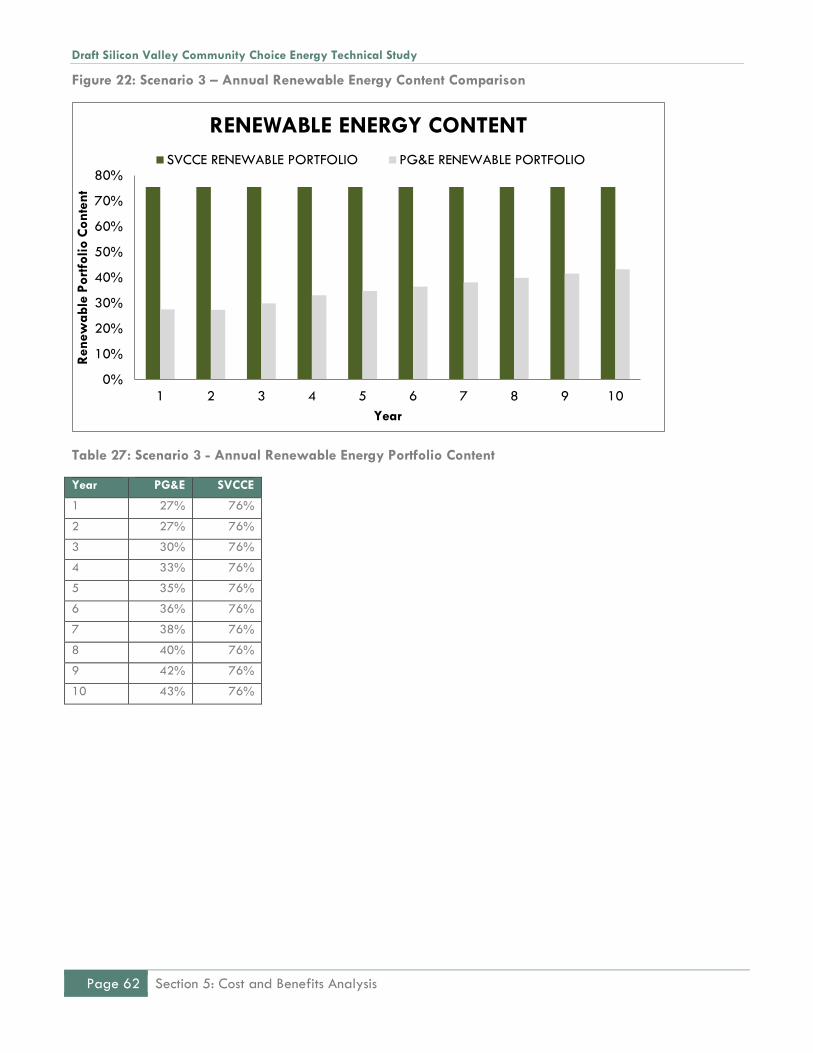
Draft Silicon Valley Community Choice Energy Technical Study
Page 62 Section 5: Cost and Benefits Analysis
Figure 22: Scenario 3 – Annual Renewable Energy Content Comparison
Table 27: Scenario 3 - Annual Renewable Energy Portfolio Content
Year PG&E SVCCE
1 27% 76%
2 27% 76%
3 30% 76%
4 33% 76%
5 35% 76%
6 36% 76%
7 38% 76%
8 40% 76%
9 42% 76%
10 43% 76%
0%
10%
20%
30%
40%
50%
60%
70%
80%
1 2 3 4 5 6 7 8 9 10
Renew
able
Po
rtfo
lio
Con
tent
Year
RENEWABLE ENERGY CONTENT
SVCCE RENEWABLE PORTFOLIO PG&E RENEWABLE PORTFOLIO

Draft Silicon Valley Community Choice Energy Technical Study
Section 6: Sensitivity Analyses Page 63
SECTION 6: SENSITIVITY ANALYSES
The economic analysis uses base case input assumptions for many variable factors that influence relative costs
of the CCE program. Sensitivity analyses were performed to examine the range of impacts that could result
from changes in the most significant variables (relative to base case values). The key variables examined are:
1) power and natural gas prices; 2) renewable energy prices; 3) low carbon energy prices; 4) PG&E rates;
5) PG&E surcharges; and 6) customer participation/opt-out rates. Additionally, a “small JPA” sensitivity case
was run reflective of minimal community participation in the SVCCE joint powers agency to test the viability of
a much smaller CCE program, and a “perfect storm” sensitivity was run to examine the cumulative impacts of
adverse changes to the key variables.
Power and Natural Gas Prices
Electric power prices in California are substantially influenced by natural gas prices, as natural gas-fired
generation is predominantly used as the marginal resource within the state’s system dispatch order. This fact
is consistent with how PEA developed the ten-year power price forecast in which a detailed natural gas
forecast was assembled and then converted to power prices using factors consistent with industry standards.
Changes in natural gas prices will also tend to change the power purchase costs of the CCE program. To the
extent that SVCCE’s selected supply portfolio excludes the use of conventional energy supply, the potential
impact related to price volatility within the natural gas market will be minimized. Such changes also influence
PG&E’s rates, but the relative cost impacts will differ depending upon the proportionate use of conventional
resources utilized by the CCE program relative to PG&E.
For the CCE program, the non-renewable portion of the supply portfolio will be influenced by changes in
natural gas and wholesale power prices. The PG&E resource mix includes resources that are influenced by
natural gas prices such as utility-owned natural gas fueled power plants, so-called “tolling” agreements with
independent generators, and certain other contracts that are priced based on an avoided cost formula. The
PG&E resource mix also includes energy sources that are not affected by natural gas prices, including
renewable resources as well as PG&E’s hydro-electric and nuclear assets.
Sensitivity to changes in natural gas and power prices were tested by varying the base case assumptions to
create high and low cases. The high case reflects a 50% increase in this input relative to the base case and
the low case reflects a 25% decrease relative to the base case.
Renewable Energy Costs
There can be wide variation in renewable energy costs due to locational factors (wind regime, solar insulation,
availability of feedstock for biomass and biogas facilities, etc.), transmission costs, technological changes,
federal tax policy, and other factors. In fact, the federal investment tax credit, or “ITC”, is expected to
decrease significantly for projects commencing operations on or after January 1, 2017 – the ITC is expected
to drop from 30% to 10%, based on PEA’s understanding, which could impose generally proportionate
increases to renewable energy pricing following such a change.
Sensitivity to renewable energy cost assumptions was tested by varying the base case costs for renewable
power purchase contracts and for the installed costs for renewable generation projects by 25% for the high
case and -25% for the low case. The variances were only applied to SVCCE’s cost structure and not PG&E’s
in order to test the impact of potential variation in site-specific renewable projects used by the CCE program.

Draft Silicon Valley Community Choice Energy Technical Study
Page 64 Section 6: Sensitivity Analyses
Carbon-Free Energy Costs
Specified purchases from carbon-free resources or low carbon emissions portfolios generally yields a premium
relative to system energy purchases. In consideration of the potential for increased CCE demand for low
carbon content energy and the generally fixed supply of the large hydro-electric generation resource base
available to California consumers, only a high case was evaluated for this factor. The high carbon-free
energy cost premium scenario was evaluated at a 300% increase relative to the base case assumption.
PG&E Rates
The base case forecast for PG&E’s generation rates yields a projected average annual increase of
approximately 2.5%. The forecast relies on resource mix data provided by PG&E in its most recent long-term
procurement plan, and incorporates many of the same core market cost assumptions (natural gas prices,
power prices, GHG allowance prices, etc.) as used in the forecast of CCE program rates. Numerous factors
can cause variances in PG&E’s rates, and low and high cases were developed for this variable. One factor
that could have a significant increase on PG&E’s rates is the potential closure or rebuilding of DCPP, resulting
from regulations prohibiting the use of once-through cooling at the plant. A high case was created that
reflects an average annual generation rate increase of 5%. The low case assumes 1.5% annual rate
increases for PG&E. Figure 23 illustrates the base, high and low case forecasts of PG&E generation rates
and how these projections compare with historical trends.
Figure 23: PG&E System Average Generation Rates
6.0
6.9
7.5 7.4
8.0 8.1
6.7
7.1
7.9
8.6
9.7
9.29.29.4 9.6
9.910.3
10.510.7
11.111.4
11.712.0
9.2
9.7
10.1
10.6
11.2
11.7
12.3
12.9
13.6
14.3
15.0
9.2 9.3 9.5 9.6 9.8 9.9 10.0 10.2 10.4 10.5
5.0
7.0
9.0
11.0
13.0
15.0
17.0
20
05
20
06
20
07
20
08
20
09
20
10
20
11
20
12
20
13
20
14
20
15
20
16
20
17
20
18
20
19
20
20
20
21
20
22
20
23
20
24
20
25
20
26
CEN
TS P
ER
KW
H
Reported Base Proj. High Proj. Low Proj.

Draft Silicon Valley Community Choice Energy Technical Study
Section 6: Sensitivity Analyses Page 65
PG&E Surcharges
The PCIA and Franchise Fee surcharges directly impact SVCCE rate competitiveness, and the PCIA has been
volatile. In an August, 2015 filing to the CPUC, PG&E projected PCIA levels for 2016 that are
approximately 70% higher than current levels.31 In general terms, the PCIA is set on an annual basis in
consideration of a specified methodology that takes into consideration the difference in costs associated with
PG&E’s supply portfolio and a market benchmark – to the extent that costs associated with the PG&E supply
portfolio exceed the market benchmark, departing customers, including CCE customers, are subject to a PCIA
surcharge. The specific methodology that is employed when determining the PCIA is subject to PCIA oversight,
and PG&E must perform related PCIA calculations consistent with such methodology. Over time, PCIA charges
will change based on the relationship between PG&E’s power portfolio costs and current market pricing. In
concept, the PCIA should diminish (and eventually expire) over time, as PCIA charges are directly associated
with PG&E power contracts, all of which should have finite term lengths. Once such contracts expire, any
related PCIA impacts should fall to zero. However, because PG&E engages in ongoing contracting efforts,
PCIA charges may persist for 20 years or more (but should diminish over time). Figure 24 shows the projected
Franchise Fee Surcharge and PCIA applicable to residential customers as well as historical data illustrating the
volatility of these surcharges.
Figure 24: PG&E CCE Surcharges for Residential Customers (Cents Per KWh)
The base case PCIA projections begin with the higher 2016 PCIA charges reported by PG&E and remain
relatively flat over the forecast period. High and low cases were run at plus or minus 50% off of the base
case.
Opt-Out Rates
Sensitivity of ratepayer costs to customer participation in the CCE program was tested by varying the opt-out
rate from 25% in the high case to 5% in the low case. A higher opt-out rate would reduce sales volumes
relative to base case assumptions, and increase the share of fixed costs paid by each customer, while a lower
opt-out rate would have the opposite effect.
31 PG&E Advice Letter AL-4696-E.

Draft Silicon Valley Community Choice Energy Technical Study
Page 66 Section 6: Sensitivity Analyses
Community Par ticipation (Small JPA)
While the base case includes all municipalities as participants in the JPA, a sensitivity was run to examine the
impacts of a much smaller program being formed in the region. For purposes of this sensitivity, it was
assumed that 25% of the total potential customers are offered service in the CCE and that 15% of these
customers elect to opt-out. Adjustments were made to assumed staffing costs to reflect the smaller scale of
operations. The long term renewable contract portfolio was adjusted downward on a pro rata basis to
reflect the reduced energy requirements. The results of this sensitivity indicate that a viable program could be
operated with significantly less than 100% participation of the prospective communities. While not explicitly
modeled, a program serving only the four sponsoring partner agencies (representing 68% of the total
potential load) would have sufficient scale and be expected to have similar rates as presented in the base
case projections.
Perfect Storm
This sensitivity examines the cumulative effects of adverse changes to all of the key variables to present what
could be considered a worst case. The likelihood that all of these variables change in unison is remote; many
of the key variables are negatively correlated meaning that increases in one variable would normally be
associated with decreases in another. For example, increases in market prices for power should result in
decreases in the PG&E surcharges, but for purposes of this sensitivity it was assumed that the PG&E
surcharges would also increase. This sensitivity was constructed with the following assumptions: high natural
gas/power prices, high renewable energy and low carbon energy costs, high PG&E surcharges, high customer
opt-out rates, and low PG&E rates.
Sensitivity Results
The sensitivity analysis produced a range of levelized electric rates for the CCE program and PG&E as shown
in the Figure 25.32 When reviewing this figure, the base case outcomes associated with each scenario are
represented by the “arrowheads” that are positioned along each vertical line – to the extent each line
extends above (or below) the arrowhead, this represents the potential for customer rates to be higher (or
lower) than the base case outcomes. It should be noted that there is considerable overlap in the range of
estimated rates, and while base case estimates show higher rates for the CCE program, any of the CCE
Scenarios could potentially result in lower ratepayer costs than under the status quo. The sensitivity analysis
for the Community Participation (Small JPA) and Perfect Storm conditions are discussed above but not
included in Figure 25 as they are very unlikely to occur and would distort the results presented in the figure.
Rate outcomes for all conditions analyzed are included in Table 28 and Figures 26 and 27.
32 The ranges shown in Figure 25 do not include the Small JPA and Perfect Storm sensitivities.
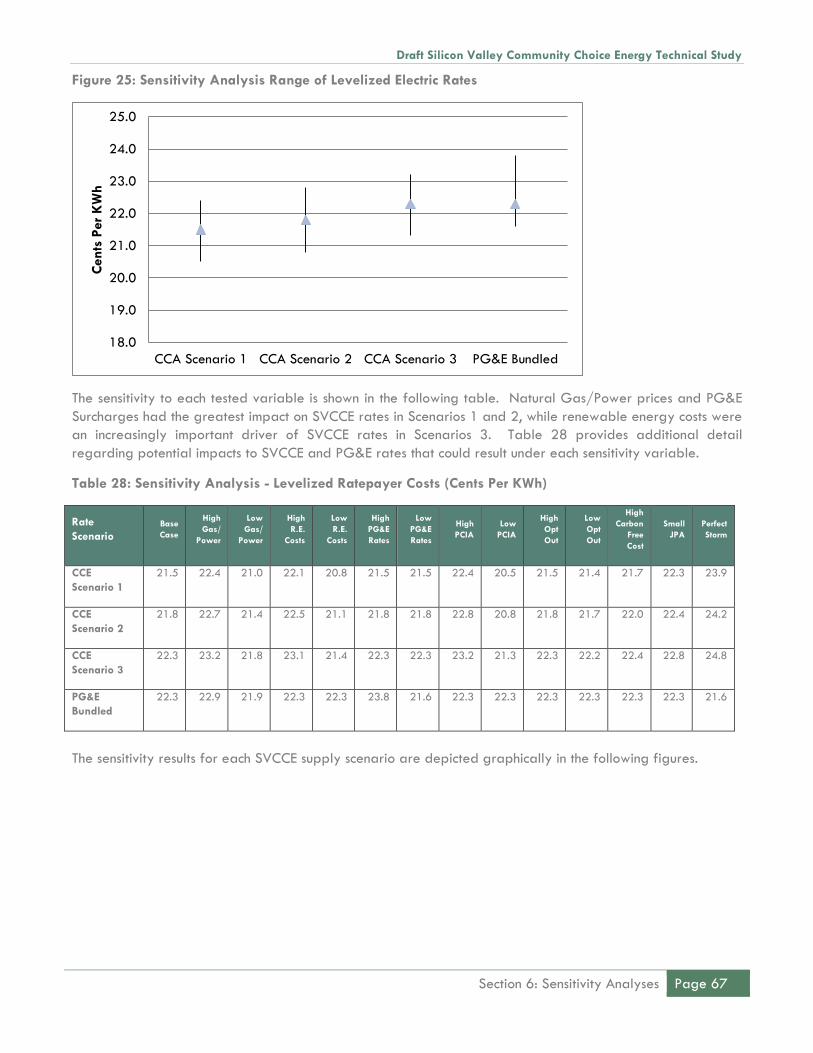
Draft Silicon Valley Community Choice Energy Technical Study
Section 6: Sensitivity Analyses Page 67
Figure 25: Sensitivity Analysis Range of Levelized Electric Rates
The sensitivity to each tested variable is shown in the following table. Natural Gas/Power prices and PG&E
Surcharges had the greatest impact on SVCCE rates in Scenarios 1 and 2, while renewable energy costs were
an increasingly important driver of SVCCE rates in Scenarios 3. Table 28 provides additional detail
regarding potential impacts to SVCCE and PG&E rates that could result under each sensitivity variable.
Table 28: Sensitivity Analysis - Levelized Ratepayer Costs (Cents Per KWh)
Rate
Scenario
Base
Case
High
Gas/
Power
Low
Gas/
Power
High
R.E.
Costs
Low
R.E.
Costs
High
PG&E
Rates
Low
PG&E
Rates
High
PCIA
Low
PCIA
High
Opt
Out
Low
Opt
Out
High
Carbon
Free
Cost
Small
JPA
Perfect
Storm
CCE
Scenario 1
21.5 22.4 21.0 22.1 20.8 21.5 21.5 22.4 20.5 21.5 21.4 21.7 22.3 23.9
CCE
Scenario 2
21.8 22.7 21.4 22.5 21.1 21.8 21.8 22.8 20.8 21.8 21.7 22.0 22.4 24.2
CCE
Scenario 3
22.3 23.2 21.8 23.1 21.4 22.3 22.3 23.2 21.3 22.3 22.2 22.4 22.8 24.8
PG&E
Bundled
22.3 22.9 21.9 22.3 22.3 23.8 21.6 22.3 22.3 22.3 22.3 22.3 22.3 21.6
The sensitivity results for each SVCCE supply scenario are depicted graphically in the following figures.
18.0
19.0
20.0
21.0
22.0
23.0
24.0
25.0
CCA Scenario 1 CCA Scenario 2 CCA Scenario 3 PG&E Bundled
Cents
Per
KW
h

Draft Silicon Valley Community Choice Energy Technical Study
Page 68 Section 6: Sensitivity Analyses
Figure 26: Scenario 1 Sensitivity Impacts on Levelized Electric Rates
Figure 27: Scenario 2 Sensitivity Impacts on Levelized Electric Rates

Draft Silicon Valley Community Choice Energy Technical Study
Section 6: Sensitivity Analyses Page 69
Figure 28: Scenario 3 Sensitivity Impacts on Levelized Electric Rates

Draft Silicon Valley Community Choice Energy Technical Study
Page 70 Section 7: Risk Analysis
SECTION 7: RISK ANALYSIS
CCE formation is not without risk, and a key element of this Study is highlighting risks that may be faced by
the CCE program as well as related risk-mitigation measures. Several of the quantitative impacts associated
with key risks have been addressed in Section 6, Sensitivity Analyses. However, there are additional risk
elements of which any aspiring CCE program should be aware as well as associated mitigation measures for
such risks. In particular, these additional risks include, but are not limited to, the following:
• Financial risks to SVCCE’s member municipalities in the unlikely event of CCE failure;
• Financial risks that may exist in the event that procured energy volumes fall short of or exceed actual
customer energy use;
• Reasonably foreseen legislative and regulatory changes, which may limit a CCE’s ability to remain
competitive with the incumbent utility;
• Availability of renewable and carbon-free energy supplies required to meet compliance mandates,
SVCCE program goals, and customer commitments; and
• General market volatility and price risk.
Financial Risks to SVCCE Members
In general terms, the prospective financial risks to SVCCE members will be limited to the extent that the JPA
agreement creates separation, also referred to as a “firewall”, between the financial assets and obligations
of the JPA and those of its individual members. This approach has been effectively employed by both MCE
and SCP at the time that each JPA was created, insulating the respective members of each organization from
the financial liabilities independently incurred by the JPA (e.g., power purchase agreements, debt, letters of
credit and other operating expenditures). For example, if the JPA was to default on a contract obligation,
any termination payments would be owed by the JPA and not the individual members, as individual JPA
members would not be responsible for the financial commitments of the JPA. From a practical perspective,
each member of the JPA would have a relatively small financial exposure, which would be limited to any
early-stage contributions and/or expenditures related to the CCE initiative before joining the JPA. After
joining the JPA, each participating municipality would be financially insulated via the JPA agreement, and it is
anticipated that the JPA would be financially independent during ongoing CCE operations, meaning that the
JPA would be responsible for independently demonstrating creditworthiness when entering into power
purchase agreements and financial covenants. Based on PEA’s understanding, qualified legal counsel was
engaged during the formation of each operating, multi-jurisdiction CCE to ensure that the associated JPA
agreement created the desired financial protections for its members.
Other than relatively small upfront costs/contributions that may be incurred by the JPA members during CCE
evaluation and JPA formation and any guarantees that may be offered to support startup, financial
obligations of the participating communities would be limited to individual customer impacts in the event of
outright CCE failure. In such a scenario, the $100,000 CCE bond is intended to cover the costs of returning
customers to PG&E service. However, following an involuntary return to bundled service, CCE customers would
be individually required to pay the PG&E Transitional Bundled Commodity Cost (TBCC), which imposes a
market-based rate on customers who fail to provide PG&E with six-month advance notice prior to
reestablishing PG&E electric service.33 In recent years, the TBCC rate has likely benefited participating
customers due to historically low market prices (and the favorable relationship of such prices to PG&E’s
generation rates). However, inherent price volatility within the electric power sector could result in relatively
high customer costs in the short-term, following an involuntary return to bundled service at a time when market
33 http://www.pge.com/tariffs/tm2/pdf/ELEC_SCHEDS_TBCC.pdf
Draft Silicon Valley Community Choice Energy Technical Study
Section 7: Risk Analysis Page 71
prices are higher than PG&E’s prevailing generation rates. Depending on future market conditions during a
time of involuntary customer return to PG&E service, cost impacts during the six-month transition period could
be +/-25% (or more, depending on actual market prices) relative to otherwise applicable PG&E rate
schedules. In practical terms, the likelihood of this risk materially impacting a SVCCE customer appears to be
quite low.
In addition to the aforementioned financial risks to the JPA and its respective members, it is also noteworthy
that a subset of the CCE Study Partners, including the cities of Sunnyvale, Cupertino and Mountain View as
well as Santa Clara County, have entered into a project funding agreement to facilitate CCE program
evaluation, formation and implementation – these communities have made certain financial expenditures to
provide for the evaluation of prospective CCE formation. PEA also understands that this subset of the CCE
Study Partners, as well as other project participants, may choose to make additional contributions for
purposes of completing SVCCE’s formative and start-up activities. At the time of JPA formation, PEA
understands that certain CCE Study Partners may request repayment of the noted initial expenditures
following successful launch of the SVCCE program and a yet-to-be-defined period of successful operations.
Clearly, the repayment of such funding is dependent upon the successful launch and operation of the SVCCE
program.
For example, if SVCCE fails to launch or discontinues business operations prior to repaying initial funding
contributed by certain of the CCE Study Partners, then such Partners run the risk of financial losses equivalent
to any amounts expended in advance of such circumstances. With regard to the risk of the CCE Study
Partners losing its initial investment in CCE evaluation and formation, failure to launch the SVCCE program
represents the primary risk in this regard. Once SVCCE has launched and is serving customers, it is reasonable
to assume that the financial contributions that were previously made by certain CCE Study Partners would be
paid back within the first five years of SVCCE operation. Based on recent discussions and general enthusiasm
related to the SVCCE initiative, it seems reasonable to assume that the SVCCE program will launch as
planned, unless market conditions significantly change such that initial SVCCE rates are projected to exceed
similar rates charged by PG&E. Under Scenario 2, for example, sensitivity analyses suggest that power costs
could increase by 14% or PG&E rates could decrease by 11% (or a related combination of such impacts)
before projected SVCCE rates would exceed PG&E’s projected rates. From a practical perspective, this
observation suggests that current operating projections provide considerable safety margins for SVCCE,
allowing for a range of market conditions and/or rate changes before rate competitiveness would be
compromised. It is noteworthy that PG&E’s 2016 rates will remain unknown until January, and power costs
won’t be known until SVCCE issues a related solicitation for such products, which is expected to occur in early
2016. In the event that actual PG&E rate changes and/or proposed power prices fall outside of the
aforementioned safety margins, SVCCE would likely defer program launch and cease incurring startup
expenses until projected operations improve, potentially jeopardizing or delaying the reimbursement of
funding initially provided by certain of the CCE Study Partners.
Deviations between Actual Energy Use and Contracted Purchases
Deviations between actual customer energy use and contracted energy purchases are inevitable. For
example, weather variation may impose meaningful day-to-day variances in expected customer energy use,
which results in the potential for ongoing imbalances between procured energy volumes and actual electric
energy consumption by SVCCE’s customer base. To the extent that such imbalances exist, the CCE may be
required to make market purchases during unexpected price spikes and/or sell off excess energy volumes at
times when prices are relatively low (when compared to the price paid for such energy), which could impose
adverse financial impacts on the CCE program. Again, this is an inevitable risk that is assumed by all energy
market participants, but prudent planning and procurement practices can be utilized by the CCE to manage

Draft Silicon Valley Community Choice Energy Technical Study
Page 72 Section 7: Risk Analysis
such risk to acceptable levels. In particular, “laddered” procurement strategies can be highly effective in
mitigating such risks – this procurement strategy is designed to promote increased cost/rate certainty during
the upcoming 12-month operating period by securing 90-100% of the CCE’s projected energy requirements
during this period of time. Beyond the 12-month operating horizon, an increasing proportion of the CCE’s
anticipated energy requirements are left “open” (i.e., are not addressed via contractual commitments) to
avoid financial commitments based on reduced planning certainty. For example, the CCE program may
decide that it is acceptable to take on market price risk associated with 5% of its expected energy
requirements over the upcoming 12-month operating period – this strategy would create cost certainty for a
significant portion of the CCE’s expected energy requirements, allowing the CCE to set rates in consideration
of such costs with minimal financial/budgetary risk. For months 13-24, the CCE would reduce forward supply
commitments to a level approximating 80-90% of expectations; for months 25-36, the CCE would further
reduce forward supply commitments to a level approximating 70-80% of expectations. Forward
procurement commitments would continue to “fall down the ladder” in subsequent months, but such open
positions are ultimately filled with time. It is also noteworthy that such percentages could always be adjusted
in consideration of prevailing market prices and the CCE’s overall risk tolerance.
This procurement strategy avoids the prospect of over-procurement and minimizes the prospect of surplus
energy sales while also allowing the CCE program to take advantage of favorable procurement opportunities
that may come about with time. During early-stage CCE operations, this strategy is particularly useful since
the CCE is unlikely to know exact customer participation levels. Over time, as the CCE’s customer base
becomes more stable/predictable, it will become less challenging to predict customer usage patterns.
Furthermore, a laddered procurement strategy allows the CCE’s portfolio composition to evolve over time as
opposed to committing to a specific resource mix that would only be minimally adjustable (subject to potential
adverse economic consequences) until related power supply agreements had expired.
Legislative and Regulatory Risk
California’s operating CCEs can attest to the challenges presented by anti-CCE legislation – a range of tactics
have been employed over time, pre-dating MCE’s launch in May, 2010 and resurfacing thereafter in various
forms. Ongoing issues continue to arise with regard to proposed legislation designed to assign/shift costs for
purposes of competitively disadvantaging CCE programs and/or limit the autonomy of CCE programs, so that
such programs appear more similar to their investor-owned counterparts. Recently, SB 350 and AB 1110
presented such issues. However, California’s operating CCEs were able to address many of the potentially
detrimental changes included within these bills through effective lobbying and technical support. California’s
IOUs regularly rely on professional lobbyists to promote their respective interests within the California
legislature, and CCEs have successfully employed similar tactics to represent their own interests, which often
differ from those of their investor-owned counterparts. Use of lobbyists within proximity to the State Capitol
also mitigates logistical challenges that may be encountered when addressing time-sensitive issues that require
on-site meeting participation and collaboration.
CCEs have also enjoyed similar success in California’s regulatory arena by utilizing the expertise of
specialized regulatory support, including qualified regulatory counsel and analysts, who have deep and long-
standing familiarity with a broad range of regulatory proceedings, assigned commissioners, judges and
support staff within jurisdictional agencies. Because certain proceedings have the potential to directly affect
the formation and ongoing operation of CCE programs, it is critically important to retain such expertise for
purposes of representing the CCEs interests, particularly if the CCE has not yet hired internal regulatory
counsel and/or staff. Over time, the CCE program may choose to scale its internal regulatory staffing in
consideration of the level of work required to achieve successful regulatory representation and desired
outcomes.

Draft Silicon Valley Community Choice Energy Technical Study
Section 7: Risk Analysis Page 73
Regarding recent legislation, on October 7, 2015, Governor Brown signed Senate Bill 350, the Clean Energy
and Pollution Reduction Act of 2015, enacting pertinent clean energy mandates reflected in this legislation. In
particular, SB 350 increases California’s RPS to 50% by 2030 amongst other clean-energy initiatives. Many
details regarding implementation of SB 350 will be developed over time with oversight by applicable
regulatory agencies. With regard to other relevant changes that have been created by SB 350, CCEs should
be aware of the following:
Costs associated with the integration of new renewable infrastructure may be off-set by a CCE if it
can demonstrate to the CPUC that it has already provided equivalent resources [Sections 454.51(d)
and 454.52(c)];
CCEs will be required to submit Integrated Resource Plans to the CPUC for certification while retaining
the governing authority and procurement autonomy administered by their respective governing
boards [Section 454.52(b)(3)];
The CPUC is now responsible for ensuring that: (1) IOU bundled customers do not incur any cost
increases as a result of customers participating in CCE service options, and (2) CCE customers do not
experience any cost increases as a result of IOU cost allocation that is not directly related to such CCE
customers (Sections 365.2 and 366.3);
Beginning in 2021, CCEs must have at least 65% of their RPS procurement under long-term contracts
of 10 years or more [Section 399.13(b)]; and
CCE energy efficiency programs will be able to count towards statewide energy efficiency targets
[Sections 25310(d)(6) and 25310(d)(8)].
In aggregate, the CCE-specific changes reflected in SB 350 are generally positive, providing for ongoing
autonomy with regard to resource planning and procurement. CCEs must be aware, however, of the long-
term contracting requirement associated with renewable energy procurement. This is not expected to present
issues for SVCCE, but planning and procurement efforts will need to consider this requirement during ongoing
operation of the CCE program.
AB 1110, which is now a two-year bill, was primarily focused on the addition of GHG emission disclosures
within the Power Content Label. During discussion in the recent legislative session, CCE interests were
generally concerned that the emissions methodology reflected in the bill was designed in a manner that was
not necessarily consistent with retail-level emissions reporting conventions used throughout the electric utility
industry and also appeared to diminish the environmental value of certain clean energy products. On
September 8, 2015, AB 1110 was ordered to the inactive file at the request of Senator Wolk.34 With this
direction in mind, AB 1110 is no longer an issue in the current legislative session. However, PEA recommends
that the CCE Study Partners should continue to monitor the legislature’s interest in promoting certain reporting
changes reflected in AB 1110, as such changes could narrow the potential field of cost-effective supply
options that could be pursued by SVCCE at some point in the future. The AB 1110 GHG emissions reporting
methodology may also present methodological conflicts with other programs, such as The Climate Registry,
which may be of interest to SVCCE at some point in the future.
Another piece of pending legislation that could pose direct and indirect impacts on CCE programs is SB 286
(Hertzberg). SB 286 was originally introduced during the 2015 legislative session (has now been converted
into a two-year bill) with the goal of increasing the direct access participatory cap by approximately 33%.
In its current form, SB 286 suggests that new direct access customers would be required to contract for 100%
34 AB 1110 bill history: http://leginfo.legislature.ca.gov/faces/billHistoryClient.xhtml?bill_id=201520160AB1110.
Draft Silicon Valley Community Choice Energy Technical Study
Page 74 Section 7: Risk Analysis
renewable energy. If passed during the 2016 legislative session, SB 286 could either spark additional
renewable development, which could keep prices stable, or push renewable prices upward due to the
increased demand. Additionally, raising the direct access cap could put more pressure on CCE programs to
offer even more price competitive products to retain large commercial and industrial customers.
Regulatory risks include the potential for utility generation costs to be shifted to non-bypassable and delivery
charges. Examples include: 1) the Cost Allocation Mechanism (“CAM”), under which the costs of certain
generation commitments made by the investor owned utilities deemed necessary for grid reliability or to
support other state policy, are allocated to non-bundled (CCE and direct access) customers; and 2) the PCIA
as previously discussed.
CAM is a mechanism that allows investor owned utilities to impose a portion of the costs associated with their
power purchases onto CCE customers, even though these purchases are for fossil fuel resources with prices that
are often above current market levels. In theory, the goal of CAM is to promote grid reliability and should
only be applied to resources that contribute in that regard; in practical terms, the investor owned utilities have
obtained CPUC-approved CAM treatment for many types of generating resources. Bundled, CCE, and direct
access customers pay for CAM in the form of the New System Generation Charge (“NSGC”). The NSGC
imposes costs on CCE customers that often seem to be duplicative in light of long-term capacity commitments
that have already been made by CCEs in the form of various power purchase agreements (which can include
capacity attributes as an element of the purchased product). In other words, the present CAM methodology
does not appear to adequately reflect the contribution being made by CCEs in terms of promoting capacity
buildout within California’s energy market and generally undermines CCE procurement autonomy through the
imposition of costs that are not associated with contracts voluntarily entered into by the CCE.
One of the only tangible benefits realized by CCE’s under the current CAM rules is an offsetting capacity
allocation, which slightly reduces monthly resource adequacy requirements of the CCE entity. As previously
noted, the passage of SB 350 requires that CCEs have at least 65% of applicable RPS procurement under
long-term contracts, and existing CCEs have already demonstrated a track record of long term contracting
notwithstanding the pending requirements of SB 350. Such contracts typically confer capacity benefits
associated with the contracted resources, which could result in diminished value of CAM capacity allocations,
as many CCEs would have already procured a significant portion of applicable capacity requirements
through requisite renewable energy contracting efforts – stated somewhat differently, the CAM charges
imposed on CCE customers would result in little capacity value for CCE customers due to the fact that many
CCEs would have already arranged for such capacity under requisite long-term contract arrangements.
Another significant regulatory risk relates to changes that may occur with regard to the CCE Bond amount.
Currently, the $100,000 bond amount is quite manageable for aspiring CCE initiatives, but this could change
dramatically in the event that a larger bond amount, based on market conditions at the time of an involuntary
return of customers to bundled service, is established at some point in the future. PEA recommends that the
CCE Study Partners actively monitor and participate in, as necessary, related regulatory proceedings to
ensure that this item does not become a barrier for CCE formation or ongoing operation. As previously noted,
retention of an experienced lobbyist and qualified regulatory expertise will serve to manage and mitigate
the aforementioned risks.
Availability of Requisite Renewable and Carbon-Free Energy Supplies
California’s recent adoption of a 50% RPS has prompted various questions regarding the sufficiency of
renewable generating capacity that may be available to support compliance with such mandates. In
particular, both new and existing CCEs, which will be subject to prevailing RPS procurement mandates,
represent a growing pool of renewable energy buyers that will be “competing” for requisite in-state
resources. While this is certainly a legitimate concern, particularly when considering that the potential for CCE

Draft Silicon Valley Community Choice Energy Technical Study
Section 7: Risk Analysis Page 75
expansion throughout California seems quite significant, it is highly unlikely that any CCE buyer would be
unable to meet applicable procurement mandates during the ten-year planning horizon. To date, renewable
energy contracting opportunities within California have been abundant, providing interested buyers with cost-
competitive procurement opportunities well in excess of compliance mandates and voluntary renewable
energy procurement targets that have been established by certain CCEs. Furthermore, to the extent that
additional CCE programs continue to form, California’s largest buyers of renewable energy, represented by
the three investor-owned utilities, will have diminished renewable energy procurement obligations as a result
of decreasing retail sales. Certainly, the potential exists for increased supply costs as additional CCE buyers
compete for available renewable projects, but the general availability of such projects does not seem to be a
significant issue that will face SVCCE over the ten-year planning horizon. It is also reasonable to assume that
California-based project developers will be competing for buyers in the sense that prospective renewable
development opportunities (i.e., potential renewable generating capacity) may actually exceed statewide
demand. This circumstance has occurred in the past, particularly when California’s largest renewable energy
buyers, the IOUs, have met applicable renewable energy procurement targets – in these instances, project
developers are forced to “compete” for other buyers, including CCEs, which have benefited from very
favorable pricing for both short- and long-term transactions.
Additionally, as the operational and future CCE’s strive to meet high carbon-free energy targets, there is
some uncertainty around the availability of hydroelectric generation resources within California and
throughout the Pacific Northwest to meet such goals. Outside of renewable energy resources, hydroelectric
generation is the lowest cost means of meeting carbon-free objectives (keeping in mind that nuclear
generation will be excluded from SVCCE’s supply portfolio) but also comes with certain variability in supply.
Given the variability of such resources (i.e., wet versus dry year) and unpredictability of the day-to-day
energy deliveries, there is risk in achieving carbon content goals. There is also a cost risk associated with the
transmission of out-of-state hydroelectric generation into California during certain times of the year when
California energy buyers are seeking to import peak hydro season production – this congestion risk could add
significant costs to contracted hydroelectric power. To the extent that necessary hydroelectric power supply is
not available, the CCE program may choose to incorporate additional renewable energy supply, likely at an
increased cost, to ensure that emission reduction commitments can be satisfied.
Market Volatility and Price Risk
Wholesale energy markets are subject to sudden and significant volatility, resulting from myriad factors,
including but not limited to the following: weather, natural disasters, infrastructure outages, legislation and
implementing regulations, and natural gas storage levels. Over the past 24 months (or longer), wholesale
energy prices have fallen to near-historic lows, providing a favorable environment for buyers of electric
energy. An abundance of domestic natural gas supply, particularly shale gas, and strong storage levels have
also suppressed electric energy pricing, which will likely promote the continued trend of relatively low prices
for the foreseeable future. However, unexpected circumstances can impose abrupt changes to available
pricing, which necessitates a thoughtful, disciplined approach to managing such risk. The following figure,
provided by the CAISO, illustrates historic volatility in the wholesale electricity market, including a nearly 40%
reduction in such prices over the past 24 months.35
35 California ISO Q2 2015 Report on Market Issues and Performance, August 17, 2015.

Draft Silicon Valley Community Choice Energy Technical Study
Page 76 Section 7: Risk Analysis
Figure 29: Historical Wholesale Electricity Price Curve
As previously described, a laddered procurement strategy will serve to mitigate wholesale pricing impacts at
any single point in time. Much like dollar cost averaging in the financial sector, laddered procurement
strategies serve to mask the impacts of periodic price spikes and troughs by blending the financial impacts
associated with such changes through a temporally diversified supply portfolio. For example, Table 29
reflects typical guidelines associated with a laddered procurement strategy – such strategies generally
attempt to balance the interests of near-term planning and budgetary certainty while moderating market
price risks at any single point in time. Based on the declining percentages reflected in Table 29, this balance
could be reasonably achieved while allowing for the inclusion of other, future contracting opportunities as well
as planned efficiency and demand-side impacts. Such strategies have been successfully implemented by
other CCE programs and are generally recognized as a prudent planning/procurement strategy. Note that
the percentages reflected in Table 29 may vary in consideration of the buyer’s unique preferences and
tolerance for risk.
Table 29: Indicative Contracting Guidelines under a Laddered Procurement Strategy
Time Horizon Contracting Guideline (Contractual Commitments/Total Energy Need)
Current Year 80% to 100%
Year 2 70% to 100%
Year 3 60% to 95%
Year 4 and Beyond Up to 70%
This procurement strategy should also create a certain level of symmetry with market impacts that would also
affect incremental procurement completed by the incumbent utility. Ultimately, there is no mitigation tactic
that could completely insulate the CCE from market price risk, but a diversified supply portfolio, in terms of
transaction timing, fuel sources and contract term lengths, will minimize such risks over time.

Draft Silicon Valley Community Choice Energy Technical Study
Section 8: CCE Formation Activities Page 77
SECTION 8: CCE FORMATION ACTIVITIES
This section provides a high level summary of the main steps involved in forming a CCE program that
culminates in the provision of service to enrolled customers. Key implementation activities include those related
to 1) CCE entity formation; 2) regulatory requirements; 3) procurement; 4) financing; 5) organization; and 6)
customer noticing. Completion of these activities is reflected in the Study’s startup cost estimates.
CCE Entity Formation
Unless the municipal organization that will legally register as the CCE entity already exists, it must be legally
established. Municipalities electing to offer or allow others to offer CCE service within their jurisdiction must
do so by ordinance. As anticipated for SVCCE, a joint power authority (“JPA”), the members of which will
include certain or all municipal jurisdictions currently represented amongst the CCE Study Partners, will be
formed via a related agreement amongst the participating municipalities. Specific examples of applicable
JPA agreements are available for currently operating CCE programs, including MCE and SCP, which were
formed under this joint structure. Based on PEA’s understanding, specific details related to SVCCE’s JPA
agreement are being developed.
Regulatory Requirements
Before aggregating customers, the CCE program must meet certain requirements set forth by the CPUC. In the
case of SVCCE, an Implementation Plan must be adopted by the joint powers authority, and that
Implementation Plan must be submitted to the CPUC. The Implementation Plan must include the following:
An organizational structure of the program, its operations, and its funding;
Ratesetting and other costs to participants;
Provisions for disclosure and due process in setting rates and allocating costs among participants;
The methods for entering and terminating agreements with other entities;
The rights and responsibilities of program participants, including, but not limited to, consumer
protection procedures, credit issues, and shutoff procedures;
Termination of the program; and
A description of the third parties that will be supplying electricity under the program, including, but
not limited to, information about financial, technical, and operational capabilities.
A Statement of Intent must be included with the Implementation Plan that provides for:
Universal access
Reliability
Equitable treatment of all classes of customers
Any requirements established by law or the CPUC concerning aggregated service.
The CPUC has ninety days to complete a review and certify the Implementation Plan though previous
Implementation Plan reviews completed on behalf of other California CCE programs have required far less
time. Following certification of the Implementation Plan, the CCE entity must submit a registration packet to
the CPUC, which includes:
An executed service agreement with PG&E, which may require a security deposit; and
Draft Silicon Valley Community Choice Energy Technical Study
Page 78 Section 8: CCE Formation Activities
A bond or evidence of sufficient insurance to cover any reentry fees that may be imposed against it
by the CPUC for involuntarily returning customers to PG&E service. As previously noted, the current
CCE bond amount is $100,000.
The CCE program would be required to participate in the CPUC’s resource adequacy program before
commencing service to customers by providing load forecasts and advance demonstration of resource
adequacy compliance. More specifically, a start-up CCE program would be required to file a formal load
forecast with the CEC upon execution of a primary supply contract, which triggers a 100% commitment to
program launch.
Procurement
Power supplies must be secured several months in advance of commencing service. Power purchase
agreements with one or more power suppliers would be negotiated, typically following a competitive
selection process. Services that are required include provision of energy, capacity, renewable energy and
scheduling coordination. Once a firm commitment to offering CCE service is made, typically through execution
of power supply contracts, the CCE should provide its inaugural load forecast to the California Energy
Commission to initiate determination of the applicable resource adequacy requirements (i.e., capacity) for the
first year of operation.
Financing
Funding must be obtained to cover start-up activities and working capital needs. Start-up funding would be
secured early in the implementation process as these funds would be needed to conduct the critical activities
leading up to service commencement. Working capital lender commitments should be secured well in
advance, but actual funding need not occur until near the time that service begins.
Organization
Initial staff positions would be filled several months in advance of service commencement to conduct the
implementation process. Initially, internal staff of the CCE program may be relatively small but this would
likely change in the event that the CCE determines to insource various administrative and operational
responsibilities and/or develops and administers new programs for its customers. Contracts with other service
providers, such as for data management services, would be negotiated and put into effect well in advance of
service commencement.
Customer Notices
Customers must be provided notices regarding their pending enrollment in the CCE program. Such notices
must contain program terms and conditions as well as opt-out instructions and must be sent to prospective
customers at least twice within the sixty-day period immediately preceding automatic enrollment. These
notices are referred to as “pre-enrollment” notices. Two additional “post-enrollment” notices must be
provided within the sixty-day period following customer enrollment during the statutory opt-out period.
Ratesetting and Preliminary Program Development
As a California CCE, SVCCE would have independent ratesetting authority with regard to the electric
generation charges imposed on its customers. Prior to service commencement, SVCCE would need to establish
initial customer generation rates for each of the customer groups represented in its first operating phase or
for all prospective customers within the CCE’s prospective service territory. SVCCE may decide to create a
schedule of customer generation rates that generally resembles the current rate options offered by PG&E.

Draft Silicon Valley Community Choice Energy Technical Study
Section 8: CCE Formation Activities Page 79
This practice would facilitate customer rate comparisons and should avoid confusion that may occur if
customers were to be transitioned to dissimilar tariff options. SVCCE would need to establish a schedule for
ongoing rate updates/changes for future customer phases and ongoing operations.
SVCCE may also choose to offer certain customer-focused programs, such as Net Energy Metering (“NEM”),
voluntary green pricing and/or FIT programs, at the time of service commencement. To the extent that SVCCE
intends to offer such programs, specific terms and conditions of service would need to be developed in
advance of service commencement.

Draft Silicon Valley Community Choice Energy Technical Study
Page 80 Section 9: Evaluation and Recommendations
SECTION 9: EVALUATION AND RECOMMENDATIONS
This section provides an overall assessment of the feasibility for forming a CCE program serving communities
of the CCE Study Partners and provides PEA’s recommendations in the event a decision is made to proceed
with development of the SVCCE program.
PEA’s analysis suggests that SVCCE could provide significant benefits – both economic and environmental –
which could be accomplished under certain prospective operating scenarios with customer rates that are
competitive, if not lower than, current rate projections for PG&E. Under a reasonable range of sensitivity
assumptions, the analysis shows that customer rates are projected to range from approximately 21 to 23
cents per kWh, on a ten-year levelized cost basis, while PG&E rates are projected to range from 22 to 24
cents per kWh on a levelized basis over this same period of time.
Under base case assumptions, CCE program rates are projected to range from 21.5 cents per kWh to 22.3
cents per kWh, depending upon the ultimate CCE program resource mix. PG&E’s generation rate is projected
to be 22.3 cents per kWh, creating the potential for customer savings under two of the three supply scenarios.
Table 30 shows projected levelized electric rates and typical residential monthly electric bills under the base
case assumptions.
Table 30: Summary of Ratepayer Impacts
Ratepayer Impact Scenario 1 Scenario 2 Scenario 3 PG&E
Levelized Electric Rate (Cents/KWh) 21.5 21.8 22.3 22.3
Typical Residential Bill ($/Month)36 $112 $114 $116 $116
It should be noted that there is considerable overlap in the range of estimated rates under the various
sensitivity scenarios described in this Study, and while base case estimates generally show highly competitive
rates for the CCE program, it is anticipated that Scenarios 1 and 2 are most likely to generate customer rate
savings while Scenario 3 is most likely to result in general cost equivalency over time.
With regard to GHG emissions impacts, the ultimate resource mix identified by the CCE program will dictate
actual GHG emissions impacts created by SVCCE operation. Depending upon resource choices made by the
CCE program, potential GHG emissions may vary widely relative to PG&E. For example, under Scenario 1,
SVCCE should assume zero electric power sector GHG emissions impacts within communities of the CCE Study
Partners. Scenarios 2 and 3 are both expected to create significant GHG emissions reductions through the
procurement of significant quantities of renewable and additional carbon-free energy. Table 31 summarizes
projected GHG emissions impacts for each of the modeled supply scenarios.
36 Average monthly residential electricity consumption within communities of the CCE Study Partners is approximately 510 kWh.
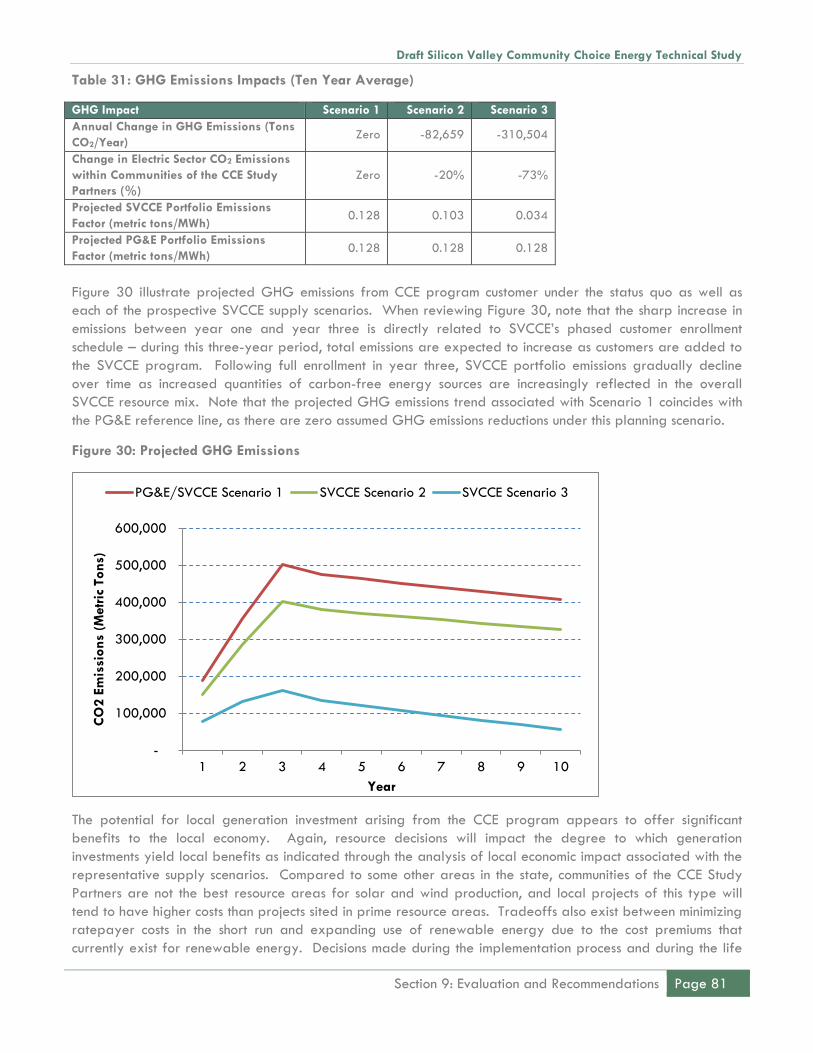
Draft Silicon Valley Community Choice Energy Technical Study
Section 9: Evaluation and Recommendations Page 81
Table 31: GHG Emissions Impacts (Ten Year Average)
GHG Impact Scenario 1 Scenario 2 Scenario 3
Annual Change in GHG Emissions (Tons
CO2/Year) Zero -82,659 -310,504
Change in Electric Sector CO2 Emissions
within Communities of the CCE Study
Partners (%)
Zero -20% -73%
Projected SVCCE Portfolio Emissions
Factor (metric tons/MWh) 0.128 0.103 0.034
Projected PG&E Portfolio Emissions
Factor (metric tons/MWh) 0.128 0.128 0.128
Figure 30 illustrate projected GHG emissions from CCE program customer under the status quo as well as
each of the prospective SVCCE supply scenarios. When reviewing Figure 30, note that the sharp increase in
emissions between year one and year three is directly related to SVCCE’s phased customer enrollment
schedule – during this three-year period, total emissions are expected to increase as customers are added to
the SVCCE program. Following full enrollment in year three, SVCCE portfolio emissions gradually decline
over time as increased quantities of carbon-free energy sources are increasingly reflected in the overall
SVCCE resource mix. Note that the projected GHG emissions trend associated with Scenario 1 coincides with
the PG&E reference line, as there are zero assumed GHG emissions reductions under this planning scenario.
Figure 30: Projected GHG Emissions
The potential for local generation investment arising from the CCE program appears to offer significant
benefits to the local economy. Again, resource decisions will impact the degree to which generation
investments yield local benefits as indicated through the analysis of local economic impact associated with the
representative supply scenarios. Compared to some other areas in the state, communities of the CCE Study
Partners are not the best resource areas for solar and wind production, and local projects of this type will
tend to have higher costs than projects sited in prime resource areas. Tradeoffs also exist between minimizing
ratepayer costs in the short run and expanding use of renewable energy due to the cost premiums that
currently exist for renewable energy. Decisions made during the implementation process and during the life
-
100,000
200,000
300,000
400,000
500,000
600,000
1 2 3 4 5 6 7 8 9 10
CO
2 E
mis
sion
s (M
etr
ic T
ons)
Year
PG&E/SVCCE Scenario 1 SVCCE Scenario 2 SVCCE Scenario 3

Draft Silicon Valley Community Choice Energy Technical Study
Page 82 Section 9: Evaluation and Recommendations
of the CCE program will determine how these considerations are balanced. PEA recommends that
considerable thought be given upfront to the ultimate goals of the CCE program so that clear objectives are
established, giving those responsible for administering the CCE program the opportunity to develop and
execute resource management and procurement plans that meet objectives of the CCE Study Partners.
In summary, it is PEA’s opinion that, based on currently observed wholesale market conditions, anticipated
PG&E electric rates and certain of the supply scenarios evaluated in this Study, amongst various other
considerations, a CCE program serving customers within communities of the CCE Study Partners could offer
both economic (i.e., positive economic development impacts and overall cost savings for customers of the CCE
program) and environmental benefits during initial program operations and, potentially, throughout the ten-
year study period. As previously noted, due to the dynamic nature of California’s energy markets,
particularly market prices which are subject to frequent changes, the SVCCE Partnership should confirm that
the assumptions reflected in this Study generally align with future market conditions (observed at the time of
any decision by the SVCCE Partnership to move forward) to promote the achievement of early-stage SVCCE
operations that generally align with the operating projections reflected in this Study – to the extent that future
market price benchmarks materially differ from any of the assumptions noted in this Study, PEA recommends
updating pertinent operating projections to ensure well-informed decision making and prudent action related
to SVCCE program formation.

Draft Silicon Valley Community Choice Energy Technical Study
Appendix A: SVCCE Pro Forma Analyses Page 83
APPENDIX A: SVCCE PRO FORMA ANALYSES

SILICON VALLEY COMMUNITY CHOICE ENERGY
FINANCIAL PRO FORMA ANALYSIS
SCENARIO 1
CATEGORY YEAR 1 YEAR 2 YEAR 3 YEAR 4 YEAR 5 YEAR 6 YEAR 7 YEAR 8 YEAR 9 YEAR 10
I. CUSTOMER ACCOUNTS:
RESIDENTIAL (E-1) 61,781 124,179 187,200 188,136 189,076 190,022 190,972 191,927 192,886 193,851
SMALL COMMERCIAL (A-1) 5,085 10,221 15,409 15,486 15,563 15,641 15,719 15,798 15,877 15,956
SMALL COMMERCIAL (A-6) 332 667 1,006 1,011 1,016 1,021 1,026 1,032 1,037 1,042
MEDIUM COMMERCIAL (A-10) 716 1,439 2,169 2,180 2,191 2,202 2,213 2,224 2,235 2,247
LARGE COMMERCIAL (E-19) 331 665 1,002 1,007 1,012 1,017 1,022 1,027 1,032 1,037
INDUSTRIAL (E-20) 12 24 37 37 37 37 38 38 38 38
STREET LIGHTING AND TRAFFIC CONTROL (LS-3) 452 908 1,369 1,376 1,383 1,390 1,397 1,404 1,411 1,418
AGRICULTURAL (AG-1B, AG-4A, AG-4B, AG-5A, AG-5B, AG-5C) 267 538 810 814 819 823 827 831 835 839
SUBTOTAL - CUSTOMER ACCOUNTS 68,976 138,642 209,003 210,048 211,098 212,153 213,214 214,280 215,352 216,428
II. LOAD REQUIREMENTS (KWH):
RESIDENTIAL (E-1) 379,302,235 762,397,493 1,149,314,221 1,155,060,792 1,160,836,096 1,166,640,276 1,172,473,478 1,178,335,845 1,184,227,524 1,190,148,662
SMALL COMMERCIAL (A-1) 103,830,975 208,700,259 314,615,641 316,188,719 317,769,663 319,358,511 320,955,304 322,560,080 324,172,881 325,793,745
SMALL COMMERCIAL (A-6) 15,589,202 31,334,295 47,236,450 47,472,633 47,709,996 47,948,546 48,188,289 48,429,230 48,671,376 48,914,733
MEDIUM COMMERCIAL (A-10) 161,290,281 324,193,466 488,721,650 491,165,258 493,621,084 496,089,190 498,569,636 501,062,484 503,567,796 506,085,635
LARGE COMMERCIAL (E-19) 226,157,453 454,576,480 685,274,044 688,700,414 692,143,916 695,604,636 699,082,659 702,578,072 706,090,963 709,621,418
INDUSTRIAL (E-20) 213,906,622 429,952,310 648,153,107 651,393,872 654,650,841 657,924,096 661,213,716 664,519,785 667,842,384 671,181,596
STREET LIGHTING AND TRAFFIC CONTROL (LS-3) 5,830,063 11,718,427 17,665,529 17,753,857 17,842,626 17,931,839 18,021,498 18,111,606 18,202,164 18,293,175
AGRICULTURAL (AG-1B, AG-4A, AG-4B, AG-5A, AG-5B, AG-5C) 18,032,203 36,244,729 54,638,929 54,912,124 55,186,684 55,462,618 55,739,931 56,018,630 56,298,723 56,580,217
SUBTOTAL - LOAD REQUIREMENTS 1,123,939,035 2,259,117,460 3,405,619,571 3,422,647,669 3,439,760,907 3,456,959,711 3,474,244,510 3,491,615,733 3,509,073,811 3,526,619,180
III. CCA OPERATING COSTS ($)
SHORT TERM MARKET PURCHASES $5,041,013 $10,132,991 $14,681,238 $14,891,117 $15,310,728 $15,848,723 $16,237,063 $16,791,157 $17,023,403 $17,414,879
TERM CONTRACT PURCHASES $12,703,352 $61,538,738 $90,598,285 $120,270,043 $122,099,085 $124,231,022 $142,640,040 $143,685,314 $150,230,703 $150,904,675
SHORT TERM RENEWABLE MARKET PURCHASES AND RECS $24,965,932 $23,699,137 $34,635,089 $16,805,807 $21,442,193 $26,684,873 $16,084,761 $23,234,929 $24,503,443 $31,730,964
SHORT TERM CARBON FREE MARKET PURCHASES $13,777,449 $31,618,914 $53,529,156 $58,123,045 $59,786,581 $61,774,017 $63,729,119 $65,508,621 $65,957,309 $66,808,386
ANCILLARY SERVICES AND CAISO CHARGES $3,405,692 $7,075,827 $10,997,945 $11,428,579 $11,866,795 $12,334,026 $12,821,715 $13,326,878 $13,812,781 $14,335,558
RESOURCE ADEQUACY CAPACITY $5,570,842 $9,270,545 $13,329,099 $13,009,335 $13,391,766 $13,788,938 $13,812,953 $14,402,178 $14,745,455 $15,381,372
STAFF AND OTHER OPERATIONS COSTS $7,169,346 $8,517,394 $9,928,752 $10,146,128 $10,368,322 $10,595,445 $10,827,606 $11,064,918 $11,307,498 $11,555,463
BILLING AND DATA MANAGEMENT $1,622,317 $3,358,684 $5,215,112 $5,398,424 $5,588,178 $5,784,603 $5,987,931 $6,198,407 $6,416,281 $6,641,814
UNCOLLECTIBLES EXPENSE $384,599 $789,381 $1,177,893 $1,263,682 $1,312,588 $1,355,208 $1,410,706 $1,471,062 $1,519,984 $1,573,866
STARTUP FINANCING $2,663,926 $2,663,926 $2,663,926 $2,663,926 $2,663,926 $0 $0 $0 $0 $0
CCA BOND CARRYING COST $1,500 $1,500 $1,500 $1,500 $1,500 $1,500 $1,500 $1,500 $1,500 $1,500
SUBTOTAL - CCA OPERATING COSTS $77,305,968 $158,667,037 $236,757,995 $254,001,584 $263,831,662 $272,398,355 $283,553,394 $295,684,964 $305,518,358 $316,348,477
IV. REVENUES FROM GREEN PREMIUM AND MARKET SALES ($)
GREEN PRICING PREMIUM 271,812$ 562,733$ 873,770$ 886,393$ 890,614$ 894,036$ 896,599$ 898,237$ 898,882$ 898,463$
MARKET SALES $0 $0 $0 $0 $0 $0 $0 $0 $0 $0
V. CONTRIBUTION TO PROGRAM RESERVES ($) $3,092,239 $6,346,681 $9,470,320 $10,160,063 $10,553,266 $10,895,934 $11,342,136 $11,827,399 $12,220,734 $12,653,939
VI. CCA REVENUE REQUIREMENT ($) $80,126,394 $164,450,985 $245,354,545 $263,275,255 $273,494,314 $282,400,254 $293,998,932 $306,614,126 $316,840,210 $328,103,953
CCA PROGRAM AVERAGE RATE (CENTS/KWH) 7.1 7.3 7.2 7.7 8.0 8.2 8.5 8.8 9.0 9.3
PG&E AVERAGE GENERATION COST (CENTS/KWH) 9.6 9.7 10.1 10.5 10.7 10.9 11.3 11.6 11.9 12.3
VII. PG&E CCA CUSTOMER SURCHARGES ($)
POWER CHARGE INDIFFERENCE ADJUSTMENT $17,176,539 $34,339,259 $57,624,201 $59,979,592 $68,846,649 $71,301,137 $73,395,868 $72,904,287 $76,084,978 $75,601,919
FRANCHISE FEE SURCHARGE $807,311 $1,645,165 $2,566,976 $2,677,997 $2,765,271 $2,826,865 $2,939,449 $3,028,912 $3,132,039 $3,233,921
SUBTOTAL - PG&E CCA CUSTOMER SURCHARGES 17,983,851$ 35,984,424$ 60,191,178$ 62,657,588$ 71,611,920$ 74,128,002$ 76,335,317$ 75,933,200$ 79,217,017$ 78,835,840$
VIII. CCA REVENUE REQUIREMENT PLUS PG&E CCA CUSTOMER SURCHARGES $98,110,245 $200,435,409 $305,545,722 $325,932,843 $345,106,235 $356,528,255 $370,334,248 $382,547,326 $396,057,227 $406,939,792
IX. REVENUE AT PG&E GENERATION RATES $107,931,990 $219,947,272 $343,187,142 $358,029,788 $369,697,818 $377,932,408 $392,984,207 $404,944,826 $418,732,178 $432,353,066
X. TOTAL CHANGE IN CUSTOMER ELECTRIC CHARGES OR SURPLUS (9,821,745)$ (19,511,863)$ (37,641,419)$ (32,096,944)$ (24,591,584)$ (21,404,153)$ (22,649,959)$ (22,397,500)$ (22,674,951)$ (25,413,274)$
CHANGE IN CUSTOMER ELECTRIC CHARGES OR SURPLUS (%) -4% -4% -5% -4% -3% -3% -3% -3% -3% -3%

SILICON VALLEY COMMUNITY CHOICE ENERGY
FINANCIAL PRO FORMA ANALYSIS
SCENARIO 2
CATEGORY YEAR 1 YEAR 2 YEAR 3 YEAR 4 YEAR 5 YEAR 6 YEAR 7 YEAR 8 YEAR 9 YEAR 10
I. CUSTOMER ACCOUNTS:
RESIDENTIAL (E-1) 61,781 124,179 187,200 188,136 189,076 190,022 190,972 191,927 192,886 193,851
SMALL COMMERCIAL (A-1) 5,085 10,221 15,409 15,486 15,563 15,641 15,719 15,798 15,877 15,956
SMALL COMMERCIAL (A-6) 332 667 1,006 1,011 1,016 1,021 1,026 1,032 1,037 1,042
MEDIUM COMMERCIAL (A-10) 716 1,439 2,169 2,180 2,191 2,202 2,213 2,224 2,235 2,247
LARGE COMMERCIAL (E-19) 331 665 1,002 1,007 1,012 1,017 1,022 1,027 1,032 1,037
INDUSTRIAL (E-20) 12 24 37 37 37 37 38 38 38 38
STREET LIGHTING AND TRAFFIC CONTROL (LS-3) 452 908 1,369 1,376 1,383 1,390 1,397 1,404 1,411 1,418
AGRICULTURAL (AG-1B, AG-4A, AG-4B, AG-5A, AG-5B, AG-5C) 267 538 810 814 819 823 827 831 835 839
SUBTOTAL - CUSTOMER ACCOUNTS 68,976 138,642 209,003 210,048 211,098 212,153 213,214 214,280 215,352 216,428
II. LOAD REQUIREMENTS (KWH):
RESIDENTIAL (E-1) 379,302,235 762,397,493 1,149,314,221 1,155,060,792 1,160,836,096 1,166,640,276 1,172,473,478 1,178,335,845 1,184,227,524 1,190,148,662
SMALL COMMERCIAL (A-1) 103,830,975 208,700,259 314,615,641 316,188,719 317,769,663 319,358,511 320,955,304 322,560,080 324,172,881 325,793,745
SMALL COMMERCIAL (A-6) 15,589,202 31,334,295 47,236,450 47,472,633 47,709,996 47,948,546 48,188,289 48,429,230 48,671,376 48,914,733
MEDIUM COMMERCIAL (A-10) 161,290,281 324,193,466 488,721,650 491,165,258 493,621,084 496,089,190 498,569,636 501,062,484 503,567,796 506,085,635
LARGE COMMERCIAL (E-19) 226,157,453 454,576,480 685,274,044 688,700,414 692,143,916 695,604,636 699,082,659 702,578,072 706,090,963 709,621,418
INDUSTRIAL (E-20) 213,906,622 429,952,310 648,153,107 651,393,872 654,650,841 657,924,096 661,213,716 664,519,785 667,842,384 671,181,596
STREET LIGHTING AND TRAFFIC CONTROL (LS-3) 5,830,063 11,718,427 17,665,529 17,753,857 17,842,626 17,931,839 18,021,498 18,111,606 18,202,164 18,293,175
AGRICULTURAL (AG-1B, AG-4A, AG-4B, AG-5A, AG-5B, AG-5C) 18,032,203 36,244,729 54,638,929 54,912,124 55,186,684 55,462,618 55,739,931 56,018,630 56,298,723 56,580,217
SUBTOTAL - LOAD REQUIREMENTS 1,123,939,035 2,259,117,460 3,405,619,571 3,422,647,669 3,439,760,907 3,456,959,711 3,474,244,510 3,491,615,733 3,509,073,811 3,526,619,180
III. CCA OPERATING COSTS ($)
SHORT TERM MARKET PURCHASES $4,059,363 $8,161,906 $11,803,457 $11,999,206 $12,339,124 $12,774,593 $13,055,640 $13,504,281 $13,694,329 $14,012,698
TERM CONTRACT PURCHASES $10,229,594 $56,571,604 $83,346,275 $112,982,427 $114,610,645 $116,484,213 $134,622,855 $135,402,388 $141,841,435 $142,331,178
SHORT TERM RENEWABLE MARKET PURCHASES AND RECS $35,076,103 $45,044,757 $67,963,379 $48,982,201 $56,858,919 $65,786,260 $59,197,404 $70,642,350 $75,808,294 $87,544,105
SHORT TERM CARBON FREE MARKET PURCHASES $10,013,757 $23,149,763 $39,463,112 $44,779,872 $44,105,738 $43,422,383 $42,427,284 $40,997,517 $38,438,717 $35,815,942
ANCILLARY SERVICES AND CAISO CHARGES $3,405,692 $7,075,827 $10,997,945 $11,428,579 $11,866,795 $12,334,026 $12,821,715 $13,326,878 $13,812,781 $14,335,558
RESOURCE ADEQUACY CAPACITY $5,570,842 $9,270,545 $13,329,099 $13,009,335 $13,391,766 $13,788,938 $13,812,953 $14,402,178 $14,745,455 $15,381,372
STAFF AND OTHER OPERATIONS COSTS $7,169,346 $8,517,394 $9,928,752 $10,146,128 $10,368,322 $10,595,445 $10,827,606 $11,064,918 $11,307,498 $11,555,463
BILLING AND DATA MANAGEMENT $1,622,317 $3,358,684 $5,215,112 $5,398,424 $5,588,178 $5,784,603 $5,987,931 $6,198,407 $6,416,281 $6,641,814
UNCOLLECTIBLES EXPENSE $399,055 $819,072 $1,223,555 $1,306,950 $1,358,967 $1,404,852 $1,463,767 $1,527,695 $1,580,324 $1,638,091
STARTUP FINANCING $2,663,926 $2,663,926 $2,663,926 $2,663,926 $2,663,926 $0 $0 $0 $0 $0
CCA BOND CARRYING COST $1,500 $1,500 $1,500 $1,500 $1,500 $1,500 $1,500 $1,500 $1,500 $1,500
SUBTOTAL - CCA OPERATING COSTS $80,211,494 $164,634,977 $245,936,112 $262,698,547 $273,153,881 $282,376,814 $294,218,655 $307,068,112 $317,646,612 $329,257,722
IV. REVENUES FROM GREEN PREMIUM AND MARKET SALES ($)
GREEN PRICING PREMIUM 209,086$ 432,872$ 672,130$ 695,756$ 684,201$ 670,974$ 655,973$ 639,087$ 620,204$ 599,204$
MARKET SALES $0 $0 $0 $0 $0 $0 $0 $0 $0 $0
V. CONTRIBUTION TO PROGRAM RESERVES ($) $3,208,460 $6,585,399 $9,837,444 $10,507,942 $10,926,155 $11,295,073 $11,768,746 $12,282,724 $12,705,864 $13,170,309
VI. CCA REVENUE REQUIREMENT ($) $83,210,867 $170,787,505 $255,101,426 $272,510,733 $283,395,835 $293,000,912 $305,331,428 $318,711,749 $329,732,273 $341,828,827
CCA PROGRAM AVERAGE RATE (CENTS/KWH) 7.4 7.6 7.5 8.0 8.2 8.5 8.8 9.1 9.4 9.7
PG&E AVERAGE GENERATION COST (CENTS/KWH) 9.6 9.7 10.1 10.5 10.7 10.9 11.3 11.6 11.9 12.3
VII. PG&E CCA CUSTOMER SURCHARGES ($)
POWER CHARGE INDIFFERENCE ADJUSTMENT $17,176,539 $34,339,259 $57,624,201 $59,979,592 $68,846,649 $71,301,137 $73,395,868 $72,904,287 $76,084,978 $75,601,919
FRANCHISE FEE SURCHARGE $807,311 $1,645,165 $2,566,976 $2,677,997 $2,765,271 $2,826,865 $2,939,449 $3,028,912 $3,132,039 $3,233,921
SUBTOTAL - PG&E CCA CUSTOMER SURCHARGES 17,983,851$ 35,984,424$ 60,191,178$ 62,657,588$ 71,611,920$ 74,128,002$ 76,335,317$ 75,933,200$ 79,217,017$ 78,835,840$
VIII. CCA REVENUE REQUIREMENT PLUS PG&E CCA CUSTOMER SURCHARGES $101,194,718 $206,771,929 $315,292,604 $335,168,322 $355,007,755 $367,128,913 $381,666,745 $394,644,949 $408,949,290 $420,664,666
IX. REVENUE AT PG&E GENERATION RATES $107,931,990 $219,947,272 $343,187,142 $358,029,788 $369,697,818 $377,932,408 $392,984,207 $404,944,826 $418,732,178 $432,353,066
X. TOTAL CHANGE IN CUSTOMER ELECTRIC CHARGES OR SURPLUS (6,737,272)$ (13,175,343)$ (27,894,538)$ (22,861,466)$ (14,690,063)$ (10,803,495)$ (11,317,462)$ (10,299,877)$ (9,782,888)$ (11,688,400)$
CHANGE IN CUSTOMER ELECTRIC CHARGES OR SURPLUS (%) -3% -3% -4% -3% -2% -1% -1% -1% -1% -1%
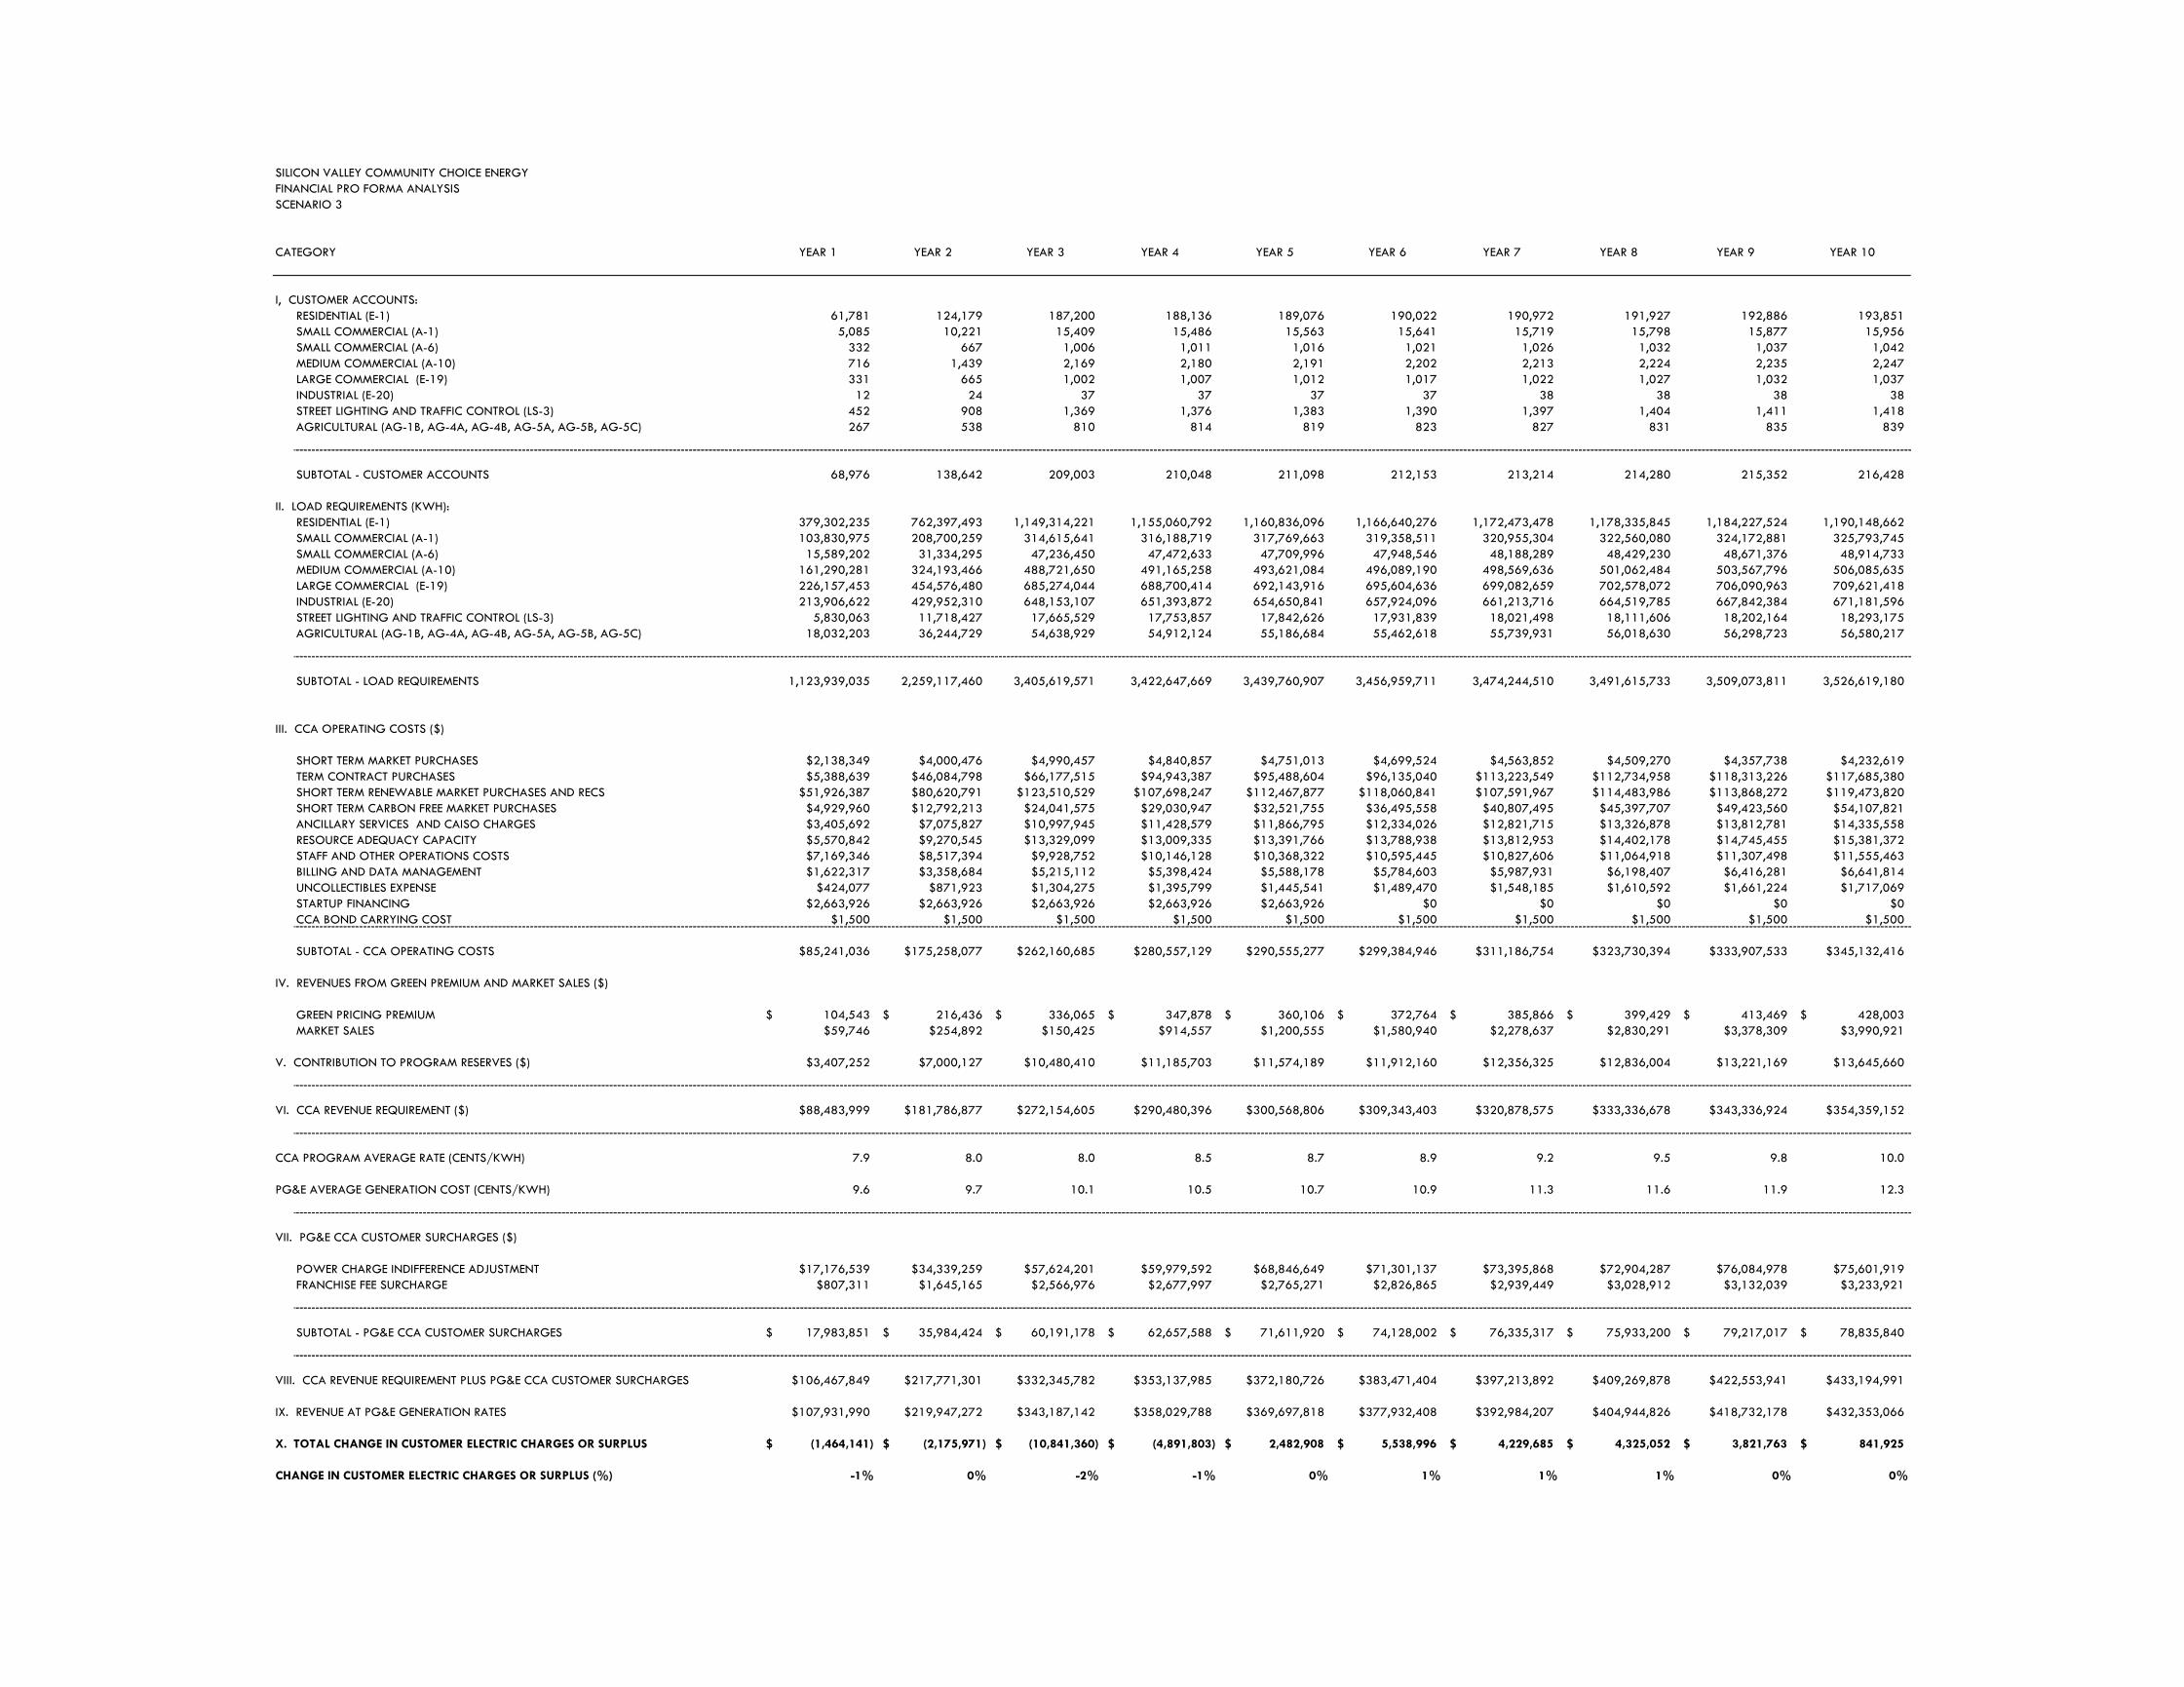
SILICON VALLEY COMMUNITY CHOICE ENERGY
FINANCIAL PRO FORMA ANALYSIS
SCENARIO 3
CATEGORY YEAR 1 YEAR 2 YEAR 3 YEAR 4 YEAR 5 YEAR 6 YEAR 7 YEAR 8 YEAR 9 YEAR 10
I, CUSTOMER ACCOUNTS:
RESIDENTIAL (E-1) 61,781 124,179 187,200 188,136 189,076 190,022 190,972 191,927 192,886 193,851
SMALL COMMERCIAL (A-1) 5,085 10,221 15,409 15,486 15,563 15,641 15,719 15,798 15,877 15,956
SMALL COMMERCIAL (A-6) 332 667 1,006 1,011 1,016 1,021 1,026 1,032 1,037 1,042
MEDIUM COMMERCIAL (A-10) 716 1,439 2,169 2,180 2,191 2,202 2,213 2,224 2,235 2,247
LARGE COMMERCIAL (E-19) 331 665 1,002 1,007 1,012 1,017 1,022 1,027 1,032 1,037
INDUSTRIAL (E-20) 12 24 37 37 37 37 38 38 38 38
STREET LIGHTING AND TRAFFIC CONTROL (LS-3) 452 908 1,369 1,376 1,383 1,390 1,397 1,404 1,411 1,418
AGRICULTURAL (AG-1B, AG-4A, AG-4B, AG-5A, AG-5B, AG-5C) 267 538 810 814 819 823 827 831 835 839
SUBTOTAL - CUSTOMER ACCOUNTS 68,976 138,642 209,003 210,048 211,098 212,153 213,214 214,280 215,352 216,428
II. LOAD REQUIREMENTS (KWH):
RESIDENTIAL (E-1) 379,302,235 762,397,493 1,149,314,221 1,155,060,792 1,160,836,096 1,166,640,276 1,172,473,478 1,178,335,845 1,184,227,524 1,190,148,662
SMALL COMMERCIAL (A-1) 103,830,975 208,700,259 314,615,641 316,188,719 317,769,663 319,358,511 320,955,304 322,560,080 324,172,881 325,793,745
SMALL COMMERCIAL (A-6) 15,589,202 31,334,295 47,236,450 47,472,633 47,709,996 47,948,546 48,188,289 48,429,230 48,671,376 48,914,733
MEDIUM COMMERCIAL (A-10) 161,290,281 324,193,466 488,721,650 491,165,258 493,621,084 496,089,190 498,569,636 501,062,484 503,567,796 506,085,635
LARGE COMMERCIAL (E-19) 226,157,453 454,576,480 685,274,044 688,700,414 692,143,916 695,604,636 699,082,659 702,578,072 706,090,963 709,621,418
INDUSTRIAL (E-20) 213,906,622 429,952,310 648,153,107 651,393,872 654,650,841 657,924,096 661,213,716 664,519,785 667,842,384 671,181,596
STREET LIGHTING AND TRAFFIC CONTROL (LS-3) 5,830,063 11,718,427 17,665,529 17,753,857 17,842,626 17,931,839 18,021,498 18,111,606 18,202,164 18,293,175
AGRICULTURAL (AG-1B, AG-4A, AG-4B, AG-5A, AG-5B, AG-5C) 18,032,203 36,244,729 54,638,929 54,912,124 55,186,684 55,462,618 55,739,931 56,018,630 56,298,723 56,580,217
SUBTOTAL - LOAD REQUIREMENTS 1,123,939,035 2,259,117,460 3,405,619,571 3,422,647,669 3,439,760,907 3,456,959,711 3,474,244,510 3,491,615,733 3,509,073,811 3,526,619,180
III. CCA OPERATING COSTS ($)
SHORT TERM MARKET PURCHASES $2,138,349 $4,000,476 $4,990,457 $4,840,857 $4,751,013 $4,699,524 $4,563,852 $4,509,270 $4,357,738 $4,232,619
TERM CONTRACT PURCHASES $5,388,639 $46,084,798 $66,177,515 $94,943,387 $95,488,604 $96,135,040 $113,223,549 $112,734,958 $118,313,226 $117,685,380
SHORT TERM RENEWABLE MARKET PURCHASES AND RECS $51,926,387 $80,620,791 $123,510,529 $107,698,247 $112,467,877 $118,060,841 $107,591,967 $114,483,986 $113,868,272 $119,473,820
SHORT TERM CARBON FREE MARKET PURCHASES $4,929,960 $12,792,213 $24,041,575 $29,030,947 $32,521,755 $36,495,558 $40,807,495 $45,397,707 $49,423,560 $54,107,821
ANCILLARY SERVICES AND CAISO CHARGES $3,405,692 $7,075,827 $10,997,945 $11,428,579 $11,866,795 $12,334,026 $12,821,715 $13,326,878 $13,812,781 $14,335,558
RESOURCE ADEQUACY CAPACITY $5,570,842 $9,270,545 $13,329,099 $13,009,335 $13,391,766 $13,788,938 $13,812,953 $14,402,178 $14,745,455 $15,381,372
STAFF AND OTHER OPERATIONS COSTS $7,169,346 $8,517,394 $9,928,752 $10,146,128 $10,368,322 $10,595,445 $10,827,606 $11,064,918 $11,307,498 $11,555,463
BILLING AND DATA MANAGEMENT $1,622,317 $3,358,684 $5,215,112 $5,398,424 $5,588,178 $5,784,603 $5,987,931 $6,198,407 $6,416,281 $6,641,814
UNCOLLECTIBLES EXPENSE $424,077 $871,923 $1,304,275 $1,395,799 $1,445,541 $1,489,470 $1,548,185 $1,610,592 $1,661,224 $1,717,069
STARTUP FINANCING $2,663,926 $2,663,926 $2,663,926 $2,663,926 $2,663,926 $0 $0 $0 $0 $0
CCA BOND CARRYING COST $1,500 $1,500 $1,500 $1,500 $1,500 $1,500 $1,500 $1,500 $1,500 $1,500
SUBTOTAL - CCA OPERATING COSTS $85,241,036 $175,258,077 $262,160,685 $280,557,129 $290,555,277 $299,384,946 $311,186,754 $323,730,394 $333,907,533 $345,132,416
IV. REVENUES FROM GREEN PREMIUM AND MARKET SALES ($)
GREEN PRICING PREMIUM 104,543$ 216,436$ 336,065$ 347,878$ 360,106$ 372,764$ 385,866$ 399,429$ 413,469$ 428,003$
MARKET SALES $59,746 $254,892 $150,425 $914,557 $1,200,555 $1,580,940 $2,278,637 $2,830,291 $3,378,309 $3,990,921
V. CONTRIBUTION TO PROGRAM RESERVES ($) $3,407,252 $7,000,127 $10,480,410 $11,185,703 $11,574,189 $11,912,160 $12,356,325 $12,836,004 $13,221,169 $13,645,660
VI. CCA REVENUE REQUIREMENT ($) $88,483,999 $181,786,877 $272,154,605 $290,480,396 $300,568,806 $309,343,403 $320,878,575 $333,336,678 $343,336,924 $354,359,152
CCA PROGRAM AVERAGE RATE (CENTS/KWH) 7.9 8.0 8.0 8.5 8.7 8.9 9.2 9.5 9.8 10.0
PG&E AVERAGE GENERATION COST (CENTS/KWH) 9.6 9.7 10.1 10.5 10.7 10.9 11.3 11.6 11.9 12.3
VII. PG&E CCA CUSTOMER SURCHARGES ($)
POWER CHARGE INDIFFERENCE ADJUSTMENT $17,176,539 $34,339,259 $57,624,201 $59,979,592 $68,846,649 $71,301,137 $73,395,868 $72,904,287 $76,084,978 $75,601,919
FRANCHISE FEE SURCHARGE $807,311 $1,645,165 $2,566,976 $2,677,997 $2,765,271 $2,826,865 $2,939,449 $3,028,912 $3,132,039 $3,233,921
SUBTOTAL - PG&E CCA CUSTOMER SURCHARGES 17,983,851$ 35,984,424$ 60,191,178$ 62,657,588$ 71,611,920$ 74,128,002$ 76,335,317$ 75,933,200$ 79,217,017$ 78,835,840$
VIII. CCA REVENUE REQUIREMENT PLUS PG&E CCA CUSTOMER SURCHARGES $106,467,849 $217,771,301 $332,345,782 $353,137,985 $372,180,726 $383,471,404 $397,213,892 $409,269,878 $422,553,941 $433,194,991
IX. REVENUE AT PG&E GENERATION RATES $107,931,990 $219,947,272 $343,187,142 $358,029,788 $369,697,818 $377,932,408 $392,984,207 $404,944,826 $418,732,178 $432,353,066
X. TOTAL CHANGE IN CUSTOMER ELECTRIC CHARGES OR SURPLUS (1,464,141)$ (2,175,971)$ (10,841,360)$ (4,891,803)$ 2,482,908$ 5,538,996$ 4,229,685$ 4,325,052$ 3,821,763$ 841,925$
CHANGE IN CUSTOMER ELECTRIC CHARGES OR SURPLUS (%) -1% 0% -2% -1% 0% 1% 1% 1% 0% 0%