Embed Size (px)
Citation preview
DRAFT REPORT ON OPTIMAL
GENERATION CAPACITY MIX
FOR
2029-30
FEBRUARY 2019
GOVERNMENT OF INDIA
MINISTRY OF POWER
CENTRAL ELECTRICITY AUTHORITY
DRAFT REPORT
ON
OPTIMAL GENERATION
CAPACITY MIX FOR
2029-30
GOVERNMENT OF INDIA
MINISTRY OF POWER
CENTRAL ELECTRICITY AUTHORITY
DRAFT REPORT ON OPTIMAL GENERATION CAPACITY MIX FOR 2029-30
CENTRAL ELECTRICITY AUTHORITY
Executive Summary
The world today is witnessing several kinds of technological disruptions in
different sectors. One of the likely disruption can be replacement of thermal
based generation with RE generation being complimented with energy storage
technology. This has been possible with the downward trend of cost of solar
panels and newer technology options like battery energy storage systems. In
fact, the reduction in cost projections is very aggressive for battery energy
storage technology so as to render them financially viable. In this context,
planning for optimal generation capacity mix gains tremendous importance
so as the future generation capacity mix will be cost effective as well as
environmental friendly. To achieve the mix, a horizon of 10-12 years is
sufficient to gear up the systems and policies in the right direction. The study
year 2029-30 has been considered keeping this in perspective.
Optimal generation capacity mix is a study primarily aimed at finding out the
least cost optimal generation capacity mix, which may be required to meet
the peak electricity demand and electrical energy requirement of the year
2029-30 as per 19th Electric Power Survey. The study minimizes the total
system cost of generation including the cost of anticipated future investments
while fulfilling all the technical constraints.
The base year of the study has been considered as 2021-22. The installed
capacity projected in the National Electricity Plan (NEP) has been taken as
input to find out the requirement of future generation capacity mix to be built
up till 2029-30. The technical and financial parameters of different generation
technologies have been considered as per National Electricity Plan.
The short term studies to assess the economic hourly generation dispatch
and adequacy of the capacity mix obtained from long term generation
planning studies for critical days of the year 2029-30 have also been carried
out. All the technical/operational characteristics of each individual
generating unit have been adhered to arrive at the adequacy of the generation
capacity mix at least production cost. Due to the technical/operational
constraints, the generation from RE sources may not be fully absorbed in the
system. The study has also been carried out to assess the RE absorption by
reducing presently stipulated technical minimum load of coal based plants.
Sensitivity analysis for contingency scenarios is also carried out by reducing
available energy from RE sources and hydro power plants to test the system
resilience. Impact on CO2 emissions due to part load efficiency loss of coal
based power plants has also been studied.
The study is based on the assumption of a single demand node for the country
and does not consider transmission lines in optimization.
DRAFT REPORT ON OPTIMAL GENERATION CAPACITY MIX FOR 2029-30
CENTRAL ELECTRICITY AUTHORITY
INDEX
Executive Summary ..................................................................................
ACRONYMS ...............................................................................................
1. Introduction ..................................................................................... 1
2. Objective of the Study ...................................................................... 2
3. Why 2029-30? ................................................................................... 3
4. Generation Expansion Planning Tool ................................................. 3
5. Present Installed Capacity ................................................................ 4
6. Generation Capacity mix of the country ............................................ 5
7. Present Load Profile of the country ................................................... 7
8. Optimal Generation Capacity Mix studies for the year 2029-30 ......... 8
8.1. Inputs for the Study ..................................................................... 8
8.2. Battery Energy Storage Systems ................................................ 12
8.3. Results of the Study ................................................................... 13
8.3.1. Long Term studies .............................................................. 13
8.3.2. Short Term studies - (Hourly Generation dispatch) ............. 16
8.3.2.1. Peak Day / Max Energy demand day – 7th October, 2029 17
8.3.2.2. Maximum RE (Wind + Solar) Generation day – 3rd July,
2029 ............................................................................. 19
8.3.2.3. Maximum Solar Generation day – 25th March, 2030 ....... 20
8.3.2.4. Minimum Solar Generation day – 8th August, 2029 ........ 21
8.3.2.5. Minimum Energy Demand Day – 14th December, 2029 ... 22
8.3.2.6. Minimum RE Generation Day – 1st February, 2030 ........ 23
8.3.2.7. Maximum variation in net demand/demand days .......... 24
8.3.3. Study on impact of reducing minimum technical load of coal
plants on RE curtailment ................................................... 25
8.3.4. Impact on CO2 emission due to part load operation of coal
based power plant ............................................................... 27
8.3.5. Sensitivity Analysis ............................................................ 27
8.3.5.1. 10% reduction in Solar and Wind generation during the
week having All-India peak demand day i.e. 7th Oct ....... 28
8.3.5.2. 10% reduction in Solar and Wind generation during the
week having minimum solar and wind generation day i.e.
3rd Feb ........................................................................... 29
8.3.5.3. 6% reduction in hydro generation during the week having
All-India peak demand day i.e. 7th Oct ........................... 30

DRAFT REPORT ON OPTIMAL GENERATION CAPACITY MIX FOR 2029-30
CENTRAL ELECTRICITY AUTHORITY
8.3.5.4. 10% reduction in RE generation and 6% hydro generation
combined together during the week having All-India peak
demand day i.e. 7th Oct ................................................. 31
9. International Commitment - INDC Targets ...................................... 32
10. Projected Achievements of INDCs by 2030 ...................................... 33
10.1. Installed capacity and share of non-fossil fuel ............................ 33
10.2. CO2 emissions from Power Sector by 2030 ................................. 33
11. Conclusions .................................................................................... 34
Annexure-I ............................................................................................ 37

DRAFT REPORT ON OPTIMAL GENERATION CAPACITY MIX FOR 2029-30
CENTRAL ELECTRICITY AUTHORITY
ACRONYMS
ACRONYMS EXPANSION
BMS Battery Management System
BU Billion Unit
CAGR Compound Annual Growth Rate
CERC Central Electricity Regulatory Commission
CO2 Carbon dioxide
CUF Capacity Utilization Factor
EMS Energy Management System
EPS Electric Power Survey
GCF Green Climate Fund
GDP Gross Domestic Product
GW Giga Watt
INDC Intended Nationally Determined Contribution
KGD6 Krishna Godavari Dhirubhai 6
kWh kilowatt hour
LNG Liquefied Natural Gas
LWR Light Water Reactor
MGR Merry Go Round
MNRE Ministry of New and Renewable Energy
MT Million Tonnes
MU Million Unit
MW Mega Watt
NEP National Electricity Plan
O&M Operation and Maintenance
PHWR Pressurized Heavy Water Reactor
PLF Plant Load Factor
PV Photo Voltaic
RE Renewable Energy
RLNG Regasified Liquefied Natural Gas
UNFCCC United Nations Framework Convention on Climate Change

DRAFT REPORT ON OPTIMAL GENERATION CAPACITY MIX FOR 2029-30
CENTRAL ELECTRICITY AUTHORITY 1
1. Introduction
Electricity is one of the key enablers for achieving socio-economic
development of the country. The economic growth leads to growth in
demand of power. Generation capacity augmentation is the most vital
component amongst various modes adopted for meeting the ever-
increasing demand of power to achieve the targeted growth rate. The
capacity addition has to be planned very optimally in view of the limited
available fuel resources for generation and environmental concerns.
After the enactment of Electricity Act, 2003 generation has been delicensed
which has given impetus to the generation capacity addition and led to
huge coal based generation capacity addition during 11th and 12th plan.
India has marched ahead in the Power Sector taking huge strides in every
sector of electricity viz. Generation, Transmission and Distribution. The
per capita electricity consumption has also increased from 592 kWh
during 2003-04 to 1149 kWh during 2017-18. Consequently, the gap
between electricity demand and supply has reduced drastically in the
recent years. Presently, country is having enough generation capacity to
meet its electricity demand. The peak electricity demand and electrical
energy requirement and supply gap is currently only 0.8% and 0.6%
respectively. However, huge capacity addition in the recent years has
raised concerns related to under-utilization of the coal based capacities
leading to stressed assets in the sector. The PLF of coal-based plants has
reduced to 60.67% during 2017-18 from 78.6% during 2007-08.
The world has started focusing on environmental issues, especially climate
change and therefore the idea of growing sustainably has taken centre
stage globally. In view of this, all countries across the globe have been
actively engaged in climate negotiations on different platforms viz.
UNFCCC. Consequently, the world has started moving towards carbon free
energy. India being an active participant globally has also started taking
initiative towards sustainable development and cleaner environment.
Towards realizing the objective of carbon free energy, India has set for itself
a target of installed capacity of 175 GW from Renewable Energy Sources
(RE) by March 2022. To further address the environmental issues arising
from the obnoxious emissions, more efficient supercritical coal based units
are being commissioned and old and inefficient coal based capacity is
being retired. The recent cost trends of RE generation sources have given
them the footing to compete with conventional sources of electricity
generation. Environmental issues along with the reduction in cost of
renewable energy sources (solar PV and wind) have given a push to the
solar and wind based power generation technologies. The capital cost of
renewable (solar PV and wind) technologies for power generation is
DRAFT REPORT ON OPTIMAL GENERATION CAPACITY MIX FOR 2029-30
CENTRAL ELECTRICITY AUTHORITY 2
becoming competitive day by day with the coal based generation. These
technologies are carbon free and will help to achieve the sustainable
development programme of the country. However, the intermittency
associated with the RE technologies is a limitation, which needs to be
addressed in the power system. One of the options which can help in large
scale integration of RE generation sources can be adoption of grid scale
energy storage technologies which can complement RE generation
sources. The cost of battery energy storage systems has been reducing at
a fast pace with the technological advancement and the world is
anticipating that it may help to absorb more RE into the power system in
the foreseeable future.
2. Objective of the Study
To find out the optimal generation capacity mix to meet the projected
peak electricity demand and electrical energy requirement in the year
2029-30 considering possible/feasible technology options,
intermittency associated with Renewable energy sources and
constraints if any, etc.
Optimum generation mix study is an optimization problem for generation
expansion planning, in which the objective function is to minimize:
a. The costs associated with operation of the existing and committed
(planned and under construction) generating stations.
b. The capital cost and operating cost of new generating stations required
for meeting peak electricity demand and electrical energy requirement
while satisfying different constraints in the system such as:
Fuel availability constraints.
Technical operational constraints viz. minimum technical load of
thermal units, ramp rates, startup and shut down time etc.
Financial implications arising out of startup cost, fuel
transportation cost etc.
Intermittency associated with renewable energy generation.
Technologies/Fuel options available for power generation considered in
the study are:
Conventional Sources – Coal and Lignite, Hydro including Pumped
Storage, Nuclear, Natural gas.
New & Renewable Energy Sources- Solar, Wind, Biomass, Small
Hydro, etc.
New Technologies – Grid scale battery energy storage systems.

DRAFT REPORT ON OPTIMAL GENERATION CAPACITY MIX FOR 2029-30
CENTRAL ELECTRICITY AUTHORITY 3
3. Why 2029-30?
To achieve the target of RE installed capacity of 175 GW by 2022, India
has taken several policy initiatives for encouraging investment in RE
Generation sources. National Electricity Plan has also laid its emphasis on
RE integration and detailed studies have been carried out in NEP for the
year 2021-2022 to analyze the power scenario with 175 GW of RE capacity
in the Grid. Further, NEP has also given a perspective scenario for 2026-
27 assuming 100 GW of capacity addition from RE during the period 2022-
27 in view of the consistency in policy push for RE.
India is also working towards low carbon emission path while meeting its
developmental goals. In this regard, India is aiming to have 40 % of the
total installed capacity by the year 2030 based on non-fossil fuel sources
as submitted in Intended Nationally Determined Contributions (INDCs). This
phase of transition warrants a detailed study of the power scenario in the
year 2030.
Also, grid scale battery energy storage technologies have started gaining
popularity globally as their cost of installation has been reducing
drastically over the years. It is expected that battery energy storage
technologies would become financially viable and complement RE as a
prominent generation source in coming years. However, India has a large
fleet of existing pit head coal power plants which provide quite cheap
energy. In view of incoherence between peak demand and RE peak
generation, hydro and flexible coal plants can provide the essential
support for grid stability.
To address the above issues and to optimally utilize the available resources
the least cost generation capacity expansion needs to be planned in
optimum manner to meet the forecasted peak electricity demand and
electrical energy requirement of the country in future. Therefore, there
arises a need for detailed generation expansion planning studies for power
scenario in 2030 where India can take the carbon-free growth path along
with optimizing generation from different sources in most cost-effective
manner. In this context, planning for optimal generation capacity mix
gains tremendous importance so as the future generation capacity mix will
be cost effective as well as environmental friendly. To achieve the mix, a
horizon of 10-12 years is sufficient to gear up the systems and policies in
the right direction. The study year 2029-30 has been considered keeping
this in perspective.
4. Generation Expansion Planning Tool
The optimal generation mix study for the year 2029-30 has been carried
out with the latest state of the art computer planning model namely

DRAFT REPORT ON OPTIMAL GENERATION CAPACITY MIX FOR 2029-30
CENTRAL ELECTRICITY AUTHORITY 4
ORDENA. The model performs generation expansion planning, production
costing and also has the capability of modelling renewable energy sources.
It also optimizes the cost of transportation of fuel and emissions from
power plants. The model optimizes the least cost of energy generation
including the capital investments required for meeting peak electricity
demand and electrical energy requirement by carrying out various
iterations for selecting the most optimal generation capacity mix including
all financial parameters and satisfying technical/operational constraints.
The software also has the capability to carry out hourly economic
generation dispatch considering all the technical constraints associated
with various generation technologies.
The schematic diagram of the software is given as Exhibit 1.
Exhibit 1
5. Present Installed Capacity
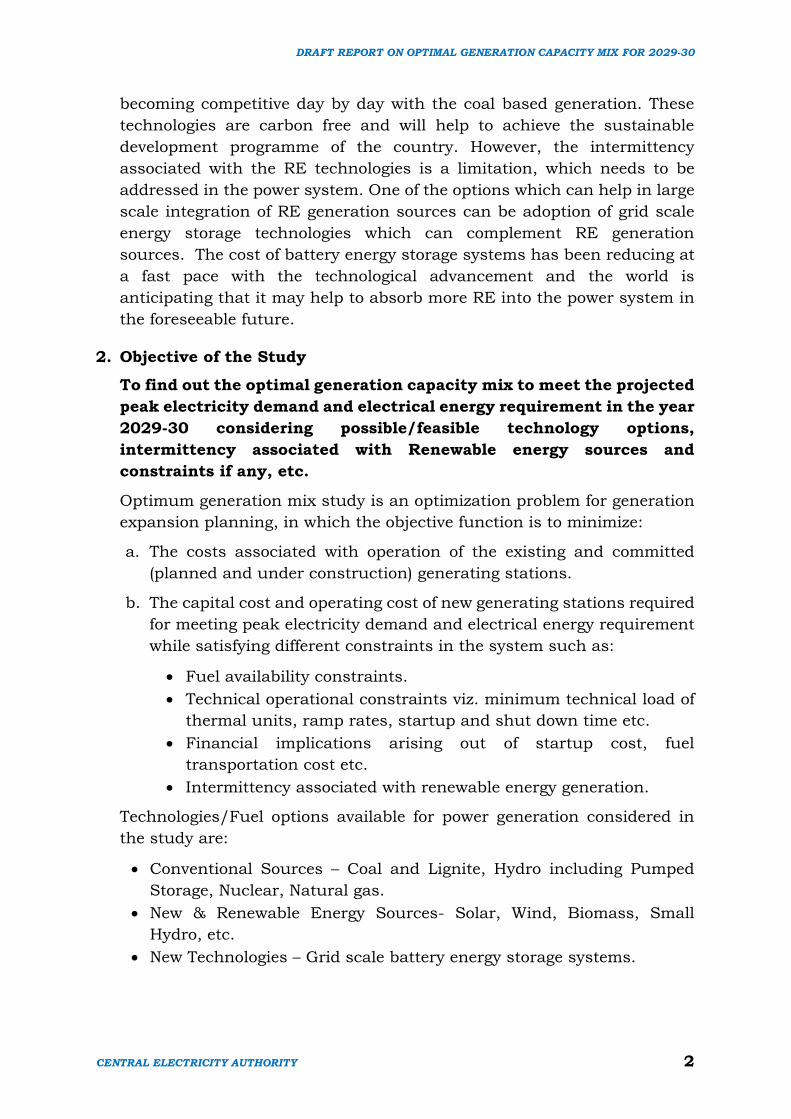
Total Installed Capacity as on 31.01.2019 was 349.2 GW, which comprise
of 45.4 GW from Hydro, 223 GW from Thermal, 74 GW from R.E.S and 6.8
GW from Nuclear. The detailed sector and fuel wise breakup of the total
installed capacity as on 31.01.2019 and energy contribution from different
sources during 2018-19 till 31.12.2018 is given in Table 1 and Exhibit 2
respectively.
DRAFT REPORT ON OPTIMAL GENERATION CAPACITY MIX FOR 2029-30
CENTRAL ELECTRICITY AUTHORITY 5
Table 1
INSTALLED CAPACITY AS ON 31.01.2019
(FIGURES IN MW)
Sector Hydro Thermal
Nuclear R.E.S
(MNRE) Total
Coal Lignite Gas Diesel Total
STATE 29878.8 63056.5 1290.0 7118.7 363.93 71829.13 0.00 1990.37 103698.30
PRIVATE 3394.0 74316.0 1830.0 10580.6 273.70 87000.30 0.00 70563.99 160958.29
CENTRAL 12126.4 53720.0 3240.0 7237.9 0.00 64197.91 6780.00 1527.30 84631.63
TOTAL 45399.2 191092.5 6360.0 24937.2 637.63 223027.34 6780.00 74081.66 349288.22
% 13.0 54.7 1.8 7.1 0.18 63.85 1.94 21.21 100.00
NOTE:- I ) I.C. DOES NOT INCLUDE BENEFITS FROM PROJECTS IN BHUTAN.
II) R.E.S. INCLUDES SHP – SMALL HYDRO POWER, B.P. – BIOMASS POWER, B.G.- BIOMASS GASIFIER, U&I – URBAN & INDUSTRIAL WASTE
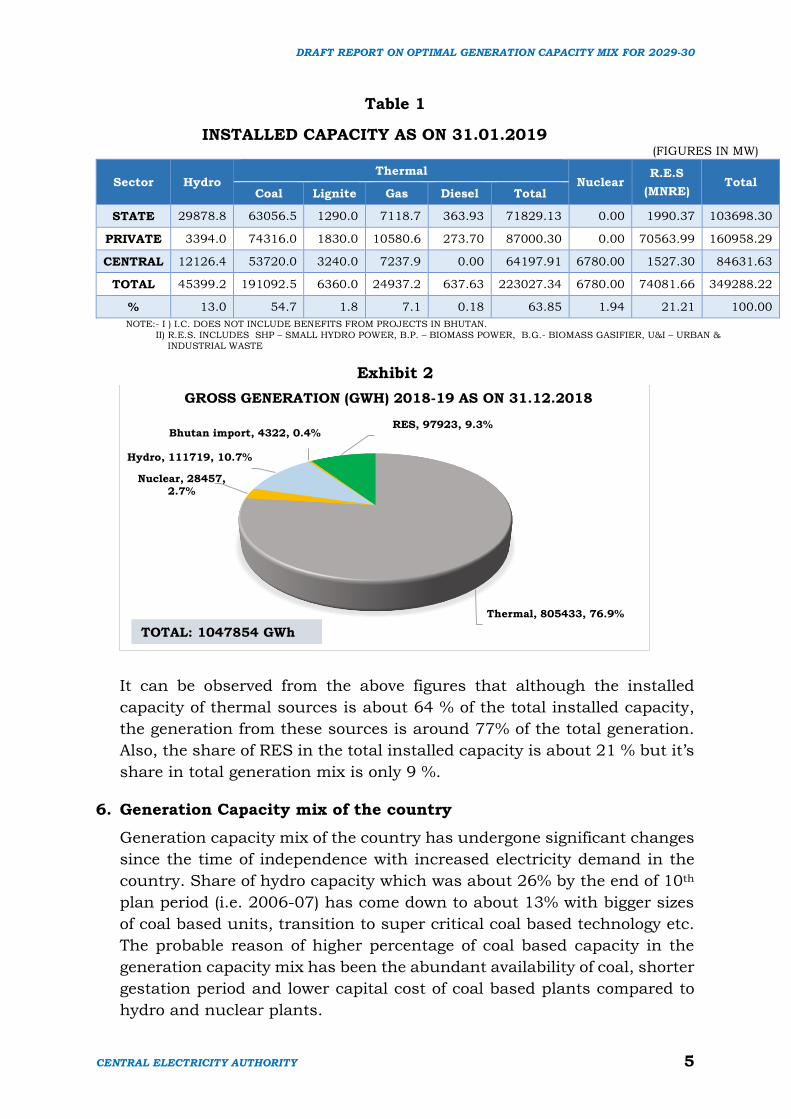
Exhibit 2
It can be observed from the above figures that although the installed
capacity of thermal sources is about 64 % of the total installed capacity,
the generation from these sources is around 77% of the total generation.
Also, the share of RES in the total installed capacity is about 21 % but it’s
share in total generation mix is only 9 %.
6. Generation Capacity mix of the country
Generation capacity mix of the country has undergone significant changes
since the time of independence with increased electricity demand in the
country. Share of hydro capacity which was about 26% by the end of 10th
plan period (i.e. 2006-07) has come down to about 13% with bigger sizes
of coal based units, transition to super critical coal based technology etc.
The probable reason of higher percentage of coal based capacity in the
generation capacity mix has been the abundant availability of coal, shorter
gestation period and lower capital cost of coal based plants compared to
hydro and nuclear plants.
Thermal, 805433, 76.9%
Nuclear, 28457, 2.7%
Hydro, 111719, 10.7%
Bhutan import, 4322, 0.4%RES, 97923, 9.3%
GROSS GENERATION (GWH) 2018-19 AS ON 31.12.2018
TOTAL: 1047854 GWh
DRAFT REPORT ON OPTIMAL GENERATION CAPACITY MIX FOR 2029-30
CENTRAL ELECTRICITY AUTHORITY 6
With the enactment of Electricity Act, 2003, coal based capacity addition
has further got a boost with increased participation of private sector in the
generation segment. Share of private sector in the installed capacity of the
country was about 10% before the Electricity Act, 2003, which has grown
to about 45% by the year 2018. Gas based generation which also started
picking up with new finds of domestic gas, has however slowed down with
the reducing production of KG D6 gas and a significant capacity is
presently stranded due to lack of domestic gas and high cost of imported
LNG. The country’s installed capacity mix also has seen growth in nuclear
based capacity from 4th five-year plan onwards and has grown up to 2% of
the installed capacity by 2018 and further has plans to increase this share.
India being richly endowed with renewable energy sources has made
significant capacity addition in the renewable energy sector in the recent
times. With environmental concerns about climate change gaining
tremendous importance, India has now committed to increase the share
of renewables in an unprecedented manner and committed to increase the
installed capacity of renewables to 175 GW by the year 2021-22.
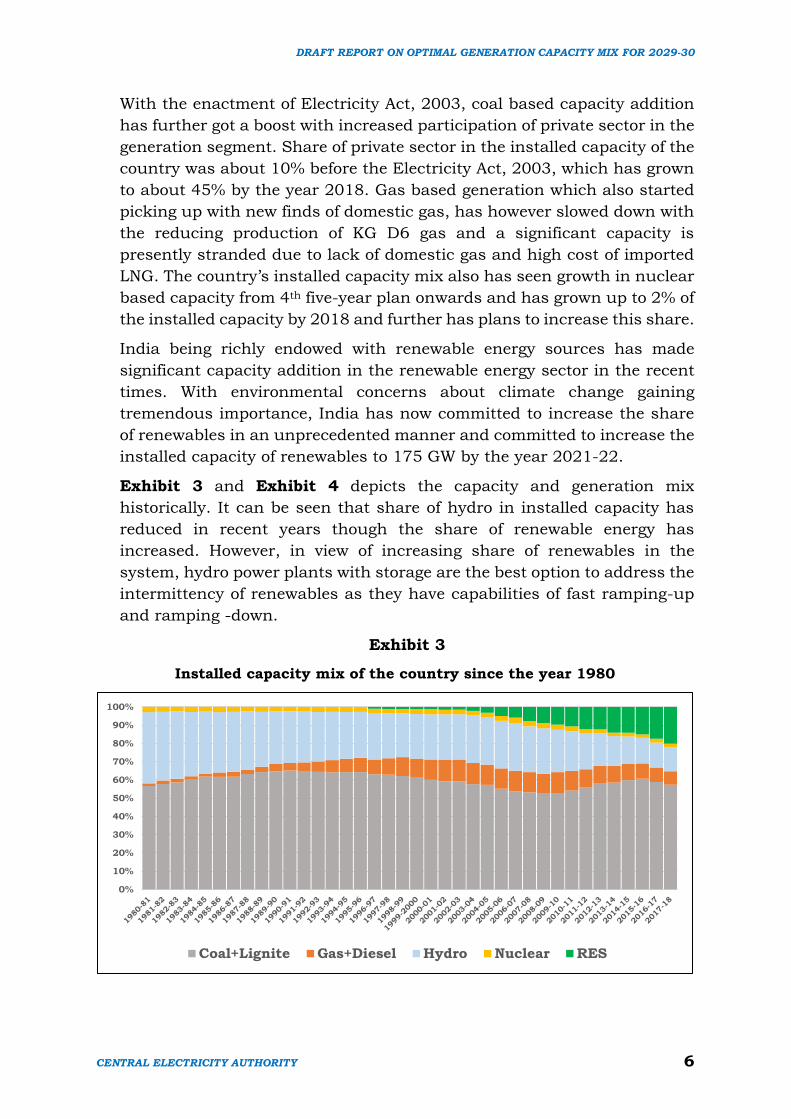
Exhibit 3 and Exhibit 4 depicts the capacity and generation mix
historically. It can be seen that share of hydro in installed capacity has
reduced in recent years though the share of renewable energy has
increased. However, in view of increasing share of renewables in the
system, hydro power plants with storage are the best option to address the
intermittency of renewables as they have capabilities of fast ramping-up
and ramping -down.
Exhibit 3
Installed capacity mix of the country since the year 1980
0%
10%
20%
30%
40%
50%
60%
70%
80%
90%
100%
Coal+Lignite Gas+Diesel Hydro Nuclear RES
DRAFT REPORT ON OPTIMAL GENERATION CAPACITY MIX FOR 2029-30
CENTRAL ELECTRICITY AUTHORITY 7
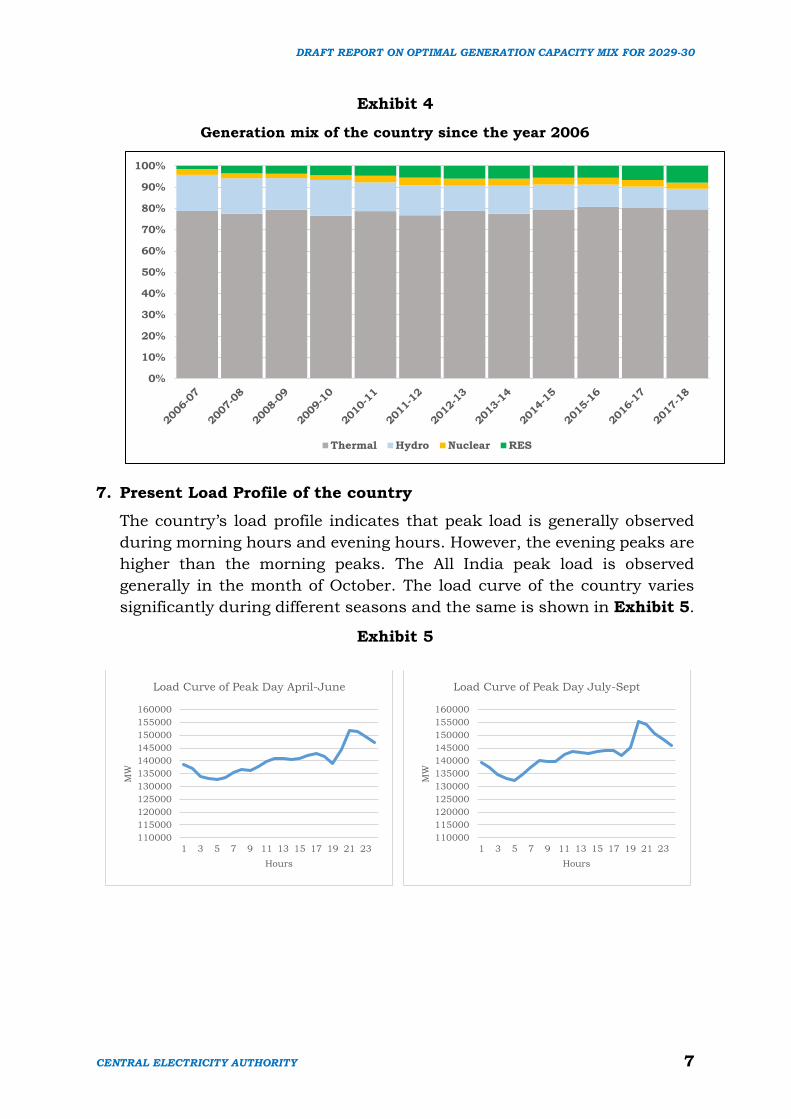
Exhibit 4
Generation mix of the country since the year 2006
7. Present Load Profile of the country
The country’s load profile indicates that peak load is generally observed
during morning hours and evening hours. However, the evening peaks are
higher than the morning peaks. The All India peak load is observed
generally in the month of October. The load curve of the country varies
significantly during different seasons and the same is shown in Exhibit 5.
Exhibit 5
0%
10%
20%
30%
40%
50%
60%
70%
80%
90%
100%
Thermal Hydro Nuclear RES
110000
115000
120000
125000
130000
135000
140000
145000
150000
155000
160000
1 3 5 7 9 11 13 15 17 19 21 23
MW
Hours
Load Curve of Peak Day April-June
110000
115000
120000
125000
130000
135000
140000
145000
150000
155000
160000
1 3 5 7 9 11 13 15 17 19 21 23
MW
Hours
Load Curve of Peak Day July-Sept

DRAFT REPORT ON OPTIMAL GENERATION CAPACITY MIX FOR 2029-30
CENTRAL ELECTRICITY AUTHORITY 8
8. Optimal Generation Capacity Mix studies for the year 2029-30
8.1. Inputs for the Study
i. Studies have been carried out to find out the optimal generation
mix to meet the peak electricity demand and electrical energy
requirement for the year 2029-30 with the objective to minimize
the total system cost subject to various constraints. The
generation capacity mix for the year 2021-22 as projected in
National Electricity Plan (NEP) Vol I (Generation) has been
considered as the base capacity for the study. The base year of
the study has thus been taken as 2021-22. Therefore, the study
period from 2022-23 to 2029-30 has been considered to arrive at
the optimal generation capacity mix for the year 2029-30.
ii. The projected installed capacity of the power plants of the country
by the end of 2021-22 as per NEP is 4,79,419 MW comprising of
51,301 MW Hydro; 2,17,302 MW Coal; 25,736 MW Gas; 10,080
MW Nuclear, 175,000 MW RE has been considered as the base
capacity.
iii. The 19th Electric Power Survey (EPS) projections for peak
electricity demand and electrical energy requirement have been
considered for the studies. Electricity demand assessed by the
110000
115000
120000
125000
130000
135000
140000
145000
150000
155000
160000
1 3 5 7 9 11 13 15 17 19 21 23M
W
Hours
Load Curve of Peak Day Oct-Nov
110000
115000
120000
125000
130000
135000
140000
145000
150000
155000
160000
1 3 5 7 9 11 13 15 17 19 21 23
MW
Hours
Load Curve of Peak Day Dec-Jan
110000
115000
120000
125000
130000
135000
140000
145000
150000
155000
160000
1 3 5 7 9 11 13 15 17 19 21 23
MW
Hours
Load Curve of Peak Day Feb-March

DRAFT REPORT ON OPTIMAL GENERATION CAPACITY MIX FOR 2029-30
CENTRAL ELECTRICITY AUTHORITY 9
19th EPS Report gives the year-wise demand upto 2026-27 and
then long term demand projections of 2031-32 with CAGR for
peak demand and energy requirement. The demand for 2029-30
has been assessed with a CAGR of peak demand of 4.4% and that
of energy requirement of 4.33% from 2027-2032.
iv. The estimated peak electricity demand (MW) and electrical energy
requirement (BU) in the years 2021-22, 2026-27 and 2029-30 are
given in Table 2.
Table 2
Projected Electricity Demand (As per 19th EPS)
Year Electrical Energy
Requirement (BU) Ex Bus
Peak Electricity Demand
(GW)
2021-22 1566 225.751
2026-27 2047 298.774
2029-30 2325 339.973
v. The 19th EPS demand estimates the total demand on the
electricity grid and has considered the energy contribution from
the solar roof-top as negative demand. However, to capture the
hourly and seasonal variation of the grid connected solar roof top
along with grid connected large solar PV plants, the energy
contributed by the solar roof top has been added to the energy
requirement projected by the 19th EPS. It has been estimated that
the energy contribution from the solar roof top during the year
2029-30 is likely to be 75 BU. Therefore, the energy requirement
for the year 2029-30 considered for the study has been taken as
2400 BU. However, the peak load during 2029-30 for the study
has been considered as 340 GW (as per 19th EPS) as there is no
peak contribution from solar roof top (All India peak load occurs
in the evening).
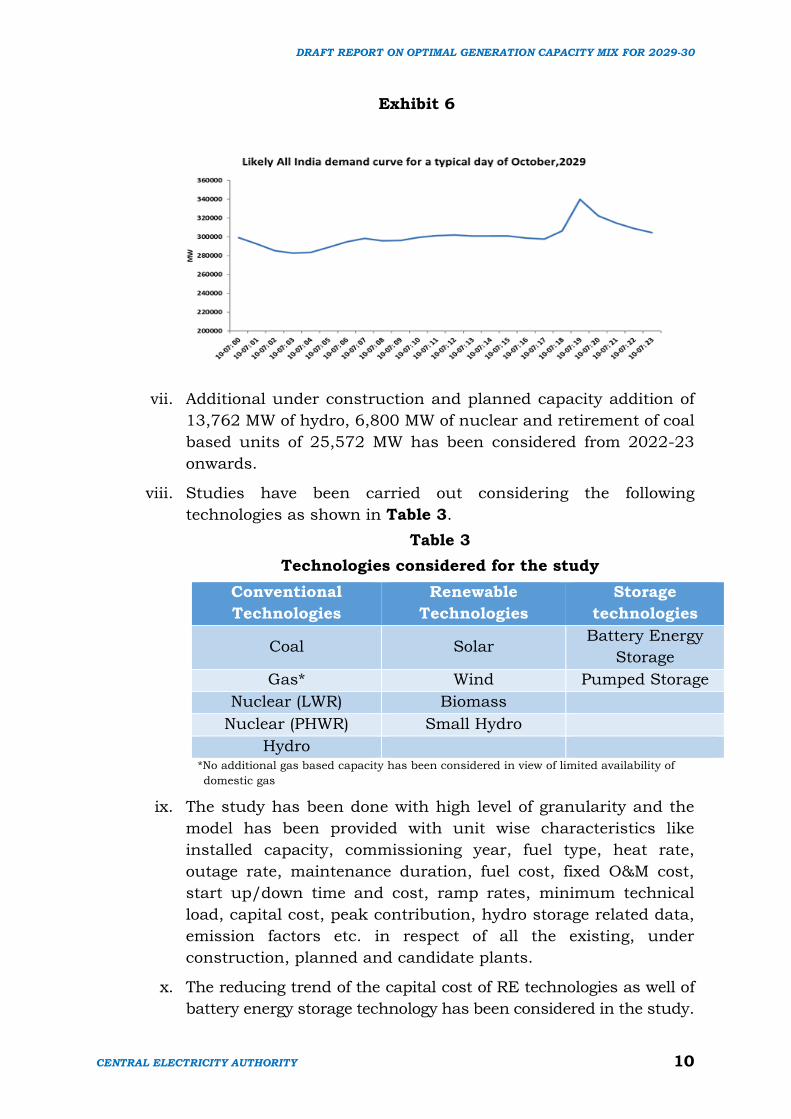
vi. The most important aspect of any generation planning study is
the annual hourly demand projections. Hence, the endeavor has
been to meticulously project hourly demand for the year 2029-30.
In this regard, the hourly demand profiles on all India basis of the
years 2014-15, 2015-16 and 2016-17 have been studied to arrive
at the most probable demand profile and the same has been
extrapolated considering the peak electricity demand and
electrical energy requirement for the study in the year 2029-30.
The likely hourly demand curve for a typical day in October 2029
is shown as Exhibit 6.
DRAFT REPORT ON OPTIMAL GENERATION CAPACITY MIX FOR 2029-30
CENTRAL ELECTRICITY AUTHORITY 10
Exhibit 6
vii. Additional under construction and planned capacity addition of
13,762 MW of hydro, 6,800 MW of nuclear and retirement of coal
based units of 25,572 MW has been considered from 2022-23
onwards.
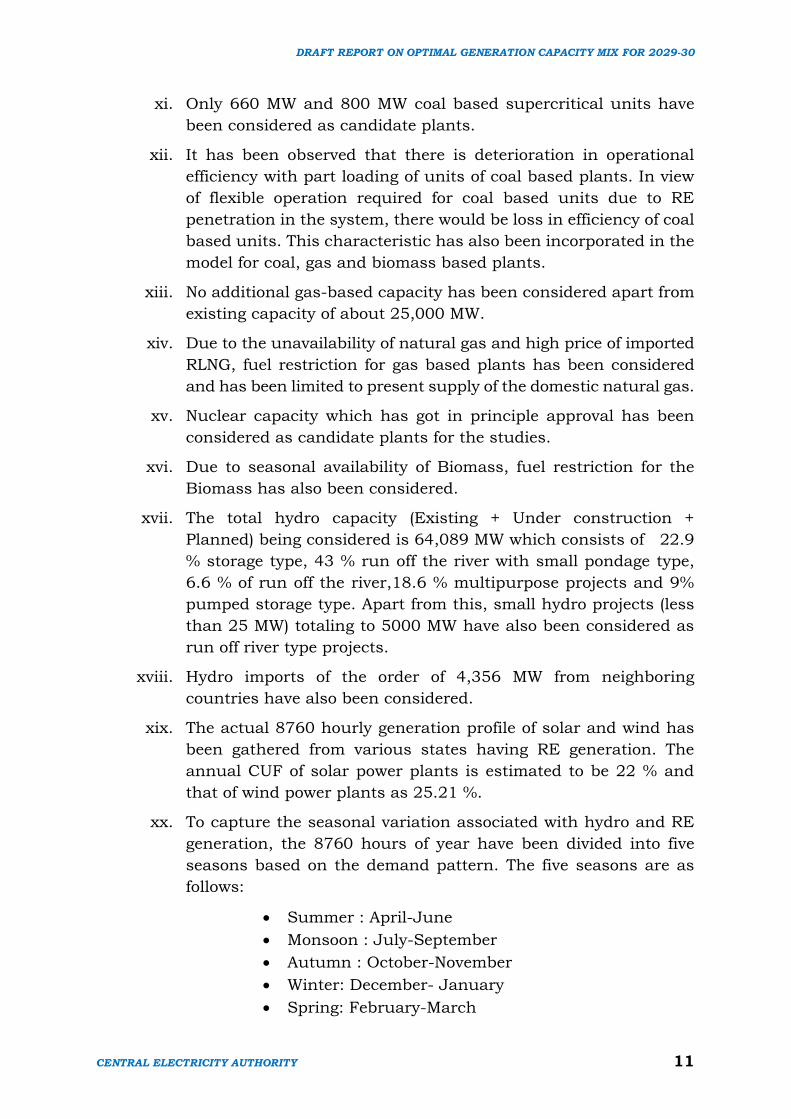
viii. Studies have been carried out considering the following
technologies as shown in Table 3.
Table 3
Technologies considered for the study
Conventional
Technologies
Renewable
Technologies
Storage
technologies
Coal Solar Battery Energy
Storage
Gas* Wind Pumped Storage
Nuclear (LWR) Biomass
Nuclear (PHWR) Small Hydro
Hydro *No additional gas based capacity has been considered in view of limited availability of
domestic gas
ix. The study has been done with high level of granularity and the
model has been provided with unit wise characteristics like
installed capacity, commissioning year, fuel type, heat rate,
outage rate, maintenance duration, fuel cost, fixed O&M cost,
start up/down time and cost, ramp rates, minimum technical
load, capital cost, peak contribution, hydro storage related data,
emission factors etc. in respect of all the existing, under
construction, planned and candidate plants.
x. The reducing trend of the capital cost of RE technologies as well of
battery energy storage technology has been considered in the study.
DRAFT REPORT ON OPTIMAL GENERATION CAPACITY MIX FOR 2029-30
CENTRAL ELECTRICITY AUTHORITY 11
xi. Only 660 MW and 800 MW coal based supercritical units have
been considered as candidate plants.
xii. It has been observed that there is deterioration in operational
efficiency with part loading of units of coal based plants. In view
of flexible operation required for coal based units due to RE
penetration in the system, there would be loss in efficiency of coal
based units. This characteristic has also been incorporated in the
model for coal, gas and biomass based plants.
xiii. No additional gas-based capacity has been considered apart from
existing capacity of about 25,000 MW.
xiv. Due to the unavailability of natural gas and high price of imported
RLNG, fuel restriction for gas based plants has been considered
and has been limited to present supply of the domestic natural gas.
xv. Nuclear capacity which has got in principle approval has been
considered as candidate plants for the studies.
xvi. Due to seasonal availability of Biomass, fuel restriction for the
Biomass has also been considered.
xvii. The total hydro capacity (Existing + Under construction +
Planned) being considered is 64,089 MW which consists of 22.9
% storage type, 43 % run off the river with small pondage type,
6.6 % of run off the river,18.6 % multipurpose projects and 9%
pumped storage type. Apart from this, small hydro projects (less
than 25 MW) totaling to 5000 MW have also been considered as
run off river type projects.
xviii. Hydro imports of the order of 4,356 MW from neighboring
countries have also been considered.
xix. The actual 8760 hourly generation profile of solar and wind has
been gathered from various states having RE generation. The
annual CUF of solar power plants is estimated to be 22 % and
that of wind power plants as 25.21 %.
xx. To capture the seasonal variation associated with hydro and RE
generation, the 8760 hours of year have been divided into five
seasons based on the demand pattern. The five seasons are as
follows:
Summer : April-June
Monsoon : July-September
Autumn : October-November
Winter: December- January
Spring: February-March
DRAFT REPORT ON OPTIMAL GENERATION CAPACITY MIX FOR 2029-30
CENTRAL ELECTRICITY AUTHORITY 12
xxi. The hydro energy availability varies significantly across the years
as it depends on the monsoon rains in a particular year.
Therefore, the actual monthly hydro generation of the existing
hydro power plants for the years 2014-15, 2015-16, 2016-17 and
2017-18 has been studied to account for variation in generation
availability due to the eventualities of draught or excess rainfall
in any particular year. For future hydro power plants, the design
energy/flows in the respective river basin has been considered.
The monthly energy generation has been summed up to arrive at
the seasonal energy. Each season has been further divided into
blocks based on the RE generation profile for increasing the
granularity and precision of the study. The model optimizes
available hydro generation in such a way that maximum benefit
of hydro can be exploited during peak hours along with ensuring
minimum outflow even during off-peak hours. In this context,
both central and state owned hydro power plants have been
assumed to contribute towards grid stability and peaking
requirement of the country.
xxii. Constraint of maximum wind capacity of 140 GW by the year
2029-30 based on the MNRE projection has been considered.
xxiii. Details of the various inputs and assumptions are given in
Annexure-I.
8.2. Battery Energy Storage Systems
The cost of Battery Energy Storage system has been estimated in
study after consultation with the various battery
manufactures/suppliers. The cost of battery energy storage system
considered in the model includes cost of battery, inverter, Battery
and Energy Management Systems and other costs (cabling and
installation costs). The size of the battery estimated by the model is
based on 100% depth of discharge. The actual size of the battery
catering to 80% depth of discharge may be more by 25%. For
modelling purpose the capital cost of the battery has been increased
by 25% to account for the 80% depth of discharge. The cost
trajectory for battery energy storage system is assumed to be
reducing uniformly from ₹ 7 Cr in 2021-22 to ₹ 4.3 Cr in 2029-30
for a 4 hour battery system which also includes an additional cost
of 25% due to depth of discharge. The O&M cost for the battery
energy storage system has been considered as 2%.
DRAFT REPORT ON OPTIMAL GENERATION CAPACITY MIX FOR 2029-30
CENTRAL ELECTRICITY AUTHORITY 13
8.3. Results of the Study
8.3.1. Long Term studies
Studies were carried out with the above inputs/assumptions using
computer model ORDENA to find out the least cost option for system
expansion for the study period beginning from 2022-23 to 2029-30.
The model determines the least cost optimal expansion path to arrive
at the optimal generation capacity mix for all the years till 2029-30,
taking into account all the technical/financial parameters for the
study period.
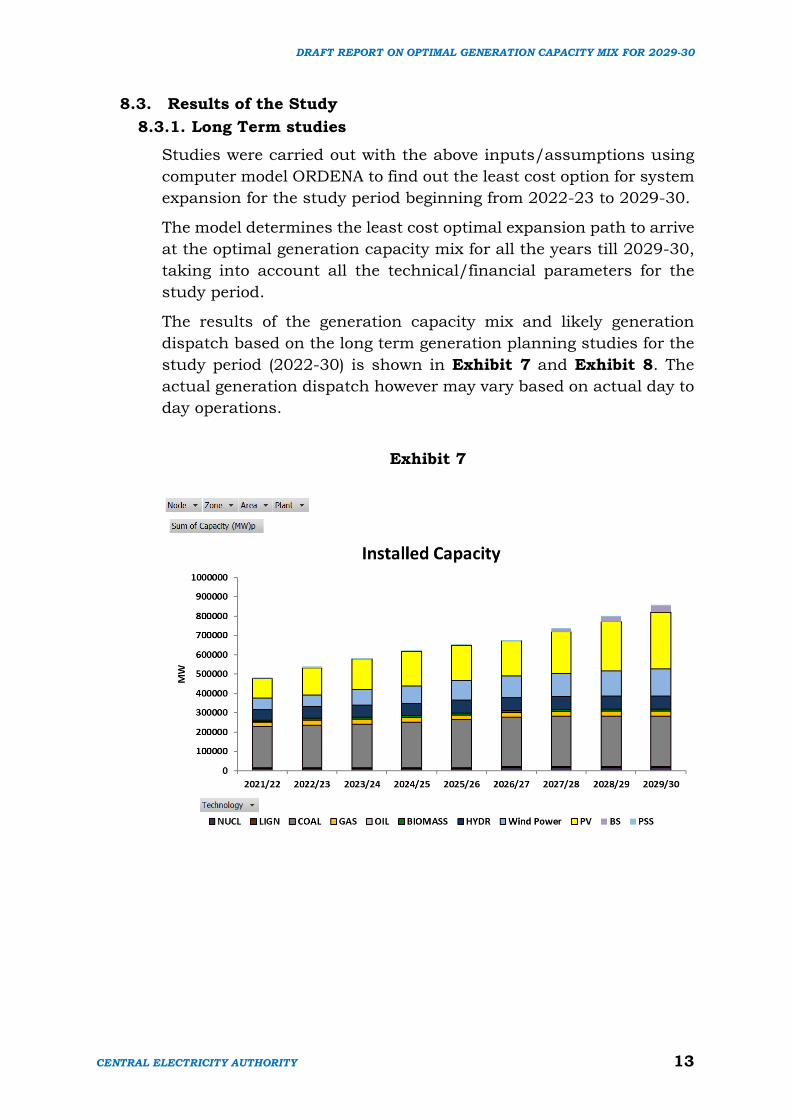
The results of the generation capacity mix and likely generation
dispatch based on the long term generation planning studies for the
study period (2022-30) is shown in Exhibit 7 and Exhibit 8. The
actual generation dispatch however may vary based on actual day to
day operations.
Exhibit 7
DRAFT REPORT ON OPTIMAL GENERATION CAPACITY MIX FOR 2029-30
CENTRAL ELECTRICITY AUTHORITY 14
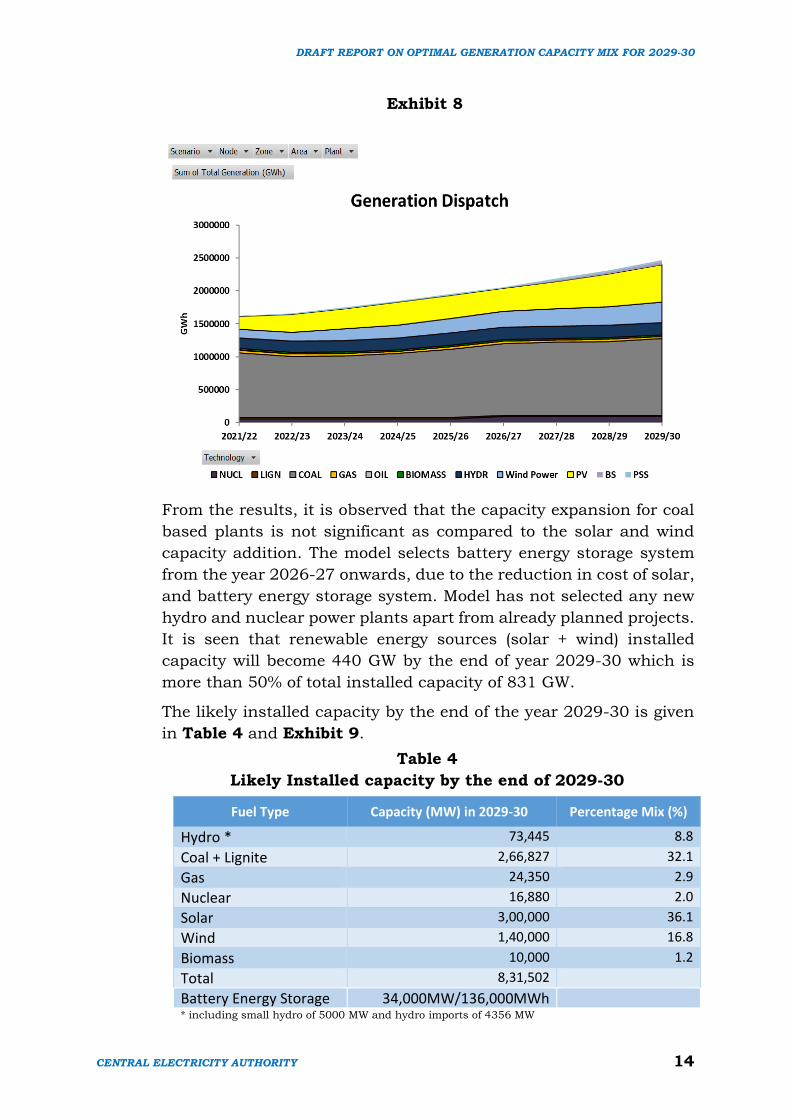
Exhibit 8
From the results, it is observed that the capacity expansion for coal
based plants is not significant as compared to the solar and wind
capacity addition. The model selects battery energy storage system
from the year 2026-27 onwards, due to the reduction in cost of solar,
and battery energy storage system. Model has not selected any new
hydro and nuclear power plants apart from already planned projects.
It is seen that renewable energy sources (solar + wind) installed
capacity will become 440 GW by the end of year 2029-30 which is
more than 50% of total installed capacity of 831 GW.
The likely installed capacity by the end of the year 2029-30 is given
in Table 4 and Exhibit 9.
Table 4
Likely Installed capacity by the end of 2029-30
Fuel Type Capacity (MW) in 2029-30 Percentage Mix (%)
Hydro * 73,445 8.8
Coal + Lignite 2,66,827 32.1
Gas 24,350 2.9
Nuclear 16,880 2.0
Solar 3,00,000 36.1
Wind 1,40,000 16.8
Biomass 10,000 1.2
Total 8,31,502
Battery Energy Storage 34,000MW/136,000MWh * including small hydro of 5000 MW and hydro imports of 4356 MW
DRAFT REPORT ON OPTIMAL GENERATION CAPACITY MIX FOR 2029-30
CENTRAL ELECTRICITY AUTHORITY 15
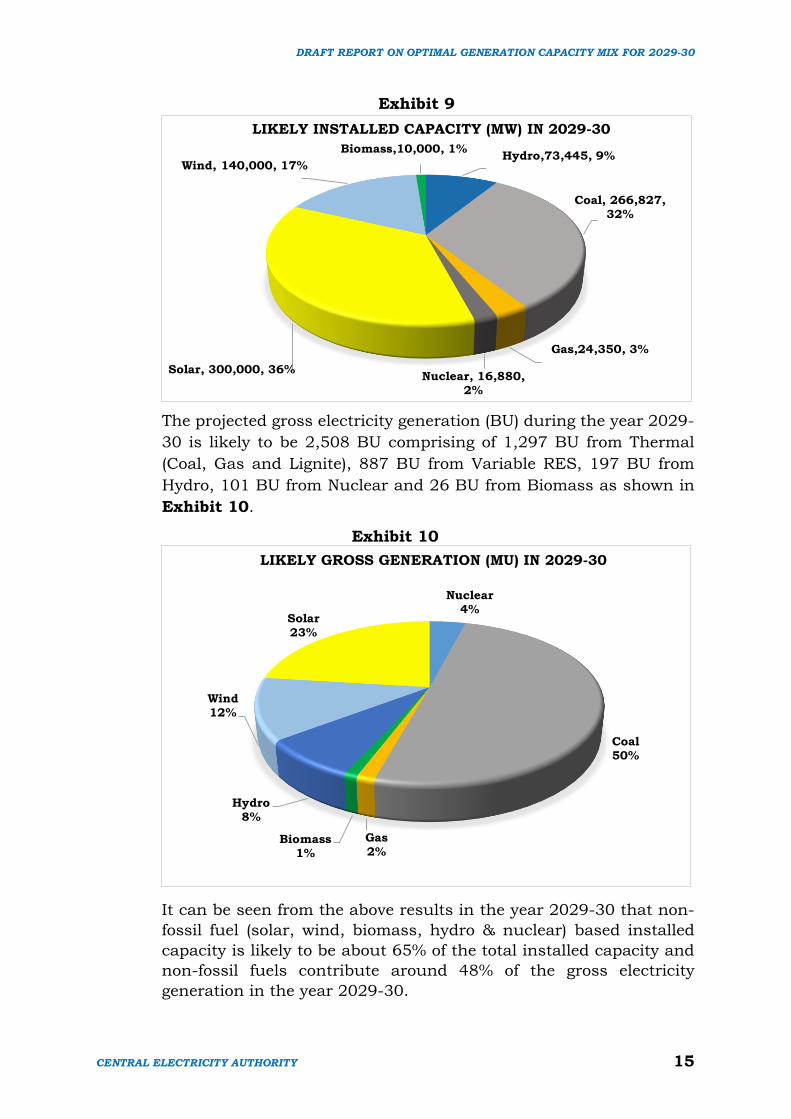
Exhibit 9
The projected gross electricity generation (BU) during the year 2029-
30 is likely to be 2,508 BU comprising of 1,297 BU from Thermal
(Coal, Gas and Lignite), 887 BU from Variable RES, 197 BU from
Hydro, 101 BU from Nuclear and 26 BU from Biomass as shown in
Exhibit 10.
Exhibit 10
It can be seen from the above results in the year 2029-30 that non-
fossil fuel (solar, wind, biomass, hydro & nuclear) based installed
capacity is likely to be about 65% of the total installed capacity and
non-fossil fuels contribute around 48% of the gross electricity
generation in the year 2029-30.
Hydro,73,445, 9%
Coal, 266,827, 32%
Gas,24,350, 3%
Nuclear, 16,880, 2%
Solar, 300,000, 36%
Wind, 140,000, 17%
Biomass,10,000, 1%
LIKELY INSTALLED CAPACITY (MW) IN 2029-30
Nuclear4%
Coal50%
Gas2%
Biomass1%
Hydro8%
Wind12%
Solar23%
LIKELY GROSS GENERATION (MU) IN 2029-30
DRAFT REPORT ON OPTIMAL GENERATION CAPACITY MIX FOR 2029-30
CENTRAL ELECTRICITY AUTHORITY 16
8.3.2. Short Term studies - (Hourly Generation dispatch)
While the long term studies for the year 2029-30 are used to assess
the optimal mix in terms of investment decisions to meet the peak
electricity demand and electrical energy requirement of the system,
the short term generation dispatch studies on hourly basis have been
carried out to assess the adequacy of various capacities to meet the
demand at every instant of time at the lowest possible cost. Although,
the system is to be designed for meeting the peak electricity demand
and electrical energy requirement on a daily basis for the complete
year of 2029-30, short term studies have been carried out on hourly
basis for one week involving the critical days for verifying the
adequacy of capacity worked out in long term planning studies. All
the operational/financial parameters and technical characteristics of
the power plant have been considered for the short term studies also
to arrive at the least cost optimum generation dispatch from the
available capacity on all the critical days.
The critical days are identified by analyzing the likely demand pattern
and likely variable RE (Wind & Solar) generation during the year
2029-30. The critical days identified are maximum peak demand
day, maximum energy demand day, maximum/minimum RE
generation day, maximum/minimum solar generation day, minimum
energy demand day, day with maximum variation in demand/net
demand. The details of typical days identified for the short term
studies are given in Table 5.
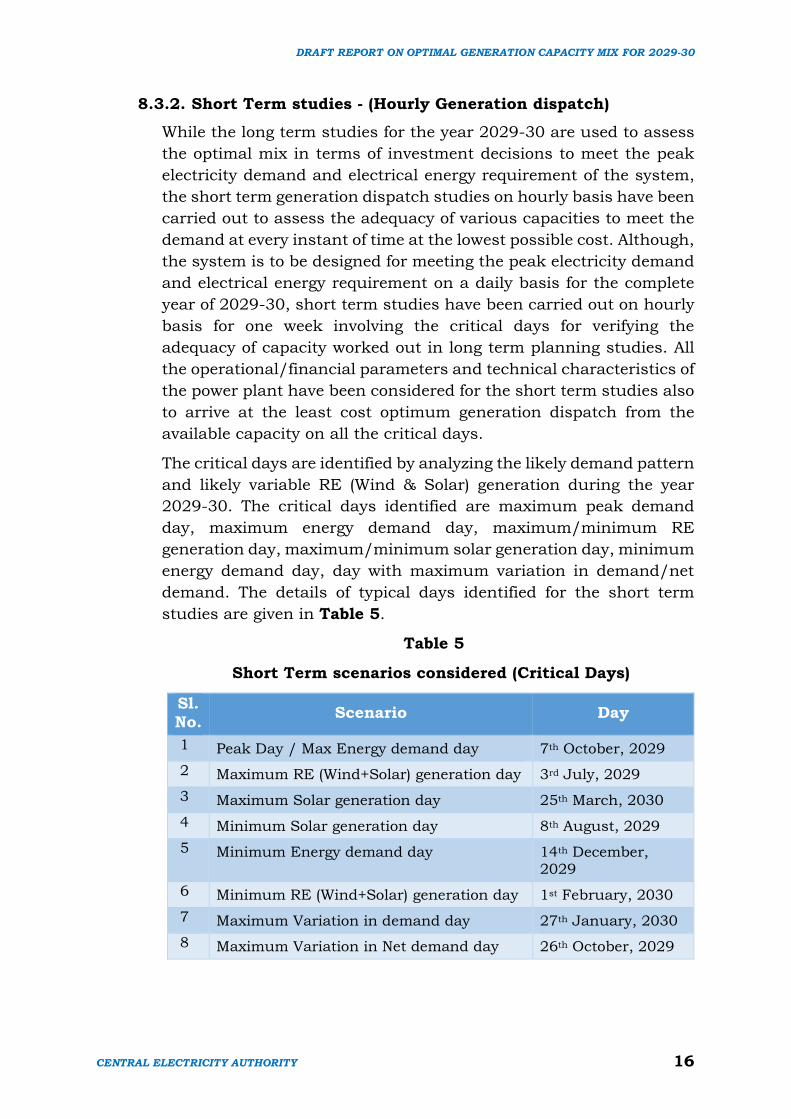
Table 5
Short Term scenarios considered (Critical Days)
Sl. No.
Scenario Day
1 Peak Day / Max Energy demand day 7th October, 2029
2 Maximum RE (Wind+Solar) generation day 3rd July, 2029
3 Maximum Solar generation day 25th March, 2030
4 Minimum Solar generation day 8th August, 2029
5 Minimum Energy demand day 14th December, 2029
6 Minimum RE (Wind+Solar) generation day 1st February, 2030
7 Maximum Variation in demand day 27th January, 2030
8 Maximum Variation in Net demand day 26th October, 2029
DRAFT REPORT ON OPTIMAL GENERATION CAPACITY MIX FOR 2029-30
CENTRAL ELECTRICITY AUTHORITY 17
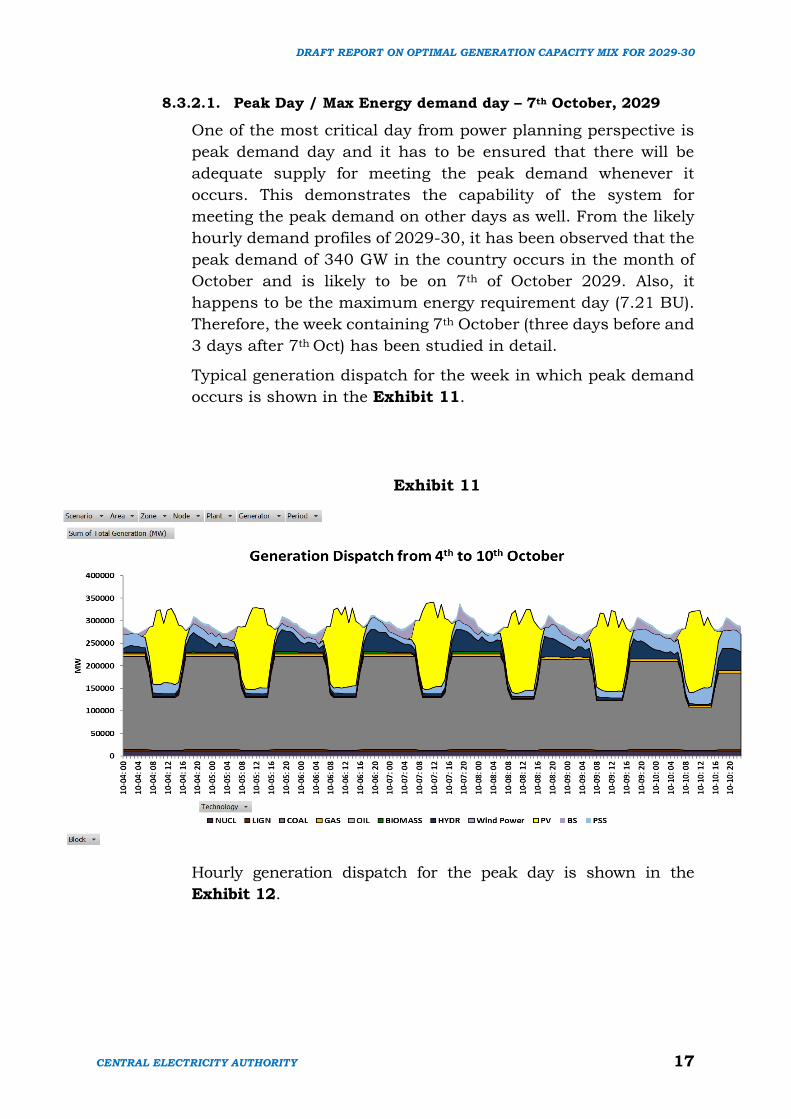
8.3.2.1. Peak Day / Max Energy demand day – 7th October, 2029
One of the most critical day from power planning perspective is
peak demand day and it has to be ensured that there will be
adequate supply for meeting the peak demand whenever it
occurs. This demonstrates the capability of the system for
meeting the peak demand on other days as well. From the likely
hourly demand profiles of 2029-30, it has been observed that the
peak demand of 340 GW in the country occurs in the month of
October and is likely to be on 7th of October 2029. Also, it
happens to be the maximum energy requirement day (7.21 BU).
Therefore, the week containing 7th October (three days before and
3 days after 7th Oct) has been studied in detail.
Typical generation dispatch for the week in which peak demand
occurs is shown in the Exhibit 11.
Exhibit 11
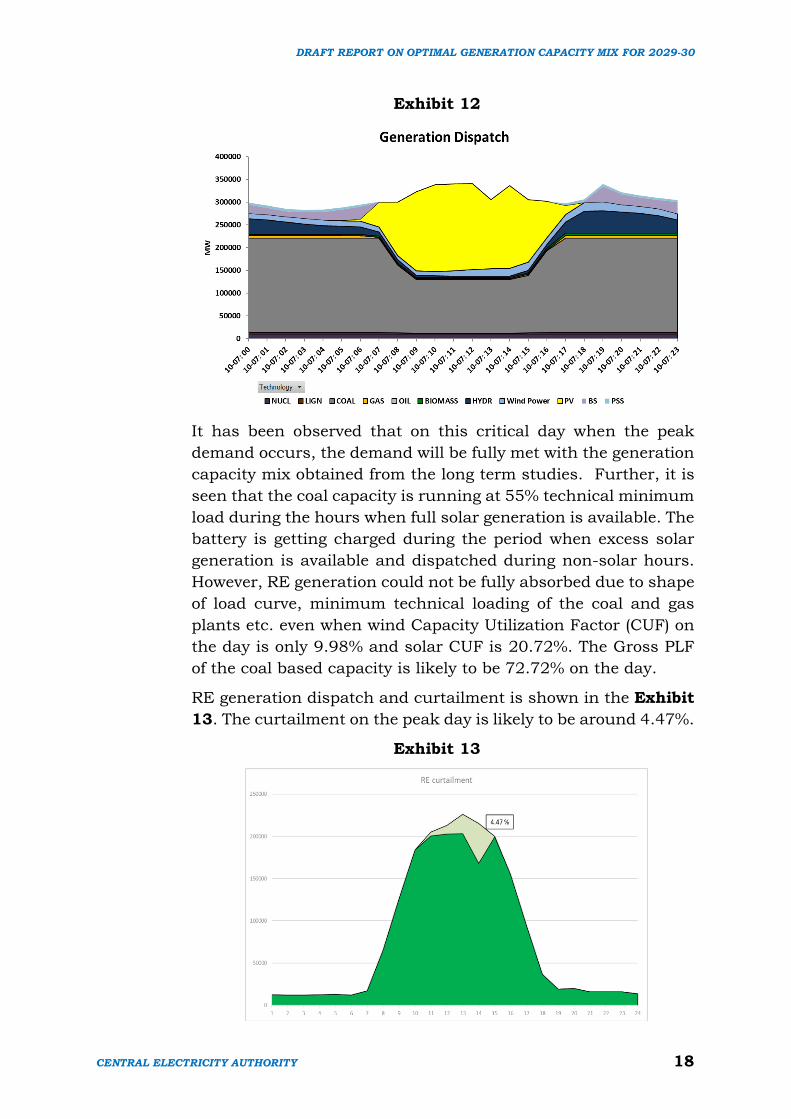
Hourly generation dispatch for the peak day is shown in the
Exhibit 12.
DRAFT REPORT ON OPTIMAL GENERATION CAPACITY MIX FOR 2029-30
CENTRAL ELECTRICITY AUTHORITY 18
Exhibit 12
It has been observed that on this critical day when the peak
demand occurs, the demand will be fully met with the generation
capacity mix obtained from the long term studies. Further, it is
seen that the coal capacity is running at 55% technical minimum
load during the hours when full solar generation is available. The
battery is getting charged during the period when excess solar
generation is available and dispatched during non-solar hours.
However, RE generation could not be fully absorbed due to shape
of load curve, minimum technical loading of the coal and gas
plants etc. even when wind Capacity Utilization Factor (CUF) on
the day is only 9.98% and solar CUF is 20.72%. The Gross PLF
of the coal based capacity is likely to be 72.72% on the day.
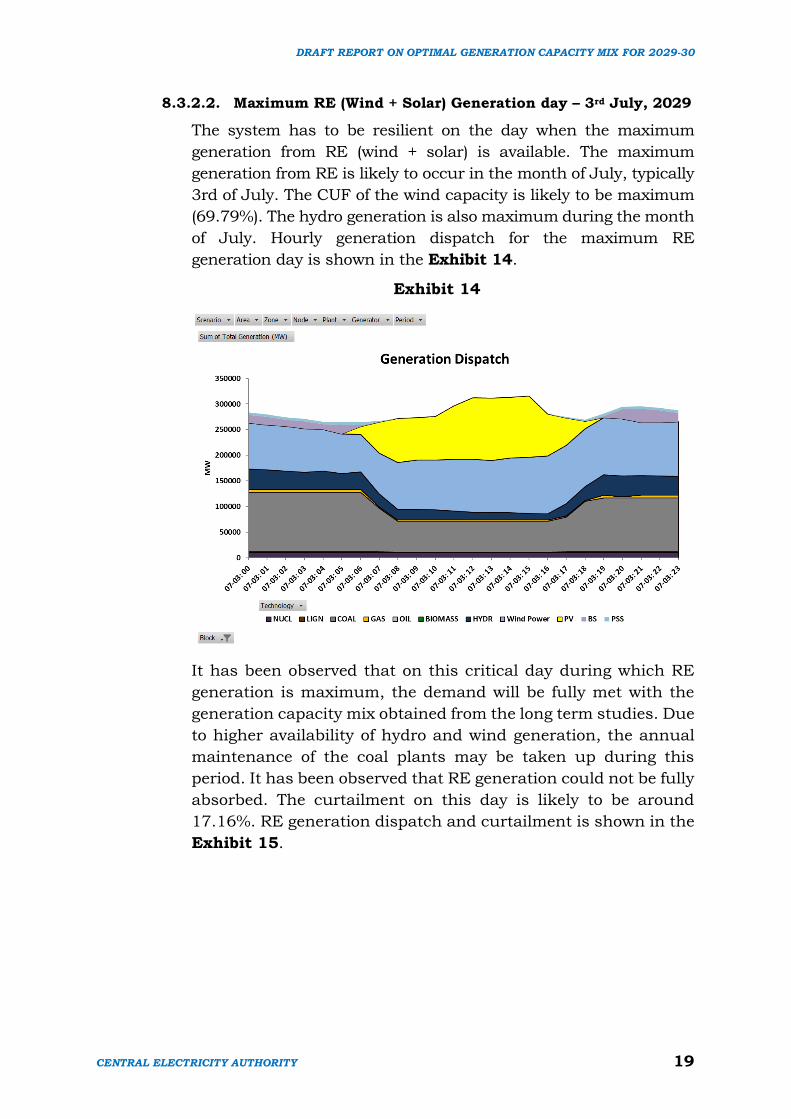
RE generation dispatch and curtailment is shown in the Exhibit
13. The curtailment on the peak day is likely to be around 4.47%.
Exhibit 13
DRAFT REPORT ON OPTIMAL GENERATION CAPACITY MIX FOR 2029-30
CENTRAL ELECTRICITY AUTHORITY 19
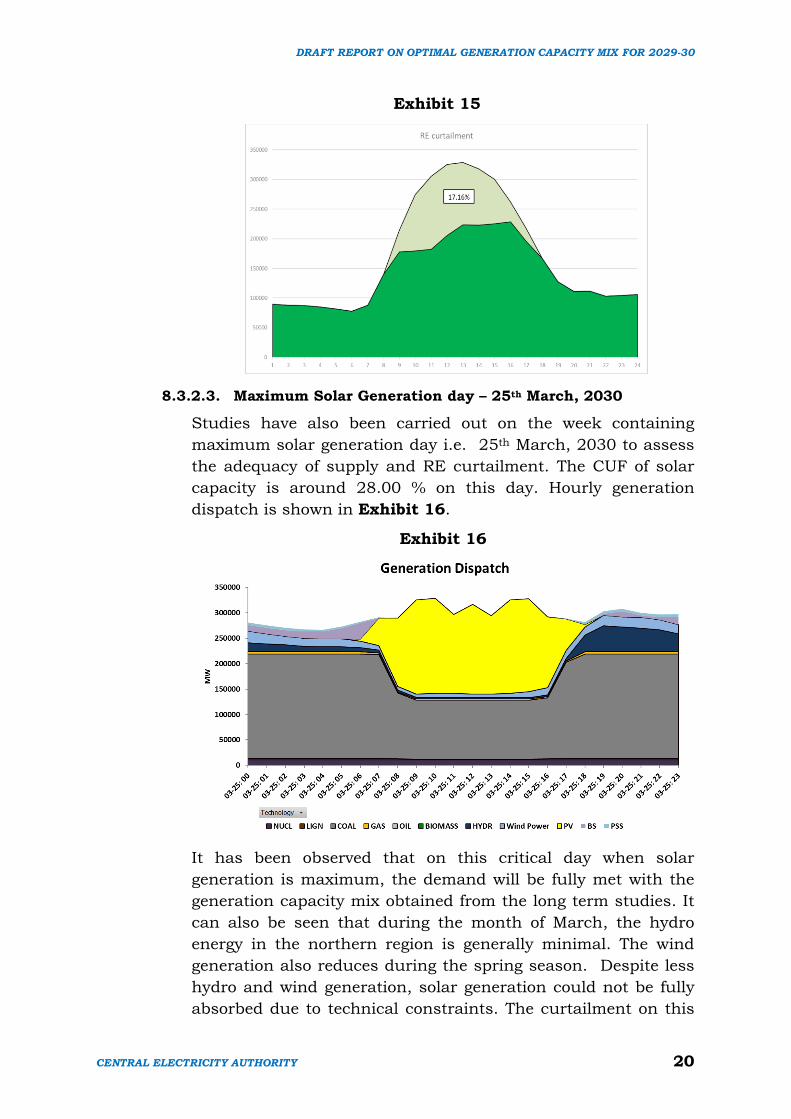
8.3.2.2. Maximum RE (Wind + Solar) Generation day – 3rd July, 2029
The system has to be resilient on the day when the maximum
generation from RE (wind + solar) is available. The maximum
generation from RE is likely to occur in the month of July, typically
3rd of July. The CUF of the wind capacity is likely to be maximum
(69.79%). The hydro generation is also maximum during the month
of July. Hourly generation dispatch for the maximum RE
generation day is shown in the Exhibit 14.
Exhibit 14
It has been observed that on this critical day during which RE
generation is maximum, the demand will be fully met with the
generation capacity mix obtained from the long term studies. Due
to higher availability of hydro and wind generation, the annual
maintenance of the coal plants may be taken up during this
period. It has been observed that RE generation could not be fully
absorbed. The curtailment on this day is likely to be around
17.16%. RE generation dispatch and curtailment is shown in the
Exhibit 15.
DRAFT REPORT ON OPTIMAL GENERATION CAPACITY MIX FOR 2029-30
CENTRAL ELECTRICITY AUTHORITY 20
Exhibit 15
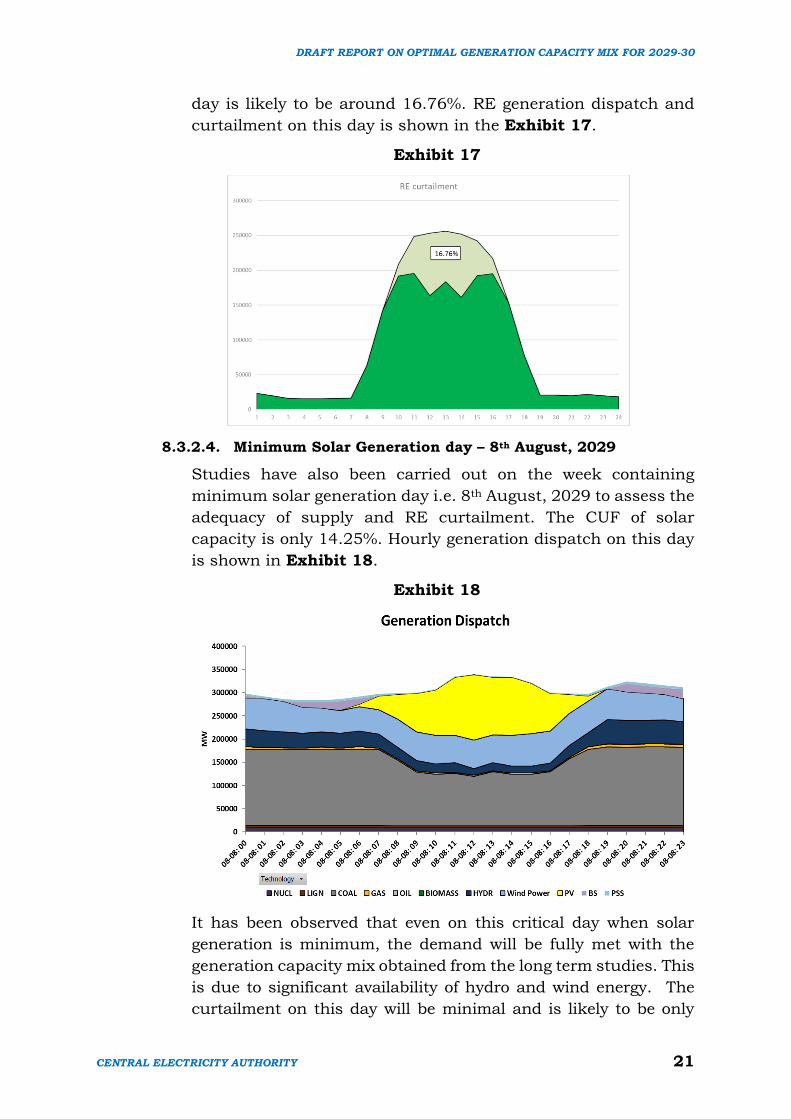
8.3.2.3. Maximum Solar Generation day – 25th March, 2030
Studies have also been carried out on the week containing
maximum solar generation day i.e. 25th March, 2030 to assess
the adequacy of supply and RE curtailment. The CUF of solar
capacity is around 28.00 % on this day. Hourly generation
dispatch is shown in Exhibit 16.
Exhibit 16
It has been observed that on this critical day when solar
generation is maximum, the demand will be fully met with the
generation capacity mix obtained from the long term studies. It
can also be seen that during the month of March, the hydro
energy in the northern region is generally minimal. The wind
generation also reduces during the spring season. Despite less
hydro and wind generation, solar generation could not be fully
absorbed due to technical constraints. The curtailment on this
DRAFT REPORT ON OPTIMAL GENERATION CAPACITY MIX FOR 2029-30
CENTRAL ELECTRICITY AUTHORITY 21
day is likely to be around 16.76%. RE generation dispatch and
curtailment on this day is shown in the Exhibit 17.
Exhibit 17
8.3.2.4. Minimum Solar Generation day – 8th August, 2029
Studies have also been carried out on the week containing
minimum solar generation day i.e. 8th August, 2029 to assess the
adequacy of supply and RE curtailment. The CUF of solar
capacity is only 14.25%. Hourly generation dispatch on this day
is shown in Exhibit 18.
Exhibit 18
It has been observed that even on this critical day when solar
generation is minimum, the demand will be fully met with the
generation capacity mix obtained from the long term studies. This
is due to significant availability of hydro and wind energy. The
curtailment on this day will be minimal and is likely to be only

DRAFT REPORT ON OPTIMAL GENERATION CAPACITY MIX FOR 2029-30
CENTRAL ELECTRICITY AUTHORITY 22
0.93%. RE generation dispatch and curtailment on this day is
shown in the Exhibit 19.
Exhibit 19
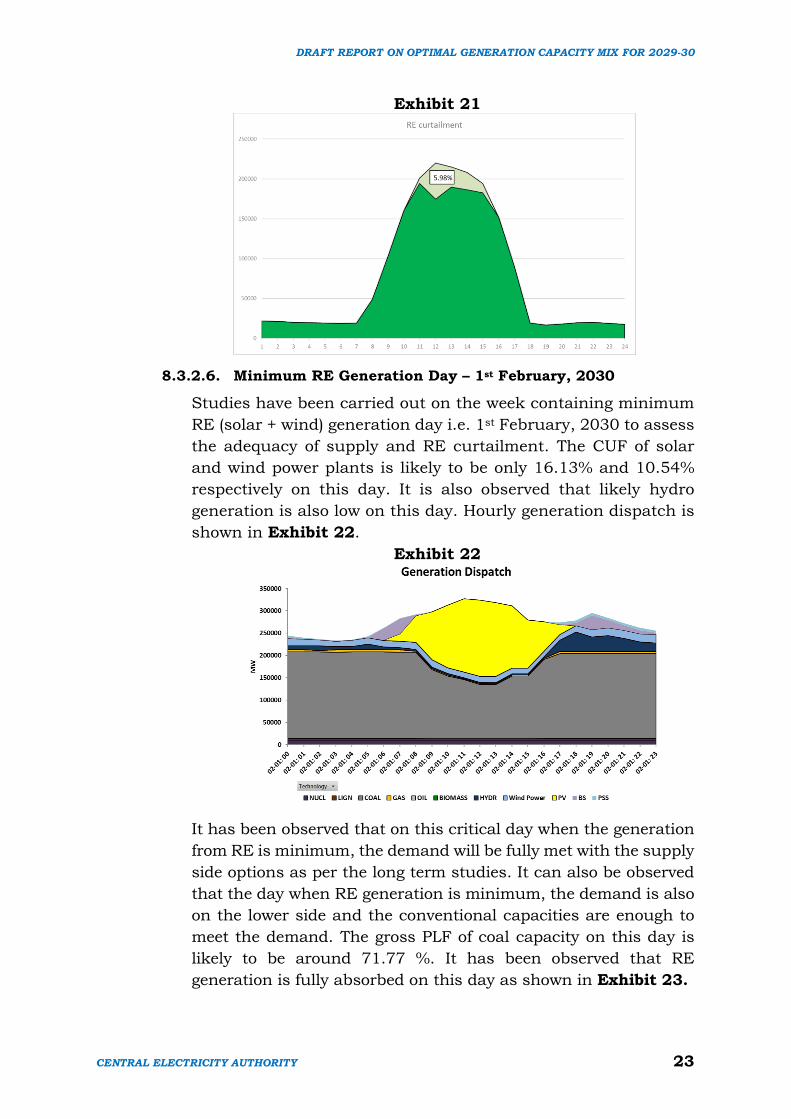
8.3.2.5. Minimum Energy Demand Day – 14th December, 2029
Studies have been carried out on the week containing minimum
energy demand day i.e. 14th December, 2029 to assess the
adequacy of supply and RE curtailment. The energy requirement
is only 6 BU on this day. Hourly generation dispatch is shown in
Exhibit 20.
Exhibit 20
It has been observed that during this critical day when energy
demand of the system is minimum, the demand will be fully met with
the supply side options as per the long term studies. It is observed
that despite hydro and wind generation being less, RE curtailment
on this day is likely to be around 5.98%. RE generation dispatch
and curtailment on this day is shown in the Exhibit 21.
DRAFT REPORT ON OPTIMAL GENERATION CAPACITY MIX FOR 2029-30
CENTRAL ELECTRICITY AUTHORITY 23
Exhibit 21
8.3.2.6. Minimum RE Generation Day – 1st February, 2030
Studies have been carried out on the week containing minimum
RE (solar + wind) generation day i.e. 1st February, 2030 to assess
the adequacy of supply and RE curtailment. The CUF of solar
and wind power plants is likely to be only 16.13% and 10.54%
respectively on this day. It is also observed that likely hydro
generation is also low on this day. Hourly generation dispatch is
shown in Exhibit 22.
Exhibit 22
It has been observed that on this critical day when the generation
from RE is minimum, the demand will be fully met with the supply
side options as per the long term studies. It can also be observed
that the day when RE generation is minimum, the demand is also
on the lower side and the conventional capacities are enough to
meet the demand. The gross PLF of coal capacity on this day is
likely to be around 71.77 %. It has been observed that RE
generation is fully absorbed on this day as shown in Exhibit 23.

DRAFT REPORT ON OPTIMAL GENERATION CAPACITY MIX FOR 2029-30
CENTRAL ELECTRICITY AUTHORITY 24
Exhibit 23
8.3.2.7. Maximum variation in net demand/demand days
Studies have been carried out for the likely days when the
variation in minimum to maximum demand is highest both for
net demand as well as total demand. The hourly generation
dispatch of the day has been studied to assess the ramping
capabilities of the conventional generation to meet the peak
demand. The maximum variation for net demand is likely to
occur on 26th October, 2029 during which the maximum hourly
net demand is 284 GW and minimum hourly net demand is 124
GW. The maximum variation in the total demand is likely to occur
on 27th January, 2030 during which the maximum hourly total
demand is 320 GW and minimum hourly total demand is 231
GW. Hourly generation dispatch is shown in Exhibit 24.
Exhibit 24
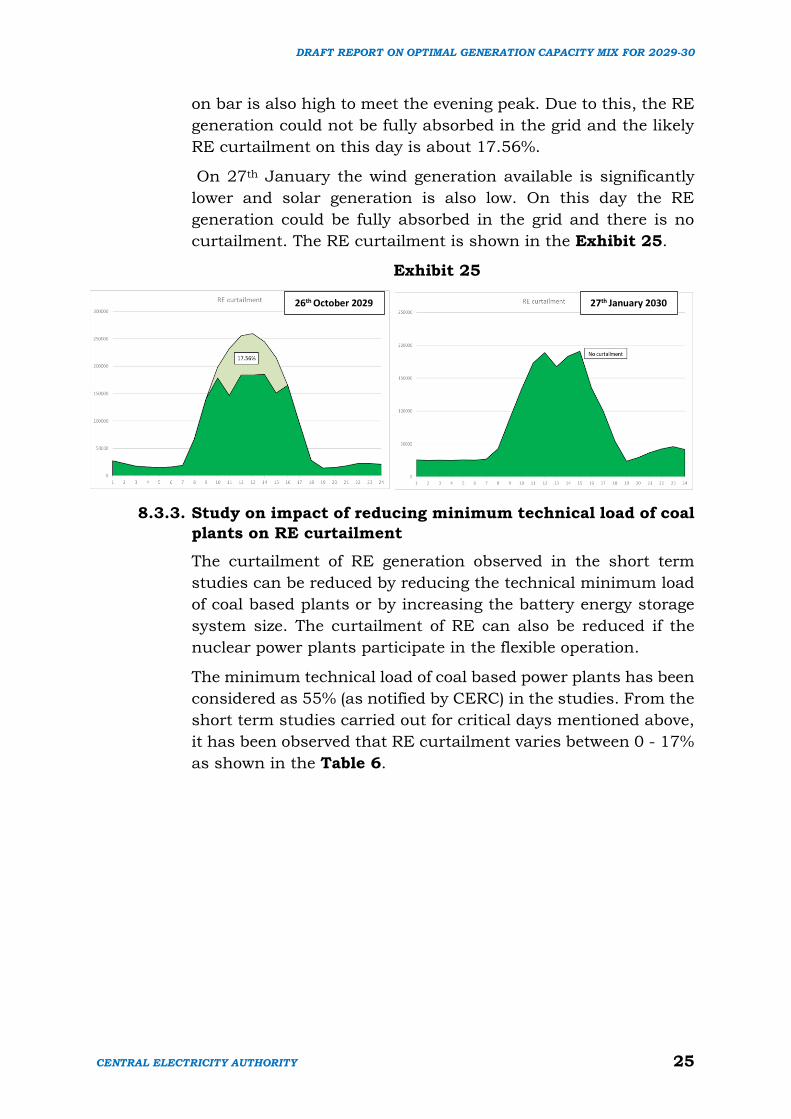
It has been observed that on this day (26th October) the peak
demand is on the higher side and thus the coal-based capacity
26th October, 2029 27th January, 2030
DRAFT REPORT ON OPTIMAL GENERATION CAPACITY MIX FOR 2029-30
CENTRAL ELECTRICITY AUTHORITY 25
on bar is also high to meet the evening peak. Due to this, the RE
generation could not be fully absorbed in the grid and the likely
RE curtailment on this day is about 17.56%.
On 27th January the wind generation available is significantly
lower and solar generation is also low. On this day the RE
generation could be fully absorbed in the grid and there is no
curtailment. The RE curtailment is shown in the Exhibit 25.
Exhibit 25
8.3.3. Study on impact of reducing minimum technical load of coal
plants on RE curtailment
The curtailment of RE generation observed in the short term
studies can be reduced by reducing the technical minimum load
of coal based plants or by increasing the battery energy storage
system size. The curtailment of RE can also be reduced if the
nuclear power plants participate in the flexible operation.
The minimum technical load of coal based power plants has been
considered as 55% (as notified by CERC) in the studies. From the
short term studies carried out for critical days mentioned above,
it has been observed that RE curtailment varies between 0 - 17%
as shown in the Table 6.
26th October 2029 27th January 2030
DRAFT REPORT ON OPTIMAL GENERATION CAPACITY MIX FOR 2029-30
CENTRAL ELECTRICITY AUTHORITY 26
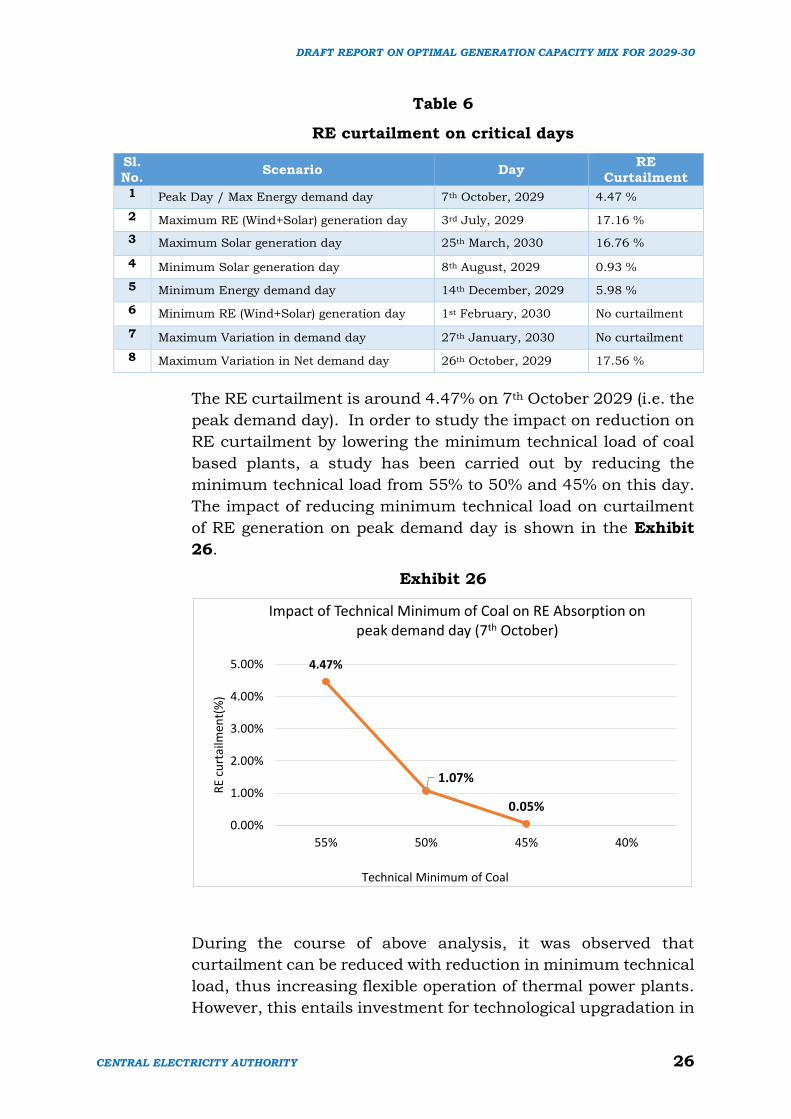
Table 6
RE curtailment on critical days
Sl.
No. Scenario Day
RE
Curtailment 1 Peak Day / Max Energy demand day 7th October, 2029 4.47 %
2 Maximum RE (Wind+Solar) generation day 3rd July, 2029 17.16 %
3 Maximum Solar generation day 25th March, 2030 16.76 %
4 Minimum Solar generation day 8th August, 2029 0.93 %
5 Minimum Energy demand day 14th December, 2029 5.98 %
6 Minimum RE (Wind+Solar) generation day 1st February, 2030 No curtailment
7 Maximum Variation in demand day 27th January, 2030 No curtailment
8 Maximum Variation in Net demand day 26th October, 2029 17.56 %
The RE curtailment is around 4.47% on 7th October 2029 (i.e. the
peak demand day). In order to study the impact on reduction on
RE curtailment by lowering the minimum technical load of coal
based plants, a study has been carried out by reducing the
minimum technical load from 55% to 50% and 45% on this day.
The impact of reducing minimum technical load on curtailment
of RE generation on peak demand day is shown in the Exhibit
26.
Exhibit 26
During the course of above analysis, it was observed that
curtailment can be reduced with reduction in minimum technical
load, thus increasing flexible operation of thermal power plants.
However, this entails investment for technological upgradation in
4.47%
1.07%
0.05%
0.00%
1.00%
2.00%
3.00%
4.00%
5.00%
55% 50% 45% 40%
RE
curt
ailm
ent(
%)
Technical Minimum of Coal
Impact of Technical Minimum of Coal on RE Absorption on peak demand day (7th October)
DRAFT REPORT ON OPTIMAL GENERATION CAPACITY MIX FOR 2029-30
CENTRAL ELECTRICITY AUTHORITY 27
coal based power plants. A reduction of approximately 3 % in the
RE curtailment was observed for every step of 5 % reduction in
minimum technical load of coal based capacity on this day.
However, the impact on RE absorption by reducing minimum
technical load of coal based plants may vary from day to day
depending on the coal based capacity on bar and available RE
generation.
8.3.4. Impact on CO2 emission due to part load operation of coal
based power plant
The efficiency of coal based power plant varies with the
loading of the machine. The impact on efficiency due to part load
operation is more in sub critical power plants than in the super
critical coal based power plants. The efficiency for different
loading conditions have been modelled in the studies. A study
has been carried out to estimate impact of part load operation of
coal based power plants due to high RE penetration in the system
and shape of the demand curve.
A study of typical days, i.e. 7th October (peak demand day)
and 3rd July (maximum RE generation day) have been carried out
by considering no efficiency drop vis-a-vis efficiency drop due to
part load operation. It is observed that CO2 emissions may
increase to the tune of 1% due to efficiency drop on part load
operation of coal based power plant on 7th October and 1.2% on
3rd July.
8.3.5. Sensitivity Analysis
While carrying out the planning studies for the future, there is
likelihood of many uncertainties. To address the uncertainties
and to test the resilience of the planned generation capacity mix
for the extreme eventualities, sensitivity analysis has also been
carried out apart from the studies for critical days as the share
of renewables (wind and solar) increases in the system. Hydro
and RE generation is highly weather dependent and may vary
during season to season. There may be a possibility that the
solar and wind generation on the peak demand day may not be
as expected. There could be a possibility that the available
generation from hydro may also come down due to draught
conditions. Therefore, hourly generation dispatch studies for
following unexpected events has been carried out.
10% reduction in solar and wind generation during the
week (4th Oct to 10th Oct 2029) having All-India peak
demand day i.e. 7th Oct.
DRAFT REPORT ON OPTIMAL GENERATION CAPACITY MIX FOR 2029-30
CENTRAL ELECTRICITY AUTHORITY 28
10% reduction in solar and wind generation during the
week (1st Feb to 7th Feb 2029) having minimum solar and
wind generation day i.e. 3rd Feb.
6% reduction in hydro generation during the week (4th Oct to
10th Oct 2029) having All-India peak demand day i.e. 7th Oct.
10% reduction in RE generation and 6% hydro generation
combined together during the week (4th Oct to 10th Oct
2029) having All-India peak demand day i.e. 7th Oct.
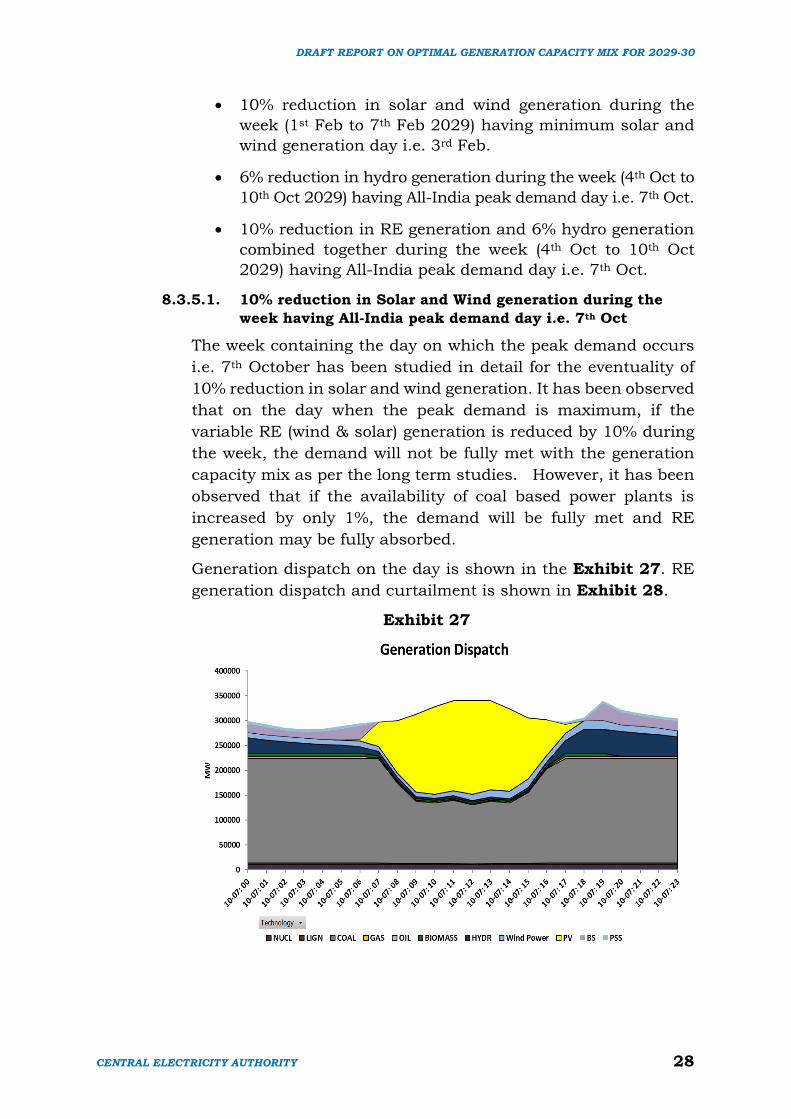
8.3.5.1. 10% reduction in Solar and Wind generation during the
week having All-India peak demand day i.e. 7th Oct
The week containing the day on which the peak demand occurs
i.e. 7th October has been studied in detail for the eventuality of
10% reduction in solar and wind generation. It has been observed
that on the day when the peak demand is maximum, if the
variable RE (wind & solar) generation is reduced by 10% during
the week, the demand will not be fully met with the generation
capacity mix as per the long term studies. However, it has been
observed that if the availability of coal based power plants is
increased by only 1%, the demand will be fully met and RE
generation may be fully absorbed.
Generation dispatch on the day is shown in the Exhibit 27. RE
generation dispatch and curtailment is shown in Exhibit 28.
Exhibit 27
DRAFT REPORT ON OPTIMAL GENERATION CAPACITY MIX FOR 2029-30
CENTRAL ELECTRICITY AUTHORITY 29
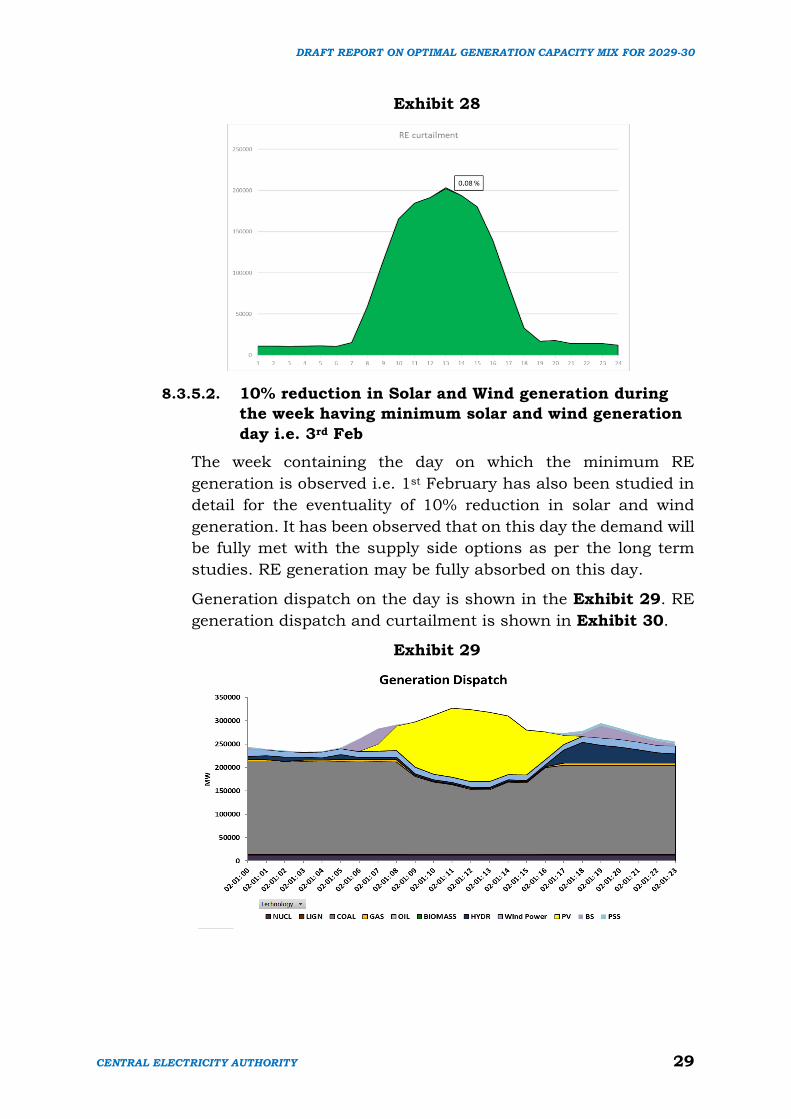
Exhibit 28
8.3.5.2. 10% reduction in Solar and Wind generation during
the week having minimum solar and wind generation
day i.e. 3rd Feb
The week containing the day on which the minimum RE
generation is observed i.e. 1st February has also been studied in
detail for the eventuality of 10% reduction in solar and wind
generation. It has been observed that on this day the demand will
be fully met with the supply side options as per the long term
studies. RE generation may be fully absorbed on this day.
Generation dispatch on the day is shown in the Exhibit 29. RE
generation dispatch and curtailment is shown in Exhibit 30.
Exhibit 29
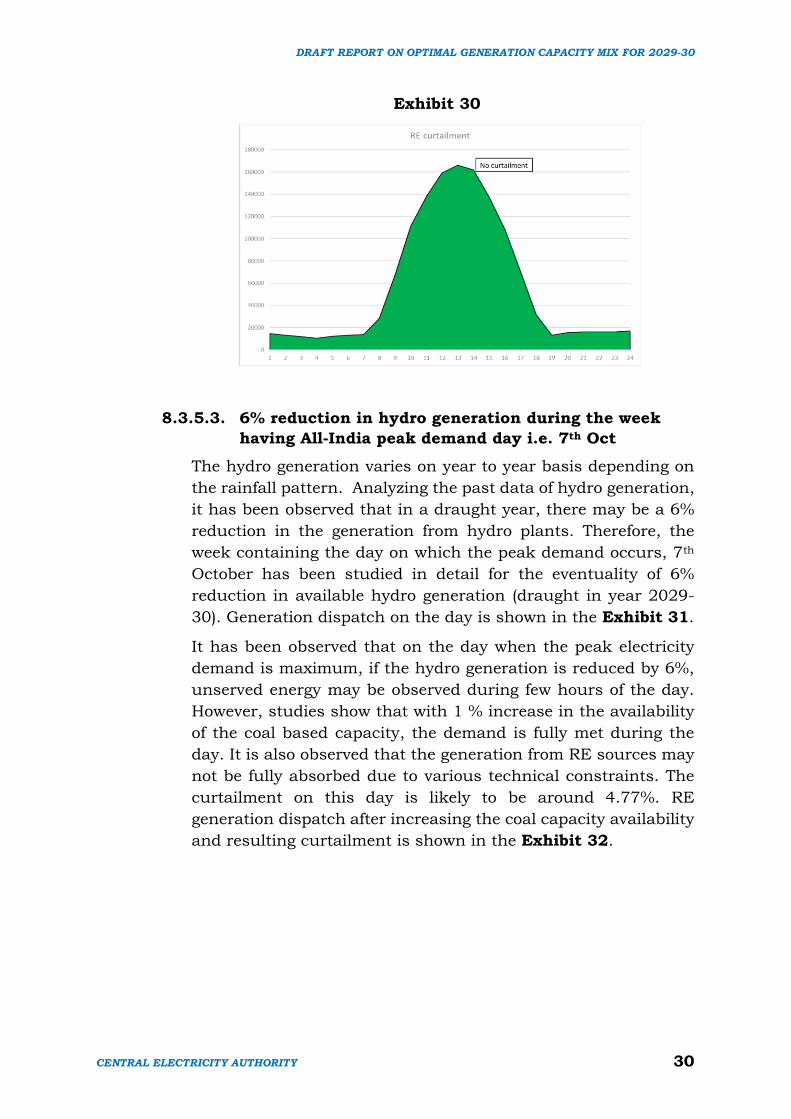
DRAFT REPORT ON OPTIMAL GENERATION CAPACITY MIX FOR 2029-30
CENTRAL ELECTRICITY AUTHORITY 30
Exhibit 30
8.3.5.3. 6% reduction in hydro generation during the week
having All-India peak demand day i.e. 7th Oct
The hydro generation varies on year to year basis depending on
the rainfall pattern. Analyzing the past data of hydro generation,
it has been observed that in a draught year, there may be a 6%
reduction in the generation from hydro plants. Therefore, the
week containing the day on which the peak demand occurs, 7th
October has been studied in detail for the eventuality of 6%
reduction in available hydro generation (draught in year 2029-
30). Generation dispatch on the day is shown in the Exhibit 31.
It has been observed that on the day when the peak electricity
demand is maximum, if the hydro generation is reduced by 6%,
unserved energy may be observed during few hours of the day.
However, studies show that with 1 % increase in the availability
of the coal based capacity, the demand is fully met during the
day. It is also observed that the generation from RE sources may
not be fully absorbed due to various technical constraints. The
curtailment on this day is likely to be around 4.77%. RE
generation dispatch after increasing the coal capacity availability
and resulting curtailment is shown in the Exhibit 32.
DRAFT REPORT ON OPTIMAL GENERATION CAPACITY MIX FOR 2029-30
CENTRAL ELECTRICITY AUTHORITY 31
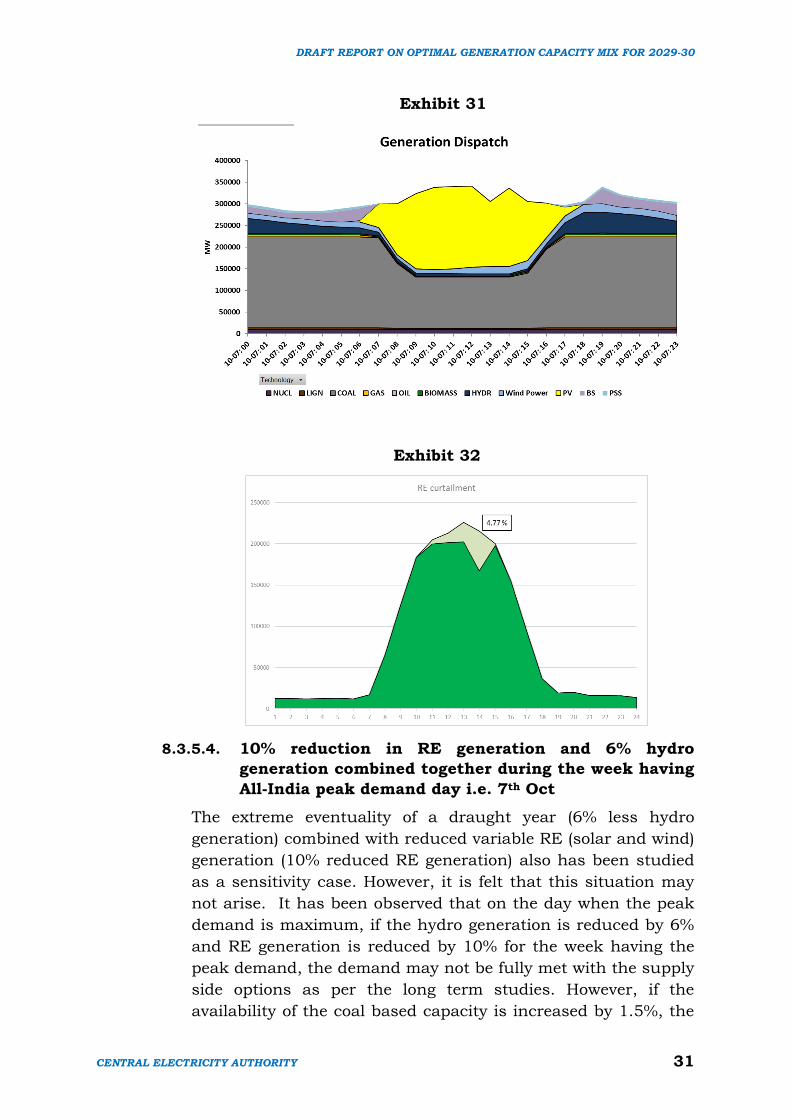
Exhibit 31
Exhibit 32
8.3.5.4. 10% reduction in RE generation and 6% hydro
generation combined together during the week having
All-India peak demand day i.e. 7th Oct
The extreme eventuality of a draught year (6% less hydro
generation) combined with reduced variable RE (solar and wind)
generation (10% reduced RE generation) also has been studied
as a sensitivity case. However, it is felt that this situation may
not arise. It has been observed that on the day when the peak
demand is maximum, if the hydro generation is reduced by 6%
and RE generation is reduced by 10% for the week having the
peak demand, the demand may not be fully met with the supply
side options as per the long term studies. However, if the
availability of the coal based capacity is increased by 1.5%, the

DRAFT REPORT ON OPTIMAL GENERATION CAPACITY MIX FOR 2029-30
CENTRAL ELECTRICITY AUTHORITY 32
demand can be fully met. Generation dispatch on the peak day
with this sensitivity is shown in the Exhibit 33.
The generation from RE sources may not be fully absorbed due
to technical constraints on this day. However, the RE curtailment
on this day is likely to be only 0.1%. RE generation dispatch after
increasing the coal capacity availability and resulting curtailment
is shown in the Exhibit 34.
Exhibit 33
Exhibit 34
9. International Commitment - INDC Targets
In October 2015, India had submitted its Intended Nationally Determined
Contribution (INDC) to UNFCCC. The key elements are:
To reduce the emissions intensity of its GDP by 33% to 35% by 2030
from 2005 level.
DRAFT REPORT ON OPTIMAL GENERATION CAPACITY MIX FOR 2029-30
CENTRAL ELECTRICITY AUTHORITY 33
To achieve about 40 percent cumulative electric power installed
capacity from non-fossil fuel based energy resources by 2030, with the
help of transfer of technology and low cost international finance
including from Green Climate Fund (GCF).
To create an additional carbon sink of 2.5 to 3 billion tonnes of CO2
equivalent through additional forest and tree cover by 2030.
10. Projected Achievements of INDCs by 2030
10.1. Installed capacity and share of non-fossil fuel
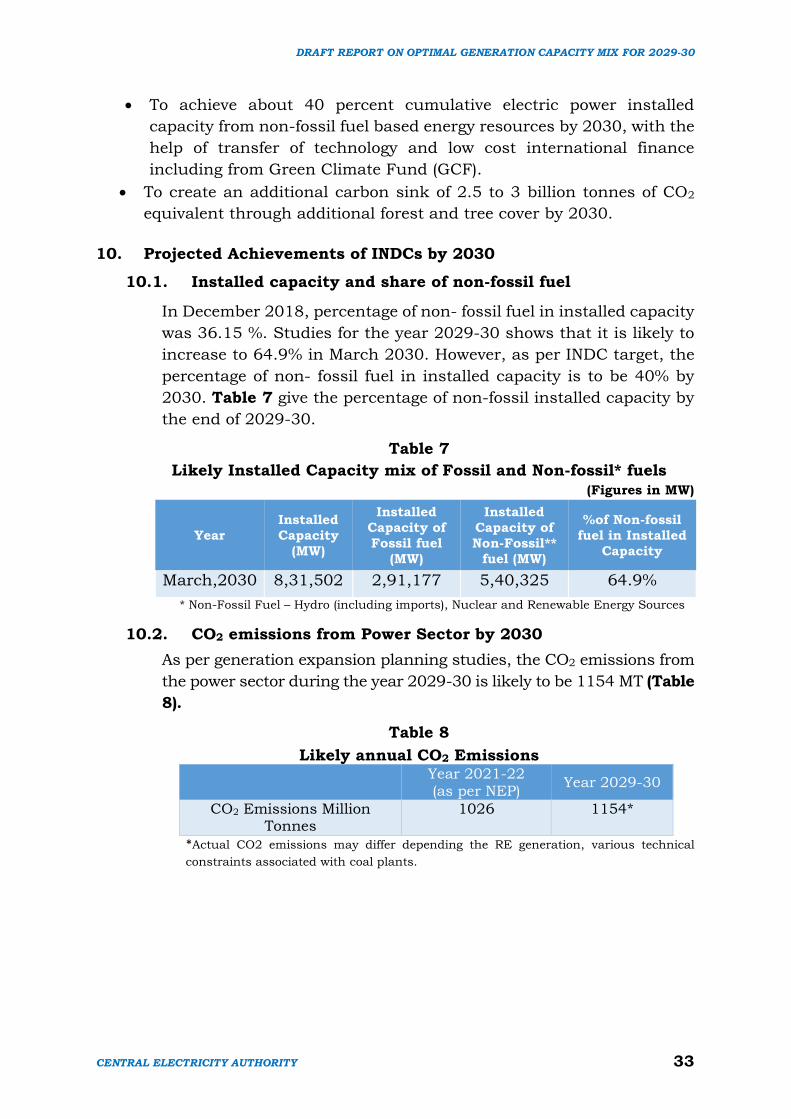
In December 2018, percentage of non- fossil fuel in installed capacity
was 36.15 %. Studies for the year 2029-30 shows that it is likely to
increase to 64.9% in March 2030. However, as per INDC target, the
percentage of non- fossil fuel in installed capacity is to be 40% by
2030. Table 7 give the percentage of non-fossil installed capacity by
the end of 2029-30.
Table 7
Likely Installed Capacity mix of Fossil and Non-fossil* fuels
(Figures in MW)
Year
Installed
Capacity
(MW)
Installed
Capacity of
Fossil fuel
(MW)
Installed
Capacity of
Non-Fossil**
fuel (MW)
%of Non-fossil
fuel in Installed
Capacity
March,2030 8,31,502 2,91,177 5,40,325 64.9%
* Non-Fossil Fuel – Hydro (including imports), Nuclear and Renewable Energy Sources
10.2. CO2 emissions from Power Sector by 2030
As per generation expansion planning studies, the CO2 emissions from
the power sector during the year 2029-30 is likely to be 1154 MT (Table
8).
Table 8
Likely annual CO2 Emissions
Year 2021-22 (as per NEP)
Year 2029-30
CO2 Emissions Million Tonnes
1026 1154*
*Actual CO2 emissions may differ depending the RE generation, various technical
constraints associated with coal plants.
DRAFT REPORT ON OPTIMAL GENERATION CAPACITY MIX FOR 2029-30
CENTRAL ELECTRICITY AUTHORITY 34
11. Conclusions
The long term study results for the period 2022-23 to 2029-30 is the most
economical solution for meeting the peak electricity demand and electrical
energy requirement of each year till 2029-30 as projected by 19th EPS. The
capacity mix also honours all the technical constraints associated with
various technologies. Grid scale batteries energy storage technology has
also been considered for finding out the optimal results keeping in view
the challenge of RE integration due to its inherent nature of being variable
and intermittent and to fulfil the demand at every instance of time.
The results of the studies show that the installed capacity by the end of
2029-30 is 8,31,502 MW which includes Hydro 64,089 MW, Small Hydro
5000 MW, Hydro Imports 4,356 MW, Coal 2,66,827 MW, Gas 24,350 MW,
Nuclear 16,880 MW, Solar 300,000MW, Wind 140,000 MW and Biomass
10,000 MW along with a Battery Energy Storage capacity of 34,000
MW/136,000 MWh. With this installed capacity, the INDC target set for
India i.e. the percentage of non- fossil fuel capacity in the total installed
capacity is to be 40% by 2030 may be met.
The economic hourly dispatch of generation capacity mix for the year
2029-30 have been studied for critical days like maximum peak demand
day, maximum energy demand day, maximum/minimum variable RE
generation day, maximum/minimum solar energy generation day,
minimum energy demand day, day with maximum variation in
demand/net demand. It was found that the energy requirement at every
instance of time has been met with all the technical/operational
constraints. It was also observed that the RE generation which could not
be absorbed in the system is in the range of 0% (on minimum RE
generation day) to 17% (on maximum RE generation day). The curtailment
arises due to the nature of load curve and generation profile of solar and
wind and operating constraints of thermal units i.e. minimum technical
constraints, gas availability, minimum flow from reservoir of hydro plants
etc. In order to study the impact on reduction of RE curtailment by
lowering the minimum technical load of coal based plants, a study has
also been carried out by reducing the minimum technical load of coal
based plants from 55% to 50%, 45% and 40% on maximum solar
generation day. It has been found that the RE curtailment gradually
reduces with decreasing the minimum technical load of operation.
However, the RE absorption may vary depending upon the coal based
capacity on bar and available RE generation.
Sensitivity analysis for contingency scenarios have also been carried out
during the week of 7th October, 2029 by considering 10% reduction in solar
and wind generation during 4th - 10th Oct 2029, 10% reduction in solar
DRAFT REPORT ON OPTIMAL GENERATION CAPACITY MIX FOR 2029-30
CENTRAL ELECTRICITY AUTHORITY 35
and wind generation during 1st - 7th Feb 2029, 6% reduction in hydro
generation during 4-10th Oct 2029, 10% reduction in RE generation and
6% hydro generation combined together during 4th -10th Oct 2029.
The results of the sensitivity studies show that with the base case installed
capacity along with a battery energy storage capacity of 34,000
MW/136,000 MWh there may be unserved energy at few instances of time.
However, it has been observed that if the availability of coal based power
plants is increased by 1% to 1.5%, the demand is likely to be fully met.
Further, the impact on efficiency due to part load operation and CO2
emissions from coal-based power plant has also been studied for the peak
demand day i.e. 7th Oct, 2029 and maximum RE generation day i.e. 3rd
July 2029. It is observed that CO2 emissions may increase to the tune of
1% due to efficiency drop on account of part load operation of coal based
power plant on 7th October and 1.2% on 3rd July 2029. The CO2 emissions
for the year 2029-30 has also been studied and the study results show
that CO2 emissions from the Power Sector is likely to be 1154 MT.
DRAFT REPORT ON OPTIMAL GENERATION CAPACITY MIX FOR 2029-30
CENTRAL ELECTRICITY AUTHORITY
ANNEXURE
DRAFT REPORT ON OPTIMAL GENERATION CAPACITY MIX FOR 2029-30
CENTRAL ELECTRICITY AUTHORITY 37
Annexure-I/1
ASSUMPTIONS
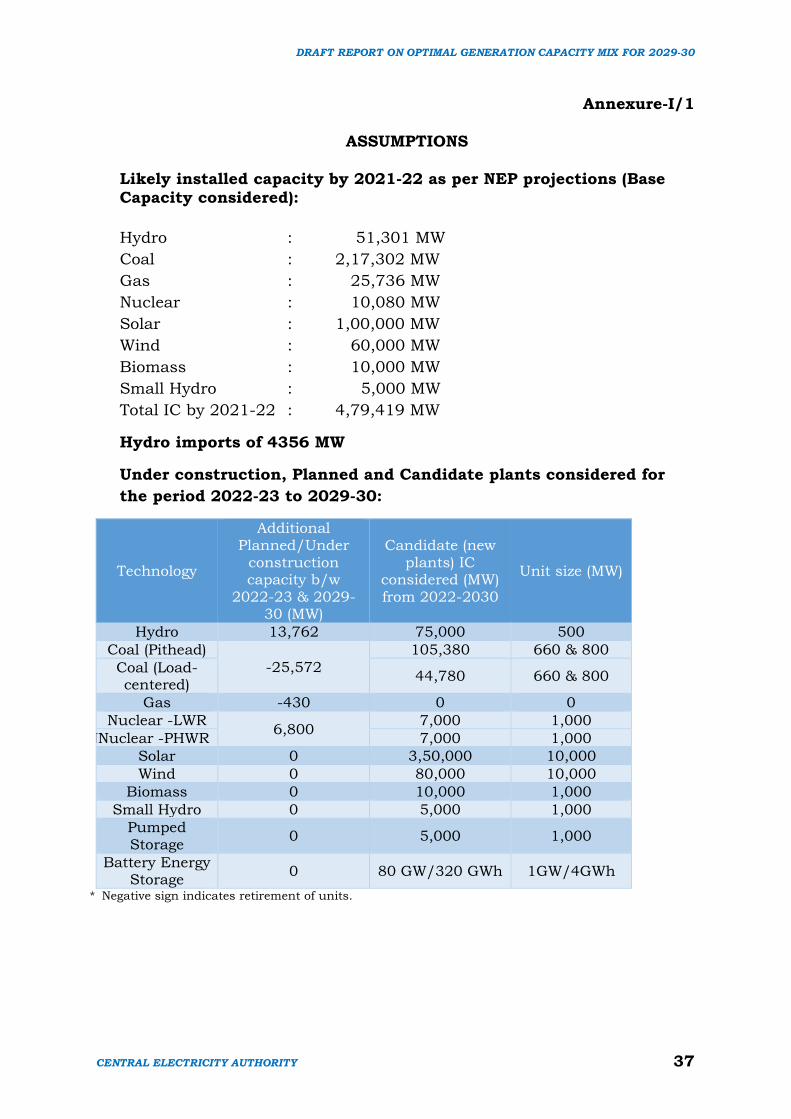
Likely installed capacity by 2021-22 as per NEP projections (Base Capacity considered):
Hydro : 51,301 MW
Coal : 2,17,302 MW
Gas : 25,736 MW
Nuclear : 10,080 MW
Solar : 1,00,000 MW
Wind : 60,000 MW
Biomass : 10,000 MW
Small Hydro : 5,000 MW
Total IC by 2021-22 : 4,79,419 MW
Hydro imports of 4356 MW
Under construction, Planned and Candidate plants considered for
the period 2022-23 to 2029-30:
Technology
Additional Planned/Under
construction capacity b/w
2022-23 & 2029-30 (MW)
Candidate (new plants) IC
considered (MW) from 2022-2030
Unit size (MW)
Hydro 13,762 75,000 500
Coal (Pithead)
-25,572
105,380 660 & 800
Coal (Load-centered)
44,780 660 & 800
Gas -430 0 0
Nuclear -LWR 6,800
7,000 1,000
NNuclear -PHWR 7,000 1,000
Solar 0 3,50,000 10,000
Wind 0 80,000 10,000
Biomass 0 10,000 1,000
Small Hydro 0 5,000 1,000
Pumped Storage
0 5,000 1,000
Battery Energy Storage
0 80 GW/320 GWh 1GW/4GWh
* Negative sign indicates retirement of units.
DRAFT REPORT ON OPTIMAL GENERATION CAPACITY MIX FOR 2029-30
CENTRAL ELECTRICITY AUTHORITY 38
Annexure-I/2
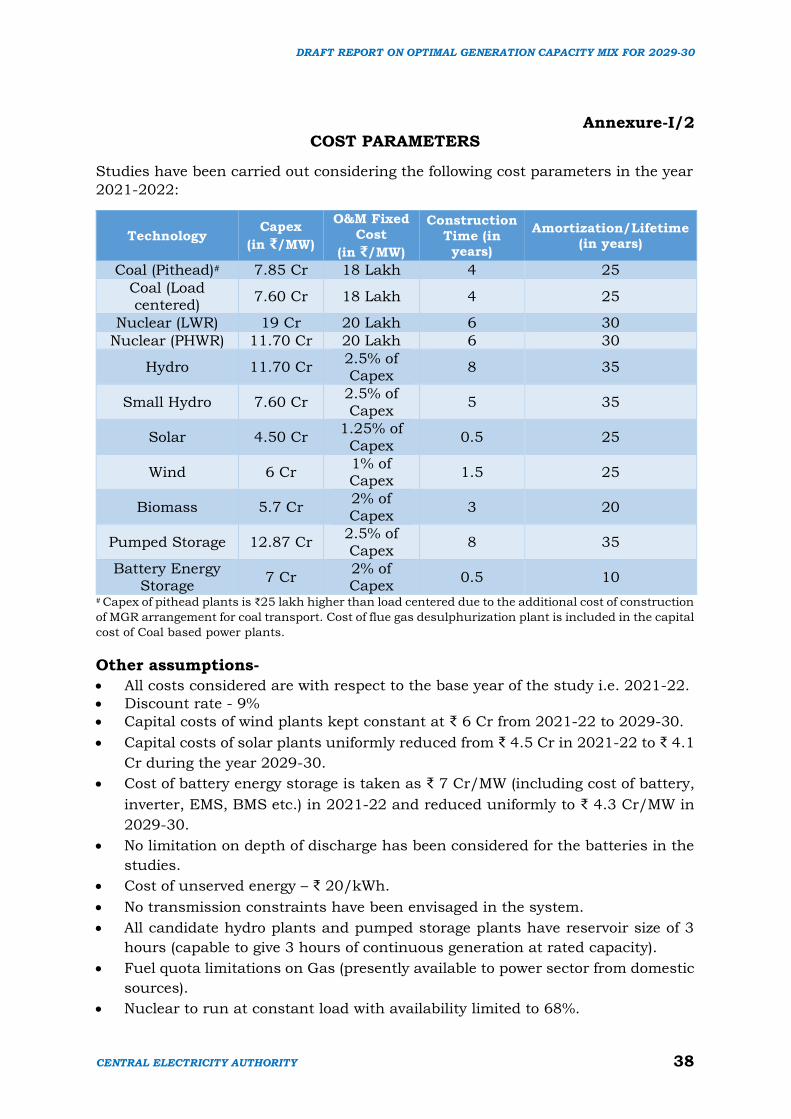
COST PARAMETERS
Studies have been carried out considering the following cost parameters in the year
2021-2022:
Technology Capex
(in ₹/MW)
O&M Fixed
Cost
(in ₹/MW)
Construction
Time (in years)
Amortization/Lifetime (in years)
Coal (Pithead)# 7.85 Cr 18 Lakh 4 25
Coal (Load centered)
7.60 Cr 18 Lakh 4 25
Nuclear (LWR) 19 Cr 20 Lakh 6 30
Nuclear (PHWR) 11.70 Cr 20 Lakh 6 30
Hydro 11.70 Cr 2.5% of Capex
8 35
Small Hydro 7.60 Cr 2.5% of Capex
5 35
Solar 4.50 Cr 1.25% of Capex
0.5 25
Wind 6 Cr 1% of Capex
1.5 25
Biomass 5.7 Cr 2% of Capex
3 20
Pumped Storage 12.87 Cr 2.5% of Capex
8 35
Battery Energy Storage
7 Cr 2% of Capex
0.5 10
# Capex of pithead plants is ₹25 lakh higher than load centered due to the additional cost of construction
of MGR arrangement for coal transport. Cost of flue gas desulphurization plant is included in the capital
cost of Coal based power plants.
Other assumptions-
All costs considered are with respect to the base year of the study i.e. 2021-22.
Discount rate - 9%
Capital costs of wind plants kept constant at ₹ 6 Cr from 2021-22 to 2029-30.
Capital costs of solar plants uniformly reduced from ₹ 4.5 Cr in 2021-22 to ₹ 4.1
Cr during the year 2029-30.
Cost of battery energy storage is taken as ₹ 7 Cr/MW (including cost of battery,
inverter, EMS, BMS etc.) in 2021-22 and reduced uniformly to ₹ 4.3 Cr/MW in
2029-30.
No limitation on depth of discharge has been considered for the batteries in the
studies.
Cost of unserved energy – ₹ 20/kWh.
No transmission constraints have been envisaged in the system.
All candidate hydro plants and pumped storage plants have reservoir size of 3
hours (capable to give 3 hours of continuous generation at rated capacity).
Fuel quota limitations on Gas (presently available to power sector from domestic
sources).
Nuclear to run at constant load with availability limited to 68%.
DRAFT REPORT ON OPTIMAL GENERATION CAPACITY MIX FOR 2029-30
CENTRAL ELECTRICITY AUTHORITY 39
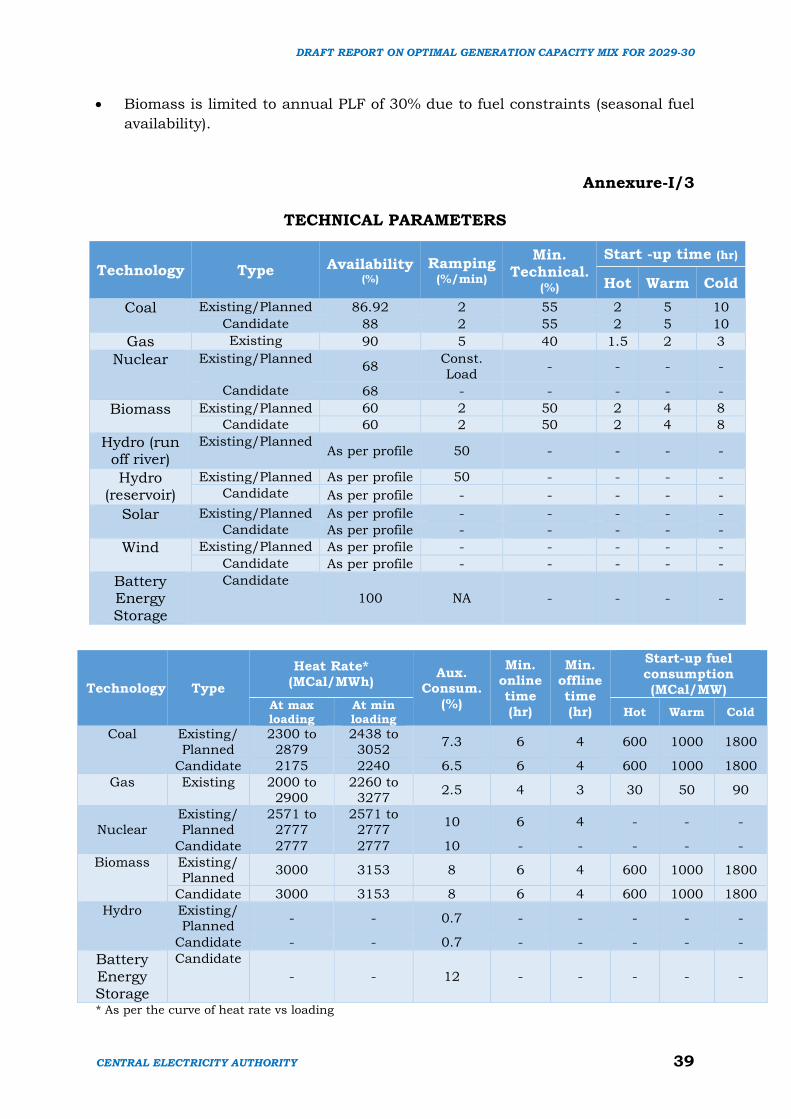
Biomass is limited to annual PLF of 30% due to fuel constraints (seasonal fuel
availability).
Annexure-I/3
TECHNICAL PARAMETERS
Technology Type Availability (%)
Ramping (%/min)
Min. Technical.
(%)
Start -up time (hr)
Hot Warm Cold
Coal Existing/Planned 86.92 2 55 2 5 10
Candidate 88 2 55 2 5 10
Gas Existing 90 5 40 1.5 2 3
Nuclear Existing/Planned 68
Const.
Load - - - -
Candidate 68 - - - - -
Biomass Existing/Planned 60 2 50 2 4 8
Candidate 60 2 50 2 4 8
Hydro (run off river)
Existing/Planned As per profile 50 - - - -
Hydro (reservoir)
Existing/Planned As per profile 50 - - - -
Candidate As per profile - - - - -
Solar Existing/Planned As per profile - - - - -
Candidate As per profile - - - - -
Wind Existing/Planned As per profile - - - - -
Candidate As per profile - - - - -
Battery Energy Storage
Candidate
100 NA - - - -
Technology Type
Heat Rate*
(MCal/MWh) Aux.
Consum.
(%)
Min. online
time
(hr)
Min. offline
time
(hr)
Start-up fuel
consumption
(MCal/MW) At max loading
At min loading
Hot Warm Cold
Coal Existing/
Planned
2300 to
2879
2438 to
3052 7.3 6 4 600 1000 1800
Candidate 2175 2240 6.5 6 4 600 1000 1800
Gas Existing 2000 to
2900
2260 to
3277 2.5 4 3 30 50 90
Nuclear
Existing/
Planned
2571 to
2777
2571 to
2777 10 6 4 - - -
Candidate 2777 2777 10 - - - - -
Biomass Existing/Planned
3000 3153 8 6 4 600 1000 1800
Candidate 3000 3153 8 6 4 600 1000 1800
Hydro Existing/
Planned - - 0.7 - - - - -
Candidate - - 0.7 - - - - -
Battery Energy Storage
Candidate
- - 12 - - - - -
* As per the curve of heat rate vs loading
DRAFT REPORT ON OPTIMAL GENERATION CAPACITY MIX FOR 2029-30
CENTRAL ELECTRICITY AUTHORITY 40
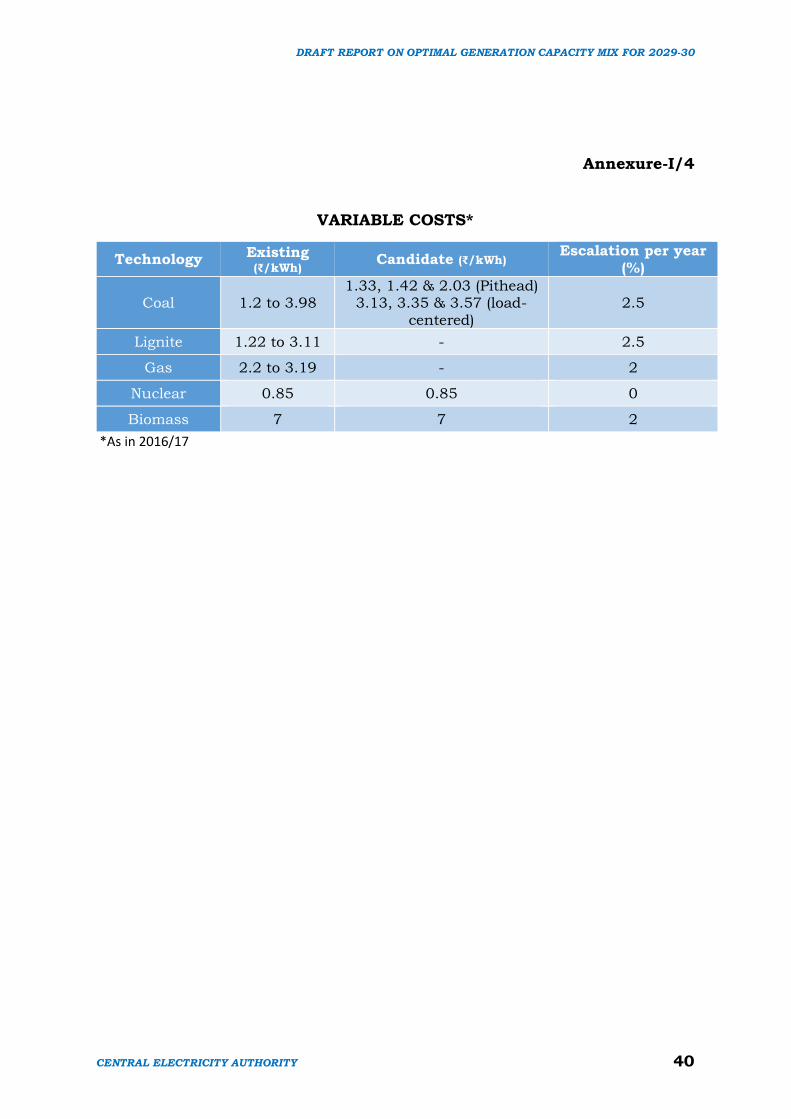
Annexure-I/4
VARIABLE COSTS*
Technology Existing (₹/kWh)
Candidate (₹/kWh) Escalation per year
(%)
Coal 1.2 to 3.98 1.33, 1.42 & 2.03 (Pithead)
3.13, 3.35 & 3.57 (load-centered)
2.5
Lignite 1.22 to 3.11 - 2.5
Gas 2.2 to 3.19 - 2
Nuclear 0.85 0.85 0
Biomass 7 7 2
*As in 2016/17


![[Name of State Electricity Distribution Company Ltd ...cea.nic.in/reports/others/enc/fca/sample_rfp_distribution... · [Name of State Electricity Distribution Company Ltd]/ ... 3](https://img.dokumen.tips/doc/110x75/5aaf60e57f8b9a59478d4006/name-of-state-electricity-distribution-company-ltd-ceanicinreportsothersencfcasamplerfpdistributionname.jpg)