Embed Size (px)
Citation preview
DRAFT OECD TEST GUIDELINE 1
2
Determination of in vitro intrinsic clearance using rainbow trout liver S9 sub-cellular 3
fraction (RT-S9) 4
INTRODUCTION 5
1. A major determinant of whether chemicals accumulate in fish is the extent to which 6
they undergo biotransformation. Standard Test Guidelines (e.g., OECD TG 305; 1) can be 7
used to measure chemical accumulation in fish, but these methods are expensive, time-8
consuming, and require a substantial number of animals. It is critical, therefore, to have 9
predictive methods and models for bioaccumulation assessment available that are rapid, cost-10
effective, and minimize the need for whole-animal testing. Ideally, such methods would be 11
based on in silico and/or in vitro approaches. 12
2. Nearly a decade ago, Nichols et al. (2) suggested that in vitro intrinsic clearance (CL, 13
IN VITRO, INT) rates, obtained using a substrate depletion approach, could be extrapolated to the 14
whole animal, and these in vivo clearance rates could be incorporated into existing mass-15
balance models for fish bioconcentration (BCF) prediction. Since then, several investigators 16
have used in vitro systems derived from fish liver tissue to predict biotransformation impacts 17
on the accumulation of selected test chemicals (3-10). These studies have shown that 18
incorporating biotransformation estimates into BCF prediction models substantially improves 19
their performance; thus, predicted levels of accumulation are much closer to measured values 20
than are model predictions obtained assuming no biotransformation. 21
3. This Test Guideline (TG) describes the use of liver S9 sub-cellular fraction (RT-S9) of 22
rainbow trout (Oncorhynchus mykiss) to determine the CL, IN VITRO, INT rate of a test chemical 23
using a substrate depletion approach. 24
4. Whole body biotransformation rate constants can be calculated using an appropriate in 25
vitro to in vivo extrapolation (IVIVE) model. These models use CL, IN VITRO, INT rates (derived 26
with this Test Guideline or Test Guideline RT-HEP; 11) to estimate liver clearance rates, 27
which are then extrapolated to a whole-body (in vivo) biotransformation rate constant. An 28
IVIVE model applicable to rainbow trout was recently described by Nichols et al. (12). 29
Crucial parameters and use of IVIVE models are discussed in the OECD Guidance Document 30
RT-HEP and RT-S9 (13) accompanying this Test Guideline and Test Guideline RT-HEP (11) 31
5. The results of a recent ring trial involving six laboratories (14) show that RT-S9 can 32
be used to reproducibly measure CL, IN VITRO, INT rates for chemicals covering a range of 33
physico-chemical properties. 34
6. Definitions of terms used in this document are provided in ANNEX 1. 35
INITIAL CONSIDERATIONS AND LIMITATIONS 36
7. The total incubation time should not exceed 2 h due to progressive loss of enzyme 37
activity of the RT-S9. However, longer incubation times (up to max. 4 h) may be considered 38
for very slowly biotransformed chemicals. This limits the use of the test for chemicals 39
metabolized at very low rates. The lowest rate of in vitro activity which can be reliably 40
quantified is a first-order elimination rate constant (ke) of approximately 0.05 h-1
to 0.14 h-1
41

2
(12, 15). More details are provided in the OECD Guidance Document RT-HEP and RT-S9 42
(13). 43
8. The reaction temperature should be at the acclimation temperature of the source fish. 44
Rainbow trout are generally maintained at temperatures ranging from 10-15°C; e.g., the 45
incubation is carried out at 12°C if the source fish are maintained at 12°C. Since 46
biotransformation rates are temperature sensitive, the test temperature should be strictly 47
controlled at the acclimation temperature using a water bath, incubator, or thermomixer. 48
9. For volatile or otherwise difficult test chemicals, several alternative approaches are 49
suggested in the OECD Guidance Document RT-HEP and RT-S9 (13) such as use of closed 50
incubation vials or glass inserts test tubes (e.g., Hirschman test tubes) and passive dosing for 51
volatile chemicals and for chemicals with very low solubility, respectively. 52
10. Before use of the Test Guideline on a mixture for generating data for an intended 53
regulatory purpose, it should be considered whether, and if so why, it may provide adequate 54
results for that purpose. Such considerations are not needed, when there is a regulatory 55
requirement for testing of the mixture. 56
11. The methodology as described here only measures depletion of the parent chemical. 57
The depletion approach could for examples also be used to identify metabolites as described 58
in OECD Guidance Document RT-HEP and RT-S9 (13). 59
12. Liver S9 sub-cellular fractions from fish species other than rainbow trout could be 60
used, provided that they can be successfully prepared and that protocols are adapted to 61
species-specific considerations (OECD Guidance Document RT-HEP and RT-S9; 13). 62
SCIENTIFIC BASIS OF THE METHOD 63
13. Rainbow trout liver S9 sub-cellular fraction is relatively easy to prepare and to use 64
(16; ANNEX 2). In a frozen state (-80°C), samples can be shipped to different locations and 65
stored for at least up to two years. Furthermore, it is possible to use the same lot of RT-S9 for 66
several tests separated in time. 67
14. The RT-S9 contains enzymes responsible for both Phase I (e.g., cytochrome P450 68
(CYP)) and Phase II biotransformation (e.g., sulfotransferases (SULT), uridine 5'-diphospho-69
glucuronosyltransferases (UGT), glutathione transferases (GST)); 17). 70
PRINCIPLE OF THE TEST 71
15. The CL, IN VITRO, INT rate of the test chemical is determined by using a substrate 72
depletion approach. The incubation system consists of RT-S9 and potassium phosphate 73
buffer supplemented with enzymatic cofactors and alamethicin to support both Phase I and II 74
biotransformations. The reaction is initiated by the addition of the test chemical. In order to 75
collect samples at various time points, the reaction is terminated by transferring an aliquot of 76
the suspension to a stopping solution. The decrease of the test chemical from the reaction vial 77
over time is measured with a validated analytical method and used to determine the CL, IN 78
VITRO, INT rate. Incubations using enzymatically inactive RT-S9 are carried out as negative 79
control to distinguish between enzymatic biotransformation and abiotic decrease. 80
INFORMATION ON THE TEST CHEMICAL 81

3
16. Before carrying out this test, the following information about the test chemical should 82
be known: 83
Solubility in water (TG 105; [18]); 84
Solubility in organic solvents (if needed for preparation of the test chemical) 85
(see OECD Guidance Document RT-HEP and RT-S9 - Section 3.2) 86
n-Octanol-water partition coefficient (log Kow) or other suitable information on 87
partitioning behavior (TGs 107, 117, 123; [19-21]); 88
Test chemical stability in water (TG 111; [22]) and/or test medium; 89
Vapor pressure (TG 104; [23]); 90
Information on biotic or abiotic degradation, such as ready biodegradability 91
(TGs 301, 310; [24, 25]); 92
Acid dissociation constant (pKa) for test chemicals that may ionize. 93
17. An appropriate analytical method, of known accuracy, precision, and sensitivity, for 94
the quantification of the test chemical in the test medium should be available, together with 95
details of sample preparation and storage. The analytical limit of quantification (LOQ) of the 96
test chemical in the test medium should be known. 97
REFERENCE CHEMICAL AND PROFICIENCY TESTING 98
18. It is recommended to use an appropriate reference chemical to verify the enzymatic 99
activity of the RT-S9 (also see §25 below). Points to be considered in choosing an 100
appropriate reference chemical are addressed in OECD Guidance Document RT-HEP and 101
RT-S9 - Section 4.2 (13). 102
19. Reference chemicals can also be used to establish the test system in a laboratory. In 103
an inter-laboratory comparison, pyrene was used as reference chemical (12). 104
VALIDITY OF THE TEST 105
20. For a test to be valid, the following criteria should be met: 106
The RT-S9 lots should be evaluated for the ability to catalyze Phase I and II 107
metabolic enzymatic reactions as described in ANNEX 3; 108
The protein concentration of the RT-S9 lots should be determined (see 109
ANNEX 2); 110
The pH of the potassium phosphate buffer must be adjusted to 7.8 0.1; 111
The substrate (test chemical) and protein concentrations should be determined 112
in preliminary experiments achieving first-order kinetics as described in 113
ANNEX 5. The protein concentration in the final reaction mix may range 114
from 0.25 - 2 mg/mL, with 1 mg/mL most commonly used; 115
The incubation temperature should be at the acclimation temperature of the 116
source fish (e.g., 10-15°C); 117
Negative (enzymatically inactive RT-S9) controls should demonstrate no 118
significant loss of parent chemical over the incubation time (i.e., <20% of loss 119
determined in enzymatically active RT-S9 incubations). Furthermore, negative 120
controls should demonstrate no apparent increase (i.e., >20%) of the parent 121
chemical over the incubation time. 122

4
A minimum of six time points should be used to determine the CL, IN VITRO, INT 123
rate, i.e., to calculate the regression and derive the slope, with an R2 value 124
>0.85. In the case of chemicals that are very slowly metabolized (e.g., a very 125
shallow slope), the R2 may not be ≥0.85. In this instance, careful consideration 126
should be given to whether the slope is significantly different than zero before 127
including or excluding the run; 128
A minimum of two independent runs must be performed (see §30) If the 129
calculated regression from the two runs with active RT-S9 are significantly 130
different (e.g., t-test of the slopes with p<0.05), then a third run should be 131
performed. 132
DESCRIPTION OF THE METHOD 133
Apparatus 134
21. The following equipment is required: 135
4°C refrigerator; 136
-20°C freezer; 137
-80°C freezer; 138
Analytical balance to weigh out reagents, cofactors and test chemicals; 139
pH meter; 140
Vortex mixer; 141
Refrigerated centrifuge for micro-centrifuge tubes or alternative test tubes used 142
in the incubation and/or stopping reaction step; 143
Sample incubation equipment, e.g., shaking water bath with chiller, shaking 144
incubator with heating and cooling functions, or thermomixer block with 145
shaking capabilities; 146
Glass ware for preparing solutions, reagents, etc 147
Glass vials for incubation test (e.g., 7 mL scintillation test tubes); 148
1.5 mL micro-centrifuge tubes; 149
Sample glass vials for HPLC/GC or other analytical instruments; 150
Pipettes and tips. 151
Cofactors, chemicals to prepare reagents 152
22. The following are required (analytical grade or equivalent): 153
Nicotinamide adenine dinucleotide 2'-phosphate, tetrasodium salt (NADPH) 154
Uridine 5'-diphosphoglucuronic acid, trisodium salt (UDPGA) 155
L-Glutathione reduced (GSH) 156
Adenosine 3'-phosphate 5'-phosphosulfate lithium salt hydrate (PAPS) 157
Alamethicin from Trichoderma viride 158
Potassium phosphate dibasic (K2HPO4) 159
Potassium phosphate monobasic (KH2PO4) 160
Chemicals for analytical measurements 161
23. The following chemicals are required: 162

5
Solvent to dissolve test chemical, analytical grade or equivalent (e.g., 163
methanol, acetonitrile, acetone). The solvent must be miscible with the 164
aqueous media used in the potassium phosphate reaction mixture. 165
Stopping and extraction solvents, analytical grade or equivalent (e.g., 166
methanol, acetonitrile, methylene chloride, methyl-tert-butyl ether). 167
RT-S9 168
24. RT-S9 can be obtained from commercial sources, if available, or prepared following 169
the example protocol in ANNEX 2. 170
25. The protein concentration of each RT-S9 lot should be determined (see ANNEX 2). 171
and each RT-S9 lot should be evaluated for its ability to catalyze Phase I and II 172
biotransformation reactions (see ANNEX 3). Standardized assays to determine Phase I and 173
Phase II enzyme activity are briefly described in ANNEX 3. These characterization assays or 174
a known reference chemical should be used to test a new lot of RT-S9 at the beginning of the 175
test or before the lot is used for the first time. They should also be used occasionally to 176
monitor possible activity losses during storage. 177
26. The inclusion of enzymatically inactive (e.g., heat-inactivated) RT-S9 is mandatory. 178
Incubations using enzymatically inactive RT-S9 serve as a negative control to distinguish 179
between enzymatic biotransformation and abiotic decrease by adsorption to the reaction vial, 180
volatilization, and abiotic degradation (further details are discussed in the guidance 181
document). A protocol for enzyme inactivation by heating is provided in ANNEX 4. 182
Test set-up 183
27. Preliminary experiments that include range finding conditions (e.g., substrate 184
concentration, protein concentration and incubation time) should be conducted to establish 185
reaction conditions needed to reliably measure intrinsic in vitro hepatic clearance of the test 186
chemical. ANNEX 5 details how conditions that result in first-order depletion kinetics can be 187
determined. 188
28. A sufficient number of sampling time points should be obtained to develop a high-189
quality regression of log-transformed chemical concentration data. At least six time points 190
should be used to generate this regression. 191
29. An example test set-up using a single vial approach with seven time points is shown in 192
Figure 1 of ANNEX 6. This test set-up is recommended to test chemicals that are not 193
difficult-to-test (e.g., non-volatile, does not bind to vessel walls, and distributes rapidly 194
through the reaction system) at one test concentration. It generally produces the least variable 195
results and is simplest to perform. For volatile test chemicals, the multiple vial approach is 196
recommended (ANNEX 6, Figure 2). 197
30. Each test consists of at least two independent runs to determine the CL, IN VITRO, INT 198
rate. Each independent run is performed on a different day or on the same day provided that 199
for each run: a) independent fresh stock solutions and working solutions of the test chemical 200
are prepared and b) independently prepared fresh RT-S9 is used. If the calculated regression 201
from the two runs with active RT-S9 are significantly different (e.g., t-test of the slopes with 202
p<0.05), then a third run should be performed. 203

6
31. For each run, one vial each for active RT-S9 and enzymatically inactive RT-S9 is 204
spiked with the test chemical, and one vials for active RT-S9 is spiked with a reference 205
chemical. Samples are collected at each time point (e.g., 2, 10, 20, 30, 60, 90, 120 min). In 206
some cases, additional vials (e.g., duplicates for each vial) may be required to ensure accuracy 207
of the analytical method for the given test chemical. For incubations with enzymatically 208
inactive RT-S9, sampling time points may be reduced if warranted based on preliminary 209
experiments (ANNEX 5). 210
32. In the following paragraphs, the single vial approach is described whereas the multiple 211
vial approach is detailed in ANNEX 6. 212
Preparation of test chemical, buffer, cofactors and stopping solutions 213
33. Stock solution(s) of the test chemical should be prepared in potassium phosphate 214
buffer (ANNEX 7) or in an adequate solvent that is previously tested. Typical solvents 215
include acetone, acetonitrile, and methanol. The stability of the test chemical in the stock 216
solution should be evaluated in advance of the test if stock solutions are not prepared freshly 217
(see OECD Guidance Document RT-HEP and RT-S9 – Section 3.2; 13). 218
34. On the day of the test, the desired spiking concentration of the test chemical is 219
prepared by diluting the stock solution with potassium phosphate buffer (ANNEX 7) or an 220
organic solvent based on the results of the preliminary experiments (see §27; ANNEX 5; 13). 221
If an organic solvent is used, the total amount in the reaction mixture should be minimized as 222
low as possible and should not exceed 1% to avoid inhibition of enzyme activity. It has to be 223
kept in mind that the alamethicin solution contains a significant proportion of organic solvent 224
which contributes to the final solvent concentration (i.e., 0.25%). In general, the test 225
concentration should be as low as possible (according to the LOQ of the analytical method) 226
and result in first order kinetics as determined in the preliminary experiment (§27; ANNEX 227
5). 228
35. ANNEX 7 describes the preparation of the buffers, co-factors and alamethicin 229
solutions needed. Stock solutions can be prepared in advance, e.g., one day before the test 230
and spiking solutions on the day of the test. 231
36. A stopping solution (e.g., methanol, acetonitrile, methylene chloride, methyl tert-butyl 232
ether) is prepared which may include an internal standard. For most tests, 1.5 mL micro-233
centrifuge tubes may be filled with the stopping solution in advance (e.g., 100 µL sample 234
terminated in 400 µL stopping solution) and stored on ice. For volatile solvents (e.g., solvents 235
that vaporize at room temperature, such as methylene chloride, methyl tert-butyl ether), the 236
tubes should remain capped and kept cool, or the solvents should be added directly prior to 237
collection of the time point. For solvents which interact with plastic, glass tubes may be used 238
to stop the reactions (see also OECD Guidance Document RT-HEP and RT-S9 - Section 3.3; 239
13). 240
Preparation of RT-S9 suspension and incubation mixtures 241
37. A sufficient volume of active RT-S9 and enzymatically inactive RT-S9 are thawed 242
and diluted with potassium phosphate buffer (see ANNEX 7) to a 10x higher protein 243
concentration (e.g., 10 mg/mL) compared to the protein concentration in the final reaction 244
mixture (e.g., 1 mg/mL). ANNEX 7 includes an example calculation. The active RT-S9 245
should be thawed in an ice-water bath. An additional volume of e.g., 25-30% is 246

7
recommended to provide a modest excess of biological material for both active and 247
enzymatically inactive RT-S9. For example, if a total of 300 µL diluted RT-S9 is needed for 248
each set of active and inactive RT-S9 respectively, then prepare about a total of 400 µL. 249
38. For the single vial approach as shown in Figure 1 of ANNEX 6, two vials with active 250
and one vial with enzymatically inactive RT-S9 are used, taking into account the number of 251
time points in the test set-up. Note: Excess active RT-S9 should not be re-frozen for later use 252
in depletion tests but may be used for as the preparation of enzymatically inactive RT-S9. 253
Excess inactive RT-S9 may be re-frozen for later use. 254
39. Reaction vials are prepared by adding 400 µL of potassium phosphate buffer pH 7.8 255
(see ANNEX 7) to each of the three vials. The diluted active or enzymatically inactive RT-S9 256
(100 µL each) is added to the corresponding reaction vials. Then, 100 µL of the alamethicin 257
working solution (250 µg/mL) is added to each of the reaction vials and the vials are pre-258
incubated on ice for 15 min. 259
40. A master mix of cofactors (NADPH, UDPGA, GSH, and PAPS) is prepared as 260
described in ANNEX 7. The master mix is mixed well and stored on ice for the least amount 261
of time before addition to the RT-S9 mixture. PAPS degrades rapidly and therefore should be 262
prepared during the pre-incubation with alamethicin and added immediately prior to §40. 263
41. 400 µL of the cofactors master mix is added to each of the pre-incubated reaction vials 264
on ice. Each vial is gently swirled until thoroughly mixed. Refer to Figure 1 in ANNEX 7 for 265
details of the contents in the reaction mixture. 266
42. The reaction mixture vials of active and enzymatically inactive RT-S9 are placed into 267
a shaking water bath or incubator and pre-incubated at the test temperature (e.g., 10-15°C) for 268
10 minutes with gentle shaking. 269
Incubation with test chemical and stopping of reaction 270
43. Test chemical (usually 5 μL; however, this depends on the concentration of the 271
spiking solution) is directly added into the reaction mixture of each vial (usually 1 mL) to 272
initiate the reaction. The vials are swirled to distribute the chemical and loosely capped. 273
44. For sampling at a specified time point, the reaction vial is removed from the water 274
bath or incubator, gently swirled or shaken, and an aliquot (e.g., 100 µL) is removed with a 275
pipette and directly dispensed into the corresponding 1.5 mL micro-centrifuge tube containing 276
ice-cold stopping solution kept on ice (see §35). To ensure quantitative transfer of the 277
sample, pipetting up and down in the solvent three times is recommended. 278
45. The micro-centrifuge tubes are kept on ice until samples from all time points have 279
been collected. It may be useful to refrigerate samples overnight to facilitate complete protein 280
precipitation prior to centrifugation if a water miscible solvent is used as stopping solution. If 281
volatile solvents like methylene chloride, and methyl tert-butyl ether are used, the samples 282
have to be extracted, if possible, directly after stopping the reaction. Preliminary experiments 283
should be performed to confirm complete precipitation of proteins upon termination of the 284
reaction. 285
46. After the sampling is completed or for volatile solvents at each sampling point, micro-286
centrifuge tubes are vortexed (e.g., for 3 min at 1500 to 2000 rpm) and centrifuged (e.g., 5 287

8
min at 20,000 g and 4°C). If recovery of the test chemical in the preliminary experiment is 288
poor, longer vortexing time (e.g., 10 min) may be needed. Some test chemicals may require 289
overnight refrigeration to ensure maximal extraction with the solvent. Additional 290
considerations are provided in OECD Guidance Document RT-HEP and RT-S9 – Section 3.3 291
(13). The supernatant is transferred to analytical HPLC/GC sample vials and stored at -20°C 292
until analysis. 293
ANALYTICAL MEASUREMENTS 294
47. The concentration of the test chemical is determined using a validated analytical 295
method. More details are provided in OECD Guidance Document RT-HEP and RT-S9 – 296
Section 3.1 (13). 297
48. Since the whole procedure is governed essentially by the accuracy, precision and 298
sensitivity of the analytical method used for the test chemical, check experimentally that the 299
accuracy, precision and reproducibility of the chemical analysis, as well as recovery (e.g., 300
80%) of the test chemical from the test medium are satisfactory 301
DETERMINATION OF IN VITRO INTRINSIC CLEARANCE 302
49. The log10-transformed substrate concentrations are plotted against time and should 303
demonstrate a log-linear decline (R2 value >0.85). 304
50. If a visual inspection of the regression shows obvious outliers, a statistically valid 305
outlier test may be applied to remove spurious data points (e.g., as described in [32]) as well 306
as documented justification for their omission. In some cases, non-linear behavior may be 307
observed at the beginning or end of a test, which could be due to problems with dissolution of 308
the test chemical or loss / inhibition of enzyme activity. However, the depletion rate should 309
be determined from the linear portion of the curve, with a minimum of six data points. 310
51. If there is an abiotic loss of test chemical from enzymatically inactive RT-S9 which 311
cannot be avoided by optimization of assay conditions (i.e., abiotic decrease >20%), the rate 312
of this loss process may be subtracted from the measured rate of depletion in active samples 313
to obtain a corrected in vitro intrinsic clearance rate (OECD Guidance Document RT-HEP 314
and RT-S9 §52; 13). In this case, however, it must be verified that the abiotic loss process 315
follows first-order kinetics. 316
52. A first-order elimination rate constant, ke (h-1
), is determined as -2.3 × slope of the log-317
linear decline. 318
53. ke is divided by the measured protein concentration to obtain the CL, IN VITRO, INT 319
(mL/h/mg protein). 320
TEST REPORT 321
54. The test report should include the following: 322
Test chemical 323
Mono-constituent substance: 324
physical appearance, water solubility, and additional relevant 325
physicochemical properties; chemical identification, such as IUPAC or 326

9
CAS name, CAS number, SMILES or InChI code, structural formula, 327
purity, chemical identity of impurities as appropriate and practically 328
feasible, etc 329
Multi-constituent substance, substances of unknown or variable composition, 330
complex reaction products or of biological materials (UVCBs) and mixtures: 331
o characterized as far as possible by chemical identity (see above), 332
quantitative occurrence and relevant physicochemical properties of the 333
constituents. 334
Analytical method for quantification of the test chemical 335
336
RT-S9 337
If purchased: 338
o Commercial source 339
o Rainbow trout supplier 340
o Rainbow trout strain 341
o Acclimation temperature 342
o Fish weight 343
o Liver weight 344
o Gonadosomatic index (for determination of sexual maturity) 345
If prepared in-house, see Reporting Template in ANNEX 2 346
Characterization (see ANNEX 3) 347
348
Test conditions 349
Concentration of test chemical and reference chemical 350
Method of preparation of stock solution(s) of test chemical and reference 351
chemical (name and concentration of solvent, if applicable) 352
Preparation and composition of reagents 353
Preparation and composition of reaction mix 354
Amount of protein in the reaction mix 355
Test set-up: method of incubation (single vial or multi vial approach) 356
Number of replicates (if more than one is used per run) 357
Number of independent runs 358
Incubation temperature 359
Time points 360
Description of preliminary experiments 361
362
Analytical method 363
Complete description of all chemical analysis procedures employed including 364
limits of detection and quantification, variability and recovery efficiency, 365
matrix used for standard preparations, internal standard etc 366
367
Statistical method 368
Description and statistical method used for exclusion of time points and/or runs 369
Results 370

10
Results from any preliminary experiments performed 371
Values from individual vials, time points for each independent run 372
Complete description of all chemical analysis procedures employed including 373
limits of detection and quantification, variability, and recovery 374
Calculated CL, IN VITRO, INT rates from incubations with active and 375
enzymatically inactive RT-S9 376
Average and standard deviation values from independent runs, as well as 377
results from t-tests to compare average CL, IN VITRO, INT rate from the runs 378
Any excluded time points or tests 379
Anything unusual about the test, any deviation from the test guideline and any 380
other relevant information 381
382
REFERENCES 383
1. OECD 2012. Test No. 305: Bioaccumulation in Fish: Aqueous and Dietary Exposure, 384
OECD Guidelines for the Testing of Chemicals, Section 3, OECD Publishing. doi: 385
10.1787/9789264185296-en. 386
2. Nichols, J.W., Schultz, I.R., and Fitzsimmons, P.N. 2006. In vitro-in vivo extrapolation of 387
quantitative hepatic biotransformation data for fish: I. A review of methods, and strategies 388
for incorporating intrinsic clearance estimates into chemical kinetic models. Aquatic 389
Toxicology 78:74-90. 390
3. Cowan-Ellsberry, C.E., Dyer, S.D., Erhardt, S., Bernhard, M.J., Roe, A.L., Dowty, M.E., 391
and Weisbrod, A.V. 2008. Approach for extrapolating in vitro metabolism data to refine 392
bioconcentration factor estimates. Chemosphere 70:1804-1817. 393
4. Dyer, S.D., Bernhard, M.J., Cowan-Ellsberry, C., Perdu-Durand, E., Demmerle, S., and 394
Cravedi, J.-P. 2008. In vitro biotransformation of surfactants in fish. Part I: Linear 395
alkylbenzene sulfonate (C12-LAS) and alcohol ethoxylate (C13EO8). Chemosphere 396
72:850-862. 397
5. Dyer, S.D., Bernhard, M.J., Cowan-Ellsberry, C., Perdu-Durand, E., Demmerle, S., and 398
Cravedi, J.-P. 2009. In vitro biotransformation of surfactants in fish. Part II: Alcohol 399
ethoxylate (C13EO8) and alcohol ethoxylate sulfate (C14EO2S) to estimate 400
bioconcentration potential. Chemosphere 76:989-998. 401
6. Han, X., Nabb, D., Mingoia, R., and Yang, C.-H. 2007. Determination of xenobiotic 402
intrinsic clearance in freshly isolated hepatocytes from rainbow trout (Oncorhynchus 403
mykiss) and rat and its application in bioaccumulation assessment. Environmental Science 404
& Technology 41:3269-3276. 405
7. Laue, H., Gfeller, H., Jenner, K.J., Nichols, J.W., Kern, S., and Natsch, A. 2014. 406
Predicting the bioconcentration of fragrance ingredients by rainbow trout using measured 407
rates of in vitro intrinsic clearance. Environmental Science & Technology 48:9486-9495. 408
8. Mingoia, R.T., Glover, K.P., Nabb, D.L., Yang, C.-H., Snajdr, S.I., and Han, X. 2010. 409
cryopreserved hepatocytes from rainbow trout (Oncorhynchus mykiss): A validation study 410
to support their application in bioaccumulation assessment. Environmental Science & 411
Technology 44:3052-3058. 412
9. Fay, K.A., Fitzsimmons, P.N., Hoffman, A.D., and Nichols, J.W. 2014. Optimizing the 413
use of rainbow trout hepatocytes for bioaccumulation assessments with fish. Xenobiotica 414
44:345-351. 415

11
10. Fay, K.A., Mingoia, R.T., Goeritz, I., Nabb, D.L., Hoffman, A.D., Ferrell, B.D., Peterson, 416
H.M., Nichols, J.W., Segner, H., and Han, X. 2014. Intra- and interlaboratory reliability of 417
a cryopreserved trout hepatocyte assay for the prediction of chemical bioaccumulation 418
potential. Environmental Science & Technology 48:8170-8178. 419
11. OECD xxxx Test No. xxx Determination of in vitro intrinsic clearance using 420
cryopreserved rainbow trout hepatocytes (RT-HEP). 421
12. Nichols, J.W., Huggett, D.B., Arnot, J.A., Fitzsimmons, P.N., and Cowan-Ellsberry C.E. 422
2013. Towards improved models for predicting bioconcentration of well-metabolized 423
compounds by rainbow trout using measured rates of in vitro intrinsic clearance. 424
Environmental Toxicology and Chemistry 32: 1611-1622. 425
13. OECD xxxx. Guidance document No xx Determination of in vitro intrinsic clearance 426
using cryopreserved hepatocytes (RT-HEP) or liver S9 sub-cellular fractions (RTL-S9) 427
from rainbow trout and extrapolation to in vivo intrinsic clearance. 428
14. OECD xxxx. Multi-laboratory ring trial to support development of OECD test guidelines 429
on determination of in vitro intrinsic clearance using cryopreserved rainbow trout 430
hepatocytes and liver S9 sub-cellular fractions. 431
15. Chen, Y., Hermens, J.L.M, Jonker, M.T.O., Arnot, J.A., Armitage, J.M., Brown, T., 432
Nichols, J.W., Fay, K.A., Droge, S.T.J. 2016. Which Molecular Features Affect the 433
Intrinsic Hepatic Clearance Rate of Ionizable Organic Chemicals in Fish? Environmental 434
Science & Technology 50: 12722-12731. 435
16. Johanning, K., Hancock, G., Escher, B., Adekola, A., Bernhard, M.J., Cowan-Ellsberry, 436
C., Domoradzki, J., Dyer, S., Eickhoff, C., Embry, M., Erhardt, S., Fitzsimmons, P., 437
Halder, M., Hill, J., Holden, D., Johnson, R., Rutishauser, S., Segner, H., Schultz, I., and 438
Nichols, J. 2012. Assessment of metabolic stability using the rainbow trout 439
(Oncorhynchus mykiss) liver S9 fraction. Current Protocols in Toxicology 53:14.10.1-28. 440
17. Ekins, S, Maenpaa, J., and Wrighton, S.A. 1999. In vitro metabolism: sub-cellular 441
fractions. In Handbook of drug metabolism (Woolf T.F. ed) pp 363-399, Marcel Dekker, 442
Inc., New York-Basel. 443
18. OECD 1995. Test No. 105: Water Solubility, OECD Guidelines for the Testing of 444
Chemicals, Section 1, OECD Publishing. doi: 10.1787/9789264069589-en. 445
19. OECD 1995. Test No. 107: Partition Coefficient (n-octanol/water): Shake Flask Method, 446
OECD Guidelines for the Testing of Chemicals, Section 1, OECD Publishing. doi: 447
10.1787/9789264069626-en. 448
20. OECD 2006. Test No. 123: Partition Coefficient (1-Octanol/Water): Slow-Stirring 449
Method, OECD Guidelines for the Testing of Chemicals, Section 1, OECD Publishing. 450
doi: 10.1787/9789264015845-en. 451
21. OECD 2004. Test No. 117: Partition Coefficient (n-octanol/water), HPLC Method, OECD 452
Guidelines for the Testing of Chemicals, Section 1, OECD Publishing. doi: 453
10.1787/9789264069824-en. 454
22. OECD 2004. Test No. 111: Hydrolysis as a Function of pH, OECD Guidelines for the 455
Testing of Chemicals, Section 1, OECD Publishing. doi: 10.1787/9789264069701-en. 456
23. OECD 2006. Test No. 104: Vapour Pressure, OECD Guidelines for the Testing of 457
Chemicals, Section 1, OECD Publishing. doi: 10.1787/9789264069565-en. 458

12
24. OECD 1992. Test No. 301: Ready Biodegradability, OECD Guidelines for the Testing of 459
Chemicals, Section 3, OECD Publishing. doi: 10.1787/9789264070349-en. 460
25. OECD 2006. Test No. 310: Ready Biodegradability - CO2 in sealed vessels (Headspace 461
Test), OECD Guidelines for the Testing of Chemicals, Section 3, OECD Publishing. doi: 462
10.1787/9789264016316-en. 463
26. OECD 2006. OECD Series on Testing and Assessment No. 54. Current approaches in the 464
statistical analysis of ecotoxicity data: A guidance to application. Available on: 465
http://www.oecd.org/officialdocuments/publicdisplaydocumentpdf/?doclanguage=en&cot466
e=env/jm/mono%282006%2918. 467
468

13
ANNEX 1 469
ABBREVIATIONS & DEFINITIONS 470
BCF Bioconcentration factor (L/kg) 471
CL, IN VITRO, INT in vitro intrinsic clearance (mL/h/106 cells or mL/h/mg 472
protein) 473
CL, IN VIVO, INT in vivo intrinsic clearance (mL/h/g fish) 474
CYP Cytochrome P450 475
DTT DL-Dithiothreitol 476
EDTA Ethylenediaminetetraacetic acid 477
EROD Ethoxyresorufin-O-deethylase 478
First-order depletion kinetics A chemical reaction in which the rate of decrease in the 479
number of molecules of a substrate is proportional to the 480
concentration of substrate molecules remaining 481
GC Gas Chromatography 482
GSH L-Glutathione 483
GSI Gonadosomatic index 484
GST Glutathione transferase 485
HBSS Hanks' Balanced Salt Solution 486
HEPES 4-(2-hydroxyethyl)-1-piperazineethanesulfonic acid) 487
HPLC High Performance Liquid Chromatography 488
IVIVE model In vitro-in vivo extrapolation model 489
ke Elimination rate constant (h-1
) 490
Kow n-Octanol-water partition coefficient 491
KM Michaelis-Menten constant 492
LOQ Limit of quantification 493
MS-222 Tricaine methanesulfonate 494
NADPH Nicotinamide adenine dinucleotide 2'-phosphate 495
PAPS Adenosine 3'-phosphate 5'-phosphosulfate 496

14
pKa Acid dissociation constant 497
rpm Revolutions per minute 498
RT-S9 Rainbow trout liver S9 subcellular fraction 499
SULT Sulfotransferase 500
S9 sub-cellular fraction Supernatant fraction obtained from an organ (usually 501
liver) homogenate by centrifuging at 9000 g for 20 502
minutes in a suitable medium; this fraction contains 503
cytosol and microsomes; note S9 from fish is centrifuged 504
at 13,000 g 505
TG Test Guideline 506
UDPGA Uridine 5'-diphosphoglucuronic acid 507
UGT Uridine 5'-diphospho-glucuronosyltransferase 508
Vmax Maximum enzymatic rate at saturating test chemical 509
concentration 510
511

15
ANNEX 2 512
EXAMPLE PROTOCOL FOR PREPARATION OF RAINBOW TROUT LIVER S9 513
SUB-CELULLAR FRACTION (RT-S9) 514
NOTE: RT-S9 can be obtained from commercial sources, if available, or prepared following 515
the example protocol provided in this Annex. The protocol is adapted from a published 516
protocol (Johanning et al., 2015 [1]) and was used in the ring trial (see OECD ring trial 517
report; 2). 518
FISH 519
1. RT-S9 should be preferably obtained from sexually immature rainbow trout since 520
previous work has shown that sexually immature rainbow trout (Oncorynchus mykiss) do not 521
differ with respect to their metabolic capabilities in relation to their gender (1, 3, 4). RT-S9 522
can therefore be collected without regard to gender. 523
2. If fish are obtained from a supplier, they should be acclimatized in the laboratory for 524
at least 2 weeks prior to use. Fish should not receive treatment for disease in the two-week 525
acclimation period and any disease treatment by the supplier should be completely avoided if 526
possible. Fish with clinical signs of disease should not be used. 527
3. Rainbow trout are typically raised at 10-15°C. The temperature of the holding tank in 528
the laboratory should be similar and maintained at ± 2°C. Holding density of fish should be 529
low enough to ensure optimal growth and welfare. 530
4. Measure and record water chemistry characteristics at periodic intervals, including: 531
pH, total alkalinity (as mg/L CaCO3), dissolved oxygen (mg/L, converted to percent 532
saturation), and total ammonia (mg/L) (Table 1). 533
5. Record fish maintenance details as well, including: photoperiod, feeding regime, feed 534
type, water temperature, holding density (kg fish/liter tank volume), and number of fish/tank 535
(Table 1). This specific information should be reported to allow for isolation-specific 536
parameters to be used in subsequent applications, such as BCF prediction models. 537
PROCEDURE SUMMARY 538
6. It is strongly recommended to use fresh liver tissue for S9 preparation. Previous work 539
has shown that freezing and thawing fish liver tissue reduces the activities of CYP enzymes 540
(5, 6). 541
7. Generally, pooling RT-S9 from several fish (three to six) is recommended. This 542
approach will diminish the influence of a single fish, and better represent a population. 543
8. After humanely killing of the fish (see §20), the hepatic portal vein is cannulated, and 544
the liver is perfused with a Ca2+
/Mg2+
-free balanced salt buffer (clearing buffer); see Table 1) 545
to clear the liver of blood. 546
9. The liver is excised from the fish, homogenized in homogenization buffer (Table 1) 547
and centrifuged at 13,000 - 15,000 x g for 20 min at 4°C. 548

16
10. The resulting supernatant from the centrifugation is aspirated and aliquoted out in 549
micro-centrifuge tubes or cryovials and stored at -80°C. 550
APPARATUS AND MATERIAL 551
11. Apparatus 552
Vessels to expose fish to anesthetic 553
Digital balance (1 g – 2000 g), weigh boats 554
Forceps, large and small sharp surgical scissors, one-edge razor blades 555
Refrigerated centrifuge (e.g., for 50 mL tubes) 556
Conical centrifuge tubes, e.g., 50 mL 557
23-G × ¾ safety winged infusion set (butterfly catheter) 558
30 mL disposable plastic syringes 559
Peristaltic pump 560
Pump tubing 561
6 cm glass petri dishes, pre-chilled 562
Glass beakers 563
30 mL Wheaton Potter-Elvehjem mortar with Teflon pestle 564
Multi-speed bench-top drill press 565
Pipets 566
Pipet tips 567
Pipet aid for serological pipets 568
Serological pipets 569
1.8 mL working volume cryogenic storage tubes 570
Micro-centrifuge tubes 571
572
12. Chemicals and reagents 573
Tricaine Methanesulfonate (MS-222) 574
Sodium bicarbonate (NaHCO3) 575
Hanks’ Balanced Salt Solution (HBSS) without Ca2+
and Mg2+
576
4-(2-hydroxyethyl)-1-piperazineethanesulfonic acid) (HEPES) 577
Tris[hydroxymethyl]aminomethanehydrochloride) (Tris-Cl), 1 M; pH 7.8 578
Potassium chloride (KCl), 1 M 579
Ethylenediaminetetraacetic acid disodium salt (EDTA-Na2; 0.5 M) 580
DL-Dithiothreitol (DTT), 100 mM) 581
Protease inhibitor cocktail (optional) 582
Sucrose 583
Sodium hydroxide (NaOH), 1 M 584
Potassium hydroxide (KOH), 1 M 585
Commercial protein assay to determine RT-S9 protein content. 586
Preparation of reagents and solutions 587
13. The tricaine methanesulfonate (MS-222; 150 mg/L) should be prepared with water 588
from the same source used to maintain the fish prepared; e.g., for 8 L, 1.2 g MS-222 is added 589
to the water and mixed until dissolved. A predetermined amount of NaHCO3 is used to 590
17
maintain the source water pH. If the water is low-alkalinity, the required mass of NaHCO3 is 591
approximately 3 times that of the MS-222. 592
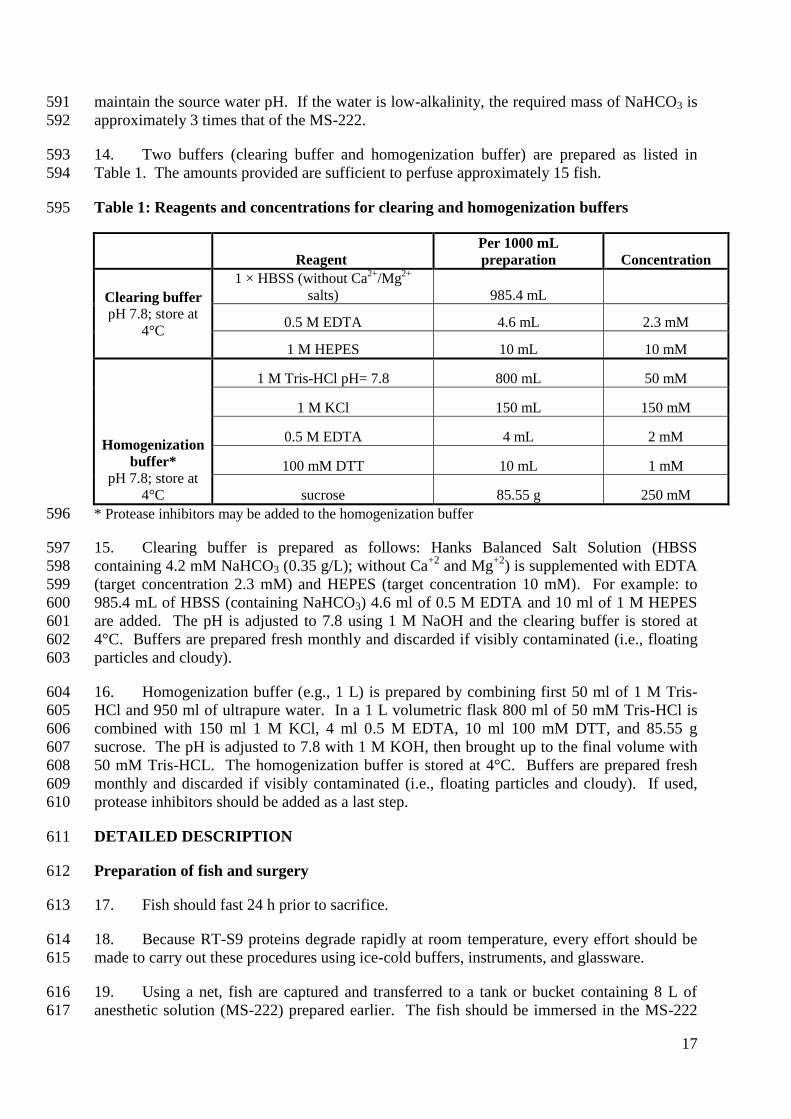
14. Two buffers (clearing buffer and homogenization buffer) are prepared as listed in 593
Table 1. The amounts provided are sufficient to perfuse approximately 15 fish. 594
Table 1: Reagents and concentrations for clearing and homogenization buffers 595
Reagent
Per 1000 mL
preparation Concentration
Clearing buffer
pH 7.8; store at
4°C
1 × HBSS (without Ca2+
/Mg2+
salts) 985.4 mL
0.5 M EDTA 4.6 mL 2.3 mM
1 M HEPES 10 mL 10 mM
Homogenization
buffer*
pH 7.8; store at
4°C
1 M Tris-HCl pH= 7.8 800 mL 50 mM
1 M KCl 150 mL 150 mM
0.5 M EDTA 4 mL 2 mM
100 mM DTT 10 mL 1 mM
sucrose 85.55 g 250 mM
* Protease inhibitors may be added to the homogenization buffer 596
15. Clearing buffer is prepared as follows: Hanks Balanced Salt Solution (HBSS 597
containing 4.2 mM NaHCO3 (0.35 g/L); without Ca+2
and Mg+2
) is supplemented with EDTA 598
(target concentration 2.3 mM) and HEPES (target concentration 10 mM). For example: to 599
985.4 mL of HBSS (containing NaHCO3) 4.6 ml of 0.5 M EDTA and 10 ml of 1 M HEPES 600
are added. The pH is adjusted to 7.8 using 1 M NaOH and the clearing buffer is stored at 601
4°C. Buffers are prepared fresh monthly and discarded if visibly contaminated (i.e., floating 602
particles and cloudy). 603
16. Homogenization buffer (e.g., 1 L) is prepared by combining first 50 ml of 1 M Tris-604
HCl and 950 ml of ultrapure water. In a 1 L volumetric flask 800 ml of 50 mM Tris-HCl is 605
combined with 150 ml 1 M KCl, 4 ml 0.5 M EDTA, 10 ml 100 mM DTT, and 85.55 g 606
sucrose. The pH is adjusted to 7.8 with 1 M KOH, then brought up to the final volume with 607
50 mM Tris-HCL. The homogenization buffer is stored at 4°C. Buffers are prepared fresh 608
monthly and discarded if visibly contaminated (i.e., floating particles and cloudy). If used, 609
protease inhibitors should be added as a last step. 610
DETAILED DESCRIPTION 611
Preparation of fish and surgery 612
17. Fish should fast 24 h prior to sacrifice. 613
18. Because RT-S9 proteins degrade rapidly at room temperature, every effort should be 614
made to carry out these procedures using ice-cold buffers, instruments, and glassware. 615
19. Using a net, fish are captured and transferred to a tank or bucket containing 8 L of 616
anesthetic solution (MS-222) prepared earlier. The fish should be immersed in the MS-222 617

18
solution for at least 1 min. The fish is properly anesthetized when opercular movement has 618
ceased, there is a total loss of equilibrium and muscle tone, and no response to stimuli (a firm 619
squeeze at the base of the tail may be used to determine response to stimuli). Subsequently, 620
the fish should be humanely killed with a sharp blow to the head. 621
20. The weight and length of the fish are recorded. 622
21. The fish is placed with the ventral surface facing up. As illustrated in Figure 1, the 623
following incisions are recommended: a) midline incision from the vent to the isthmus, taking 624
care not to cut too deeply into the body cavity; followed by b) a lateral incision at the caudal 625
end of the midline incision extending about half way up to the dorsal surface; and c) a similar 626
lateral incision just caudal to the operculum. 627
22. By folding back and cut away the resulting flap, the body cavity is exposed and the 628
liver should be dark red (Figure 2). The ventral branch of the hepatic portal vein (running 629
from the intestine to the liver hilus) should be located and carefully cleared from any 630
obscuring connective tissue. 631
23. It is optional to loosely loop silk suture material (4/0) under the hepatic portal vein 632
before cannulating it (Figure 2) using a safety winged infusion needle set, 23-G × 3/4-in., 633
attached to a 30 mL syringe filled with ice-cold clearing buffer (see Table 1). The 4/0 silk 634
suture is tightly drawn around the needle and tied off to prevent leakage of the clearing buffer 635
from the insertion site. The hepatic vein(s) leading from the liver to the heart is severed to 636
permit drainage of the tissue. 637
Liver perfusion 638
24. The liver is perfused (about 10 to 15 mL/min) with 20 to 30 mL of ice-cold clearing 639
buffer until the tissue is pale in color (i.e., blood is removed; Figure 3). The liver is gently 640
massaged while perfusing to aid flow of the blood, especially areas where the blood is 641
concentrated. Removal of blood is required to ensure that RT-S9 is free of blood-borne 642
metabolizing enzymes (e.g., plasma proteases). 643
25. After removal of the blood, the liver is excised and placed on an ice-cold petri dish, 644
taking care not to cut open the gall bladder (a thin-walled sac, usually containing dark green 645
or brown bile). The gall bladder is carefully removed by using scissors to sever the 646
connective tissue that attaches it to the liver. The liver is rinsed with 5 to 10 mL of ice-cold 647
clearing buffer, kept on hand in a 30 mL syringe for this purpose. Note: It is important that 648
gall bladder bile does not contaminate the liver RT-S9 since this will denature and inactivate 649
metabolic enzymes. This rinse step is employed as a precaution to deal with possible contact 650
of the liver with small amounts of bile. Livers that come in contact with large amounts of bile 651
should be rejected from further processing if possible. 652
26. Before weighing the livers to the nearest 0.01 g, excess fluid is removed from the liver 653
with a paper towel. The liver weight is recorded (Table 1). The liver is placed in a 250 mL 654
beaker containing 150 mL ice-cold homogenization buffer kept on ice until all the fish for that 655
specific batch are sampled and livers collected. 656
27. The gonads (ovaries or testes) are removed in their entirety and weigh to the nearest 657
0.01 g. The gonadosomatic index (GSI) of the donor animal is determined by calculating the 658
gonad weight divided by the whole animal weight (GSI = (100 x the gonad mass) /whole 659

19
animal mass). Both the gonad weight and GSI are recorded (Table 1). The gonads (testes or 660
ovaries) appear as two strands of tissue that run along the length of the peritoneal cavity on 661
the ventral side of the kidney. Sexual maturity in trout may be determined by the measured 662
GSI. Generally, males with a GSI <0.05 and females with a GSI <0.5 may be considered 663
sexually immature. Alternatively, sexual maturity may be determined using histology (7). 664
Detailed descriptions of gonadal development in trout may be found in (8-10). 665
28. The desired number of fish is sampled as described in §§16-26. It is important to 666
proceed quickly. The total length of time from netting a fish to placing a liver in the 667
homogenization buffer should be <15 min. 668
RT-S9 processing and preparation 669
29. After sampling and weighing the livers, these are treated as follows. The livers are cut 670
into small (<0.5 cm2) pieces with a pair of scissors and/or one edge razor blades. 671
30. The minced tissue in homogenization buffer is transferred to a Potter-Elvehjem mortar 672
(pre-chilled and kept on ice) and the beaker rinsed with an additional volume (equivalent to 673
the liver weight) of homogenization buffer. This volume along with any remaining tissue is 674
transferred to the mortar. The tissue is homogenized using a Teflon pestle (normal clearance 675
0.1 to 0.15 mm) attached to a bench-top drill press set at low speed (e.g., 500 rpm). This 676
should be done by forcing the pestle slowly (10 to 15 sec per stroke) to the bottom of the 677
mortar and should be repeated four to five times. Additional homogenization is not required 678
and may cause protein denaturation. 679
31. The liver homogenate is poured into a 50 mL round-bottom centrifuge tube (pre-680
chilled and kept on ice). All livers are processed as described in §§ 23-27. Assuming the fish 681
size range (400 to 600 g) and sample number (four to five) recommended here, the expected 682
volume of raw liver homogenate is approximately 50 to 70 mL. 683
32. The liver homogenates are centrifuged for 20 min at 13,000 × g, 4°C. The tubes are 684
gently removed from the centrifuge. Depending on the lipid content of livers being sampled, 685
a layer of yellow lipid may form on the surface of the supernatant. This layer is aspirated 686
with a Pasteur pipet and discarded. The remaining supernatant (i.e., the pooled RT-S9) is 687
decanted or aspirated with a serological pipet into a chilled 150 mL beaker taking care not to 688
transfer any material from the pellet. The pellet at the bottom of the centrifuge tube should be 689
relatively firm and brown in color. A lighter-colored layer may form on the surface of the 690
pellet. 691
33. The pooled RT-S9 is mixed using a glass rod or equivalent, then aliquots (e.g., 0.5 692
mL) of the solution are transferred to pre-labeled 1.8 mL cryogenic storage tubes or micro-693
centrifuge tubes and immediately snap frozen in liquid nitrogen (or equivalent). Note: It is 694
extremely important to keep RT-S9 on ice at all times. Four to five fish of the recommended 695
size will yield 35 to 45 mL of RT-S9. Assuming that this is divided into 0.5 mL aliquots for 696
storage, it will be necessary to pre-label 70 to 90 cryogenic storage tubes. Labeled tubes 697
should be chilled before samples are added and stored not more than 24 h in a −20°C freezer 698
until just prior to use. 699
34. The RT-S9 containing storage tubes are collected and transferred to liquid nitrogen or 700
a -80°C freezer for storage (for at least 2 years). 701

20
35. The total volume of RT-S9 obtained from a sampling effort is recorded. This value is 702
used to calculate the concentration of RT-S9 protein per gram of liver tissue. 703
Determination of RT-S9 protein content 704
36. Three RT-S9 samples are thawed in an ice-water bath (e.g., micro-centrifuge tube 705
holders floating in a beaker containing ice and water) and placed on ice once the ice crystals 706
are dissolved. The protein content is determined in a well-mixed homogenous RT-S9 sample 707
using standard assay (e.g., 11, 12) or a commercially available protein assay kit following the 708
manufacturer’s instructions (e.g., 96-well flat-bottom plates and a microplate reader, 709
bioanalyzer, cuvettes and spectrophotometer or other instrumentation and methodologies that 710
allow accurate protein concentration determination). The dilution of RT-S9 used for the 711
protein concentration determination should be such that the value falls in the linear section of 712
the standard curve to avoid under or overestimations of protein content. The protein content 713
of the given RT-S9 lot is the average of replicate sample vials. 714

21
REPORTING TEMPLATE 715
716
717 Table 1. Record of fish information, maintenance conditions, and individual fish 718
observations. 719
720

22
FIGURES 721
722
723
724 725 Figure 1. Incisions required exposing the internal organs of the fish after it has been 726
euthanized. The fish in this picture is sexually mature and is shown for illustrative purposes 727
only. Sexually immature animals should be used to obtain RT-S9. (Figure used with 728
permission from Johanning et al., 2012 [1]). 729
730
731
732
733 734 Figure 2. Cannulation of the hepatic portal vein to clear the liver of blood. (Figure used with 735
permission from Johanning et al., 2012 [1]). 736

23
737 738 Figure 3. Blanched appearance of a liver that has been successfully cleared of blood. The 739
fish in this picture is sexually mature and is shown for illustrative purposes only. Sexually 740
immature animals should be used to obtain RT-S9. (Figure used with permission from 741
Johanning et al., 2012 [1]). 742
743
744
REFERENCES 745
746 1. Johanning, K., Hancock, G., Escher, B., Adekola, A., Bernhard, M.J., Cowan-Ellsberry, 747
C., Domoradzki, J., Dyer, S., Eickhoff, C., Embry, M., Erhardt, S., Fitzsimmons, P., 748
Halder, M., Hill, J., Holden, D., Johnson, R., Rutishauser, S., Segner, H., Schultz, I., and 749
Nichols, J. 2012. Assessment of metabolic stability using the rainbow trout 750
(Oncorhynchus mykiss) liver S9 fraction. Current Protocols in Toxicology 53:14.10.1-28. 751
2. OECD xxxx. Multi-laboratory ring trial to support development of OECD test guidelines 752
on determination of in vitro intrinsic clearance using cryopreserved rainbow trout 753
hepatocytes and liver S9 sub-cellular fractions. 754
3. Johanning, K., Gauvin, R., Palmer, M., Lehnert, K., Shaw, M., Dungan, L., Whisnart,R., 755
Lohnes, K., and Hill, J. 2010. In vitro rainbow trout (Oncorhynchus mykiss) liver S9 756
metabolism assay: optimizing the assay conditions to determine chemical bioaccumulation 757
potential. SETAC Europe 20th Annual Meeting, Seville, Spain. 758
4. Fay, K.A., Fitzsimmons, P.N., Hoffman, A.D., and Nichols, J.W. 2014. Optimizing the 759
use of rainbow trout hepatocytes for bioaccumulation assessments with fish. Xenobiotica 760
44:345-351. 761
5. Förlin, L., and Andersson, T. 1985. Storage conditions of rainbow trout liver cytochrome 762
P-450 and conjugating enzymes. Comparative Biochemistry and Physiology Part B 763
80:569-572. 764

24
6. Lindström-Seppä, P., and Hänninen, O. 1988. Sampling and storage conditions of rainbow 765
trout liver affects monooxygenase and conjugation enzymes. Comparative Biochemistry 766
and Physiology Part C 89:221-224. 767
7. Blazer, V. 2002. Histopathological assessment of gonadal tissue in wild fishes. Fish 768
Physiology and Biochemistry 26:85-1201. 769
8. Billard, R. and Escaffre, A. 1975. Identification of spermatogenesis stages in the rainbow 770
trout based on gonad morphology and spermiation (in French). Bulletin français de la 771
pêche et de la pisciculture 256:111-118. 772
9. Gomez, J.M., Mourot,B., Fostier, A., and Le Gac, F. 1999. Growth hormone receptors in 773
ovary and liver during gametogenesis in female rainbow trout (Oncorhynchus mykiss). 774
Journal of Reproduction and Fertility 115:275-285. 775
10. Le Gac, F., Thomas, J.L., Mourot, B., and Loir, M. 2001. In vivo and in vitro effects of 776
prochloraz and nonylphenol ethoxylates on trout spermatogenesis. Aquatic Toxicology 777
53:187-200. 778
11. Bradford, M. M. 1976. A rapid and sensitive method for the quantitation of microgram 779
quantities of protein utilizing the principle of protein-dye binding. Analytical 780
Biochemistry 72:248–254. 781
12. Lowry, O. H., Rosebrough, N. J., Farr, A. L., Randall, R. J. 1951. Protein measurement 782
with the Folin phenol reagent. Journal of Biological Chemistry 193:265-275. 783
784

25
ANNEX 3 785
CHARACTERIZATION OF RAINBOW TROUT LIVER S9 SUB-CELLULAR 786
FRACTION (RT-S9) 787
1. Each isolated RT-S9 lot should be evaluated for the ability to catalyze Phase I and II 788
biotransformation reactions. These characterization assays may be performed on freshly 789
prepared or thawed RT-S9 fractions. 790
2. Suggested standardized assays for measuring Phase I and Phase II biotransformation 791
activity are listed in Table 1 and briefly described in (1). Table 1 provides an overview of the 792
methods most commonly used, the substrates, and key references. Results from these assays 793
should be included in the Reporting Template. 794
3. Activity of RT-S9 may also be evaluated using well-characterized, known test 795
chemicals. 796
4. Generally, the RT-S9 is diluted to the necessary protein concentration specified by the 797
particular assay. The results are then normalized to protein content, determined as described 798
in ANNEX 2. 799
5. If the likely pathway for biotransformation of a particular test chemical is known, it 800
may be advisable to evaluate this pathway in advance, assuming that a standardized assay for 801
measuring this activity is available. Assays that evaluate endpoints (e.g., enzyme activity at 802
30 min) or kinetic activity determination can be used. If comparing results with other 803
laboratories, the exact conditions (e.g., substrate concentration, protein concentration, 804
incubation time(s), endpoint or time points) utilized should be considered. 805
806

26
Table 1: List of commonly-used enzyme activity assays, substrates, and references that can 807
be used to characterize activity of RT-S9. 808
Assay / Activity Enzyme Reaction type Substrate Reference(s)
Phase I
Ethoxycoumarin O-
deethylation
(ECOD)
CYP1A O-deethylation 7-
Ethoxycoumarin
2, 3, 4
7-ethoxyresorufin
O-dealkylation
(EROD)
CYP1A O-dealkylation 7-
Ethoxyresorufin
5
7-methoxyresorufin
O-dealkylation
(MROD)
CYP1A O-dealkylation 7-
Methoxyresorufin
5
7-
pentoxyresorufinO-
dealkylation
(PROD)
CYP2B O-dealkylation 7-
Pentoxyresorufin
5
Testosterone 6β-
hydroxylation
CYP3A Aromatic
ring
hydroxylation
Testosterone 6
Chlorzoxazone 6-
hydroxylation
CYP2E1 Aromatic
ring
hydroxylation
Chlorzoxazone 7
Lauric acid 11-
hydroxylation
CYP2K1 Long-chain
aliphatic
hydroxylation
Lauric acid 5
p-nitrophenyl
acetate hydrolysis
Carboxylesterase Hydrolysis p-nitrophenyl
acetate
8
Phase
II
CDNB-glutathione
conjugation
GST Glutathione
conjugation
1-chloro-2,4-
dinitrobenzene
9
p-Nitrophenol
glucuronidation
UGT Glucuronidation p-Nitrophenol 10, 11
809
REFERENCES 810 811
1. Johanning, K., Hancock, G., Escher, B., Adekola, A., Bernhard, M.J., Cowan-Ellsberry, 812
C., Domoradzki, J., Dyer, S., Eickhoff, C., Embry, M., Erhardt, S., Fitzsimmons, P., 813
Halder, M., Hill, J., Holden, D., Johnson, R., Rutishauser, S., Segner, H., Schultz, I., and 814
Nichols, J. 2012. Assessment of metabolic stability using the rainbow trout 815
(Oncorhynchus mykiss) liver S9 fraction. Current Protocols in Toxicology 53:14.10.1-28. 816
2. Edwards, A.M., Glistak, M.L., Lucus, C.M., and Wilson, P.A. 1984. 7-ethoxycoumarine 817
deethylase activity as a convenient measure of liver drug metabolizing enzymes: 818
Regulation in cultured hepatocytes. Biochemical Pharmacology 33:1537–1546. 819
3. Cravedi, J.P., Perdu-Durand, E., and Paris, A. 1998. Cytochrome P450-dependent 820
metabolic pathways and glucuronidation in trout liver slices. Comparative Biochemistry 821
and Physiology Part C 121:267–275. 822
4. Leguen, I., Carlsson, C., Perdu-Durand, E., Prunet, P., Part, P., and Cravedi, J.P. 2000. 823
Xenobiotic and steroid biotransformation activities in rainbow trout gill epithelial cells in 824
culture. Aquatic Toxicology 48:165–176. 825
5. Nabb, D.L., Mingoia, R.T., Yang, C.H., and Han, X. 2006. Comparison of basal level 826
metabolic enzyme activities of freshly isolated hepatocytes from rainbow trout 827
(Oncorhynchus mykiss) and rat. Aquatic Toxicology 80:52–59. 828

27
6. Oesch, F., Wagner, H., Platt, K.L., and Arand, M. 1992. Improved sample preparation for 829
the testosterone hydroxylation assay using disposable extraction columns. Journal of 830
Chromatography 582:232–235. 831
7. Peter, R., Bocker, R., Beaune, P.H., Iwasaki, M., Guengerich, F.P., and Yang, C.S. 1990. 832
Hydroxylation of chlorzoxazone as a specific probe for human liver cytochrome P-833
450IIE1. Chemical Research in Toxicology 3:566–573. 834
8. Wheelock, C. E., Eder, K. J., Werner, I., Huang, H., Jones, P. D., Brammell, B. F., Elskus, 835
A. A., and Hammock, B. D. 2005. Individual variability in esterase activity and CYP1A 836
levels in Chinook salmon (Oncorhynchus tshawytscha) exposed to esfenvalerate and 837
chlorpyrifos. Aquatic Toxicology 74: 172-192. 838
9. Habig, W.H., Pabst, M.J., and Jakoby, W.B. 1974. Glutathione S-transferases. The first 839
enzymatic step in mercapturic acid formation. Journal of Biological Chemistry 249:7130–840
7139. 841
10. Castren, M., and Oikari A. 1983. Optimal assay conditions for liver UDP-842
glucuronosyltransferase from the rainbow trout, Salmo gairdneri. Comparative 843
Biochemistry and Physiology Part C 76:365–369. 844
11. Ladd, M.A., Fitzsimmons, P.N., and Nichols, J.W., 2016. Optimization of a UDP-845
glucuronosyltransferase assay for trout liver S9 fractions: activity enhancement by 846
alamethicin, a pore-forming peptide, Xenobiotica 46:1066-1075. 847
848

28
ANNEX 4 849
PREPARATION OF ENZYMATICALLY INACTIVE RAINBOW TROUT LIVER S9 850
SUB-CELLULAR FRACTION (RT-S9) 851
1. It is suggested that laboratories consider preparing a large volume of enzymatically 852
inactive RT-S9 in advance, and freeze them as aliquots (e.g., 0.5 mL). 853
2. RT-S9 is enzymatically inactivated to provide negative control material for the 854
substrate depletion test. Inactivation is routinely achieved by heating at 100°C (in boiling 855
water) in a capped vial. The resulting enzymatically inactive material may be processed using 856
a hand-held homogenizer to produce a sample that can be easily pipetted if there is excessive 857
agglutination in the material (1). 858
3. If there is a substantial decrease (>20%) of the test chemical in the enzymatically 859
inactive RT-S9 control, an alternative negative control may be used (see OECD Guidance 860
Document RT-HEP and RT-S9, Annex 4 [2]). 861
4. Equipment: 862
Hot plate 863
Beaker with water (water bath) 864
Vessel for boiling the RT-S9 within the water bath with a cap 865
hand-held tissue homogenizer (e.g., 15 mL) (Optional) 866
1.5 mL micro-centrifuge tubes 867
5. Material: 868
RT-S9 with known protein content 869
6. The volume of the suspension should be recorded and the suspension transferred to a 870
heat-safe vessel (preferably glass). 871
7. A beaker of water is heated on a hotplate and the water brought to boiling. A capped 872
vessel with the RT-S9 suspension is placed into the boiling water bath, and the suspension 873
brought to a slow boil for 15 min. 874
8. After the suspension has cooled down, this is transferred to a graduated cylinder and 875
the volume adjusted by adding 100 mM potassium phosphate buffer to maintain the desired 876
concentration. OPTIONAL: If excess agglutination is observed, transfer to a handheld 877
homogenizer. Homogenize the sample by hand until the solution is homogeneous (1). 878
9. The RT-S9 should be diluted with the 100 mM potassium phosphate buffer to the 879
desired concentration (e.g., 10 mg/mL) before use in a test. 880
10. Aliquots (e.g., 0.5 mL) of the enzymatically inactive RT-S9 are transferred into 1.5 881
mL micro-centrifuge tubes and stored at -20°C until used. 882
883

29
REFERENCES 884
1. Johanning, K., Hancock, G., Escher, B., Adekola, A., Bernhard, M.J., Cowan-Ellsberry, 885
C., Domoradzki, J., Dyer, S., Eickhoff, C., Embry, M., Erhardt, S., Fitzsimmons, P., 886
Halder, M., Hill, J., Holden, D., Johnson, R., Rutishauser, S., Segner, H., Schultz, I., and 887
Nichols, J. 2012. Assessment of metabolic stability using the rainbow trout 888
(Oncorhynchus mykiss) liver S9 fraction. Current Protocols in Toxicology 53:14.10.1-28. 889
2. OECD xxxx. Guidance document No xx Determination of in vitro intrinsic clearance 890
using cryopreserved hepatocytes (RT-HEP) or liver S9 sub-cellular fractions (RTL-S9) 891
from rainbow trout and extrapolation to in vivo intrinsic clearance. 892
893

30
ANNEX 5 894
PRELIMINARY EXPERIMENTS TO ESTABLISH REACTION CONDITIONS 895
1. The primary goal of conducting preliminary experiments is to determine reaction 896
conditions that result in first-order depletion kinetics. These experiments are used to establish 897
a sampling schedule that captures the depletion of the test chemical (as significantly different 898
from the negative controls) while preserving the ability to quantify the test chemical 899
concentration in the system at final points. Preliminary experiments are performed with RT-900
S9 that has been characterized for Phase I and II metabolic enzyme activity (refer to ANNEX 901
3). 902
2. An appropriate analytical method, of known accuracy, precision, and sensitivity, for 903
the quantification of the test chemical in the test medium should be available, together with 904
details of sample preparation and storage. The analytical limit of quantification (LOQ) of the 905
test chemical in the test medium should be known. 906
3. To obtain a chemical depletion rate for use in the in vitro to in vivo extrapolation 907
model, it is generally desirable to achieve 20% to 90% depletion of the test chemical over the 908
course of the test. Variables that can be tested to achieve this goal include: protein 909
concentration, starting test chemical concentration, and total incubation time (1). 910
4. In addition to these range finding conditions, other considerations for achieving an 911
accurate substrate depletion measurement include: sensitivity of the analytical method and the 912
need for an internal standard, solvent selections to dissolve the test chemical, introduction into 913
the system and reaction termination, and the use of positive (reference chemical) and negative 914
controls (refer to ANNEX 4 and [2]). 915
5. It is generally recommended that substrate depletion experiments, including 916
preliminary experiments may be conducted at protein concentrations of 0.25-2 mg/mL, with 1 917
mg/mL most commonly used. 918
6. The starting test chemical concentration is determined by the need to achieve first-919
order kinetics as well as the sensitivity of the analytical method, keeping in mind the possible 920
need to measure concentrations substantially lower than starting values (i.e., at later time 921
points). The sensitivity of the analytical method should be able to accurately measure all time 922
points or 10% of the initial test chemical concentration. Theory dictates that the likelihood of 923
first-order kinetics increases as the starting concentration is decreased below the Michaelis-924
Menten constant, KM. The KM is the substrate concentration at which the reaction rate is ½ 925
Vmax (maximum rate achieved by the system at substrate maximum saturation concentration). 926
Realistically, it is not always possible to achieve these concentrations due to detection 927
limitations of the analytical method for the test chemical. Practical experience suggests that a 928
starting concentration in the very low micromolar/high nanomolar range (e.g., ≤ 1.0 μM) 929
often yields satisfactory results, although users should try to perform depletion experiments at 930
the lowest reasonable test chemical concentration. Further discussion of chemical 931
concentrations is included in the OECD Guidance Document RT-HEP and RT-S9 (2). 932
7. In order to choose appropriate starting test chemical concentration, three 933
concentrations may be evaluated: a) 1.0 μM or other concentration based on previous 934
information, if available; b) lowest concentration-quantifiable assuming 50% depletion, and c) 935
a concentration in between a) and b). 936

31
8. A decision tree may be employed to make the final decisions regarding the starting 937
incubation concentration for each test chemical. 938
939 940
9. Preliminary experiments are generally conducted with a limited number of time points 941
(e.g., 0.1, 30 and 1 h) and replication (e.g., one duplicate per time point). The initial test 942
chemical concentration resulting in the most rapid depletion-rate is usually preferred for the 943
definitive test. If several test chemical concentrations generate similar depletion rates, the 944
higher concentration is preferred as it minimizes detection limit challenges. 945
10. Depending on the need, the sampling scheme may span <10 min up to usually up to 2 946
h, for very slowly biotransformed test chemicals up to 4 h may be possible incorporating the 947
recommended six or more individual sampling time points. 948
11. First-order depletion rate constants derived from these tests can not be expected to 949
vary in direct proportion to the protein concentration or test chemical concentration. 950
Increasing the protein concentration above 2 mg/mL is not recommended to avoid saturation 951
of enzymes. 952
12. A departure from first-order kinetics can be expected if the starting chemical 953
concentration saturates the activity of enzymes responsible for chemical clearance. For 954
reaction pathways that exhibit classical Michaelis-Menten kinetics, this saturation will result 955
in zero-order elimination, the appearance of zero-order kinetics suggests that the starting 956
chemical concentration should be reduced (1). 957
13. Alternatively, log-transformation of the data may yield a pattern suggesting bi-958
exponential kinetics with an initial “fast” depletion phase followed by a “slow” terminal 959
depletion phase. This pattern can be caused by product inhibition, wherein the accumulation 960
of metabolites inhibits enzymatic activity at later time points, cofactor limitation or enzyme 961
saturation. Reduction of both the starting chemical concentration and protein concentration 962
may be attempted in an effort to eliminate this problem (1). 963
Do the rates vary with concentration?
NO – choose the historical value.
YES – Do the rates of the lowest 2
concentrations vary?
YES – Choose the lowest concentration
which can be comfortably analyzed.
NO – Choose the higher of the two concentrations.
32
964
REFERENCES 965
1. Johanning, K., Hancock, G., Escher, B., Adekola, A., Bernhard, M.J., Cowan-Ellsberry, 966
C., Domoradzki, J., Dyer, S., Eickhoff, C., Embry, M., Erhardt, S., Fitzsimmons, P., 967
Halder, M., Hill, J., Holden, D., Johnson, R., Rutishauser, S., Segner, H., Schultz, I., and 968
Nichols, J. 2012. Assessment of metabolic stability using the rainbow trout 969
(Oncorhynchus mykiss) liver S9 fraction. Current Protocols in Toxicology 53:14.10.1-28. 970
2. OECD xxxx. Guidance document No xx Determination of in vitro intrinsic clearance 971
using cryopreserved hepatocytes (RT-HEP) or liver S9 sub-cellular fractions (RTL-S9) 972
from rainbow trout and extrapolation to in vivo intrinsic clearance. 973
974

33
ANNEX 6 975
976
TEST SET-UPs 977 978
Test Set-up 1: Single vial approach (Figure 1) 979
1. The single vial approach is recommended to test chemicals that are not difficult-to-test 980
(e.g., non-volatile, does not bind to vessel walls, and distributes rapidly through the reaction 981
system). It generally produces the least variable results and is simplest to perform. 982
2. As described in §29ff of the main text, incubations are carried out in a single vial 983
containing e.g., 1 mL of RT-S9 suspension. Samples (100 µL) are taken at the defined time 984
points from this vial and are transferred into a micro-centrifuge tube containing stopping 985
solution. 986
3. A minimum number of 6 time points is required to determine the CL, IN VITRO, INT rate; 987
therefore, the test set-up should include ≥ 6 time points (e.g., 2, 10, 20, 30, 60, 90, 120 min). 988
989 990
Figure 1. Test Set-up 1: Independent runs using the single vial approach 991
992
Test Set-up 2: Multiple vial approach (Figure 2) 993
3. This set-up is recommended for volatile test chemicals. 994

34
4. Incubations with volatile test substances can be performed by sealing the vials 995
containing e.g., 200 μL of RT-S9 reaction mixtures with a septum-lined cap after the pre-996
incubation period. A syringe may then be used to introduce both the test chemical and 997
stopping solution. Alternatively, vials may be closed directly after adding the test chemical 998
with a pipette and opened just prior to adding the stopping solution. As for the single-vial 999
approach, east test consists of at least two independent runs to determine the CL, IN VITRO, INT 1000
rate. Each independent run is performed on a different day or on the same day, provided that 1001
for each run: a) independent fresh stock solutions and working solutions of the test chemical 1002
area prepared and; b) independently prepared fresh RT-S9 is used. For each run, the pre-1003
determined number of vials is prepared for active RT-S9 (e.g., total of 14, 7 for test chemical 1004
and 7 for the reference chemical) and for enzymatically inactive RT-S9 (e.g., 7). The vials 1005
are spiked with the test chemical and the reference chemical as shown in Figure 2. Stopping 1006
solution is added directly to each sample vial at the various time points (e.g., 2, 10, 20, 30, 60, 1007
90, 120 min). Additional details are provided in (1). 1008
1009
Figure 2. Test Set-up 2: Independent runs using the multiple vial approach 1010
1011
REFERENCES 1012
1. Johanning, K., Hancock, G., Escher, B., Adekola, A., Bernhard, M.J., Cowan-Ellsberry, 1013
C., Domoradzki, J., Dyer, S., Eickhoff, C., Embry, M., Erhardt, S., Fitzsimmons, P., 1014
Halder, M., Hill, J., Holden, D., Johnson, R., Rutishauser, S., Segner, H., Schultz, I., and 1015
Nichols, J. 2012. Assessment of metabolic stability using the rainbow trout 1016
(Oncorhynchus mykiss) liver S9 fraction. Current Protocols in Toxicology 53:14.10.1-28. 1017
1018

35
ANNEX 7 1019
PREPARATION OF BUFFERS, CO-FACTOR AND ALAMETHICIN SOLUTIONS, 1020
AND DILUTION OF RT-S9 TO WORKING PROTEIN CONCENTRATION 1021
1. Potassium phosphate mono and dibasic buffer stock solutions should be prepared as 1022
listed in Table 1. 1023
Table 1: Potassium phosphate mono and dibasic buffer stock solutions 1024
Reagent mM mg
Volume
ultrapure water
(mL)
Storage
temperature &
time
Dibasic (K2HPO4) potassium
phosphate buffer 100 1.742 100 4°C; max 1 month
Monobasic (KH2PO4)
potassium phosphate buffer 100 0.681 50 4°C; max 1 month
1025
2. Potassium phosphate buffer (KPO4 buffer; pH 7.8, 100 mM) should be prepared as 1026
described in Table 2. 1027
Table 2: Preparation of potassium phosphate100 mM (KPO4 buffer) buffer, pH 7.8 at 10-1028
15°C (depending on fish acclimation temperature). 1029
Reagent Concentration
Dibasic
(K2HPO4 )
buffer
(mL)
Monobasic
(KH2PO4)
buffer (mL)
Total
volume
(mL)
pH at
11°C
Storage
temperature
Potassium
phosphate
buffer (KPO4),
pH 7.8 +/- 0.1
at fish
maintenance
temperature
(e.g.,10-15°C)
100 mM 88 12 100 7.8 4°C; max 1
month
1030
3. Additional dibasic or monobasic potassium phosphate buffer can be added to adjust to 1031
pH 7.8 at the reaction temperature (e.g., 10-15°C). 1032
4. Preparation of alamethicin stock solution and working solution: 1033
Alamethicin stock solution (10 mg/mL) is prepared in methanol by adding 0.1 mL 1034
methanol per mg of alamethicin to the vial. The vial is carefully vortexed and the 1035
alamethicin stock solution stored as 25 µL aliquots in micro-centrifuge tubes (e.g., 1036
1.5 mL Eppendorf) at -20°C until use. 1037

36
Alamethicin working solution (250 µg/mL) in KPO4 buffer is prepared by diluting 1038
one 25 µL aliquot of 10 mg/mL stock solution with 975 µL KPO4 buffer (see 2.) 1039
5. Preparation of cofactors solutions: The three cofactors listed in Table 3 may be pre-1040
weighed prior to the test and stored in vials (e.g., 1.5 mL Eppendorf) at -20°C. On the day of 1041
the test, 1 mL of ice-cold KPO4 buffer is added to the respective vials, the solutions are 1042
vortexed until completely dissolved and then stored on ice until use. 1043
Table 3: Preparation of cofactors solution 1044
Cofactors mM mg mL of KPO4 buffer
(ice-cold)
β-nicotinamide adenine dinucleotide 2’-
phosphate, tetrasodium salt (NADPH) 20 16.67 1
uridine 5’ -diphosphoglucuronic acid,
trisodium salt (UDPGA) 20 12.93 1
L-glutathione (GSH) 50 15.37 1
1045
6. Since the purity of the fourth co-factor 3'-phosphoadenosine 5'-phosphosulfate (PAPS) 1046
will likely be <95%, adjustment for solution preparation is required. It is further 1047
recommended to prepare one concentrated solution (10 mM) prior to the test day and freezing 1048
it as 50 µL aliquots. On the day of the test, one aliquot may be thawed and diluted to the 1049
working concentration (1 mM). 1050
Calculate the amount of chemical required to prepare a 10 mM PAPS solution. An 1051
accurate adjustment for chemical purity would take into account the lot-specific 1052
information of the purity of the anhydrous acid, % water, % lithium and % solvent. 1053
However, for the purposes here, a simple adjustment for purity of anhydrous acid 1054
and water content will be sufficient. 1055
o Chemical mass × anhydrous acid content × (1- water content)/ 507.26 1056
g/mol = mol anhydrous acid 1057
o Volume of KPO4 buffer (mL) to add = (mmol of anhydrous acid/10 mM) × 1058
1000 mL/L 1059
Adjust a small volume (e.g., 25 mL) of ice-cold KPO4 buffer to pH 8.0 by addition 1060
of dibasic potassium phosphate solution (see Table 1) 1061
Dissolve PAPS in the calculated volume of ice-cold pH 8.0 KPO4 buffer (PAPS is 1062
most stable when frozen at pH 8). 1063
Aliquot 50 µL each into pre-chilled micro-centrifuge tubes and immediately freeze 1064
at -80°C. 1065
7. A master mix of cofactors is prepared just prior to the pre-incubation step with each of 1066
the pre-weighed cofactor (NADPH, UDPGA, GSH) and PAPS. 1067

37
8. Immediately before addition of the master mix, one aliquot of the 10 mM PAPS 1068
solution is thawed and diluted with 450 µL of KPO4. 1069
9. All the cofactors are combined in a master mix as follows: 1070
o 500 µL of 20 mM NADPH 1071
o 500 µL of 20 mM UDPGA 1072
o 500 µL of 50 mM GSH 1073
o 500 µL of 1 mM PAPS 1074
The master mix should be vortexed prior to adding it to the reaction vials. 1075
10. Dilution of active and enzymatically inactive RT-S9 to working protein concentration: 1076
the active and the enzymatically inactive RT-S9 are diluted with KPO4 buffer to 10-fold 1077
concentrated working solutions so that the appropriate concentration of protein is delivered to 1078
the reaction system in 100 µL (active or enzymatically inactive RT-S9). 1079
The amount of KPO4 buffer needed to achieve the appropriate RT-S9 working 1080
concentration (i.e., 10-fold) is determined. 1081
Example: concentration of active RT-S9 = 23.6 mg/mL (protein/mL); the target 1082
concentration for the given chemical is 1 mg/ml; the volume of the frozen RT-S9 1083
tube is for example 150 µl 1084
o Total protein content: 23.6 mg/mL x 150 µL = 3540 µg protein 1085
o Total volume needed: 3540 µg protein/10 mg/mL = 354 µL 1086
o Buffer to add: 354 µL-150 µL = 204 µL KPO4 1087
1088
1089
1090
1091
1092
1093
1094
1095
1096
1097
1098
1099
Figure 1. Description of reaction mixture contents in a 7 mL scintillation vial prior to 1100
spiking with the test chemical. 1101
400 μL 100 mM KPO4 buffer
100 μL pre-diluted active RT-S9 or enzymatically inactive RT-S9
(final conc. e.g., 1 mg/mL)
100 μL 250 μg/mL alamethicin (final conc. 25 μg/mL)
100 μL 20 mM NADPH (final conc. 2 mM)
100 μL 20 mM UDPGA (final conc. 2 mM)
100 μL 50 mM GSH (final conc. 5 mM)
100 μL 1 mM PAPS (final conc. 0.1 mM)
1000 μL (1.0 mL) total volume


![[Pro] [s9] heridas](https://img.dokumen.tips/doc/110x75/55874fded8b42a8c468b4713/pro-s9-heridas.jpg)