Embed Size (px)
Citation preview
0
Draft Final Report for
Bundelkhand
Revised
Pub
lic D
iscl
osur
e A
utho
rized
Pub
lic D
iscl
osur
e A
utho
rized
Pub
lic D
iscl
osur
e A
utho
rized
Pub
lic D
iscl
osur
e A
utho
rized
Pub
lic D
iscl
osur
e A
utho
rized
Pub
lic D
iscl
osur
e A
utho
rized
Pub
lic D
iscl
osur
e A
utho
rized
Pub
lic D
iscl
osur
e A
utho
rized
1
Table of Contents
Executive Summary .......................................................................................................................................... 7
Chapter 1: Introduction ................................................................................................................................. 31
1.0 Introduction & Background ............................................................................................................. 31
1.1 Water Resource Development in Uttar Pradesh ............................................................................... 31
1.2 Study Area & Project Activities ....................................................................................................... 34
1.3 Need for the Social & Environmental Framework ........................................................................... 38
1.4 Objectives ........................................................................................................................................ 38
1.5 Scope of Work (SoW) ...................................................................................................................... 38
1.6 Approach & Methodology ............................................................................................................... 39
1.7 Work Plan ........................................................................................................................................ 41
1.8 Structure of the Report ..................................................................................................................... 42
Chapter 2: Regulatory Review and Gap Analysis ........................................................................................ 44
2.0 Introduction ...................................................................................................................................... 44
2.1 Policy and regulatory framework to deal with water management, social and environmental safeguards ....................................................................................................................................................... 44
2.1.2 Regulatory framework to deal with water, environment and social Safeguards .............................. 44
2.1.3 Legislative Framework to Deal with Social Safeguards .................................................................. 45
2.2 Applicable Policy, Rules & Regulation to project interventions / activities .................................... 45
2.2.1 EIA Notification ............................................................................................................................... 45
2.3 Institutional Framework to deal with water, social and environmental safeguards.......................... 49
2.4 Institutional Gaps ............................................................................................................................. 51
Chapter 3: Socio-Economic Baseline Status ................................................................................................. 53
3.0 Introduction ...................................................................................................................................... 53
3.1 Socio-Economic Baseline Status of Bundelkhand Area of Uttar Pradesh Based on secondary Data 53
3.1.1 Demography Profile: 1991 and 2001 ............................................................................................... 53
3.1.2 Decadal Growth in Population ......................................................................................................... 54
3.1.3 Population Density ........................................................................................................................... 54
3.1.4 Sex Ratio: Number of Females per 1000 Male ................................................................................ 54
3.1.5 Sex –wise Literacy Rates and Gender Gap in Literacy .................................................................... 54
3.1.6 Educational Institutions.................................................................................................................... 55
3.1.7 Safe Source of Drinking Water ........................................................................................................ 55
3.1.8 Road Density .................................................................................................................................... 55
3.1.9 Proportion of Electrified villages ..................................................................................................... 56
3.1.10 Number of Commercial Banks .................................................................................................... 56
3.1.11 Post offices, P.C.O. and Telephone Connections ........................................................................ 56
2
3.1.12 Health facilities ........................................................................................................................... 57
3.1.13 Persons in Labour Force .............................................................................................................. 57
3.1.14 Families Below Poverty Line ...................................................................................................... 57
3.1.15 Cropping Intensity ....................................................................................................................... 58
3.1.16 Crop Coverage Area under Pulses and oilseeds: ......................................................................... 58
3.1.17 Productivity of Pulses and Oilseeds ............................................................................................ 58
3.1.18 Operational Landholdings ........................................................................................................... 58
3.1.19 Irrigation Intensity ....................................................................................................................... 59
3.1.20 Irrigation Potential ...................................................................................................................... 59
3.1.21 Source-wise Irrigation ................................................................................................................. 59
3.1.22 Per Capita Annual Food Grain Availability ................................................................................ 59
3.1.23 Proportion of Agricultural Labour .............................................................................................. 60
3.1.24 Consumption of Fertilizer ........................................................................................................... 60
3.1.25 Pesticides Consumption .............................................................................................................. 60
3.1.26 Soil Fertility ................................................................................................................................ 60
3.1.27 Facilities for Livestock ................................................................................................................ 61
3.1.28 Reservoir Fish Production ........................................................................................................... 61
3.2 Socio-Economic Baseline Status of Blocks under Project area in Jamini, Sajnam and Rohini Dam of Lalitpur district based on secondary data ................................................................................................... 61
3.3 Socio-economic status of Bundelkhand Region based on Primary Survey in Command & Non-command area ................................................................................................................................................ 65
3.3.1 Socio-economic status of Bundelkhand Region based on Household Survey ................................. 65
3.3.2 Socio-Economic Baseline Status of Lalitpur district based on Household Survey ............................. 68
3.4 Socio-Economic Baseline Status of Bundelkhand & Lalitpur district based on primary Survey based on Focussed Group Discussions (FGD) ............................................................................................... 79
3.4.1 Socio-Economic Baseline Status of Bundelkhand based on Focussed Group discussion ................ 79
3.4.2 Socio-Economic Baseline Status of Lalitpur district based on Focussed Group discussion ............ 82
3.5 Socio-Economic Issues in Bundelkhand .......................................................................................... 85
3.6 Irrigation Infrastructure Performance Agriculture Productivity, Livelihood & Poverty ................ 102
Chapter 4: Regional Environmental Setting & Environmental Baseline ................................................. 103
4.0 Background .................................................................................................................................... 103
4.1 Study Area ..................................................................................................................................... 103
4.2 Environmental status of Bundelkhand region ................................................................................ 103
4.2.1 Land Environment ......................................................................................................................... 103
4.2.2 Geology & Minerals in Bundelkhand Region ................................................................................ 105
4.2.3 Soils in Bundelkhand Region ......................................................................................................... 108
4.3 Climate & Air Environment ........................................................................................................... 115
4.3.1 Temperature ................................................................................................................................... 115
4.3.2 Rainfall ........................................................................................................................................... 116
3
4.3.3 Air Pollution .................................................................................................................................. 118
4.4 Water Environment ........................................................................................................................ 118
4.4.1 Surface Water Resources of Bundelkhand Region in Uttar Pradesh.............................................. 118
4.4.2 Surface Water Resources of Study Area ........................................................................................ 119
4.4.3 Hydrogeology & Ground Water Resources of the Bundelkhand Region in Uttar Pradesh ............ 121
4.4.4 Ground Water Resources Development ......................................................................................... 122
4.4.5 Hydrogeology & Ground Water Resources of Lalitpur district & Study Area .............................. 124
4.4.6 Sources of Irrigation in Bundelkhand & Lalitpur District ............................................................. 127
4.4.7 Sources of Irrigation in Study Area ............................................................................................... 129
4.4.8 Performance of Surface Water Schemes ........................................................................................ 131
4.4.9 Cost Implications ........................................................................................................................... 132
4.4.10 Surface Water Quality ............................................................................................................... 133
4.4.11 Project Area Surface Water Quality .......................................................................................... 134
4.4.12 Ground Water Quality- Bundelkhand Region ........................................................................... 135
4.4.13 Ground Water Quality- Project Area ......................................................................................... 136
4.5 Forest & Biodiversity Aspect ......................................................................................................... 137
4.5.1 Endemic Plant ................................................................................................................................ 138
4.5.2 Natural Ecosystem, Flora & Fauna in Project Area ....................................................................... 138
4.5.3 Wetlands ........................................................................................................................................ 138
4.5.4 Protected Areas-Bundelkhand Area ............................................................................................... 141
4.5.5 Project Area Impact Assessment .................................................................................................... 142
4.6 Health Issues .................................................................................................................................. 143
4.6.1 Water Borne Disease ...................................................................................................................... 143
4.6.2 Vector Borne Disease..................................................................................................................... 143
Chapter 5: Impact Assessment and Environmental and Social Management Framework .................... 160
5.0 Introduction .................................................................................................................................... 160
5.1 Categorization of Activities /Components ..................................................................................... 160
5.2 Environmental and Social Management Framework ..................................................................... 164
5.3 Screening ....................................................................................................................................... 292
Chapter 6: IEC Strategy, Capacity Building & Training & Monitoring & Evaluation ......................... 305
6.0 Introduction .................................................................................................................................... 305
6.1 Need for Information, Education and Communication Strategy .................................................... 305
6.2 Generation of information and knowledge base............................................................................. 305
6.3 Strategic Communication ............................................................................................................... 308
6.4 Conflict Resolutions ....................................................................................................................... 311
6.5 Effectiveness of existing resolution system for new assets and opportunities to be created under the project. 312
6.6 Institutional Arrangement, Training and Capacity Building Plan .................................................. 313

4
6.6.1 Mechanisms of environmental and social performance improvement of project ........................... 313
6.6.2 Skill and capacity-building requirements ....................................................................................... 314
6.6.3 Capacity Building and Training Needs of UPID............................................................................ 315
6.6.4 Implementation Mechanism ........................................................................................................... 319
6.6.5 Convergence with overall capacity-building plan .......................................................................... 324
6.7 Monitoring & Evaluation ............................................................................................................... 325
6.7.1 Social Impact Monitoring Indicators ............................................................................................. 325
6.7.2 Level-1 Indicators .......................................................................................................................... 326
6.7.3 Level-2 and Level-3 Indicators ...................................................................................................... 326
6.7.4 Environmental Impacts Monitoring Indicators .............................................................................. 327
6.8 Implementation Schedule & Costing ............................................................................................. 333
6.9 Integration with the Project ............................................................................................................ 333
List of Tables Table 1.1: Basin wise study area ....................................................................................................................... 34 Table 2.1: Applicable Environmental Laws and Regulations ........................................................................... 46 Table 2.2: Application of Bank Safeguard Policies .......................................................................................... 46 Table 2.3: Agencies dealing with water, environment and social sector and their responsibility ..................... 50 Table 3.1: Major Social Issues / Findings Based on Secondary Data Versus Proposed Project ....................... 86 Table 3.2: Major Social / Findings Based on Primary Survey Versus Proposed Project .................................. 91 Table 4.1: Mineral Resources in Bundelkhand ............................................................................................... 106 Table 4.2: Sanctioned lease record for mining in Bundelkhand...................................................................... 107 Table 4.3: Block wise Soil Fertility Status (2009-10) ..................................................................................... 109 Table 4.4: Micro-nutrients and precision element index, 2007-08.................................................................. 110 Table 4.5: Block wise Soil Fertility Status (2009-10) ..................................................................................... 110 Table 4.6: Micro-nutrients and precision element index, 2007-08.................................................................. 111 Table 4.7: District wise Land use Pattern Bundelkhand (2008-09) in Hectare ............................................... 111 Table 4.8: Land use Pattern of Command Area (% of reported Area) ............................................................ 114 Table 4.9: District wise rainfall Pattern in Bundelkhand Area (mm) .............................................................. 117 Table 4.10: District rainfall Pattern in Lalipur (mm) ...................................................................................... 117 Table 4.11: District-wise Ground Water Resource and Irrigation Potential .................................................. 122 Table 4.12: District wise Ground Water Resources Available, Utilization and Stage of Development in Bundelkhand-2004 .......................................................................................................................................... 122 Table 4.13: District wise Ground Water Resources Available, Utilization and Stage of Development in Bundelkhand-2009 .......................................................................................................................................... 124 Table 4.14: Irrigable Area and Area irrigated from different Source (Tha) .................................................... 128 Table 4.15: Number and area of MI schemes in Bundelkhand region ............................................................ 128 At district level, analysis of source of irrigation has been carried out from 2000-01 to 2008-09. .................. 129 Table 4.16: Source of Irrigation in Lalitpur (%) ............................................................................................. 129 Table 4.17: Source of Irrigation in Command Area (%) ................................................................................. 130 Table 4.18: Surface Water Quality Bundelkhand ........................................................................................... 133 Table 4.19: Water Sampling Results of Study Area ....................................................................................... 134 Table 4.20: Forest Cover in Bundelkhand Area .............................................................................................. 137 Table 4.21: Forest Cover in Project Area ........................................................................................................ 138 Table 4.22: Area estimates of wetlands in Lalitpur ......................................................................................... 139 Table 4.23: Protected Area and Flora & Fauna ............................................................................................... 141 Table 4.24: Distance of Protected Areas and Impact ...................................................................................... 142 Table 4.25: Vector borne disease profile of the Bundelkhand Area ............................................................... 143 Table 4.26: Summary of Issues (UP-Bundelkhand) ........................................................................................ 145 Table 5.1: Categorization of Project Intervention ........................................................................................... 161

5
Table 5.2: Social Environmental Management Framework (SEMF) for Components proposed under UPWSRP Phase-II. 165 Table 5.3: Analysis of Alternatives ................................................................................................................. 292 Table 5.4: Checklist for SEMF Activities – Implementation .......................................................................... 297 Table 6.1: Suggested strategy and framework for IEC .................................................................................. 305 Table 6.2: Summary of communication tools ................................................................................................. 309 Table 6.3: Conflicts and existing resolution system ........................................................................................ 311 Table 6.4: Findings of conflicts and their resolution for various assets .......................................................... 313 Table 6.5: Summary of capacity-building requirements at various stakeholder levels ................................... 314 Table 6.6: Existing Status of Functional Knowledge ...................................................................................... 318 Table 6.7: Target Groups and Type of Training Programs ............................................................................. 319 Table 6.8: Training Programs for Awareness Raising .................................................................................... 320 Table 6.9: Training Programs for Social & Environmental Due Diligence .................................................... 321 Table 6.10: Training Areas & Faculty ............................................................................................................ 323 Table 6.11: Timeline of capacity-building initiatives for functionaries and farmers ...................................... 325 Table 6.12: Criteria for identifying indicators................................................................................................. 326 Table 6.13: Elements to develop indicators .................................................................................................... 327 Table 6.14: Level-2 and Level-3 Indicators .................................................................................................... 329 Table 6.15: Key Environmental & Socio-economic Impact ........................................................................... 331 Compliance of the Review Committee Minutes dated 18th September’2012 ........................................... 334 Response of Comments (GWE, PACT) on DFR-Bundelkhand ................................................................ 335
List of Figures Figure 1.1: Major rivers & drainage basins of Uttar Pradesh ............................................................................ 32 Figure 1.2: Average Annual Water Balance of Uttar Pradesh .......................................................................... 33 Figure 1.3: Districts in Study Area ................................................................................................................... 35 Figure 2.1: Legal and institutional framework for environmental safeguards .................................................. 51 Figure 4.1: Physiographic features of Bundelkhand region ............................................................................ 104 Figure 4.2: Physiography of Study Area ......................................................................................................... 105 Figure 4.3: Geological & Mineral Map of District Lalitpur ............................................................................ 107 Figure 4.4: Soil Map of Bundelkhand Area .................................................................................................... 108 Figure 4.5: The Soil Fertility\Health Map of the Project Area ........................................................................ 109 Figure 4.6: Change in Land use Pattern .......................................................................................................... 112 Figure 4.7: Land use Pattern in Command Area (2000-01) ............................................................................ 113 Figure 4.8: Land use Pattern in Command Area (2008-09) ............................................................................ 113 Figure 4.9: Change in Land use Pattern .......................................................................................................... 115 Figure 4.10: Temperature Profile .................................................................................................................... 116 Figure 4.11: Normal rainfall Isohyets in Bundelkhand region ........................................................................ 116 Figure 2.12: Average Rainfall in Bundelkhand Area ...................................................................................... 117 Figure 4.13: Rainfall Pattern from 2000 - 2009 .............................................................................................. 117 Figure 4.14: Irrigation Map of UP-Bundelkhand ............................................................................................ 119 Figure 4.15: Select systems for which Detailed Studies are proposed ............................................................ 120 Figure 4.16: Hydrogeology of Bundelkhand region ....................................................................................... 122 Figure 4.17: Map Showing Categorization of Blocks Lalitpur District, U.P. ................................................. 125 Figure 4.18: Depth of Water Level Map, Lalitpur District, U.P. .................................................................... 126 Figure 4.19: Depth of Water Level Map, Lalitpur District, U.P. .................................................................... 127 Figure 4.22: Temporal Source of Irrigation .................................................................................................... 130 Figure 4.23: Water Quality of Betwa and Ken ................................................................................................ 133 Figure 4.24: Wetland Area in Lalitpur and within Project Area ..................................................................... 140 Figure 4.25: Satellite map of Wetland Area in Lalitpur and within Project Area ........................................... 141 Figure 4.26: Interventions ............................................................................................................................... 143 Figure 5.1: SEMF Execution Mechanism ....................................................................................................... 296 Figure 6.1: Organization Structure of UPID ................................................................................................... 317

6
Figure 6.2: Mechanism of Implementation of Training Programs .................................................................. 322 Figure 6.3: Social Monitoring Indicator Mechanisms ..................................................................................... 326
7
Executive Summary
Government of Uttar Pradesh had initiated UP Water Sector Restructuring Project (UPWSRP) in 2001 with financial loan assistance of US$ 150 million from World Bank (WB) with developmental objectives of: (i) setting up enabling institutional and policy frame work for water sector reform in the state for integrated water resources management (IWRM); and (ii) to initiate irrigation, agriculture and drainage sub-sector reforms in the state to increase and sustain water and agricultural productivity. With the aim to adopt a river basin development and management approach to address all issues related to water in an integrated and socially and environmentally sustainable framework, and to ensure the concept of basin development and management a 5 year long Phase-I was initiated in May 2001, which focused on Ghaghra-Gomti basin for initial implementation of both water sector and drainage sector reform programmes. UPWSRP was initiated with a long term perspective of 12-15 years to cover entire State and therefore, GoUP has decided to continue the efforts already initiated under Phase –I for funding from WB under Phase-II. Prior to 15th March 2012, it was decided in principle to include Bundelkhand region of the State to study and implement IWRM in order to reform the water and agriculture sector with emphasis to mitigate droughts and rehabilitate this region. This region has recently witnessed severest prolonged (four-year cycle) drought for the first time in the recorded history. Considering major interventions have been planned under Bundelkhand package, the phase – II has undergone major shift in study area. Subsequently, Lower Ganga Canal System (LGC) has been included in the Phase – II, while only a selected portion of Bundelkhand & Sharda Sahayak Canal System have been included in Phase – II. Study area includes Lalitpur district of Bundelkhand region, three districts, Shahuji Maharaj Nagar, Barabanki & Rae Bareli district under Sharda Sahayak Command Area and twelve districts, Kashiram Nagar, Etah, Firozabad, Manipuri, Farrukhabad, Etawah, Kannauj, Auraiya, Ramabai Nagar, Kanpur Nagar, Fatehpur & Kaushambi under Lower Ganga Canal system. Basinwise area covered in the project is about 2.9 million hectare, out of which about 3% falls under each of Bundelkhand and Sarda Sahayak Command area, while the remaining 24% falls in Lower Ganga Canal Command area. Major activities, which have been identified to be carried out under Phase II of the project area given below. Activity-1: Participatory Irrigation Management Activities Activity-2: Rehabilitation of Canal & Drainage Systems Activity-3: Piloting Alternative Branch-Level Management Mechanism for Water Service Provision & Maintenance Activity-4: Agriculture Water Use and Productivity Efficiency Improvement Program Activity-5: Social Assessment/ Development Under Phase-I, SWaRA had developed a basin Master Plan for Ghagra–Gomti Basins (GGB), a Decision Support System (DSS) for Jaunpur Branch Canal System, and an environmental and social basin assessment (BESA) and social and environmental management plan (SEMP) for Ghagra – Gomti Sub basin. Ghaghra Gomti Basin Social and Environmental Assessment (GG-BSEA) study comprising of 31 districts (Allahabad, Ambedkar Nagar, Azamgarh, Bahraich, Ballia, Balrampur, Barabanki, Basti, Deoria, Faizabad, Ghazipur, Gonda, Gorakhpur, Hardoi, Jaunpur, Kheri, Kushinagar, Lucknow, Maharajganj, Mau, Pilibhit, Pratapgarh, Rai Bareli, Sant Kabir Nagar, Shahjahahanpur, Shrawasti, Siddharthnagar, Sitapur, Sultanpur, Unnao and Varanasi) of Uttar Pradesh, was carried out during Phase I of the project. This study was prepared based on the basin planning, where social and environmental baseline was established both in spatial and temporal context. Further, social and environmental and institutional issues were identified and mitigation options were proposed. Training and capacity building needs assessment was carried out and type of training program / modules along with target audience were developed. A basin level social, environmental and institutional and monitoring framework was prepared for implementation during phase II. Some of the gaps which have been observed in the earlier BSEA while implementing the current environmental & social framework study are given below. • Study area did not include Bundelkhand and Lower Ganga Canal System, which has different
environmental and social features.

8
• Institutional structure for mainstreaming environmental and social safeguards recommended in BSEA have not been implemented.
• Training and capacity building of UPID and other stakeholders recommended under BSEA have been partly implemented.
• Environmental and social safeguard indicator / parameter monitoring framework / system which were recommended in BSEA is yet to be implemented.
It is in this context, Project Activity Core Team (PACT) on behalf of UPWSRP, Government of Uttar Pradesh (GoUP) is carrying out a Social and Environment Assessment (SEA) of the study area in addition to updating the existing SEA and SEMP for the additional areas now being covered under Phase II project. The SEA will lead to development of social and environmental management framework (SEMF) in order to mainstream social and environmental safeguards in the overall basin development. The major objectives of this study is: to identify environmental, social and socio-economic issues; to identify potential impacts (both positive and negative) of the proposed investments under Phase II; to provide relevant mitigation measures to contain/minimize/reverse the potential negative impacts of the project investments as well as replicate/upscale/intensify the potential positive impacts; to prepare a Social and Environmental Management Framework (SEMF) that will guide implementers at various levels to mainstream environmental and social issues; develop appropriate recommendations for sustainable utilization of water resources by integrating environmental and social concerns in water sector planning and management. The major items of SoW as per ToR include: Identifying key environmental and social issues in the geographical areas covered by the project and assessing the potential impacts arising from proposed project investments; Undertake a detailed review of legal, policy and regulatory environment as well as the institutional framework in place for the management of water sector and irrigation service delivery; Developing Environmental Management Plans (EMPs) for investments that are known and prepare a social and Environmental Management Framework (SEMF) for new project investments; Prepare a detailed social and environmental mitigation plan for the identified issues and potential adverse impacts; Prepare a Monitoring and Evaluation (M&E) strategy and plan including a list of key environmental and social indicators for monitoring at various levels; Prepare a training and capacity building plan on social and environmental issues, given the intended stakeholders and institutions; and develop a communications and consultation strategy to guide project investments during the implementation phase. Approach & Methodology include: Gap analysis; A comprehensive regulatory review; Secondary and primary data collection and analysis; A monitoring and evaluation (M&E) strategy; Development of SEMF and SEMP; Training needs assessment; Consultation and communication needs assessment; Presentation of outputs through stakeholders’ consultations by conducting two workshops. Regulatory Review EIA notification, 14th September 2006 governs all environmental due diligence related to development projects in India. Under this latest EIA Notification, 14th September 2006, all projects listed in Schedule -1 of the Notification require prior environmental clearance. The objective of the notification is to formulate a transparent, decentralized and efficient regulatory mechanism to: Incorporate necessary environmental safeguards at planning stage Involve stakeholders in the public consultation process Identify developmental projects based on impact potential instead of the investment criteria As per new notification, item 1(C) on river valley projects having more than 10,000 ha of Culturable Command Area (CCA) fall in category A projects, while projects having less than 10,000 ha of CCA fall under category B projects. Category A projects require submission of EIA report as per issued ToR by national environmental appraisal committee and public consultation before getting environmental clearance from Central Government. Category B projects require clearance from State’s Environmental Appraisal Committee. Since the activities currently contemplated fall under the rehabilitation & modernization project without any change in
9
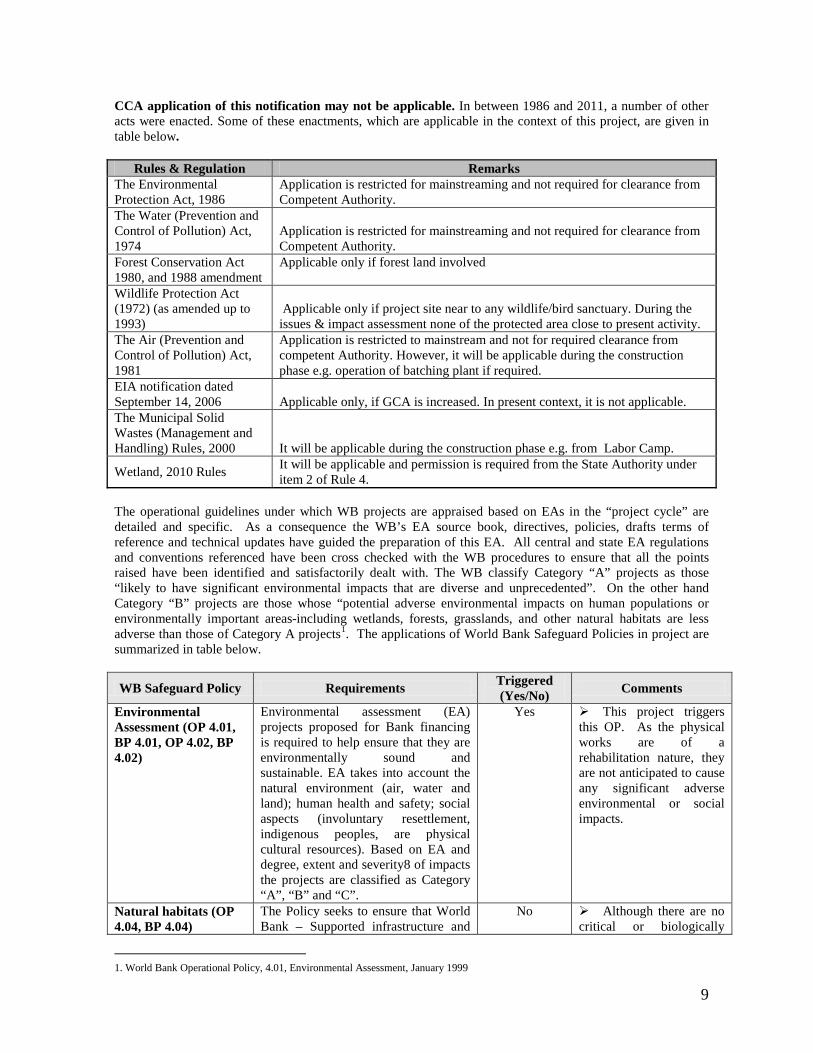
CCA application of this notification may not be applicable. In between 1986 and 2011, a number of other acts were enacted. Some of these enactments, which are applicable in the context of this project, are given in table below.
Rules & Regulation Remarks
The Environmental Protection Act, 1986
Application is restricted for mainstreaming and not required for clearance from Competent Authority.
The Water (Prevention and Control of Pollution) Act, 1974
Application is restricted for mainstreaming and not required for clearance from Competent Authority.
Forest Conservation Act 1980, and 1988 amendment
Applicable only if forest land involved
Wildlife Protection Act (1972) (as amended up to 1993)
Applicable only if project site near to any wildlife/bird sanctuary. During the issues & impact assessment none of the protected area close to present activity.
The Air (Prevention and Control of Pollution) Act, 1981
Application is restricted to mainstream and not for required clearance from competent Authority. However, it will be applicable during the construction phase e.g. operation of batching plant if required.
EIA notification dated September 14, 2006 Applicable only, if GCA is increased. In present context, it is not applicable. The Municipal Solid Wastes (Management and Handling) Rules, 2000 It will be applicable during the construction phase e.g. from Labor Camp.
Wetland, 2010 Rules It will be applicable and permission is required from the State Authority under item 2 of Rule 4.
The operational guidelines under which WB projects are appraised based on EAs in the “project cycle” are detailed and specific. As a consequence the WB’s EA source book, directives, policies, drafts terms of reference and technical updates have guided the preparation of this EA. All central and state EA regulations and conventions referenced have been cross checked with the WB procedures to ensure that all the points raised have been identified and satisfactorily dealt with. The WB classify Category “A” projects as those “likely to have significant environmental impacts that are diverse and unprecedented”. On the other hand Category “B” projects are those whose “potential adverse environmental impacts on human populations or environmentally important areas-including wetlands, forests, grasslands, and other natural habitats are less adverse than those of Category A projects1. The applications of World Bank Safeguard Policies in project are summarized in table below.
WB Safeguard Policy Requirements Triggered (Yes/No) Comments
Environmental Assessment (OP 4.01, BP 4.01, OP 4.02, BP 4.02)
Environmental assessment (EA) projects proposed for Bank financing is required to help ensure that they are environmentally sound and sustainable. EA takes into account the natural environment (air, water and land); human health and safety; social aspects (involuntary resettlement, indigenous peoples, are physical cultural resources). Based on EA and degree, extent and severity8 of impacts the projects are classified as Category “A”, “B” and “C”.
Yes This project triggers this OP. As the physical works are of a rehabilitation nature, they are not anticipated to cause any significant adverse environmental or social impacts.
Natural habitats (OP 4.04, BP 4.04)
The Policy seeks to ensure that World Bank – Supported infrastructure and
No Although there are no critical or biologically
1. World Bank Operational Policy, 4.01, Environmental Assessment, January 1999

10
WB Safeguard Policy Requirements Triggered (Yes/No) Comments
other development projects take into account the conservation of biodiversity, as well as the numerous environmental services and products which natural habitats provide to human society.
significant wetlands in this area, support for management of wetland and waterlogged areas should be enhanced in the project.
Forestry (OP 4.36, BP 4.36)
The Policy aims to reduce deforestation, enhance the environmental contribution of forested areas, promote afforestation, reduce poverty and encourage economic development.
No None of the project activities will trigger this OP as no forestry activities or activities on forest land are envisaged. Additionally, there are no forests in the irrigation areas selected for piloting reforms.
Pest Management (OP 4.09)
The procurement of any pesticide in a Bank – financed project is contingent on an assessment of the nature and degree of associated risks, taking into account the proposed use and the intended users. The need to prevent the development of resistance in pests.
Yes Although the project does not plan to finance any pesticides, there is a possibility of induced impact of greater pesticide use due to increased agricultural intensification and diversification. Hence, integrated pest management activities should be enhanced.
Cultural Property (OPN 11.03)
Cultural Property – This policy aims at assisting in the preservation of cultural property, historical, religious and unique natural value-this includes remains left by previous human inhabitants and unique environment features, as well as in the protection and enhancement of cultural properties encountered in Bank-financed project.
No No archaeological or other cultural sites of significance are impacted by proposed project
Indigenous Peoples (OP 4.10, BP 4.10)
This policy contributes to the Bank’s mission of poverty reduction and sustainable development by ensuring that the development process fully respects the dignity, human rights, economies, and cultures.
No No impact (adverse or positive) expected by project on tribals – a detailed spatial census analysis does not indicate any tribal concentrations in the areas selected to pilot physical interventions.
Water Resource management (OP 4.07)
Bank involvement in water resources management entails support for providing potable water, sanitation facilities, flood control , and water for productive activities in a manner that is economically viable, environmentally sustainable, and socially equitable. The Bank assists borrowers in the following priority areas:
Developing a comprehensive framework for designing water
Yes Applicable – the project intends to rehabilitate Dam and canal system

11
WB Safeguard Policy Requirements Triggered (Yes/No) Comments
resource investments, policies, and institutions. Within this framework, when the borrower develops and allocates water resources, it considers cross-sectoral impacts in a regional setting (e.g., a river basin). Adopting pricing and incentive policies that achieve cost recovery, water conservation, and better allocation of water resources. Decentralizing water service delivery, involving users in planning and managing water projects, and encouraging stakeholders to contribute to policy formulation. Restoring and preserving aquatic ecosystems and guarding against over-exploitation of groundwater resources, giving priority to the provision of adequate water and sanitation services for the poor. Avoiding the waterlogging and salinity problems associated with irrigation investments by (i) monitoring water tables and implementing drainage networks where necessary, and (ii) adopting best management practices to control water pollution. Establishing strong legal and regulatory frameworks to ensure that social concerns are met, environmental resources are protected, and monopoly pricing is prevented.
Involuntary Resettlement (OD 4.30)
The policy aims to avoid involuntary resettlement to the extent feasible, or to minimize and mitigate its adverse social and economic impacts.
No Although no resettlement and rehabilitation is anticipated under the project, an R&R policy for the sector has been developed and adopted by GOUP.
Safety of Dams (OP 4.37, BP 4.37)
The World Bank’s safeguard policy on safety of Dams is based on the principle that, for the life of a dam, the owner (in this case of Government of India) is responsible for ensuring that appropriate measures are taken and sufficient resources are provided for the safety of the dam, irrespective of its funding sources or construction status. Because there are serious consequences if a dam does not function properly or fails. The Bank is concerned about the safety of a new dam, it finances and existing dams on which a Bank financed project is directly dependent. Upgrading and/or
Yes Applicable as per draft document. This component needs to be finalized.

12
WB Safeguard Policy Requirements Triggered (Yes/No) Comments
rehabilitation of existing dams, as proposed under this project, falls within the policy, thus OP/BP 4.37 is triggered. Under OP/BP 4.37 requires that the dam upgrading be designed and its civil works be supervised by experienced and competent professionals. It also requires that implementing agency adopt and implement certain dam safety measures for the design, bid tendering, construction, operation and maintenance of the dam and associated works. The safe operation of dams has significant social, economic, and environmental relevance. World bank has concern to strengthen the institutional, legislative, and regulatory frameworks for dam safety programs.
Projects in Disputed Areas (OP 7.60, BP 7.60, GP 7.60)
Projects is Disputed Areas No The project is not in a disputed area and the OP is not triggered.
The EMP has been designed to not only ensure compliance with World Bank safeguard policies but also to adopt good practices to maximize the environmental benefits that are possible in this type of project. At institutional level, a number of agencies both at national and state levels are associated with water resources, environmental management and social safeguards. Their roles and responsibilities are described below.
Stakeholders Policy Regulatory Data / Information
Implementation
Central Ministry of Water Resources Ministry of Rural Development and Poverty Alleviation
Ministry of Environment and Forests Ministry of Agriculture/ Indian Council for Agricultural Research
Central Pollution Control Board Ministry of Urban Development Ministry of Power Ministry of Industries Ministry of Health Ministry of Food Processing
UP State Minor Irrigation Urban Development-UP Jal Nigam Rural Development-UP Jal Nigam Department of Land Development & Water Resources

13
Stakeholders Policy Regulatory Data / Information
Implementation
Forest Environment Industries Power Health Agriculture Horticulture Irrigation Department, UP Department of Agriculture, UP UP Bhumi Sudhar Nigam UP Council of Agricultural Research UP State Ground Water Department UP Jal Nigam Directorate of Environment, UP UP Remote Sensing Applications Centre Water and Land Management Institute, Lucknow
District District Planning Committee
Block Block Development Officer
Local Gram Panchayat
Baseline Social Assessment Major findings in project area based on secondary data include: Increasing trend of cropping intensity has been observed; Lower irrigation intensity than the district; Increased dependence on ground water for irrigation; Increase in coverage area & production of pulses & oilseeds; Stagnant efficiency of surface water irrigation infrastructure i.e. Dams & Canal System; Increase in number of marginal workers; Increase in marginal farmers while decrease in small & large farmers; Increased literacy rate; Increased gap in gender literacy; Decline in proportion of farmers & agriculture labour in main workers; Decreasing SC population due to migration; ST population is negligible & depends on forest produce; BPL Families are increasing; Increase in per capita food grain availability; Major source of drinking water is India Mark II; Decreasing number of PHC & allopathic hospitals & beds per lac of population; 99.9% electrified villag; Decline in fixed line telephone; Increased road density; Declining reservoir fish production; Decrease in consumption of fertilizer; Usage of chemical pesticide & biopesticide. Major findings in command & non command area through primary survey include: Blockwise, in command area of block Mandwara about 96% of area was sown during Rabi followed by Talbehat (93%) and Birdha (90.0%). In non-command area also higher proportion of sown area was covered in Rabi in Mndwari (98%) followed by Birdha (94%) and Talbehat (92%); In the command area, a higher proportion irrigated area was covered by canal in the district (48.5%), highest in Block Talbehat (64.5%) followed by Birdha (54.5%) and only 30.2% in Mandwara; Despite a significantly higher proportion of irrigated area getting water from canal, about 4% to 9% irrigation is carried out by dug wells / ponds and 20% to 58% through tubewells. There was also heavy dependence on Rainfall i.e. 43% in Talbehat, 40% in Birdha and 20% in Mandwara. Situation suggest inability of canal system to provide adequate and timely water for irrigation. In command area only about 80% of the total number of required watering for wheat crop were reportedly given – about 52% were timely and 48% late; Untimely water supply shortage of HYV seeds also lead to lower agriculture productivity; During Kharif, a higher proportion of sown area (49.7%) was covered in command area of the

14
district, highest in Block Mandwara (54%) followed by Birdha (50%) and Talbehat (41%) against 43%, 47% and 39% respectively in non command area. In the command area, a higher proportion irrigated area was covered by canal in the district (48.5%), highest in Block Talbehat (64.5%) followed by Birdha (54.5%) and only 30.2% in Mandwara; Despite a significantly higher proportion of irrigated area getting water from canal, about 4% to 9% irrigation is carried out by dug wells / ponds and 20% to 58% through tubewells. There was also heavy dependence on Rainfall i.e. 43% in Talbehat, 40% in Birdha and 20% in Mandwara. Situation suggest inability of canal system to provide adequate and timely water for irrigation. In command area only about 80% of the total number of required watering for wheat crop were reportedly given – about 52% were timely and 48% late; In command area of block Mandwara, a larger proportion of sown area was reportedly irrigated (53%) followed by Talbehat (48%) and Birdha (36%) while in non command more area in block Mandwara ((57%) was reportedly irrigated followed by Birdha (48%) and Talbehat (45%). In non command area, since canal was reportedly not available about 53% of the irrigated area was covered through Private Tubewell, 40% through Pond / Well and 3% through Reservoir / Dam in the district. Block-wise almost the entire irrigated land in Birdha was covered by Pond / Well (99.7%), followed by Private Tubewell 99%) and Reservoir / Dam (9%); in Talbehat and Mandwara there was heavy dependence on Private Tubewell as 79% and 71% of area was irrigated through this source. About 12% of irrigated area in Mandwara and 10% in Talbehat was covered through Pond / well. Dependence on rainfall in non-command area was lower than in command area; Source of Irrigation; When enquired about farmer’s preferred source of irrigation 58% in command preferred Tubewell as compared to 52 % farmers preferring through canal. In non command area 93% each mentioned their preferred source would be Tubewell and canal. Therefore, ground water is the preferred source though there is regular power failure and high cost of irrigation; The respondents belonging to the three blocks reported that the level of canal water generally remain high during November-December while during March-June they (Canal) remain dry. Such a pattern of response in favour of Tubewell indicate that either canal was not serving their entire area or the supply was untimely / inadequate; In Talbehat, 9% of the area irrigated through pond / well; In Mandwara 7% of the area irrigated through pond/well; In Birdha about 50% of the area irrigated through ponds & well; The menace of stray animals due to Anna Pratha destroy a considerable part of crops while there is no check on them to prevent the loss due to social practice as well as the influence of owners of such cattle; Most of the respondents in Command (96.4%) and non-command (94.7%) area reported the quality of drinking water was clean; Out of those who suffered from certain diseases in Command area: 7% of men and 12% of women were affected by Cholera/ Diarrhoea (significantly higher proportion of both in Mandwara); Thus, most common diseases which affected a significant proportion of men and women in both command and non-command area were related to quality of drinking water, sanitation/ environmental pollution; Proportion of migrated workers was significantly higher in command area of block Talbehat (33%) and Mandwara (27%) than in Birdha (6%). Similar position was found in non command area, though not significantly. Migratory pattern was seasonal with very limited permanent migration; A large majority of women respondents (92%) complained of low status of women in their family in both command and non command area. About 35% in non command complained about alcoholic husband, 30% regarding violence against women, 28% about strict behavior of In-laws, and 27% complained about insecure village environment. The proportion of women complaining about same was lower in command i.e. 16.4%, 16.4% 18.2% and 16.4% respectively; A pattern of response in favor. Tubewells indicate that either canal was not serving entire area or the supply was untimely or inadequate; Sources of irrigation shows that the farmers were depending on more than one source in both command and non-command area; This situation suggest inability of canal system to provide adequate and timely water for irrigation; In both Command and non-command area farmers were depending on more than one source of irrigation including rainfall; There was no role of farmers in recording of irrigation through canal; and that they reported that repair of canal was undertaken neither annually nor season-wise. They had also no knowledge about the fine imposed on any one for unauthorized use of canal water or any case filed on canal crime; About 24 percent of houses in Block Birdha in command area and 27 percent in Block Mandwara and 22 percent in Birdha in non-command area had pit toilet within their house. About two-third of Pacca houses in Block Birdha command area and Block Mandwara and 57 percent in Birdha in non-command area had this facility within their premises. Average monthly Expenses on Medical treatment of all family members and exclusively on women shows that a higher proportion of expenses were incurred on treatment of women members in both command (50.3%) and non command (53.1%) area. Average monthly expenses on treatment of women were significantly higher in Block Mandwara and Talbehat than in Block Birdha in both command and non-command area; None of the respondents in command area had any knowledge of the NGOs working in their area while 6 respondents in non command (5 in block Talbehat and 1 in Mandwara) knew the NGOs in their area. Among the 6

15
respondents 5 also reported their families had benefited from the activities of the NGOs. Thus, activities of the NGOs seems to be limited. There was no Water Users Association in the district. In command area only two respondents reported that they discuss about sharing of canal water with fellow farmers; None reported about any type of arrangement for distribution of canal water; A total of 9 respondents, 5 in command and 4 in non command informed about the existence of self-help groups in their area. These SHGs were working for improvement in Animal Husbandry and some were also helping their members for small business. None of the family members of the respondents were, however, associated with the SHGs. It therefore suggest their area of activities was limited. There was no Water Users Association in the district. In command area only two respondents reported that they discuss about sharing of canal water with fellow farmers; None reported about any type of arrangement for distribution of canal water; there was no role of farmers in recording of irrigation through canal; and that they reported that repair of canal was undertaken neither annually nor season-wise. However, a large majority of Women respondents reportedly voted in elections in both command (95.5%) and non command (95.3%) area which indicate a higher degree of consciousness about the importance of elections; The respondents were asked to identify a critical situation that they faced due to poverty. About half of the sample in command (52%) and non command (51%) mentioned that they could not arrange medical treatment of family member; about 31% in command 37% in non command reported that they could not marry their daughter while about 17% in command and 13% in non command reported their children had to drop out of school due to non payment of fee. Non availability of medical treatment due to poverty was reported by more respondents in block Talbehat and Mandwara in both command and non command areas as compared to block Birdha. As regards programs related to poverty alleviation, people mentioned only MNREGA. A large proportion of families in both command and non command area owned this asset ranging between 84.0% of household in Block Birdha, 87.0% in Talbehat and 90.0% in Mandwara in the Command Area. In non command area 84.0% of families in Block Mandwara, 88.0% in Birdha and 93.0% in Talbehat had these assets. Ownership of livestock by a large number of household indicate animal husbandary is an important source of earning. The average number of livestock per family was significantly higher in the command area (6.6) of all three blocks as compared to non command area (2.7). This situation may be due to easy availability of surface water in the command area. Care of livestock in the families was reported as joint responsibility of Men and women in both command (95%) and non command (91%) area; The farmers were using chemical and Bio-fertilizer and Chemical Pesticide in the district (Bio-Pesticide used only in Block Mandwara). The average quantity of Bio-fertilizer used per Ha was higher (339.9 Kg.) than the quantity of Chemical fertilizer (282.8 Kg) in command and non command (334.5 Kg and 264.7 Kg respectively) area. The quantity of chemical as well as Bio-fertilizer per hectare was higher in command than in the non-command area. The average quantity of chemical Pesticide used in Command area was also higher (17.5 Kg/Litre) than in non-command area (7.0 Kg/Litre). The highest quantity of Bio fertilizer and Chemical Pesticide were used in Block Mandwara in both Command and non-Command area, Bio-fertilizer @ 376.9 Kg in Command and 389.5 Kg in non-command and chemical Pesticide @ 46.2 Kg/Litre in Command and 15.3 Kg/Litre in non-Command which were very high as compared to other Blocks; Farmer in command area indicated that repair of canal was undertaken neither annually nor season-wise. Willingness to pay higher Water Tariff. A small proportion of farmers in the command area of district (12.4%) expressed their readiness to pay higher water Tariff if timely and adequate canal water supply is provided. It was also found that more small than large farmers expressed their willingness to pay higher charges provided the timely and adequate water supply is assured; When enquired whether the respondents maintain contact with any officials of the Irrigation Department only 2 in Command and 4 in non-command reported that they maintain contacts with the Seenchpal, particularly when they do not get sufficient water for irrigation. Major findings in project area through FGD include: Major crops in Rabi are Wheat, Gram, Pulses and Mustard. Generally farmers use HYV seeds but a significant proportion of them used a local variety of wheat seed (Katia) as it does not require many watering. However, productivity of Katia is low; Decreasing agriculture productivity due to untimely water supply and shortage of HYV seeds; In Kharif Pulses, Maize, Til, Groundnut, Jwar and Soyabean; About 90% of net sown area was irrigated; Source of Irrigation; In block Birdha and Bar, the ground water level is very deep (70-80 metre). About 22%-24% of tubewells failure were recorded at the time of installation in Birdha, Mehrauni and Mandawara block. There is no maintenance of tubewells.; Canal system irrigation through Jamni, Sajnam & Rohini at less than recent normal; Cattle damage not only canal banks but also forest land; Under national horticulture Mission free saplings of Guava, Awonla, Lemon and Mango are given to farmers. Guava and Aownla are giving good return after about four years and a net income of about Rs. 70000/- per hectare was estimated from their crops; India Mark – II is the main source
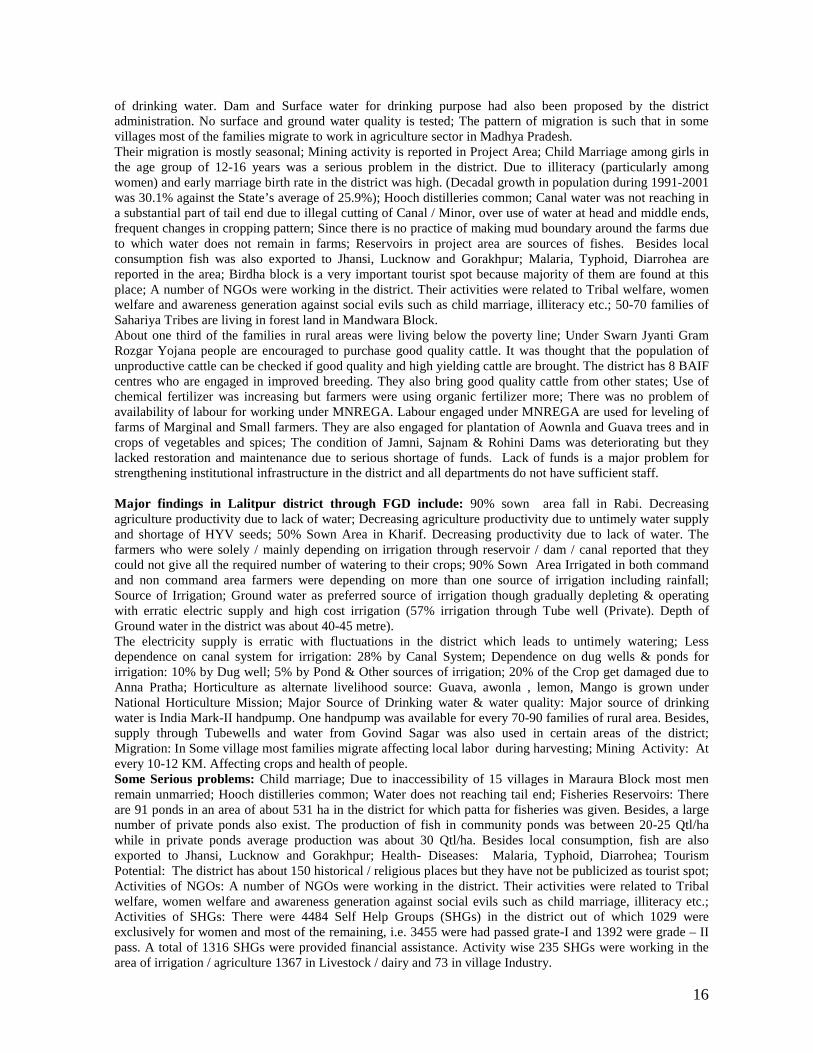
16
of drinking water. Dam and Surface water for drinking purpose had also been proposed by the district administration. No surface and ground water quality is tested; The pattern of migration is such that in some villages most of the families migrate to work in agriculture sector in Madhya Pradesh. Their migration is mostly seasonal; Mining activity is reported in Project Area; Child Marriage among girls in the age group of 12-16 years was a serious problem in the district. Due to illiteracy (particularly among women) and early marriage birth rate in the district was high. (Decadal growth in population during 1991-2001 was 30.1% against the State’s average of 25.9%); Hooch distilleries common; Canal water was not reaching in a substantial part of tail end due to illegal cutting of Canal / Minor, over use of water at head and middle ends, frequent changes in cropping pattern; Since there is no practice of making mud boundary around the farms due to which water does not remain in farms; Reservoirs in project area are sources of fishes. Besides local consumption fish was also exported to Jhansi, Lucknow and Gorakhpur; Malaria, Typhoid, Diarrohea are reported in the area; Birdha block is a very important tourist spot because majority of them are found at this place; A number of NGOs were working in the district. Their activities were related to Tribal welfare, women welfare and awareness generation against social evils such as child marriage, illiteracy etc.; 50-70 families of Sahariya Tribes are living in forest land in Mandwara Block. About one third of the families in rural areas were living below the poverty line; Under Swarn Jyanti Gram Rozgar Yojana people are encouraged to purchase good quality cattle. It was thought that the population of unproductive cattle can be checked if good quality and high yielding cattle are brought. The district has 8 BAIF centres who are engaged in improved breeding. They also bring good quality cattle from other states; Use of chemical fertilizer was increasing but farmers were using organic fertilizer more; There was no problem of availability of labour for working under MNREGA. Labour engaged under MNREGA are used for leveling of farms of Marginal and Small farmers. They are also engaged for plantation of Aownla and Guava trees and in crops of vegetables and spices; The condition of Jamni, Sajnam & Rohini Dams was deteriorating but they lacked restoration and maintenance due to serious shortage of funds. Lack of funds is a major problem for strengthening institutional infrastructure in the district and all departments do not have sufficient staff. Major findings in Lalitpur district through FGD include: 90% sown area fall in Rabi. Decreasing agriculture productivity due to lack of water; Decreasing agriculture productivity due to untimely water supply and shortage of HYV seeds; 50% Sown Area in Kharif. Decreasing productivity due to lack of water. The farmers who were solely / mainly depending on irrigation through reservoir / dam / canal reported that they could not give all the required number of watering to their crops; 90% Sown Area Irrigated in both command and non command area farmers were depending on more than one source of irrigation including rainfall; Source of Irrigation; Ground water as preferred source of irrigation though gradually depleting & operating with erratic electric supply and high cost irrigation (57% irrigation through Tube well (Private). Depth of Ground water in the district was about 40-45 metre). The electricity supply is erratic with fluctuations in the district which leads to untimely watering; Less dependence on canal system for irrigation: 28% by Canal System; Dependence on dug wells & ponds for irrigation: 10% by Dug well; 5% by Pond & Other sources of irrigation; 20% of the Crop get damaged due to Anna Pratha; Horticulture as alternate livelihood source: Guava, awonla , lemon, Mango is grown under National Horticulture Mission; Major Source of Drinking water & water quality: Major source of drinking water is India Mark-II handpump. One handpump was available for every 70-90 families of rural area. Besides, supply through Tubewells and water from Govind Sagar was also used in certain areas of the district; Migration: In Some village most families migrate affecting local labor during harvesting; Mining Activity: At every 10-12 KM. Affecting crops and health of people. Some Serious problems: Child marriage; Due to inaccessibility of 15 villages in Maraura Block most men remain unmarried; Hooch distilleries common; Water does not reaching tail end; Fisheries Reservoirs: There are 91 ponds in an area of about 531 ha in the district for which patta for fisheries was given. Besides, a large number of private ponds also exist. The production of fish in community ponds was between 20-25 Qtl/ha while in private ponds average production was about 30 Qtl/ha. Besides local consumption, fish are also exported to Jhansi, Lucknow and Gorakhpur; Health- Diseases: Malaria, Typhoid, Diarrohea; Tourism Potential: The district has about 150 historical / religious places but they have not be publicized as tourist spot; Activities of NGOs: A number of NGOs were working in the district. Their activities were related to Tribal welfare, women welfare and awareness generation against social evils such as child marriage, illiteracy etc.; Activities of SHGs: There were 4484 Self Help Groups (SHGs) in the district out of which 1029 were exclusively for women and most of the remaining, i.e. 3455 were had passed grate-I and 1392 were grade – II pass. A total of 1316 SHGs were provided financial assistance. Activity wise 235 SHGs were working in the area of irrigation / agriculture 1367 in Livestock / dairy and 73 in village Industry.

17
A number of SHGs were engaged in preparation of spices, Achars and Murabbas. Some SHGs were engaged in making Terrakota and in weaving famous Chanderi Saries; Deaths due to starvation: Not Reported; ST population: Negligible; BPL families: About one third of the families in rural areas were living below the poverty line; Livestock Rearing: Under Swarn Jyanti Gram Rozgar Yojana people are encouraged to purchase good quality cattle. It was thought that the population of unproductive cattle can be checked if good quality and high yielding cattle are brought. The district has 8 BAIF centres who are engaged in improved breeding. They also bring good quality cattle from other states; Use of chemical fertilizer & bio pesticide: Use of chemical fertilizer was increasing but farmers were still using organic fertilizer more; Availability of agriculture labour: There was no problem of availability of labour for working under MNREGA. Labour engaged under MNREGA are used for leveling of farms of Marginal and Small farmers. They are also engaged for plantation of Awonla and Guava trees and in crops of vegetables and spices; Lack of funds for maintenance of Dams: Dams have large amount of silt. The condition of Dams was deteriorating but their restoration and maintenance was not possible due to serious shortage of funds. Lack of funds is a major problem for strengthening institutional infrastructure in the district; and Lack of HR / Staff: All departments do not have sufficient staff. Major social issues, which have emerged include data: Shifting in occupational pattern & livelihood, migration; Livelihood & Food security; Agriculture & Livelihood; Deteriorating Performance of Irrigation Infrastructures, Agriculture & Livelihood; Heavy dependency on ground water, costly source of irrigation; Alternate & traditional sources of irrigation; Loss of Livelihood; Livelihood; Health; Poverty Alleviation & Alternate sources of Livelihood; Dependence on electricity; Gender & Health; Access to information & connectivity; Connectivity to Agrimarket infrastructure; Lack of participatory approach for water use; Poverty Alleviation & Alternate sources of Livelihood; Linking of Health & Poverty; Tourism; Lack of participatory approach in water resource management; Lack of participatory approach in water resource management; Poverty ; Vulnerability of tribal population; Alternative source of Livelihood & alternate to anna pratha; Soil & Water Pollution; Seasonal availability of agriculture labour; Low cost of irrigation service delivery impacting financial performance of irrigation system; Lack of human resources, awareness & capacity building.

18
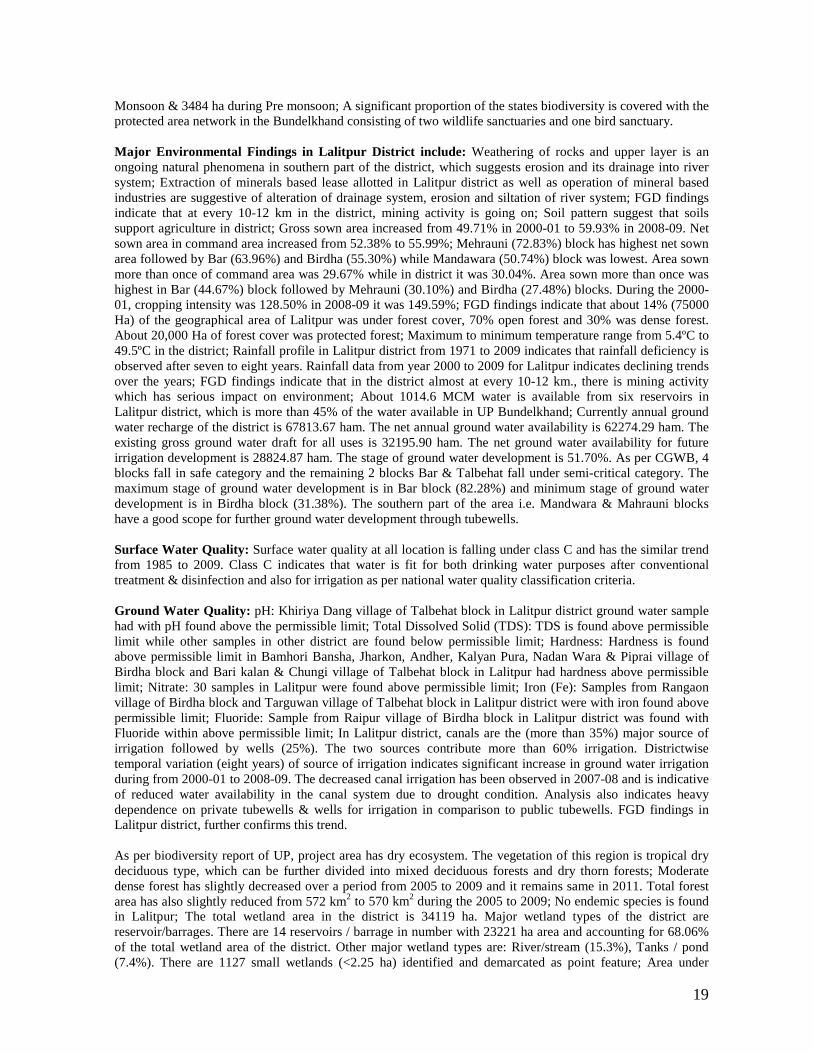
Baseline Environmental Assessment: Major Environmental Findings in Bundelkhand Region: Weathering of rocks and upper layer is an ongoing natural phenomena which suggests erosion and its drainage into river system depending on vegetation cover; Extraction of minerals based lease allotted in each district as well as operation of mineral based industries are suggestive of alteration of drainage system, erosion and siltation of river system; Soil Pattern in the region indicates that it supports agriculture in the region. However, primary survey of command & non-command area indicates decreasing fertility & increasing consumption of fertilizers. Change in land use pattern from 2000-01 to 2008-09 indicate that forest area in the Bundelkhand declined from 268660 ha in 2000-01 to 244578 ha during 2008-09. Present fallow land increased from 145904 ha in 2000-01 to 184415 ha in 2008-09. Overall gross sown area increased in 2008-09 in comparison to 2000-01. This increase in 2008 is because of increase in gross sown area in Jalaun, Lalitpur & Mahoba, while in all other districts it declined. Maximum to minimum temperature ranges from 5.4ºC to 49.5ºC; Rainfall data from year 2000 to 2009 indicates declining trends in all the districts of Bundelkhand. Average rainfall ranges from 841 mm in 2000 to 619 mm in 2009. Year 2006, 2007 and 2008 indicate highly rainfall deficit years in Bundelkhand. This phenomena prevailed continuously for three years and had impacts on water resources. A simple root cause analysis indicates that rainfall deficiency triggers reduced water availability in canals, which may further trigger decline in agriculture production and water for other uses; Recent mining activity is leading to deterioration of air quality; According to UPID data, about 2013 MCM of surface water is available from 28 existing reservoirs in UP Bundelkhand; According to Central Ground Water Board2, the total ground water resources of the Bundelkhand region are 8397 Million Cubic Meter (MCM) out of which 4632 MCM (55.1%) is in Uttar Pradesh. Utilizable potential for irrigation in Bundelkhand region is around 6419 MCM out of which 3544 MCM (55.2%) is in Uttar Pradesh. Level of utilisation in Uttar Pradesh, till 2001 was 1019 MCM and balance ground water available for future development was thus 2525 MCM (53%); CGWB data indicates that ground water development has increased from 37.56% in 2001 to 54% in 2009; While the CGWB report suggest availability of additional potential that can be tapped, the recent drought cycle of four years has completely depleted the available resource in drought prone districts in the absence of recharge from rainfall; during this period; Further yield and re-charging in the drought prone districts seem to be poor and additional ground water development appears to be economically unsustainable because of rocky terrain in Bundelkhand and cost of developing dug wells/tube wells being very high. Surface Water Quality: Surface water quality at all monitored locations is falling under class C and has the similar trend from 1985 to 2009. Class C indicates that water is fit for both drinking water purposes after conventional treatment & disinfection and also for irrigation as per national water quality classification criteria. Ground Water Quality: pH: Out of 151 samples, 13 samples were found above permissible limit (pH 8.5) in Jalaun district, in Jhansi district and in Lalitpur district; Total Dissolved Solid (TDS): A total 11 samples were found above permissible limit (2000 mg/l) in Jalaun district and in Jhansi district; Hardness: Out of 151 ground water samples, 33 ground water samples are observed above the permissible limit (600 mg/l) in Jalaun, Jhansi and Lalitpur districts; Nitrate: Out of 151 ground water sample, 106 ground water samples were found above permissible limit. in Jalaun; Jhansi, Lalitpur and Mahoba; Iron (Fe): A total 8 water samples were observed above permissible limit (1 mg/l), in Jalaun district, in Jhansi district; Fluoride: A total 12 samples were found above permissible limit (1.5 mg/l). in Jalaun district; in Jhansi district and in Lalitpur district; Third census of minor irrigation schemes (2001) suggests nearly 14% of net sown area of about 19 lakh ha is irrigated by major and medium schemes, 13% by gravity water and 1% by other surface water resources. Kharif irrigation is about 5% and Rabi about 95%. Nearly 70% of the area continues to be rain dependant. A comparative analysis of irrigated area of the Bundelkhand covered under different sources (Source: District Statistical Handbook) for 2000-01 and 2008-09 indicates that ground water use covers 16% of the reported irrigated area in the year 2000-01 and 28% in 2008-09. Surface water use covers 49% in 2000-01 and 45% in 2008-09. The data indicates that source of irrigation increased by 12% through ground water in Bundelkhand region; Landuse statistics indicate decrease in Forest cover. As per biodiversity report of UP Bundelkhand has dry ecosystem. The vegetation of this region is tropical dry deciduous type, which can be further divided into mixed deciduous forests and dry thorn forests. Two endemic plant species is found in Lalitpur district. Rorippa pseudoislandica (Brassicaceae) & Alectra chitrakutensis (Scrophulariaceae) is found in Hamirpur & Banda; About 120067 ha of wetland area falls in UP. The area under aquatic vegetation is 7152 ha during Post
2 Hydrogeology of the Bundelkhand region, CGWB, 2001
19
Monsoon & 3484 ha during Pre monsoon; A significant proportion of the states biodiversity is covered with the protected area network in the Bundelkhand consisting of two wildlife sanctuaries and one bird sanctuary. Major Environmental Findings in Lalitpur District include: Weathering of rocks and upper layer is an ongoing natural phenomena in southern part of the district, which suggests erosion and its drainage into river system; Extraction of minerals based lease allotted in Lalitpur district as well as operation of mineral based industries are suggestive of alteration of drainage system, erosion and siltation of river system; FGD findings indicate that at every 10-12 km in the district, mining activity is going on; Soil pattern suggest that soils support agriculture in district; Gross sown area increased from 49.71% in 2000-01 to 59.93% in 2008-09. Net sown area in command area increased from 52.38% to 55.99%; Mehrauni (72.83%) block has highest net sown area followed by Bar (63.96%) and Birdha (55.30%) while Mandawara (50.74%) block was lowest. Area sown more than once of command area was 29.67% while in district it was 30.04%. Area sown more than once was highest in Bar (44.67%) block followed by Mehrauni (30.10%) and Birdha (27.48%) blocks. During the 2000-01, cropping intensity was 128.50% in 2008-09 it was 149.59%; FGD findings indicate that about 14% (75000 Ha) of the geographical area of Lalitpur was under forest cover, 70% open forest and 30% was dense forest. About 20,000 Ha of forest cover was protected forest; Maximum to minimum temperature range from 5.4ºC to 49.5ºC in the district; Rainfall profile in Lalitpur district from 1971 to 2009 indicates that rainfall deficiency is observed after seven to eight years. Rainfall data from year 2000 to 2009 for Lalitpur indicates declining trends over the years; FGD findings indicate that in the district almost at every 10-12 km., there is mining activity which has serious impact on environment; About 1014.6 MCM water is available from six reservoirs in Lalitpur district, which is more than 45% of the water available in UP Bundelkhand; Currently annual ground water recharge of the district is 67813.67 ham. The net annual ground water availability is 62274.29 ham. The existing gross ground water draft for all uses is 32195.90 ham. The net ground water availability for future irrigation development is 28824.87 ham. The stage of ground water development is 51.70%. As per CGWB, 4 blocks fall in safe category and the remaining 2 blocks Bar & Talbehat fall under semi-critical category. The maximum stage of ground water development is in Bar block (82.28%) and minimum stage of ground water development is in Birdha block (31.38%). The southern part of the area i.e. Mandwara & Mahrauni blocks have a good scope for further ground water development through tubewells. Surface Water Quality: Surface water quality at all location is falling under class C and has the similar trend from 1985 to 2009. Class C indicates that water is fit for both drinking water purposes after conventional treatment & disinfection and also for irrigation as per national water quality classification criteria. Ground Water Quality: pH: Khiriya Dang village of Talbehat block in Lalitpur district ground water sample had with pH found above the permissible limit; Total Dissolved Solid (TDS): TDS is found above permissible limit while other samples in other district are found below permissible limit; Hardness: Hardness is found above permissible limit in Bamhori Bansha, Jharkon, Andher, Kalyan Pura, Nadan Wara & Piprai village of Birdha block and Bari kalan & Chungi village of Talbehat block in Lalitpur had hardness above permissible limit; Nitrate: 30 samples in Lalitpur were found above permissible limit; Iron (Fe): Samples from Rangaon village of Birdha block and Targuwan village of Talbehat block in Lalitpur district were with iron found above permissible limit; Fluoride: Sample from Raipur village of Birdha block in Lalitpur district was found with Fluoride within above permissible limit; In Lalitpur district, canals are the (more than 35%) major source of irrigation followed by wells (25%). The two sources contribute more than 60% irrigation. Districtwise temporal variation (eight years) of source of irrigation indicates significant increase in ground water irrigation during from 2000-01 to 2008-09. The decreased canal irrigation has been observed in 2007-08 and is indicative of reduced water availability in the canal system due to drought condition. Analysis also indicates heavy dependence on private tubewells & wells for irrigation in comparison to public tubewells. FGD findings in Lalitpur district, further confirms this trend. As per biodiversity report of UP, project area has dry ecosystem. The vegetation of this region is tropical dry deciduous type, which can be further divided into mixed deciduous forests and dry thorn forests; Moderate dense forest has slightly decreased over a period from 2005 to 2009 and it remains same in 2011. Total forest area has also slightly reduced from 572 km2 to 570 km2 during the 2005 to 2009; No endemic species is found in Lalitpur; The total wetland area in the district is 34119 ha. Major wetland types of the district are reservoir/barrages. There are 14 reservoirs / barrage in number with 23221 ha area and accounting for 68.06% of the total wetland area of the district. Other major wetland types are: River/stream (15.3%), Tanks / pond (7.4%). There are 1127 small wetlands (<2.25 ha) identified and demarcated as point feature; Area under
20
aquatic vegetation in pre-monsoon season is 1261 ha during post-monsoon season while in pre-monsoon season it reduced to 671 ha. Major Environmental Findings in (Command & Non-command) Project Area include: FGD findings with stakeholders indicate that dams have large amount of silt. However, no measurement of siltation in Jamni, Rohini & Sajnam has been carried out; More farmers in non command (15%) than in command area (4%) reportedly got soil fertility of their farms tested during the last ten years, mostly once, and sometimes twice or more. The proportion of such farmers was significant in Block Birdha non-command (38%). About 21% of farmers in non-command and 12% in Command area reported reduction in Soil fertility of their farms, mostly due to sodicity; Block-wise about 19% of farmers in Mandwara, 15% in Talbehat and 7% in Birdha in Command area reported reduction in soil fertility of their farms while in non-command area about 27% of farmers in Birdha, 19% in Mandwari and 18% in Talbehat reported similar condition of soil fertility of their farms; Further shortage of fertilizer is a serious constraint for a significant proportion of farmers in both command and non-command area. Primary survey indicates tha overall gross sown area increased in 2008-09 in comparison to 2000-01. This increase in 2008-09 is because of increase in gross sown area in all blocks of command area. Further, gross sown area showed an increasing trend during Kharif except during 2005-06 & 2006-07, which can be attributed to drought years. This indicates that availability of water can further increase the gross sown area in the command. Forest area has decreased, while land put to use other than agriculture has increased; Primary survey in command area indicates that out of 110 families in Command area 12 having 12.6 Ha land and 28 families out of 190 in non command having 30.3 Ha land reportedly suffered from drought. The affected size of landholding suggest that most of them were Marginal farmers. Block wise 8 in Birdha and 2 each in Mandwari and Talbehat in Command and 11 in Birdha, 10 in Talbehat and 7 in Mandwari in non command had suffered due to drought . Only two farmers in command and 5 in non command area had a total Barren land of 1.8 Ha and 9.6 Ha respectively while one farmer each in command and non-command area complained about water logging. FGD findings indicate that the forest cover is going to reduce due to Anna Pratha. The stray animals eat the newly grown plant; Primary survey indicated that the period of heavy rains in the area was reportedly July-August in all the three blocks of both command and non-Command area; During the last 10 years, crops of a majority of farmers in Command (74%) and non-command (62%) area were affected for 3-4 times due to occurrences of drought, which is a considerably large number as one failure of crop affects the economic condition of farmers for more than two crop seasons; About 88% of farmers in command area reported their crops were affected by drought between once and six times in the last 10 years. About 96% of affected farmers were in Block Birdha and Mandwari while in Talbehat about 65% of the farmers were affected; About 79% of farmers in non-command reported their crops were affected between once and 8 times in the last 10 years. About 96% of farmers in Birdha, 92% in Talbehat and 55% in Mandwari suffered from such occurrences; FGD findings Indicate that air quality deteriorating due to mining activity in Command & Non-Command area; About 167 MCM water is available from Jamni, Sajnam and Rohini Dams, which is 16.4% of the total water available in Lalitpur district; Performance of Jamini reservoir live storage indicates that it ranged between 17.3% in 2007-08 to 100% during 2003-04 & 2005-06. Out of eleven year period, live storage ranged between 60% to 80% during four years, one year between 80% to 90% and above 90% during five years. During one year, the live storage capacity was less than 20%. Live storage trend indicates steep decrease during the period 2005 to 2009 indicating hydrological drought. Performance of Sajnam reservoir live storage indicates that it ranged between 17.9% during 2007-08 to 100% during 2005-06 & 2008-09. During eleven year period, it ranged between 60% to 80% during three years, while for one year, it ranged between 80% to 90%. During the remaining seven years, the live storage was below 60%. Live storage trend indicates steep decrease in capacity during the period 2005 to 2009 indicating hydrological drought. Further, near normal conditions are indicated during three years, when live storage capacity was above 90%; Live storage capacity of Rohini dam from 2000-01 to 2010-11 indicated that it ranged from zero in 2007-08 to 100% in 2005-06 and 2008-09. Storage capacity was above 90% during two years, while it ranged between 70% to 80% for three years. During five years, it was below 70%. Steep decrease in storage capacity was observed during 2005 to 2009 indicating hydrological drought; Above analysis indicates that near normal water availability have been observed for five years in Jamni, three years in Sajnam and two years in Rohini reservoirs during eleven year period. Considering 70% as the bare minimum live storage, it can be inferred that canal system from the three reservoirs can be operated to some extent for seven years. During the remaining four years, canal supplies for irrigation had to be curtailed significantly. During 2007-08, Jamni & Sajnam reservoirs had just 17% of water left while in Rohini reservoir it was

21
negligible. Therefore, availability of water is a serious issue, which was confirmed during stakeholder consultations both in the district as well as the project area as highlighted in chapter 3. Pre & Post Monsoon 2006, depth to water table of the district indicates that premonsoon water level varies from 0.77 (Talbehat) to 11.85 mbgl (Madawara). In post monsoon period, depth to water level varies from 0.70 to 10.38 mbgl. Water level fluctuation varies from 0.07 m (Talbehat) to 2.60 m (Lalitpur) Shallow water level is observed in canal commands and the deeper water level is noticed at southeastern part of the district mainly in Madawara block. The shallow water level (0.00 to 3.00 mbgl) are occurring in the form of small pockets along the surface water bodies in Talbehat areas; FGD findings indicate that depth of Ground water in the district was going down & had recently reached 40-45 Metre. In block Birdha and Bar, the water level is very deep (70-80 metre). About 22-24% of tubewells failure was recorded at the time of installation in Birdha, Jakhaura & Mehrauni and Mandawara block. This drop could be attributed to recent drought years and absence of recharge. Further these findings also confirm Bar as semi critical block. Surface Water Quality: Project area (Jamni, Sajnam, Rohni Dam and canal system) has never been monitored by any agency. So, Pre- monsoon surface water quality assessment has been carried out in the command area of Jamini Dam, Rohni Dam and Sajnam Dam; Turbidity is found beyond the permissible limit (10 NTU) in all locations except Left Sajnam Canal and Right Sajnam Canal. Hardness is also observed within the desirable limit; Residual Chlorine was found beyond the desirable limit (0.2 mg/l) at all locations; Fluoride was observed slight beyond the permissible limit (1.5 mg/l) at Left Sajnam Canal and Right Sajnam Canal. Ground Water Quality: pH: was highest in Khiriqamisar, Bhawani, Gugarwara, Jaraoli, Kakdari & Pah villages of Bar block; Patsemra & Tenga village of Birdha block; Piprat & Ramgarha village of Mandawara block and Baryo, Dhurwara, Khatora, Kuraura, Luharra & Sindwaha village of Mehrauni block; Turbidity: was highest in Bamhori Kharait, Banoni, Billa, Semaria, Dashrara, Dailwara, Kakdari, Kuwagaon, Mathura Dang, Mirchwara , Khakron, Semrabhag, Nagar, Kailoni, Udaipura & Umari villages of Bar block; Bandar Gurha Village Of Birdha Block; Didonia Village Of Mandawara Block And Bamhori, Bahadursingh, Chhayan, Gadolikalan, Jakhaura, Kisarda, Bamhorighat, Rameshra, Sadumal, Samogar & Sindwaha village of Mehrauni block; Nitrate: was highest in Billa, Daroni, Dashrara, Jaraoli, Mathura Dang, Todi & Udya Villages of Bar Block; Dongra Kalan & Pali Rural Village of Birdha Block; Bachhraoni, Dongra Kalan, Amora, Bhonta, Dhurwara, Chhapchhol, Deoran Kalan, Khatora, Bangaruwa, Mainwar, Bamhorighat, Rameshra, Saidpur & Samogar Village of Mandawara Block; Iron: was found above permissible in Badokhara, Suri Khurd, Bamhori Kharait, Bhelonilodh, Daroni, Dashrara, Didaura, Bharoni, Jaraoli, Teela, Kakdari, Karmai, Kuwagaon, Mogan, Pah, Khakron, Pura Dhadkuwa, Semrabhag Nagar, Kailoni & Udaipura Villages in Bar Block and 4 Village in Birdha Block; 12 Village in Mehrauni block; Fluoride: was found above permissible in 19 Villages of Bar Block, one village of Mandwara block and 19 Village of Mehrauni Block. Block wise temporal variation (Ten years) of source of irrigation indicates slight reduction of canal irrigation and increase in ground water irrigation during 2006 & 2007. The decreased canal irrigation is indicative of reduced water availability in the canal system during the subsequent years. This further indicates fluctuation in rainfall during these two years; Except for Mehrauni block, all the blocks showed increased dependence on ground water. It also indicates that Mehrauni block located on the head of the canal system gets the maximum advantage of canal irrigation. Further, Bar block, which is located at the tail end area of canal system indicates maximum dependence (43% to 69%) on ground water for irrigation. This increased dependence on ground water in Bar has resulted in 82% of ground water development in the block, thereby ranking it into semi critical category as per CGWB. This limits the scope of further development of ground water resources up to 8% to 10% in the block and require interventions for increasing efficiency in Canal System on the upstream side in order to deliver water in the tail end. In Jamni canal system, actual irrigation during Rabi ranged from 21% in 2006-07 to above 100% of the recent normal during 2005-06. 2006-07 indicated drastic cut in canal irrigation due to minimum live storage capacity of reservoir. During five years out of ten years the canal system could irrigate only 75% to 80% of the maximum irrigation, while during four years, it was above 90%. During Kharif season, irrigation from canal system was observed minimum during 2002-03, 2003-04 and 2007-08. This may be attributed due to nearly 60% live storage in Jamni reservoir during 2001-02, 2002-03 and extreme drought year in 2007-08. In Sajnam canal system, actual irrigation during Rabi ranged from 55% in 2007-08 to more than 100% of the recent normal during 2005-06. Six years out of ten years have been observed to be normal, where the canal system could irrigate near normal to maximum irrigation, while during three years canal irrigation have been found to be below normal and one year as drought year. During Kharif season, irrigation from canal system
22
was observed minimum, during 2003-04, while it was maximum during 2010-11. This may be attributed to nearly 60% live storage capacity in Sajnam reservoir. In Rohini canal system, actual irrigation during Rabi ranged from 20% during 2007-08 to above 100% during 2001-02 and 2004-05 & 2005-06. Six years out of ten years have been observed to be normal, where the canal system could irrigate normal to maximum irrigation, while during three years, canal irrigation have been found to below normal, while one year has been observed as drought year. During Kharif season, irrigation from canal system was observed minimum during 2003-04 and 2008-09, while it was maximum during 2005-06. Performance of canal system in terms of tail feeding from 2006-07 to 2011-12 indicates that irrigation was targeted only for 68% to 85% of the total tail ends during this period. Only 6% tail ends were fed during 2007-08 indicating drought conditions, while a maximum of 85% of the target was achieved during two years (2006-07 & 2008-09). This indicated that tail ends do not receive water during majority of years. This could be due to either non availability of water on account of deficit rainfall or due to deficiencies in the canal operating system e.g. water losses; Data from UPID indicates that water losses per km in Jamni canal ranges from 1.72 cusec/km to 1.84/km. Similarly, in Sajnam canal system, it ranges from 1.80 cusec/km to 2.33 cusec/km, while in Rohini canal system, it is 1.09 cusec/km. FGD findings in the district Lalitpur and field interaction with the farmers confirm these findings. FGD findings indicate that the district has a large number (aprox. 50) of medicinal species in the forest area. The varity of small medicinal trees are Bhangraj, Bhum amla, Shankh pushpi, Safed Musli, Shatabar, Harjor, Ashwgandha, Arusa, Thuar, etc. The tall varities of trees are Gulmarg, Amla, Bel, Beejasal, Mahua, Duddhi, Neem, Jamun, Arjun, Reetha, etc.; Arjun, Shankh pushpi and Jamun are found in abundance on both sides of river, canal and drains in the district; About 14% (75000 Ha) of the geographical area of Lalitpur was under forest cover, 70% open forest and 30% was dense forest. About 20,000 Ha of forest cover was protected forest. Other forest produce from the blocks are Tendu leaves, Chironji, Mahva, Arjun ki chhal and Bel, which are collected and sold to the forest doptes; Sandal trees are found in block Bar. Illegal cutting of sandal trees is a major problem; Mahavir Swami Wildlife sanctuary is ~16 km from the nearest Dam (Sajnam) where interventions are proposed As per the Environment Impact Assessment notification, 2006, the project site should be 10 km away from the eco-sensitive zone. So, proposed activities do not invoke EIA notification.
Major Environment Issues include: Soil Erosion in the Catchment area; Decreasing Fertility of soil & increasing consumption of fertilizer; Changes in land use particularly in catchment area e.g. decreasing forest cover & diversion of land for other uses (non agriculture); Extreme climatic conditions, rainfall deficiency & drought; Air quality deterioration; Limited availability of Surface Water; Limited availability of Ground Water; Surface & Ground Water Quality; Increasing dependence on ground water for irrigation in comparison to surface water; Decrease in forest cover, vulnerability of Flora & Fauna; Vulnerability of Protected Areas & Wetlands. Project Impacts include: 1. Hiring of services for WUA formations will lead to employment generation. 2. Awareness campaign on PIM will lead to increased awareness which will: Lead to greater awareness about community inclusion, ownership, participation & empowerment including
female & SC/ST in water resource management e.g. Pani Panchayat at village level in Lalitpur district. Lead to greater awareness about the need for surface water availability at tail end thereby reducing
dependence on ground water resources in tail end area of command. Lead to greater awareness about the need to prepare & implement Crop Plan, which will lead to agriculture
intensification & diversification. Lead to greater awareness about land use change, due to increase in net sown area due to bringing of
additional land into agriculture & allied activities. Lead to greater awareness about the need to arrest land diversion for uses other than agriculture. Lead to greater awareness about increased opportunities for sustainable livelihood through agriculture &
allied activities triggering arrest of changes in occupational pattern; reduction in indebtedness & finally reduction in financial risk & vulnerability.
Lead to greater awareness about soil fertility, soil erosion and waste dumping / utilization of waste for useful purposes.
Lead to greater awareness and knowledge base about air pollution, GHG emissions and extreme climate events.

23
Lead to increased awareness about water pollution, causes of pollution, surface and ground water quality as well as the sources of pollution e.g. nutrient transport from agriculture field into water body may cause eutrophication of water bodies.
Lead to increased awareness about the need to conserve fodder & develop pasture land in order to address “Anna Pratha” in command area in Lalitpur.
Lead to increased awareness about the need to protect Flora, Fauna, Protected Areas, Cultural Heritage & Wetlands.
Lead to increased awareness about the need to protect and conserve drinking water sources for arresting water & vector borne diseases, improve sanitation practices and address public health.
3. Election of candidates / farmers / SC/ST in water user’s association at all levels (field / Kolaba / alpika / others) will not only lead to empowerment of females, vulnerable groups about also ensure their ownership and partnership in decision making.
4. Registration & handing over of management of irrigation system to WUAs will: Lead to competing uses community inclusion, ownership, participation & empowerment including female
& SC/ST in water resource management e.g. Pani Panchayat at village level in Lalitpur district. Lead to surface water availability at tail end thereby reducing dependence on ground water resources in
tail end. Lead to preparation & implementation Crop Plan, which will lead to agriculture intensification &
diversification. Lead to increase in net sown area and bring additional land into agriculture & allied activities. Lead to arrest of land diversion for uses other than agriculture. Lead to increased opportunities for sustainable livelihood through agriculture & allied activities thereby
arresting changes in occupational pattern; reduction in indebtedness & reduction in risk & vulnerability. Lead to planning & implementation of measures for soil fertility, soil erosion and waste dumping /
utilization of waste for useful purposes. Lead to planning & implementation of measures for air pollution and GHG emissions as well as extreme
climate events. Lead to increased planning & implementation of measures for addressing water pollution, causes of
pollution and surface and ground water quality, as well as the sources of pollution. Lead to planning & implementation of measures to conserve fodder & develop pasture land in order to
address “Anna Pratha”. Lead to planning & implementation of measures to protect Flora, Fauna, Protected Areas, Cultural
Heritage & Wetlands. Lead to planning & implementation of measures to protect & conserve drinking water sources for arresting
water & vector borne diseases improve sanitation practices and address public health issue. 5. Training & Capacity Building of UPID & WUA’s will lead to planning & implementation of: Community inclusion, ownership, participation & empowerment including female & SC/ST in water
resource management. Surface water availability at tail end thereby reducing dependence on ground water resources in tail end. Preparation & implementation of Crop Plan, which will lead to agriculture intensification &
diversification. Bring additional land into agriculture & allied activities. Arresting of land diversion for use other than agriculture. Developing increased opportunities for sustainable livelihood through agriculture & allied activities
thereby arresting changes in occupational pattern reduction in indebtedness & reduction in risk & vulnerability.
Measures for soil fertility, soil erosion and waste dumping / utilization of waste for useful purposes. Measures for addressing air pollution and GHG emissions as well as extreme climate events. Measures for addressing water pollution, causes of pollution, surface and ground water quality as well as
the sources of pollution. Measures for conserving fodder & developing pasture land in order to address “Anna Pratha” in command
area in Lalitpur. Measures for protecting Flora, Fauna, Protected Areas, Cultural Heritage & Wetlands. Measures for protecting & conserving drinking water sources for arresting water & vector borne diseases,
improving sanitation practices and addressing public health issue. 6. Exposure trips to sites of successful experiments will:
24
Lead to learinng about community inclusion, ownership, participation & empowerment including female & SC/ST in water resource management.
Lead to learning about surface water availability at tail end thereby reducing dependence on ground water resources in tail end.
Lead to learning about the need to prepare & implement Crop Plan, which will lead to agriculture intensification & diversification.
Lead to learning about increase in net sown area and bringing additional land into agriculture & allied activities.
Lead to learning about arrest of land diversion for user other than agriculture. Lead to learning about increased opportunities for sustainable livelihood through agriculture & allied
activities thereby arresting changes in occupational pattern; reduction in indebtedness & reduction in financial risk & vulnerability.
Lead to learning about soil fertility, soil erosion and dumping / utilization of waste for useful purposes. Lead to learning about water pollution, causes of pollution, surface and ground water quality as well as the
sources of pollution e.g. eutrophication of water bodies & its causes. Lead to learning about the need to conserve fodder & develop pasture land in order to “Anna Pratha”. Lead to learning about the need to protect Flora, Fauna, Protected Areas, Cultural Heritage & Wetlands. Lead to learning about the need to protect conserve drinking water sources for arresting water & vector
borne diseases improve sanitation practices and address public health issue. 7. Construction of office for WUAs in phase 1 may require additional land for construction and also for
creation of infrastructure for providing services. Will require land Air pollution is expected during construction activity related to these offices. Construction waste is expected to be generated during construction activity related to these offices. 8. Construction of office for WUAs in phase 2 may require additional space for construction and also for
creation of infrastructure for providing services. May require land Air pollution is expected during construction activity related to these offices. Construction waste is expected to be generated during construction activity related to these offices. 9. Rehabilitation and Modernization of Rohini Dam Canal System, Jamini Dam Canal system and Sajnam
Dam Canal System will: Lead to greater surface water availability at tail end thereby reducing dependence on ground water
resources in tail end. Lead to preparation & implementation of Crop Plan, which will lead to agriculture intensification &
diversification. Lead to greater water availability resulting is increase in net sown area and bringing additional land into
agriculture & allied activities. Lead to arrest of land diversion for uses other than agriculture. Lead to increased opportunities for sustainable livelihood through agriculture & allied activities thereby
arresting changes in occupational pattern; reduction in indebtedness & reduction in risk & vulnerability. Lead to soil erosion and waste dumping during construction. Result in air pollution and GHG emissions during construction activity Result in surface water pollution during construction and operation Lead to planning & implementation of measures to conserve fodder & develop pasture land in order to
address “Anna Pratha”. Lead to reduced water logging leading to arrest of water & vector borne diseases, improve sanitation
practices and address public health issue. 10. Storage dams/regulating weirs shall need special rehabilitation and modernization to sustain the canal
system rehabilitation and modernization e.g. Jamini: 1-Stone boulder pitching of seepage drain is distributed and damaged between Km. 0.6 to 5.5 Km; Rohini Dam:- 1-U/s pitching damage in some places; Sajnam Dam:- 1-Leakage in seepage gallery. 2-seepage drain is damaged.
Lead to surface water availability at tail end thereby reducing dependence on ground water resources in tail end.
Lead to preparation & implementation Crop Plan, which will lead to agriculture intensification & diversification.
Lead to arrest of land diversion for uses other than agriculture. Lead to land diversion to implement construction activities by contractor.

25
Lead to increased opportunities for sustainable livelihood through agriculture & allied activities thereby arresting changes in occupational pattern; reduction in indebtedness & reduction in risk & vulnerability.
Lead to implementation of measures for soil fertility, soil erosion and dumping / utilization of waste for useful purposes.
Lead to air pollution and GHG emissions as well as extreme climate events. Lead to surface water pollution during construction. Lead to implementation of measures to conserve fodder & develop pasture land in order to address “Anna
Pratha”. Lead to implementation of measures to protect & conserve wetlands Lining of canals e.g. Rt. and Lt. Sajanam Canal 40.3 km length & Rt. and Lt. Jamni Canal 67.4 km length. Lead to surface water availability at tail end thereby reducing dependence on ground water resources in
tail end. Lead to preparation & implementation Crop Plan, which will lead to agriculture intensification &
diversification. Lead to increase in net sown area and bring additional land into agriculture & allied activities. Lead to arrest of land diversion for uses other than agriculture. Lead to increased opportunities for sustainable livelihood through agriculture & allied activities thereby
arresting changes in occupational pattern; reduction in indebtedness & reduction in risk & vulnerability. Lead to soil erosion and waste dumping during construction. Result in air pollution and GHG emissions during construction activity Result in surface water pollution during construction and operation Lead to implementation of measures to protect & conserve wetlands 11. Rehabilitation of existing important Building e.g. Inspection houses, offices, colonies, video conferencing
centre etc. Will require land Air pollution is expected during construction activity related to these offices. Construction waste is expected to be generated during construction activity related to these offices. Majority of impacts due to project are positive, regional and of long-term duration. Some of the impacts are negative, short-term and local in nature and restricted during construction. Based on the intensity of imacts, various components of the project have been categorized into category A,B & C as given below.
Category A (C2) Category B (C1, C2, C4) Category C Dredging/De-silting of Dam Heavy machinery Small tools and pumps
Rehabilitation of Canal & Drainage Systems Material handling and storage Sheds to keep machines and
tools Silt Disposal
Temporary land acquisition , if any
Lining of main and branch canal Tree felling / vegetation, if any
Repairs of existing structures of the canal and also new demand of VRBs, DRBs, Syphons etc
Debris Disposal
Improving Dam Drainage Transport of materials
Construction of offices / building Majority of negative impacts screened have been described below.
Impacted Environmental and Social Components
Type of Impact
Remarks

26
Construction Phase +Ve / -Ve
S. No
Construction Phase
1. Landscape Degradation
Negative
It is a Direct Short term impact; Irreversible in nature; Severity is low; Insignificant Impact on Livelihood
2. Soil Erosion Negative It is a Direct Short term impact; Water Quality may deteriorate in the immediate downstream due to surface runoff; Severity is low; Insignificant Impact on Livelihood
3. Air / Noise Pollution
Negative It is a Direct Short term impact; Reversible in nature; Severity is low; Low impact on local livelihood due to generation of dust, noise and handling of heavy machinery.
4. Water Pollution
Negative It is a Direct Short term impact; Reversible in nature; Severity is low; Insignificant Impact on Livelihood
5. Soil Pollution Negative It is a Direct Short term impact; Reversible in nature; Severity is low; Insignificant impact on local livelihood.
6. Disturbance to Fauna
Negative It is an Indirect Short term impact; Reversible in nature; Severity is low;
7. Impact on Flora/Fauna Negative It is an Indirect Short term impact; Irreversible in nature; Severity is low; No Impact on Livelihood
8. Worker/Local people exposure
Negative It is a Direct short term impact; Reversible in nature; Severity is low; Low impact on local livelihood due to generation of dust, smoke and noise from machinery and vehicles.
9. Water Delivery Reduction Interruption
Negative It is a Direct short term impact; Reversible in nature; Severity is low; Low to moderate impact on local livelihood due to reduction or irregular water supply in the downstream during construction
h 10. Generation of Excavated material
Negative It is a Direct short term impact; Reversible in nature; Severity is low; Low impact on local livelihood due to generation of dust and improper handling huge excavated material.
11. Deterioration to aquatic environment
Negative It is a Direct short term impact; Severity is low; Low to moderate impact on aquatic life due to reduction or irregular water supply in the downstream during construction phase.

27
Impacted Environmental and Social Components
Type of Impact
+Ve / -Ve
Remarks
Construction Phase
S. No
Construction Phase
12. Generation of Debris / waste materials
Negative It is a Direct short term impact; Severity is low; with suitable mitigation measures
13. Canal embankment erosion
Negative It is a Direct impact; Severity is low; with suitable mitigation measures
14. Impact on Human health, especially workers working at construction sites. (L b C )
Negative It is a Direct short term impact; Severity is low; with suitable mitigation measures
15. Impact on fisheries and fishermen livelihood
Negative Impact can be minimize/neutralize with suitable mitigation measures.
Analysis of alternatives indicate that project implementation will have higher beneficial impacts. Further mitigation measures have been proposed for each negative impact. A budget 1% of the total project cost have been proposed to carry out implementation of SEMF. ESMF The ESMF is the instrument that provides the necessary guidance to identify salient environmental and social issues early on, prepare, as needed, remedies and plans to address these issues, and monitor implementation. Keeping in view the specific requirements of ESMF, five forms have been developed. These forms will serve as reference material for use by the field officials/engineers to enable them to develop and impact sub-project specific ESMF. The forms are briefly described below. The 25 sub-project level activities identified for the development of the ESMF have been given in Form SC-1 for the purpose of identifying the activities relevant to a specific sub-project and screening out the other activities. The responsible entity at the dam level will carry out this task. To identify the potential environmental / social impacts of an activity, the tasks and facilities required to be performed and provided for the activity are needed to be identified. These have been termed as components of an activity. A list of all possible components have been prepared and given in Form SC-2. For each activity, the components involved can be identified by dam level officials. Form SC-3 provides the identified sub-project activities in the first column, the components involved in the second column and potential impacts in the third column. Last two columns refer to implementation phase (I) and post-implementation phase (P). Based on potential environmental and social impacts associated with each component, these have been categorized as A, B and C and are given in Form SC-4. Application of Environmental and Social Management Framework (SEMF) Social and Environmental Management Framework (SEMF) is a tool for use by a project proponent to identify and address the potential environmental and social concerns or impacts of a project right from the planning stage to its implementation and post-implementation operations. The objective of developing SEMF is to mainstream it with other project documents in the planning, execution and post-execution stages in order to ensure that environmental and social concerns are adequately taken care of in all these stages.
Keeping this in view, the present SEMF has been developed for use by the UPID/PACT Government of Uttar Pradesh, during rehabilitation and strengthening of dams and canal system under the Social and Environmental
28
Assessment (SEA)-Bundelkhand with the assistance from the World Bank. The SEMF can be used by the project authorities for incorporation of environmental and social safeguards in the planning, execution and operation stages of each sub-project activity. A step-by-step methodology has been provided that can be followed along with engineering and institutional interventions required for the project activities.
A template will be used that will require the concerned State/Circle level PMUs during the investigation and preliminary design stage to provide detailed information on technical, environmental, social, and all implementation-related aspects of each activity. Details about the data to be collected and the specific forms to be prepared are given in the next sections. The State/Circle level PMU will for each sub-project incorporate in the template the essential elements from the environmental and social screening templates prepared as part of the SEMF. Based on the review of the templates, a final categorization of each of the sub-project activity will be made. Those that have no major environmental or social issues can have the designs finalized and be tendered. Only the few where there may be major environmental or social issues will require the preparation of a site specific EA/EMP. This template will allow an early identification of those activities where major issues can be expected.
It may be mentioned here that though the sub-project activities for the development of this SEMF have been identified based on the analysis of such activities in three dams proposed to be taken up for rehabilitation under the SEA, this is a live document which can be improved upon at the sub-project level by the concerned authorities, as and when the need arises. SEMF will be implemented at planning, implementation & post implementation stage is shown below.
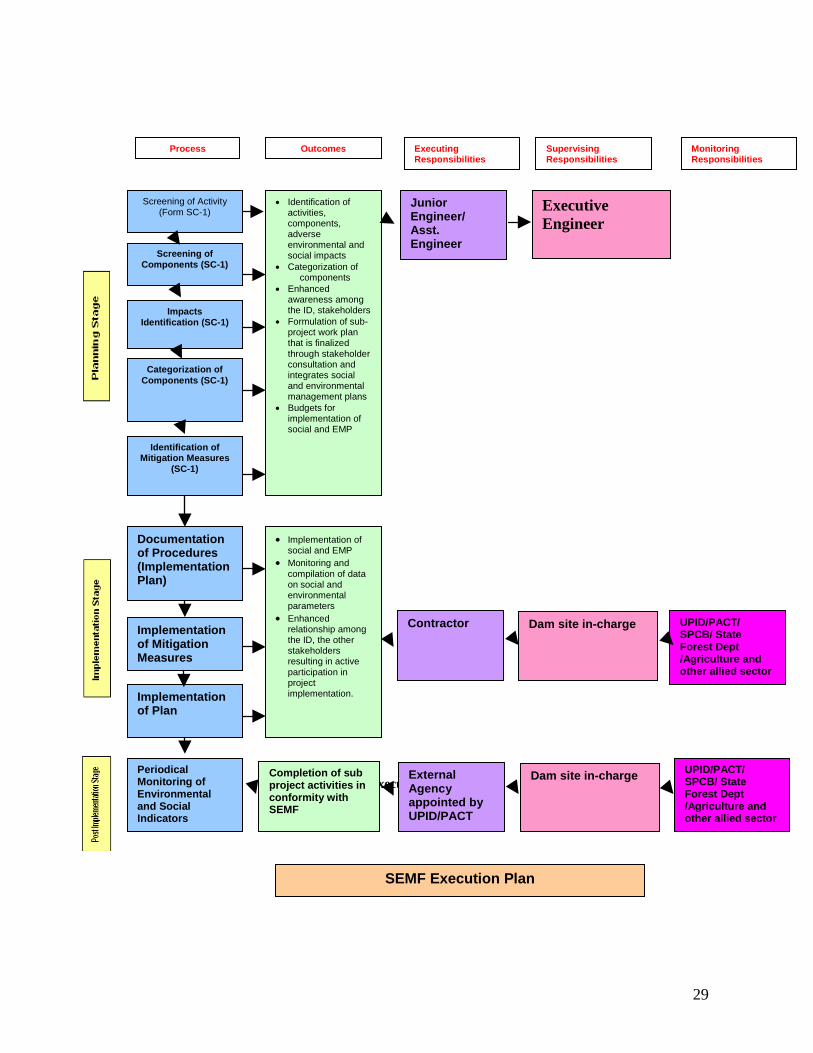
29
SEMF Execution Mechanism
Screening of Activity (Form SC-1)
Process Outcomes Executing Responsibilities
Supervising Responsibilities
Monitoring Responsibilities
Screening of Components (SC-1)
Impacts Identification (SC-1)
Categorization of Components (SC-1)
Identification of Mitigation Measures
(SC-1)
Documentation of Procedures (Implementation Plan)
Implementation of Mitigation Measures Implementation of Plan
Periodical Monitoring of Environmental and Social Indicators
Completion of sub project activities in conformity with SEMF
External Agency appointed by UPID/PACT
Dam site in-charge
UPID/PACT/ SPCB/ State Forest Dept /Agriculture and other allied sector
• Implementation of social and EMP
• Monitoring and compilation of data on social and environmental parameters
• Enhanced relationship among the ID, the other stakeholders resulting in active participation in project implementation.
• Identification of activities, components, adverse environmental and social impacts
• Categorization of components
• Enhanced awareness among the ID, stakeholders
• Formulation of sub-project work plan that is finalized through stakeholder consultation and integrates social and environmental management plans
• Budgets for implementation of social and EMP
Contractor
Junior Engineer/ Asst. Engineer
Dam site in-charge
Executive Engineer
UPID/PACT/ SPCB/ State Forest Dept /Agriculture and other allied sector
SEMF Execution Plan

30
A public consultation strategy has been prepared & implemented covering majority of stakeholders. Monitoring and Evaluation Framework Monitoring and evaluation is primarily required to ensure proper and timely implementation of environmental and social mitigation measures identified in the planning stage, based on the ESMF. Monitoring at regular intervals during implementation and for a specified period in the post implementation stages is necessary to identify and implement any change / improvement needed in the execution of the activity or in the mitigation measures. A monitoring and evaluation cell may be created at State level under the supervision of an official familiar with environmental and social issues of the sub-projects. He may be given suitable training if needed. In specific situations, one may consider appointing external agencies to carry out the monitoring and evaluation activities and report to the supervising official. The indicators to be monitored can be framed from the ESMF taking into consideration the activities involved. The feedback received from monitoring and evaluation cell will be discussed with the implementing officials and the contractor and corrective actions will be taken, where necessary. Training & Capacity Building Training and Capacity Building Strategy will form an integral part of the sub-project Plan and its implementation will be synchronized with other project interventions at different level. The responsibility of approving Training and Capacity Building Strategy as part of sub-project Plan will be with the PACT. The PACT will ensure that Training and Capacity Building Strategy conform to the agreed strategy of the project. The key to institutional reforms would be well-trained and motivated human resources. Competence levels of the departmental officials and their ability must be assessed and training in new skills provided. Cultural sensitivity, group dynamics, conflict resolution, leadership and ability to work with user population are as important as the engineering skills which are already in place. This will require the co-option into UPID of social, gender and environmental subject matter specialists. This would also be an appropriate opportunity for assessing the capabilities of state training institutions, and enhance them if necessary. Enhanced training would also be required for WUAs / UPID. The need for training equipment, computers, and software, training aids must be assessed, and procurement procedures should be initiated.
31
Chapter 1: Introduction 1.0 Introduction & Background
India, which has a geographical area of about 329 million hectares (MHa), is endowed with rivers and abundant natural resources. It is crisscrossed by a large number of small and big rivers, some of them figuring amongst the mighty rivers of the world. According to 2001 census, a major part of India’s population of 1.03 billion is rural where agriculture supported by river system is the major livelihood and a source of their prosperity. As per Ministry of Water Resources (MoWR), Government of India (GoI), there are twelve major river basins having a cumulative catchment area of 25,28,084 km2 and 48 medium river basin with a cumulative catchment area of 2,48,505 km2 in the country. As per MoWR, GoI, the average annual availability of water in these river basins is estimated at 1869.35 km3 per year. The ground water resources of the country have been estimated based on the guidelines and recommendations of the Ground Water Estimation Committee-97 (GEC-97).The total annual replenishable ground water resources of the country have been estimated as 433 billion cubic meter (BCM). Keeping 34 BCM for natural discharge, the net annual ground water availability for the entire country is estimated to be 399 BCM. The present annual ground water draft is around 231 BCM out of which 213 BCM is for irrigation use and 18 BCM is for domestic & industrial use. The stage of ground water development in the country is around 58%. The development of large irrigation works after independence has led to food self sufficiency on one hand while creating environmental problems on the other hand. The state of Uttar Pradesh is also facing some of these problems especially in Ganga Basin. Therefore, a need for sustainable and environmentally ground water resource development and management has been felt in the basin. 1.1 Water Resource Development in Uttar Pradesh The state of Uttar Pradesh (UP) is enriched with fertile land, abundant water resources, biodiversity, as well as human resources and historical & cultural heritage. Large networks of many perennial rivers, mostly flowing from the Himalayas, contributes to its vast water resources potential and provide drainage to the state. These rivers are shown in Figure 1.1. Major rivers include Ganga, Yamuna, Ghaghra, Gomti, Gandak, Sone and Sarda. In addition, it has a number of smaller rivers. A deep alluvial aquifer underlies the vast plains, recharged annually by almost 1000 mm monsoon rainfall. The average annual water balance of Uttar Pradesh as per Irrigation Department (ID), Government of Uttar Pradesh (GoUP) is shown in Figure 1.2. Salient features of the state are given in Box 1. Main streams of major rivers in the state provide water for canal irrigation. Therefore, over the past century, one of the world’s largest canal systems has been constructed in the state, which supports predominantly rice-wheat cropping system. The total length of the canal system in the state is about 71780 km, which consists of 4261 km of major canals and 7107 km of branch canals. The major canal system in the state includes Upper Ganga Canal, Eastern Yamuna Canal, Agra Canal, Lower Ganga Canal, Sarda Canal and Sarda Sahayak Canal System, Gandak Canal, Ken Canal and Betwa Canal systems. In Irrigation sector, about 43.8 BCM of surface water has been utilized out of a total of about 161.70 BCM of surface water in the state. Not all the available water is utilizable due to lack of storage sites, which are located in Nepal. As per MoWR data, the total irrigation potential created at the end of ninth plan in the state is about 29.5 MHa (31% of the total
Box 1.1 Uttar Pradesh at a Glance The state of Uttar Pradesh (UP), having a geographical area of 24 MHa and a population of 166 million inhabitants accounting for 9% of India’s total land area, and 17% of its population, is endowed with rich natural resource potential, lies in the fertile Indo-Gangetic plain with high natural soil fertility, abundant rainfall, and surface and groundwater resources. Five major rivers the Ganga, Yamuna, Ramganga, Gomti and Ghagra flow through the state. All the rivers are part of Ganga Basin and ultimately drain into the Bay of Bengal. Physio-graphically, the state is broadly divided into two regions, the southern hills, plateau, and the vast alluvial Gangetic Plains. The state has four major regions viz. Southern UP (Bundelkhand), Western UP, Central UP, Eastern UP. Administratively there are 71 districts in the state. The economy of UP is predominantly dependent on agriculture, which accounts for 40% of state’s GDP, and 75% of employment. The total arable land in the state is about 19.3 MHa out of which 92% is used for agriculture. Approximately 70% of total agricultural land in UP is dependent on irrigation using surface water sources with an average gross cropping intensity of about 100%.

32
national potential), out of which 80% has been utilized. Most of irrigation headworks are run-of-river systems, supplemented by some small reservoirs at some places particularly in the Shivalik foothills of the Himalayas and in Bundelkhand region. Initially, most systems were initiated as a protective measure against droughts. However, with introduction of high-yielding varieties of crops in recent years, irrigation demand has significantly increased. So most systems have been under major rehabilitation in recent years in order to augment their discharge capacities. MoWR, GoI data indicates that the annual replenishable ground water resource in the state is about 76.35 BCM per year with net annual ground water availability of about 70.18 BCM per year, out of which 48.78 BCM per year is the total draft with an availability of 19.52 BCM per year of water for future irrigation. The stage of ground water development in the state has been estimated to be 70%. The recent statistics on human development shows that the socio-economic and human development in UP has fallen behind India's better performing states. Growing population coupled with poor human development indices started exerting pressure on the resources base and the environment in the state. Agriculture sector performance, has been declining while the rate of poverty is increasing (with an estimated 35% living below the poverty line) every year. The existing huge gap between the present farm productivity and its potential is increasing gradually. Sustainability of agriculture is threatened by water-logging and consequent soil salinity-sodicity in canal command areas, whereas groundwater depletion is also occurring in some other areas, resulting in reduced productivity. Further, during monsoon period, the rivers cause flooding of large areas, particularly in Eastern UP, resulting into considerable loss of crops, life and property. Overall scenario indicates that due to changes in cropping pattern, competition from increasing demands for agriculture, domestic usage, power, industrial, environmental and other uses, allocation of water to different stakeholders in appropriate quantity and quality has become increasingly difficult while considerable losses occur due to natural disasters like flooding. Bundelkhand region on the other hand experienced severe cyclic drought during 2004-08. In the above context, Uttar Pradesh Water Sector Restructuring Project was initiated to address the issues related to water and related sector in the state.
Source: ID, GoUP
Figure 1.1: Major rivers & drainage basins of Uttar Pradesh

33
Source: ID, GoUP
Figure 1.2: Average Annual Water Balance of Uttar Pradesh UPWSRP - Phase-I Phase – I of the UPWSRP was initiated in 2001 with financial loan assistance of US$ 150 million from World Bank (WB) and with the developmental objectives of: (i) setting up enabling institutional and policy frame work for water sector reform in the state for integrated water resources management (IWRM); and (ii) to initiate irrigation, agriculture and drainage sub-sector reforms in the state to increase and sustain water and agricultural productivity. With the aim to adopt a river basin development and management approach to address all issues related to water in an integrated and socially and environmentally sustainable framework, and to ensure the concept of basin development and management to be deeply rooted, a 5 year long Phase-I was initiated in May 2001, which focused on Ghaghra-Gomti basin for initial implementation of both water sector and drainage sector reform programmes. Under this phase, GoUP has created the institutional set up consisting of (i) State Water Board (SWB) under the Chairmanship of Chief Secretary, GoUP and Principal secretaries of all concerned departments and finance department as members; (ii) State Water Resources Agency (SWaRA) to provide a State level capability for inter-sectoral water allocation, planning, management and optimal use of surface and ground water based on comprehensive and environmentally sustainable river basin plans. SWaRA is also working as a secretariat to the SWB. SWB and SWaRA are required to facilitate and guide the implementation of IWRM in the State; (iii) State Water Resources Data Analysis Centre (SWaRDAC) to assist SWaRA in collection, compilation, scrutiny and analysis of all water, land and other natural resource data; (iv) enacted an Act on Uttar Pradesh Water Management and Regulatory Commission Act, 2008 and established UP Water Management and Regulatory Commission (UP-WaMReC); (v) Project Activity Core Team (PACT) to implement the project, and (vi) Ghaghra-Gomti Basin Development and Management Entity (to be created). Ghaghra Gomti Basin Social and Environmental Assessment (GG-BSEA) study comprising of 31 districts (Allahabad, Ambedkar Nagar, Azamgarh, Bahraich, Ballia, Balrampur, Barabanki, Basti, Deoria, Faizabad, Ghazipur, Gonda, Gorakhpur, Hardoi, Jaunpur, Kheri, Kushinagar, Lucknow, Maharajganj, Mau, Pilibhit, Pratapgarh, Rai Bareli, Sant Kabir Nagar, Shahjahahanpur, Shrawasti, Siddharthnagar, Sitapur, Sultanpur, Unnao and Varanasi) of Uttar Pradesh, was carried out during Phase I of the project. This study was prepared based on the basin planning, where social and environmental baseline was established both in spatial and temporal context. Further, social and environmental and institutional issues were identified and mitigation options were proposed. Training and capacity building needs assessment was carried out and type of training program / modules along with target audience were developed. A basin level social, environmental and institutional and monitoring framework was prepared for implementation during phase
AVERAGE ANNUAL RAINFALL
34.37 Mham
AVERAGE RAINFALL
EVAPORATION 6.01 Mham
AVERAGE ANNUAL RAINOFF
12.89 Mham
AVERAGE ANNUAL
PERCOLATION 15.47 Mham
AVERAGE ANNUAL WATER BALANCE OF UTTAR PRADESH

34
II. Some of the gaps which have been observed in the earlier BSEA while implementing the current environmental & social framework study are given below.
• Study area did not include Bundelkhand and Lower Ganga Canal System, which has different environmental and social features.
• Institutional structure for mainstreaming environmental and social safeguards recommended in BSEA have not been implemented.
• Training and capacity building of UPID and other stakeholders recommended under BSEA have been partly implemented.
• Environmental and social safeguard indicator / parameter monitoring framework / system which were recommended in BSEA is yet to be implemented.
The above gaps are understandable considering non transfer of irrigation infrastructure and to WUA during Phase I. However, the social and environmental knowledge base and infrastructure (GIS) developed at both PACT and SWaRA while implementing BSEA during Phase I can be utilized for implementing social & environmental interventions during Phase II. UPWSRP - Phase-II UPWSRP was initiated with a long term perspective of 12-15 years to cover entire State and therefore, GoUP has decided to continue the efforts already initiated under Phase –I for funding from WB under Phase-II. Prior to 15th March 2012, it was decided in principle to include Bundelkhand region of the State to study and implement IWRM in order to reform the water and agriculture sector with emphasis to mitigate droughts and rehabilitate this region. This region has recently witnessed severest prolonged (four-year cycle) drought for the first time in the recorded history. Considering major interventions have been planned under Bundelkhand package, the phase – II has undergone major shift in study area. Subsequently, Lower Ganga Canal System (LGC) has been included in the Phase – II, while only a selected portion of Bundelkhand & Sharda Sahayak Canal System have been included in Phase – II. A brief profile of Bundelkhand region & Sharda Sahayak region included earlier in Phase II was submitted as Annexure 1.1 of Interim Report.
1.2 Study Area & Project Activities Study area includes Lalitpur district of Bundelkhand region, three districts, Shahuji Maharaj Nagar, Barabanki & Rae Bareli district under Sharda Sahayak Command Area and twelve districts, Kashiram Nagar, Etah, Firozabad, Manipuri, Farrukhabad, Etawah, Kannauj, Auraiya, Ramabai Nagar, Kanpur Nagar, Fatehpur & Kaushambi under Lower Ganga Canal system. Basinwise area covered in the project is given in Table 1.1 and shown in Figure 1.3.
Table 1.1: Basin wise study area Sl. No. Basin/Project Name GCA (Lakh ha)
1.0 Bundelkhand Region
1.1 Portion of Betwa canal command consisting of Jamini Dam, Sajnam Dam and Rohini Dam 1.18
Sub Total 1.18 2.0 Sharda Sahayak Command 2.1 Haidergarh branch of Sarda Sahayak 0.98 3.0 Lower Ganga Canal (LGC) 3.1 LGC Canal Command Area 27
Sub Total 27.98 Grand Total (1.0+2.0+3.0) 29.16
Source: Terms of Reference pp. 22

35
Figure 1.3: Districts in Study Area
Major activities, which will be carried out under Phase II of the project area given below. Activity-1: Participatory Irrigation Management Activities: The participatory irrigation management (PIM) activities will be implemented in the study area. The list of PIM activities, which will be performed during the project period are: Awareness Generation; Conducting workshop with line departments; Hiring of Services of NGOs; Formation of Water User’s Associations; Conduction of election training at PACT / WALMI; Capacity Building of UPID; Capacity building of WUAs (including training of NGOs personnel); Strengthening of divisional PIM Cell; Preparation of maps, forms, registers etc. for WUAs; Providing Experts in PIM Cell, PACT and PIM Cell at Regional Chief Level; Logistics for divisional PIM Cell (like computers, almirah, tables, chairs, printers and fax); Hiring of retired Revenue official per division; One time functional grant to WUAs towards their sustainability. Activity-2: Rehabilitation of Canal & Drainage Systems: Rehabilitation and modernization of branch canal systems (sub-basins) of the Jamini, Sajnam & Rohini of Betwa Canal System; Haidergarh branch of Sarda Sahayak System & Lower Ganga Canal systems along with their head works, is proposed under phase-II. Some of the activities may include: A detailed study of the feeder head for mitigation of silt problem after due analysis and model studies; The detailed rehabilitation and modernization design/redesign plan considering the water availability in these Canal systems; Repairs of existing structures of the canal and Lining of main and branch canal. The rehabilitation and modernization works in the Irrigation and Drainage sub-sector reforms with a view
36
to enhance the system operational and management efficiency, are proposed in the study area. Activity-3: Piloting Alternative Branch-Level Management Mechanism for Water Service Provision & Maintenance: It has been realized at every level that objectives of food, nutritional and environmental security cannot be achieved by the efforts of Public Sector alone. Therefore, joint efforts of Public and Private Sector in the field of irrigation are required. The major areas considered for promoting Public-Private-Partnership (PPP) in Irrigation sector include: Identification of distributary level WUA’s and its adoption of interventions. These interventions may include: − Managing water conjunctively in a participatory mode through technology support. − Marketable horticultural produce and better live stock production through marketing
support like sale of inputs, such as Seeds, Fertilizers, Pesticides, Implements, Equipments, etc. and Processing and Marketing of Farm products.
− Establishing with effective market linkages to address the agricultural input
requirements as well as sale of produce through infrastructure support. Activity-4: Agriculture Water Use and Productivity Efficiency Improvement Program: For improvement of farmers practices that are not new (water management, nutrient management etc) the phase II of the project will undertake a capacity building program though training, using tools such as participatory technology development, learning by doing and farmers forums. Introduction of new technologies, including crops, the project will use demonstrations as the primary introduction vehicle. This would have a primary focus on water efficiency (that increase productivity) technologies, such as system of rice intensification (SRI), alternative wetting and drying, conservation agriculture, direct seeding, less water using crops, etc. The project would then have a series of cross cutting interventions that link the capacity building/training and the demonstrations and these would include field days, exposure visits, workshops etc. Preparation of outlet specific crop plans based upon availability of water shall be achieved by Farmers Field School; Awareness camps; Organization of need based demonstrations; Promotion of green manuring; Organization of field days; Training of Farmers and facilitators; Exposure visits of farmers and facilitators and Organization of workshops. Farmers Field School: The Farmers Field School (FFS) shall be developed
basically as training and capacity building forum for the members of the water users associations. The training will use concepts of participatory technology development and hands on learning by doing coupled with brief field level trainings. The objective of the FFS is to integrate practical lessons on water management and productivity in such a manner that it assists the members of the WUA to implement water distribution and sharing arrangements that maximize the productivity of all its members and ensures equitable resource (water) distribution. It is anticipated that the FFS would run for a full year covering the

37
full farming system, however the exact contents of the training ‘package’ would be decided through a curriculum development phase, and would use experiences from other successful interventions in UP (i.e. farmers field schools under UPDASP) and within India (i.e. farmer water schools under Andhra Pradesh Farmer Managed Groundwater Systems Project). The training is likely to include the following topics, some of which may be optional:
Crop water budgeting and warabandi Biofertilizer applications and seed treatment
Hydrological unit (outlet/minor) concept and calculation of area
Agro-Ecosystem Analysis
Water holding capacity of soils (and impact of increased soil organic matter)
Natural and artificial recharge
Efficient irrigation techniques, e.g. SRI, ridge and furrow, sprinklers, alternate furrow and subsurface sub-line, as well as water-saving agricultural practices such as mulching
Role of institutions (WUA) in water management
Recharge, discharge, rainfall and draft concept and calculation
Role of women in water management
Water measurements in canals and borewells
The FFS would also develop the concept of a WUA water management resources person, who would be selected with the intention that he would extend the message to other members of the WUA.
Awareness Camps: Department of Agriculture and Horticulture proposes to
organize one day Awareness Camp at minor level twice a year, to create awareness among farmers about agriculture water use and productivity improvement programme and departmental ongoing scheme etc.
Training: To update the skill/knowledge of farmers of the project area, training on different aspects (land, water and crop management, Bio-dynamic/organic Farming, Seed Multiplication, Post harvest management, IPM, INM on pulses, oil seed, vegetables, fruits, spices, flower medicinal & aromatic and cereal crops) will be organized in situ and at SAUs/KVKs/IIPR Kanpur and SIMA Rahman Khera, Lucknow etc.
Demonstrations: Focus will be given mainly on following aspects, with priority for water efficiency related interventions –
Direct water efficiency demonstrations Use of short duration variety, line sowing SRI Soil treatment with Trichoderma Conservation agriculture Quality seeds and Seed Replacement Ridge and furrow systems Integrated Nutrient Management Timely irrigation through the conjunctive use of water
Timely Sowings
Alternative wetting and drying Timely Transplanting Micro irrigation Proper Plant spacing
38
Zero tillage seed drills Proper Placement of Seed & Fertilizer Indirect (productivity related) demonstrations
Eco- Friendly Pest Management
Use of area specific varieties Soil Testing Use of hybrids Line transplanting Field Days: To disseminate the technology adopted in demonstrations to other
farmers of the village and to solve the problems of the farmers on the spot a field day will be organize during reproductive phase of the crop preferably at grain filling or fruit setting stage in Kharif, Rabi and Zaid.
Exposure Visits: Best practicing farmers will be exposed to improve technical know-how through exposure visit out side the state.
Workshops: To promote the cultivation of pulses & oil seed and other cereals (Rice & Wheat) it is proposed to organize Workshops every year.
Activity-5: Social Assessment/ Development: Phase II will include involvement of farmers while ensuring the social safeguards during the rehabilitation of canals and minors in order to reduce the negative social impacts through activities such as given below.
• Social Assessment and Safeguards for Rehabilitation and Development of Drains/Canals/Wetlands
• Participation of Women in PIM • Promotion of Women SHGs for raising the income of family
1.3 Need for the Social & Environmental Framework Under Phase-I, SWaRA had developed a basin Master Plan for Ghagra–Gomti Basins (GGB), a Decision Support System (DSS) for Jaunpur Branch Canal System, and an environmental and social basin assessment (BESA) and social and environmental management plan (SEMP) for Ghagra – Gomti Sub basin. It is in this context, Project Activity Core Team (PACT) on behalf of UPWSRP, Government of Uttar Pradesh (GoUP) is carrying out a Social and Environment Assessment (SEA) of the study area in addition to updating the existing SEA and SEMP for the additional areas now being covered under Phase II project. The SEA will lead to development of social and environmental management framework (SEMF) in order to mainstream social and environmental safeguards in the overall basin development. The SEA & SEMF is being carried out as per objectives, scope of work (SoW), approach & methodology to give the required deliverable as described below. 1.4 Objectives
• to identify environmental, social and socio-economic issues • to identify potential impacts (both positive and negative) of the proposed investments under Phase
II • to provide relevant mitigation measures to contain/minimize/reverse the potential negative
impacts of the project investments as well as replicate/upscale/intensify the potential positive impacts
• to prepare a Social and Environmental Management Framework (SEMF) that will guide implementers at various levels to mainstream environmental and social issues
• develop appropriate recommendations for sustainable utilization of water resources by integrating environmental and social concerns in water sector planning and management
1.5 Scope of Work (SoW)

39
The major items of SoW as per ToR are given below.
• Identifying key environmental and social issues in the geographical areas covered by the project
and assessing the potential impacts arising from proposed project investments (this will include the entire Bundelkhand area within Uttar Pradesh and new proposed areas in Phase I districts of the ongoing project).
• Undertake a detailed review of legal, policy and regulatory environment as well as the institutional
framework in place for the management of water sector and irrigation service delivery with a view to recommend measures to improve management, reform institutional framework and amend legal/policy/regulatory provisions related to water and irrigation sector.
• Developing Environmental Management Plans (EMPs) for investments that are known and
prepare a social and Environmental Management Framework (SEMF) for new project investments.
• Prepare a detailed social and environmental mitigation plan for the identified issues and potential
adverse impacts. • Prepare a Monitoring and Evaluation (M&E) strategy and plan including a list of key
environmental and social indicators for monitoring at various levels. • Prepare a training and capacity building plan on social and environmental issues, given the
intended stakeholders and institutions. • Develop a communications and consultation strategy to guide project investments during the
implementation phase. 1.6 Approach & Methodology A comprehensive approach and methodology has been adopted to carry out Social and Environmental Assessment (SEA) Framework for entire Bundelkhand Area of Uttar Pradesh. A programmatic stepwise approach, which has been used to develop the SEMF is: Step 1: Gap analysis has been carried out based on data available from earlier GGB BSEA study and requirements of the current assignment. This will also include identification of different stakeholders and their existing roles and responsibilities. Step 2: A comprehensive regulatory review has been carried out by summarizing the applicable policies and regulations. All the ongoing plans, programs and projects have been identified and compiled in tabular formats to give an idea of the level of ongoing interventions. Step 3: Secondary and primary data collection and analysis. All the relevent data from secondary sources is being presented using database and graphically shown using GIS technique. Identification of hotspots with different attributes have been further confirmed through ground truthing. This will lead to identification of issues, causes and broad level impacts. Step 4: Extent and level of impacts has been assessed by using trend analysis, outputs from the DSS carried out earlier by SWaRA. Step 5: Based on the impact analysis, SEMF of adaptive and mitigative activities is being formulated and the level of planned investments obtained from the analysis carried out in step 2.

40
Step 6: A monitoring and evaluation (M&E) strategy and plan including a list of key environmental and social indicators for monitoring at various levels has been prepared. Monitoring indicators have been identified in order to monitor impacts identified in step 4 and outputs of activities identified in step 5. These indicators will serve as input to ‘performance and monitoring” software already developed earlier under GGB BSEA. Step 7: Development of SEMF and SEMP. Institutional assessment has been carried out and outputs of steps 4, 5 and 6 have been mapped with respective institutions so that ‘roles’ and “responsibilities” for implementation will be assigned. Step 8: Training needs assessment has been carried out by using the outputs from Steps 1 to 7 and existing training modules have been strengthened. This will lead to development of a training and capacity building plan on social and environmental issues. Step 9: Consultation and communication needs assessment has been carried out through different stakeholder’s consultation identified in step 1 and assessed through step 3 and step 7. This has lead to development of consultation and communication plan. Step 10: Presentation of outputs through stakeholders’ consultations by conducting two workshops, one after submitting draft final report and one after submitting final report. At first, the baseline status has been assessed by collection and analysis of:
• Secondary data - published and unpublished data – e.g.: official memos / directives / documents, minutes / notes, etc., census (2001, 2011-if available)
• Primary data - collected through field survey consisting of questionnaire survey, guide & focused group discussions.
• Academic and other research work published/ unpublished in the form of books, reports, and articles and,
• GIS and web based data, • Stakeholder consultation and field observations.
Secondary data has been collected from the various state and national level agencies such as Ministry of Environment and Forest, Central Water Commission, National River Conservation Directorate, National Environmental Engineering Research Institute, The Energy Research Institute, Central Pollution Control Board, State Pollution Control Board, Department of Environment (GoUP), Ground Water Board (State And Central), Irrigation Department, Agriculture Department, Project Activity Core Team, State Water Resource Agency, UP Planning Commission, Department of Rural Development, Department of Health And Family Welfare, Department of Revenue And Land Record, Uttar Pradesh Diversified Agriculture Support Project, UP Bhumi Sudhar Nigam and all other relevant agencies. This data is in the form of reports, quantitative figures in excel format, table, graphs, bar charts and text. Description of the Primary data collection tools being used (Stand alone/Combination) KAP & PRA, focus group meetings, semi-structured interviews, workshops and scientific environmental tests have been used to collect primary data. Description of KAP/ PRA/ Focus group meetings tools/ Methodologies & their Applications: For conducting KAP/PRA/ focus group meetings, the selection of sample size and target group for cultivator/householder interview component is very important. The overall sampling frame for this assessment has been used to generalize information on all villages within the project area. A statistical sample of these local communities has been used in this methodology to generalize the results back to the project as a whole. In this context, a primary survey was conducted in 2100 households in 21 blocks in seven districts of Bundelkhand during December 2011 and January & February 2012 based on approved questionnaire and sample size submitted with inception report.

41
Participatory Focus Group Meetings: Participatory focus group meetings provide a useful forum for a range of stakeholders to share their opinions and concerns regarding specific topics. A specialized, spatially organized focus group has been utilized for the focus groups proposed by IRGSSA for this assessment. These focus groups provide systematic information on key project problems and targets. A focus group discussion (FGD) guide was prepared and submitted to PACT in February 2012, which has been finalized and is being used for conducting FGD in April 2012. A copy of this guide was submitted as Annexure 1.3 of the interim report. Other related tools such as Trend analysis; Social mapping; Day time use analysis; information and Document Review; Quantitative Household and Community Interviews; Semi-Structured Interviews and Stakeholder Workshops had been employed as part of PRAs to capture information on specific topics of interest. 1.7 Work Plan A comprehensive work plan was submitted along with inception report. The major activities and outputs of this work plan are given below. Activity 1: Gap analysis and regulatory review. Output: Inception report giving the approach and methodology, modified work plan and regulatory review. Activity 2: Secondary and primary data collection and analysis. Output: Interim report Activity 3: Impact analysis. Output: Input as a chapter to draft final report Activity 4: Identification of mitigation measures. Based on the impact analysis, frame work of adaptive and mitigative activities has been formulated. Output: Input as a chapter to draft final report Activity 5: Development of a monitoring and evaluation (M&E) strategy and plan. This includes identification of key environmental and social indicators for monitoring at various levels. These indicators serve as input to ‘performance and monitoring” software already developed earlier under GGB BSEA. Output: Input as a chapter to draft final report Activity 6: Training needs assessment. Output: Input as a chapter to draft final report Activity 7: Consultation and communication needs assessment. Output: Input as a chapter to draft final report Activity 8: Development of SEMF and SEMP. Institutional assessment has been carried out and outputs of activities 1 to 7 are being mapped with respective institutions so that ‘roles’ and “responsibilities” for implementation are being assigned. The SEMF will include: a) Review of the project development cycle of sub-projects comprising planning, designing,
implementation and operational phases and identifies opportunities for the integration of social and environmental management measures at appropriate stages of development.
b) Identifying social and environmental issues associated with each sub-projects of UPID, based on the results of the tasks carried out above.
c) Identification of potential impacts such as land acquisition, R&R, issues of vulnerable communities, gender, impact on livelihoods etc. arising out of various sub-projects.
d) Formulation Social and Environmental Management Framework comprising the following: • Screening and Scoping Criteria • Categorization of sub-projects of UPID/other sectors,

42
• Outline of methodology to carry out SEA • Guidance on securing various clearances • Systems, Policies and Procedures • Monitoring and evaluation mechanism • Draft Terms of reference (TOR) for special studies (as and if required)
e) Institutional Mechanism for the implementation and monitoring of social and environmental
management. f) Training and Capacity Building requirements.
Output: Input as a chapter to draft final report Activity 9: Draft final Report. A draft final report will be prepared consisting of outputs from activities 1 to 8. Output: Draft final report Activity 10: Two workshops. The first workshop will present outputs of draft final report and the other will present the outputs of final report. Output: Final report 1.8 Structure of the Report The current draft final report has been prepared and is being submitted to PACT only for Bundelkhand region. It is organized into six chapters as described below. Chapter 1: Introduction: brief description why SEA was carried out; Social/Socio-economic & Environmental reports and actions: Brief description of social & environmental reports and contents and actions which have been initiated; Project objectives and outlines of UPWSRP: Short description of the project components. Chapter 2: Social/Socio-economic & Environmental policy, legal and guidelines: Brief review of policies and legislative acts both at the Central/State Government level and World Bank level. Chapter 3: Social/socio-economic Baseline & Framework: Short review of baseline data & social and environmental profile of the area with detailed framework. Chapter 4: Environmental Baseline & Framework: Short review of environmental baseline, environmental profile with detailed Framework. Chapter 5: Social/Socio-economic & Environmental Impact Assessment: Short description social and environmental assessment and predicted impacts. Social/Socio-economic & Environmental Capabilities/Trainings: Description of the social & environmental expertise in the different departments of the UP Bundelkhand area and their required trainings. Chapter 6: Social/Socio-economic & Environmental Management Plan: Provision of adequate safeguards in social & environmental management and measures to improve the mainstreaming of social & environmental issues in water resources management. Limitations While limited time availability for conducting all the stakeholder consultations and covering 2100 households in the stipulated time has been a real challenge, there have been no major limitations in conducting the work. Further change of study area post 15th March, 2012 have been a real challenge in addressing new situation issues & concerns. The new project PIP document has not been detailed out, and therefore, the major activities are still in the final stage of development. The analysis therefore had to be undertaken keeping certain assumptions in mind. Use of this report

43
The report has been prepared with the expressed understanding of that the consultant will provide support and assistance to the client in meeting the disclosure requirement of the project, which, at the minimum, shall meet the World Bank policy on public disclosure and requirements under the Right to Information Act of the Government.

44
Chapter 2: Regulatory Review and Gap Analysis 2.0 Introduction The effective mainstreaming of environmental and social concerns for sustainable water resource development means their integration within the legal, policy and institutional regimes at different levels of administration in the country and state. Therefore, a review of the existing policy, regulatory and institutional framework related to water resources, environment and natural resources, and social sector has been carried out, and findings are summarized in the following sections. 2.1 Policy and regulatory framework to deal with water management, social and environmental safeguards Both central and state government has given their attention on the degrading effects of water resources, irrigation and agricultural performance and consequential issues arising out of it. Policy and regulatory frameworks at national and state level have been formulated to ensure safeguards in the last two decades. This has been necessitated to provide appropriate technical knowhow, guidance and advice for relevant agencies to pave the way for effective water management and social and environmental safeguards. Major policy framework include sector related policies and policies related to environment and state level. Sector policies include Constitutional Provisions, National Water Policy, UP State Water Policy & UP Agriculture Policy. Environmental & Social Safeguard related policy include National Environment Policy, National Forest Policy, State’s Forest Policy & National Policy on Resettlement & Rehabilitation. A gist of these policies are given in Annexure 2.1. The key features of policy and regulatory framework developed in this respect are discussed in the following sub-sections. 2.1.2 Regulatory framework to deal with water, environment and social Safeguards The key environment and forests acts, rules and notification of Government of India are listed below:
- The Indian Forest Act (1927) - The Indian Wildlife (Protection) Act (1973) (amended 1993) - The Water (Prevention and Control of Pollution) Act (1974) (amended 1988) - The Water (Prevention and Control of Pollution) Cess Act (1977) (amended 1992) - The Forest (Conservation) Act (1980) (amended 1988) - The Air (Prevention and Control of Pollution) Act (1981) (amended 1987) - The Environment (Protection) Act (1986) (amended 1991) - The Public Liability Insurance Act (1991) (amended 1992) - The National Environment Tribunal Act (1995) - The National Environment Appellate Authority Act (1997) - The Wild Life (Protection) Amendment Act (2002) - The Biological Diversity Act (2002) - The Water (Prevention and Control of Pollution) Cess (Amendment) Act (2003) - The Hazardous Wastes (Management, Handling & Transboundary) Rules (2008) - The Municipal Solid Wastes (Management and Handling) Rules (2000) - The Hazardous Wastes (Management and Handling) Amendment Rules (2000) - The Recycled Plastics Manufacture and Usage (Amendment) Rules (2003) - Bio-Medical Waste (Management and Handling) (Amendment) Rules (2003 - Forest (Conservation) Rules (2003) - Draft Biological Diversity Rules (2003) - Environmental Impact Assessment Notification (1994) (amended 2006) - Constituting the Taj Trapezium Zone Pollution (Prevention and Control) Authority (1998) - Fly Ash Notification (1999)
The key environment and forests acts, rules and notification of Government of Uttar Pradesh are listed below:
- Northern India Canal & Drainage Act (1873) - UP Tendu Patta Niyamawali (1972)

45
- UP Wildlife (Protection) Act (1974) - The Panchayat Forest Act (1976) - The UP Resin and other Forest Produce (Regulation of Trade) Rules (1976) - The UP Tree Protection Act (1976) - Air (Pollution Prevention & Control) Rules (1983)
2.1.3 Legislative Framework to Deal with Social Safeguards The main acts related to social safeguards are listed below:
- National Commission for Women Act (1990) - Dowry Prohibition Act (1961) was amended in 1984 - The Medical Termination of Pregnancy Act (1971) - Commission of Sati (Prevention) Act (1987) - Equal Remuneration Act (1976) - The Employees' State Insurance Act (1948) - The National Rural Employment Guarantee Act (2005) [Act 42 of 2005] - The Protection of Women from Domestic Violence (2005) [Act 43 of 2005] - The Scheduled Castes and the Scheduled Tribes (Prevention of Atrocities Act (1989) [Act 33 of
1989] - The Protection of Civil Rights Act (1955) [Act 22 of 1955] - The Employment of Manual - Scavengers and Construction of Dry Latrines (Prohibition) Act
(1933) [Act 46 of 1993] EIA notification of 2006 forms the basis of environmental & social assessment of water resources project in U.P. 2.2 Applicable Policy, Rules & Regulation to project interventions / activities 2.2.1 EIA Notification This is the Indian Government’s Guidelines for environmental impact assessment governing all of the development interventions that takes place within the boundaries of India. EIA notification was first issued by Ministry of Environment and Forests (MoEF) in 1994 and later amended in 2002 and 2006. Under the latest EIA Notification, 14th September 2006, all projects listed in Schedule -1 of the Notification require prior environmental clearance. The objective of the notification is to formulate a transparent, decentralized and efficient regulatory mechanism to:
Incorporate necessary environmental safeguards at planning stage Involve stakeholders in the public consultation process Identify developmental projects based on impact potential instead of the investment criteria
As per new notification, item 1(C) on river valley projects having more than 10,000 ha of Culturable Command Area (CCA) fall in category A projects, while projects having less than 10,000 ha of CCA fall under category B projects. Category A projects require submission of EIA report as per issued ToR by national environmental appraisal committee and public consultation before getting environmental clearance from Central Government. Category B projects require clearance from State’s Environmental Appraisal Committee. Since the activities currently contemplated fall under the rehabilitation & modernization project without any change in CCA application of this notification may not be applicable. At state level the Department of Environment (DE) in UP have their own guidelines for carrying out environmental assessments and list the types of projects that require EIAs and provide instruction on how they should be carried out. The guidelines include “Irrigation Systems” in the list and provide an index of environmental considerations that should be addressed when carrying out an EIA. No EA procedure exists in the UPID’s operating and management rules. In guidelines for “studies and reporting” produced by the
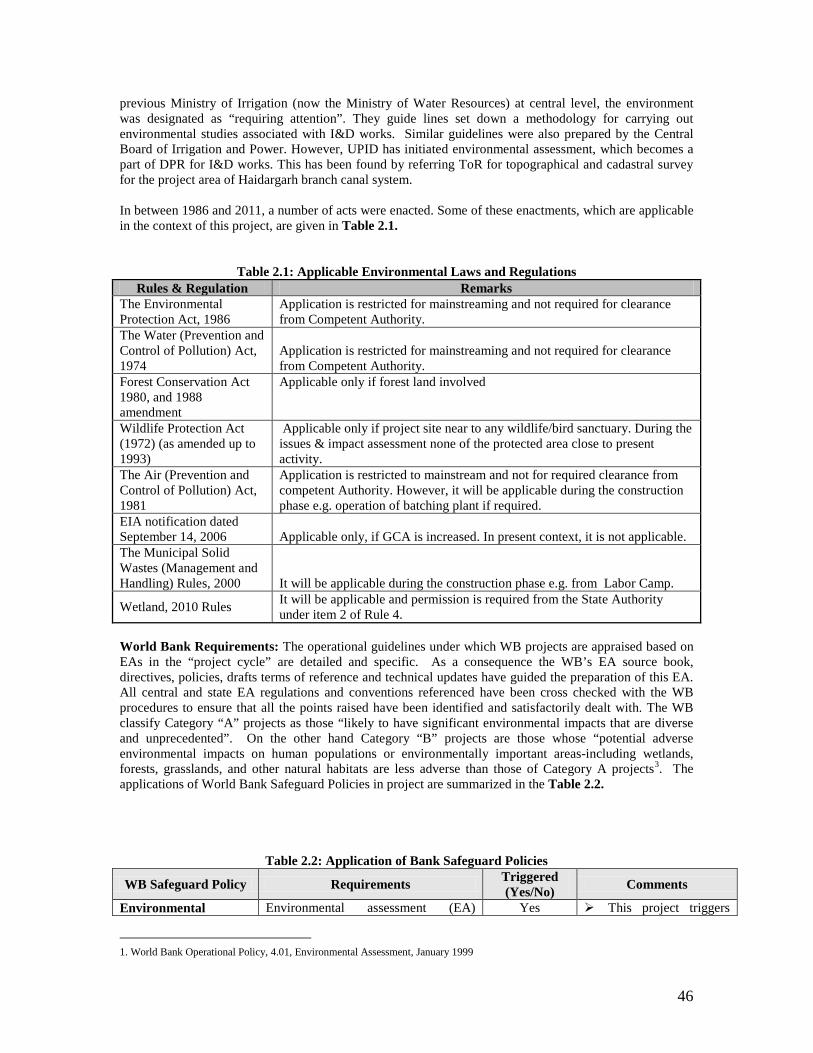
46
previous Ministry of Irrigation (now the Ministry of Water Resources) at central level, the environment was designated as “requiring attention”. They guide lines set down a methodology for carrying out environmental studies associated with I&D works. Similar guidelines were also prepared by the Central Board of Irrigation and Power. However, UPID has initiated environmental assessment, which becomes a part of DPR for I&D works. This has been found by referring ToR for topographical and cadastral survey for the project area of Haidargarh branch canal system. In between 1986 and 2011, a number of acts were enacted. Some of these enactments, which are applicable in the context of this project, are given in Table 2.1.
Table 2.1: Applicable Environmental Laws and Regulations Rules & Regulation Remarks
The Environmental Protection Act, 1986
Application is restricted for mainstreaming and not required for clearance from Competent Authority.
The Water (Prevention and Control of Pollution) Act, 1974
Application is restricted for mainstreaming and not required for clearance from Competent Authority.
Forest Conservation Act 1980, and 1988 amendment
Applicable only if forest land involved
Wildlife Protection Act (1972) (as amended up to 1993)
Applicable only if project site near to any wildlife/bird sanctuary. During the issues & impact assessment none of the protected area close to present activity.
The Air (Prevention and Control of Pollution) Act, 1981
Application is restricted to mainstream and not for required clearance from competent Authority. However, it will be applicable during the construction phase e.g. operation of batching plant if required.
EIA notification dated September 14, 2006 Applicable only, if GCA is increased. In present context, it is not applicable. The Municipal Solid Wastes (Management and Handling) Rules, 2000 It will be applicable during the construction phase e.g. from Labor Camp.
Wetland, 2010 Rules It will be applicable and permission is required from the State Authority under item 2 of Rule 4.
World Bank Requirements: The operational guidelines under which WB projects are appraised based on EAs in the “project cycle” are detailed and specific. As a consequence the WB’s EA source book, directives, policies, drafts terms of reference and technical updates have guided the preparation of this EA. All central and state EA regulations and conventions referenced have been cross checked with the WB procedures to ensure that all the points raised have been identified and satisfactorily dealt with. The WB classify Category “A” projects as those “likely to have significant environmental impacts that are diverse and unprecedented”. On the other hand Category “B” projects are those whose “potential adverse environmental impacts on human populations or environmentally important areas-including wetlands, forests, grasslands, and other natural habitats are less adverse than those of Category A projects3. The applications of World Bank Safeguard Policies in project are summarized in the Table 2.2.
Table 2.2: Application of Bank Safeguard Policies
WB Safeguard Policy Requirements Triggered (Yes/No) Comments
Environmental Environmental assessment (EA) Yes This project triggers
1. World Bank Operational Policy, 4.01, Environmental Assessment, January 1999

47
WB Safeguard Policy Requirements Triggered (Yes/No) Comments
Assessment (OP 4.01, BP 4.01, OP 4.02, BP 4.02)
projects proposed for Bank financing is required to help ensure that they are environmentally sound and sustainable. EA takes into account the natural environment (air, water and land); human health and safety; social aspects (involuntary resettlement, indigenous peoples, are physical cultural resources). Based on EA and degree, extent and severity8 of impacts the projects are classified as Category “A”, “B” and “C”.
this OP. As the physical works are of a rehabilitation nature, they are not anticipated to cause any significant adverse environmental or social impacts.
Natural habitats (OP 4.04, BP 4.04)
The Policy seeks to ensure that World Bank – Supported infrastructure and other development projects take into account the conservation of biodiversity, as well as the numerous environmental services and products which natural habitats provide to human society.
No Although there are no critical or biologically significant wetlands in this area, support for management of wetland and waterlogged areas should be enhanced in the project.
Forestry (OP 4.36, BP 4.36)
The Policy aims to reduce deforestation, enhance the environmental contribution of forested areas, promote afforestation, reduce poverty and encourage economic development.
No None of the project activities will trigger this OP as no forestry activities or activities on forest land are envisaged. Additionally, there are no forests in the irrigation areas selected for piloting reforms.
Pest Management (OP 4.09)
The procurement of any pesticide in a Bank – financed project is contingent on an assessment of the nature and degree of associated risks, taking into account the proposed use and the intended users. The need to prevent the development of resistance in pests.
Yes Although the project does not plan to finance any pesticides, there is a possibility of induced impact of greater pesticide use due to increased agricultural intensification and diversification. Hence, integrated pest management activities should be enhanced.
Cultural Property (OPN 11.03)
Cultural Property – This policy aims at assisting in the preservation of cultural property, historical, religious and unique natural value-this includes remains left by previous human inhabitants and unique environment features, as well as in the protection and enhancement of cultural properties encountered in Bank-financed project.
No No archaeological or other cultural sites of significance are impacted by proposed project
Indigenous Peoples (OP 4.10, BP 4.10)
This policy contributes to the Bank’s mission of poverty reduction and sustainable development by ensuring that the development process fully
No No impact (adverse or positive) expected by project on tribals – a detailed spatial census
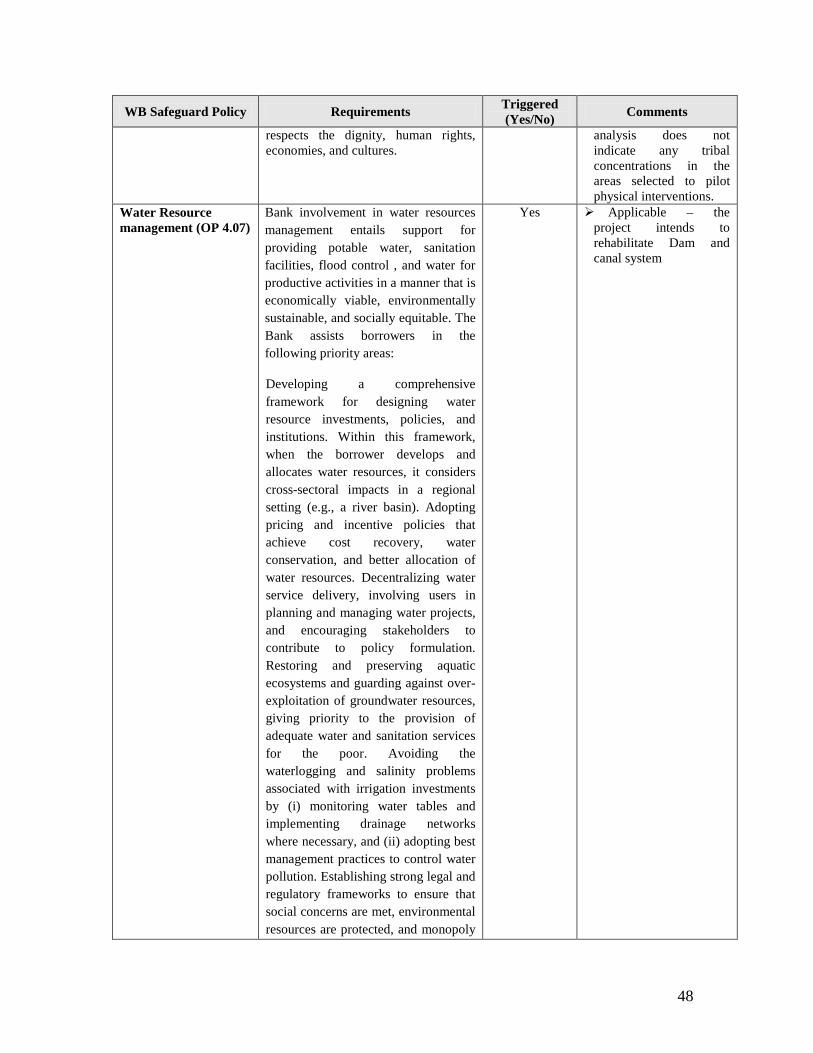
48
WB Safeguard Policy Requirements Triggered (Yes/No) Comments
respects the dignity, human rights, economies, and cultures.
analysis does not indicate any tribal concentrations in the areas selected to pilot physical interventions.
Water Resource management (OP 4.07)
Bank involvement in water resources management entails support for providing potable water, sanitation facilities, flood control , and water for productive activities in a manner that is economically viable, environmentally sustainable, and socially equitable. The Bank assists borrowers in the following priority areas:
Developing a comprehensive framework for designing water resource investments, policies, and institutions. Within this framework, when the borrower develops and allocates water resources, it considers cross-sectoral impacts in a regional setting (e.g., a river basin). Adopting pricing and incentive policies that achieve cost recovery, water conservation, and better allocation of water resources. Decentralizing water service delivery, involving users in planning and managing water projects, and encouraging stakeholders to contribute to policy formulation. Restoring and preserving aquatic ecosystems and guarding against over-exploitation of groundwater resources, giving priority to the provision of adequate water and sanitation services for the poor. Avoiding the waterlogging and salinity problems associated with irrigation investments by (i) monitoring water tables and implementing drainage networks where necessary, and (ii) adopting best management practices to control water pollution. Establishing strong legal and regulatory frameworks to ensure that social concerns are met, environmental resources are protected, and monopoly
Yes Applicable – the project intends to rehabilitate Dam and canal system

49
WB Safeguard Policy Requirements Triggered (Yes/No) Comments
pricing is prevented.
Involuntary Resettlement (OD 4.30)
The policy aims to avoid involuntary resettlement to the extent feasible, or to minimize and mitigate its adverse social and economic impacts.
No Although no resettlement and rehabilitation is anticipated under the project, an R&R policy for the sector has been developed and adopted by GOUP.
Safety of Dams (OP 4.37, BP 4.37)
The World Bank’s safeguard policy on safety of Dams is based on the principle that, for the life of a dam, the owner (in this case of Government of India) is responsible for ensuring that appropriate measures are taken and sufficient resources are provided for the safety of the dam, irrespective of its funding sources or construction status. Because there are serious consequences if a dam does not function properly or fails. The Bank is concerned about the safety of a new dam, it finances and existing dams on which a Bank financed project is directly dependent. Upgrading and/or rehabilitation of existing dams, as proposed under this project, falls within the policy, thus OP/BP 4.37 is triggered. Under OP/BP 4.37 requires that the dam upgrading be designed and its civil works be supervised by experienced and competent professionals. It also requires that implementing agency adopt and implement certain dam safety measures for the design, bid tendering, construction, operation and maintenance of the dam and associated works. The safe operation of dams has significant social, economic, and environmental relevance. World bank has concern to strengthen the institutional, legislative, and regulatory frameworks for dam safety programs.
Yes Applicable as per draft document. This component needs to be finalized.
Projects in Disputed Areas (OP 7.60, BP 7.60, GP 7.60)
Projects is Disputed Areas No The project is not in a disputed area and the OP is not triggered.
The EMP has been designed to not only ensure compliance with World Bank safeguard policies but also to adopt good practices to maximize the environmental benefits that are possible in this type of project. 2.3 Institutional Framework to deal with water, social and environmental safeguards

50
The legal and institutional framework to deal with water and environmental safeguard measures is described in Table 2.3. A number of agencies both at national and state levels are associated with water resources, environmental management and social safeguards. Table 2.3 also describes the key institutions at national, state, block and local levels, together with their specific roles.
Table 2.3: Agencies dealing with water, environment and social sector and their
responsibility
Stakeholders Policy Regulatory Data / Information
Implementation
Central Ministry of Water Resources Ministry of Rural Development and Poverty Alleviation
Ministry of Environment and Forests Ministry of Agriculture/ Indian Council for Agricultural Research
Central Pollution Control Board Ministry of Urban Development Ministry of Power Ministry of Industries Ministry of Health Ministry of Food Processing
UP State Minor Irrigation Urban Development-UP Jal Nigam Rural Development-UP Jal Nigam Department of Land Development & Water Resources
Forest Environment Industries Power Health Agriculture Horticulture Irrigation Department, UP Department of Agriculture, UP UP Bhumi Sudhar Nigam UP Council of Agricultural Research UP State Ground Water Department UP Jal Nigam Directorate of Environment, UP UP Remote Sensing Applications Centre Water and Land Management Institute, Lucknow
District District Planning Committee

51
Stakeholders Policy Regulatory Data / Information
Implementation
Block Block Development Officer
Local Gram Panchayat
2.4 Institutional Gaps The legal and institutional framework with respect to environment is shown in Figure 2.1. The UP Department of Environment (DoE), in Lucknow, is primarily responsible for protecting and preserving environmental quality in the state. The Uttar Pradesh State Pollution Control Board (UPSPCB) is responsible for enforcing the regulations, and has a wider role in environmental governance than any other government body in the state and reports both to the Central Pollution Control Board (CPCB) in Delhi and the DoE. In addition to monitoring and enforcing industrial environmental standards, the UPSPCB also monitors other environmental issues, such as municipal solid waste, and biomedical waste. Unlike MoEF, the DoE does not have forests under its purview, as these are handled by the state Department of Forests. The supervisory powers exercised by MoEF are not vested with the DoE as per the regulatory framework but instead lie with UPSPCB. DoE is dependant on the state government for resources, where as, UPSPCB raises most of its financial resources through consent fee and water cess.
Figure 2.1: Legal and institutional framework for environmental safeguards
The analysis of the above policy, legal and regulatory framework indicates that a number of acts, regulations and agencies are involved at national, state and district level to implement them. All the agencies are functioning as per their mandate while there appears to be lack of integrating mechanism for overall development of the water sector in the state. This is visible in terms of meeting individual goals by each of the agencies at the state level. For example, food sufficiency, irrigation and drinking water availability and control of pollution but lack of integrated planning in the sector over the years has manifested in terms of water logging, salinity, sodicity, siltation, reduced water delivery efficiency

52
resulting in stagnation of agriculture production, have been achieved to some extent deterioration of soil quality, higher resource consumption and higher non point source of pollution.

53
Chapter 3: Socio-Economic Baseline Status
3.0 Introduction Socio-economic status of Bundelkhand Region has been compiled based on the secondary data for the year 2000-01 to 2008-09. Analysis of demographic data is based on Census 1991, 2001 and 2011 (provisional figure). Similarly analysis of BPL families has also been taken from BPL Census 1998 & 2002. Livestock population is based on the year 1997 and 2003. This chapter has been divided into 5 sections describing Socio-economic baseline status of Bundelkhand based on secondary data, Socio-economic baseline status of blocks under command area of Jamini, Sajnam and Rohini Dam based on secondary data, Socio-economic baseline status of Bundelkhand based on primary survey (both household survey and focused group discussion), Socio-economic baseline status of Lalitpur district based on primary survey (both household survey and focused group discussion) and Socio-economic issues emerge from primary and secondary data. Major findings of the important parameters such as Population Density, literacy, Sex ratio, persons in labour force, families below poverty line, cropping intensity, irrigation intensity, canal irrigated area, source of drinking water, proportion of agriculture labour, etc. is given in the following section. The secondary data tables of UP Bundelkhand districts are given in Annexure 3.1, detailed primary data tables of UP Bundelkhand district in Annexure 3.2 and comparative data of UP Bundelkhand given in Annexure 3.3. Further identified socio-economic issues, recommendations and suggestions based on stakeholder consultation (household survey & FGD) have been summarized. 3.1 Socio-Economic Baseline Status of Bundelkhand Area of Uttar Pradesh Based on secondary Data 3.1.1 Demography Profile: 1991 and 2001 Total population in the 7 district increased in census 2001 by 22.34% against census 1991. Among the 7 districts, Jhansi had highest population as per census 2001 (17,44,931) followed by Banda (15,37,334), Jalaun (14,54,452), Hamirpur (10,43,724), Lalitpur (9,77,734), Chitrakoot (7,66,225) and Mahoba (7,08,447). According to provisional figure of Census 2011, total population in the 7 district increased in census 2011 by an average of 17.72% against census 2001. Similar trends of population were observed in all districts of UP Bundelkhand. Among the 7 districts, Jhansi had highest population (20,00,755) followed by Banda (17,99,541), Jalaun (16,70,718), Lalitpur (12,18,002), Hamirpur (11,04,021), Chitrakoot (9,90,626) and Mahoba (8,76,055). The proportion of male population range between 53.12% and 54.09 % of the total population (census 2001) while females constituted between 45.91 % and 46.88 %. As per the provisional figure of census 2011, the proportion of male population range between 52.50% and 53.76% and female between 46.24% and 47.50%. The proportion of male population in all 7 districts was found higher than the state’s average (52.41%). Except in District Jalaun, the proportion of male population had declined in 2001 over census 1991. The decline was between 0.22 % and 0.83 % while in Jalaun it increased by 0.6 %. The proportion of scheduled castes population (S.C.) was highest in District Jhansi (28.07 %) fallowed by Jalaun (27.04 %), Chitrakoot (26.34 %), Mahoba (25.78 %), Lalitpur (24.93 %), Hamirpur (22.79 %) and Banda (20.83 %). In comparison to census 1991 the proportion of S.C. population in 2001 had declined in 6 districts by 0.97 % in Banda, by 0.98 % in Hamirpur by 0.30 % in Jalaun, by 0.73 % in Jhansi, by 0.19 % in Lalitpur and by 0.80 in Mahoba. In Chitrakoot, their proportion remained almost the same. The distribution of population in Rural and Urban areas of districts showed that the highest rural population was in district Chitrakoot (90.01 %) followed by Lalitpur (85.48 %), Banda (84.41 %), Hamirpur (83.35 %), Mahoba (78.14 %), Jalaun (76.59 %) and Jhansi (59.21 %). The Schedule Tribe (S.T.) Population was nominal, i.e. A total of 1498 persons in the 7 districts.

54
3.1.2 Decadal Growth in Population The decadal increase in population during 1981- 91 and 1991-2001 shows a significant decline, particularly in district Hamirpur from 22.8 % to 18.0 %, Jalaun from 23.6 % to 19.3% and Jhansi from 25.7% to 22.0 %. In Banda, the decline in growth was from 22.8 % to 21.4 %, in Mahoba from 22.52 % to 21.7 % and Lalitpur from 30.2 % to 30.0 %. The data for Chitrakoot for the period 1981-91was not available while the increase in population during 1991-2001 was 28.6 %. The increase in population in Lalitpur and Chitrakoot was significantly higher (1991-2001) than the growth rate of U.P. (25.9 %). According to provisional figure of census 2011, population growth between 2001 and 2011 were observed significantly lower (range from 11.09% to 15.52%) in four districts as against the state’s average (20.09%) while in two districts namely Lalitpur (24.57%) and Chitrakoot (23.53%), the growth was recorded higher than the state’s average. Population growth in district Banda was observed 19.84% which is slightly lower than the state’s average. 3.1.3 Population Density Density of population in districts of Bundelkhand had been very low due mainly to topographic conditions. Against 473 persons per sq. km. at State level in 1991 the density was 149 persons in Lalitpur followed by 170 in Chitrakoot, 192 in Mahoba, 215 in Hamirpur, 267 in Jalaun, 285 in Jhansi and 304 in Banda. The number of persons per sq. km. increased in 2001 but still remained far behind the State’s (690 persons per Sq. km.). In Lalitpur it was 194 persons, 242 in Chitrakoot, 244 in Hamirpur, 246 in Mahoba, 319 in Jalaun, 345 in Banda and 347 per sq. km in Jhansi. As per the provisional figure of census 2011, density of population in all 7 districts of Bundelkhand still remained far behind (range between 242 per sq. km and 408 per sq. km) the state’s average of 828 per sq. km. In 2011, the highest population density was found in Banda i.e. 408 persons per sq. km. followed by 398 in Jhansi, 366 in Jalaun, 308 in Chitrakoot, 279 in Mahoba, 275 in Hamirpur and 242 in Lalitpur. The density of population has increased in all the districts as compared to census 2001. Highest increment in population density (between census 2001 and 2011) was observed in district Chitrakoot followed by Banda, Jhansi, Lalitpur, Jalaun, Mahoba and Hamirpur. 3.1.4 Sex Ratio: Number of Females per 1000 Male As compared to the Sex Ratio at the State level in 1991 (879) and 2001 (898), the number of female per thousand male at both census periods remained considerably low, ranging between 829 and 863 in census 1991 and between 842 and 882 in census 2001. Similar trend (ranging between 860 and 905 as against 908 state’s average) was also recorded in census 2011. Thus, the Sex Ratio improved during census 2001 over 1991 but remained low as compared to the state’s. Similar trend was also observed from provisional figure of census 2011. As compared to the Census 2001, the highest improvement was recorded in Lalitpur (from 882 to 905) and lowest in Banda (from 860 to 863) district. 3.1.5 Sex –wise Literacy Rates and Gender Gap in Literacy The percentage of total as well as male and female literate population significantly improved in census 2001 against 1991. Three districts namely, Jalaun (50.65 %), Jhansi (45.01 %) and Hamirpur (41.71 %) had higher literacy rates than that the state (41.60 %) in 1991. In 2001 the literacy rate improved and four districts namely, Jhansi (65.47 %), Chitrakoot (64.83 %), Jalaun (64.52 %) and Hamirpur (57.3 %) had higher literacy rate than that of the sates (56.3 %). According to the provisional figure of census 2011, the literacy percentage significantly improved in all districts of

55
UP bundelkhand region. The total literacy percentage in three districts namely Jhansi (76.37%), Jalaun (75.16%) and Hamirpur (70.16%) were observed higher than the state’s average (69.72%). The literacy rate among males in 7 districts ranged between 45.22 % and 66.1 % in 1991 while it ranged between 63.81 % and 78.76 % in 2001. Among females the percentage of literates ranged between 12.99 % and 31.59 % in 1991 and between 32.97 % and 50.16 % in 2001. In 2011, the percentage of male and female literates had improved as compared to census 2001. The percentage of male literates ranged between 76.41% and 86.58% while female between 52.26% and 64.88%. The Gender Gap in literacy reduced significantly in 5 districts in 2001 as compared to 1991. For example, the gap in district Banda reduced to 32.47% in 2001 from 35.29% in 1991; in Chitrakoot to 27.68% from 34.4%; in Hamirpur to 31.78% from 35.79%; to 28.18% from 34.51% in Jalaun, to 28.6% in 2001 from 37.16 in 1991 in Jhansi. In Mahoba the Gender gap remained more or less same i.e. 31.28% in 2001 over 31.89% in 1991. In Lalitpur, the gap increased to 30.8 in 2001 as against 28.6% in 1991. In Lalitpur, female literates increased from 16.62% to 32.97% but they remained considerably behind the male literates, who were 45.22% in 1991 and 63.81% in 2001. As per the provisional figure of census 2011, the gender gap in literacy in all 7 districts of UP bundelkhand region were found higher (ranged between 21.01 and 24.43) than the state’s average (19.98). The highest gender gap in literacy was found in district Banda, Lalitpur and Hamirpur. 3.1.6 Educational Institutions Number of Primary Schools per lac population increased in all the 7 districts from base year i.e. 2000-01 to 2004-05. The number of schools declined significantly during 2005-06 from the year 2006-07. This indicator showed some improvement but in 2008-09, the number of schools per lac population in 6 districts remained much behind the number in 2004-05. In District Jhansi, however, the number of schools increased to 124.8 in 2007-08 and to 131.3 in 2008-09 as against their number in 2004-05 (122.5).
The number of upper Primary Schools per lac population also showed more or less similar trend as in the case of Primary Schools. The number of schools per lac population increased during 2000-01 and 2004-05 but declined significantly in 6 districts (except Jhansi) during 2005-06. Except District Chitrakoot, the other 6 districts per lac population in 2008-09 as against their number in 2004-05. The number of higher secondary school per lac population declined in all the 7 districts in 2005-06 and except District Banda the number of schools in 2008-09 remained lower than their number in 2004-05. 3.1.7 Safe Source of Drinking Water All the villages in District Banda, Hamirpur, Lalitpur and Mahoba were getting drinking water through India mark-2 hand pumps since 2000-01.
In district Chitrakoot, about 88% of villages had India mark-2 or other handpump on in 2000-01. In 2003-04, Tap water was provided to about 23% of village and about 60% of village were getting water from India mark -2 or other handpums. In 2009-10, about 22% of villages were getting water supply from tap and the remaining 78% from India mark-2 handpump. In District Jalaun about 93% of villages were getting water through India mark-2 or other handpumps in 2000-01. From 2006-07 tap water was provided to about 21% of villages. In District Jhansi, about 97% of villages were getting water through India mark-2 handpumps since 2000-01. 3.1.8 Road Density
56
Length of metalled road per thousand sq. km. in District Hamirpur was 316.20 km. in 2000-01 which steadily increased to 404.10 Km in 2008-09 and in Jhansi, the length increased from 240.50 km. to 381.40. During same period, in Chitrakoot, the road length continued to increase from 216.8 km. to 311.30 km. In other districts, some fluctuations were found, i.e. in Banda, the length of road was 308.60 km in 2000-01 which reached to 355.40 km. in 2004-05 and declined to 334.7 km. in 2005-06 but improved to 418.90 km. in 2008-09. In Jalaun from 390.10 km. in 2000-01, the road length increased to 456.20 km in 2004-05 but declined to 442.80 km. which reached to 456.40 km. in 2008-09. In Lalitpur from the road length increased from 264.10 km. in 2000-01 to 282.20 km. in 2005-06, the road length declined to 275.50 km in 2006-07 but improved to 295.10 km. in 2008-09. In Mahoba, the length of road was 388.80 km. per thousand Sq. km. in 2000-01, which decreased to 274.90 km. in 2001-02 but improved to 407.70 km. in 2008-09. 3.1.9 Proportion of Electrified villages The proportion of electrified village in district Jhansi and Lalitpur steadily increased from 74.0% and 55.0% in 2000-01 to 100.0% and 99.9% respectively in 2008-09. In District Banda, 79.9% of villages were reportedly electrified in 2000-01 which increased to 100.0% in 2003-04 and covered 100.0% villages during 2008-09. In Chitrakoot, 57.4% villages were electrified in 2000-01 which increased to 61.9% in 2002-03 and reached 85.0% in 2008-09. In Hamirpur, from 87.7% electrified villages in 2000-01 the percentage increased to 96.2% of villages in 2008-09. In Jalaun, the percentage of electrified villages increased from 77.8% in 2000-01 to about 92.2% in 2008-09. In Mahoba, 57.9% villages were electrified in 2000-01 which increased to 95.0% in 2008-09. 3.1.10 Number of Commercial Banks There were 28 branches of nationalized commercial and 50 rural banks in District Banda in 2000-01 which increased to 31 and 59 respectively in 2009-10. In Chitrakoot 10 branches of nationalized and 28 rural banks were reported in 2000-01. Their number increased to 16 and 30 respectively in 2009-10. In Hamirpur, the number of branches of nationalized banks were 26 and of rural banks were 30 in 2000-01 and 29 and 30 respectively in 2009-10. District Jalaun had 48 branches nationalized 35 rural banks in 2000-01 which increased to 50 and 39 respectively in 2009-10. District Jhansi had 75 branches of nationalized banks and 23 rural banks in 2000-01 the number branches of nationalized banks increased to 95 and of the rural banks remained same, i.e. 23 in 2009-10. In Lalitpur, 23 branches each of nationalized and rural banks existed in 2000-01. The number of branches of nationalized banks increased to 34 while rural banks declined to 20 in 2009-10. District Mahoba had 16 branches of nationalized banks and 17 rural banks in 2000-01. Their number increased to 19 and 18 respectively during 2009-10. 3.1.11 Post offices, P.C.O. and Telephone Connections District Banda had 208 Post offices, 9 Telegraph offices, 225 P.C.Os and 11,193 Telephone connections in 2000-01. The number of Post offices, P.C.Os and Telephone connections increased to 211 (1.4%); 364 (62%) and 16,900 (51%) respectively in 2009-10.
District Chitrakoot had 76 Post offices, 6 Telegraph offices, 306 P.C.Os and 1,885 Telephone connections in 2000-01. Number of post offices increased to 77 (1.0%); P.C.Os to 435 (42%) and Telephone connections to 6123 (22%) in 2009-10. In district Hamirpur, there were 147 Post offices, 1 Telegraph office 508 P.C.Os and 9,337 telephone connections in 2000-01. Number of post offices and Telephone connection declined to 140 and 8,918 respectively while number of P.C.Os increased to 618 (22%). In District Jalaun, 244 Post offices, 12 telegraph offices 1,271 P.C.Os and 14,034 telephone connections existed in 2000-01. The number of Post Offices increased to 245 (0.4%), P.C.Os to 2,267(106%) and telephone connections to 28,939 (78%) in 2009-10.

57
District Jhansi had 212 Post offices, 31 telegraph offices, 847 P.C.Os and 41,136 telephone connections in 2000-01. Number of Post Offices increased to 213 (0.5%), P.C.Os to 1,742 (106%) while Telephone connections declined to 30,200 (73%) in 2009-10. In District Lalitpur, the number of Post Offices (153) and telegraph offices (2) in 2000-01 remained unchanged in 2009-10 while the number of P.C.Os declined from 290 in 2000-01 to 110 (38%) in 2009-10 and that number of telephone connections declined from 9164 in 2000-01 to 6,632 (72%) in 2009-10. District Mahoba had 85 Post offices, 4 telegraph offices, 250 P.C.Os and 5,827 telephone connections in 2000-01. The number of Post offices increased to 92 (8%), P.C.Os to 466 (86%) and Telephone connections to 8,512 (46%) in 2009-10. 3.1.12 Health facilities Indicators for health facilities in districts include: (i) Number of Allopathic Hospitals and Primary Health Centres per lac population; and, (ii) Number of beds available in Allopathic hospitals and PHCs per lac population. We find that except in district Jhansi, the number of hospitals per lac population in 6 districts declined from 2000-01 to 2008-09 probably due to stagnation in number of hospitals and increase in population over the years. Almost similar scenario was noticed in number of beds available in Allopathic Hospitals per lac population. The number of beds per lac population declined in 5 districts, from 2000-01 to 2008-09, while in Hamirpur the number remained same in 2008-09 as against 2000-01. In district Jhansi, the Number of beds increased considerably from 2000-01 to 2008-09, possibly due to increase in number of hospitals. 3.1.13 Persons in Labour Force Some significant features of labour force emerge from the data pertaining to 1991 and 2001. Major findings are given below. The percentage of total workers i.e. Main and Marginal declined from about 43% in Banda in 1991 to 40% in 2001; in Chitrakoot from 49% to 43%; and in Jhansi from about 38% to 37%. The percentage of total workers increased in Hamirpur from about 39% in 1991 to 42% in 2001; in Jalaun from about 33% to 36%; in Lalitpur from 42% to 43%; and in Mahoba from about 41% in 1991 to 42% in 2001. The proportion of main workers among total workers in 1991 was significantly higher in all 7 districts, ranging between 78% and 88% which declined significantly in 2001; ranging between 66% and 72%. Thus, the percentage of Marginal workers increased considerably in 2001 as against 1991. The proportion of farmers and agricultural labour, among main workers declined seriously from 1991 to 2001 in all 7 districts while the percentage of other workers increased significantly from 1991 to 2001 showing that more farmers and agricultural labour had shifted to other activities in 2001. 3.1.14 Families Below Poverty Line The data of surveys of families below poverty line in the year 1998 and 2002 reveal that: The proportion families below poverty line (BPL) increased significantly in District Chitrakoot from 42% in 1998 to 63% in 2002; in Jalaun from 35% to about 50%; and in Banda from 46% in 1998 to 49% in 2002. The proportion of BPL families declined in 4 district i.e. Mahoba from about 57% in 1998 to 33% in 2002; in Hamirpur from about 65% to 55%; in Jhansi from about 29% to 25%, and in Lalitpur from about 38% in 1998 to 34% in 2002.

58
3.1.15 Cropping Intensity The Cropping Intensity slightly improved in 4 districts namely, Jalaun from 112.0 to 118.8; in Jhansi from 126.7% to 129.8%; in Lalitpur from 134.1% to 153.7% and in Mahoba from 114.4% to 131.4% from 2000-01 to 2008-09. In the three districts where Cropping Intensity declined were Banda, Chitrakoot and Hamirpur. In Banda it declined from 125.6% in 2000-01 to 123.1% in 2008-09 and in Hamirpur it declined from 110.5% to 106.5% and Chitrakoot 111.6% to 107.3%. 3.1.16 Crop Coverage Area under Pulses and oilseeds: The crop coverage area under total Pulses had declined in 4 districts, i.e. Banda, from 1,69,571 Ha in 2000-01 to 1,63,104 Ha (by 3.8%) in 2008-09; in Hamirpur from 2,10,991 Ha. to 1,57,046 Ha (by 25.6%); in Jalaun; from 2,01,255 Ha to 1,59,794 (by 20.6%) Ha; and Jhansi from 2,18,720 Ha in 2000-01 to 1,51,501 Ha (by 30.7%) in 2008-09. The area under total Pulses reportedly increased in 3 districts namely, Chitrakoot from 72,937 Ha in 2000-01 to 85,275 Ha (by 16.9%) in 2008-09, in Lalitpur from 1,73,029 Ha to 2,35,082 Ha (By 35.9%).and in Mahoba from 1,41,828 Ha in 2000-01 to 1,72,565 Ha (by 21.7%) in 2008-09. The Crop coverage area under total oilseeds increased significantly in 5 districts namely in Jalaun, the Crop area increased from 18,909 Ha in 2000-01 to 44,456 Ha (by 135.1%); in 2008-09; in Jhansi from 47,551 Ha to 70,954 Ha (by 49.2%); in Lalitpur from 21,610Ha to 32,730 Ha (51.5%) and in Mahoba the Crop area increased from 28,562 Ha in 2000-01 to 37,604 Ha (by 31.7%) in 2008-09. The crop area under total oilseeds declined in 2 districts namely, Banda from 8,349 Ha in 2000-01 to 7,155 Ha in 2008-09 (by 14.3%) and in Chitrakoot from 4,279 Ha to 4,122 ha (by 3.7%) in the same period. 3.1.17 Productivity of Pulses and Oilseeds The production of total Pulses i.e. Qtl./Ha increased in 2008-09 over 2000-01 in all 7 districts of Bundelkhand. From 4.85 Qtl./Ha in 2000-01 in Mahoba the productivity increased to 8.45 Qtl./Ha (by 74.2%) in 2008-09; from 6.37 Qtl./Ha to 10.88 Qtl./Ha (by 70.8%) in Jhansi; from 5.83 to 8.01 Qtl./Ha (by 37.4%) in Hamirpur; from 6.16 to 8.32 Qtl./Ha in Lalitpur (by 35.1%); from 6.83 Qtl./Ha in 2000-01 to 08.17 Qtl./Ha (by 19.6%) in 2008-09 in Jalaun; from 7.06 to 7.92 Qtl./Ha (by 12.2%) in Banda and in Chitrakoot the productivity of Pulses increased from 7.56 Qtl./Ha in 2000-01 to 8.21 Qtl./Ha in 2008-09 (by 8.6%). The productivity of total oilseeds (Qtl./Ha) increased in 6 districts namely, Jhansi from 3.66 Qtl./Ha in 2000-01 to 4.87 Qtl./Ha in 2008-09 (by 33.0%) followed by Hamirpur from 3.36 Qtl./Ha in 2000-01 to 4.42 Qtl./Ha in 2008-09 (by 31.5%); in Lalitpur from 5.86 to 6.47 Qtl./Ha (by 10.4%); in Chitrakoot from 3.76 to 3.92 Qtl./Ha (by 4.3%)’ in Banda from 4.25 to 4.39 Qtl./Ha (by 3.3%); and in Jalaun from 3.64 Qtl./Ha in 2000-01 to 3.69 Qtl./Ha in 2008-09 (by 1.4%). District Mahoba showed decline in productivity of total oilseeds from 4.1 to 3.26 Qtl./Ha (by 20.5%) in the same periods. 3.1.18 Operational Landholdings A comparative position in Agriculture Census 1995-96 and 2000-01 shows that the percentage of Marginal farmers having upto 1 Ha land increased in 2000-01 over 1995-96 in all 7 districts, from 57.41% to 58.92% in Banda, 59.03% to 61.68% in Chitrakoot, 46.06% to 47.99% in Hamirpur, 52.76% to 59.33% in Jalaun, 47.93% to 54.30% in Jhansi, 37.75% to 41.73% in Lalitpur and from 47.78% to 49.78% in Mahoba. Except in Hamirpur and Banda the proportion of Small farmers (with 1-2 Ha) declined in 2000-01 over 1995-96 from 20.83% in 1995-96 to 20.44% in 2000-01 in Chitrakoot, from 21.69% to 18.87% in Jalaun, from 25.98% to 23.18% in Jhansi, from 34.93% to 33.78% in Lalitpur and from 24.11% to 23.92% in Mahoba. The proportion of large farmers with landholding above 2 Ha considerably declined in all 7 districts in 2000-01, from 22.52% in 1995-96 to, 20.82% in Banda in 2000-01, from 20.13% to 17.88% in Chitrakoot,
59
from 30.91% to 247.80% in Hamirpur, from 25.55% to 21.80% in Jalaun, from 26.08% to 22.52% in Jhansi, from 27.32% to 24.49% in Lalitpur and from 28.11% to 26.30% in Mahoba. The above conditions point out the strong possibility of farmers selling their land. The position was more serious in Jalaun, Jhansi and Chitrakoot where proportion of Marginal farmers increased by about 7%, 6% and 3% respectively. This does reflect that the small and large farmers were compelled by circumstances to sell some part of their land. 3.1.19 Irrigation Intensity Irrigation Intensity in districts of U.P. Bundelkhand has been very low. Against the State’s Irrigation Intensity of 142.60% in 2000-01 district Lalitpur had 100.8; Jhansi 101.5; Mahoba 102; Jalaun 102.3; Hamirpur 103.5; Banda 105.6 and Chitrakoot had 108.8.
In 2008-09 the Irrigation Intensity increased to 133.2% in Banda and to 105.5% in Jalaun while in other districts the situation deteriorated further, e.g. In Chitrakoot it declined to 104.4%, in Hamirpur to 101.3%, in Jhansi to 101.4%; in Mahoba to 101.7%, in Lalitpur it remained same at 100.8%. During this period the Irrigation Intensity at State level was 145.97. 3.1.20 Irrigation Potential The length of Canal was longest in district Jalaun in 2009-10 (1916 Km.) followed by Jhansi (1236 Km.), Banda (1193 Km.) Hamirpur (832 Km.), Lalitpur (825 Km.), Chitrakoot (611 Km.) and Mahoba (455 km). District Jalaun had 581 Gevernment Tubells, 3014 permanent wells, 1518 Rahat and 12,989 Pumpsets of different types in 2009-10. Jhansi had 96 Government Tubewells, 26,390 permanent wells, 4570 Rahat and 13150 Pumpsets. Banda had 460 Government Tubewells, 3034 permanent wells, 1076 Rahat and 14,142 Pumpsets. Hamirpur had 616 Government Tubewells, 2884 permanent wells, 2456 Rahat and 13691 Pumpsets. Lalitpur had only one government Tubwell, 26202 permanent wells, 4799 Rahat and 2970 pumpsets. Chitrakoot had only 4 Government Tubwells, 3766 permanent wells, 2534 Rahat and 4323 pumpsets. District Mahoba had only 3 Government Tubewells, 16023 permanent wells, 4378 Rahat and 1812 pumpsets. District Lalitpur, Chitrakoot and Mahoba had Small length of Canal and insignificant number of Government Tubewell. 3.1.21 Source-wise Irrigation The proportion of Canal irrigated land has significantly declined over the years except in district Lalitpur & Jhansi, e.g. of the total irrigated land in Banda about 53% was irrigated through Canal in 2000-01 which declined to 47.5% in 2008-09; in Chitrakoot from 75.6% to 20.4%; in Hamirpur from 28.69% to 24.9%; in Jalaun from 69.1% to 68.2%; and in Mahoba Canal irrigated area declined from 32.5% in 2000-01 to 29.7% in 2008-09. Canal irrigated area increased in Jhansi from 42.8% to 44.1%; and in Lalitpur from 26.6% to 31.0%. With Decreasing area irrigated through Canal, area irrigated Through Tubewells, mostly private wells and ponds increased very significantly in 2008-09 as compared to 2000-01. 3.1.22 Per Capita Annual Food Grain Availability The per capita annual availability of food grains has considerably increased in 2008-09 against 2000-01 in 7 districts. In district Banda per capita availability of food grains including pulses in 2000-01 was 270.5 Kg which increased to 339.2 Kg in 2008-09, an increase of 25.3%; in Chitrakoot from 232.0 Kg to 245.3 Kg (increased by 5.8%); in Hamirpur from 350.4 Kg to 547.9 Kg (increased by 56.4%); in Jalaun from 358.1 Kg to 473.0 Kg (increased by 32.1%); in Jhansi from 260.9 Kg to 333.4 Kg (increase of 27.8 %); in Lalitpur from 334.5 Kg to 661.1 Kg (increase of 97.6%); and in Mahoba the availability increased from 220.2 Kg in 2000-01 to 391.9 Kg in 2008-09 (increased by 78.0%).
60
3.1.23 Proportion of Agricultural Labour The proportion of agricultural labour among total workers had declined very seriously in all the 7 districts. The proportion of agricultural labour among total workers in 1991 was 23.27% in Banda which declined to 13.84% in 2001; in Chitrakoot it declined from 19.76% in 1991 to 11.78% in 2001; in Hamirpur from 26.72% to 14.68%, in Jalaun from 20.44% to 12.99%; in Jhansi from 15.82% to 7.70%; in Lalitpur from 8.04% to 4.94% and in Mahoba the agricultural labour declined from 24.27% in 1991 to 12.60% in 2001. The above changes in the proportion of agricultural labour among total workers strongly indicate shrinking condition of job availability in agriculture sector in Bundelkhand area. 3.1.24 Consumption of Fertilizer The consumption of fertilizer per hectare sown area had increased from 2000-01 to 2008-09 in 5 districts while in two districts it has reduced during the same period of time. In Banda the consumption of fertilizer was 19.9 Kg per hectare which increased to 31.3 Kg in 2008-09; in Chitrakoot the consumption increased from 33.0 Kg to 44.2 Kg; in Hamirpur from 27.3 Kg to 30.2 Kg; in Jalaun from 51.5 Kg to 66.9 Kg, in Jhansi from 53.5 Kg to 70.5 Kg per hectare. In Lalitpur, the consumption of fertilizer decreased from 35.5 Kg per Ha in 2000-01 to 29.4 Kg per Ha in 2008-09 and in Mahoba the consumption declined from 27.9 Kg per Ha to 24.2 Kg per Ha during same period. Fertilizer consumption has increased slightly in whole Bundelkhand region but still far behind the state’s average due to higher ownership of livestocks and use of organic manure. 3.1.25 Pesticides Consumption The per hectare average pesticides consumption is 476.4 gm. in Jhansi, 385.7 gm. in Lalitpur, 527.3 gm. in Jalaun, 121.5 gm in Banda, 242.9 gm in Hamirpur, 131.3 gm in Mahoba and 207.9 gm. in Chitrakoot against the state average of 596.5gm. In the above districts bio pesticides were also used ranging from 16.7 gm. (Mahoba) to 55.5 gm. (Lalitpur) per Ha. Use of bio pesticides in the districts Jhansi, Jalaun, Banda, Hamirpur & Chitrakoot were 38.8 gm., 52.3 gm., 22.9 gm., 26.9 gm and 31.5 gm. Per Ha. respectively. 3.1.26 Soil Fertility In Bundelkhand the fertility status is not satisfactory. It is declining steadily. In year 1999-2000, the nitrogen availability in 5 blocks were medium with low to very low P and high for K whereas 9 blocks were in the range of very low for N and very low to high for P & K. Thirty two blocks were in category of low N content, very low to low P and low to high K. In 2006-09 only one block was in medium category for N, P&K ranged very low to low for P & High for K. The nitrogen content of 43 blocks was low with variable P&K. Two blocks were found in category of very low for N and very low to high for P&K. Data analysis between 1999 to 2008-09 shows that the level of N degraded and 14 blocks shifted from medium to low; The number of blocks increased 32 to 43 blocks and 3 blocks reached in very low category, likewise P&K also degraded invariably. It means fertility status of soil is steady degrading due to various faulty agricultural practices including improper fertilizer management. Secondary and micro-nutrients deficiencies in soils also emerged as a yield limiting factor. In most of the Bundelkhand region Cu, Fe & Mn are sufficient but Sulphur and Zinc are low to marginal or sufficient. Efficient Soil management strategy is the only way to maintain good soil health and crop productivity.
61
3.1.27 Facilities for Livestock For the treatment of diseases of livestock a number veterinary hospitals and dispensaries existed in the districts. But, surprisingly, their numbers have reduced over the years in all the districts. In Banda the number of veterinary hospitals and dispensaries was reduced to 26 in 2009-10 from 45 in 2001-01; in Chitrakoot their number declined to 13 from 30, in Hamirpur to 21 from 42 in Jalaun to 26 from 59, in Jhansi to 24 from 35, in Lalitpur to 25 from 51 and in Mahoba their number declined to 11 in 2009-10 from 21 in 2000-01. The number of A.I. Centres/Sub-centre increased from 16 in Banda in 2000-01 to 34 in 2009-10; in Chitrakoot from 10 to 22; in Hamirpur from 25 to 44; in Jalaun from 25 to 92; in Lalitpur from 20 to 47; and in Mahoba from 10 in 2000-01 to 23 in 2009-10. In Jhansi, however, their number was reduced from 46 in 2000-01 to 21 in 2009-10. 3.1.28 Reservoir Fish Production There were 19 departmental reservoirs in Banda with an area of 47.2 Ha producing 330.6 Qtl. In 2009-10: Chitrakoot had 5 departmental reservoir with an area of 2375 Ha producing 241 Quintal; Jhansi had 11 departmental reservoir with an area of 3973.38 Ha. producing 1085.1 Qtl; Lalitpur had only one departmental reservoir with an area 126.47 Ha. producing 80 Qtl, and Mahoba had 28 departmental reservoir with an area of 4054.38 Ha producing 1244.64 Quintal fish. Besides, there were private reservoir in Banda (44 Ha), Hamirpur (911 Ha.) Jalaun (8 Ha.), Jhansi (43 Ha.) and Mahoba (16 Ha.) producing 184. 1680, 275, 499 and 244 Qtl. Fish respectively. 3.2 Socio-Economic Baseline Status of Blocks under Project area in Jamini, Sajnam and Rohini Dam of Lalitpur district based on secondary data The command area of Jamini, Sajnam and Rohini dams fall in four blocks namely Bar, Birdha, Mahrauni and Mandawara of Lalitpur district. The brief baseline status of these blocks is given below:
1. District Lalitpur with an area of 5039 square Km. had a total population of 977734 persons, including 24.93% of the Scheduled Castes (SC) during Census 2001. Thus, the proportion of SC population was higher than the State’s (21.15%). (Annexure 3.1, Table-1)
2. Decadal increase in population of the district remained higher in 1991-2001 (30.01%) and 2001-2011 (24.57%) against growth at the State level (25.85%) and 20.09% respectively. (Annexure 3.1, Table-2)
3. Density of population per Sq.Km. in Lalitpur remained very low as compared to the State’s i.e. 149 persons per Sq.Km. in 1991, 194 in 2001 and 242 in 2011 as against the State’s 473, 690 and 828 during three periods respectively due to its topography (Table-3)
4. Sex Ratio, i.e. number of females per 1000 males improved in the district from 882 in 2001 to 905 in 2011 as against State’s 898 and 908 respectively. (Table-4)
5. Literacy Rates in the district increased from 32.12% in 1991 to 49.46% in 2001 to 64.96% in 2011 but remained behind the State’s i.e. 41.6%, 56.30% and 69.72% respectively. Literacy rates among females significantly improved in the district from 2001 (32.97%) to 2001 (52.26%) as compared to increase among males from 63.81% in 2001 to 76.41% in 2011 which reduced gender gap in literacy from 30.84% in 2001 to 24.15% in 2011. (Table-5)
62
Educational Institutions
• The number of primary schools per lac population slightly declined from 126.8 in 2000-01 to 125.1 in 2008-09 may be because new schools were not opened proportionate to the increase in population.
• The number of senior primary schools per lac population significantly increased from 31.2 in 2000-01 to 55.1 in 2008-09 mainly because more new schools for girls were established.
• The number of higher secondary schools per lac population declined from 3.2 in 2000-01 to 2.9 in 2008-09 as a large number of private schools has been started and the government did not feel pressure from public for opening highor secondary schools. (Table-6)
6. Safe Source of Drinking Water was available in all villages of the district since 2000-01 through
India Mark-II handpumps. (Table-7). 7. Length of Metalled road per thousand sq.km. in the district increased from 257.95 Km. in 2000-01
to 278.325 Sq.Km. i.e. about 20 Km road was added in eight years. (Table-8) 8. Proportion of electrified villages in the district increased from about 55% in 2000-01 to almost all
(99.8%) in 2008-09). (Table-8) 9. In district Lalitpur, 23 branches each of nationalized and rural banks existed in 2000-01. The
branches of nationalized bank increased to 34 while of the rural banks declined to 20 in 2009-10. (Table-10)
10. The number of Post offices (153) and Telegraph offices (2) in 2000-01 remained unchanged in
2009-10. Number of PCOs and Telephone connections declined significantly from 290 and 9164 respectively in 2000-01 to 110 and 6632 respectively in 2009-10.
11. The decline in number of PCOs and Telephone connection may be the result of popularity of
mobile phones. (Table-11) 12. Health Facilities Indicators for health facilities include (i) Number of Allopathic Hospitals and
Primary Health Centres (PHC) per lac population, and (ii) Number of beds available per lac population in those hospitals.
The number of hospitals per lac population declined in the district from 4.7 in 2000-01 to 3.8 in 2008-09. Similarly, the number of beds in Allopathic hospitals and PHCs per lac population declined from 30.5 in 2000-01 to 27.8 in 2008-09. This situation arose probably due to stagnation in number of hospitals and beds and increase in population over the years. (Table-12).
13. Labour Force
a. The percentage of total workers, i.e. Main and Marginal, marginally increased from 42% in 1991 to
43% in 2001. b. The proportion of Main workers among total workers in 1991 was significantly higher, i.e. 78.2%
which declined to 68.46% in 2001. Thus, the percentage of Marginal workers increased from 21.78% in 1991 to 31.54% in 2001.
c. The proportion of farmers and agricultural labour, among Main workers declined seriously from 1991
to 2001, showing that due to decline in agricultural conditions more farmers and agricultural labour had shifted to other activities (Table-13).
63
14. Families below Poverty Line The Proportion of families living below poverty line declined in district Lalitpur from about 38% in 1998 to about 34%. In the project area, however, their proportion increased from about 35% to 39% during the same period. The increase in proportion of BPL families was recorded in all the four blocks of the project area but was significantly higher in block Mandwara, from about 36% in 1998 to 48% in 2002. (Table-14)
15. Cropping Intensity improved in the district from 134.1 in 2000-01 to 153.7 in 2008-09. Similarly, in the project area of the district it increased from 128.5 to 149.6 during the same period. A significantly higher increase was recorded in block Bar and Birdha. (Table-15)
16. Crop coverage Area under Pulses and Oilseeds
a) The area under total Pulses in the district increased from 173029 Ha in 2000-01 to 235082 Ha in 2008-09 i.e. an increase of about 36%. The increase in project area was about 38%.
b) The Crop area under total oilseeds increased in the district from 21610 Ha in 2000-01 to 32730 Ha i.e. by about 52% during same period. In project Area the increase in area under oilseeds was higher i.e. about 65%. (Table-16).
17. Productivity of Pulses and Oilseeds
a) The productivity of total pulses in Lalitpur increased by 35% from 2000-01 (6.16 Qtl/Ha) to 2008-09 (8.32 Qtl/Ha)
b) The productivity of total oilseeds increased by 10.4% i.e. from 5.86 Qtl/Ha in 2000-01 to 6.47 Qtl/Ha in
2008-09 (Table-17) 18. Operational Landholdings
a) A comparative position in Agriculture Census 1995-96 and 2000-01 shows that the percentage of Marginal
farmers having upto 1 Ha. Land increased from 37.75% in 1995-96 to 41.73% in 2000-01 in the district. b) The percentage of Small farmers with upto 2 Ha and Large farmers having landholdings of More than 2 Ha
declined from 1995-96 to 2000-01. A similar position was found in the project area of the district. c) A significant increase in percentage of Marginal landholding and decline in proportion of Small
landholdings was found in Block Mahrauni and Birdha. (Table-18) 19. Irrigation Intensity
• Irrigation Intensity in entire UP Bundelkhand has been very low. Against the State’s Irrigation. Intensity of
142.60% in 2000-01 district Lalitpur had 100.8%.
• In 2008-09 Irrigation Intensity at State level was 145.97while in district Lalitpur it remained same at 100.8%
• In the project area of the district the Irrigation Intensity was further lower at 100.4% in 2000-01 and 100.3% in 2008-09. (Table-19)

64
20. Irrigation Potential
The length of canal in the district in 2009-10 was 825 Km. and in project area 579 Km. The district had only one Government Tubewell, 26202 permanent wells, 4799 Rahat and 2970 pumpsets. (Table-20)
21. Source-wise Irrigation
a) The proportion of Canal irrigated land in district Lalitpur was about 32% of the total irrigated land in 2000-01 and 31% in 2009-10.
b) There was decline in area irrigated through canal from 2001-02 to 2003-04 ranging between 27% and 30%.
A very serious decline in canal irrigated area was reported in 2008-09 i.e. 17%. c) In 2009-10 area under canal irrigation was about 31%, under Tubewell 22.85%, through wells 29%, ponds
14% and other sources 3%. d) Of the total irrigated land in project area of the district about 25% was irrigated through canal, 30%
through Tubewell, 26% through wells, 15% through ponds and 4% through other sources. e) The total irrigated area in the district increased significantly from 184773 Ha in 2000-01 to 249224 Hain
2009-10. (increased by 35%) The total irrigated area in the project part of the district increased from 123181 Ha to 174524 Ha i.e. by
42% during the same period. (Table-21). 22. Average Livestock Per Family
The average number of livestock per family in the district during animal census of 1997 and 2003 remained 5. In the project area the average number of livestock per family declined from 6 to 5. (Table-22).
23. Reservoir Fish Production There were 3 departmental reservoirs in district Lalitpur in an area of 18250 Ha in 2000-01, producing 1411 quintal fish. In 2009-10 the number of departmental reservoir was reduced to only one, in an area of 126.47 Ha, producing only 80 quintal Fish. Thus, the production of fish in last 10 years declined to almost insignificant level (Table-23).

65
3.3 Socio-economic status of Bundelkhand Region based on Primary Survey in Command & Non-command area 3.3.1 Socio-economic status of Bundelkhand Region based on Household Survey 1. Percentage of SC population: The percentage of schedule caste population in command and non-
command area in districts Lalitpur, Jhansi, Hamirpur, and Chitrakoot were higher (between 23% to 31%) than the UP average (21.5%). In district Jalaun, the percentage of SC population in command (21%) and no-command area (20%) was lower than the state average. Command area of district Mahoba and non-command area of district Banda have low percentage (18% and 19%) of SC population.
2. Percentage of Joint Families: Joint families living in command area range between 28% in
Hamirpur to 53% in Chitrakoot while in non command area range from 30% in Hamirpur to 48% in Chitrakoot. The higher percentage (48%-53%) of joint families living in command and non-command area in districts Chitrakoot while lowest (28%-30%) in district Hamirpur. The pattern suggests traditional system of living.
3. Literacy: The total literacy in command area in UP Bundelkhand districts range from 33%
(chitrakoot) to 81% (Jhansi) while 42% (chitrakoot) to 76% (Lalitpur) in non command area district. Literacy percentage among male was more than 80% in all districts except Mahoba (in command 74% & 78% in non-command area) and non command area in Banda (73%) district. The literacy percentage among female was 60% (Mahoba) to 75% (Jalaun) in command area and 64% (Banda) to 70% (Lalitpur) in non command area of UP Bundelkhand region.
4. Living Condition: Kutcha and pukka House: More than 70% of families living in kutcha or kutcha-
pukka houses in both command and non command area of UP Bundelkhand districts.
No toilet within house: More than 70% of families do not having toilets within their house in both command and non command area, except command area of Banda and Jalaun districts of UP Bundelkhand.
Fuel for cooking (Wood, cow dung or both): More than 90% of families were using wood, cow dung or both as a source of fuel for cooking in both command and non command area districts of UP Bundelkhand.
Source of drinking water (Government and private): More than 85% of families were using India Mark-II handpump and private handpumps as a source drinking water in both command and non command area districts except in Banda (71% in command & 77% in non command) of UP Bundelkhand.
5. Ownership of Livestock: More than 80% of families were having livestock except district Mahoba
(76% in command & 72% in non command) and non-command area (76%) of district Chitrakoot of UP Bundelkhand. The average numbers of livestock per family were 4-6 in all districts in both command and non- command area except Jhansi (2 in both command in non command).
6. Average annual saving: The annual savings were very low ranging from Rs. 1257/- to Rs. 2233/- in
five districts of UP Bundelkhand in both command and non-command area. Annual saving in district Jhansi and Chitrakoot was however much higher (Rs. 13331/- to Rs. 26455/-) than the other districts.

66
7. Indebtedness: The percentage of indebted families in command area range between 24% (Jalaun) to 45% (Banda). In non-command area, the percentage of indebted families was range from 28% (Jhansi) to 55% (Banda). The majority of indebted families ranging between 75% to 97% is not able to re-pay their loan in both command and non-command area. The 100% families of block Rampura-district Jalaun (both command and non-command), Gohand block of Hamirpur and Charkhari block of Mahoba district (non-command area) has not re-paid any part of their loan.
8. Migration: The highest migration from families (12% to 38%) was recorded in district Chitrakoot
followed by Banda, Mahoba, Jalaun, Lalitpur and Jhansi. Lowest migration was recorded (8%) in Hamirpur district.
9. Crop affected by Drought in last 10 years: A majority of farmers reported that their crops were
affected 3-4 times in last 10 years due to drought. The percentage of families affected by 3-4 times in command area range between 62% (Chitrakoot) to 88% (Lalitpur) and in non command area 72% (Jalaun) to 85% (Mahoba).
10. Productivity: The productivity of important crops (Wheat, Jwar, Pulses and Oilseeds) in entire UP
Bundelkhand districts was lower than the state average of 2008-09. Productivity of these crops in all districts of UP Bundelkhand was further lower in non-command area as compared to the command area.
Productivity of wheat: Productivity of wheat in command area range between 21.5 Qtl/Ha (Chitrakoot) to 23.7 Qtl/Ha (Jalaun) while in non-command 18.4 Qtl/Ha (Banda) to 20.9 Qtl/Ha (Lalitpur). Productivity of Jwar: Productivity of Jwar in command area range between 6.8 Qtl/Ha (Lalitpur) to 10.6 Qtl/Ha (Chitrakoot) and in non-command 5.9 Qtl/Ha (Mahoba) to 8.8 Qtl/Ha (Chitrakoot). Productivity of pulses: Productivity of pulses in command area range between 6.2 Qtl/Ha (Hamirpur) to 7.6 Qtl/Ha (Chitrakoot) while in non-command 5.7 Qtl/Ha (Mahoba) to 7.2 Qtl/Ha (Chitrakoot). Productivity of Oilseeds: Productivity of Oilseeds in command area range between 3.5 Qtl/Ha (Banda) to 5.4 Qtl/Ha (Jhansi) and in non-command 2.7 Qtl/Ha (Banda) to 5.3 Qtl/Ha (Hamirpur). Thus, productivity of all crops in non-command area was lower than in the command area.
11. Cause of low productivity in last 5 years: There were various factors that affected the crop
productivity, some of the major causes were: irrigation problem (Late watering and insufficient watering), shortage of fertilizers, lack of HYV seeds, poor rain and crop spoilage through stray animals (Anna Pratha) & wild animals in both command and non command area of UP Bundelkhand region. The productivity of important crops has slightly increased in both command and non command area of UP Bundelkhand region where watering was done timely, adequate water supply, proper use of fertilizers, use of HYV seeds and no or very low spoilage of crop through stray animals (Anna Pratha) & wild animals. The farmers of head and middle canal/minor were getting higher production as compared to tail end farmers.
12. Percentage of irrigation to sown area: In command area of UP Bundelkhand districts, the
percentage of irrigation to sown area range from 39% (Mahoba) to 69% (Chitrakoot) and in non

67
command area from 26% (Banda) to 59% (Chitrakoot). Irrigation through canal in command area was very low in Hamirpur (12%), Chitrakoot (14%) and Jhansi (26%).
13. Watering of Crops: Between 72% (Banda) and 99% (Chitrakoot) of watering were given as against required for various crop. About 17% (Banda) to 49% (Hamirpur, Jalaun and Lalitpur) of watering were not given on time.
14. Disposal of Garbage: More than 90% of respondents reported that they throw waste into dump site in Lalitpur, Jalaun, Hamirpur, Mahoba and Banda district. About 10%-50% of respondents were also throwing waste near home and in the field in all districts of UP Bundelkhand.
15. Monthly medical expenses on women: Between 50% and 60% of total medical expenses of families were on women in both command and non-command area of UP Bundelkhand except chitrakoot district. More women in the families suffered from various diseases as compared to men.
16. Major diseases: There were 6 major diseases which affected both male and female in command and non-command area of entire UP Bundelkhand districts. These diseases were Typhoid, Cholera/Diarrhoea, Malaria, Whoping Cough, Jaundice and Skin disease. Dysentery was also reported only in non command area of Hamirpur and command area of Chitrakoot.
17. Benefits from Poverty alleviation Programme: About 5%-26% of families benefited through MNREGA Schemes in six districts of UP Bundelkhand. The highest percentage of beneficiaries was in district Lalitpur in both command (73%) and non command area (69%). A benefit through Bundelkhand package was reported in command area of Jhansi district. The large beneficiaries of MNREGA scheme in all 7 districts, however, expressed dissatisfaction from the benefit they received suggesting some shortcoming in the programme.
18. School going age group (7-14 years) of Children: Between 78% (Mahoba) and 100% (Lalitpur and Hamirpur) of boys were attended schools in the age of 7-14 years while the percentage of girls was lower than the boys ranging from 65% (Banda) to 94% (Jhansi).
19. Major problem associated with continuing schooling of girls: There were 3 major problems i.e. transport facility, lack of nearby schools and poverty affecting continuation of schooling of girls in both command and non command area of UP Bundelkhand districts.
20. Employment: Number of days per year employment of men was significantly higher than of the women in both command and non command area of UP Bundelkhand districts. Number of employment days per year of men in non-command area was higher than in the command area while in case of women the number of days was higher in command area. Number of days of employment in agriculture was lower than in non-agriculture as agriculture does not offer higher opportunities as main crop season is only Rabi. Number of employment days per year of men in command area range between 151 (Lalitpur) to 215 (Chitrakoot) while in non command 164 (Hamirpur) to 243 (Lalitpur). Number of employment days per year of women in command area range from 111 (Hamirpur) to 215 (Mahoba & Chitrakoot) while in non command between 105 (Hamirpur) to 140 (Mahoba).

68
21. Status of women in a family: A significant proportion of women reported that their husbands were alcoholic, followed by violence against them in district Jhansi, Jalaun and Mahoba. Insecure environment and strict behaviour of in-laws was reported in Chitrakoot district in both command and non-command area. Their low status in family was reported in district Lalitpur, Hamirpur and Banda in both command and non-command area.
22. Participation in election: A large majority of women respondents ranging between 89% and 98% in all districts vote in election for Panchayat, Vidhan Sabha and Lok Sabha in both command and non-command are of UP Bundelkhand districts.
3.3.2 Socio-Economic Baseline Status of Lalitpur district based on Household Survey
The sample of household for primary survey consisted of 10 families from each of the 10 villages of three Blocks, namely, Birdha, Mandwari and Talbehat of district Lalitpur. The data was analysed on Command, non-command area basis. A total of 110 families belong to the Command and 190 to the non-command area, out of them the families of farmers were 98 and 168 respectively. Data tables of district Lalitpur are given in Annexure-3.2 of this report. Caste-wise Distribution: A large proportion of the sample household in Command (53.6%) and non command (52.1%) area belong to the other Backward castes (OBC) followed by the Scheduled Castes (22.7% and 26.8%) respectively. SC Population in Lalitpur was 24.93% i.e. higher than at the State level. About one fifth of the families belong to the General Castes (20.9% and 20.5% respectively) while Scheduled Tribe families were nominal i.e. 2.7% in Command and 0.5%, in non-command area. Block Mandwari had a higher sample of OBC (60.0% and 55.7%) while Block Talbehat had higher proportion of SC (33.3% and 30.0%) household. (Table-1) Landholding Size: The average landholding size in district Lalitpur was reportedly higher (1.73 Ha) than at the State level (0.83 Ha) in 2000-01. It is reflected in the sample of household as 34.5% in Command and 33.7% in non-command area were small farmers having 1-2 Ha; 28.2% in Command and 26.8% in non command were large farmers with more than 2.0 Ha; 26.4% in command and 27.9% in non command area were Marginal farmers having upto 1.0 Ha land. Landless constituted 10.9% in Command and 11.6% in non command Area (Table-1) Composition of Families: Though a majority of families in the district were single in both Command (58.2%) and non-Command (63.2%) area yet the proportion of joint families was significant which reflect traditional system prevailing in the society. A large majority of household were Male headed in both the Command (94.6%) and non-Command (93.7%) area (Table-2) Literacy: The percentage of literates among families in Command was 77.8 and in non-Command 76.4, was significantly higher than at the State level (69.7%) in Census 2011. In non-command area of Block Talbehat their proportion was, however, slightly lower (67.4%) than at the State level (69.7%). (Table-3)
Living Condition
1. About 18 percent of houses in both command and non-command area had pit toilet within their house.
About 24 percent of houses in Block Birdha in command area and 27 percent in Block Mandwari and 22 percent in Birdha in non-command area had such facility. About two-third of Pacca houses in Block Birdha command area and Block Mandwari and 57 percent in Birdha in non-command area had this facility within their premises.

69
2. About 62 percent of houses in Command and 64 percent in non-command area had electricity
connection. A significantly larger proportion of houses in Block Birdha in both area had this facility than in other Blocks (Table-4)
3. A large majority of families were using Cow dung cake/ firewood as fuel for Cooking (Table-5) 4. A large majority of families in both Command (77.3%) and non-Command (80.0%) were getting
drinking water through government handpumps. Most of the respondents in Command (96.4%) and non-command (94.7%) area reported the quality of drinking water was clean. (Table-6)
Family Assets- Transport: About 91 percent of families in command and non-command each had some assets for transport. A larger proportion of them had Moped/Motor cycle and or Bicycle. About 42 percent of families in Command owned Moped/Moter Cycle and about 36 percent had Bicycle. Thus, about 77 percent of household had these comparatively cheap and fast mode of transport while about 8 percent had tractor and 4 percent owned Bullock cart. In non-Command area about 56 percent of families owned Bicycle and 29 percent had Moped/Motor Cycle while about 4 percent had tractor and 1 percent owned Bullock Cart (Table-7)
Family Assets- Agricultural Implements: About 40 percent of families in Command and 45 percent in non-Command area had some agricultural implements. Among them in command area 27.3% each had Pumpset and Ferrying Trolly; 20.5% owned Tractor; 31.8% had Harrow; 11.4% owned Thresher and 50.0% had wooden Plow. In non-Command area 40.0% of families owning implements had Pumpset; 23.5% had Ferrying Trolly; 10.6% had harrow; 8.2% each had Tractor and Thresher and 38.8% owned wooden plow. The proportion of families owning pumpset is certainly large which indicate the dire need of irrigation. Further, the proportion of Pumpsets owners in Block Birdha was very high as against other two Blocks in both Command (46.2%) and non-Command (56.3%) area. It suggests serious surface water shortage in this Block. (Table-8)
Family Assets-Livestock: A large proportion of families in both Command and non-command area owned this asset ranging between 84.0% of household in Block Birdha, 87.0% in Talbehat and 90.0% in Mandwari in the Command Area. In non-command area 84.0% of families in Block Mandwari, 88.0% in Birdha and 93.0% in Talbehat had there assets. Ownership of livestock by a large number of household indicate animal husbandary is an important source of earning for the people in Lalitpur. The average number of livestock per family was significantly higher in the command area (6.6)of all three blocks as compared to non-command area (2.7). This situation may be due to easy availability of surface water in the command area. (Table-9)
Family Income: The average net annual income per family from various sources was found higher in command (Rs. 45179) as against the non-command (Rs. 36456) area. The same trend was found in all the three Blocks. The average per family annual net earnings from two major sources, i.e. agriculture and animal husbandry were lower in non command area as the cost of input were considerably higher in this area. Due to shortage of surface water farmers and owners of livestock were depending on costly ground water for irrigation of crops as well as for animal fodder. (Table-10)

70
Family Expenditure: Average annual expenditure per family on Education, Health, consumption and other such as marriage, Festivals and functions was analysed. The average amount spent on each of the above in Command area was considerably higher than in non-command area of all the three Blocks, due to their higher income. In term of percentage to the total expenditure, a larger proportion was spent on consumption by the families in non-command area (71.6%) than in the command (68.2%) area. This may be due to the fact that average annual income of families in non-command area was significantly lower than in Command area (Table-11)
Savings: As regards the number of families who were able to save some small amount of money and deposited it in the Bank, Post office or kept with themselves a slightly higher average annual savings was reported by respondents of Command (Rs. 1429/-) than of the non-command (Rs. 1257/-) area, may be due to the higher income they earned as analysed earlier. The number of families who were able to save money was also higher in command than in non-command area, many of whom had deposited their savings to Bank or Post office and had also kept some amount with themselves. The amount of average annual saving deposited with Banks was higher than the amount deposited with Post office or kept with themselves. (Table-12). Indebtedness
a) Indebtedness seems to be a serious problem as about 40% of sample families in command and 29% in non-command area were indebted.
b) Average loan per indebted family in command area was Rs. 98341/- while average current outstanding was
Rs. 93295/- i.e. about 95% of the loan amount was yet to be repaid.
In non-Command area the average loan amount per indebted family was Rs. 102536/- while the average current outstanding amount was Rs. 81125/- i.e. about 79% of the loan amount was yet to be repaid. Thus, a higher proportion of amount was repaid in non-command than in command area.
c) A higher average loan per indebted family was reported in Block Birdha followed by Mandwari and Talbehat in both Command and non-Command area.
d) A significantly larger average amount of loan was obtained from banks than money lenders or relatives /
friends in both Command and non-command area. e) A larger proportion of loan secured from Banks was repaid in non-command (21%) than in command area
(about 5%) f) Surprisingly, the entire loan amount taken from Moneylenders remained outstanding in both command and
non-command area despite the fact that it carried a very high interest rate of even upto about 5% per month.(Table-13)
Condition of Poverty
a) The respondents were asked to identify a critical situation that they faced due to poverty. About half of the sample in Command (52%) and non-command (51%) mentioned that they could not arrange medical treatment of family member; about 31% in command 37% in non command reported that they could not marry their daughter while about 17% in command and 13% in non command reported their children had to drop out of school due to non-payment of fee.
b) Non availability of Medical treatment due to poverty was reported by more respondents in block Talbehat
and Mandwari in both Command and non-Command areas as compared to block Birdha. (Table-14)

71
Mitigation Status
a) A total of 21 Male (19%) alongwith 4 female workers in command area migrated for employment. Among them 12 male and 3 female workers migrated out of their district but within the State while 9 male and 1 female worker migrated out of the state.
b) Migration of 12 male and 4 female workers was seasonal. Thus, out of 21 male workers 9 migrated
permanently. c) In non-Command area a lower proportion of families (8%) informed about migration of their members as
15 male and 1 female workers had migrated to other places. Among them 9 male and 1 female worker migrated out of their district but within the State while 6 male workers migrated out of the state.
d) Migration of 11 male and 1 female worker was seasonal. Thus only 4 male workers had migrated
permanently. e) Proportion of migrated workers was significantly higher in command area of block Talbehat (33%) and
Mandwari (27%) than in Birdha (6%). Similar position was found in non-command area, though not significantly (Table-16).
1. Area affected by Water logging/Barren land/Drought
Out of 110 families in Command area 12 having 12.6 Ha land and 28 families out of 190 in non command having 30.3 Ha land reportedly suffered from drought. The affected size of landholding suggest that most of them were Marginal farmers. Block wise 8 in Birdha and 2 each in Mandwari and Talbehat in Command and 11 in Birdha, 10 in Talbehat and 7 in Mandwari in non command had suffered due to drought . Only two farmers in command and 5 in non command area had a total Barren land of 1.8 Ha and 9.6 Ha respectively while one farmer each in command and non-command area complained about water logging. (Table-18)
2. Depth of Ground water and Preferred Source of Irrigation The depth of ground water in all the 3 blocks in Command and non-command both was more than 30 feet. (Table-19) When enquired about farmer’s preferred source of irrigation in Case ground water level was very deep 58 in command preferred Tubewell as compared to 52 farmers preferring through Canal. In non-command area 93 each mentioned the preferred source would be Tubewell and canal. Such a pattern of response in favour of Tubewell indicate that either canal was not serving their entire area or the supply was untimely / inadequate. Block wise, a significantly large number of respondents in Talbehat (22) in command and non-Command (51) both preferred irrigation through Tubewell as compared to those preferring Canal irrigation i.e. 8 and 17 respectively. This suggests that the condition of canal irrigation in Block Talbehat was not satisfactory. (Table-20). The respondents belonging to the three Blocks reported that the level of canal water generally remain high during November-December while during March-June they (Canal) remain dry. (Table-21)
3. Rainfall
The period of heavy rains in the area was reportedly July-August in all the three blocks of both command and non-Command area.
4. Crops affected by Drought in Lost 10 years

72
a) About 88% of farmers in command area reported their crops were affected by drought between once and six
times in the last 10 years. About 96% of affected farmers were in Block Birdha and Mandwari while in Talbehat about 65% of the farmers were affected.
b) About 79% of farmers in non-command reported their crops were affected between once and 8 times in the last 10 years. About 96% of farmers in Birdha, 92% in Talbehat and 55% in Mandwari suffered from such occurrences.
c) During the last 10 years, crops of a majority of farmers in Command (74%) and non-command (62%) area were affected for 3-4 times due to occurrences of drought, which is a considerably large number as one failure of crop affects the economic condition of farmers for more than two crop seasons. (Table-24)
5. Soil Fertility Testing
a) More farmers in non command (15%) than in command area (4%) reportedly get soil fertility of their farms tested in the last ten years, mostly once, and some twice or more. The proportion of such farmers was significant in Block Birdha non-command (38%). (Table-25)
b) About 21% of farmers in non-command and 12% in Command area reported reduction in Soil fertility of their farms, mostly due to sodicity. Block-wise about 19% of farmers in Mandwari, 15% in Talbehat and 7% in Birdha in Command area reported reduction in soil fertility of their farms while in non-command area about 27% of farmers in Birdha, 19% in Mandwari and 18% in Talbehat reported similar condition of soil fertility of their farms. It is therefore, a serious constraint for a significant proportion of farmers in both command and non-command area. (Table-26) Only 3 farmers in command and 7 in non-command reported about barrenness of some of their farm land.
6. Main Crops at Present, 5 years Back and 10 years Back and Their Productivity (Qtl./Ha):
a) Major crops in terms of area covered in the district included Wheat, Jwar, pulses and Oilseed. Productivity i.e. Qtl/Ha of all crops was low in comparision to the State’s average for the year 2008-09. For example, productivity of Wheat in the district was reportedly 24.9 Qtl/Ha in Command and 20.9 Qtl/Ha in non-command against State’s average of 29.97 Qtl/Ha, For Jwar 6.8 Qtl/Ha in command and 6.9 Qtl/Ha in non-command against states average of 10.38 Qtl/Ha; For total pulses 6.7 Qtl./Ha in Command and 6.2 Qtl/Ha in non-command against State’s 8.99 Qtl/Ha and for Total oilseed was 4.9 Qtl/Ha in Command and 4.4 Qtl/Ha in non command against State’s 8.87 Qtl/Ha.
b) As per responses in household survey Productivity of Wheat in Command area of the district remained considerably higher i.e. 24.9 Qtl/Ha at present, 20.7 Qtl/Ha 5 years back and 17.3 Qtl/Ha 10 years before as against in the non-command area i.e. 20.9 Qtl/Ha, 18.5 Qtl/Ha and 16.5 Qtl/Ha during the three periods respectively.
c) Productivity of other crops such as Jwar, Pulses and Oilseeds had mixed trend during three periods i.e. at present, 5 years and 10 years before in command and non-command area.
d) The productivity of Jwar in Command at present was reportedly 6.8 Qtl/Ha slightly lower than in non-command (6.9 Qtl/Ha) while it was slightly higher (7.6 Qtl/Ha) 5 years before but lower (6.4 Qtl/Ha) 10 years before as against (7.4 and 6.6 Qtl/Ha) in non-Command area.
e) The productivity of Pulses at present in Command was higher (6.7 Qtl/Ha) than in non-command (6.2 Qtl/Ha) but its productivity was reported lower in Command 5 years and 10 years back (6.2 and 6.0 Qtl/Ha) than 7.3 and 6.2 Qtl/Ha in non-command area.
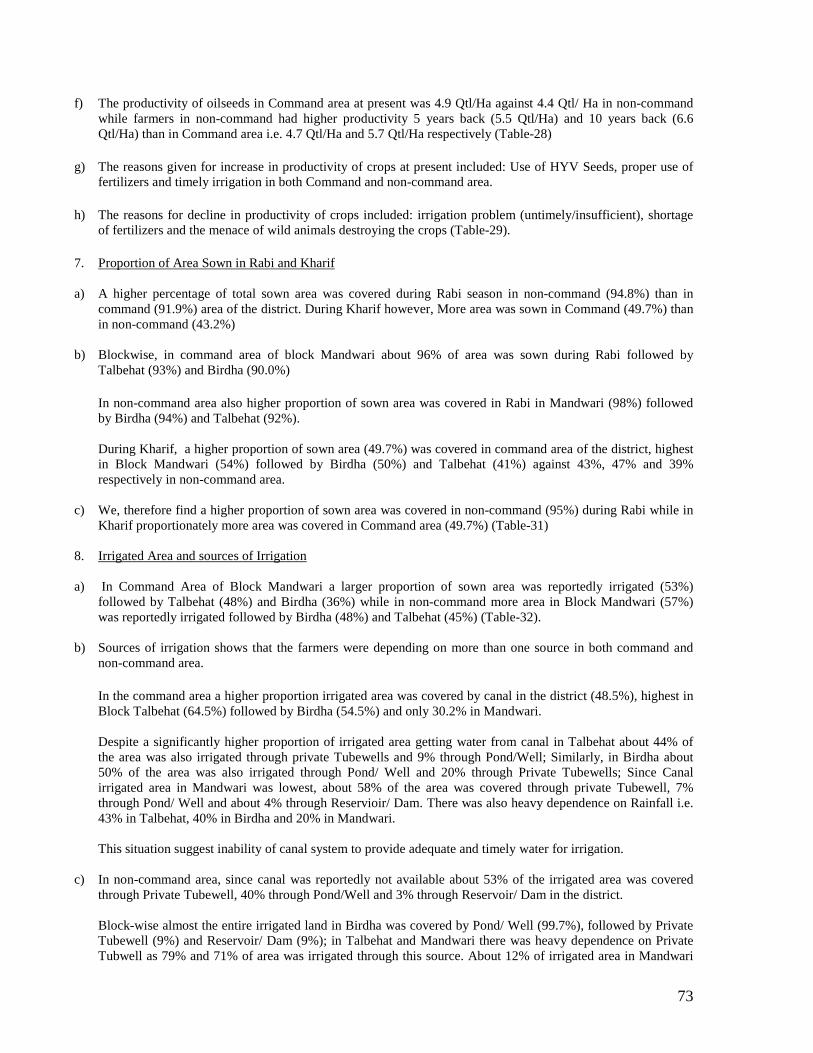
73
f) The productivity of oilseeds in Command area at present was 4.9 Qtl/Ha against 4.4 Qtl/ Ha in non-command while farmers in non-command had higher productivity 5 years back (5.5 Qtl/Ha) and 10 years back (6.6 Qtl/Ha) than in Command area i.e. 4.7 Qtl/Ha and 5.7 Qtl/Ha respectively (Table-28)
g) The reasons given for increase in productivity of crops at present included: Use of HYV Seeds, proper use of fertilizers and timely irrigation in both Command and non-command area.
h) The reasons for decline in productivity of crops included: irrigation problem (untimely/insufficient), shortage of fertilizers and the menace of wild animals destroying the crops (Table-29).
7. Proportion of Area Sown in Rabi and Kharif
a) A higher percentage of total sown area was covered during Rabi season in non-command (94.8%) than in command (91.9%) area of the district. During Kharif however, More area was sown in Command (49.7%) than in non-command (43.2%)
b) Blockwise, in command area of block Mandwari about 96% of area was sown during Rabi followed by Talbehat (93%) and Birdha (90.0%) In non-command area also higher proportion of sown area was covered in Rabi in Mandwari (98%) followed by Birdha (94%) and Talbehat (92%).
During Kharif, a higher proportion of sown area (49.7%) was covered in command area of the district, highest in Block Mandwari (54%) followed by Birdha (50%) and Talbehat (41%) against 43%, 47% and 39% respectively in non-command area.
c) We, therefore find a higher proportion of sown area was covered in non-command (95%) during Rabi while in
Kharif proportionately more area was covered in Command area (49.7%) (Table-31)
8. Irrigated Area and sources of Irrigation
a) In Command Area of Block Mandwari a larger proportion of sown area was reportedly irrigated (53%) followed by Talbehat (48%) and Birdha (36%) while in non-command more area in Block Mandwari (57%) was reportedly irrigated followed by Birdha (48%) and Talbehat (45%) (Table-32).
b) Sources of irrigation shows that the farmers were depending on more than one source in both command and non-command area. In the command area a higher proportion irrigated area was covered by canal in the district (48.5%), highest in Block Talbehat (64.5%) followed by Birdha (54.5%) and only 30.2% in Mandwari. Despite a significantly higher proportion of irrigated area getting water from canal in Talbehat about 44% of the area was also irrigated through private Tubewells and 9% through Pond/Well; Similarly, in Birdha about 50% of the area was also irrigated through Pond/ Well and 20% through Private Tubewells; Since Canal irrigated area in Mandwari was lowest, about 58% of the area was covered through private Tubewell, 7% through Pond/ Well and about 4% through Reservioir/ Dam. There was also heavy dependence on Rainfall i.e. 43% in Talbehat, 40% in Birdha and 20% in Mandwari. This situation suggest inability of canal system to provide adequate and timely water for irrigation.
c) In non-command area, since canal was reportedly not available about 53% of the irrigated area was covered through Private Tubewell, 40% through Pond/Well and 3% through Reservoir/ Dam in the district. Block-wise almost the entire irrigated land in Birdha was covered by Pond/ Well (99.7%), followed by Private Tubewell (9%) and Reservoir/ Dam (9%); in Talbehat and Mandwari there was heavy dependence on Private Tubwell as 79% and 71% of area was irrigated through this source. About 12% of irrigated area in Mandwari

74
and 10% in Talbehat was covered through Pond/Well. Dependence on rainfall in non-command area was lower than in command area. Thus, in both Command and non-command area farmers were depending on more than one source of irrigation including rainfall. (Table-33).
d) Willingness to pay higher Water Tariff: A small proportion of farmers in the command area of district (12.4%) expressed their readiness to pay higher water Tarrif if timely and adequate canal water supply is provided. It was also found that more small than large farmers expressed their willingness to pay higher charges provided the timely and adequate water supply is assured. (Table-34)
e) Position of Irrigation through reservoir/Dam/Canal: The farmers who were solely / mainly depending on irrigation through reservoir / Dam / Canal reported that they could not give all the required number of watering to their crops. In command area only about 80% of the total number of required watering for wheat crop were reportedly given-about 52% were timely and 48% late; 95% of total required waterings for Jwar were given- 84% timely and 16% were late; about 88% of total required watering were given to their Pulses crop and all were late watering. In non-command area about 88% of the total number of required waterings were given to wheat crop-51% timely and 49% were late; Only 76% of the required number of watering for Pulses crop were given-74% timely and 26% were late. Thus, we find dependence on only these sources of irrigation was not at all satisfactory, which adversely affect the productivity. (Table-35).
9. Landholding Size wise Production of Crops, Cost and Income per Ha (in Rs.) a) The average productivity (Qtl/Ha) of Wheat, Jwar and Pulses in command area was lower in Marginal
landholdings (<1 Ha) than in Small (1-2 Ha) and Large (> 2 Ha) landholdings. In case of oilseeds Marginal farmers recorded higher productivity than small and large farmers. It may be due to higher use of fertilizers and adequate irrigation. The expenditure on these two items by Small and Large farmers was negligible/nil.
b) In non-command area, the average productivity of all four crops was lower in Marginal landholdings as compared to Small and Large size of landholdings.
c) The average productivity (Qtl/Ha) of Wheat, Pulses and oilseeds was higher in Command (25.32, 6.72 and 5.15) than in non-command (20.98, 6.22 and 4.29) area while that of Jwar was slightly higher in non-command (6.83%) than in Command (6.45 Qtl/Ha) area.
d) Due mainly to higher productivity the net income per Ha produce (as percent of total price) was higher in Command area in respect of Wheat (41.84%) Pulses (41.13%) and Oilseeds (61.64%) as compared to net income from Produce of Wheat (30.61%), Pulses (31.32%) and oilseeds (59.92%) in non-command. Net Income from Jwar produce per Ha. Was higher in non-command (27.88%) than in Command (22.40%) area due mainly to the same season. (Table-36)
10. Problems in Marketing of Produce Farmers were selling their produce at more than one place as they were not selling their entire produce at one point of time as it depend on the quantity of produce and their need to get cash. A larges proportion of farmers reportedly sold their produce in local market followed by Mandi, Wholesellers / Middleman / Moneylanders in both command and non-command area. Only a few sold their produce at the Procurement Centre.

75
The major problems in marketing of the produce included: a) Low price in local market b) Exploitation by Middlemen / Moneylender c) Lack of procurement Centre at Convenient distance d) Long distance of mandi e) High cost of transportation to long distance procurement Centre and Mandi. (Table-37)
11. Use of Fertilizer and Pesticide Per Hectare
a) The farmers were using chemical and Bio-fertilizer and Chemical Pesticide in the district (Bio-Pesticide used
only in Block Mandwari)
b) The average quantity of Bio-fertilizer used per Ha was higher (339.9 Kg.) than the quantity of Chemical fertilizer (282.8 Kg) in command and non command (334.5 Kg and 264.7 Kg respectively) area both.
c) The quantity of chemical as well as Bio-fertilizer per Ha. Was higher in command than in the non-command area.
d) The average quantity of chemical Pesticide used in Command area was also higher (17.5 Kg/Litre) than in non-command area (7.0 Kg/Litre).
e) The highest quantity of Bio fertilizer and Chemical Pesticide were used in Block Mandwari in both Command and non-Command area, Bio-fertilizer @ 376.9 Kg in Command and 389.5 Kg in non-command and chemical Pesticide @ 46.2 Kg/Litre in Command and 15.3 Kg/Litre in non-Command which were very high as compared to other Blocks. (Table-39)
12. Major Problems Related to Agriculture and Irrigation and Probable reasons:
a) The farmers informed about five problems that they were facing with regard to agriculture. Their problems as well as the probable reasons were common in both Command and non-command area which included:
Problems Probable Reasons % of Respondents Command Non-Command
1. Seed Quality Shortage of HYV Seeds 90.8 94.6 2. Fertilizer Problem Shortage 71.4 87.5 3. Stray Animals Due to Anna Pratha 90.8 81.0 4. Loss of Animals Wild Animals Close to forest
Attack 74.5 80.4
5. Low Productivity Loss of Soil Fertility 53.1 66.1
b) Although cause of low productivity has been mentioned as loss of soil fertility yet it is a due to shortage of HYV seeds and fertilizer as well as loss of soil fertility.
c) The menace of stray animals due to Anna Pratha destroy a considerable part of crops while there is no check on them to prevent the loss due to social practice as well as the influence of owners of such cattle.
d) There was reportedly considerable loss of cattle due to their killing by wild animals around the forest area.
As regards the major problems that farmers were facing in relation to irrigation, the common problems in both command and non-command area were:
Problems Probable Reasons % of Respondents Command Non-Command
1. Electricity Regular Power failure 96.9 82.1 2. Water Level Deep Ground Water Level 83.7 76.8 3. Water Supply Untimely Supply 85.7 73.8

76
Problems Probable Reasons % of Respondents Command Non-Command
4. Irrigation Equipment Lack of proper Equipment 79.6 71.4
5. High Cost of Irrigation Due to Heavy dependence on Tubewell
76.5 64.3
Regular Power failures causes not only hardship but increases dependence on Diesel run Tubewells, which enhances cost of irrigation. Due to untimely supply of canal water dependence on tubewell further increases or else the crops suffer. Shortage of irrigation equipment needs financial investment for which the farmers were not capable, while cheap irrigation through wells was difficult due to ground water level being very deep. (Table-40). 13. Water Users Association/ Arrangement for Distribution of Canal Water There was no Water Users Association in the district. In command area only two respondents reported that they discuss about sharing of canal water with fellow farmers; None reported about any type of arrangement for distribution of canal water; there was no role of farmers in recording of irrigation through canal; and that they reported that repair of canal was undertaken neither annually nor season-wise. They had also no knowledge about the fine imposed on any one for unauthorised use of Canal water or any case filed on canal crime. (Table-41, 42, 43 and 49) 14. Working of NGOs in the district None of the respondents in Command area had any knowledge of the NGOs working in their area while 6 respondents in non-command (5 in Block Talbehat and 1 in Mandwari) knew the NGOs in their area. Among the 6 respondents 5 also reported their families had benefited from the activities of the NGOs. Thus, activities of the NGOs seems to be limited. (Table-52) 15. Self-Help Groups A total of 9 respondents, 5 in Command and 4 in non-command informed about the existence of Self-Help Groups in their area. These SHGs were working for improvement in Animal Husbandry and some were also helping their members for small business. None of the family members of the respondents were, however, associated with the SHGs. It, therefore suggest their area of activities was limited (Table-53 & 54). 16. Contact with Officials of Irrigation Department
a) When enquired whether the respondents maintain contact with any officials of the Irrigation Department only 2 in Command and 4 in non-command reported they maintain contacts with the Seenchpal, particularly when they do not get sufficient water for irrigation. (Table-56, 57)
17. Environment-Disposal of Garbage
a) It seems people were not particular in dumping garbage at some specific place. They were, therefore, throwing it wherever they desired. Most of them were however, throwing it on dump site in the village (93% in Command and 89% in non-command), 31% in command and 17% in non-command were also throwing it near their home; 29% in command and 35% in non-command were throwing it in the field while 8% in command and 11% in non-command were dumping it in pond.
The above practice result in breeding of mosquitoes / flies (55% in command and non-command each), dirty environment (58% in command, 35% in non-command), foul smell (33% in command 39% in non-command), and prevalence of Malaria (16% and 22% respectively) (Table-58)
b) A sizeable section of respondents reported that they also use garbage for preparing fertilizer (38% in Command and 36% in non-command). It seems only a part of Garbage was used for this purpose which was thrown at dumpsite. (Table-59).

77
18. Health conditions
a) Average monthly Expenses on Medical treatment of all family members and exclusively on women shows that a higher proportion of expenses were incurred on treatment of women members in both command (50.3%) and non command (53.1%) area.
Average monthly expenses on treatment of women were significantly higher in Block Mandwari and Talbehat than in Block Birdha in both command and non-command area (Table-60). b) Higher average monthly expenses on treatment of women was probably because proportionately more
women than men had suffered from certain diseases in the last two years in both command (14% against 12% of men) and non-command (15% against 13% of men) area. (Table-61)
c) Out of those who suffered from certain diseases in Command area 24% men and 14% women suffered
from Typhoid (significantly higher proportion of both in Block Mandwari); 7% of men and 12% of women were affected by Cholera/ Diarrhoea (significantly higher proportion of both in Mandwari); 20% of men and 33% of women suffered from Malaria (a very high proportion of both in Block Talbehat); 13% of men and 7% of women suffered from whoping cough (a higher proportion of both in Block Birdha) while 20% of men and 19% of women were affected by some skin disease (significantly higher proportion of both in Block Birdha and Talbehat).
In non-Command area, of those who suffered from certain diseases 18% of men and 20% of women suffered from Typhoid (a higher proportion of both in Block Talbehat) ; 18% of men and 21% of women suffered from Malaria ( a high proportion of both in Talbehat); 12% of men and 16% of women suffered from whoping cough (significantly higher proportion of both in Block Mandwari and Birdha; and 25% of men and 22% of women were affected by skin diseases (significantly higher proportion of both in Birdha). (Table-62) Thus, most common diseases which affected a significant proportion of men and women in both command and non-command area were Typhoid, Malaria, Whoping cough and some skin diseases which were related to quality of drinking water, sanitation/ environmental pollution. 19. Families Benefitted from Government Programmes The respondents were enquired about the benefit their families received from the government programmes in the area of Agriculture, Irrigation and Poverty Alleviation. They had no knowledge of the Government programmes related to Agriculture and Irrigation. As regards programmes related to Poverty Alleviation people mentioned only MNREGA. The proportion of beneficiary families was 73% in Command and 69% in non-command area. The proportion of beneficiary families in Block Talbehat was lowest in both Command (47%) and non-command (43%) area. Most of the respondents from beneficiary families expressed dissatisfaction from the benefits that they received under MNREGA. The reasons may be:
a) Wages under MNREGA were lower than prevailing market rates, and b) There were some problems in Management of the programme as they complained about irregular payment
period. (Table-63) 20. Conditions of Women Earning Women and their Average Annual Income: A total of 19 i.e. about 17% of the women interviewed in Command and 27 i.e. 14% in non-command area were earning members in their families, mostly working as labour as 14 in command and 23 in non-command were earning through this source. The proportion of earning women was lowest in Block Talbehat, both in Command (10%) and non-command (6%).

78
A total of 4 women in Command and 3 in non-command had an average annual income from Agriculture amounting to Rs. 35788/- and 36417/- respectively while 14 in command and 23 in non-command had average annual income of Rs. 8743/- and 9887/- respectively from labour. One women each in the command and non-command was earning through service with an annual income of Rs. 48000/- and Rs. 45000/- respectively. (Table-64). Family Land in Khatauni (Revenue Record): Out of 98 families of farmers in Command and 168 in non-command, family land was recorded in Khatauni in the name of women in 4 household of command and 3 in non-command. Thus, most of families had land ownership in the name of male members. (Table-65). School Going Boys and Girls in Age Group 7-14 Years: There were 114 boys in age group of 7-14 years in Command and 177 in non-command area and all of them were reportedly attending school. Among a total of 94 girls in command 62 (66%) and out of 123 in non-command 88 (72%) were attending school. Thus a sizeable proportion of girls i.e. 34% in Command and 28% in non-command area were out of school. (Table-66) Average Expenses on Education of children’s: The average per child annual expenditure on education of boys in command area was significantly higher (Rs. 3211/-) as compared to expenses on girls (Rs. 2454/-). Expenses on girls education were significantly lower in Block Talbehat i.e. Rs. 1847/- and Birdha i.e. Rs. 2453/- than on boys education i.e. Rs. 3591/- and Rs. 2982/- respectively. In non-command area, however, average annual expenses on girls education were reported higher (Rs. 2883/-) than on boys (Rs. 2620/-). Block wise expenses on girls education were significantly higher in Mandwari (Rs. 3273/-) than on boys (Rs. 2380/-) while in Birdha expenses on girls was considerably low (Rs. 1724/-)as against on boys (Rs. 2451/-) (Table-67) Education upto Class VIII (7-14 age group) is free alongwith books and mid-day meal in public schools. The average monthly expenses of Rs. 268/- on boys Rs. 205/- on girls in command and Rs. 218/- on boys and 240/- on girls suggest that either due to non availability of public school in or around the village or the families of small and large farmers were preferring to send their children to private school in anticipation of Quality education. Problems in Girls Education: A total of 72 (65%) of families in Command and 109 (57%) in non-command had girls in the school going age. They were asked about the problems that they face in continuing education of girls. A larger proportion of them in command and non-command (43% and 49% respectively) mentioned the problem of transport, suggesting that girls were to go out of the village; about 15% of respondents in Command and 19% in non-command mentioned lack of school in the village; 15% in command and 10% in non-command cited the problem of their poverty; early marriage as a constraint was mentioned about 18% in non-command while about 26% in command and 4% in non-command had no specific reason, indicating their lack of interest in the education of girls. (Table-68) Agricultural Work Done by Women: Most of the women engaged in agricultural work were working for cultivation/weeding in Command (81%) and non-command (76%) area. A significant proportion of women taking-up sowing (35% and 36% in command and non-command respectively); Crop-Storage (33% and 14% in command and non-command respectively); and Harvesting (15% and 9% respectively), Thus, they were engaged in multiple agricultural activities (Table-69).
Care of Livestock: Care of livestock in the families was reportedly joint responsibility of Men and women in both command (95%) and non-command (91%) area. (Table-71) Time spent by women in Household Activities: Average number of hours per day spent by women respondents in household activities were reportedly 8.33 in Command and 8.31 in non-command area. Their activities included cooking, care of livestock, fetching water, collecting fuel wood, unpaid work on own farm and other household activities. For fetching water about 0.55 hours was spent in command and 1.16 hour in non-command while for collecting fuel wood they were spending 1.00 hour in command 1.51 hour in non-

79
command area. Care of Livestock was taking 1.00 hour in command and 0.58 hour in non-command area. (Table-72) Difference in working conditions of men and women
a) The workers, Men and women both were earning wages from agricultural and non-agricultural work. The average number of working days of Men was 151/ year in Command and 183/ year in non-command. Women were getting work in both agricultural and non-agricultural activities for 124 days / year in command 108 / year in non-command area.
b) Average rate of daily wages of women workers in both agriculture (Rs. 94/-) and non-agriculture work (Rs. 116/-) against wages for men (Rs. 106/- and Rs. 135/- respectively) in command were lower. Similarly in non-command, they were getting average daily wages of Rs. 80/- for agricultural and Rs. 115/- for non-agricultural work as against men getting an average daily wage of Rs.97/- and Rs. 132/- respectively. (Table-73).
Average Annual Saving of Women from their Income
a) There were 19 (17.3%) women respondents in command and 27 (14.2%) in non-command who were earning members. Among them 12 in command had an average annual saving of Rs. 1063/- In non-command out of 27 earning women 10 reported by had average saving of Rs. 4943/- per year (Table-75)
b) The earning women members were reportedly sharing family expenses on Health, Food, clothes and Education of children. A significantly higher proportion of them were sharing family expenditure on Health and Education of children in both Command and non-command area (Table-76)
Association with SHG and Voluntary Agencies: Only one women respondent in Command area of Block Talbehat was member of Self Help Group (SHG) benefitted by Rs. 1000/- per year. None in non-command was associated with the SHG. (Table-77) Only 1 women respondent in Command area of Block Talbehat was associated with a voluntary agency for community service, engaged in Training of Sewing. (Table-78) Get Reasonable Importance as Member of Panchayat & WUA: There were no WUA in the District. None of the Women respondents in Command was members of village Panchayat. In non-Command area one respondent each in Block Mandwari and Talbehat were Panchayat member. The Panchayat member in Block Talbehat was getting reasonable importance in the meetings while the other one in Mandwari had a negative experience. (Table-79) Social Problems that Affect Women: A large majority of women respondents (92%) complained of low status of women in their family in both command and non command area. About 35% in non-command complained about alcoholic husband, 30% regarding violence against women, 28% about Strict behaviour of In-laws, and 27% complained about insecure village environment. The proportion of women complaining about same was lower in Command i.e. 16.4%, 16.4%, 18.2% and 16.4% respectively. (Table-80) Voting in Elections for Village Panchayat/ Vidhan Sabha/ Lok Sabha: A large majority of Women respondents reportedly voted in elections in both command (94.5%) and non-command (95.3%) area which indicate a higher degree of consciousness about the importance of elections. (Table-81)
3.4 Socio-Economic Baseline Status of Bundelkhand & Lalitpur district based on primary Survey based on Focussed Group Discussions (FGD)
3.4.1 Socio-Economic Baseline Status of Bundelkhand based on Focussed Group discussion

80
The focused group discussion was carried out between 02nd April 2012 and 07th May, 2012 in all districts of UP Bundelkhnad. Some Significant Findings of focused group discussion in U.P. Bundhelkhand districts are given below.
Sl. No. Finding Lalitpur Jhansi Jalaun Hamirpur Mahoba Banda Chitarakoot
1. % Sown Area in Rabi
90% 67% 99% 97% 100% (70-75%) under Oil seeds Pulses
90% 60%
2. % Sown Area in Karif
50% 33% 29% 26% 42% 30% 40%
3. % Sown Area Irrigated
90% 80% 64% 80% 63% 60% 26% (65% Rain fed )
4. Source of Irrigation
Tube well (Private)
57% 10% 30% 56% 20% 70% 67%
System Canal 28% 70% 68% 36% 30% 20% 20% Dug well 10% - - - 50% - - Pond & Other 5% - 2% 8% - 10% 13%
5. Damage of crop due to Anna Pratha
20% 15% 15-20% 30-40% & 60% Horticulture Saplings
25-30% 40% of Sampling destroyed loss of crop about 30%
15-20% Crop Damage
6. Horticulture under National Horticulture Mission
Guava, awonla , lemon, Mango
Guava , Awonla lemon, turmeric, ginger Due to shortage of storage facilities about 35% produce is destroyed
- Awonla, Guava, lemon, mosmi
Guava, orange, mosmi, lemon
Guava, awonla, lemon, keenu, orange & Floriculture
Guava, citrus , Awonla
7. Forest Cover 14% - - 24010 Ha 5.5% - 21% 8. Medicinal
Species in forest area
About 50 - - - - - Mahua Bel Fruit
9. Major Source of Drinking water
India Mark II
India Mark II
Piped / India Mark II
Through Jal Nigam Schemes / India Mark II
India Mark II, Hand Pumps (50% out
1. 60 water supply schemes in
1. India mark II
2. 23-24 water supply
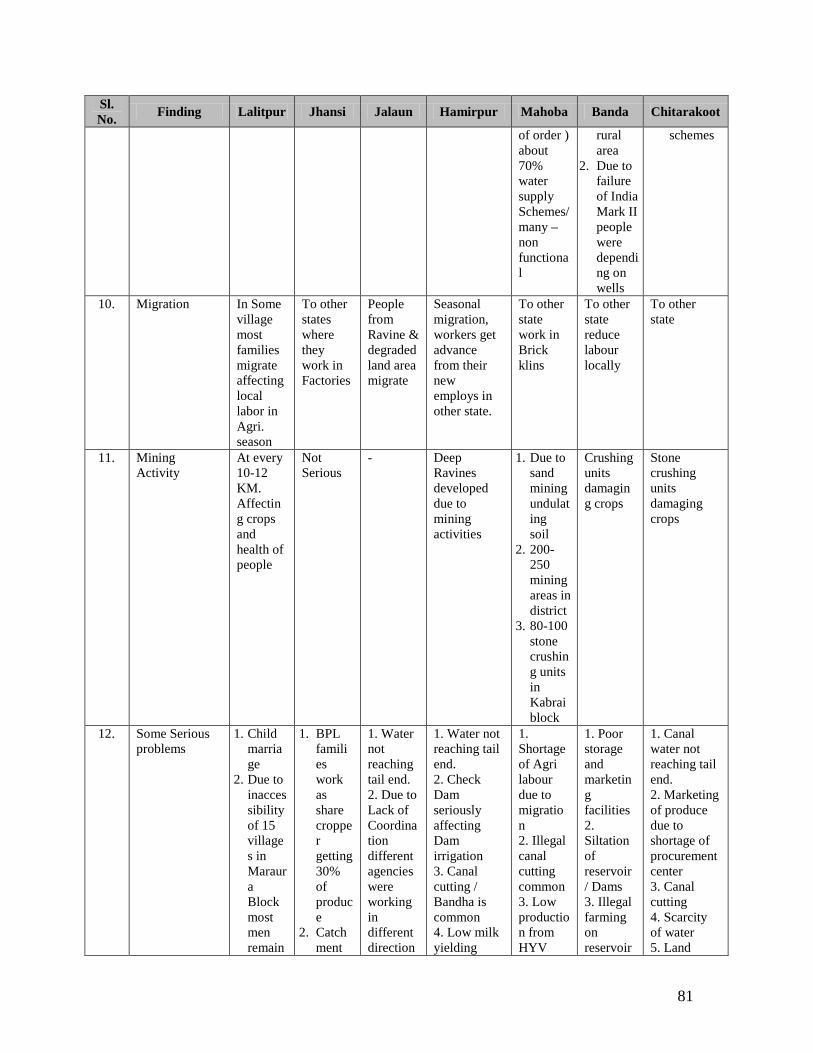
81
Sl. No. Finding Lalitpur Jhansi Jalaun Hamirpur Mahoba Banda Chitarakoot
of order ) about 70% water supply Schemes/many –non functional
rural area
2. Due to failure of India Mark II people were depending on wells
schemes
10. Migration In Some village most families migrate affecting local labor in Agri. season
To other states where they work in Factories
People from Ravine & degraded land area migrate
Seasonal migration, workers get advance from their new employs in other state.
To other state work in Brick klins
To other state reduce labour locally
To other state
11. Mining Activity
At every 10-12 KM. Affecting crops and health of people
Not Serious
- Deep Ravines developed due to mining activities
1. Due to sand mining undulating soil
2. 200-250 mining areas in district
3. 80-100 stone crushing units in Kabrai block
Crushing units damaging crops
Stone crushing units damaging crops
12. Some Serious problems
1. Child marriage
2. Due to inaccessibility of 15 villages in Maraura Block most men remain
1. BPL families work as share cropper getting 30% of produce
2. Catchment
1. Water not reaching tail end. 2. Due to Lack of Coordination different agencies were working in different direction
1. Water not reaching tail end. 2. Check Dam seriously affecting Dam irrigation 3. Canal cutting / Bandha is common 4. Low milk yielding
1. Shortage of Agri labour due to migration 2. Illegal canal cutting common 3. Low production from HYV
1. Poor storage and marketing facilities 2. Siltation of reservoir / Dams 3. Illegal farming on reservoir
1. Canal water not reaching tail end. 2. Marketing of produce due to shortage of procurement center 3. Canal cutting 4. Scarcity of water 5. Land

82
Sl. No. Finding Lalitpur Jhansi Jalaun Hamirpur Mahoba Banda Chitarakoot
unmarried
3. Hooch distilleries common
4. Water not reaching tail end
area of major Dams dependent on Madhya Pradesh
3. Water regulation in M.P. may pose serious problem for Jhansi, Jalaun & Hamirpur
3. Poor warehousing facilities for storage of food grains. 4. High S.C. Population (27%), mostly working as Landless labour 5.49% BPL families
cattle seeds supplied by Agriculture Department
and river beds. 4. Use of banned pesticides 5. Safe drinking water
grabing by powerful people. 6. There was no water in Dam / Reservoir in last 2 years, in current year 50% filling
13. Fisheries Reservoirs
91 Ponds in 531 ha
- - 403 Ponds of 0.2 to 5 Ha under village panchayat
18 Large Ponds about 150 small ponds
Scope of fisheries after desilting of ponds
In about 200 Ha
14. Health- Diseases
Malaria, Typhoid, Diarrohea
Malaria, T.B. Hypatitis, Dirrohea, Typhoid
Dirrohea, malaria
Dirrohea, dehyderation, Malaria,, Filaria, T.B.
Dirrohea, Malaria, Typhoid, Viral fever, Silicosis, Skin diseases Lack of health consciousness for safe drinking water, Sanitation
T.B., HIV, Malaria, Colitis
Dirrhoea, T.B., Skin Disease, Malaria
3.4.2 Socio-Economic Baseline Status of Lalitpur district based on Focussed Group discussion
Meeting held on 07.05.2012 under the chairmanship of Shri Upendra Kumar, Executive Engineer, Sinchai Khand, Lalitpur and attended by 15 senior officials of different departments including Irrigation, Jal Nigam, District

83
Development Office, PWD, Health, Forest, Minor Irrigation and Blocks. The discussion yielded the following information about the conditions in the district:
1. Net Sown Area 2.99 Lakh Hectare Area under Rabi 2.68 Lakh Hectare Area under Kharif 1.50 Lakh Hectare
2. Major crops in Rabi were Wheat, Gram, pulses and Mustard. In Kharif Pulses, Maize, Til, Groundnut, Jwar and Soyabeen.
3. About 90% of net sown area was irrigated. Major source of irrigation was private Tubewells (57%) followed by System Canal (27.45%) Dugwell (10.5%) and Ponds (5%) Ponds were many in villages.
4. About 50% of the total irrigated area served by Minor Irrigation System. 5. Canal Water was not reaching in a substantial part of Tail end due to illegal cutting of Canal/Minor, over
use of water at head and middle ends, frequent changes in cropping pattern. 6. The electricity supply is very low in the district which leads to untimely watering. 7. Generally farmers use HYV seeds but a significant proportion of them used a local variety of wheat seed
(Katia) as it does not require many watering. 8. Since there is no practice of making mud boundry around the farms due to which water does not remain in
farms. 9. There were no fodder machines in Lalitpur. 10. The menace of Anna Pratha practice, common in all the districts of Bundelkhand was seriously damaging
crops in Lalitpur also. It was estimated that atleast 20% of crops and about 30% of fruit saplings were destroyed by the stray cattles left by their owners to graze. The damage was more in Kharif.
11. Under Swarn Jayanti Gram Rozgar Yojana people are encouraged to purchase good quality cattle. It was thought that the population of unproductive cattle can be checked if good quality and high yielding cattle are brought.
12. The district has 8 BAIF centres who are engaged in improved breeding. They also bring good quality cattle from other states.
13. The district has a large number (aprox. 50) of medicinal species in the forest area. The varity of small medicinal trees are Bhangraj, Bhum amla, Shankh pushpi, Safed Musli, Shatabar, Harjor, Ashwgandha, Arusa, Thuar, etc. The tall verities of trees are Gudmarg, Amla, Bel, Beejasal, Mahua, Duddhi, Neem, Jamun, Arjun, Reetha, etc.
14. Arjun, Shankh pushpi and Jamun are found in abundance on both sides of river, canal and drains in the district.
15. Hooch distilleries are very common in the district. They are located even at road side. People engaged in this activity were not ready to leave this profession as the earnings through it were substantial.
16. People spend a large part of their earnings on alcohol and Biri Smoking. 17. Men are generally lazy. They spend their time in drinking alcohol and in playing cards. They work for a
few days and till the earning is exhausted they will not work to earn while women in the area were hard working.
18. About one third of the families in rural areas were living below the poverty line. 19. The average family size is about 8-10 person which leads to population growth in the district. 20. Under national horticulture Mission free saplings of Guava, Awonla, Lemon and Mango are given to
farmers. Guava and Awonla are giving good return after about four years and a net income of about Rs. 70000/- per hectare was estimated from their crops.
21. The successful demonstration of horticulture crops was in village Palaura of Block Jakhaura. 22. There was no problem of availability of labour for working under MNREGA. 23. Labour engaged under MNREGA are used for levelling of farms of Marginal and Small farmers. They are
also engaged for plantation of Awonla and Guava trees and in crops of vegitables and spices. 24. Use of chemical fertilizer was increasing but farmers were still using organic fertilizer more. 25. There were 91 ponds in an area of about 531 Hectare in the district for which Patta for fisheries was given.
Besides, a large number of private ponds also exist. The production of fish in community ponds was between 20-25 Qtl/Ha while in private ponds average production was about 30 Qtl/Ha.
26. Besides local consumption fish was also exported to Jhansi, Lucknow and Gorakhpur.
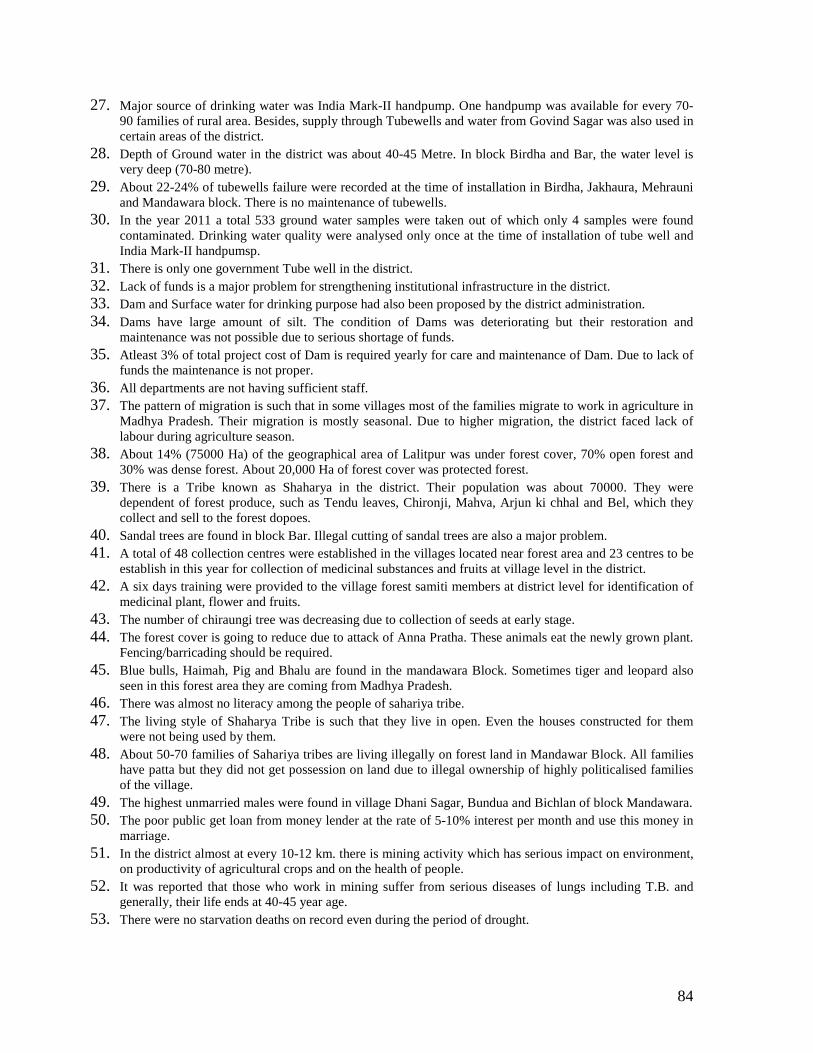
84
27. Major source of drinking water was India Mark-II handpump. One handpump was available for every 70-90 families of rural area. Besides, supply through Tubewells and water from Govind Sagar was also used in certain areas of the district.
28. Depth of Ground water in the district was about 40-45 Metre. In block Birdha and Bar, the water level is very deep (70-80 metre).
29. About 22-24% of tubewells failure were recorded at the time of installation in Birdha, Jakhaura, Mehrauni and Mandawara block. There is no maintenance of tubewells.
30. In the year 2011 a total 533 ground water samples were taken out of which only 4 samples were found contaminated. Drinking water quality were analysed only once at the time of installation of tube well and India Mark-II handpumsp.
31. There is only one government Tube well in the district. 32. Lack of funds is a major problem for strengthening institutional infrastructure in the district. 33. Dam and Surface water for drinking purpose had also been proposed by the district administration. 34. Dams have large amount of silt. The condition of Dams was deteriorating but their restoration and
maintenance was not possible due to serious shortage of funds. 35. Atleast 3% of total project cost of Dam is required yearly for care and maintenance of Dam. Due to lack of
funds the maintenance is not proper. 36. All departments are not having sufficient staff. 37. The pattern of migration is such that in some villages most of the families migrate to work in agriculture in
Madhya Pradesh. Their migration is mostly seasonal. Due to higher migration, the district faced lack of labour during agriculture season.
38. About 14% (75000 Ha) of the geographical area of Lalitpur was under forest cover, 70% open forest and 30% was dense forest. About 20,000 Ha of forest cover was protected forest.
39. There is a Tribe known as Shaharya in the district. Their population was about 70000. They were dependent of forest produce, such as Tendu leaves, Chironji, Mahva, Arjun ki chhal and Bel, which they collect and sell to the forest dopoes.
40. Sandal trees are found in block Bar. Illegal cutting of sandal trees are also a major problem. 41. A total of 48 collection centres were established in the villages located near forest area and 23 centres to be
establish in this year for collection of medicinal substances and fruits at village level in the district. 42. A six days training were provided to the village forest samiti members at district level for identification of
medicinal plant, flower and fruits. 43. The number of chiraungi tree was decreasing due to collection of seeds at early stage. 44. The forest cover is going to reduce due to attack of Anna Pratha. These animals eat the newly grown plant.
Fencing/barricading should be required. 45. Blue bulls, Haimah, Pig and Bhalu are found in the mandawara Block. Sometimes tiger and leopard also
seen in this forest area they are coming from Madhya Pradesh. 46. There was almost no literacy among the people of sahariya tribe. 47. The living style of Shaharya Tribe is such that they live in open. Even the houses constructed for them
were not being used by them. 48. About 50-70 families of Sahariya tribes are living illegally on forest land in Mandawar Block. All families
have patta but they did not get possession on land due to illegal ownership of highly politicalised families of the village.
49. The highest unmarried males were found in village Dhani Sagar, Bundua and Bichlan of block Mandawara. 50. The poor public get loan from money lender at the rate of 5-10% interest per month and use this money in
marriage. 51. In the district almost at every 10-12 km. there is mining activity which has serious impact on environment,
on productivity of agricultural crops and on the health of people. 52. It was reported that those who work in mining suffer from serious diseases of lungs including T.B. and
generally, their life ends at 40-45 year age. 53. There were no starvation deaths on record even during the period of drought.
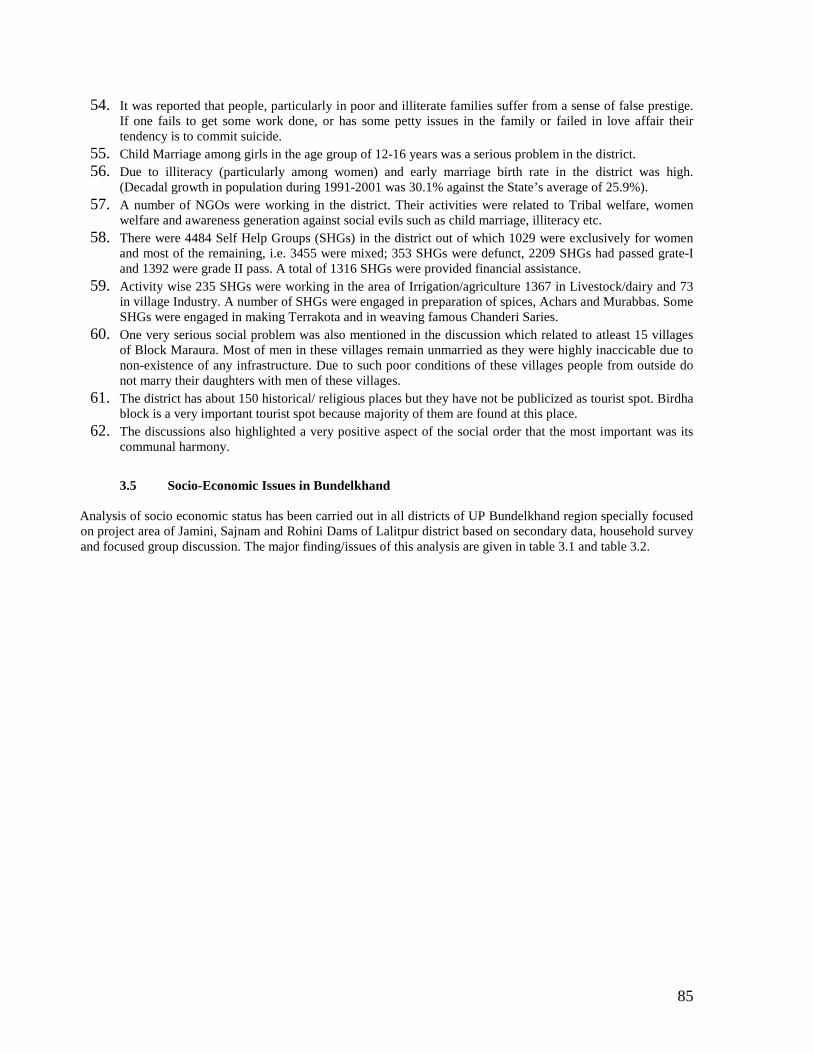
85
54. It was reported that people, particularly in poor and illiterate families suffer from a sense of false prestige. If one fails to get some work done, or has some petty issues in the family or failed in love affair their tendency is to commit suicide.
55. Child Marriage among girls in the age group of 12-16 years was a serious problem in the district. 56. Due to illiteracy (particularly among women) and early marriage birth rate in the district was high.
(Decadal growth in population during 1991-2001 was 30.1% against the State’s average of 25.9%). 57. A number of NGOs were working in the district. Their activities were related to Tribal welfare, women
welfare and awareness generation against social evils such as child marriage, illiteracy etc. 58. There were 4484 Self Help Groups (SHGs) in the district out of which 1029 were exclusively for women
and most of the remaining, i.e. 3455 were mixed; 353 SHGs were defunct, 2209 SHGs had passed grate-I and 1392 were grade II pass. A total of 1316 SHGs were provided financial assistance.
59. Activity wise 235 SHGs were working in the area of Irrigation/agriculture 1367 in Livestock/dairy and 73 in village Industry. A number of SHGs were engaged in preparation of spices, Achars and Murabbas. Some SHGs were engaged in making Terrakota and in weaving famous Chanderi Saries.
60. One very serious social problem was also mentioned in the discussion which related to atleast 15 villages of Block Maraura. Most of men in these villages remain unmarried as they were highly inaccicable due to non-existence of any infrastructure. Due to such poor conditions of these villages people from outside do not marry their daughters with men of these villages.
61. The district has about 150 historical/ religious places but they have not be publicized as tourist spot. Birdha block is a very important tourist spot because majority of them are found at this place.
62. The discussions also highlighted a very positive aspect of the social order that the most important was its communal harmony.
3.5 Socio-Economic Issues in Bundelkhand Analysis of socio economic status has been carried out in all districts of UP Bundelkhand region specially focused on project area of Jamini, Sajnam and Rohini Dams of Lalitpur district based on secondary data, household survey and focused group discussion. The major finding/issues of this analysis are given in table 3.1 and table 3.2.
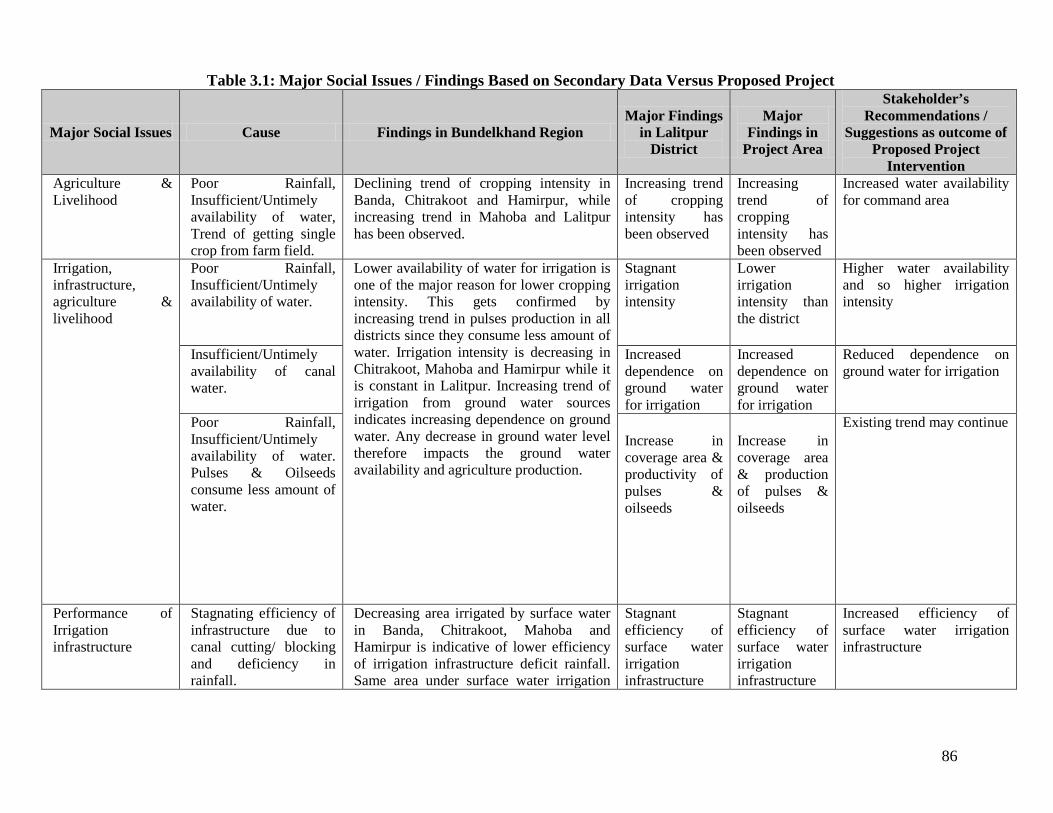
86
Table 3.1: Major Social Issues / Findings Based on Secondary Data Versus Proposed Project
Major Social Issues Cause Findings in Bundelkhand Region Major Findings
in Lalitpur District
Major Findings in
Project Area
Stakeholder’s Recommendations /
Suggestions as outcome of Proposed Project
Intervention Agriculture & Livelihood
Poor Rainfall, Insufficient/Untimely availability of water, Trend of getting single crop from farm field.
Declining trend of cropping intensity in Banda, Chitrakoot and Hamirpur, while increasing trend in Mahoba and Lalitpur has been observed.
Increasing trend of cropping intensity has been observed
Increasing trend of cropping intensity has been observed
Increased water availability for command area
Irrigation, infrastructure, agriculture & livelihood
Poor Rainfall, Insufficient/Untimely availability of water.
Lower availability of water for irrigation is one of the major reason for lower cropping intensity. This gets confirmed by increasing trend in pulses production in all districts since they consume less amount of water. Irrigation intensity is decreasing in Chitrakoot, Mahoba and Hamirpur while it is constant in Lalitpur. Increasing trend of irrigation from ground water sources indicates increasing dependence on ground water. Any decrease in ground water level therefore impacts the ground water availability and agriculture production.
Stagnant irrigation intensity
Lower irrigation intensity than the district
Higher water availability and so higher irrigation intensity
Insufficient/Untimely availability of canal water.
Increased dependence on ground water for irrigation
Increased dependence on ground water for irrigation
Reduced dependence on ground water for irrigation
Poor Rainfall, Insufficient/Untimely availability of water. Pulses & Oilseeds consume less amount of water.
Increase in coverage area & productivity of pulses & oilseeds
Increase in coverage area & production of pulses & oilseeds
Existing trend may continue
Performance of Irrigation infrastructure
Stagnating efficiency of infrastructure due to canal cutting/ blocking and deficiency in rainfall.
Decreasing area irrigated by surface water in Banda, Chitrakoot, Mahoba and Hamirpur is indicative of lower efficiency of irrigation infrastructure deficit rainfall. Same area under surface water irrigation
Stagnant efficiency of surface water irrigation infrastructure
Stagnant efficiency of surface water irrigation infrastructure
Increased efficiency of surface water irrigation infrastructure

87
Major Social Issues Cause Findings in Bundelkhand Region Major Findings
in Lalitpur District
Major Findings in
Project Area
Stakeholder’s Recommendations /
Suggestions as outcome of Proposed Project
Intervention and stagnating irrigation intensity during last decade in Lalitpur is indicative of stagnating efficiency of irrigation infrastructure which may not be able to cater to increasing cropping intensity and increasing area under main crops in the district.
i.e. Dams & Canal System
i.e. Dams & Canal System
Shift in occupational pattern & livelihood
Lower wages of agriculture labour than non-agriculture labour, Insufficient storage facility of agriculture produce, Poor condition of roads/ connectivity of marketing, Majority of farmers not getting benefits of minimum support price of agriculture produce.
Declining trend in labor force for agriculture and increasing trend in marginal workers is indicative of declining opportunities in agriculture. Therefore, agriculture and allied activities as well as major source of livelihood is decreasing.
Changes in occupational patterns to areas other than agriculture allied activities
Increase in number of marginal workers
Increased opportunity in agriculture
Shift in occupational pattern & livelihood
Fragmentation of families and buy agriculture land by marginal farmers/ landless from small and large farmers.
Increase in marginal farmers, while decrease in small & large farmers
Increase in marginal farmer while decrease in small & large farmers
Increase in marginal farmers while decrease in small & large farmers
Due to fragmentation of land holding, this trend may continue even when increased opportunity in agriculture is anticipated.
Awareness & capacity building
Financial support by government through various schemes and programmes for education, Increased awareness regarding
Increasing literacy rate (both male and female) in all the districts is an indicator of increasing level of primary skill, which could be used for other sources of livelihood.
Increased literacy rate
Increased literacy rate
Additional opportunity in agriculture may generate additional income to overcome constraint of funds for literacy.

88
Major Social Issues Cause Findings in Bundelkhand Region Major Findings
in Lalitpur District
Major Findings in
Project Area
Stakeholder’s Recommendations /
Suggestions as outcome of Proposed Project
Intervention education,
Awareness & capacity building
Financial support by government through various schemes and programmes for education, Increased awareness regarding girls education,
Gender gap in literacy is also decreasing in all districts except for Lalitpur, where it is increasing. Increased literacy rate further indicates increasing assimilative capacity of population for near interventions, which could be related to agriculture practices / techniques, water management / water distribution, governance and equity as envisaged in the project.
Increased gap in gender literacy
Increased gap in gender literacy
Additional opportunity in agriculture may generate additional income to overcome constraint of funds for literacy.
Shift in occupational pattern & livelihood, migration
Limited opportunity in agriculture, Low wages, Insufficient storage facility of agriculture produce, farmers not getting benefits of minimum support price of agriculture produce.
Decline in proportion of farmers & agriculture labour in main workers
Decline in proportion of farmers & agriculture labour in main workers
Decline in proportion of farmers & agriculture labour in main workers
Additional opportunity in agriculture due to project may arrest the current declining trend.
Shifting in occupational pattern & livelihood, migration
Migration for livelihood opportunities in other areas.
Banda and Hamirpur show declining trend in population growth, while population density is increasing in all districts. ST population is negligible in Banda, Chitrakoot and Lalitpur. Except for Chitrakoot, where it is constant, SC population is decreasing in all other districts. This could be attributed to migration due to livelihood opportunities in other areas. ST population is constant in Mahoba and increasing in Hamirpur.
Decreasing SC population due to migration
Decreasing SC population due to migration
Additional opportunity in agriculture due to project may arrest the current declining trend.
Livelihood Rigidity in traditional style of living and poor income opportunities due to limited source.
ST population is negligible & depends on forest produce
ST population is negligible & depends on forest produce
Project is not applicable
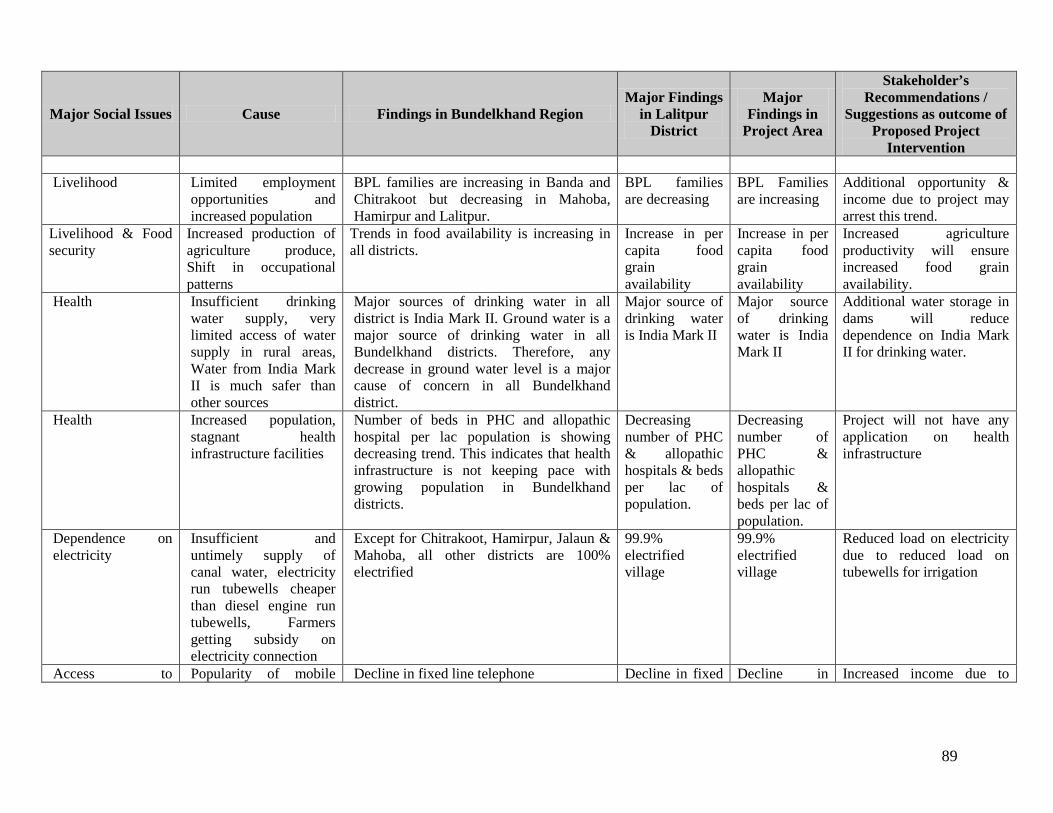
89
Major Social Issues Cause Findings in Bundelkhand Region Major Findings
in Lalitpur District
Major Findings in
Project Area
Stakeholder’s Recommendations /
Suggestions as outcome of Proposed Project
Intervention
Livelihood Limited employment opportunities and increased population
BPL families are increasing in Banda and Chitrakoot but decreasing in Mahoba, Hamirpur and Lalitpur.
BPL families are decreasing
BPL Families are increasing
Additional opportunity & income due to project may arrest this trend.
Livelihood & Food security
Increased production of agriculture produce, Shift in occupational patterns
Trends in food availability is increasing in all districts.
Increase in per capita food grain availability
Increase in per capita food grain availability
Increased agriculture productivity will ensure increased food grain availability.
Health Insufficient drinking water supply, very limited access of water supply in rural areas, Water from India Mark II is much safer than other sources
Major sources of drinking water in all district is India Mark II. Ground water is a major source of drinking water in all Bundelkhand districts. Therefore, any decrease in ground water level is a major cause of concern in all Bundelkhand district.
Major source of drinking water is India Mark II
Major source of drinking water is India Mark II
Additional water storage in dams will reduce dependence on India Mark II for drinking water.
Health Increased population, stagnant health infrastructure facilities
Number of beds in PHC and allopathic hospital per lac population is showing decreasing trend. This indicates that health infrastructure is not keeping pace with growing population in Bundelkhand districts.
Decreasing number of PHC & allopathic hospitals & beds per lac of population.
Decreasing number of PHC & allopathic hospitals & beds per lac of population.
Project will not have any application on health infrastructure
Dependence on electricity
Insufficient and untimely supply of canal water, electricity run tubewells cheaper than diesel engine run tubewells, Farmers getting subsidy on electricity connection
Except for Chitrakoot, Hamirpur, Jalaun & Mahoba, all other districts are 100% electrified
99.9% electrified village
99.9% electrified village
Reduced load on electricity due to reduced load on tubewells for irrigation
Access to Popularity of mobile Decline in fixed line telephone Decline in fixed Decline in Increased income due to

90
Major Social Issues Cause Findings in Bundelkhand Region Major Findings
in Lalitpur District
Major Findings in
Project Area
Stakeholder’s Recommendations /
Suggestions as outcome of Proposed Project
Intervention information & connectivity
phones line telephone fixed line telephone
project will increase to mobile phone penetration
Connectivity to Agri-market infrastructure
Government initiatives to provide better connectivity.
Increased road density Increased road density
Increased road density
Project will not have any impact on road infrastructure.
Livelihood Insufficient water availability, poor care and maintenance of small water bodies, Lack of HYV seedling and awareness.
Reservoir fish production exists
Declining reservoir fish production
Increased water availability in reservoirs / dams will improve fish production & additional source of livelihood.
Water & soil contamination
Easy process of procurement and application of chemical fertilizers
Increase in fertilizer consumption in five districts other than Lalitpur & Mahoba
Decrease in consumption of fertilizer
Decrease in consumption of fertilizer
Project will result in increased usage of fertilizers
Water & soil contamination
Farmers tried to get more production from farm field, Easy process of procurement and application of chemical & bio pesticide
Usage of chemical & bio pesticide Usage of chemical pesticide & biopesticide
Usage of chemical pesticide & biopesticide
Project will result in increased usage of chemical pesticides & biopesticides.

91
Table 3.2: Major Social / Findings Based on Primary Survey Versus Proposed Project
Major Social Issues Cause
Major Findings in Lalitpur District
through FGD
Major findings in Project Area through FGD
Major findings in Command & Non Command Area through Primary Survey
Recommendations / Suggestions as outcome of
Proposal Project Intervention
Agriculture & Livelihood
Trend of sowing local wheat variety called “Katia”. Insufficient/untimely supply of canal water, Majority of canals were run only in rabi season
90% sown area fall in Rabi. Decreasing agriculture productivity due to lack of water.
Major crops in Rabi are Wheat, Gram, Pulses and Mustard. Generally farmers use HYV seeds but a significant proportion of them used a local variety of wheat seed (Katia) as it does not require many watering. However, productivity of Katia is low.
Blockwise, in command area of block Mandwara about 96% of area was sown during Rabi followed by Talbehat (93%) and Birdha (90.0%). In non-command area also higher proportion of sown area was covered in Rabi in Mndwari (98%) followed by Birdha (94%) and Talbehat (92%). In the command area, a higher proportion irrigated area was covered by canal in the district (48.5%), highest in Block Talbehat (64.5%) followed by Birdha (54.5%) and only 30.2% in Mandwara. Despite a significantly higher proportion of irrigated area getting water from canal, about 4% to 9% irrigation is carried out by dug wells / ponds and 20% to 58% through tubewells. There was also heavy dependence on Rainfall i.e. 43% in Talbehat, 40% in Birdha and 20% in Mandwara. Situation suggest inability of canal system to provide adequate and timely water for irrigation. In command area only about 80% of the total number of required watering for wheat crop were reportedly given – about 52% were timely and 48% late.
Increased water availability for command area
Deteriorating Performance of Irrigation Infrastructures, Agriculture & Livelihood
Insufficient/untimely supply of canal water and shortage of HYV seeds.
Decreasing agriculture productivity due to untimely water supply and shortage of HYV seeds.
Decreasing agriculture productivity due to untimely water supply and shortage of HYV seeds.
Untimely water supply shortage of HYV seeds also lead to lower agriculture productivity.
Increased water availability for command area
Deteriorating Performance of Irrigation Infrastructures, Agriculture,
Insufficient/untimely supply of canal water and poor rainfall
50% Sown Area in Kharif. Decreasing productivity due to lack of water. The farmers who were solely / mainly
In Kharif Pulses, Maize, Til, Groundnut, Jwar and Soyabean.
During Kharif, a higher proportion of sown area (49.7%) was covered in command area of the district, highest in Block Mandwara (54%) followed by Birdha (50%) and Talbehat (41%) against 43%, 47% and 39% respectively in non command area. In
Improve efficiency of surface water irrigation system
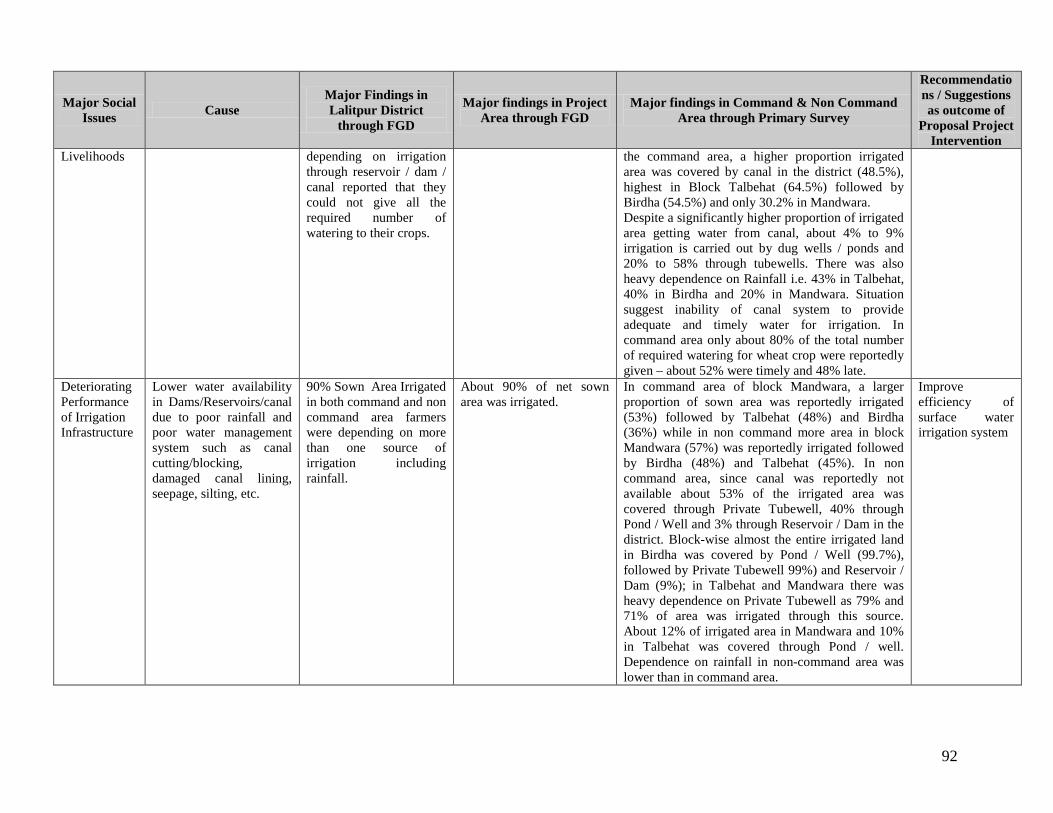
92
Major Social Issues Cause
Major Findings in Lalitpur District
through FGD
Major findings in Project Area through FGD
Major findings in Command & Non Command Area through Primary Survey
Recommendations / Suggestions as outcome of
Proposal Project Intervention
Livelihoods depending on irrigation through reservoir / dam / canal reported that they could not give all the required number of watering to their crops.
the command area, a higher proportion irrigated area was covered by canal in the district (48.5%), highest in Block Talbehat (64.5%) followed by Birdha (54.5%) and only 30.2% in Mandwara. Despite a significantly higher proportion of irrigated area getting water from canal, about 4% to 9% irrigation is carried out by dug wells / ponds and 20% to 58% through tubewells. There was also heavy dependence on Rainfall i.e. 43% in Talbehat, 40% in Birdha and 20% in Mandwara. Situation suggest inability of canal system to provide adequate and timely water for irrigation. In command area only about 80% of the total number of required watering for wheat crop were reportedly given – about 52% were timely and 48% late.
Deteriorating Performance of Irrigation Infrastructure
Lower water availability in Dams/Reservoirs/canal due to poor rainfall and poor water management system such as canal cutting/blocking, damaged canal lining, seepage, silting, etc.
90% Sown Area Irrigated in both command and non command area farmers were depending on more than one source of irrigation including rainfall.
About 90% of net sown area was irrigated.
In command area of block Mandwara, a larger proportion of sown area was reportedly irrigated (53%) followed by Talbehat (48%) and Birdha (36%) while in non command more area in block Mandwara (57%) was reportedly irrigated followed by Birdha (48%) and Talbehat (45%). In non command area, since canal was reportedly not available about 53% of the irrigated area was covered through Private Tubewell, 40% through Pond / Well and 3% through Reservoir / Dam in the district. Block-wise almost the entire irrigated land in Birdha was covered by Pond / Well (99.7%), followed by Private Tubewell 99%) and Reservoir / Dam (9%); in Talbehat and Mandwara there was heavy dependence on Private Tubewell as 79% and 71% of area was irrigated through this source. About 12% of irrigated area in Mandwara and 10% in Talbehat was covered through Pond / well. Dependence on rainfall in non-command area was lower than in command area.
Improve efficiency of surface water irrigation system

93
Major Social Issues Cause
Major Findings in Lalitpur District
through FGD
Major findings in Project Area through FGD
Major findings in Command & Non Command Area through Primary Survey
Recommendations / Suggestions as outcome of
Proposal Project Intervention
Heavy dependency on ground water, costly source of irrigation. Dependence on electricity
Insufficient/untimely supply of canal water and poor rainfall. Watering through diesel run engine tubewell due to inadequate electricity supply.
Ground water as preferred source of irrigation though gradually depleting & operating with erratic electric supply and high cost irrigation, 57% irrigation through Tube well (Private). Depth of Ground water in the district was about 40-45 metre). The electricity supply is erratic with fluctuations in the district which leads to untimely watering.
In block Birdha and Bar, the ground water level is very deep (70-80 metre). About 22%-24% of tubewells failure were recorded at the time of installation in Birdha, Mehrauni and Mandawara block. There is no maintenance of tubewells.
When enquired about farmer’s preferred source of irrigation 58% in command preferred Tubewell as compared to 52 % farmers preferring through canal. In non command area 93% each mentioned their preferred source would be Tubewell and canal. Therefore, ground water is the preferred source though there is regular power failure and high cost of irrigation.
Conjunctively use of surface & ground water
Deteriorating Performance of Irrigation Infrastructure
Insufficient/untimely supply of canal. Irrigation through tubewells.
Less dependence on canal system for irrigation: 28% by Canal System.
Canal system irrigation through Jamni, Sajnam & Rohini at less than recent normal.
The respondents belonging to the three blocks reported that the level of canal water generally remain high during November-December while during March-June they (Canal) remain dry. Such a pattern of response in favour of Tubewell indicate that either canal was not serving their entire area or the supply was untimely / inadequate.
Improve efficiency of surface water irrigation system
Alternate & traditional sources of irrigation
Get water easier and at minimum cost than tubewells.
Dependence on dug wells & ponds for irrigation: 10% by Dug well 5% by Pond & Other sources
In Talbehat, 9% of the area irrigated through pond / well; In Mandwara 7% of the area irrigated through pond/well; In Birdha about 50% of the area irrigated through ponds & well.
Rehabilitation / Modernization of ponds
Loss of Livelihood
Traditional practice of “Anna Pratha”.
20% of the Crop get damaged due to Anna Pratha
Cattle damage not only canal banks but also forest land.
The menace of stray animals due to Anna Pratha destroy a considerable part of crops while there is no check on them to prevent the loss due to social practice as well as the influence of owners of such cattle.
Improved irrigation efficiency for improved fodder production
Livelihood Horticulture Give more benefits than agriculture,
Horticulture as alternate livelihood source: Guava,
Under national horticulture Mission free saplings of
Improved agriculture /

94
Major Social Issues Cause
Major Findings in Lalitpur District
through FGD
Major findings in Project Area through FGD
Major findings in Command & Non Command Area through Primary Survey
Recommendations / Suggestions as outcome of
Proposal Project Intervention
less damage risk and very low care and maintenance after three years of plantation.
awonla , lemon, Mango is grown under National Horticulture Mission
Guava, Awonla, Lemon and Mango are given to farmers. Guava and Aownla are giving good return after about four years and a net income of about Rs. 70000/- per hectare was estimated from their crops.
horticulture extension services
Health Untimely/insufficient drinking water supply, very limited access of water supply in rural areas, Water from India Mark II is much safer than other sources
Major Source of Drinking water & water quality: Major source of drinking water is India Mark-II handpump. One handpump was available for every 70-90 families of rural area. Besides, supply through Tubewells and water from Govind Sagar was also used in certain areas of the district.
India Mark – II is the main source of drinking water. Dam and Surface water for drinking purpose had also been proposed by the district administration. No surface and ground water quality is tested.
Most of the respondents in Command (96.4%) and non-command (94.7%) area reported the quality of drinking water was clean. Out of those who suffered from certain diseases in Command area: 7% of men and 12% of women were affected by Cholera/ Diarrhoea (significantly higher proportion of both in Mandwara). Thus, most common diseases which affected a significant proportion of men and women in both command and non-command area were related to quality of drinking water, sanitation/ environmental pollution.
Additional water storage in dams will reduce dependence on India Mark II for drinking water
Poverty Alleviation & Alternate sources of Livelihood
Better Employment opportunities. Low wages as compared to other place.
Migration: In Some village most families migrate affecting local labor during harvesting.
The pattern of migration is such that in some villages most of the families migrate to work in agriculture sector in Madhya Pradesh. Their migration is mostly seasonal.
Proportion of migrated workers was significantly higher in command area of block Talbehat (33%) and Mandwara (27%) than in Birdha (6%). Similar position was found in non command area, though not significantly. Migratory pattern was seasonal with very limited permanent migration.
Increase opportunity in agriculture & allied activity
Health Unscientific practices at mining activities.
Mining Activity: At every 10-12 KM. Affecting crops and health of people
Mining activity is reported in Project Area.
Project will not have any application
Gender & Lack of awareness, 1. Child marriage Child Marriage among girls Awareness

95
Major Social Issues Cause
Major Findings in Lalitpur District
through FGD
Major findings in Project Area through FGD
Major findings in Command & Non Command Area through Primary Survey
Recommendations / Suggestions as outcome of
Proposal Project Intervention
Health Traditional practices in the age group of 12-16 years was a serious problem in the district. Due to illiteracy (particularly among women) and early marriage birth rate in the district was high. (Decadal growth in population during 1991-2001 was 30.1% against the State’s average of 25.9%).
generation
Gender
Inaccessibility/ non connectivity of road and other infrastructure facilities.
2. Due to inaccessibility of 15 villages in Maraura Block most men remain unmarried.
Not Applicable Not Applicable
Gender & Health
Increased trend of alcoholism, Easier availability of local alcohol at a minimum price.
3. Hooch distilleries common
Hooch distilleries common
A large majority of women respondents (92%) complained of low status of women in their family in both command and non command area. About 35% in non command complained about alcoholic husband, 30% regarding violence against women, 28% about strict behavior of In-laws, and 27% complained about insecure village environment. The proportion of women complaining about same was lower in command i.e. 16.4%, 16.4% 18.2% and 16.4% respectively.
Awareness & Women Empowerment
Deteriorating Performance of Irrigation Infrastructure. Lack of participatory approach for water use.
Poor Water management Practices, Canal cutting/Blockage, illegal lifting of canal water, Excess use of canal water at head and middle of the canal.
4. Water not reaching tail end
Canal water was not reaching in a substantial part of tail end due to illegal cutting of Canal / Minor, over use of water at head and middle ends, frequent changes in cropping pattern.
A pattern of response in favor of Tubewells indicate that either canal was not serving entire area or the supply was untimely or inadequate. Sources of irrigation shows that the farmers were depending on more than one source in both command and non-command area. This situation suggest inability of canal system to provide adequate and timely water for irrigation. In both Command and non-command area farmers
Participatory approaches for improved performance of irrigation infrastructure e.g. implementation of PIM

96
Major Social Issues Cause
Major Findings in Lalitpur District
through FGD
Major findings in Project Area through FGD
Major findings in Command & Non Command Area through Primary Survey
Recommendations / Suggestions as outcome of
Proposal Project Intervention
Since there is no practice of making mud boundary around the farms due to which water does not remain in farms.
were depending on more than one source of irrigation including rainfall. There was no role of farmers in recording of irrigation through canal; and that they reported that repair of canal was undertaken neither annually nor season-wise. They had also no knowledge about the fine imposed on any one for unauthorized use of canal water or any case filed on canal crime.
Poverty Alleviation & Alternate sources of Livelihood
Diversify income generation activities
Fisheries Reservoirs: There are 91 ponds in an area of about 531 ha in the district for which patta for fisheries was given. Besides, a large number of private ponds also exist. The production of fish in community ponds was between 20-25 Qtl/ha while in private ponds average production was about 30 Qtl/ha. Besides local consumption, fish are also exported to Jhansi, Lucknow and Gorakhpur.
Reservoirs in project area are sources of fishes. Besides local consumption fish was also exported to Jhansi, Lucknow and Gorakhpur.
Improved income through alternate livelihood from water resources
Linking of Health & Poverty
Poor sanitation facilities and practices.
Health- Diseases: Malaria, Typhoid, Diarrohea
Malaria, Typhoid, Diarrohea
About 24 percent of houses in Block Birdha in command area and 27 percent in Block Mandwara and 22 percent in Birdha in non-command area had pit toilet within their house. About two-third of Pacca houses in Block Birdha command area and Block Mandwara and 57 percent in Birdha in non-command area had this facility within their premises. Average monthly Expenses on Medical treatment of
Improved income through improved agriculture productivity to meet medical expanses

97
Major Social Issues Cause
Major Findings in Lalitpur District
through FGD
Major findings in Project Area through FGD
Major findings in Command & Non Command Area through Primary Survey
Recommendations / Suggestions as outcome of
Proposal Project Intervention
all family members and exclusively on women shows that a higher proportion of expenses were incurred on treatment of women members in both command (50.3%) and non command (53.1%) area. Average monthly expenses on treatment of women were significantly higher in Block Mandwara and Talbehat than in Block Birdha in both command and non-command area.
Tourism Lack of campaigning/ Advertising
Tourism Potential: The district has about 150 historical / religious places but they have not be publicized as tourist spot.
Birdha block is a very important tourist spot because majority of them are found at this place.
Project does not have any intervention on tourism infrastructure
Lack of participatory approach in water resource management
There was no Water Users Association, There was no NGO’s working in participatory irrigation and water resource management.
Activities of NGOs: A number of NGOs were working in the district. Their activities were related to Tribal welfare, women welfare and awareness generation against social evils such as child marriage, illiteracy etc.
A number of NGOs were working in the district. Their activities were related to Tribal welfare, women welfare and awareness generation against social evils such as child marriage, illiteracy etc.
None of the respondents in command area had any knowledge of the NGOs working in their area while 6 respondents in non command (5 in block Talbehat and 1 in Mandwara) knew the NGOs in their area. Among the 6 respondents 5 also reported their families had benefited from the activities of the NGOs. Thus, activities of the NGOs seems to be limited. There was no Water Users Association in the district. In command area only two respondents reported that they discuss about sharing of canal water with fellow farmers; None reported about any type of arrangement for distribution of canal water.
Implementation of PI< and participatory approach for water resource management
Lack of participatory approach in water resource management
There was no Water Users Association, There was no SHG’s working in participatory irrigation and water resource management.
Activities of SHGs: There were 4484 Self Help Groups (SHGs) in the district out of which 1029 were exclusively for women and most of the remaining, i.e. 3455 were had passed grate-I and 1392 were grade – II
A total of 9 respondents, 5 in command and 4 in non command informed about the existence of self-help groups in their area. These SHGs were working for improvement in Animal Husbandry and some were also helping their members for small business. None of the family members of the respondents were, however, associated with the SHGs. It therefore suggest their area of activities was limited. There was no Water Users Association in the
Implementation of PI< and participatory approach for water resource management

98
Major Social Issues Cause
Major Findings in Lalitpur District
through FGD
Major findings in Project Area through FGD
Major findings in Command & Non Command Area through Primary Survey
Recommendations / Suggestions as outcome of
Proposal Project Intervention
pass. A total of 1316 SHGs were provided financial assistance. Activity wise 235 SHGs were working in the area of irrigation / agriculture 1367 in Livestock / dairy and 73 in village Industry. A number of SHGs were engaged in preparation of spices, Achars and Murabbas. Some SHGs were engaged in making Terrakota and in weaving famous Chanderi Saries.
district. In command area only two respondents reported that they discuss about sharing of canal water with fellow farmers; None reported about any type of arrangement for distribution of canal water; there was no role of farmers in recording of irrigation through canal; and that they reported that repair of canal was undertaken neither annually nor season-wise. However, a large majority of Women respondents reportedly voted in elections in both command (95.5%) and non command (95.3%) area which indicate a higher degree of consciousness about the importance of elections.
Poverty Deaths due to starvation: Not Reported
Not Reported Not Reported Improved agriculture productivity to augment food security
Vulnerability of tribal population
Style of living which makes their dependency on forest
ST population: Negligible 50-70 families of Sahariya Tribes are living in forest land in Mandwara Block.
Negligible Coordination with agriculture extension services
Poverty Increased population, low employment opportunities and low crop productivity.
BPL families: About one third of the families in rural areas were living below the poverty line.
About one third of the families in rural areas were living below the poverty line.
The respondents were asked to identify a critical situation that they faced due to poverty. About half of the sample in command (52%) and non command (51%) mentioned that they could not arrange medical treatment of family member; about 31% in command 37% in non command reported that they could not marry their daughter while about 17% in command and 13% in non command reported their children had to drop out of school due to non payment of fee. Non availability of medical
Improve income opportunities due to short & long term project intervention

99
Major Social Issues Cause
Major Findings in Lalitpur District
through FGD
Major findings in Project Area through FGD
Major findings in Command & Non Command Area through Primary Survey
Recommendations / Suggestions as outcome of
Proposal Project Intervention
treatment due to poverty was reported by more respondents in block Talbehat and Mandwara in both command and non command areas as compared to block Birdha. As regards programs related to poverty alleviation, people mentioned only MNREGA.
Alternative source of Livelihood & alternate to anna pratha
Cattle left free for grazing under traditional practice “Anna Pratha” which is the main reason of livestock in each household. Lack of cross breed domestic animals resulting in poor milk field.
Livestock Rearing: Under Swarn Jyanti Gram Rozgar Yojana people are encouraged to purchase good quality cattle. It was thought that the population of unproductive cattle can be checked if good quality and high yielding cattle are brought. The district has 8 BAIF centres who are engaged in improved breeding. They also bring good quality cattle from other states.
Under Swarn Jyanti Gram Rozgar Yojana people are encouraged to purchase good quality cattle. It was thought that the population of unproductive cattle can be checked if good quality and high yielding cattle are brought. The district has 8 BAIF centres who are engaged in improved breeding. They also bring good quality cattle from other states.
A large proportion of families in both command and non command area owned this asset ranging between 84.0% of household in Block Birdha, 87.0% in Talbehat and 90.0% in Mandwara in the Command Area. In non command area 84.0% of families in Block Mandwara, 88.0% in Birdha and 93.0% in Talbehat had these assets. Ownership of livestock by a large number of household indicate animal husbandary is an important source of earning. The average number of livestock per family was significantly higher in the command area (6.6) of all three blocks as compared to non command area (2.7). This situation may be due to easy availability of surface water in the command area. Care of livestock in the families was reported as joint responsibility of Men and women in both command (95%) and non command (91%) area.
Coordination with agriculture and allied activities extension services
Soil & Water Pollution
Application of chemical fertilizers by large and small, Higher population of domestic animals particularly with marginal farmers.
Use of chemical fertilizer & bio pesticide: Use of chemical fertilizer was increasing but farmers were still using organic fertilizer more.
Use of chemical fertilizer was increasing but farmers were using organic fertilizer more.
The farmers were using chemical and Bio-fertilizer and Chemical Pesticide in the district (Bio-Pesticide used only in Block Mandwara). The average quantity of Bio-fertilizer used per Ha was higher (339.9 Kg.) than the quantity of Chemical fertilizer (282.8 Kg) in command and non command (334.5 Kg and 264.7 Kg respectively) area. The quantity of chemical as well as Bio-fertilizer per hectare was higher in command than in the non-command area. The average quantity of chemical Pesticide used in Command area was also higher (17.5 Kg/Litre) than in non-command area (7.0 Kg/Litre). The highest
Awareness building & Pilot demonstration of bio-fertilizer and bio-pesticides
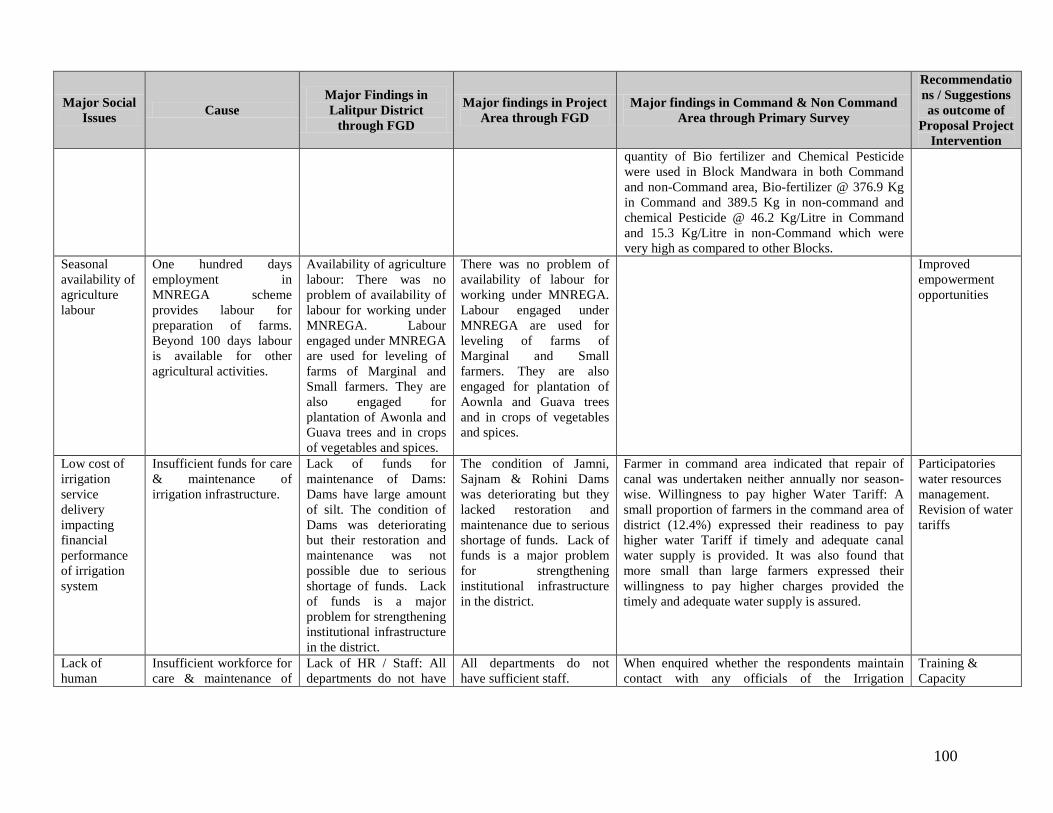
100
Major Social Issues Cause
Major Findings in Lalitpur District
through FGD
Major findings in Project Area through FGD
Major findings in Command & Non Command Area through Primary Survey
Recommendations / Suggestions as outcome of
Proposal Project Intervention
quantity of Bio fertilizer and Chemical Pesticide were used in Block Mandwara in both Command and non-Command area, Bio-fertilizer @ 376.9 Kg in Command and 389.5 Kg in non-command and chemical Pesticide @ 46.2 Kg/Litre in Command and 15.3 Kg/Litre in non-Command which were very high as compared to other Blocks.
Seasonal availability of agriculture labour
One hundred days employment in MNREGA scheme provides labour for preparation of farms. Beyond 100 days labour is available for other agricultural activities.
Availability of agriculture labour: There was no problem of availability of labour for working under MNREGA. Labour engaged under MNREGA are used for leveling of farms of Marginal and Small farmers. They are also engaged for plantation of Awonla and Guava trees and in crops of vegetables and spices.
There was no problem of availability of labour for working under MNREGA. Labour engaged under MNREGA are used for leveling of farms of Marginal and Small farmers. They are also engaged for plantation of Aownla and Guava trees and in crops of vegetables and spices.
Improved empowerment opportunities
Low cost of irrigation service delivery impacting financial performance of irrigation system
Insufficient funds for care & maintenance of irrigation infrastructure.
Lack of funds for maintenance of Dams: Dams have large amount of silt. The condition of Dams was deteriorating but their restoration and maintenance was not possible due to serious shortage of funds. Lack of funds is a major problem for strengthening institutional infrastructure in the district.
The condition of Jamni, Sajnam & Rohini Dams was deteriorating but they lacked restoration and maintenance due to serious shortage of funds. Lack of funds is a major problem for strengthening institutional infrastructure in the district.
Farmer in command area indicated that repair of canal was undertaken neither annually nor season-wise. Willingness to pay higher Water Tariff: A small proportion of farmers in the command area of district (12.4%) expressed their readiness to pay higher water Tariff if timely and adequate canal water supply is provided. It was also found that more small than large farmers expressed their willingness to pay higher charges provided the timely and adequate water supply is assured.
Participatories water resources management. Revision of water tariffs
Lack of human
Insufficient workforce for care & maintenance of
Lack of HR / Staff: All departments do not have
All departments do not have sufficient staff.
When enquired whether the respondents maintain contact with any officials of the Irrigation
Training & Capacity

101
Major Social Issues Cause
Major Findings in Lalitpur District
through FGD
Major findings in Project Area through FGD
Major findings in Command & Non Command Area through Primary Survey
Recommendations / Suggestions as outcome of
Proposal Project Intervention
resources, awareness & capacity building
irrigation infrastructure. sufficient staff. Department only 2 in Command and 4 in non-command reported that they maintain contacts with the Seenchpal, particularly when they do not get sufficient water for irrigation.
Building

102
3.6 Irrigation Infrastructure Performance Agriculture Productivity, Livelihood & Poverty An important aspect, which has emerged is the linkage of irrigation infrastructure performance with agriculture productivity and its further linkage to livelihood and poverty. An analysis of this linkage through primary survey findings is given below. The proportion of families owning pumpset is large in both command & non-command area which indicate the dire need of irrigation. The average net annual income per family from various sources was found higher in command (Rs. 45179) as against the non-command (Rs. 36456) area. The average per family annual net earnings from two major sources, i.e. agriculture and animal husbandry were lower in non command area as the cost of input were considerably higher in this area. Due to shortage of surface water, farmers and owners of livestock were depending on costly ground water for irrigation of crops as well as for animal fodder. As regards the number of families who were able to save some small amount of money and deposited it in the Bank, Post office or kept with themselves a slightly higher average annual savings was reported by respondents of Command (Rs. 1429/-) than of the non-command (Rs. 1257/-) area, may be due to the higher income they earned as analysed earlier. The number of families who were able to save money was also higher in command than in non-command area, many of whom had deposited their savings to Bank or Post office and had also kept some amount with themselves. The amount of average annual saving deposited with Banks was higher than the amount deposited with Post office or kept with themselves. Indebtedness seems to be a serious problem as about 40% of sample families in command and 29% in non-command area were indebted. Average loan per indebted family in command area was Rs. 98341/- while average current outstanding was Rs. 93295/- i.e. about 95% of the loan amount was yet to be repaid. In non-Command area the average loan amount per indebted family was Rs. 102536/- while the average current outstanding amount was Rs. 81125/- i.e. about 79% of the loan amount was yet to be repaid. Thus, a higher proportion of amount was repaid in non-command than in command area. Surprisingly, the entire loan amount taken from Moneylenders remained outstanding in both command and non-command area despite the fact that it carried a very high interest rate of even upto about 5% per month. Gender bias has been observed in women ownership of land, women education, meeting daily needs like fetching water, care of livestock, collection fuel wood and rate of wages paid to women. Recommendation and suggestions received through stakeholder consultation indicate the nature of proposed interventions in Phase-II.

103
Chapter 4: Regional Environmental Setting & Environmental Baseline 4.0 Background Environmental setting and assessment of the study area has been carried out for Bundelkhand and in general Lalitpur, where the project interventions are being proposed. The baseline environmental conditions have been described in terms of Land Environment, Climate & Air Environment, Water Environment Forest & Biodiversity and public health. Each of these items have been described in terms of respective parameters in the following sections. 4.1 Study Area Bundelkhand region lies between 23°10' and 26°27'N; 78°4' and 81°34'E. It comprises seven districts (Banda, Chitrakoot, Hamirpur, Mahoba, Lalitpur, Jhansi and Jalaun) of Uttar Pradesh with a total area of 29418 sq km, which is 12.21% of the total geographical area of the Uttar Pradesh. Geographically, Bundelkhand region is a part of central zone of India with a number of northbound perennial rivers of Sindh, Pahuj, Betwa, Dhasan, Ken, Baghein, Paisuni and Tons, etc., with numerous tributaries flowing into the Yamuna river. 4.2 Environmental status of Bundelkhand region Environmental status has been assessed based on natural resources features like Land Environment Consisting of Physiography & Drainage, Geology, mineral & mining, land use, soil environment, Climate & Air Environment consisting of climatic conditions; Water environment, Forest and biodiversity and Public health. The baseline indicators have been developed considering 2000-01 as benchmark year. These indicators describe the “key issues” both quantitative and in spatial context within Bundelkhand & Lalitpur. 4.2.1 Land Environment Physiography Uttar Pradesh Bundelkhand area is bounded by Vindhyan plateaus in South to river Yamuna in North, river Ken in East and rivers Betwa and Pahuj in West. The region generally slopes from South to North. The area generally slopes from mild ravines to level plains near Yamuna. The elevations in the area range from 600 m above mean sea levels (amsl) in southern part in MP to 150 m (amsl) near the Yamuna in UP. The total area of Bundelkhand is 29616.9 km2 hectares with a population of 6389336. Figure 4.1 shows the physiographic features of Bundelkhand region while the salient features of the Lalitpur district are described below.

104
Figure 4.1: Physiographic features of Bundelkhand region
Lalitpur District Lalitpur lies between Latitude 24º11′ N - 25º17′12″ N and Longitude 78º11′ E - 79º00′ E. The area of the district is 5039 kmP
2P with total population of 835790. The area is generally rocky. The highest ground
is in the extreme south with scraps of the vindhyan plateau, running from the Betwa in south-easterly direction and gradually breaking up into a confined mass of hills, parts of which approach a height of 650 m amsl. The north of the scrap, undulating plain of black soil interrupted with scattered hills and scoured by numerous drainage channals, stretches north beyonds the town of Lalitpur and gradually becomes more rocky. Low red hills of granitoid rock then appear with long ridges running from south- west to north- west direction.
Most of the area is being drained by river Jamni and its tributaries which form its eastern boundry, separating it from Tikamgarh district in Madhya Pradesh. River Betwa forms the western and northern boundry and drains the western part of the district. The south eastern part is partly drained by Dhasan river. In general, the slope is towards the north.
Physiography of Study Area Sajnam river is a tributary of Jamni. It originates from rocky area in Mandwara block in Lalitpur district, flows northwards through Mahroni & Bar blocks of Lalitpur district & finally falls into Jamini, near Chandawal in Tikamgarh district of Madhya Pradesh. The physiographic features of Sajnam river is shown in Figure 4.2. Jamini river sub-basin (Figure 4.2) enters Lalitpur cutting through the forest near Madanpur village, and flows northward for 45 km leaving the town of Mahroni on its right. It then takes north-easterly bend and after 6 km further comes to form the boundary of the district for about 60 km. It comes very close to Betwa just before it finally leaves the district. Jamini has been dammed within Lalitpur district.

105
Rohini river originates in Mandwara block of Lalitpur district and merges with river Dhasan in the same block. The physiographic features of the river is given in Figure 2.2.
Figure 4.2: Physiography of Study Area
The physiographic features indicates that undulating terrain due to Vindhyan rocks in the southern part (Lalitpur, Jhansi, Mahoba & Southern part of Banda & Chitrakoot) makes it a rich source of natural resources e.g. minerals, forests while the drainage pattern towards north along with Yamuna plain is indicative of resources supporting agriculture. The verification of these features is described in section 4.2.2 on Geology & Minerals and Section 4.2.3 on Soils. 4.2.2 Geology & Minerals in Bundelkhand Region The Geological formations in Bundelkhand region are from Archaeans to recent origin. The crystalline rocks of Archaeans consist of granite, gneiss and quartz reefs. The Vindhyan are represented by sand stone, lime stone and shale. The rocks are dominant in the region while the unconsolidated formations of recent (Quaternary) consisting of sand, silt and clay occupy Northern parts of the region along the river Yamuna in the districts of Jalaun, Hamirpur, Banda and parts of Chitrakoot. The underlying Archaeans is mostly composed of basal crystalline, mostly granites, popularly known as ‘Bundelkhand Granite’ and Metamorphic, mostly Gneisses. These are fractured jointed and weathered. The thickness of weathered zone depends upon the topography, drainage & vegetation cover. The Granites are pink to grey coloured and are coarse to fine grained. The Granites are normally sloping northerly towards the Yamuna. The Southern hilly tract is roughly parallel to the Ganga-Yamuna lineament. The tract is underlain by granitic complex in Bundelkhand region. It is overlain by rocks Mahakoshal (Bijawar) and Vindhyan Super group. The younger rock comprise of coal bearing Gondwana in south Sonbhadra and basaltic rocks in southern part of Lalitpur. The Vindhyan, are represented by a pile of Precambrian sedimentary rock, consisting of sub-horizontal and weakly folded beds of sand stone, shale and limestone. These sediments, attaining thickness of more than 4000 m are laid over Achaean rocks. The Vindhyan are exposed in parts of Banda district. In Chitrakoot

106
granite hillocks are capped by lower Vindhyan rocks and Kaimur sandstone. The limestones extending towards the Yamuna are highly cavernous.
Alluviums on the other hand comprise mainly of Clays, Silt and Sand stone mixed with gravel and kankar. These formations have a thickness of about 130 to 150 m over the eroded base of Bundelkhand Granite. The alluvium deposits are mostly found in Hamirpur, Jalaun and parts of Jhansi district.
Granites of varying types from the Lower Pre Cambrian/Archaen period are the predominant Geological materials found across the region. Alluvial deposits of clay, silt and sand of sub-aerial and fluviatile origin are the most recent geological deposits in Bundelkhand and are more predominant near the Yamuna River and its tributaries. Ravines in the north and deep gorges in the south are the result of the active erosion of the unconsolidated alluvial material deposited by the major streams in the region, namely the Betwa, Dhasan and the Ken. These ravines and gorges are uncultivable and pose an increasing threat to nearby farmland as they continue to expand.
Geological formations described above support extraction of minerals and mineral support based industry in the region. Therefore, the district wise mineral resources confirming the resource base is described in Table 4.1.
Table 4.1: Mineral Resources in Bundelkhand
Sr. No. Mineral Area District
Reserves (In lakh tonnes As on mar. 31st -
06)
Value Uses
1. Diaspore Mailar, Gaurari, Tori
Lalitpur 0.50 3.87 Refractory
2. Pyrophyllite Garhmau, Mailar, Gaurari, Tori
Jhansi, Mahoba, Lalitpur
12.17 17.90 Refractory, Ceramics, Talc, Insecticide etc.
3. Granite Kalapahar, Khailar, Kewal, Bijoli
Jhansi, Mahoba, Lalitpur, Banda,
484919000 M3
(source-IBM)
61852.00 Polished slab & tiles
4. Rock Phosphate
Pisnari & Tori Lalitpur 60.00 369.00 Fertilizer & Elemental Phosphorus Industry
*Lies in the sanctuary area Source: Directorate Geology & Mining, UP Geology & Minerals in Study Area In Lalitpur District, Geological Setup consists of the area which is covered by Bundelkhand Granitic Massif overlain by Mahakoshal (Bijawar) and Vindhyans. Mineral investigation programmes in the area include, Gold in Girar area, Platinum group of elements in Ikauna-Dangli area and placer Gold in Berwar area. Major minerals include Pyrophyllite, Diaspore and Rock phosphate. Minor minerals include Granite, sandstone and Morrum. Sanctioned leases in the district include 4 Sand and Morrum, 53 for Granite dimensional stone, 8 for Diaspore – Pyrophyllite, 15 Building stone (Granite) and 30 for Building Stone (Sandstone). The Geology & mineral map of the study area is given in Figure 4.3. Mineral Based industries include 8 Granite Stone cutting/polishing units, 2 Granite & Sandstone cutting / polishing units, 11 Stone grit units and 2 Handicraft units.

107
Figure 4.3: Geological & Mineral Map of District Lalitpur
Details of Sanctioned Leases-Major Minerals There are 29 authorized mining locations which are located in 5 districts of Bundelkhand Area. As per the department of Geology and Mining, there is no unauthorized mining activity reported in the Uttar Pradesh Bundelkhand Area. The mining locations in the study area are given in Table 4.2.
Table 4.2: Sanctioned lease record for mining in Bundelkhand Sr. No. Mineral Lease Holder Village Area (ha) Period
Lalitpur 1. Pyrophyllite/
Diaspore Sri J.K. Minerals Maillar, Shivpura,
(Tehsil Lalitpur) 30.75 20 years from
30.10.72 Renewed from 29.10.92 for 20 yrs.
2. - do - - do - Bijri, (Tehsil & District Lalitpur)
37.983 20 years from 01.09.83 Renewed
3. - do - Sri Om Prakash Kejriwal
Mailar (Tehsil Lalitpur)
2.10 10 years from 22.4.84 Applied for Renewal
4. - do - M/s. UP SMDC Ltd
Tori, Pulawan (Tehsil Mehrauni)
73.20 20 years from 23.9.83
5. - do - - do - Seron, Lagoun (Tehsil Mandwara)
254 20 years from 23.9.83
6. - do - - do - Bijri, (Tehsil Lalitpur), Dhankuan, (Tehsil Mehrauni)
447 20 years from 7.4.85
7. Rock Phosphate - do - Sonrai, Tori (Tehsil Mehrauni)
874 20 years from 9.3.81
8. Pyrophyllite Diaspore
M/s. Ishwar Industries Limited
Pura, Dhankuan (Tehsil Mehrauni)
47.42 20 years from 01.05.64
9. - do - M/s. Vini Minerals Myaun 19.15 Acre 20 years from

108
Sr. No. Mineral Lease Holder Village Area (ha) Period 22.12.94
10. - do - - do - Bilata, (Tehsil Mehrauni)
5.90 Acre 20 years from 09.01.97
11. - do - Sri Salil Richharia Mailar (Tehsil Lalitpur)
15.00 Acre 20 years from 10.11.98
12. - do - Sri Vishwa Nath Singh
Pura Dhan Kuan (Tehsil Mehrauni)
6.25 Acre 20 years from 16.9.96
13. - do - Sri Subhash, Chandra Om Hare
Mailar, (Tehsil Lalitpur)
8.77 Acre 20 years from 27.07.01
Source: Directorate of Geology & Mining, UP 1. Weathering of rocks and upper layer is an ongoing natural phenomena which suggests erosion and its drainage into river system depending on vegetation cover. 2. Extraction of minerals based lease allotted in each district as well as operation of mineral based industries are suggestive of alteration of drainage system, erosion and siltation of river system and air and water pollution. 4.2.3 Soils in Bundelkhand Region Broadly there are four types of soils in the region namely (i) Red sandy soils, (ii) Shallow black soils, (iii) Mixed red and black soil, and (iv) Alluvial soils. Red sandy soils, commonly known as Rakar soils contains quartz, orthoclase, microcline etc and exists in districts of Jhansi and Lalitpur in Uttar Pradesh. These soils are shallow, gravelly and extremely porous with low organic matter and have poor water holding capacity and are thus not much suitable for main stream agricultural activities. Shallow black soil, also locally known as Parwa soils, which are coarse grained clayey in nature and mostly grey to grayish brown in clolor, usually occurs in low laying areas of the district Jalaun, Hamirpur and Banda. The particle size of this soil varies from fine to medium and has high water retaining capacity and is thus suitable for plant growth and crop cultivation. The alluvial or Mar soil occurs in northern parts of region in the districts of Jalaun and Hamirpur in Uttar Pradesh. The soil is brown in colour with medium depth. This soil is generally less rich in organic matter. The soil pattern of Bundelkhand region is shown in Figure 4.4. Gradually changing behavior of the soil pattern and has an important bearing on hydrology, hydro-geology, and agronomy resulting into a typical livelihood pattern of the people.
Figure 4.4: Soil Map of Bundelkhand Area

109
Soils in Lalitpur District Lalitpur district falls in Chromusterfs and Association, Ustalfs and Usterts soil classification. The soil group under this classification indicates mixed red and black soil and medium black soil. Soil pattern suggest that soils support agriculture in district. Soil Fertility Status: The soils in Lalitpur district in general are fertile. Available nitrogen concentration in soils in general ranges between low to very low. Same trend has been observed for available Phosphate where most of the soils lie between low to very low category. The available potassium is high to medium in most of the areas. According to the soil testing data on Nitrogen (N) available phosphate (P) and potassium (K) of the project area is given in Table 4.3 and Figure 4.5. Further, both macronutrient & micronutrient status in the study area has been described in following sections.
Figure 4.5: The Soil Fertility\Health Map of the Project Area
Table 4.3: Block wise Soil Fertility Status (2009-10)
District Block No. of Samples Element Index Fertility Level N P K N P K
Lalitpur
Talbehat 2284 2.57 1.45 3.91 Medium Very Low High Bar 3121 2.51 1.48 3.88 Medium Very Low High Jakhaura 3277 2.44 1.47 3.92 Low Very Low High Birdha 3334 2.40 1.47 3.90 Low Very Low High Mahrauni 3487 2.63 1.43 3.84 Medium Very Low High Madwara 2492 2.70 1.77 3.80 Medium Low High
Total 17995 2.54 1.51 3.88 Medium Very Low High Source: Department of Agriculture, UP Macro-nutrient Status Nitrogen Status: Out of six blocks, two blocks Jakhaura & Birdha blocks have low to very low nitrogen status in soil while four blocks have Nitrogen status as Medium.

110
Phosphate Status: The very low phosphate status has been reported in Talbehat, Bar, Jakhaura, Birdha & Mahurani block of Lalitpur while the low phosphate status has been reported in Mandwara block of Lalitpur. Potassium Status: The high potassium status has been reported in all blocks of Lalitpur. Micro-nutrients Status Micronutrient in the soil plays an important role both for soil fertility as well as soil pollution. In cases of deficiency of such micronutrients, soil productivity decline and microbial activities are affected, which result in lower organic carbon and lower availability of soil nutrition to the crop. Deficiency of the micronutrient is also linked with the performance of the problematic soil e.g. deficiency of zinc in sodic soil has multiplier effect to reduce the soil productivity and deteriorate the soil characteristics. The data of micronutrient deficiency for Lalitpur district is analyzed for different micro nutrients and given in Table 4.4.
Table 4.4: Micro-nutrients and precision element index, 2007-08
District Block No. of Samples
S No. of Sample
s
Element Index Fertility Level
Element Index
Fertility Level Z Cu Fe Mn Z Cu Fe Mn
Lalitpur
Talbehat 491 1.66 D 491 2.43 3.25 3.31 3.33 M S S S
Bar 392 1.72 M 392 2.44 3.27 3.29 3.32 M S S S
Jakhaura 1214 1.61 D 1214 2.48 3.28 3.31 3.31 M S S S
Birdha 609 2.00 M 609 2.52 3.22 3.26 3.33 S S S S
Mahrauni 319 1.67 D 319 2.51 3.31 3.32 3.33 S S S S
Madwara 277 1.60 D 277 2.32 3.29 3.31 3.33 M S S S
Total 3302 1.71 M 3302 2.45 3.27 3.30 3.33 M S S S Source: Department of Agriculture, UP (M= Medium, D=Deficient, S=Sufficient) The deficiency of sulphur is reported Talbehat, Mahrauni & Mandwara block of Lalitpur while other block of different district is found medium. Copper, Iron and Manganese is found sufficient in the district. Soil Fertility Status in Study Area The soils of study area in general are fertile. Available nitrogen concentration in soils in general ranges between low to medium. The available phosphate was observed low to very low while potassium was found high. According to the soil testing data on Nitrogen (N) available phosphate (P) and potassium (K) of the project area is given in Table 4.5.
Table 4.5: Block wise Soil Fertility Status (2009-10)
District
Block No. of Samples Element Index Fertility Level
N P K N P K Bar 3121 2.51 1.48 3.88 Medium Very Low High Birdha 3334 2.40 1.47 3.90 Low Very Low High Mahrauni 3487 2.63 1.43 3.84 Medium Very Low High Madwara 2492 2.70 1.77 3.80 Medium Low High Medium Very Low High
Source: Department of Agriculture, UP

111
Macro-nutrient Status Nitrogen Status: The low nitrogen status has been reported in Birdha block of Sajnam Command Area while other blocks, Bar, Mahrauni & Mandwara falling in Jamini & Rohini belong to medium nitrogen status. Phosphate Status: Very low phosphate status has been reported in 3 blocks of Command Area while Madwara block was observed low phosphate level. Potassium Status: The potassium status was found high in all blocks. Since Birdha block is deficient in both Nitrogen & Phosphate, any intervention related to higher usage of Nitrogenous or Phosphatic fertilizer by the farmers offers higher potential of water pollution from the agruiculture run off in the command area in the long term. Micro-nutrients Status Analysis of micronutrient deficiency for the command area has been analyzed and blocks reported deficient for different micro nutrients are given in Table 4.6.
Table 4.6: Micro-nutrients and precision element index, 2007-08
District Block
No. of Sampl
es
S No. of Samp
les
Element Index Fertility Level Eleme
nt Index
Fertility Level
Z Cu Fe Mn Z Cu
Fe
Mn
Bar 392 1.72 M 392 2.44 3.27 3.29 3.32 M S S S Birdha 609 2.00 M 609 2.52 3.22 3.26 3.33 S S S S Mahrauni 319 1.67 D 319 2.51 3.31 3.32 3.33 S S S S Madwara 277 1.60 D 277 2.32 3.29 3.31 3.33 M S S S Total 3302 1.71 M 3302 2.45 3.27 3.30 3.33 M S S S
Source: Department of Agriculture, UP (M= Medium, D=Defficient, S=Sufficient) The deficiency of sulphur is reported in Mahrauni & Madwara block of Jamini command area while in other blocks is found to be medium. Copper, Iron and Mengnese is found sufficient in all blocks. Land Use Land has remained as an important factor for economic activities in Bundelkhand. With the rising population, increasing pressures are being felt on the finite land resources, to meet the demands of food and fodder. The total land area of Bundelkhand Area falling in Uttar Pradesh is 29,61,692 hectares (Statistical Abstract 2008-09). Land use of Bundelkhand can be categorized as cultivable, and uncultivable. Uncultivable land includes forest, pasture, fallow, and barren land. The breakup of land use pattern in 2008-09 and 2000-01 is given in Table 4.7 and shown in Figure 4.6.
In Lalitpur district, during 2008-09, nearly 66.14% of the total area is used for the cultivation, while approximately 16.52% is under double cropping system.
Table 4.7: District wise Land use Pattern Bundelkhand (2008-09) in Hectare
Particular Total
Bundelkhand (2000-01)
Lalitpur (2000-01)
Total Bundelkhand
(2008-09)
Lalitpur (2008-09)
Total Area 2958534 509436 2961692 509791 Forest 268660 76160 244578 76160 Barren Cult. Waste 142258 80919 117340 61581

112
Particular Total
Bundelkhand (2000-01)
Lalitpur (2000-01)
Total Bundelkhand
(2008-09)
Lalitpur (2008-09)
Present fallow land 145904 18838 184415 12182 Other fallow land 74221 24152 55054 14179 Barren & uncult. Land 115349 17701 108449 14985 Land put non Agri. use 210693 33226 254677 41323 Pastures to non-agri. Use 5405 3471 5475 3286 Area under bush, forest & garden 10746 1750 32813 669 Net area sown 1985298 253219 1958891 285426 Area sown more than once 388669 86473 489497 153134
Gross area sown
2373967 2373967 2448388 339692 438560 1705645 1705645 1735127 220317 253063 665193 665193 697188 118773 184656
3000 3000 16013 602 841 Land prepared for sugarcane 129 0 60 0 Net irrigated area 839651 176254 1105072 249224 Gross irrigated area 862236 177677 1176969 251096
Block wise land use pattern in Lalitpur district is given in Annexure 4.1.
Figure 4.6: Change in Land use Pattern
Changes in Land Use Pattern in Bundelkhand Change in land use pattern is analyzed based upon the recent changes of the Bundelkhand land use pattern in 2000-01 over 2008-09 and shown in Figure 4.6. Forest area in the Bundelkhand declined from 268660 ha in 2000-01 to 244578 ha during 2008-09. Present fallow land increased from 145904 ha in 2000-01 to 184415 ha in 2008-09. Overall gross sown area increased in 2008-09 in comparison to 2000-01. This increase in 2008 is because of increase in gross sown area in Jalaun, Lalitpur & Mahoba, while in all other districts it declined. Land Use in Study Area

113
During 2000-01, the total land area of Command (4 blocks) was 336774 hectare while in district it was 509436 hectare. Land use of Command Area can be categorized as cultivable, and uncultivable. Uncultivable land includes forest, pasture, fallow, and barren land. The breakup of land use pattern in 2000-01 is given in Table 4.8 and shown in Figure 4.7.
15.0
4
14.9
5
15.4
315
.88
4.08
3.70 5.
60
4.74
2.58
3.47 3.88 6.
52
0.66
0.68
0.35
0.34
52.3
8
49.7
1
14.9
3 16.9
7
0
10
20
30
40
50
60
% o
f Rep
ortin
g Ar
ea
Forest Barren Cult.Waste
Presentfallow land
Other fallowland
Barren & uncult. Land
Land put touse other
thanagriculture
Pastures tonon-agri. Use
Area underbush, forest
& garden
Net areasown
Area sownmore than
once
Landuse Pattern-2000-01 Command AreaDistrict
Figure 4.7: Land use Pattern in Command Area (2000-01)
During the year 2000-01, nearly 52.38% of the total area is used for the cultivation while in district 49.71%. Mehrauni (59.38%) block has highest net sown area followed by Birdha (52.23%) and Bar (52.19%) while Mandawara block has lowest. Area more than once of command area was 14.93% while in district it was 16.97%. Area sown more than once was highest in Bar (22.55%) block followed by Mehrauni (14.00%) and Birdha (13.08%) blocks.
During 2008-09, nearly 59.83% of the total area is used for the cultivation while in district it was 55.99%. Mehrauni (72.83%) block has highest net sown area followed by Bar (63.96%) and Birdha (55.30%) while Mandawara (50.74%) block was lowest. Area more than once of command area was 29.67% while in district it was 30.04%. Area sown more than once was highest in Bar (44.67%) block followed by Mehrauni (30.10%) and Birdha (27.48%) blocks. During the 2000-01, cropping intensity was 128.50% in 2008-09 it was 149.59. The breakup of land use pattern in command area in 2008-09 is given in Table 4.8 & shown in Figure 4.8.
9.94 14
.95
11.3
5
12.0
8
2.83
2.39
2.96 2.78
2.24 2.94
5.26 8.11
0.54
0.64 0.10
0.13
59.8
3
55.9
9
29.6
7
30.0
4
0
10
20
30
40
50
60
%of
Rep
ortin
g A
rea
Forest Barren Cult.Waste
Presentfallow land
Other fallowland
Barren & uncult. Land
Land put touse other
thanagriculture
Pastures tonon-agri. Use
Area underbush, forest
& garden
Net areasown
Area sownmore than
once
Landuse Pattern-2008-09 Command AreaDistrict
Figure 4.8: Land use Pattern in Command Area (2008-09)

114
Table 4.8: Land use Pattern of Command Area (% of reported Area)
Particular 2000-01
2001-02
2002-03
2003-04
2004-05
2005-06
2006-07
2007-08
2008-09
Total Area 336774 336539 336539 333128 331782 329632 339576 330045 330860 Forest 15.04 15.05 15.05 9.94 9.94 9.94 9.94 9.94 9.94 Barren Cult. Waste 15.43 15.25 15.05 11.98 11.04 11.72 12.09 11.41 11.35 Present fallow land 4.08 4.05 7.88 5.80 4.46 6.92 6.24 8.85 2.83 Other fallow land 5.60 5.53 4.79 3.44 2.97 3.50 3.11 2.96 2.96 Barren & uncult. Land 2.58 2.55 2.41 2.37 2.24 2.25 2.48 2.25 2.24 Land put to use other than agriculture 3.88 3.88 4.68 4.48 4.46 4.50 6.96 5.27 5.26 Pastures to non-agri. Use 0.66 0.66 0.66 0.66 0.54 0.54 0.52 0.54 0.54 Area under bush, forest & garden 0.35 0.31 0.27 0.28 0.12 0.12 0.10 0.10 0.10 Net area sown 52.38 52.72 49.21 55.79 58.90 55.51 54.00 53.71 59.83 Area sown more than once 14.93 15.98 23.96 23.11 23.44 16.36 18.29 17.01 29.67
Gross area sown
Total
339692.00
341544.00
318114.00
385426.00
401115.00
362209.00
377348.00
348214.00
438560.00
Rabi 46.43 47.09 44.38 40.60 42.73 49.78 47.46 34.42 40.70 Khar
if 20.23 20.44 23.33 26.31 25.30 15.56 17.50 32.58 26.73 Jaya
d 0.08 0.17 0.05 0.07 0.05 0.07 0.09 0.03 0.10 Net irrigated area 68.35 71.35 70.76 79.04 80.73 91.55 92.49 65.09 88.16
Land use data indicates that Command Area encompasses 11.18 % of the total area of Bundelkhand but forest share is 15.04% in 2000-01 while 9.94% in 2008-09. Changes in Land Use Pattern in Command Area Change in land use pattern is calculated based upon the recent changes of the Command Area land use pattern in 2000-01 over 2008-09 and shown in Figure 4.9. Net sown area was 59.83% in 2008-09 while 52.38% in 2000-01.

115
15.0
4
9.94
15.4
3
11.3
5
4.08
2.83 5.
60
2.96
2.58
2.24 3.
88 5.26
0.66
0.54
0.35
0.10
52.3
8
59.8
3
14.9
3
29.6
7
0
10
20
30
40
50
60
%of
Rep
ortin
g Ar
ea
Forest Barren Cult.Waste
Present fallowland
Other fallowland
Barren & uncult.Land
Land put to useother thanagriculture
Pastures tonon-agri. Use
Area underbush, forest &
garden
Net area sown Area sown morethan once
Change in Landuse Pattern 2000-012008-09
Figure 4.9: Change in Land use Pattern
Overall gross sown area increased in 2008-09 in comparison to 2000-01. This increase in 2008-09 is because of increase in gross sown area in all blocks of command area. Further, gross sown area showed an increasing trend during Kharif except during 2005-06 & 2006-07, which can be attributed to drought years. This indicates that availability of water can further increase the gross sown area in the command. Forest area has decreased, while land put to use other than agriculture has increased. Since agriculture is dependent on water availability and other climatic conditions, it is pertinent to study rainfall, temperature and associated irrigation system. Hydrology both surface and ground water supporting irrigation system has been described in section. 4.3 Climate & Air Environment The climate of the Bundelkhand is Central India type sub-tropical and may be characterised by a very hot dry summer and cold winter. The region shows four distinct seasons. Summer being from March to mid-June, Monsoon from mid-June to September, post-monsoonal transition between October and November while the winter months will range from December to February. Lalitpur district also experiences similar type of climatic conditions as that of Bundelkhand. 4.3.1 Temperature IMD data from 1991 to 2002 indicates that the maximum annual mean temperature in the command area varies between 31.1°C to 32.9°C. Similarly, the minimum range of the annual mean temperature varies between 18.3°C and 20°C as shown in Figure 4.10. However, the minimum to maximum temperature may range from 5.4ºC to 49ºC.

116
Temperature
19.3
19.3
19.1
19.1
19.2
19.1
18.3 19.3
19.2
19.4
19.4
20.0
32.3
32.3
32.1
32.1
32.2
32.0
31.2 32.2
32.1
32.4
32.3
32.9
0.0
5.0
10.0
15.0
20.0
25.0
30.0
35.0
1991
1992
1993
1994
1995
1996
1997
1998
1999
2000
2001
2002
Tem
pera
ture
Minimum Maximum
Figure 4.10: Temperature Profile
4.3.2 Rainfall Rainfall is the most significant parameter for classifying biomes, geographic area and climate. The temporal variation as well as the spatial variation plays a significant role in the water resources planning of system. The rainfall pattern in Bundelkhand is typically monsoonic and the Bundelkhand region gets around 600 to 1350 mm of rainfall annually. MP portion of the Bundelkhand gets around 900 to 1350 mm while UP portion of Bundelkhand gets around 600 to 900 mm of normal rainfall. Normal rainfall Isohyetal map of Bundelkhand region is shown in Figure 4.11.
Figure 4.11: Normal rainfall Isohyets in Bundelkhand region
District wise rainfall pattern is given in Table 4.9. Rainfall data from year 2000 to 2009 shown in Figure 4.12 indicates declining trends in all the districts of Bundelkhand.
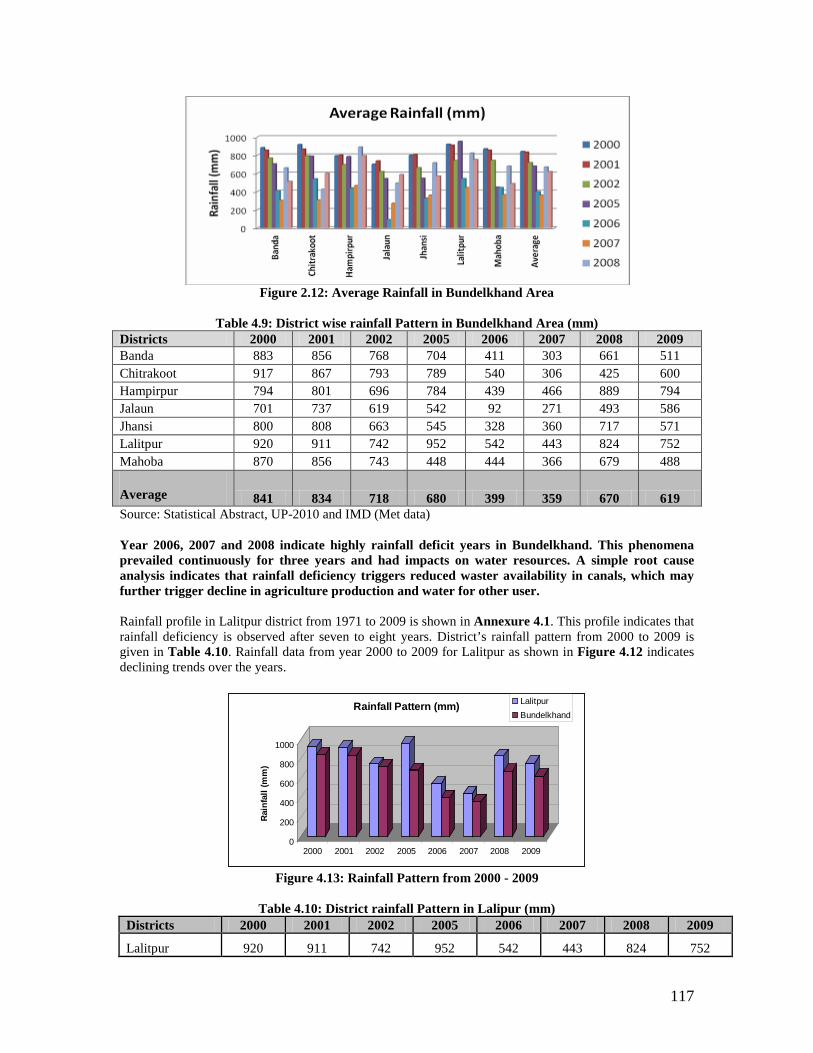
117
Figure 2.12: Average Rainfall in Bundelkhand Area
Table 4.9: District wise rainfall Pattern in Bundelkhand Area (mm)
Districts 2000 2001 2002 2005 2006 2007 2008 2009 Banda 883 856 768 704 411 303 661 511 Chitrakoot 917 867 793 789 540 306 425 600 Hampirpur 794 801 696 784 439 466 889 794 Jalaun 701 737 619 542 92 271 493 586 Jhansi 800 808 663 545 328 360 717 571 Lalitpur 920 911 742 952 542 443 824 752 Mahoba 870 856 743 448 444 366 679 488
Average 841 834 718 680 399 359 670 619 Source: Statistical Abstract, UP-2010 and IMD (Met data) Year 2006, 2007 and 2008 indicate highly rainfall deficit years in Bundelkhand. This phenomena prevailed continuously for three years and had impacts on water resources. A simple root cause analysis indicates that rainfall deficiency triggers reduced waster availability in canals, which may further trigger decline in agriculture production and water for other user. Rainfall profile in Lalitpur district from 1971 to 2009 is shown in Annexure 4.1. This profile indicates that rainfall deficiency is observed after seven to eight years. District’s rainfall pattern from 2000 to 2009 is given in Table 4.10. Rainfall data from year 2000 to 2009 for Lalitpur as shown in Figure 4.12 indicates declining trends over the years.
0
200
400
600
800
1000
Rain
fall
(mm
)
2000 2001 2002 2005 2006 2007 2008 2009
Rainfall Pattern (mm) LalitpurBundelkhand
Figure 4.13: Rainfall Pattern from 2000 - 2009
Table 4.10: District rainfall Pattern in Lalipur (mm)
Districts 2000 2001 2002 2005 2006 2007 2008 2009
Lalitpur 920 911 742 952 542 443 824 752

118
Districts 2000 2001 2002 2005 2006 2007 2008 2009
Bundelkhand 841 834 718 680 399 359 670 619 Year 2006, 2007 and part of in 2008 indicate rainfall deficit years in Lalitpur4, where rainfall dipped to as low as 49% of normal rainfall. This phenomenon prevailed continuously for three years and had impacts on water resources. 4.3.3 Air Pollution Currently no documentary or physical evidence has been found in the study area, which indicates air pollution. Though the area is rich in Pyrophyllite Diaspore, any mining activity in the project area offers the potential of air pollution especially SPM. This has been very well documented 5 in neighbouring districts of Bundelkhand Region. 4.4 Water Environment Water environment has been described in terms of surface & ground water resources in Bundelkhand region, district Lalitpur & study area. Water availability has been described in terms of surface & ground water availability while water usage has been described in terms of sources of irrigation and drinking water purposes. Further water quality has been described in terms of surface & ground water quality in Bundelkhand, Lalitpur district and the study area. 4.4.1 Surface Water Resources of Bundelkhand Region in Uttar Pradesh The topography of the Bundelkhand supports river system, which are major source of water in the region. While river Yamuna being the periphery river in the north flowing from west to east, its main tributaries viz. Betwa, Ken, Gharara, Bagain, Paisuni flowing from south to north traverse through the region. The second order tributaries of Yamuna, viz. Rivers Jamni and Dhasan are tributaries to the Betwa while rivers Bearma and Sonar are tributaries of the Ken. The rivers that originate from Madhya Pradesh and traverse through both Madhya Pradesh and Uttar Pradesh are: (i) the Ken and its tributaries, Bewas, Bearma, Sonar and Urmil and (ii) the Betwa and its main tributaries the Jamni and the Dhasan, (iii) river Kopra and river Bewas. In addition a number of other small rivers also traverse through Uttar Pradesh. The entire drainage forms a part of Ganga basin. The general feature of rivers within Bundelkhand is that these swell during monsoon and almost dry up during summer. While Yamuna, Ken, Betwa, Dhasan are perennial, their tributaries and other small streams within Uttar Pradesh region are not. The extent of surface water resources as adopted by the projects in the region and reflective of their project provisions is, however, indicative of the surface water potential of the region. Irrigation map of Bundelkhand is given in Figure 4.14. In all, there are 28 major and medium existing schemes, 6 under construction and 15 are proposed within UP. Majority of the existing irrigation schemes within UP-Bundelkhand are fully developed. In addition, a number of lift irrigation schemes are also in operation. Small rivers like the Paisuni, Gunta and the Baghain and many other rivers originate within Uttar Pradesh and have comparatively small contributions for use within Uttar Pradesh which are nearly utilized. Salient features of the existing projects / schemes are given in Annexure 4.2. Details of important canal systems in Bundelkhand are given in Annexure 4.3. At regional level, water sharing schemes exist between UP & MP in Bundelkhand. Inter-sectoral and inter-regional water allocation occurs in Betwa & Ken river system as well as proposed in Ken-Betwa river link
4 Report on Drought Mitigation Strategy for Bundelkhand region of Uttar Pradesh and Madhya Pradesh by Inter Ministerial Team, National Rain Fed Area Authority (2008) 5 Singh Gyatri, Pal Amrit, Environmental Impacts of Mining on Bundelkhand Region of Uttar Pradesh, India Recent Research in Science & Technology 2010, 2(3): 50-57’.

119
Project. Brief description of these allocation are given in Annexure 4.4. There are no international water issues with respect to Bundelkhand.
Figure 4.14: Irrigation Map of UP-Bundelkhand
Source: UPID 4.4.2 Surface Water Resources of Study Area Select systems for which interventions have been proposed include Jamini, Sajnam & Rohini in Lalitpur district. These projects are shown in Figure 4.15. Jamini Dam Jamni Dam is an earthen dam situated between latitude 24º20`N - 24º25`N and longitude 78º40`E – 78º45`E near the village Devri of Mahroni Tehsil, 55 km. away from Lalitpur district head quarter in East-North direction on Jamni River. The catchment area of Jamni dam is 414.00 Sq. Km. out of which 245.81 Sq. Km. is in UP and 168.19 Sq.Km. is in M.P.. It has been constructed between the year 1962 to 1973. It is an earthen dam of length 6.400 KM. with top width 6.10 M. maximum height of dam is 15.70M. Maximum capacity of dam is 92.88 MCM and dead storage is 8.80 MCM. FRL is 403.55M. and dead storage level is 396.85M. HFL is 403.86M and live storage is 84.023 MCM. Maximum designed flood discharge is 2520 Cusec. The average rain fall in dam area is 802 mm. The spillway of the dam is ogee type having six nos. of vertical gates of size 12.19m X 6.09m. Length of spillway is 90.00M and crest level is 397.72 M. Dam has been filled with full capacity in the year, 1990, 1993, 1996, 1999, 2003 and in 2011. The dam funds water to the canal system where, length of the main canal is 67.40 km with 36 number of distribution system having a total length of 177.91 km. The irrigable command area is 55114 ha with an annual irrigation of 13699 ha. The dam also has provision for 1.42 MCM of drinking water supply. Rohini Dam Rohini dam is an earthen dam situated between latitude 24º20`N – 24º25`N and 79º50`E – 79º55`E near the village Madawara of Mahroni Tehsil, 65 km. away from Lalitpur district head quarter in South-East direction on Rohini river. The catchments area of Rohni dam is 44.03 Sq. KM. Dam was constructed between the year 1976 to 1984. It is an earthen dam of length 1.647 KM. with top width 6.08 M.

120
Maximum height of dam is 15.50 M. Maximum capacity of dam is 12.11 MCM and dead storage is 3.82 MCM FRL is 396.39M. HFL is 397.10m and live storage is 8.29 MCM. Maximum designed flood discharge from the dam is 380 Cumecs. The average rain fall in dam area is 956 mm. The spillway is ogee type having there nos. of vertical gates of size 6.0m X 3.60M length of spillway is 24.00M and crest wall is 393.00 M. Dam has been filled with full capacity is year, 1987, 1990, 1991, 1992, 1993, 1994, 1995, 1996, 2005 and in 2008. The total length of Rohni canal system is 20.09 km. where, the length of main canal is 8.64 KM. having four number of minors. The length of distribution system is 11.220 km. GCA is 4002 ha CCA is 3302 ha and proposed Irrigation is 1780 ha.
Figure 4.15: Select systems for which Detailed Studies are proposed
Sajnam Dam Sajnam dam is situated on Sajnam river between Sindhwaha village of Mehroni Tehsil & Kalothara Village of Lalitpur Tehsil, 30 Km. away from Lalitpur District head quarter in south east direction between latitude 240 -32' N and longitude 780-36 'E. The catchment area of dam is 290 Sq. Km. out of which 258 Sq.Km. is in UP and 32 Sq.Km. is in MP. It has been constructed between 1977 to 1990. It is an earthen dam of length 4.374 Km. with top width of 6.70m, top level 375.80m. Maximum height of dam is 13.40m, maximum capacity of Dam is 83.50 MCM and dead storage is 8.65 MCM, F.R.L. is 373.20m and dead storage level is 367.20m & free board is 2.60m. Water provision for Irrigation is 37.67 MCM & for drinking water is 1.417MCM. Maximum flood discharge is 131400 cusecs. The average rain fall in dam area is 889mm. Design flood discharge is 3724 Cumec and revised flood discharge by CWC is 4850 Cumecs. Spillway is ogee type having capacity of 2000 cumecs through four vertical gates of size 10m x 6.50m. Dam has been filled with full capacity in the year 1996, 1999, 2005, 2008 and 2011. The length of main canal is 37.50 km. Length of left Sajnam Canal is 20.30 km with a design discharge of 97 Cusecs. Length of right Sajnam Canal is 20 km with a design discharge of 68 Cusecs. There are 16 number

121
of distribution system with a length of 48.05 km. Irrigation command area is 10210 ha with annual irrigation of 71415 ha. 4.4.3 Hydrogeology & Ground Water Resources of the Bundelkhand Region in Uttar Pradesh The nature and the extent of the aquifer bodies, their hydro-geological properties in relation to the ground water flow characteristics and their formations in Bundelkhand region are classified as consolidated, Vindhyan formations and unconsolidated formations6. The Consolidated Formations: These broadly can be interpreted as composed of granite, gneisses and quartz reef etc. and are hard rocks and compact with negligible porosity resulting into poor aquifers. The porosity of these rocks varies from 0 to 0.3%, and, therefore, these formations are incapable of holding and transmitting water. However, along the planes of weakness and fractures, joints, and shear planes, the weathering and decomposition provides appreciable porosity. Generally dug wells in these zones have a depth of 5 to 30 m with water levels between 3 to 15 m below ground level (bgl). The Vindhyan formation: These formations on the other hand are composed of sand stones, shale and limestone. The sandstones and shale are hard and compact hence form poor aquifer. The ground water occurs in these formations under water table conditions in fine interstice of the weathered zones and joint planes. Deeper sandstone zones are compact and impervious and generally do not bear water and are thus unsuitable for ground water development. The cavernous zones and cavities in lime stones on the other hand are generally potential repositories of ground water and provide copious discharge when tapped. Wells in lime stones can yield up to 100 to 500 :m3/day. Unless tapped, both these formations leak water which flows fast towards the Yamuna. The Unconsolidated Formations: These occur south of the Yamuna in Jalaun, Hamirpur, Banda and parts of Chitrakoot district in Uttar Pradesh. Unconsolidated formations are characterized by generally north-east sloping planes formed by the drainage system of Yamuna river. The sediments mainly comprise clay-kankar-silt with intercalation of sand and gravel lenses of varying thickness and inter-granular porosity. Thickness of these deposits is about 50-150 m. Ground water in these strata generally occurs in the upper zones of about 40 m. and under semi-unconfined conditions at deeper level below 40 m. Wells between 30 to 40 m of granular aquifer can yield 50-65 litres per second (lps) (4000 to 5000 m3/day). Hydro-geology of the Bundelkhand region is shown in Figure 4.16.
6 Hydrogeology of the Bundelkhand region, CGWB, 2001
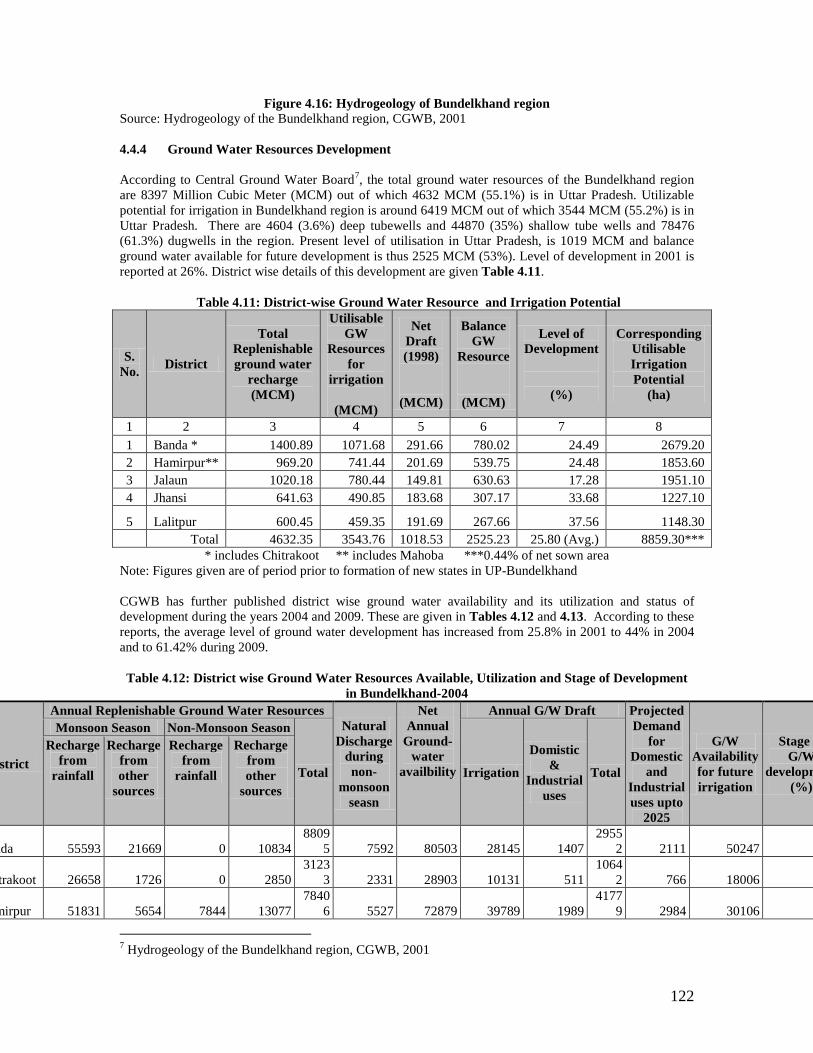
122
Figure 4.16: Hydrogeology of Bundelkhand region Source: Hydrogeology of the Bundelkhand region, CGWB, 2001 4.4.4 Ground Water Resources Development According to Central Ground Water Board7, the total ground water resources of the Bundelkhand region are 8397 Million Cubic Meter (MCM) out of which 4632 MCM (55.1%) is in Uttar Pradesh. Utilizable potential for irrigation in Bundelkhand region is around 6419 MCM out of which 3544 MCM (55.2%) is in Uttar Pradesh. There are 4604 (3.6%) deep tubewells and 44870 (35%) shallow tube wells and 78476 (61.3%) dugwells in the region. Present level of utilisation in Uttar Pradesh, is 1019 MCM and balance ground water available for future development is thus 2525 MCM (53%). Level of development in 2001 is reported at 26%. District wise details of this development are given Table 4.11.
Table 4.11: District-wise Ground Water Resource and Irrigation Potential
S. No. District
Total Replenishable ground water
recharge (MCM)
Utilisable GW
Resources for
irrigation
(MCM)
Net Draft (1998)
(MCM)
Balance GW
Resource
(MCM)
Level of Development
(%)
Corresponding Utilisable Irrigation Potential
(ha)
1 2 3 4 5 6 7 8 1 Banda * 1400.89 1071.68 291.66 780.02 24.49 2679.20 2 Hamirpur** 969.20 741.44 201.69 539.75 24.48 1853.60 3 Jalaun 1020.18 780.44 149.81 630.63 17.28 1951.10 4 Jhansi 641.63 490.85 183.68 307.17 33.68 1227.10
5 Lalitpur 600.45 459.35 191.69 267.66 37.56 1148.30 Total 4632.35 3543.76 1018.53 2525.23 25.80 (Avg.) 8859.30***
* includes Chitrakoot ** includes Mahoba ***0.44% of net sown area Note: Figures given are of period prior to formation of new states in UP-Bundelkhand CGWB has further published district wise ground water availability and its utilization and status of development during the years 2004 and 2009. These are given in Tables 4.12 and 4.13. According to these reports, the average level of ground water development has increased from 25.8% in 2001 to 44% in 2004 and to 61.42% during 2009. Table 4.12: District wise Ground Water Resources Available, Utilization and Stage of Development
in Bundelkhand-2004
strict
Annual Replenishable Ground Water Resources Natural
Discharge during non-
monsoon seasn
Net Annual
Ground- water
availbility
Annual G/W Draft Projected Demand
for Domestic
and Industrial uses upto
2025
G/W Availability for future irrigation
Stage o G/W
developm (%)
Monsoon Season Non-Monsoon Season
Total Irrigation
Domistic &
Industrial uses
Total
Recharge from
rainfall
Recharge from other
sources
Recharge from
rainfall
Recharge from other
sources
nda 55593 21669 0 10834 8809
5 7592 80503 28145 1407 2955
2 2111 50247
trakoot 26658 1726 0 2850 3123
3 2331 28903 10131 511 1064
2 766 18006
mirpur 51831 5654 7844 13077 7840
6 5527 72879 39789 1989 4177
9 2984 30106
7 Hydrogeology of the Bundelkhand region, CGWB, 2001

123
strict
Annual Replenishable Ground Water Resources Natural
Discharge during non-
monsoon seasn
Net Annual
Ground- water
availbility
Annual G/W Draft Projected Demand
for Domestic
and Industrial uses upto
2025
G/W Availability for future irrigation
Stage o G/W
developm (%)
Monsoon Season Non-Monsoon Season
Total Irrigation
Domistic &
Industrial uses
Total
Recharge from
rainfall
Recharge from other
sources
Recharge from
rainfall
Recharge from other
sources
aun 57440 12494 7059 19505 9649
7 7923 88574 27413 1371 2878
4 2056 59105
nsi 38078 6197 6221 20418 7091
4 4091 66824 26681 1936 2861
7 3230 36913
itpur 40256 6410 4633 16515 6781
4 5539 62274 30747 1449 3219
6 2702 28825
hoba 33327 3197 0 10523 4704
7 47025 42342 19980 999 2097
9 1498 20864 erage
Source: Central Ground Water Board (http://cgwb.gov.in/download.html)
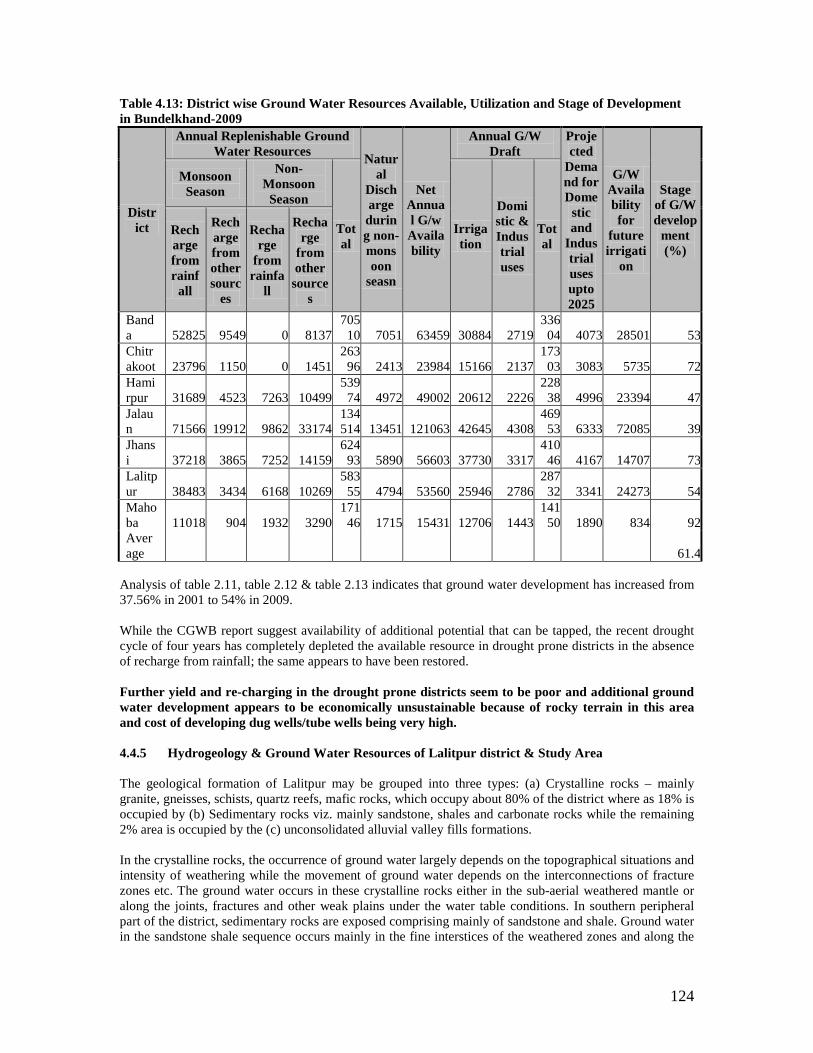
124
Table 4.13: District wise Ground Water Resources Available, Utilization and Stage of Development in Bundelkhand-2009
District
Annual Replenishable Ground Water Resources Natur
al Discharge during non-monsoon
seasn
Net Annual G/w Availability
Annual G/W Draft
Projected
Demand for Dome
stic and
Industrial uses upto 2025
G/W Availability for
future irrigati
on
Stage of G/W develop
ment (%)
Monsoon Season
Non-Monsoon
Season
Total
Irrigation
Domistic & Industrial uses
Total
Recharge from rainf
all
Recharge from other sourc
es
Recharge
from rainfa
ll
Recharge
from other
sources
Banda 52825 9549 0 8137
70510 7051 63459 30884 2719
33604 4073 28501 53
Chitrakoot 23796 1150 0 1451
26396 2413 23984 15166 2137
17303 3083 5735 72
Hamirpur 31689 4523 7263 10499
53974 4972 49002 20612 2226
22838 4996 23394 47
Jalaun 71566 19912 9862 33174
134514 13451 121063 42645 4308
46953 6333 72085 39
Jhansi 37218 3865 7252 14159
62493 5890 56603 37730 3317
41046 4167 14707 73
Lalitpur 38483 3434 6168 10269
58355 4794 53560 25946 2786
28732 3341 24273 54
Mahoba 11018 904 1932 3290
17146 1715 15431 12706 1443
14150 1890 834 92
Average 61.4
Analysis of table 2.11, table 2.12 & table 2.13 indicates that ground water development has increased from 37.56% in 2001 to 54% in 2009. While the CGWB report suggest availability of additional potential that can be tapped, the recent drought cycle of four years has completely depleted the available resource in drought prone districts in the absence of recharge from rainfall; the same appears to have been restored. Further yield and re-charging in the drought prone districts seem to be poor and additional ground water development appears to be economically unsustainable because of rocky terrain in this area and cost of developing dug wells/tube wells being very high. 4.4.5 Hydrogeology & Ground Water Resources of Lalitpur district & Study Area The geological formation of Lalitpur may be grouped into three types: (a) Crystalline rocks – mainly granite, gneisses, schists, quartz reefs, mafic rocks, which occupy about 80% of the district where as 18% is occupied by (b) Sedimentary rocks viz. mainly sandstone, shales and carbonate rocks while the remaining 2% area is occupied by the (c) unconsolidated alluvial valley fills formations. In the crystalline rocks, the occurrence of ground water largely depends on the topographical situations and intensity of weathering while the movement of ground water depends on the interconnections of fracture zones etc. The ground water occurs in these crystalline rocks either in the sub-aerial weathered mantle or along the joints, fractures and other weak plains under the water table conditions. In southern peripheral part of the district, sedimentary rocks are exposed comprising mainly of sandstone and shale. Ground water in the sandstone shale sequence occurs mainly in the fine interstices of the weathered zones and along the

125
joint planes, bedding planes in the unaltered rocks. In the carbonate rocks the ground water occurs either in the weathered mantle or along the cavities and cavernous formed as a result of carstification. The availability of ground water depends upon the number of such cavities and other saturated weak planes in these rocks. The ground water development in the study area is given in Figure 4.17. Annual ground water recharge of the district is 67813.67 ham. The net annual ground water availability is 62274.29 ham. The existing gross ground water draft for all uses is 32195.90 ham. The net ground water availability for future irrigation development is 28824.87 ham. The stage of ground water development is 51.70%. As per CGWB, 4 blocks fall in safe category and the remaining 2 blocks Bar & Talbehat fall under semi-critical category. The maximum stage of ground water development is in Bar block (82.28%) and minimum stage of ground water development is in Birdha block (31.38%). The southern part of the area i.e. Mandwara & Mahrauni blocks have a good scope for further ground water development through tubewells.
Source: Ground Water Brochure of Lalitpur District, U.P. (A.A.P.: 2008-2009)
Figure 4.17: Map Showing Categorization of Blocks Lalitpur District, U.P. Depth to Water Level: Pre & Post Monsoon 2006, depth to water table of the district is given in Figure 4.18 & Figure 4.19. As Premonsoon water level varies from 0.77 (Talbehat) to 11.85 mbgl (Madawara). In postmonsoon period, depth to water level varies from 0.70 to 10.38 mbgl. Water level fluctuation varies from 0.07 m (Talbehat) to 2.60 m (Lalitpur). Shallow water level is observed in canal commands and the deeper water level is noticed at southeastern part of the district mainly in Madawara block. The shallow

126
water level (0.00 – 3.00 mbgl) are occurring in the form of small pockets along the surface water bodies in Talbehat areas.
Source: Ground Water Brochure of Lalitpur District, U.P. (A.A.P.: 2008-2009)
Figure 4.18: Depth of Water Level Map, Lalitpur District, U.P.

127
Source: Ground Water Brochure of Lalitpur District, U.P. (A.A.P.: 2008-2009)
Figure 4.19: Depth of Water Level Map, Lalitpur District, U.P. 4.4.6 Sources of Irrigation in Bundelkhand & Lalitpur District Third census of minor irrigation schemes (2001) suggests nearly 14% of net sown area of about 19 lakh ha is irrigated by major and medium schemes, 13% by gravity water and 1% by other surface water resources. Kharif irrigation is about 5% and Rabi about 95%. Nearly 70% of the area continues to be rain dependant. Table 4.14 given below shows irrigation from different sources.

128
Table 4.14: Irrigable Area and Area irrigated from different Source (Tha)8
District Name
Geogra-phical Area
Cultivable
Area
Net Sown Area
System Canals
Minor Irrigation (MI) Area Under Different Source Total Irrig-ation from
all source
Ground Water Wells /Tube wells Surface Water Total
MI Irrigated Area Dug Shallo
w Deep Flow Lift
Lalitpur 386.52 324.76 299.66 27.45 11.34 45.75 59.66 1.38 2.43 120.54 147.99
Jhansi 313.29 219.27 199.86 13.62 9.61 15.75 1.62 4.68 3.90 35.55 49.16
Jalaun 401.40 324.21 303.86 37.92 10.90 34.52 37.74 2.00 3.46 88.60 126.52 Hamir pur 457.76 371.44 337.13 118.09 7.16 26.71 61.00 1.03 0.51 96.41 214.50 Mahoba 483.96 356.17 305.98 57.24 41.43 30.71 8.76 0.83 5.51 87.25 144.48 Banda 509.87 387.68 213.34 46.74 52.08 2.06 3.80 0.17 2.85 60.97 107.71 Chitrakoot 277.95 203.73 194.05 8.83 31.95 2.22 0.30 10.63 0.87 45.97 54.80
Total 2830.74 2187.24 1853.87 309.89 164.46 157.71 172.8
8 20.71 19.51 535.27 845.16
Percent of Net Sown Area 16.7 8.9 8.5 9.3 1.1 1.1 28.9 45.6 Source – Third Minor Irrigation Census (2000-01) Major findings of socio-economic (secondary & primary) study indicates that planned cropping pattern in Uttar Pradesh portion of Bundelkhand region comprises mainly of wheat, pulses and oilseeds. Broadly there are three agro-climactic zones, (i) Wheat, (ii) Wheat and Rice and (iii) Jowar-Wheat. Wheat is mainly grown in Mahoba, Jhansi, and Lalitpur in Uttar Pradesh. Under the Wheat-Rice category, Banda is the main producing districts. Jalaun and Hamirpur fall under the Wheat-Jowar zone. However, such patterns are not favourable to the farmers.
Traditionally, farmers prefer Jowar-bajra due to uncertainties of rainfall. Where ever some irrigation is available, there is some shift to Urad, groundnut, Soya bean, Sesame and maize. Paddy area is negligible. In Rabi season, Gram, Massoor are the main crops. Mixed cropping in some areas is also practiced to mitigate uncertainties. Whereever some assured irrigation is available, there appears to be some shift in favour of Peas. It can be inferred that farmers prefer Rabi over Kharif. The practice of Anna Pratha prevails in Bundelkhand region, particularly in rain fed and water deficit irrigated project areas. As per the practice, farmers prefer to store waters in shallow aquifers and small storage to obtain assured Rabi. During Kharif, cattle are let loose in fields for grazing. In this context, water environment is being described in the following section. Minor Irrigation Development in UP-Bundelkhand According to the third census on Minor irrigation9 a number of surface and ground water schemes are existing in the UP-Bundelkhand region are given in Table 4.15.
Table 4.15: Number and area of MI schemes in Bundelkhand region GROUND WATER
Deep Tube Wells Shallow Tube Wells Dug wells All Structures Number
4604 44870 78476 127950
8 Concept note on “IWRM for Rehabilitation of Bundelkhand Region of Uttar Pradesh, SWaRA for Phase -2 of UPWSRP 9 Third minor irrigation census compiled by Ministry of Water Resources, Government of India, (2001)

129
GROUND WATER Average area irrigated (ha) per structure
37.5 3.5 2.1 3.9 As per Table 4.15, both Surface and ground water is used for irrigation in the Bundelkhand Area. Surface water is supplied through canals, ponds and rivers. Ground water is extracted from public and private tube-wells. A comparative analysis of irrigated area of the Bundelkhand covered under different sources (Source: District Statistical Handbook) is shown in Figure 4.20 & Figure 4.21 for 2000-01 and 2008-09. It can be seen that ground water use covers 16% of the reported irrigated area in the year 2000-01 and 28% in 2008-09. Surface water use covers 49% in 2000-01 and 45% in 2008-09. The data indicates that source of irrigation increased by 12% through ground water in Bundelkhand region.
At district level, analysis of source of irrigation has been carried out from 2000-01 to 2008-09.
Table 4.16: Source of Irrigation in Lalitpur (%)
District Year Canals Tubewell Wells Ponds Others Public Private
Lalitpur
2000-01 26.66 0.51 5.16 38.26 3.03 26.38 2001-02 29.77 0.00 6.68 36.45 2.98 24.13 2002-03 29.20 8.14 4.69 34.33 18.16 5.49 2003-04 33.33 0.00 10.93 32.96 21.34 1.44 2004-05 33.32 0.00 11.68 34.77 16.97 3.26 2005-06 34.09 0.02 12.04 32.37 17.94 3.54 2006-07 35.34 0.02 15.05 29.48 17.07 3.05 2007-08 17.01 0.91 39.55 24.90 14.60 3.03 2008-09 30.99 0.34 22.51 28.61 14.19 3.36
Table 4.18 indicates that in Lalitpur district, canals are the (more than 35%) major source of irrigation followed by wells (25%). The two sources contribute more than 60% irrigation. Districtwise temporal variation (eight years) of source of irrigation indicates significant increase in ground water irrigation during from 2000-01 to 2008-09. The decreased canal irrigation has been observed in 2007-08 and is indicative of reduced water availability in the canal system due to drought condition. Table 4.18 also indicates heavy dependence on private tubewells & wells for irrigation in comparison to public tubewells. FGD findings in Lalitpur district, further confirms this trend. 4.4.7 Sources of Irrigation in Study Area
Figure 4.20: Source of Irrigation in Bundelkhand in 2000-01
Figure 4.21: Source of Irrigation in Bundelkhand in 2008-09

130
Both Surface and ground water is used for irrigation in the Command Area. Surface water is supplied through canal, ponds and river. Ground water is extracted from public, private tube-wells and Wells. Irrigated area of the command area covered under different sources as per the District Statistical Handbook is shown in Figure 4.22. Ground water (Tubewells +Wells) use covers 32.54% of the reported irrigated area in the year 2000-01 and 55.92% in 2009-10,which indicates approximately 23.38% of ground water usage increased within 10 years. Surface water (Canal + Pond) use covers 41.78% in 2000-01 and 40.25% in 2009-10. The data indicates that source of irrigation by Canals and Other sources decreased slightly. Block wise area irrigated by different sources is given in Table 4.17.
0
10
20
30
40
50
60
% o
f Rep
ortin
g A
rea
2000-01 2001-02 2002-03 2003-04 2004-05 2005-06 2006-07 2007-08 2008-09 2009-10
Source of Irrigation (%)Canals
Public Tubewell
Private Tubwell
Wells
Ponds
Others
Figure 4.22: Temporal Source of Irrigation
Table 4.17: Source of Irrigation in Command Area (%)
Block Name Year Surface Water Ground Water
Others Total Canals Pond Total Tubewell Wells Total Public Private
Bar
2000-01 35.86 3.56 39.42 0 1.21 42.36 43.57 17.01 34699 2001-02 24.96 2.72 27.68 0 0.80 51.24 52.04 20.28 27535 2002-03 25.00 3.56 28.56 0 0.56 49.44 50.00 21.43 28725 2003-04 28.09 22.39 50.48 0 0.61 48.24 48.85 0.67 25862 2004-05 29.16 22.25 51.41 0 8.63 39.18 47.81 0.77 36064 2005-06 21.66 22.45 44.11 0 0.65 52.99 53.63 2.26 36354 2006-07 22.81 20.56 43.37 0 1.24 52.37 53.61 3.02 39660 2007-08 19.00 20.82 39.82 0 0.41 57.24 57.66 2.52 36021 2008-09 4.42 21.32 25.73 0 16.53 53.11 69.64 4.63 7065 2009-10 13.57 20.12 33.69 0.50 1.54 61.00 63.04 3.27 39413
Birdha
2000-01 34.38 0.86 35.24 0 2.73 27.62 30.35 34.40 35112 2001-02 26.25 2.40 28.65 0 15.25 23.13 38.38 32.98 34679 2002-03 33.09 3.10 36.20 0 17.22 21.65 38.88 24.93 38012 2003-04 46.36 11.24 57.60 0 12.63 23.08 35.71 6.69 37238 2004-05 45.29 14.18 59.46 0 16.90 22.62 39.52 1.01 45306 2005-06 31.16 11.44 42.60 0 26.36 23.21 49.57 7.84 49724 2006-07 32.66 5.79 38.45 0 29.79 20.28 50.08 11.47 52632 2007-08 31.34 12.64 43.98 0 31.74 17.97 49.71 6.32 56082 2008-09 14.91 14.58 29.50 0.22 50.47 16.39 67.08 3.43 44907 2009-10 29.06 10.65 39.71 0.40 36.06 16.97 53.43 6.86 55576
Mahrauni
2000-01 57.55 2.17 59.72 2.6 4.92 19.37 26.85 13.43 31555 2001-02 52.78 1.29 54.07 2.22 4.41 13.67 20.30 25.64 34593 2002-03 45.87 0.64 46.51 0 9.95 15.98 25.94 27.56 35322 2003-04 21.07 13.56 34.63 45.87 6.63 6.15 58.65 6.72 30411 2004-05 38.51 25.35 63.86 0 19.81 14.06 33.87 2.27 25084
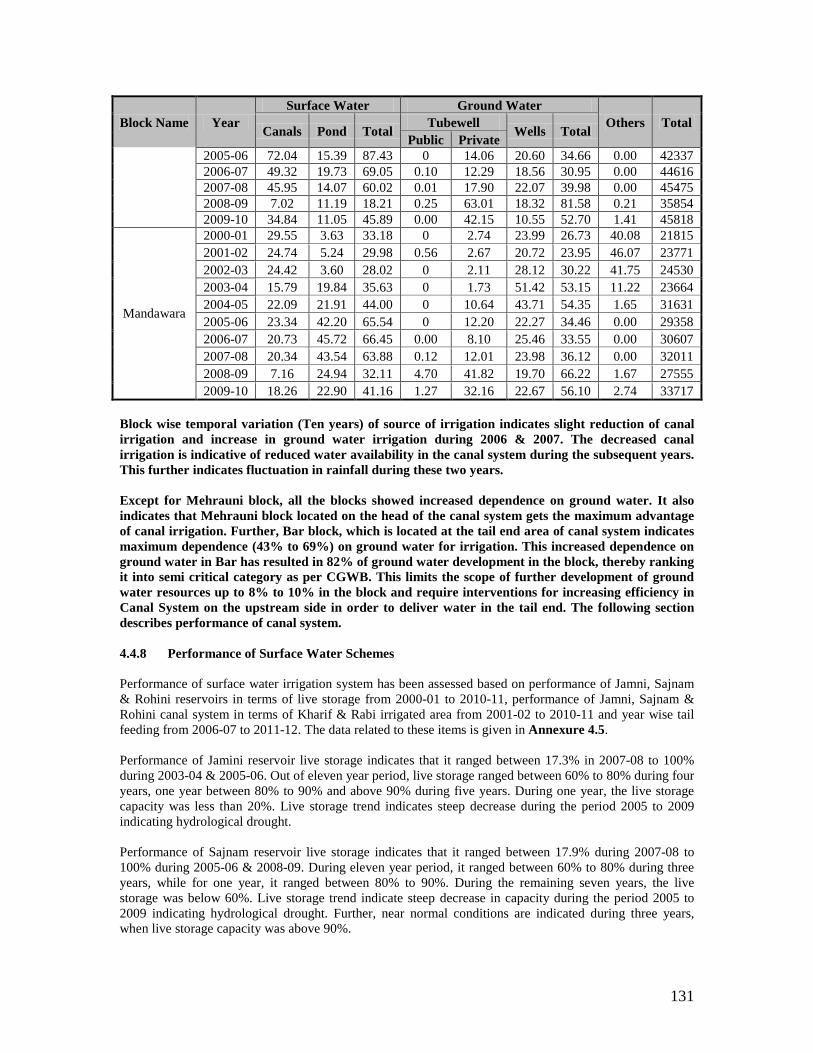
131
Block Name Year Surface Water Ground Water
Others Total Canals Pond Total Tubewell Wells Total Public Private 2005-06 72.04 15.39 87.43 0 14.06 20.60 34.66 0.00 42337 2006-07 49.32 19.73 69.05 0.10 12.29 18.56 30.95 0.00 44616 2007-08 45.95 14.07 60.02 0.01 17.90 22.07 39.98 0.00 45475 2008-09 7.02 11.19 18.21 0.25 63.01 18.32 81.58 0.21 35854 2009-10 34.84 11.05 45.89 0.00 42.15 10.55 52.70 1.41 45818
Mandawara
2000-01 29.55 3.63 33.18 0 2.74 23.99 26.73 40.08 21815 2001-02 24.74 5.24 29.98 0.56 2.67 20.72 23.95 46.07 23771 2002-03 24.42 3.60 28.02 0 2.11 28.12 30.22 41.75 24530 2003-04 15.79 19.84 35.63 0 1.73 51.42 53.15 11.22 23664 2004-05 22.09 21.91 44.00 0 10.64 43.71 54.35 1.65 31631 2005-06 23.34 42.20 65.54 0 12.20 22.27 34.46 0.00 29358 2006-07 20.73 45.72 66.45 0.00 8.10 25.46 33.55 0.00 30607 2007-08 20.34 43.54 63.88 0.12 12.01 23.98 36.12 0.00 32011 2008-09 7.16 24.94 32.11 4.70 41.82 19.70 66.22 1.67 27555 2009-10 18.26 22.90 41.16 1.27 32.16 22.67 56.10 2.74 33717
Block wise temporal variation (Ten years) of source of irrigation indicates slight reduction of canal irrigation and increase in ground water irrigation during 2006 & 2007. The decreased canal irrigation is indicative of reduced water availability in the canal system during the subsequent years. This further indicates fluctuation in rainfall during these two years. Except for Mehrauni block, all the blocks showed increased dependence on ground water. It also indicates that Mehrauni block located on the head of the canal system gets the maximum advantage of canal irrigation. Further, Bar block, which is located at the tail end area of canal system indicates maximum dependence (43% to 69%) on ground water for irrigation. This increased dependence on ground water in Bar has resulted in 82% of ground water development in the block, thereby ranking it into semi critical category as per CGWB. This limits the scope of further development of ground water resources up to 8% to 10% in the block and require interventions for increasing efficiency in Canal System on the upstream side in order to deliver water in the tail end. The following section describes performance of canal system. 4.4.8 Performance of Surface Water Schemes Performance of surface water irrigation system has been assessed based on performance of Jamni, Sajnam & Rohini reservoirs in terms of live storage from 2000-01 to 2010-11, performance of Jamni, Sajnam & Rohini canal system in terms of Kharif & Rabi irrigated area from 2001-02 to 2010-11 and year wise tail feeding from 2006-07 to 2011-12. The data related to these items is given in Annexure 4.5. Performance of Jamini reservoir live storage indicates that it ranged between 17.3% in 2007-08 to 100% during 2003-04 & 2005-06. Out of eleven year period, live storage ranged between 60% to 80% during four years, one year between 80% to 90% and above 90% during five years. During one year, the live storage capacity was less than 20%. Live storage trend indicates steep decrease during the period 2005 to 2009 indicating hydrological drought. Performance of Sajnam reservoir live storage indicates that it ranged between 17.9% during 2007-08 to 100% during 2005-06 & 2008-09. During eleven year period, it ranged between 60% to 80% during three years, while for one year, it ranged between 80% to 90%. During the remaining seven years, the live storage was below 60%. Live storage trend indicate steep decrease in capacity during the period 2005 to 2009 indicating hydrological drought. Further, near normal conditions are indicated during three years, when live storage capacity was above 90%.

132
Live storage capacity of Rohini dam from 2000-01 to 2010-11 indicated that it ranged from zero in 2007-08 to 100% in 2005-06 and 2008-09. Storage capacity was above 90% during two years, while it ranged between 70% to 80% for three years. During five years, it was below 70%. Steep decrease in storage capacity was observed during 2005 to 2009 indicating hydrological drought. Above analysis indicates that near normal water availability have been observed for five years in Jamni, three years in Sajnam and two years in Rohini reservoirs during eleven year period. Considering 70% as the bare minimum live storage, it can be inferred that canal system from the three reservoirs can be operated to some extent for seven years. During the remaining four years, canal supplies for irrigation had to be curtailed significantly. During 2007-08, Jamni & Sajnam had just 17% of water left while in Rohini it was negligible. Therefore, availability of water is a serious issue, which was confirmed during stakeholder consultations both in the district as well as the project area as highlighted in chapter 3. In Jamni canal system, actual irrigation during Rabi ranged from 21% in 2006-07 to above 100% of the recent normal during 2005-06. 2006-07 indicated drastic cut in canal irrigation due to minimum live storage capacity of reservoir. During five years out of ten years the canal system could irrigate only 75% to 80% of the maximum irrigation, while during four years, it was above 90%. During Kharif season, irrigation from canal system was observed minimum during 2002-03, 2003-04 and 2007-08. This may be attributed due to nearly 60% live storage in Jamni reservoir during 2001-02, 2002-03 and extreme drought year in 2007-08. In Sajnam canal system, actual irrigation during Rabi ranged from 55% in 2007-08 to more than 100% of the recent normal during 2005-06. Six years out of ten years have been observed to be normal, where the canal system could irrigate near normal to maximum irrigation, while during three years canal irrigation have been found to be below normal and one year as drought year. During Kharif season, irrigation from canal system was observed minimum, during 2003-04, while it was maximum during 2010-11. This may be attributed to nearly 60% live storage capacity in Sajnam reservoir. In Rohini canal system, actual irrigation during Rabi ranged from 20% during 2007-08 to above 100% during 2001-02 and 2004-05 & 2005-06. Six years out of ten years have been observed to be normal, where the canal system could irrigate normal to maximum irrigation, while during three years, canal irrigation have been found to below normal, while one year has been observed as drought year. During Kharif season, irrigation from canal system was observed minimum during 2003-04 and 2008-09, while it was maximum during 2005-06. Performance of canal system in terms of tail feeding from 2006-07 to 2011-12 indicates that irrigation was targeted only for 68% to 85% of the total tail ends during this period. Only 6% tail ends were fed during 2007-08 indicating drought conditions, while a maximum of 85% of the target was achieved during two years (2006-07 & 2008-09). This indicated that tail ends do not receive water during majority of years. This could be due to either non availability of water on account of deficit rainfall or due to deficiencies in the canal operating system e.g. water losses. Data from UPID indicates that water losses per km in Jamni canal ranges from 1.72 cusec/km to 1.84/km. Similarly, in Sajnam canal system, it ranges from 1.80 cusec/km to 2.33 cusec/km, while in Rohini canal system, it is 1.09 cusec/km. FGD findings in the district Lalitpur and field interaction with the farmers confirm these findings. 4.4.9 Cost Implications Increased dependence on ground water especially on private tubewells have significant cost implications. FGD findings in district indicates that cost of surface water irrigation for Rabi season (wheat & other food grain) is about Rs 100/ha to Rs 173/ha. These costs are inclusive of 3 cycles watering through canal system. Ground water costs through private tubewells ranges from Rs 150 to Rs 200/hour. For irrigating one hectare about 10 to 12 hours of tubewells operations are required. This indicates that cost of ground water irrigation through private tubewells is about Rs 1500 to Rs 2000 per hectare. FGD findings also indicate

133
that cost of ground water irrigation through public tubewells is about Rs 600/ha. The difference in surface & ground water irrigation rates further necessitates interventions in improving performance of canal system. 4.4.10 Surface Water Quality Surface water quality of Bundelkhand region has been described based on Central Pollution Control Board (CPCB) water quality monitoring stations and UP Pollution Board for five locations. Water quality data during 1985 has been described based on Water Quality Atlas of India prepared by CPCB. The five locations include three locations monitored by UP Pollution Control Board in Jhansi district and two locations by CPCB, on each in Hamirpur & Lalitpur district. Data for these five locations have been described from 2005 to 2009 in Table 4.18, while the year 1985 status is given in Figure 4.23. During the 2008 & 2009, pH is found slightly alkaline in nature at all locations; Turbidity is found beyond the permissible limit; all biological oxygen demand and chemical oxygen demand is observed within the permissible limit at both locations and concentration of both total coliform and fecal coliform are found much lower in Betwa at Hamirpur as compared to Govind Sagar Dam.
Figure 4.23: Water Quality of Betwa and Ken
Table 4.18: Surface Water Quality Bundelkhand
Loc
atio
n
Year pH Turbidity Total Alkalinity BOD COD
Total Dissolved
Solids
Fecal Coliform
Total Coliform
Class as Per CPCB Norms
Bet
wa-
Ham
irpu
r 2005 7.6 0.6 88.2 2.1 19.4 279.8 170.6 2833.8
C 2006 7.5 1 77.8 2.4 30 266.6 75.3 304.2 2007 7.6 7.4 76 2.1 26.6 260.5 79.1 325 2008 8.3 16 NA 2 20.9 279.4 70.8 355 2009 8.3 18.9 NA 2.9 12.2 303.7 390 7110
Shah
zad-
Gov
ind
Saga
r
2005 7.6 0.9 69.3 2.1 24 259.5 238 317.5
C 2006 7.7 1.5 76 2.1 24 255 348 156 2007 7.7 1.2 NA 1.8 21.3 237.7 265.5 333.3 2008 8.2 16.8 NA 1.5 17.5 161.8 215.5 212.5 2009 8 15.7 NA 2.6 11 263 443.5 7225

134
Loc
atio
n Year pH Turbidity Total Alkalinity BOD COD
Total Dissolved
Solids
Fecal Coliform
Total Coliform
Class as Per CPCB
Pahu
j Dam
, Jh
ansi
2005 7.6 NA NA 3.1 35.3 275.2 NA NA
C 2006 7.8 NA NA 3.2 41.4 272.7 NA NA 2007 8.3 NA NA 2.8 20.8 247 NA NA 2008 8.6 NA NA 2.1 25.3 360.4 NA NA 2009 8.7 NA NA 4.1 15.73 255.1 NA NA
PT
PP
Pari
chha
,
2005 7.6 NA NA 2.1 23.27 256 NA NA
C 2006 7.6 NA NA 2.0 23.3 256.1 NA NA 2007 7.5 NA NA 1.9 24 245 NA NA 2008 7.3 NA NA 1.9 21 210 NA NA 2009 7.9 NA NA 1.8 15 232 NA NA
PT
PP
Pari
chha
,
2005 7.6 NA NA 2.3 28.3 274 NA NA
C 2006 7.6 NA NA 2.2 28.3 260 NA NA 2007 7.6 NA NA 2.1 30 273.3 NA NA 2008 7.8 NA NA 2.3 35.1 228.5 NA NA 2009 7.1 NA NA 2.1 45.5 285.5 NA NA
Source: Central Pollution Control Board-2010 and UP Pollution Control Board (Regional Office, Jhansi)-2011 Both Figure 4.23 and Table 4.18 indicate that surface water quality at all location is falling under class C and has the similar trend from 1985 to 2009. Class C indicates that water is fit for both drinking water purposes after conventional treatment & disinfection and also for irrigation as per national water quality classification criteria. 4.4.11 Project Area Surface Water Quality Water Quality in project area (Jamni, Sajnam & Rohni Dam and associated canal system) has never been monitored by any agency. So, Pre- monsoon surface water quality assessment has been carried out in the command area of Jamini Dam, Rohni Dam and Sajnam Dam. Surface water quality results have been summarized in Table 4.19. Analysis of these results are given below: pH: The pH value at all locations is found between 7.0 and 7.8, which indicates within permissible limit (8.5). pH is highest observed at Right Sajnam Canal while lowest at Left Sajnam Canal. Dissolve Oxygen: Dissolve Oxygen (DO) is found between 6.2 to and 8.1, which indicates good amount of Dissolve Oxygen and water is fit for irrigation as well as for drinking purpose. Turbidity: Turbidity is found beyond the permissible limit (10 NTU) in all locations except Left Sajnam Canal and Right Sajnam Canal. Hardness is also observed within the desirable limit. Residual Chlorine: Residual Chlorine was found beyond the desirable limit (0.2 mg/l) at all locations while chloride was found below the desirable limit. Fluoride: Fluoride was observed slight beyond the permissible limit (1.5 mg/l) at Left Sajnam Canal and Right Sajnam Canal. Iron, Ammonia and Nitrate is observed within the limit at all locations.
Table 4.19: Water Sampling Results of Study Area Location Parameters
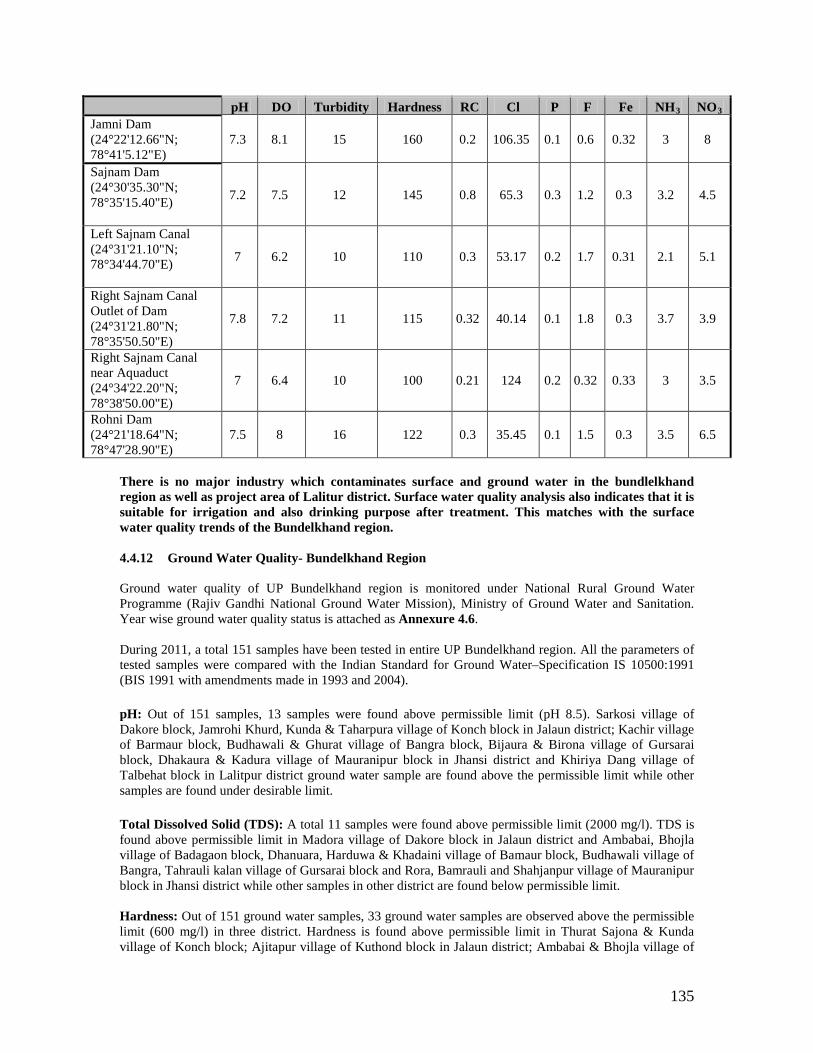
135
pH DO Turbidity Hardness RC Cl P F Fe NH3 NO3 Jamni Dam (24°22'12.66"N; 78°41'5.12"E)
7.3 8.1 15 160 0.2 106.35 0.1 0.6 0.32 3 8
Sajnam Dam (24°30'35.30"N; 78°35'15.40"E)
7.2 7.5 12 145 0.8 65.3 0.3 1.2 0.3 3.2 4.5
Left Sajnam Canal (24°31'21.10"N; 78°34'44.70"E)
7 6.2 10 110 0.3 53.17 0.2 1.7 0.31 2.1 5.1
Right Sajnam Canal Outlet of Dam (24°31'21.80"N; 78°35'50.50"E)
7.8 7.2 11 115 0.32 40.14 0.1 1.8 0.3 3.7 3.9
Right Sajnam Canal near Aquaduct (24°34'22.20"N; 78°38'50.00"E)
7 6.4 10 100 0.21 124 0.2 0.32 0.33 3 3.5
Rohni Dam (24°21'18.64"N; 78°47'28.90"E)
7.5 8 16 122 0.3 35.45 0.1 1.5 0.3 3.5 6.5
There is no major industry which contaminates surface and ground water in the bundlelkhand region as well as project area of Lalitur district. Surface water quality analysis also indicates that it is suitable for irrigation and also drinking purpose after treatment. This matches with the surface water quality trends of the Bundelkhand region. 4.4.12 Ground Water Quality- Bundelkhand Region Ground water quality of UP Bundelkhand region is monitored under National Rural Ground Water Programme (Rajiv Gandhi National Ground Water Mission), Ministry of Ground Water and Sanitation. Year wise ground water quality status is attached as Annexure 4.6. During 2011, a total 151 samples have been tested in entire UP Bundelkhand region. All the parameters of tested samples were compared with the Indian Standard for Ground Water–Specification IS 10500:1991 (BIS 1991 with amendments made in 1993 and 2004).
pH: Out of 151 samples, 13 samples were found above permissible limit (pH 8.5). Sarkosi village of Dakore block, Jamrohi Khurd, Kunda & Taharpura village of Konch block in Jalaun district; Kachir village of Barmaur block, Budhawali & Ghurat village of Bangra block, Bijaura & Birona village of Gursarai block, Dhakaura & Kadura village of Mauranipur block in Jhansi district and Khiriya Dang village of Talbehat block in Lalitpur district ground water sample are found above the permissible limit while other samples are found under desirable limit.
Total Dissolved Solid (TDS): A total 11 samples were found above permissible limit (2000 mg/l). TDS is found above permissible limit in Madora village of Dakore block in Jalaun district and Ambabai, Bhojla village of Badagaon block, Dhanuara, Harduwa & Khadaini village of Bamaur block, Budhawali village of Bangra, Tahrauli kalan village of Gursarai block and Rora, Bamrauli and Shahjanpur village of Mauranipur block in Jhansi district while other samples in other district are found below permissible limit. Hardness: Out of 151 ground water samples, 33 ground water samples are observed above the permissible limit (600 mg/l) in three district. Hardness is found above permissible limit in Thurat Sajona & Kunda village of Konch block; Ajitapur village of Kuthond block in Jalaun district; Ambabai & Bhojla village of

136
Badagaon block; Harduwa, Khadaini & Sarsenda village of Bamaur block; Budhawali & Sayawani bujurg village of Bangra block; Banka Pahari, Birona, Dhawari, Lohar Gaon, Shila, Lidhora, Mar Kuwan, Simardha, Tahrauli Kalan & Tahrauli Khas village of Gursai block; Rora, Bamrauli Estate, Shahjahanpur, Gangasagar & Saimra Dang of Mauranipur block in Jhansi diostrict; Bamhori Bansha, Jharkon, Andher, Kalyan Pura, Nadan Wara & Piprai village of Birdha block and Bari kalan & Chungi village of Talbehat block in Lalitpur district while other water samples are within permissible limit. Nitrate: Out of 151 ground water sample, 106 ground water samples were found above permissible limit. A total number 4 ground water samples were found above permissible limit in Jalaun; 58 in Jhansi; 30 in Lalitpur and 14 in Mahoba while other samples were found within permissible limit. Iron (Fe): A total 8 water samples were observed above permissible limit (1 mg/l), Fe is found more than permissible limit in Madora & Sarsoki village of Dakore block, Alaipura & Bhadvan village in Jalaun block of Jalaun district; Khadaini village of Bamaur block, Lakhawati village of Gursarai block in Jhansi district and Rangaon village of Birdha block and Targuwan village of Talbehat block in Lalitpur district while iron in other water sample was found within permissible limit. Fluoride: A total 12 samples were found above permissible limit (1.5 mg/l). Fluoride was found above permissible limit in Karyoali village of Konch block in Jalaun district; Dhanaura, Dundi, Pahara & Khadaini village of Bamaur block, Budhawali & Syawani Buzurg village of Bangra block, Bijaura & Dhurwai village of Gursai block, Chakara & Fatehpur village of Mauranipur block in Jhansi district and Raipur village of Birdha block in Lalitpur district while other water sample was found within permissible limit. 4.4.13 Ground Water Quality- Project Area Ground water quality of project area is also monitored under National Rural Ground water programme (Rajiv Gandhi National Ground Water Mission), Ministry of Ground Water and Sanitation. All the parameters of tested samples were compared with the Indian Standard for Ground Water–Specification IS 10500:1991 (BIS 1991 with amendments made in 1993 and 2004). pH: The pH is found highest in Khiriqamisar, Bhawani, Gugarwara, Jaraoli, Kakdari & Pah villages of Bar block; Patsemra & Tenga village of Birdha block; Piprat & Ramgarha village of Mandawara block and Baryo, Dhurwara, Khatora, Kuraura, Luharra & Sindwaha village of Mehrauni block. Rest of villages has below permissible limit. Block wise ground water quality status is attached as Annexure 4.6. Turbidity: The Turbidity is highest observed in Bamhori Kharait, Banoni, Billa, Semaria, Dashrara, Dailwara, Kakdari, Kuwagaon, Mathura Dang, Mirchwara , Khakron, Semrabhag, Nagar, Kailoni, Udaipura & Umari villages of Bar block; Bandar Gurha Village Of Birdha Block; Didonia Village Of Mandawara Block And Bamhori, Bahadursingh, Chhayan, Gadolikalan, Jakhaura, Kisarda, Bamhorighat, Rameshra, Sadumal, Samogar & Sindwaha village of Mehrauni block. Rest of village samples have below permissible limit. Nitrate: The Nitrate is observed highest in Billa, Daroni, Dashrara, Jaraoli, Mathura Dang, Todi & Udya Villages of Bar Block; Dongra Kalan & Pali Rural Village of Birdha Block; Bachhraoni, Dongra Kalan, Amora, Bhonta, Dhurwara, Chhapchhol, Deoran Kalan, Khatora, Bangaruwa, Mainwar, Bamhorighat, Rameshra, Saidpur & Samogar Village of Mandawara Block. Rest of village samples have value below permissible limit. Iron: Iron is found above permissible in Badokhara, Suri Khurd, Bamhori Kharait, Bhelonilodh, Daroni, Dashrara, Didaura, Bharoni, Jaraoli, Teela, Kakdari, Karmai, Kuwagaon, Mogan, Pah, Khakron, Pura Dhadkuwa, Semrabhag Nagar, Kailoni & Udaipura Villages in Bar Block and 4 Village in Birdha Block; 12 Village in Mehrauni block. Rest of village samples has below permissible limit. Fluoride: The Fluoride is found above permissible in 19 Villages of Bar Block, one village of Mandwara block and 19 Village of Mehrauni Block. Rest of villages in blocks is below permissible limit.

137
4.5 Forest & Biodiversity Aspect As per biodiversity report of UP, Bundelkhand has dry ecosystem. The vegetation of this region is tropical dry deciduous type, which can be further divided into mixed deciduous forests and dry thorn forests. District wise forest cover is given in Table 4.20 Natural Eco System • Mixed deciduous forests: The common constituents of these forests are the taller and dominant trees
of Terminalia elliptica, T. bellerica, Tectona grandis, Pterocarpus marsupium, Bombax ceiba, Cochlospermum religiosum, Diospyros melanoxylon, Lagerstroemia parviflora, Buchanania lanzan, Mitragyna parviflora, Sterculia urens, gardenia gummifera, Acacia catehu, Holarrhena antidysentrica, Ziziphus maruitiana, Calotropis procera, Adhatoda zeylainca and Woodfordia fruticosa. Among the climbers and shrubs Rhynchosia minima, Atylosia scarabaeoides, Mucuna pruriens, Cissampelos pareira, Ichnocarpus frutescens, Hemidesmus indicus, Tinsopora cordifolia, Dioscorea hispida and Cuscuta reflexa (a parasitic climber) are seen. Several species of moist deciduous forest may also be found in the forest area of Karvi in Banda particularly in sheltered places. Stunted sal of dry type appears in association with several different species.
• Dry thorn forests: These forests are mainly found in Jalaun, Lalitpur and Hamirpur areas. The scrub
vegetation is characterized by Ziziphus xylocarpus, Prosopis spicigera, Butea monosperma, Acacia nilotica, Calotropis procera, Bombax ceiba, and Gardenia spinosa. The intermixed shrubs are usually Flacourtia indica, Grewia rothii, Ziziphus mauritiana and Z. nummularia. The common climbers with twinning branches entangled with shrubs are Abrus precatorius, Cissampelos pareira, Mukia maderaspatana, Mimordica dioica and Gymnema syvestre.
Table 4.20: Forest Cover in Bundelkhand Area
(Area in km2)
District Year Geographical Area (GA)
Very Dense Forest
Moderate Dense Forest
Open Forest Total % of
GA Change Scrub
Banda 2011 4532 0 26 77 103 2.27 0 29 2009 4532 0 26 77 103 2.27 -1 29 2005 4532 0 27 76 103 2.27 0 29
Chitrakoot 2011 3092 0 358 203 561 18.14 0 15 2009 3092 0 358 203 561 18.14 0 15 2005 3092 0 346 208 554 17.92 0 14
Hamirpur 2011 4282 0 66 108 174 4.06 0 39 2009 4282 0 66 108 174 4.06 -2 39 2005 4282 0 67 111 178 4.16 0 38
Jalaun 2011 4565 0 65 179 244 5.35 0 48 2009 4565 0 65 179 244 5.35 1 48 2005 4565 0 68 179 247 5.41 0 49
Jhansi 2011 5024 0 33 167 200 3.98 0 121 2009 5024 0 33 167 200 3.98 0 121 2005 5024 0 34 168 202 4.02 0 119
Lalitpur 2011 5039 0 128 442 570 11.31 0 41 2009 5039 0 128 442 570 11.31 0 41 2005 5039 0 146 426 572 11.35 0 42
Mahoba 2011 2884 0 22 73 95 3.29 0 96 2009 2884 0 22 73 95 3.29 1 96

138
District Year Geographical Area (GA)
Very Dense Forest
Moderate Dense Forest
Open Forest Total % of
GA Change Scrub
2005 2884 0 20 74 94 3.26 0 95 Source: Forest Survey of India Report, 2001, 2009 & 2005 4.5.1 Endemic Plant There are two endemic species found within Bundelkhand which are given below. Name of Species & Family Place of Occurrence Rorippa pseudoislandica (Brassicaceae) Hamirpur Alectra chitrakutensis( Scrophulariaceae) Banda 4.5.2 Natural Ecosystem, Flora & Fauna in Project Area As per biodiversity report of UP, Project area has dry ecosystem. The vegetation of this region is tropical dry deciduous type, which can be further divided into mixed deciduous forests and dry thorn forests. District forest cover is given in Table 4.21.
Table 4.21: Forest Cover in Project Area (Area in km2)
District Year Geographical Area (GA)
Very Dense Forest
Moderate Dense Forest
Open Forest Total
% of GA Change Scrub
Lalitpur 2011 5039 0 128 442 570 11.31 0 41 2009 5039 0 128 442 570 11.31 0 41 2005 5039 0 146 426 572 11.35 0 42
Source: Forest Survey of India Report, 2001, 2009 & 2005 Table 4.21 indicates that moderate dense forest has slightly decreased over a period from 2005 to 2009 and it remains same in 2011. Total forest area has also slight reduced from 572 km2 to 570 km2 during the 2005 to 2009. 4.5.3 Wetlands Wetlands have been variously defined for different purpose, depending upon the specific objectives. The modified definition of Wetlands by International Union for the Conservation of Nature and Natural Resources (IUCN) is being used for the purposes of the present study. “All submerged or water saturated lands natural or manmade, inland or coastal, permanent or temporary, static or dynamic, vegetated or non–vegetated which necessarily have a land –water interface are defined as Wetlands”. As per the National wetland inventory assessment, 2011, district wise wetland map inventory and description of Bundelkhand Area is given as Annexure 4.7 and status of project area is discussed below: Lalitpur The total wetland area in the district is 34119 ha. Major wetland types of the district are reservoir/barrages. There are 14reservoirs/barrage in number with 23221 ha area and accounting for 68.06% of total wetland area of the district. Other major wetland types are: River/stream (15.3%), Tanks/pond (7.4%). There are 1127 small wetlands (<2.25 ha) identified and demarcated as point feature. Wetland area estimates of the district are summarized in Table 4.22. Area under aquatic vegetation in pre-monsoon season is 1261 ha during post-monsoon season while in pre-monsoon season it reduced to 671 ha. Water spread area in post-monsoon season is 28405 ha and in pre-monsoon season it is 12657 ha. Low turbidity of water is observed during both the seasons.

139
Table 4.22: Area estimates of wetlands in Lalitpur
Area in ha
Sr. No.
Wetland Code
Wetland Category
Number of
Wetlands
Total Wetland
Area
% of wetland
area
Open Water Post-
monsoon Area
Pre-monsoon
Area 1100 Inland Wetlands - Natural
1101 Lakes/Ponds 34 1338 3.92 740 305 1102
Ox-bow lakes/ Cut-off meanders
3 30 0.09 5 0
1103 High altitude wetlands - - - - - 1104 Riverine wetlands 60 368 1.08 317 132 1105 Waterlogged 83 275 0.81 213 24 1106 River/Strea 38 5225 15.31 1908 1717
1200
Inland Wetlands -Man-made
1201 Reservoirs/Barrages 14 23221 68.06 23149 10137 1202 Tanks/Ponds 371 2535 7.43 2073 342 1203 Waterlogged - - - - - 1204 Salt pans - - - - -
Sub-Total 603 32992 96.70 28405 12657 Wetlands (<2.25 ha),
mainly Tanks 1127 1127 3.30 - -
Total 1730 34119 100.00 28405 12657 Area under Aquatic Vegetation 1261 671 Area under turbidity levels Low 27352 27352 Moderate 620 145 High 433 63 Source: National Wetland Inventory Assessment Atlas, UP-2011

140
Figure 4.24: Wetland Area in Lalitpur and within Project Area
Jamini Dam
Sanjam Dam
Rohini Dam
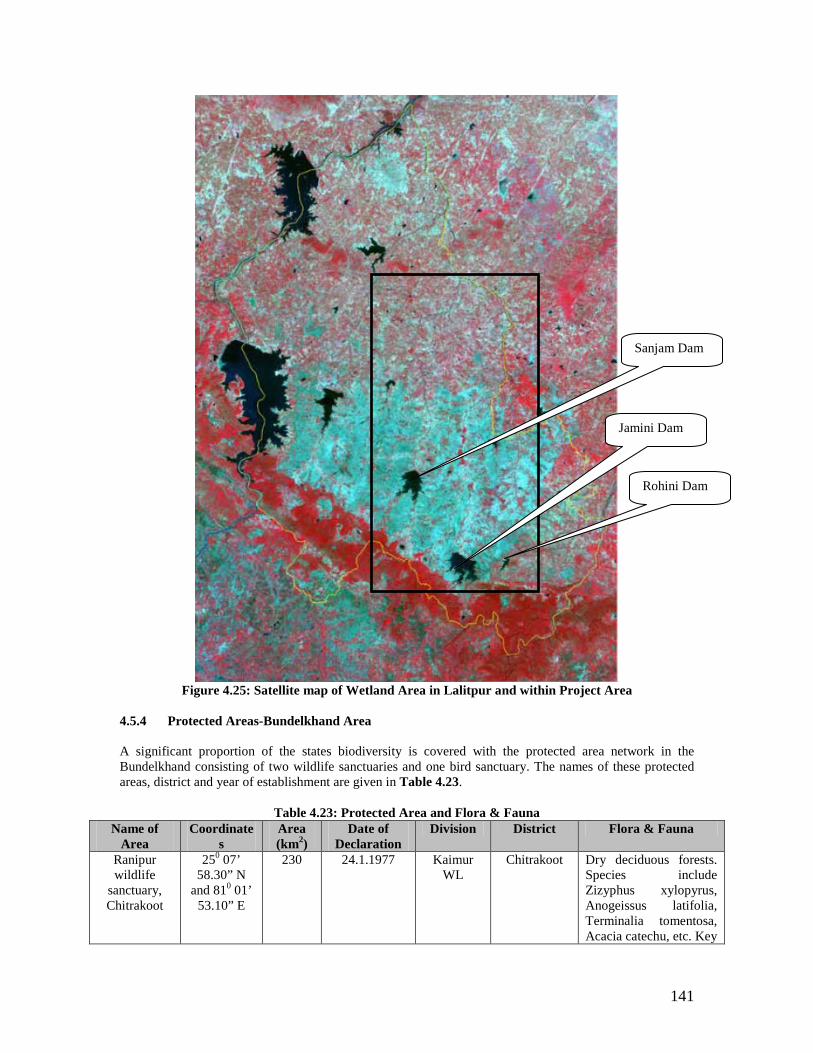
141
Figure 4.25: Satellite map of Wetland Area in Lalitpur and within Project Area
4.5.4 Protected Areas-Bundelkhand Area A significant proportion of the states biodiversity is covered with the protected area network in the Bundelkhand consisting of two wildlife sanctuaries and one bird sanctuary. The names of these protected areas, district and year of establishment are given in Table 4.23.
Table 4.23: Protected Area and Flora & Fauna Name of
Area Coordinate
s Area (km2)
Date of Declaration
Division District Flora & Fauna
Ranipur wildlife
sanctuary, Chitrakoot
250 07’ 58.30” N
and 810 01’ 53.10” E
230 24.1.1977 Kaimur WL
Chitrakoot Dry deciduous forests. Species include Zizyphus xylopyrus, Anogeissus latifolia, Terminalia tomentosa, Acacia catechu, etc. Key
Jamini Dam
Sanjam Dam
Rohini Dam
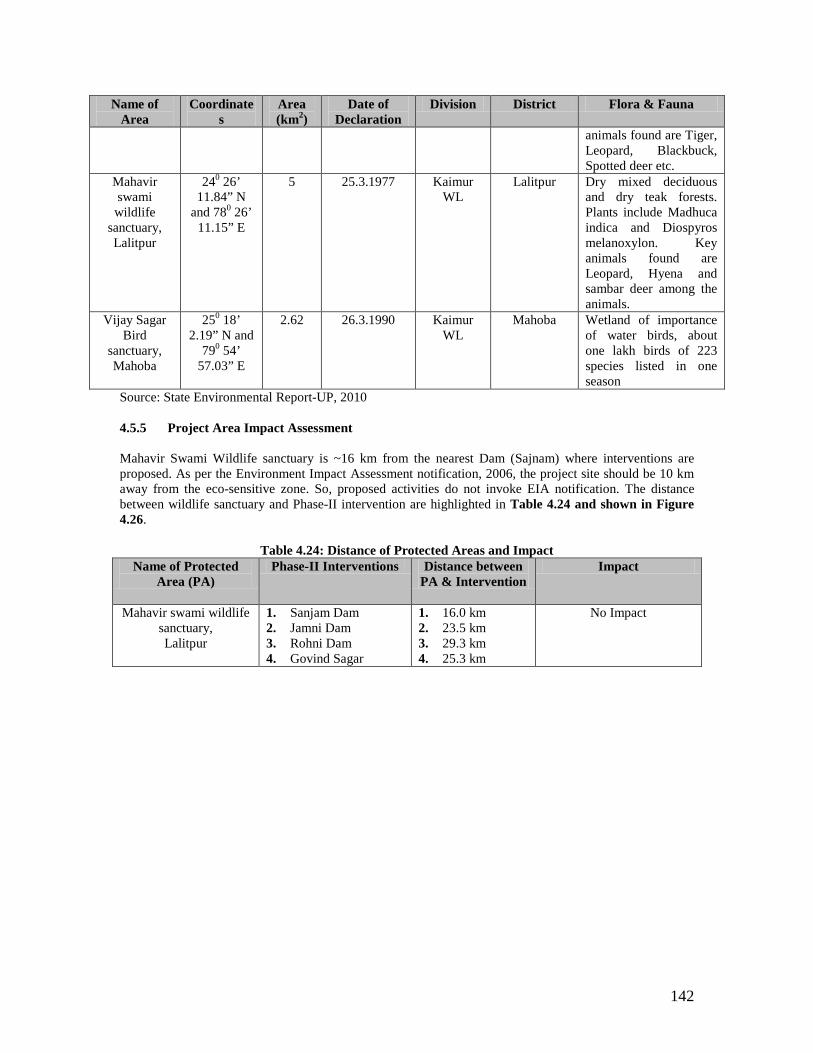
142
Name of Area
Coordinates
Area (km2)
Date of Declaration
Division District Flora & Fauna
animals found are Tiger, Leopard, Blackbuck, Spotted deer etc.
Mahavir swami wildlife
sanctuary, Lalitpur
240 26’ 11.84” N
and 780 26’ 11.15” E
5 25.3.1977 Kaimur WL
Lalitpur Dry mixed deciduous and dry teak forests. Plants include Madhuca indica and Diospyros melanoxylon. Key animals found are Leopard, Hyena and sambar deer among the animals.
Vijay Sagar Bird
sanctuary, Mahoba
250 18’ 2.19” N and
790 54’ 57.03” E
2.62 26.3.1990 Kaimur WL
Mahoba Wetland of importance of water birds, about one lakh birds of 223 species listed in one season
Source: State Environmental Report-UP, 2010 4.5.5 Project Area Impact Assessment Mahavir Swami Wildlife sanctuary is ~16 km from the nearest Dam (Sajnam) where interventions are proposed. As per the Environment Impact Assessment notification, 2006, the project site should be 10 km away from the eco-sensitive zone. So, proposed activities do not invoke EIA notification. The distance between wildlife sanctuary and Phase-II intervention are highlighted in Table 4.24 and shown in Figure 4.26.
Table 4.24: Distance of Protected Areas and Impact Name of Protected
Area (PA) Phase-II Interventions Distance between
PA & Intervention Impact
Mahavir swami wildlife sanctuary, Lalitpur
1. Sanjam Dam 2. Jamni Dam 3. Rohni Dam 4. Govind Sagar
1. 16.0 km 2. 23.5 km 3. 29.3 km 4. 25.3 km
No Impact
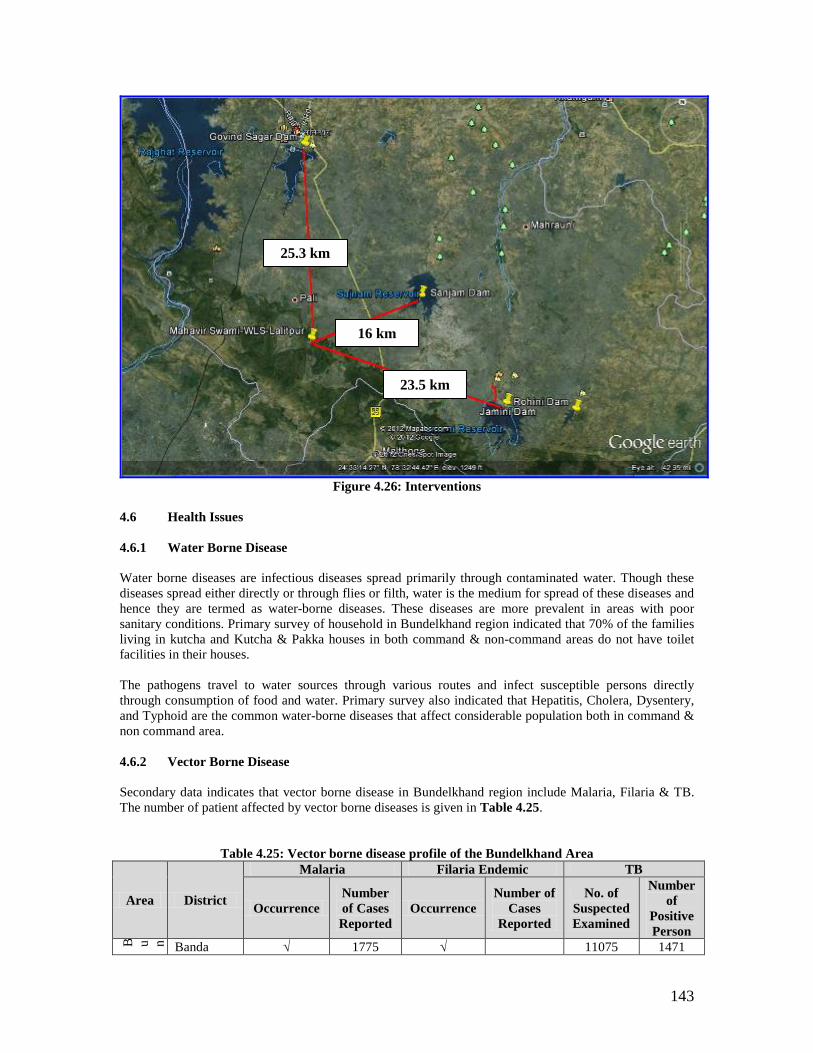
143
Figure 4.26: Interventions
4.6 Health Issues 4.6.1 Water Borne Disease Water borne diseases are infectious diseases spread primarily through contaminated water. Though these diseases spread either directly or through flies or filth, water is the medium for spread of these diseases and hence they are termed as water-borne diseases. These diseases are more prevalent in areas with poor sanitary conditions. Primary survey of household in Bundelkhand region indicated that 70% of the families living in kutcha and Kutcha & Pakka houses in both command & non-command areas do not have toilet facilities in their houses. The pathogens travel to water sources through various routes and infect susceptible persons directly through consumption of food and water. Primary survey also indicated that Hepatitis, Cholera, Dysentery, and Typhoid are the common water-borne diseases that affect considerable population both in command & non command area. 4.6.2 Vector Borne Disease Secondary data indicates that vector borne disease in Bundelkhand region include Malaria, Filaria & TB. The number of patient affected by vector borne diseases is given in Table 4.25.
Table 4.25: Vector borne disease profile of the Bundelkhand Area
Area District
Malaria Filaria Endemic TB
Occurrence Number of Cases Reported
Occurrence Number of
Cases Reported
No. of Suspected Examined
Number of
Positive Person
B u n
Banda √ 1775 √ 11075 1471
16 km
23.5 km
25.3 km
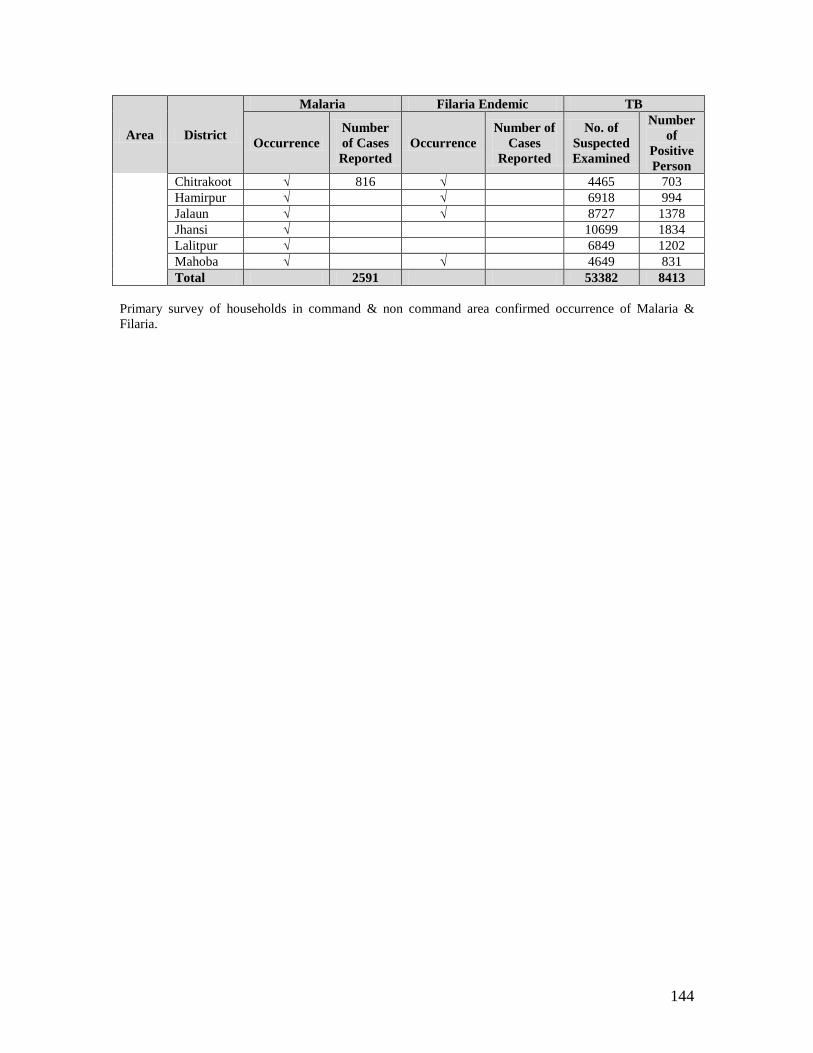
144
Area District
Malaria Filaria Endemic TB
Occurrence Number of Cases Reported
Occurrence Number of
Cases Reported
No. of Suspected Examined
Number of
Positive Person
Chitrakoot √ 816 √ 4465 703 Hamirpur √ √ 6918 994 Jalaun √ √ 8727 1378 Jhansi √ 10699 1834 Lalitpur √ 6849 1202 Mahoba √ √ 4649 831 Total 2591 53382 8413
Primary survey of households in command & non command area confirmed occurrence of Malaria & Filaria.
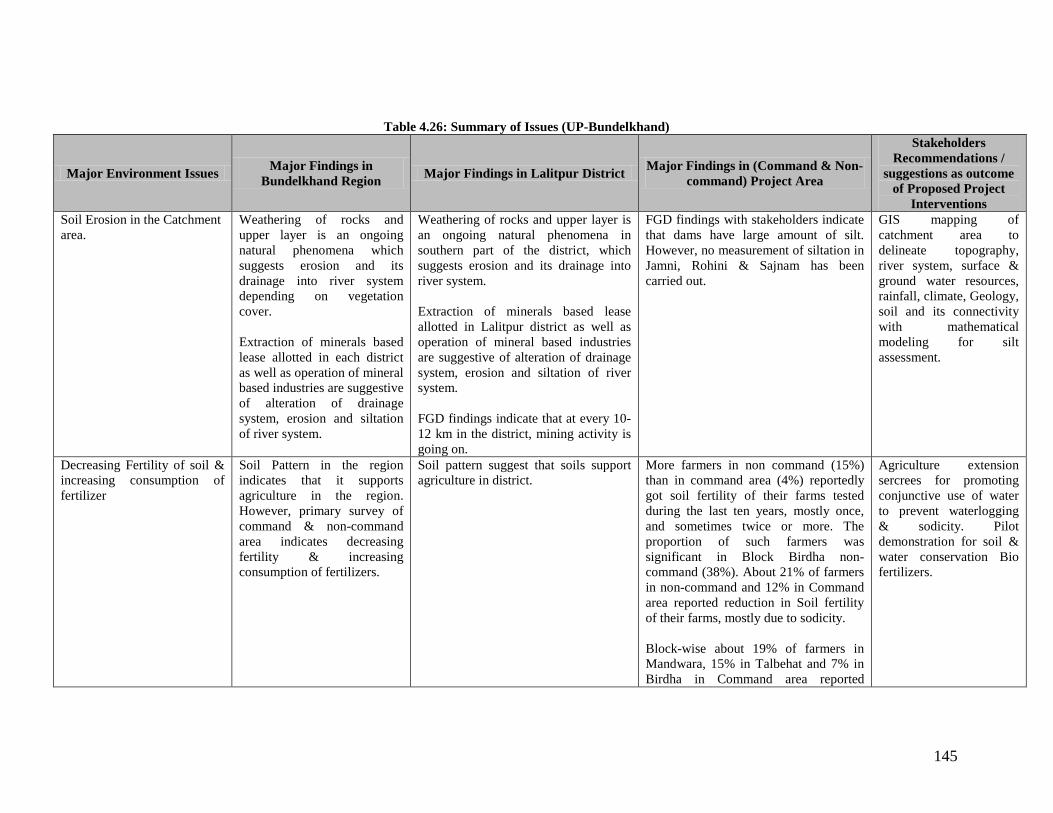
145
Table 4.26: Summary of Issues (UP-Bundelkhand)
Major Environment Issues Major Findings in Bundelkhand Region Major Findings in Lalitpur District Major Findings in (Command & Non-
command) Project Area
Stakeholders Recommendations /
suggestions as outcome of Proposed Project
Interventions Soil Erosion in the Catchment area.
Weathering of rocks and upper layer is an ongoing natural phenomena which suggests erosion and its drainage into river system depending on vegetation cover. Extraction of minerals based lease allotted in each district as well as operation of mineral based industries are suggestive of alteration of drainage system, erosion and siltation of river system.
Weathering of rocks and upper layer is an ongoing natural phenomena in southern part of the district, which suggests erosion and its drainage into river system. Extraction of minerals based lease allotted in Lalitpur district as well as operation of mineral based industries are suggestive of alteration of drainage system, erosion and siltation of river system. FGD findings indicate that at every 10-12 km in the district, mining activity is going on.
FGD findings with stakeholders indicate that dams have large amount of silt. However, no measurement of siltation in Jamni, Rohini & Sajnam has been carried out.
GIS mapping of catchment area to delineate topography, river system, surface & ground water resources, rainfall, climate, Geology, soil and its connectivity with mathematical modeling for silt assessment.
Decreasing Fertility of soil & increasing consumption of fertilizer
Soil Pattern in the region indicates that it supports agriculture in the region. However, primary survey of command & non-command area indicates decreasing fertility & increasing consumption of fertilizers.
Soil pattern suggest that soils support agriculture in district.
More farmers in non command (15%) than in command area (4%) reportedly got soil fertility of their farms tested during the last ten years, mostly once, and sometimes twice or more. The proportion of such farmers was significant in Block Birdha non-command (38%). About 21% of farmers in non-command and 12% in Command area reported reduction in Soil fertility of their farms, mostly due to sodicity.
Block-wise about 19% of farmers in Mandwara, 15% in Talbehat and 7% in Birdha in Command area reported
Agriculture extension sercrees for promoting conjunctive use of water to prevent waterlogging & sodicity. Pilot demonstration for soil & water conservation Bio fertilizers.

146
Major Environment Issues Major Findings in Bundelkhand Region Major Findings in Lalitpur District Major Findings in (Command & Non-
command) Project Area
Stakeholders Recommendations /
suggestions as outcome of Proposed Project
Interventions reduction in soil fertility of their farms while in non-command area about 27% of farmers in Birdha, 19% in Mandwari and 18% in Talbehat reported similar condition of soil fertility of their farms.
Further shortage of fertilizer is a serious constraint for a significant proportion of farmers in both command and non-command area.
Changes in land use particularly in catchment area e.g. decreasing forest cover & diversion of land for other uses (non agriculture)
Change in land use pattern from 2000-01 to 2008-09 indicate that forest area in the Bundelkhand declined from 268660 ha in 2000-01 to 244578 ha during 2008-09. Present fallow land increased from 145904 ha in 2000-01 to 184415 ha in 2008-09. Overall gross sown area increased in 2008-09 in comparison to 2000-01. This increase in 2008 is because of increase in gross sown area in Jalaun, Lalitpur & Mahoba, while in all other districts it declined.
Gross sown area increased from 49.71% in 2000-01 to 59.93% in 2008-09. Net sown area in command area increased from 52.38% to 55.99%.
Mehrauni (72.83%) block has highest net sown area followed by Bar (63.96%) and Birdha (55.30%) while Mandawara (50.74%) block was lowest. Area sown more than once of command area was 29.67% while in district it was 30.04%. Area sown more than once was highest in Bar (44.67%) block followed by Mehrauni (30.10%) and Birdha (27.48%) blocks. During the 2000-01, cropping intensity was 128.50% in 2008-09 it was 149.59%. FGD findings indicate that about 14% (75000 Ha) of the geographical area of Lalitpur was under forest cover, 70% open forest and 30% was dense forest.
Primary survey indicates tha overall gross sown area increased in 2008-09 in comparison to 2000-01. This increase in 2008-09 is because of increase in gross sown area in all blocks of command area. Further, gross sown area showed an increasing trend during Kharif except during 2005-06 & 2006-07, which can be attributed to drought years. This indicates that availability of water can further increase the gross sown area in the command. Forest area has decreased, while land put to use other than agriculture has increased. Primary survey in command area indicates that out of 110 families in Command area 12 having 12.6 Ha land and 28 families out of 190 in non command having 30.3 Ha land reportedly suffered from drought. The affected size of landholding suggest that
Preparation of knowledge base through GIS mapping of catchmernt & command area and promote pilot demonstration of interventions like forestry programs in catchment area. Pilot demonstration of livestock rearing as an alternate to Anna Pratha.
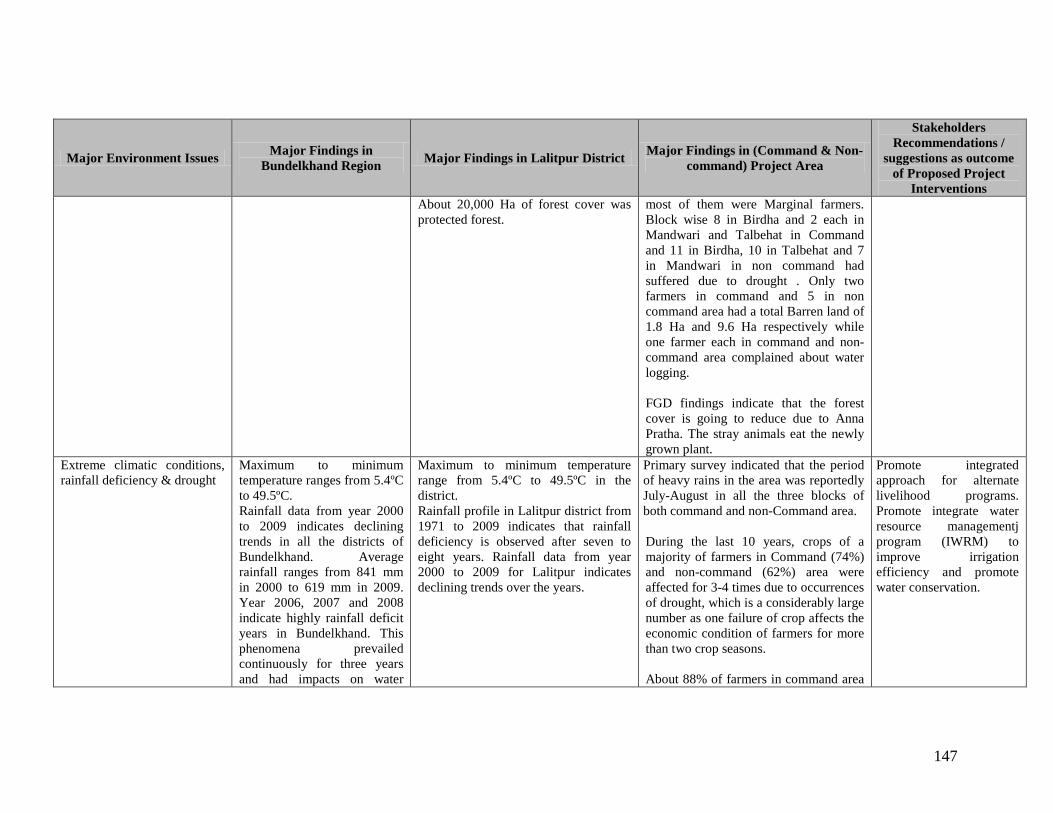
147
Major Environment Issues Major Findings in Bundelkhand Region Major Findings in Lalitpur District Major Findings in (Command & Non-
command) Project Area
Stakeholders Recommendations /
suggestions as outcome of Proposed Project
Interventions About 20,000 Ha of forest cover was protected forest.
most of them were Marginal farmers. Block wise 8 in Birdha and 2 each in Mandwari and Talbehat in Command and 11 in Birdha, 10 in Talbehat and 7 in Mandwari in non command had suffered due to drought . Only two farmers in command and 5 in non command area had a total Barren land of 1.8 Ha and 9.6 Ha respectively while one farmer each in command and non-command area complained about water logging. FGD findings indicate that the forest cover is going to reduce due to Anna Pratha. The stray animals eat the newly grown plant.
Extreme climatic conditions, rainfall deficiency & drought
Maximum to minimum temperature ranges from 5.4ºC to 49.5ºC. Rainfall data from year 2000 to 2009 indicates declining trends in all the districts of Bundelkhand. Average rainfall ranges from 841 mm in 2000 to 619 mm in 2009. Year 2006, 2007 and 2008 indicate highly rainfall deficit years in Bundelkhand. This phenomena prevailed continuously for three years and had impacts on water
Maximum to minimum temperature range from 5.4ºC to 49.5ºC in the district. Rainfall profile in Lalitpur district from 1971 to 2009 indicates that rainfall deficiency is observed after seven to eight years. Rainfall data from year 2000 to 2009 for Lalitpur indicates declining trends over the years.
Primary survey indicated that the period of heavy rains in the area was reportedly July-August in all the three blocks of both command and non-Command area. During the last 10 years, crops of a majority of farmers in Command (74%) and non-command (62%) area were affected for 3-4 times due to occurrences of drought, which is a considerably large number as one failure of crop affects the economic condition of farmers for more than two crop seasons. About 88% of farmers in command area
Promote integrated approach for alternate livelihood programs. Promote integrate water resource managementj program (IWRM) to improve irrigation efficiency and promote water conservation.

148
Major Environment Issues Major Findings in Bundelkhand Region Major Findings in Lalitpur District Major Findings in (Command & Non-
command) Project Area
Stakeholders Recommendations /
suggestions as outcome of Proposed Project
Interventions
resources. A simple root cause analysis indicates that rainfall deficiency triggers reduced water availability in canals, which may further trigger decline in agriculture production and water for other uses.
reported their crops were affected by drought between once and six times in the last 10 years. About 96% of affected farmers were in Block Birdha and Mandwari while in Talbehat about 65% of the farmers were affected.
About 79% of farmers in non-command reported their crops were affected between once and 8 times in the last 10 years. About 96% of farmers in Birdha, 92% in Talbehat and 55% in Mandwari suffered from such occurrences.
Air quality deterioration Recent mining activity is leading to deterioration of air quality.
FGD findings indicate that in the district almost at every 10-12 km., there is mining activity which has serious impact on environment.
FGD findings Indicate that air quality deteriorating due to mining activity in Command & Non-Command area.
Promote prevention of crop damage through coordination with agriculture extension service.
Limited availability of Surface Water
According to UPID data, about 2013 MCM of surface water is available from 28 existing reservoirs in UP
About 1014.6 MCM water is available from six reservoirs in Lalitpur district, which is more than 45% of the water available in UP Bundelkhand.
About 167 MCM water is available from Jamni, Sajnam and Rohini Dams, which is 16.4% of the total water available in Lalitpur district.
Rehabilitation & modernization of dams & hydraulic structures. Installation of

149
Major Environment Issues Major Findings in Bundelkhand Region Major Findings in Lalitpur District Major Findings in (Command & Non-
command) Project Area
Stakeholders Recommendations /
suggestions as outcome of Proposed Project
Interventions Bundelkhand.
Performance of Jamini reservoir live storage indicates that it ranged between 17.3% in 2007-08 to 100% during 2003-04 & 2005-06. Out of eleven year period, live storage ranged between 60% to 80% during four years, one year between 80% to 90% and above 90% during five years. During one year, the live storage capacity was less than 20%. Live storage trend indicates steep decrease during the period 2005 to 2009 indicating hydrological drought. Performance of Sajnam reservoir live storage indicates that it ranged between 17.9% during 2007-08 to 100% during 2005-06 & 2008-09. During eleven year period, it ranged between 60% to 80% during three years, while for one year, it ranged between 80% to 90%. During the remaining seven years, the live storage was below 60%. Live storage trend indicates steep decrease in capacity during the period 2005 to 2009 indicating hydrological drought. Further, near normal conditions are indicated during three years, when live storage capacity was above 90%. Live storage capacity of Rohini dam from 2000-01 to 2010-11 indicated that
hydrological instrumentation & data recording system for surface waqter resource management.

150
Major Environment Issues Major Findings in Bundelkhand Region Major Findings in Lalitpur District Major Findings in (Command & Non-
command) Project Area
Stakeholders Recommendations /
suggestions as outcome of Proposed Project
Interventions it ranged from zero in 2007-08 to 100% in 2005-06 and 2008-09. Storage capacity was above 90% during two years, while it ranged between 70% to 80% for three years. During five years, it was below 70%. Steep decrease in storage capacity was observed during 2005 to 2009 indicating hydrological drought. Above analysis indicates that near normal water availability have been observed for five years in Jamni, three years in Sajnam and two years in Rohini reservoirs during eleven year period. Considering 70% as the bare minimum live storage, it can be inferred that canal system from the three reservoirs can be operated to some extent for seven years. During the remaining four years, canal supplies for irrigation had to be curtailed significantly. During 2007-08, Jamni & Sajnam reservoirs had just 17% of water left while in Rohini reservoir it was negligible. Therefore, availability of water is a serious issue, which was confirmed during stakeholder consultations both in the district as well as the project area as highlighted in chapter 3.
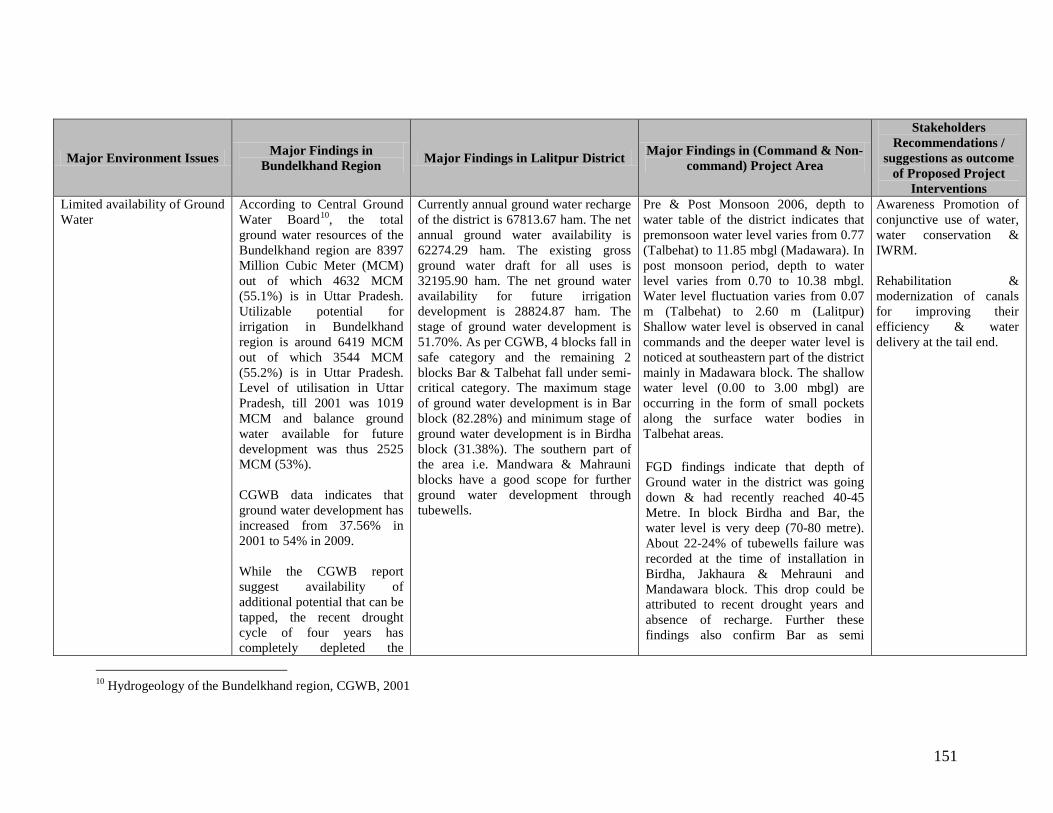
151
Major Environment Issues Major Findings in Bundelkhand Region Major Findings in Lalitpur District Major Findings in (Command & Non-
command) Project Area
Stakeholders Recommendations /
suggestions as outcome of Proposed Project
Interventions Limited availability of Ground Water
According to Central Ground Water Board10, the total ground water resources of the Bundelkhand region are 8397 Million Cubic Meter (MCM) out of which 4632 MCM (55.1%) is in Uttar Pradesh. Utilizable potential for irrigation in Bundelkhand region is around 6419 MCM out of which 3544 MCM (55.2%) is in Uttar Pradesh. Level of utilisation in Uttar Pradesh, till 2001 was 1019 MCM and balance ground water available for future development was thus 2525 MCM (53%). CGWB data indicates that ground water development has increased from 37.56% in 2001 to 54% in 2009. While the CGWB report suggest availability of additional potential that can be tapped, the recent drought cycle of four years has completely depleted the
Currently annual ground water recharge of the district is 67813.67 ham. The net annual ground water availability is 62274.29 ham. The existing gross ground water draft for all uses is 32195.90 ham. The net ground water availability for future irrigation development is 28824.87 ham. The stage of ground water development is 51.70%. As per CGWB, 4 blocks fall in safe category and the remaining 2 blocks Bar & Talbehat fall under semi-critical category. The maximum stage of ground water development is in Bar block (82.28%) and minimum stage of ground water development is in Birdha block (31.38%). The southern part of the area i.e. Mandwara & Mahrauni blocks have a good scope for further ground water development through tubewells.
Pre & Post Monsoon 2006, depth to water table of the district indicates that premonsoon water level varies from 0.77 (Talbehat) to 11.85 mbgl (Madawara). In post monsoon period, depth to water level varies from 0.70 to 10.38 mbgl. Water level fluctuation varies from 0.07 m (Talbehat) to 2.60 m (Lalitpur) Shallow water level is observed in canal commands and the deeper water level is noticed at southeastern part of the district mainly in Madawara block. The shallow water level (0.00 to 3.00 mbgl) are occurring in the form of small pockets along the surface water bodies in Talbehat areas.
FGD findings indicate that depth of Ground water in the district was going down & had recently reached 40-45 Metre. In block Birdha and Bar, the water level is very deep (70-80 metre). About 22-24% of tubewells failure was recorded at the time of installation in Birdha, Jakhaura & Mehrauni and Mandawara block. This drop could be attributed to recent drought years and absence of recharge. Further these findings also confirm Bar as semi
Awareness Promotion of conjunctive use of water, water conservation & IWRM. Rehabilitation & modernization of canals for improving their efficiency & water delivery at the tail end.
10 Hydrogeology of the Bundelkhand region, CGWB, 2001

152
Major Environment Issues Major Findings in Bundelkhand Region Major Findings in Lalitpur District Major Findings in (Command & Non-
command) Project Area
Stakeholders Recommendations /
suggestions as outcome of Proposed Project
Interventions available resource in drought prone districts in the absence of recharge from rainfall; during this period. Further yield and re-charging in the drought prone districts seem to be poor and additional ground water development appears to be economically unsustainable because of rocky terrain in Bundelkhand and cost of developing dug wells/tube wells being very high.
critical block.
Surface & Ground Water Quality
Surface Water Quality Surface water quality at all monitored locations is falling under class C and has the similar trend from 1985 to 2009. Class C indicates that water is fit for both drinking water purposes after conventional treatment & disinfection and also for irrigation as per national water quality classification criteria.
Ground Water Quality
Surface Water Quality Surface water quality at all location is falling under class C and has the similar trend from 1985 to 2009. Class C indicates that water is fit for both drinking water purposes after conventional treatment & disinfection and also for irrigation as per national water quality classification criteria. Ground Water Quality
pH: Khiriya Dang village of Talbehat
Surface Water Quality Project area (Jamni, Sajnam, Rohni Dam and canal system) has never been monitored by any agency. So, Pre- monsoon surface water quality assessment has been carried out in the command area of Jamini Dam, Rohni Dam and Sajnam Dam. • Turbidity is found beyond the
permissible limit (10 NTU) in all locations except Left Sajnam Canal and Right Sajnam Canal. Hardness is also observed within the desirable limit.
Regular monitoring of surface & ground water quality for developing database to identify sources of pollution & prevention.

153
Major Environment Issues Major Findings in Bundelkhand Region Major Findings in Lalitpur District Major Findings in (Command & Non-
command) Project Area
Stakeholders Recommendations /
suggestions as outcome of Proposed Project
Interventions pH: Out of 151 samples, 13 samples were found above permissible limit (pH 8.5) in Jalaun district, in Jhansi district and in Lalitpur district.
Total Dissolved Solid (TDS): A total 11 samples were found above permissible limit (2000 mg/l) in Jalaun district and in Jhansi district. Hardness: Out of 151 ground water samples, 33 ground water samples are observed above the permissible limit (600 mg/l) in Jalaun, Jhansi and Lalitpur districts. Nitrate: Out of 151 ground water sample, 106 ground water samples were found above permissible limit. in Jalaun; Jhansi, Lalitpur and Mahoba. Iron (Fe): A total 8 water samples were observed above permissible limit (1 mg/l), in Jalaun district, in Jhansi district
block in Lalitpur district ground water sample had with pH found above the permissible limit.
Total Dissolved Solid (TDS): TDS is found above permissible limit while other samples in other district are found below permissible limit. Hardness: Hardness is found above permissible limit in Bamhori Bansha, Jharkon, Andher, Kalyan Pura, Nadan Wara & Piprai village of Birdha block and Bari kalan & Chungi village of Talbehat block in Lalitpur had hardness above permissible limit. Nitrate: 30 samples in Lalitpur were found above permissible limit. Iron (Fe): Samples from Rangaon village of Birdha block and Targuwan village of Talbehat block in Lalitpur district were with iron found above permissible limit. Fluoride: Sample from Raipur village of Birdha block in Lalitpur district was found with Fluoride within above permissible limit.
• Residual Chlorine was found beyond the desirable limit (0.2 mg/l) at all locations.
• Fluoride was observed slight
beyond the permissible limit (1.5 mg/l) at Left Sajnam Canal and Right Sajnam Canal.
Ground Water Quality • pH: was highest in Khiriqamisar,
Bhawani, Gugarwara, Jaraoli, Kakdari & Pah villages of Bar block; Patsemra & Tenga village of Birdha block; Piprat & Ramgarha village of Mandawara block and Baryo, Dhurwara, Khatora, Kuraura, Luharra & Sindwaha village of Mehrauni block.
• Turbidity: was highest in
Bamhori Kharait, Banoni, Billa, Semaria, Dashrara, Dailwara, Kakdari, Kuwagaon, Mathura Dang, Mirchwara , Khakron, Semrabhag, Nagar, Kailoni, Udaipura & Umari villages of Bar block; Bandar Gurha Village Of Birdha Block; Didonia Village Of Mandawara Block And Bamhori,
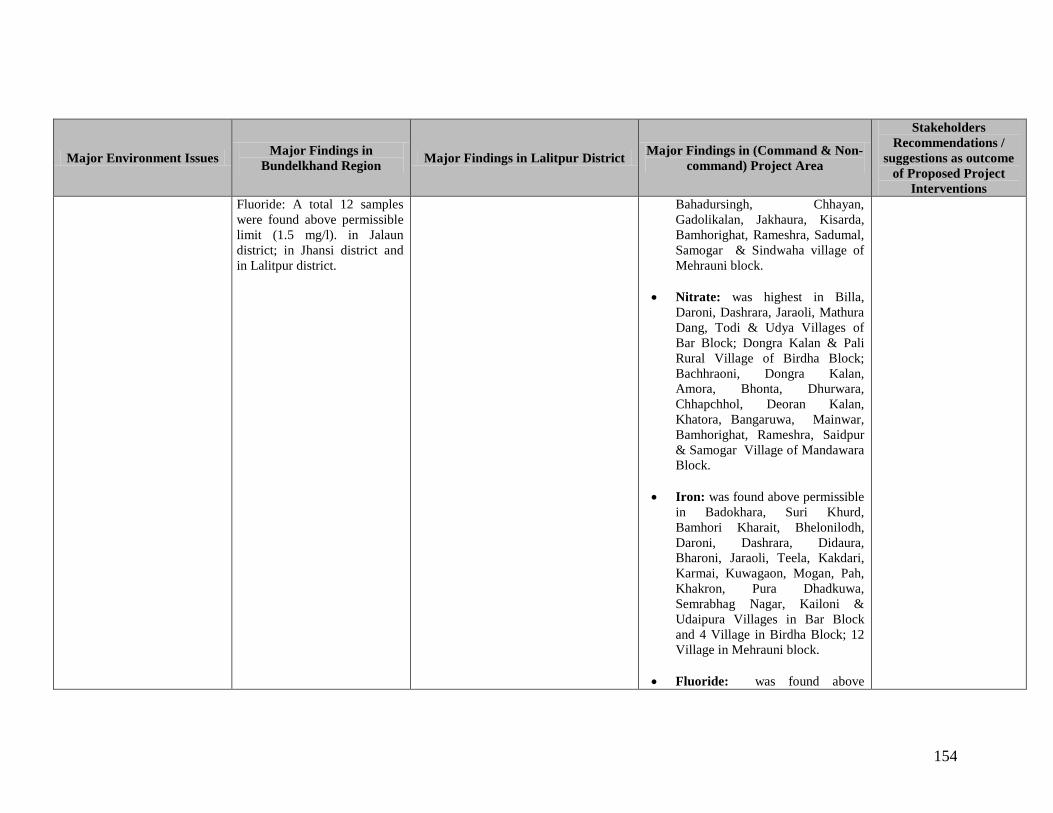
154
Major Environment Issues Major Findings in Bundelkhand Region Major Findings in Lalitpur District Major Findings in (Command & Non-
command) Project Area
Stakeholders Recommendations /
suggestions as outcome of Proposed Project
Interventions Fluoride: A total 12 samples were found above permissible limit (1.5 mg/l). in Jalaun district; in Jhansi district and in Lalitpur district.
Bahadursingh, Chhayan, Gadolikalan, Jakhaura, Kisarda, Bamhorighat, Rameshra, Sadumal, Samogar & Sindwaha village of Mehrauni block.
• Nitrate: was highest in Billa,
Daroni, Dashrara, Jaraoli, Mathura Dang, Todi & Udya Villages of Bar Block; Dongra Kalan & Pali Rural Village of Birdha Block; Bachhraoni, Dongra Kalan, Amora, Bhonta, Dhurwara, Chhapchhol, Deoran Kalan, Khatora, Bangaruwa, Mainwar, Bamhorighat, Rameshra, Saidpur & Samogar Village of Mandawara Block.
• Iron: was found above permissible
in Badokhara, Suri Khurd, Bamhori Kharait, Bhelonilodh, Daroni, Dashrara, Didaura, Bharoni, Jaraoli, Teela, Kakdari, Karmai, Kuwagaon, Mogan, Pah, Khakron, Pura Dhadkuwa, Semrabhag Nagar, Kailoni & Udaipura Villages in Bar Block and 4 Village in Birdha Block; 12 Village in Mehrauni block.
• Fluoride: was found above

155
Major Environment Issues Major Findings in Bundelkhand Region Major Findings in Lalitpur District Major Findings in (Command & Non-
command) Project Area
Stakeholders Recommendations /
suggestions as outcome of Proposed Project
Interventions permissible in 19 Villages of Bar Block, one village of Mandwara block and 19 Village of Mehrauni Block.
Increasing dependence on ground water for irrigation in comparison to surface water.
Third census of minor irrigation schemes (2001) suggests nearly 14% of net sown area of about 19 lakh ha is irrigated by major and medium schemes, 13% by gravity water and 1% by other surface water resources. Kharif irrigation is about 5% and Rabi about 95%. Nearly 70% of the area continues to be rain dependant. A comparative analysis of irrigated area of the Bundelkhand covered under different sources (Source: District Statistical Handbook) for 2000-01 and 2008-09 indicates that ground water use covers 16% of the reported irrigated area in the year 2000-01 and 28% in 2008-09. Surface water use covers 49% in 2000-01 and 45% in 2008-09. The data indicates that source of irrigation increased by 12% through ground water in Bundelkhand region.
In Lalitpur district, canals are the (more than 35%) major source of irrigation followed by wells (25%). The two sources contribute more than 60% irrigation. Districtwise temporal variation (eight years) of source of irrigation indicates significant increase in ground water irrigation during from 2000-01 to 2008-09. The decreased canal irrigation has been observed in 2007-08 and is indicative of reduced water availability in the canal system due to drought condition. Analysis also indicates heavy dependence on private tubewells & wells for irrigation in comparison to public tubewells. FGD findings in Lalitpur district, further confirms this trend.
Block wise temporal variation (Ten years) of source of irrigation indicates slight reduction of canal irrigation and increase in ground water irrigation during 2006 & 2007. The decreased canal irrigation is indicative of reduced water availability in the canal system during the subsequent years. This further indicates fluctuation in rainfall during these two years. Except for Mehrauni block, all the blocks showed increased dependence on ground water. It also indicates that Mehrauni block located on the head of the canal system gets the maximum advantage of canal irrigation. Further, Bar block, which is located at the tail end area of canal system indicates maximum dependence (43% to 69%) on ground water for irrigation. This increased dependence on ground water in Bar has resulted in 82% of ground water development in the block, thereby ranking it into semi critical category as per CGWB. This limits the scope of further development of ground water resources up to 8% to 10% in the block
Improving efficiency of canal irrigation by rehabilitation & modernization of canal system to prevent water losses and ensuring service delivery at the tail end. Awareness Promotion of conjunctive use of water, water conservation & IWRM.

156
Major Environment Issues Major Findings in Bundelkhand Region Major Findings in Lalitpur District Major Findings in (Command & Non-
command) Project Area
Stakeholders Recommendations /
suggestions as outcome of Proposed Project
Interventions and require interventions for increasing
efficiency in Canal System on the upstream side in order to deliver water in the tail end. In Jamni canal system, actual irrigation during Rabi ranged from 21% in 2006-07 to above 100% of the recent normal during 2005-06. 2006-07 indicated drastic cut in canal irrigation due to minimum live storage capacity of reservoir. During five years out of ten years the canal system could irrigate only 75% to 80% of the maximum irrigation, while during four years, it was above 90%. During Kharif season, irrigation from canal system was observed minimum during 2002-03, 2003-04 and 2007-08. This may be attributed due to nearly 60% live storage in Jamni reservoir during 2001-02, 2002-03 and extreme drought year in 2007-08. In Sajnam canal system, actual irrigation during Rabi ranged from 55% in 2007-08 to more than 100% of the recent normal during 2005-06. Six years out of ten years have been observed to be normal, where the canal system could irrigate near normal to maximum irrigation, while during three years canal

157
Major Environment Issues Major Findings in Bundelkhand Region Major Findings in Lalitpur District Major Findings in (Command & Non-
command) Project Area
Stakeholders Recommendations /
suggestions as outcome of Proposed Project
Interventions irrigation have been found to be below normal and one year as drought year. During Kharif season, irrigation from canal system was observed minimum, during 2003-04, while it was maximum during 2010-11. This may be attributed to nearly 60% live storage capacity in Sajnam reservoir. In Rohini canal system, actual irrigation during Rabi ranged from 20% during 2007-08 to above 100% during 2001-02 and 2004-05 & 2005-06. Six years out of ten years have been observed to be normal, where the canal system could irrigate normal to maximum irrigation, while during three years, canal irrigation have been found to below normal, while one year has been observed as drought year. During Kharif season, irrigation from canal system was observed minimum during 2003-04 and 2008-09, while it was maximum during 2005-06. Performance of canal system in terms of tail feeding from 2006-07 to 2011-12 indicates that irrigation was targeted only for 68% to 85% of the total tail ends during this period. Only 6% tail ends were fed during 2007-08 indicating drought conditions, while a maximum of 85% of the target was achieved during

158
Major Environment Issues Major Findings in Bundelkhand Region Major Findings in Lalitpur District Major Findings in (Command & Non-
command) Project Area
Stakeholders Recommendations /
suggestions as outcome of Proposed Project
Interventions two years (2006-07 & 2008-09). This indicated that tail ends do not receive water during majority of years. This could be due to either non availability of water on account of deficit rainfall or due to deficiencies in the canal operating system e.g. water losses. Data from UPID indicates that water losses per km in Jamni canal ranges from 1.72 cusec/km to 1.84/km. Similarly, in Sajnam canal system, it ranges from 1.80 cusec/km to 2.33 cusec/km, while in Rohini canal system, it is 1.09 cusec/km. FGD findings in the district Lalitpur and field interaction with the farmers confirm these findings.
Decrease in forest cover, vulnerability of Flora & Fauna
Landuse statistics indicate decrease in Forest cover. As per biodiversity report of UP Bundelkhand has dry ecosystem. The vegetation of this region is tropical dry deciduous type, which can be further divided into mixed deciduous forests and dry thorn forests. Two endemic plant species is found in Lalitpur district. Rorippa pseudoislandica
As per biodiversity report of UP, project area has dry ecosystem. The vegetation of this region is tropical dry deciduous type, which can be further divided into mixed deciduous forests and dry thorn forests. Moderate dense forest has slightly decreased over a period from 2005 to 2009 and it remains same in 2011. Total forest area has also slightly reduced from 572 km2 to 570 km2 during the 2005 to 2009.
FGD findings indicate that the district has a large number (aprox. 50) of medicinal species in the forest area. The varity of small medicinal trees are Bhangraj, Bhum amla, Shankh pushpi, Safed Musli, Shatabar, Harjor, Ashwgandha, Arusa, Thuar, etc. The tall varities of trees are Gulmarg, Amla, Bel, Beejasal, Mahua, Duddhi, Neem, Jamun, Arjun, Reetha, etc.
Arjun, Shankh pushpi and Jamun are found in abundance on both sides of
Promote afforestation programs & canal side plantations through ongoing forestry programs of forest department.
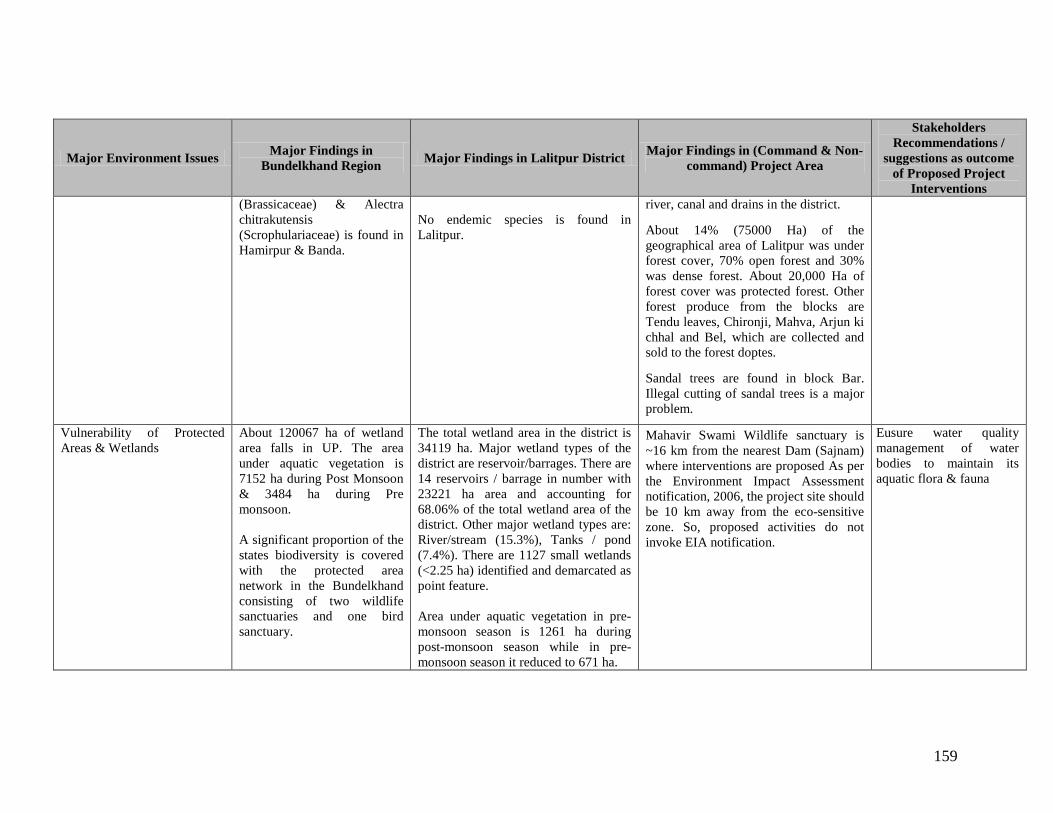
159
Major Environment Issues Major Findings in Bundelkhand Region Major Findings in Lalitpur District Major Findings in (Command & Non-
command) Project Area
Stakeholders Recommendations /
suggestions as outcome of Proposed Project
Interventions (Brassicaceae) & Alectra chitrakutensis (Scrophulariaceae) is found in Hamirpur & Banda.
No endemic species is found in Lalitpur.
river, canal and drains in the district.
About 14% (75000 Ha) of the geographical area of Lalitpur was under forest cover, 70% open forest and 30% was dense forest. About 20,000 Ha of forest cover was protected forest. Other forest produce from the blocks are Tendu leaves, Chironji, Mahva, Arjun ki chhal and Bel, which are collected and sold to the forest doptes.
Sandal trees are found in block Bar. Illegal cutting of sandal trees is a major problem.
Vulnerability of Protected Areas & Wetlands
About 120067 ha of wetland area falls in UP. The area under aquatic vegetation is 7152 ha during Post Monsoon & 3484 ha during Pre monsoon. A significant proportion of the states biodiversity is covered with the protected area network in the Bundelkhand consisting of two wildlife sanctuaries and one bird sanctuary.
The total wetland area in the district is 34119 ha. Major wetland types of the district are reservoir/barrages. There are 14 reservoirs / barrage in number with 23221 ha area and accounting for 68.06% of the total wetland area of the district. Other major wetland types are: River/stream (15.3%), Tanks / pond (7.4%). There are 1127 small wetlands (<2.25 ha) identified and demarcated as point feature. Area under aquatic vegetation in pre-monsoon season is 1261 ha during post-monsoon season while in pre-monsoon season it reduced to 671 ha.
Mahavir Swami Wildlife sanctuary is ~16 km from the nearest Dam (Sajnam) where interventions are proposed As per the Environment Impact Assessment notification, 2006, the project site should be 10 km away from the eco-sensitive zone. So, proposed activities do not invoke EIA notification.
Eusure water quality management of water bodies to maintain its aquatic flora & fauna
160
Chapter 5: Impact Assessment and Environmental and Social Management Framework 5.0 Introduction Social & Environmental Impact Assessment has been carried out based on Impact evaluation criteria. Based on the outcome of Social & Environmental Impact Assessment for project related activities, an appropriate Environmental & Social Management Framework (ESMF) has been formulated which needs to be implemented as part of UPWSRP Phase II. The ESMF formulated and presented here meets the requirements of the World Bank’s OP 1.01 on Project’s Environmental Management Plan and comprises of following elements:
• Screening & scoping of impact • Assessment of environmental and social impacts; • Environmental and Social Management Framework outlining mitigation measures, implementation
schedule and primary responsibility for implementation. Each of the above mentioned items are described below. 5.1 Categorization of Activities /Components
Categorization of activities/components envisaged in the project has been done and shown in Table 5.1 based on their extent of adverse environmental and social impacts. Based on Potential environmental and social impacts associated with each activity/component, these components have been classified under three categories.
Category A: Activity/Components which have major environmental/social impacts and require specific environment management plan (EMP) for implementation of mitigation measures. This EMP is to be incorporated in the bid document and contractor/implementing agencies has to follow this during construction as well as operation.
Category B: Components which have moderate environmental and social impacts and certain precautionary measures have to be followed by the contractor and the project authorities to minimize impacts during construction as well as operation.
Category C: Components which have negligible or nil environmental and social impacts and as such no mitigation measures have been proposed for these activities.

161
Table 5.1: Categorization of Project Intervention
Socio - Economic Components / Activities Category A Category B Category C
C1: Participatory Irrigation Management Hiring of services for formation of WUAs √ Awareness and village motivation campaign on PIM √ Preparation of landholders list and voter list for selected area √ Election of water users’ associations for selected area √ Election of kulaba and alpika samiti for selected area √ Registration and handling over of management of irrigation system to the WUAs √ Capacity building of UPID and WUAs; Training of PIM cell at division and circle √ Exposure trips to successful experiments √ Construction of office for WUAs in phase I area √ √ Construction of office for WUAs in phase 2 area √ √ Impact Assessment studies; Strengthening of PIM Cell PACT (Human Resource) √ C2: Rehabilitation of Canal & Drainage Systems Rehabilitation and Modernization Canal System. √ Dainage Rehabilitation √ Lining of Canal √ Rehabilitation of existing important Building e.g. Inspection houses, offices, colonies, video
conferencing centre etc. √
C 3: Piloting Alternative Branch – Level Management Mechanism for Water Service Provision & Maintenance as part of promoting Public-Private-Partnership in Irrigation Sector. Implementation in a participatory mode through active engagement of all the stakeholders at various
levels e.g. Ascertain equitable distribution of canal water. √
Optimally utilizing available water for intensive and diversified agriculture to promote for productivity gains in the crops along with promoting higher sown area in the Kharif season e.g. Promotion and extension of improved management mechanism for water service provision & maintenance; Increase production of cereals, pulses and oil seeds through improved practices for productivity enhancement in a sustainable manner; Restoring soil fertility and productivity; Enhancing farm level economy diversifying through vegetable and fruit cultivation.
√
Animal husbandry and dairy activities will be expanded as an ancillary activity to enhance farmer’s incomes as well as to cope with the drought conditions e.g. improving livestock and poultry productivity through breeding, feeding and management.
√
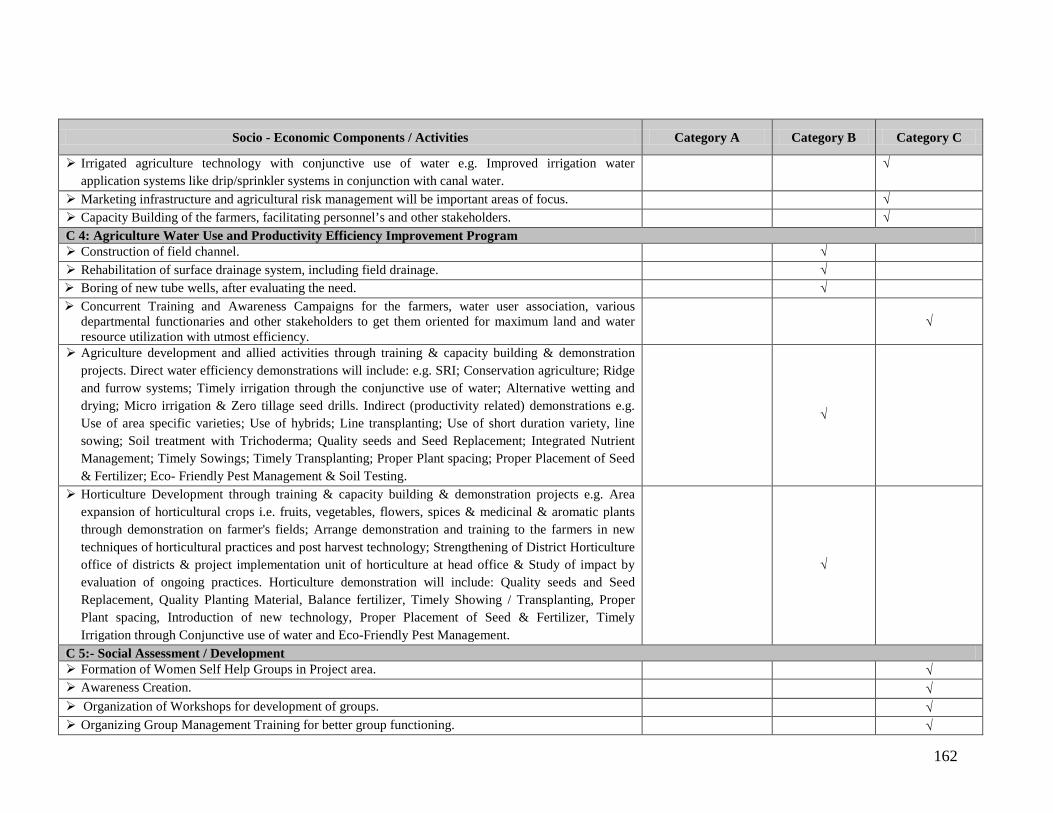
162
Socio - Economic Components / Activities Category A Category B Category C
Irrigated agriculture technology with conjunctive use of water e.g. Improved irrigation water application systems like drip/sprinkler systems in conjunction with canal water.
√
Marketing infrastructure and agricultural risk management will be important areas of focus. √ Capacity Building of the farmers, facilitating personnel’s and other stakeholders. √ C 4: Agriculture Water Use and Productivity Efficiency Improvement Program Construction of field channel. √ Rehabilitation of surface drainage system, including field drainage. √ Boring of new tube wells, after evaluating the need. √ Concurrent Training and Awareness Campaigns for the farmers, water user association, various
departmental functionaries and other stakeholders to get them oriented for maximum land and water resource utilization with utmost efficiency.
√
Agriculture development and allied activities through training & capacity building & demonstration projects. Direct water efficiency demonstrations will include: e.g. SRI; Conservation agriculture; Ridge and furrow systems; Timely irrigation through the conjunctive use of water; Alternative wetting and drying; Micro irrigation & Zero tillage seed drills. Indirect (productivity related) demonstrations e.g. Use of area specific varieties; Use of hybrids; Line transplanting; Use of short duration variety, line sowing; Soil treatment with Trichoderma; Quality seeds and Seed Replacement; Integrated Nutrient Management; Timely Sowings; Timely Transplanting; Proper Plant spacing; Proper Placement of Seed & Fertilizer; Eco- Friendly Pest Management & Soil Testing.
√
Horticulture Development through training & capacity building & demonstration projects e.g. Area expansion of horticultural crops i.e. fruits, vegetables, flowers, spices & medicinal & aromatic plants through demonstration on farmer's fields; Arrange demonstration and training to the farmers in new techniques of horticultural practices and post harvest technology; Strengthening of District Horticulture office of districts & project implementation unit of horticulture at head office & Study of impact by evaluation of ongoing practices. Horticulture demonstration will include: Quality seeds and Seed Replacement, Quality Planting Material, Balance fertilizer, Timely Showing / Transplanting, Proper Plant spacing, Introduction of new technology, Proper Placement of Seed & Fertilizer, Timely Irrigation through Conjunctive use of water and Eco-Friendly Pest Management.
√
C 5:- Social Assessment / Development Formation of Women Self Help Groups in Project area. √ Awareness Creation. √ Organization of Workshops for development of groups. √ Organizing Group Management Training for better group functioning. √

163
Socio - Economic Components / Activities Category A Category B Category C
Promotion of saving and credit activity in groups. √ Grading of WSHGs. √ To promote economic activity in the group providing revolving fund in the groups and establish their
CCL with Banks.
√
The Groups after establishing their CCL from Banks will be handed over to the concerned departments (Animal Husbandry, Fisheries, Horticulture etc.) for economic activity as per the proposal of the group.
√
The willing groups of BPL categories will also be linked with SGSY scheme of the department as per guidelines.
√
Marketing assistance to groups’ produce through organizing exhibitions and melas. √ Exposure Trips to various successful experiences of other states. √ Participation in national/ international exhibitions and events. √ ‘Impact Assessment of WSHGs Formation and its functioning on the socio-economic betterment of
their families’.
√
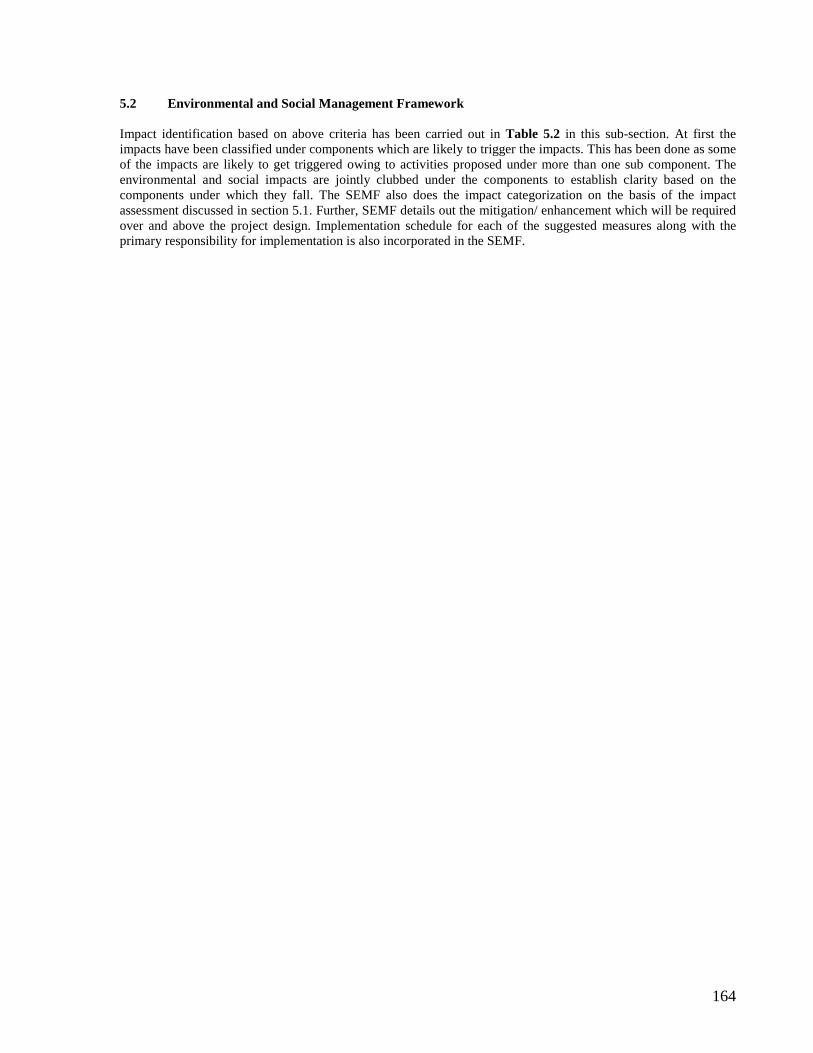
164
5.2 Environmental and Social Management Framework Impact identification based on above criteria has been carried out in Table 5.2 in this sub-section. At first the impacts have been classified under components which are likely to trigger the impacts. This has been done as some of the impacts are likely to get triggered owing to activities proposed under more than one sub component. The environmental and social impacts are jointly clubbed under the components to establish clarity based on the components under which they fall. The SEMF also does the impact categorization on the basis of the impact assessment discussed in section 5.1. Further, SEMF details out the mitigation/ enhancement which will be required over and above the project design. Implementation schedule for each of the suggested measures along with the primary responsibility for implementation is also incorporated in the SEMF.
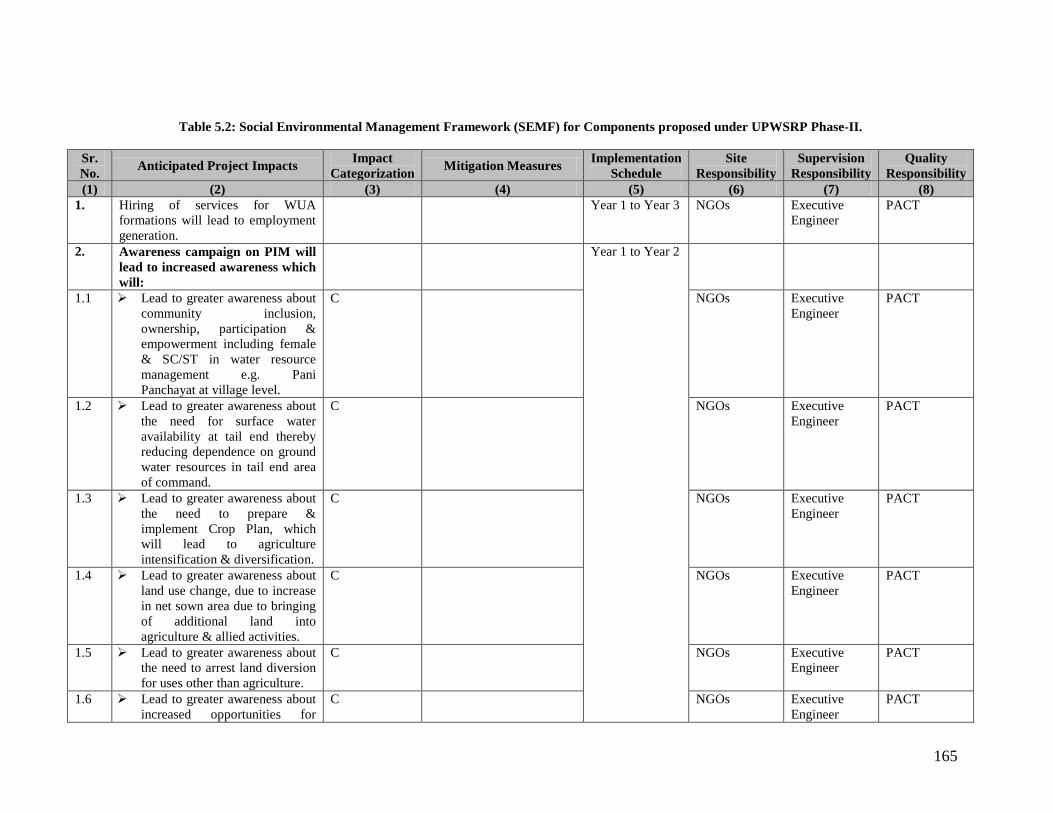
165
Table 5.2: Social Environmental Management Framework (SEMF) for Components proposed under UPWSRP Phase-II. Sr. No. Anticipated Project Impacts Impact
Categorization Mitigation Measures Implementation Schedule
Site Responsibility
Supervision Responsibility
Quality Responsibility
(1) (2) (3) (4) (5) (6) (7) (8) 1. Hiring of services for WUA
formations will lead to employment generation.
Year 1 to Year 3 NGOs Executive Engineer
PACT
2. Awareness campaign on PIM will lead to increased awareness which will:
Year 1 to Year 2
1.1 Lead to greater awareness about community inclusion, ownership, participation & empowerment including female & SC/ST in water resource management e.g. Pani Panchayat at village level.
C NGOs Executive Engineer
PACT
1.2 Lead to greater awareness about the need for surface water availability at tail end thereby reducing dependence on ground water resources in tail end area of command.
C NGOs Executive Engineer
PACT
1.3 Lead to greater awareness about the need to prepare & implement Crop Plan, which will lead to agriculture intensification & diversification.
C NGOs Executive Engineer
PACT
1.4 Lead to greater awareness about land use change, due to increase in net sown area due to bringing of additional land into agriculture & allied activities.
C NGOs Executive Engineer
PACT
1.5 Lead to greater awareness about the need to arrest land diversion for uses other than agriculture.
C NGOs Executive Engineer
PACT
1.6 Lead to greater awareness about increased opportunities for
C NGOs Executive Engineer
PACT

166
Sr. No. Anticipated Project Impacts Impact
Categorization Mitigation Measures Implementation Schedule
Site Responsibility
Supervision Responsibility
Quality Responsibility
(1) (2) (3) (4) (5) (6) (7) (8) sustainable livelihood through agriculture & allied activities triggering arrest of changes in occupational pattern; reduction in indebtedness & finally reduction in financial risk & vulnerability.
1.7 Lead to greater awareness about soil fertility, soil erosion and waste dumping / utilization of waste for useful purposes.
C NGOs Executive Engineer
PACT
1.8 Lead to greater awareness and knowledge base about air pollution, GHG emissions and extreme climate events.
C NGOs Executive Engineer
PACT
1.9 Lead to increased awareness about water pollution, causes of pollution, surface and ground water quality as well as the sources of pollution e.g. nutrient transport from agriculture field into water body may cause eutrophication of water bodies.
C NGOs Executive Engineer
PACT
1.10 Lead to increased awareness about the need to conserve fodder & develop pasture land/ Sodic land.
C NGOs Executive Engineer
PACT
1.11 Lead to increased awareness about the need to protect Flora, Fauna, Protected Areas, Cultural Heritage & Wetlands.
C NGOs Executive Engineer
PACT
1.12 Lead to increased awareness about the need to protect and conserve drinking water sources for arresting water & vector borne diseases, improve
C NGOs Executive Engineer
PACT

167
Sr. No. Anticipated Project Impacts Impact
Categorization Mitigation Measures Implementation Schedule
Site Responsibility
Supervision Responsibility
Quality Responsibility
(1) (2) (3) (4) (5) (6) (7) (8) sanitation practices and address public health.
3. Election of candidates / farmers / SC/ST in water user’s association at all levels (field / Kolaba / alpika / others) will not only lead to empowerment of females, vulnerable groups about also ensure their ownership and partnership in decision making.
C Zero Year to Year 4
NGOs Executive Engineer
PACT
4. Registration & handing over of management of irrigation system to WUAs will:
C Year 1 NGOs Executive Engineer
PACT
3.1 Lead to competing uses community inclusion, ownership, participation & empowerment including female & SC/ST in water resource management at village level.
C NGOs Executive Engineer
PACT
3.2 Lead to surface water availability at tail end thereby reducing dependence on ground water resources in tail end.
C NGOs Executive Engineer
PACT
3.3 Lead to preparation & implementation Crop Plan, which will lead to agriculture intensification & diversification.
C NGOs Executive Engineer
PACT
3.4 Lead to increase in net sown area and bring additional land into agriculture & allied activities.
C NGOs Executive Engineer
PACT
3.5 Lead to arrest of land diversion for uses other than agriculture.
C NGOs Executive Engineer
PACT
3.6 Lead to increased opportunities for sustainable livelihood
C NGOs Executive Engineer
PACT
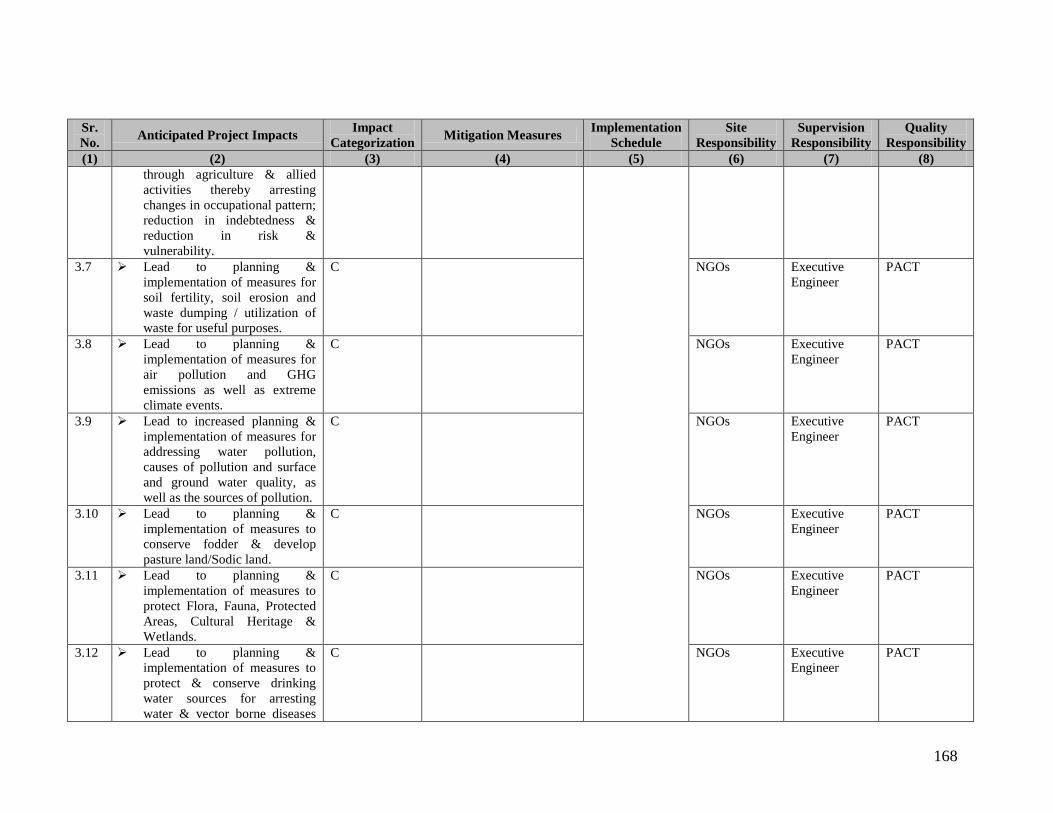
168
Sr. No. Anticipated Project Impacts Impact
Categorization Mitigation Measures Implementation Schedule
Site Responsibility
Supervision Responsibility
Quality Responsibility
(1) (2) (3) (4) (5) (6) (7) (8) through agriculture & allied activities thereby arresting changes in occupational pattern; reduction in indebtedness & reduction in risk & vulnerability.
3.7 Lead to planning & implementation of measures for soil fertility, soil erosion and waste dumping / utilization of waste for useful purposes.
C NGOs Executive Engineer
PACT
3.8 Lead to planning & implementation of measures for air pollution and GHG emissions as well as extreme climate events.
C NGOs Executive Engineer
PACT
3.9 Lead to increased planning & implementation of measures for addressing water pollution, causes of pollution and surface and ground water quality, as well as the sources of pollution.
C NGOs Executive Engineer
PACT
3.10 Lead to planning & implementation of measures to conserve fodder & develop pasture land/Sodic land.
C NGOs Executive Engineer
PACT
3.11 Lead to planning & implementation of measures to protect Flora, Fauna, Protected Areas, Cultural Heritage & Wetlands.
C NGOs Executive Engineer
PACT
3.12 Lead to planning & implementation of measures to protect & conserve drinking water sources for arresting water & vector borne diseases
C NGOs Executive Engineer
PACT

169
Sr. No. Anticipated Project Impacts Impact
Categorization Mitigation Measures Implementation Schedule
Site Responsibility
Supervision Responsibility
Quality Responsibility
(1) (2) (3) (4) (5) (6) (7) (8) improve sanitation practices and address public health issue.
5. Training & Capacity Building of UPID & WUA’s will lead to planning & implementation of:
C Year 1 to Year 5
4.1 Community inclusion, ownership, participation & empowerment including female & SC/ST in water resource management.
C
4.2 Surface water availability at tail end thereby reducing dependence on ground water resources in tail end.
B
Prevention of seepage losses and water logging monitoring water availability at the tail end.
4.3 Preparation & implementation of Crop Plan, which will lead to agriculture intensification & diversification.
B Soil Quality Monitoring, Water Quality Monitoring.
4.4 Bring additional land into agriculture & allied activities.
B Monitoring of landuse change.
4.5 Arresting of land diversion for use other than agriculture.
B Monitoring of landuse change.
4.6 Developing increased opportunities for sustainable livelihood through agriculture & allied activities thereby arresting changes in occupational pattern reduction in indebtedness & reduction in risk & vulnerability.
B Monitoring of indebtedness
4.7 Measures for soil fertility, soil erosion and waste dumping / utilization of waste for useful purposes.
B Top soil restoration using farm yard manure. Prevention of soil loss through bunding waste dumping at designated sites waste utilization for
170
Sr. No. Anticipated Project Impacts Impact
Categorization Mitigation Measures Implementation Schedule
Site Responsibility
Supervision Responsibility
Quality Responsibility
(1) (2) (3) (4) (5) (6) (7) (8) biocomposting.
4.8 Measures for addressing air pollution and GHG emissions as well as extreme climate events.
B Reduction of GHG emissions through alternate cropping.
4.9 Measures for addressing water pollution, causes of pollution, surface and ground water quality as well as the sources of pollution.
B Monitoring of water quality measurement and reduction in pesticide consumption Assessment of chemical fertilizer consumption.
4.10 Measures for conserving fodder & developing pasture land/sodic land.
B Conjunctive use of water top soil restoration Green Plantation.
4.11 Measures for protecting Flora, Fauna, Protected Areas, Cultural Heritage & Wetlands.
B Prevention of encroachment into wetlands, Cultural Heritage Protected areas.
4.12 Measures for protecting & conserving drinking water sources for arresting water & vector borne diseases, improving sanitation practices and addressing public health issue.
B Prevention of water logging waste dumping at designated place.
6. Exposure trips to sites of successful experiments will:
C Year 4 to Year 5 NGOs Executive Engineer
PACT
5.1 Lead to learinng about community inclusion, ownership, participation & empowerment including female & SC/ST in water resource management.
C NGOs Executive Engineer
PACT
5.2 Lead to learning about surface water availability at tail end thereby reducing dependence
C NGOs Executive Engineer
PACT

171
Sr. No. Anticipated Project Impacts Impact
Categorization Mitigation Measures Implementation Schedule
Site Responsibility
Supervision Responsibility
Quality Responsibility
(1) (2) (3) (4) (5) (6) (7) (8) on ground water resources in tail end.
5.3 Lead to learning about the need to prepare & implement Crop Plan, which will lead to agriculture intensification & diversification.
C NGOs Executive Engineer
PACT
5.4 Lead to learning about increase in net sown area and bringing additional land into agriculture & allied activities.
C NGOs Executive Engineer
PACT
5.5 Lead to learning about arrest of land diversion for user other than agriculture.
C NGOs Executive Engineer
PACT
5.6 Lead to learning about increased opportunities for sustainable livelihood through agriculture & allied activities thereby arresting changes in occupational pattern; reduction in indebtedness & reduction in financial risk & vulnerability.
C NGOs Executive Engineer
PACT
5.7 Lead to learning about soil fertility, soil erosion and dumping / utilization of waste for useful purposes.
C NGOs Executive Engineer
PACT
5.8 Lead to learning about water pollution, causes of pollution, surface and ground water quality as well as the sources of pollution e.g. eutrophication of water bodies & its causes.
C NGOs Executive Engineer
PACT
5.9 Lead to learning about the need to conserve fodder & develop pasture land/sodic land.
C NGOs Executive Engineer
PACT

172
Sr. No. Anticipated Project Impacts Impact
Categorization Mitigation Measures Implementation Schedule
Site Responsibility
Supervision Responsibility
Quality Responsibility
(1) (2) (3) (4) (5) (6) (7) (8) 5.10 Lead to learning about the need
to protect Flora, Fauna, Protected Areas, Cultural Heritage & Wetlands.
C NGOs Executive Engineer
PACT
5.11 Lead to learning about the need to protect conserve drinking water sources for arresting water & vector borne diseases improve sanitation practices and address public health issue.
C NGOs Executive Engineer
PACT
7. Construction of office for WUAs in phase 1 & Phase II may require additional land for construction and also for creation of infrastructure for providing services.
A Year 2 to Year 3
Contractor Executive Engineer
Third Party / PACT
6.1 Construction of WUAs office building
6.2 Labor Camps Worker local People Exposure
Impact on human health (Labor Camps)
Routine medical check up of Field staff and labours
Provision of potable drinking water at site
Provision of proper sewage and waste disposal system. Sanitation facilities have to be provided at the camp sites.
Awareness program on HIV aids and other communicable disease may be provided to the work force.
First aid facilities to
Contractor Executive Engineer
Third Party / PACT

173
Sr. No. Anticipated Project Impacts Impact
Categorization Mitigation Measures Implementation Schedule
Site Responsibility
Supervision Responsibility
Quality Responsibility
(1) (2) (3) (4) (5) (6) (7) (8) be provided at the construction camps. Any case of disease outbreak may be immediately subjected to medical treatment. Mosquito repellant to be provided to the labors such as odomas, coil and sprays. The camps may maintain cleanliness and hygienic condition.
Proper ventilation may be provided in labour camps
Sufficient fuel may be provided to the work force at campsite. Alternate arrangement for fuel such as provision of LPG, Kerosene etc. to be provided to the camp
Head phones, ear plugs to be provided to the workers at construction site.
All workers employed on mixing of asphaltic material, cement, lime mortars, concrete etc. may be provided with protective footwear and protective goggles. Workers involved in welding

174
Sr. No. Anticipated Project Impacts Impact
Categorization Mitigation Measures Implementation Schedule
Site Responsibility
Supervision Responsibility
Quality Responsibility
(1) (2) (3) (4) (5) (6) (7) (8) work may be provided with welder’s protective eye shields
Adequate precaution must be taken to prevent danger from electrical equipments
6.3 Heavy machinery Air / Noise Pollution Soil Pollution
Worker local People Exposure
Limit hours of operation in populated areas
Use of barriers to reduce exposure
All crusher used in construction should confirm to relative dust emission devises
Low emission construction equipment, vehicles and generator sets may be used
Collection and recycling of lubricants
Measures to prevent accidental Spills
Locate handling sites away from populated areas
Follow proper operation and handling measures to minimize exposure
Provide prior warning /signals
Provide sirens in vehicles to avoid any collision with
Contractor Executive Engineer
Third Party / PACT

175
Sr. No. Anticipated Project Impacts Impact
Categorization Mitigation Measures Implementation Schedule
Site Responsibility
Supervision Responsibility
Quality Responsibility
(1) (2) (3) (4) (5) (6) (7) (8) human/animals
Organise awareness programs on environmental resource management
Organise Health camps
Child labour must be strictly prohibited
Provide signages near construction sites and approach roads
6.4 Hot mix plant Air / Noise Pollution
Soil Pollution
Worker local People Exposure
Air pollution control measure like water sprinkling
Limit hours of operation in populated areas
Use of barriers to reduce exposure
Plants, machinery and equipment may be handled so as to minimize generation of dust.
All crusher used in construction should confirm to relative dust emission devises
Low emission construction equipment, vehicles and generator sets may be used
Air quality monitoring may be conducted at construction sites.
Contractor Executive Engineer
Third Party / PACT
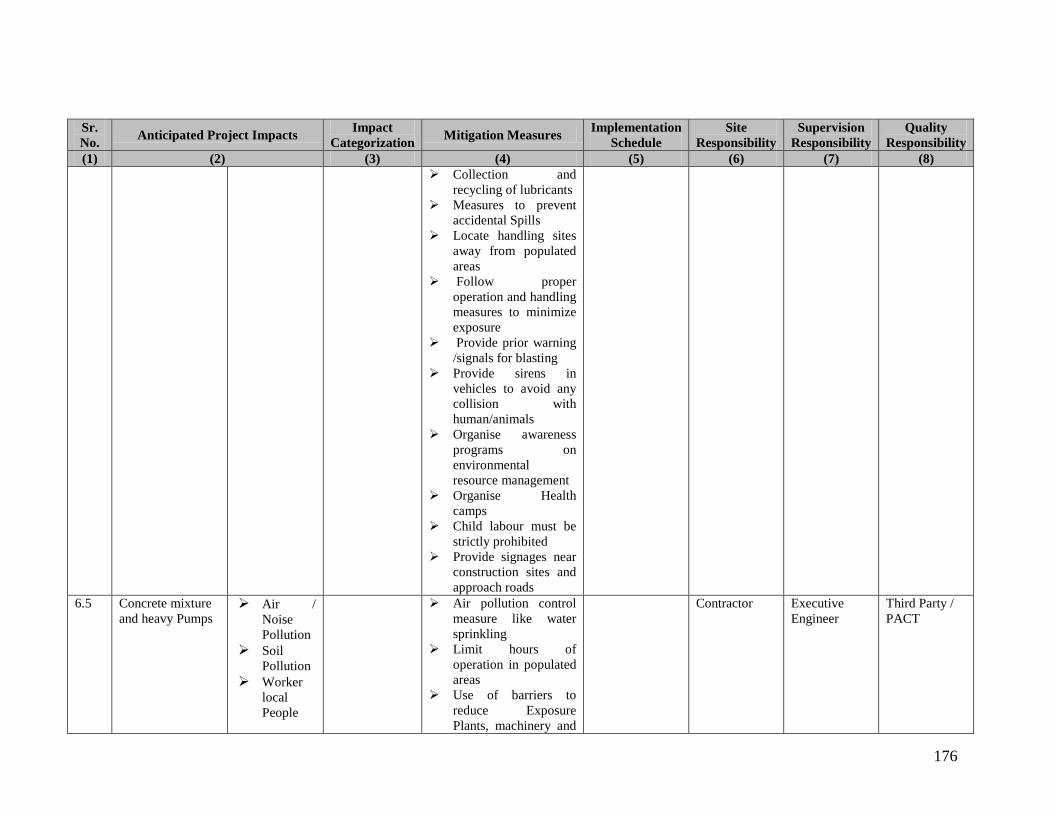
176
Sr. No. Anticipated Project Impacts Impact
Categorization Mitigation Measures Implementation Schedule
Site Responsibility
Supervision Responsibility
Quality Responsibility
(1) (2) (3) (4) (5) (6) (7) (8) Collection and
recycling of lubricants Measures to prevent
accidental Spills Locate handling sites
away from populated areas
Follow proper operation and handling measures to minimize exposure
Provide prior warning /signals for blasting
Provide sirens in vehicles to avoid any collision with human/animals
Organise awareness programs on environmental resource management
Organise Health camps
Child labour must be strictly prohibited
Provide signages near construction sites and approach roads
6.5 Concrete mixture and heavy Pumps
Air / Noise Pollution
Soil Pollution
Worker local People
Air pollution control measure like water sprinkling
Limit hours of operation in populated areas
Use of barriers to reduce Exposure Plants, machinery and
Contractor Executive Engineer
Third Party / PACT

177
Sr. No. Anticipated Project Impacts Impact
Categorization Mitigation Measures Implementation Schedule
Site Responsibility
Supervision Responsibility
Quality Responsibility
(1) (2) (3) (4) (5) (6) (7) (8) Exposure equipment may be
handled so as to minimize generation of dust.
All crusher used in construction should confirm to relative dust emission devises
Low emission construction equipment, vehicles and generator sets may be used
Air quality monitoring may beconducted at construction sites.
Collection and recycling of lubricants
Measures to prevent accidental Spills
Locate handling sites away from populated areas
Follow proper operation and handling measures to minimize exposure
Provide prior warning /signals for blasting
Provide sirens in vehicles to avoid any collision with human/animals
Organise awareness programs on environmental

178
Sr. No. Anticipated Project Impacts Impact
Categorization Mitigation Measures Implementation Schedule
Site Responsibility
Supervision Responsibility
Quality Responsibility
(1) (2) (3) (4) (5) (6) (7) (8) resource management
Organise Health camp Child labour must be
strictly prohibited Provide signages near
construction sites and approach roads
6.6 Material handling and storage
Soil Pollution
Worker local People Exposure
Air / Noise Pollution
Air pollution control measure like water sprinkling
Limit hours of operation in populated areas
Use of barriers to reduce exposure
Plants, machinery and equipment may be handled so as to minimize generation of dust.
All crusher used in construction should confirm to relative dust emission devises
Low emission construction equipment, vehicles and generator sets may be used
Air quality monitoring may be conducted at construction sites.
Collection and recycling of lubricants
Measures to prevent accidental spills
Locate handling sites
Contractor Executive Engineer
Third Party / PACT

179
Sr. No. Anticipated Project Impacts Impact
Categorization Mitigation Measures Implementation Schedule
Site Responsibility
Supervision Responsibility
Quality Responsibility
(1) (2) (3) (4) (5) (6) (7) (8) away from populated areas
Follow proper operation and handling measures to minimize exposure
Provide prior warning /signals for blasting
Provide sirens in vehicles to avoid any collision with human/animals
Organise awareness programs on environmental resource management
Organise Health camps
Child labour must be strictly prohibited
Provide signages near construction sites and approach roads
6.7 Debris Disposal Air / Noise Pollution
Water Pollution (Surface)
Soil Pollution
Trucks Traffic increase
Landscape Degradati
Air pollution control measure like water sprinkling
Limit hours of operation in populated areas
Use of barriers to reduce exposure
Plants, machinery and equipment may be handled so as to minimize generation of dust.
All crusher used in
Contractor Executive Engineer
Third Party / PACT

180
Sr. No. Anticipated Project Impacts Impact
Categorization Mitigation Measures Implementation Schedule
Site Responsibility
Supervision Responsibility
Quality Responsibility
(1) (2) (3) (4) (5) (6) (7) (8) on construction should
confirm to relative dust emission devises
Low emission construction equipment, vehicles and generator sets may be used
Air quality monitoring may be conducted at construction sites.
Dump solid waste in specified place to minimize contamination of water
Dump wastewater in authorized locations and after treatment
Collection and recycling of lubricants
Measures to prevent accidental spills
Avoid traffic in populated areas as much as possible
Install speed breaker and signages near settlements
Roadside plantation It is a direct, short
term impact; Irreversible in nature; Severity is low; Insignificant Impact on Livelihood
Carry plantation work

181
Sr. No. Anticipated Project Impacts Impact
Categorization Mitigation Measures Implementation Schedule
Site Responsibility
Supervision Responsibility
Quality Responsibility
(1) (2) (3) (4) (5) (6) (7) (8) on open sites
Do not dump waste along settlement or access route
Frame Muck disposal program
Frame quarry & borrow area rehabilitation program
Develop green belts along approach road
On completion of the works all the temporary structures may be cleared away, all rubbish disposed, excreta and disposal pits or trenches filled in and effectively sealed off and the whole site
6.8 Transport of materials
Air / Noise Pollution
Soil Pollution
Trucks Traffic increase
Air pollution control measure like water sprinkling
Limit hours of operation in populated areas
Use of barriers to reduce exposure
Plants, machinery and equipment may be handled so as to minimize generation of dust.
All crusher used in construction should confirm to relative
Contractor Executive Engineer
Third Party / PACT

182
Sr. No. Anticipated Project Impacts Impact
Categorization Mitigation Measures Implementation Schedule
Site Responsibility
Supervision Responsibility
Quality Responsibility
(1) (2) (3) (4) (5) (6) (7) (8) dust emission devises
Low emission construction equipment, vehicles and generator sets may be used
Air quality monitoring may be conducted at construction sites.
Collection and recycling of lubricants
Measures to prevent accidental Spills
Spillage proof vehicles shall be allowed
Avoid traffic in populated areas as much as possible
Install speed breaker and signages near settlements
Roadside plantation 8. Rehabilitation and Modernization
of Branch Canal System and drainage system will:
Year 1 to Year 3
7.1 Lead to greater surface water availability at tail end thereby reducing dependence on ground water resources in tail end.
C
Contractor Executive Engineer
Third Party / PACT
7.2 Lead to preparation & implementation of Crop Plan, which will lead to agriculture intensification & diversification.
C Contractor Executive Engineer
Third Party / PACT
7.3 Lead to greater water C Contractor Executive Third Party /
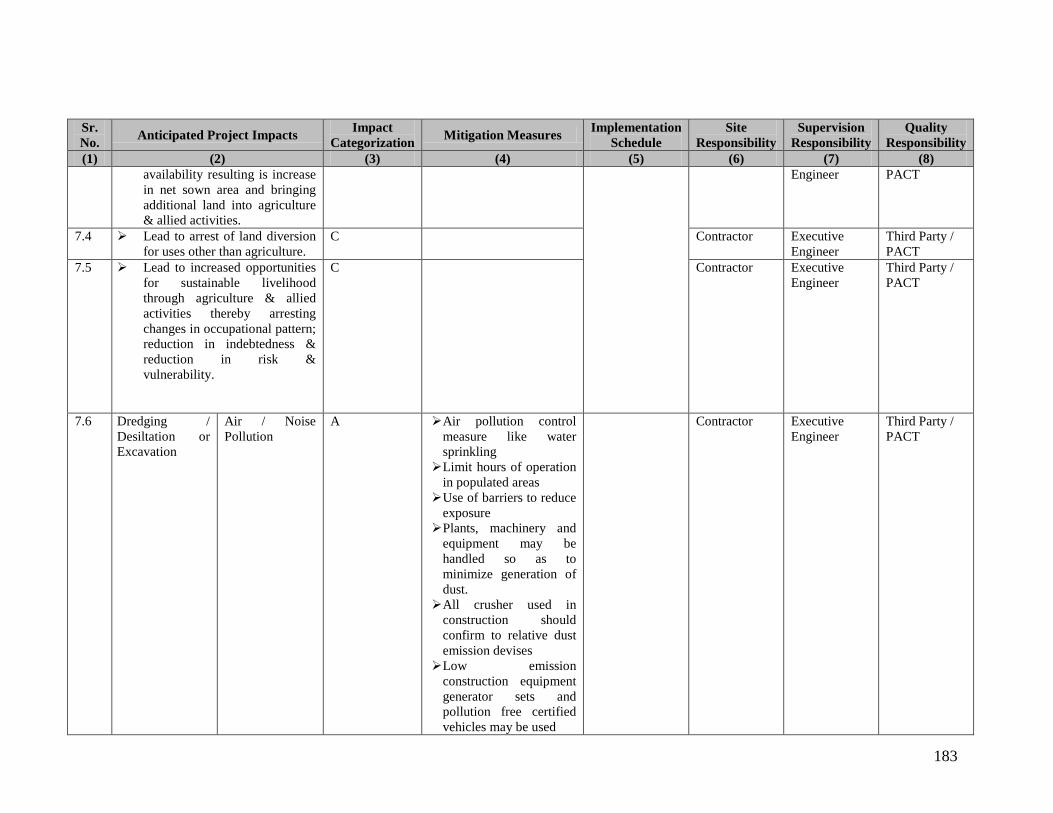
183
Sr. No. Anticipated Project Impacts Impact
Categorization Mitigation Measures Implementation Schedule
Site Responsibility
Supervision Responsibility
Quality Responsibility
(1) (2) (3) (4) (5) (6) (7) (8) availability resulting is increase in net sown area and bringing additional land into agriculture & allied activities.
Engineer PACT
7.4 Lead to arrest of land diversion for uses other than agriculture.
C Contractor Executive Engineer
Third Party / PACT
7.5 Lead to increased opportunities for sustainable livelihood through agriculture & allied activities thereby arresting changes in occupational pattern; reduction in indebtedness & reduction in risk & vulnerability.
C Contractor Executive Engineer
Third Party / PACT
7.6 Dredging / Desiltation or Excavation
Air / Noise Pollution
A Air pollution control measure like water sprinkling Limit hours of operation
in populated areas Use of barriers to reduce
exposure Plants, machinery and
equipment may be handled so as to minimize generation of dust. All crusher used in
construction should confirm to relative dust emission devises Low emission
construction equipment generator sets and pollution free certified vehicles may be used
Contractor Executive Engineer
Third Party / PACT

184
Sr. No. Anticipated Project Impacts Impact
Categorization Mitigation Measures Implementation Schedule
Site Responsibility
Supervision Responsibility
Quality Responsibility
(1) (2) (3) (4) (5) (6) (7) (8) Air quality monitoring
may be conducted at construction sites.
7.7 Water Pollution Surface Water
A Dump solid waste in specified place to minimize contamination of water
Dump wastewater in authorized locations and after treatment
Contractor Executive Engineer
Third Party/PACT
7.8 Soil Pollution A Collection and recycling of lubricants
Measures to prevent accidental spills
Contractor Executive Engineer
Third Party/PACT
7.9 Trucks Traffic increase
A Pollution Free certified vehicles to be allowed
Avoid traffic in populated areas as much as possible
Install speed breaker and signages near settlements
Roadside plantation
Contractor Executive Engineer
Third Party/PACT
7.10 Worker/Local people exposure
A Provide safety measures (mask, gloves, hat etc) to minimize exposure
Provide sirens in vehicles to avoid any collision with human/animals
Organise awareness programs on environmental resource management
Contractor Executive Engineer
Third Party/PACT

185
Sr. No. Anticipated Project Impacts Impact
Categorization Mitigation Measures Implementation Schedule
Site Responsibility
Supervision Responsibility
Quality Responsibility
(1) (2) (3) (4) (5) (6) (7) (8) Organise Health
camps Child labour must be
strictly prohibited Provide signages near
work sites 7.11 Disposal of
Excavated Material (Silt/vegetation)
A A silt disposal plan with quantum (generated/ utilized/ disposed off ) shall be part of contract agreement
Disposal Area shall be pre-identified with due consent of local community prior to initiate work
Quality of silt shall be assessed before disposal
Remove extra silt and vegetation material as soon as possible from site
Dumping of silt/vegetation only in designated place by the engineers to minimize impact on environment
Major Drains (if any) contract agreement shall also have silt disposal plan
Slope of drains/canals shall not be more than 1 m height and 2 m in
Contractor Executive Engineer
Third Party/PACT

186
Sr. No. Anticipated Project Impacts Impact
Categorization Mitigation Measures Implementation Schedule
Site Responsibility
Supervision Responsibility
Quality Responsibility
(1) (2) (3) (4) (5) (6) (7) (8) width
Technical specifications shall be part of contract agreement
7.12 Water Delivery Reduction Interruption
A Prior water use plan shall be prepared and arrange alternate source of water to fulfil more basic needs
Contractor Executive Engineer
Third Party/PACT
7.13 Heavy Machinery Handling and Haulage of Machinery
Air / Noise Pollution
A Limit hours of operation in populated areas
Use of barriers to reduce exposure
All crusher used in construction should confirm to relative dust emission devises
Low emission construction equipment, vehicles and generator sets may be used
Contractor Executive Engineer
Third Party/PACT
7.14 Soil Pollution A Collection and recycling of lubricants
Measures to prevent accidental Spills
Contractor Executive Engineer
Third Party/PACT
7.15 Worker/Local people exposure
A Locate handling sites away from populated areas
Follow proper operation and handling measures to minimize exposure
Provide prior warning
Contractor Executive Engineer
Third Party/PACT
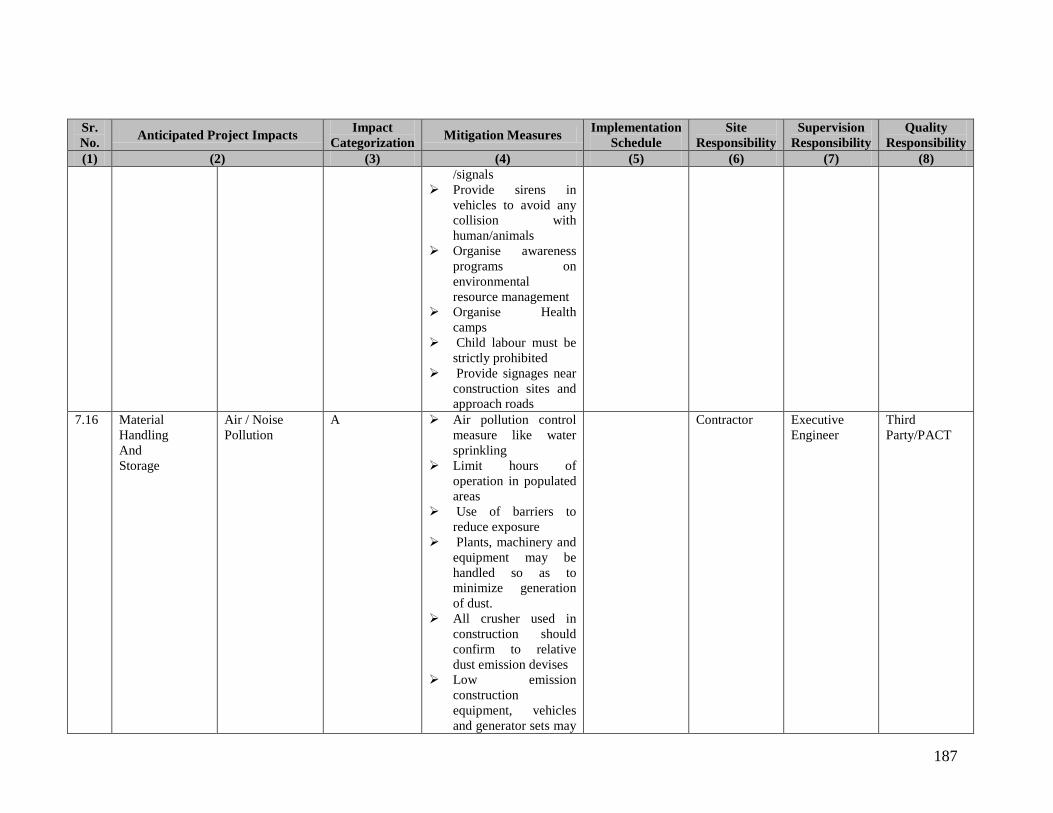
187
Sr. No. Anticipated Project Impacts Impact
Categorization Mitigation Measures Implementation Schedule
Site Responsibility
Supervision Responsibility
Quality Responsibility
(1) (2) (3) (4) (5) (6) (7) (8) /signals
Provide sirens in vehicles to avoid any collision with human/animals
Organise awareness programs on environmental resource management
Organise Health camps
Child labour must be strictly prohibited
Provide signages near construction sites and approach roads
7.16 Material Handling And Storage
Air / Noise Pollution
A Air pollution control measure like water sprinkling
Limit hours of operation in populated areas
Use of barriers to reduce exposure
Plants, machinery and equipment may be handled so as to minimize generation of dust.
All crusher used in construction should confirm to relative dust emission devises
Low emission construction equipment, vehicles and generator sets may
Contractor Executive Engineer
Third Party/PACT

188
Sr. No. Anticipated Project Impacts Impact
Categorization Mitigation Measures Implementation Schedule
Site Responsibility
Supervision Responsibility
Quality Responsibility
(1) (2) (3) (4) (5) (6) (7) (8) be used
Air quality monitoring may be conducted at construction sites.
7.17 Soil Pollution A Collection and recycling of lubricants
Measures to prevent accidental spills
Contractor Executive Engineer
Third Party/PACT
7.18 Worker/Local people exposure
A Locate handling sites away from populated areas
Follow proper operation and handling measures to minimize exposure
Provide prior warning /signals for blasting
Provide sirens in vehicles to avoid any collision with human/animals
Organise awareness programs on environmental resource management
Organise Health camps
Child labour must be strictly prohibited
Provide signages near construction sites and approach roads
Contractor Executive Engineer
Third Party/PACT
7.19 Debris Disposal
Air / Noise Pollution
A Air pollution control measure like water sprinkling
Limit hours of operation in populated
Contractor Executive Engineer
Third Party/PACT
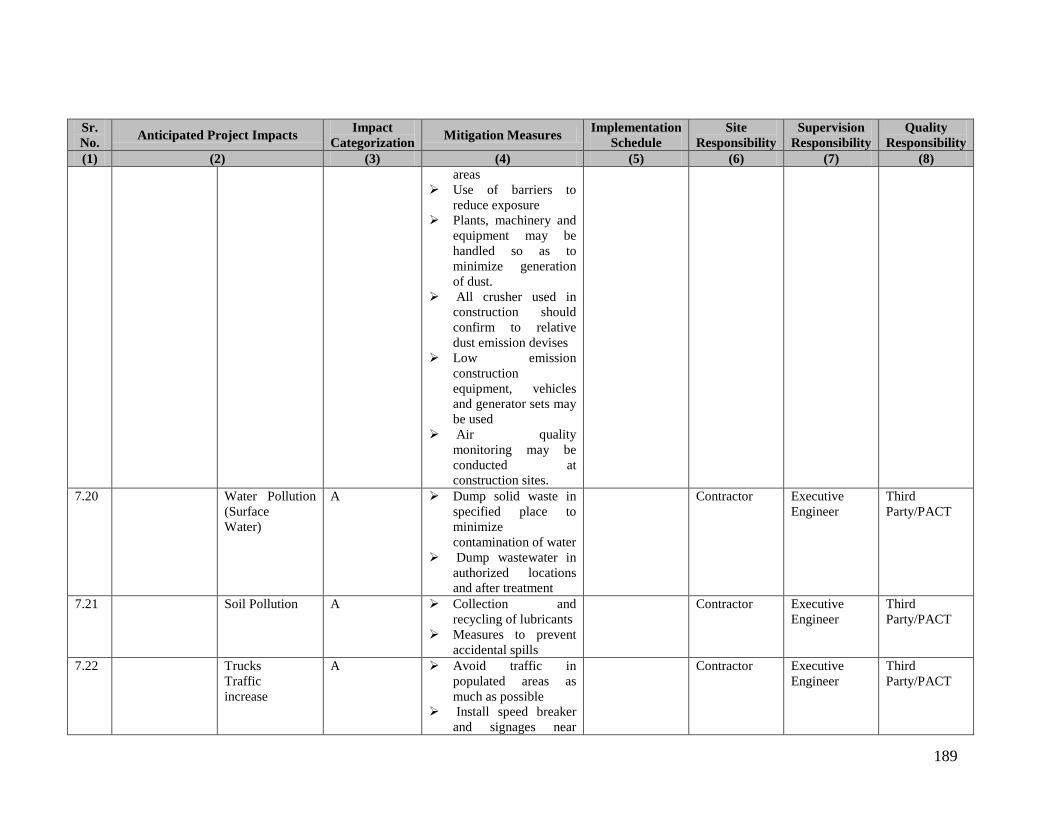
189
Sr. No. Anticipated Project Impacts Impact
Categorization Mitigation Measures Implementation Schedule
Site Responsibility
Supervision Responsibility
Quality Responsibility
(1) (2) (3) (4) (5) (6) (7) (8) areas
Use of barriers to reduce exposure
Plants, machinery and equipment may be handled so as to minimize generation of dust.
All crusher used in construction should confirm to relative dust emission devises
Low emission construction equipment, vehicles and generator sets may be used
Air quality monitoring may be conducted at construction sites.
7.20 Water Pollution (Surface Water)
A Dump solid waste in specified place to minimize contamination of water
Dump wastewater in authorized locations and after treatment
Contractor Executive Engineer
Third Party/PACT
7.21 Soil Pollution A Collection and recycling of lubricants
Measures to prevent accidental spills
Contractor Executive Engineer
Third Party/PACT
7.22 Trucks Traffic increase
A Avoid traffic in populated areas as much as possible
Install speed breaker and signages near
Contractor Executive Engineer
Third Party/PACT

190
Sr. No. Anticipated Project Impacts Impact
Categorization Mitigation Measures Implementation Schedule
Site Responsibility
Supervision Responsibility
Quality Responsibility
(1) (2) (3) (4) (5) (6) (7) (8) settlements
Roadside plantation 7.23 Landscape
Degradation A It is a direct, short
term impact; Irreversible in nature; Severity is low; Insignificant Impact on Livelihood
Carry plantation work on open sites
Do not dump waste along settlement or access route
Frame Muck disposal program
Frame quarry & borrow area rehabilitation program
Develop green belts along approach road
On completion of the works all the temporary structures may be cleared away, all rubbish disposed, excreta and disposal pits or trenches filled in and effectively sealed off and the whole site
Contractor Executive Engineer
Third Party/PACT
7.24 Transport of Materials
Air / Noise Pollution
A Air pollution control measure like water sprinkling
Limit hours of operation in populated areas
Use of barriers to
Contractor Executive Engineer
Third Party/PACT

191
Sr. No. Anticipated Project Impacts Impact
Categorization Mitigation Measures Implementation Schedule
Site Responsibility
Supervision Responsibility
Quality Responsibility
(1) (2) (3) (4) (5) (6) (7) (8) reduce exposure
Plants, machinery and equipment may be handled so as to minimize generation of dust.
All crusher used in construction should confirm to relative dust emission devises
Low emission construction equipment, vehicles and generator sets may be used
Air quality monitoring may be conducted at construction sites.
7.25 Soil Pollution A Collection and recycling of lubricants
Measures to prevent accidental Spills
Contractor Executive Engineer
Third Party/PACT
7.26 Trucks Traffic increase
A Spillage proof vehicles shall be allowed
Avoid traffic in populated areas as much as possible
Install speed breaker and signages near settlements
Roadside plantation
Contractor Executive Engineer
Third Party/PACT
7.27 Small Tools and Pumps
Air / Noise Pollution
A Low emission construction equipment, vehicles and generator sets may be used
Contractor Executive Engineer
Third Party/PACT

192
Sr. No. Anticipated Project Impacts Impact
Categorization Mitigation Measures Implementation Schedule
Site Responsibility
Supervision Responsibility
Quality Responsibility
(1) (2) (3) (4) (5) (6) (7) (8) 7.28 Borrow
Materials/ Area
Air / Noise Pollution
A Air pollution control measure like water sprinkling
Limit hours of operation in populated areas
Use of barriers to reduce exposure
Plants, machinery and equipment may be handled so as to minimize generation of dust.
All crusher used in construction should confirm to relative dust emission devises
Low emission construction equipment, vehicles and generator sets may be used
Air quality monitoring may be conducted at construction sites.
Contractor Executive Engineer
Third Party/PACT
7.29 Soil Pollution A Collection and recycling of lubricants
Measures to prevent accidental Spills
Contractor Executive Engineer
Third Party/PACT
7.30 Trucks Traffic increase
A Avoid traffic in populated areas as much as possible
Install speed breaker and signages near settlements
Roadside plantation
Contractor Executive Engineer
Third Party/PACT
7.31 Soil Erosion A Limitation of earth Contractor Executive Third
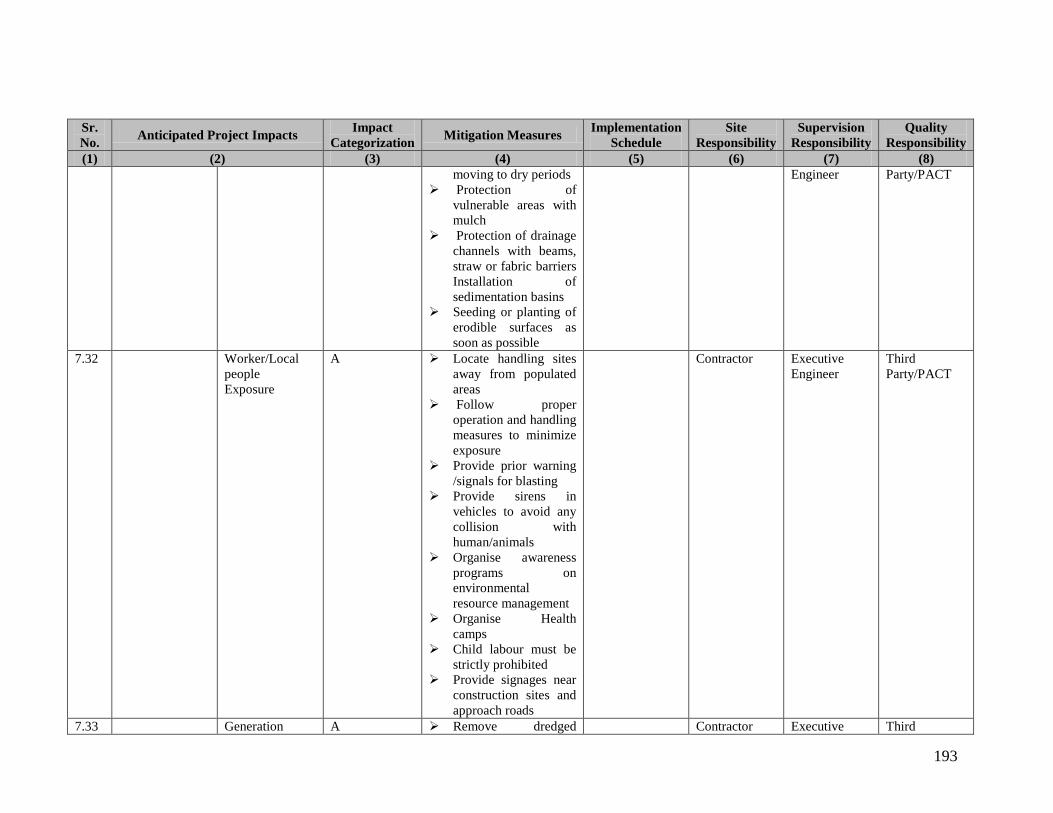
193
Sr. No. Anticipated Project Impacts Impact
Categorization Mitigation Measures Implementation Schedule
Site Responsibility
Supervision Responsibility
Quality Responsibility
(1) (2) (3) (4) (5) (6) (7) (8) moving to dry periods
Protection of vulnerable areas with mulch
Protection of drainage channels with beams, straw or fabric barriers Installation of sedimentation basins
Seeding or planting of erodible surfaces as soon as possible
Engineer Party/PACT
7.32 Worker/Local people Exposure
A Locate handling sites away from populated areas
Follow proper operation and handling measures to minimize exposure
Provide prior warning /signals for blasting
Provide sirens in vehicles to avoid any collision with human/animals
Organise awareness programs on environmental resource management
Organise Health camps
Child labour must be strictly prohibited
Provide signages near construction sites and approach roads
Contractor Executive Engineer
Third Party/PACT
7.33 Generation A Remove dredged Contractor Executive Third
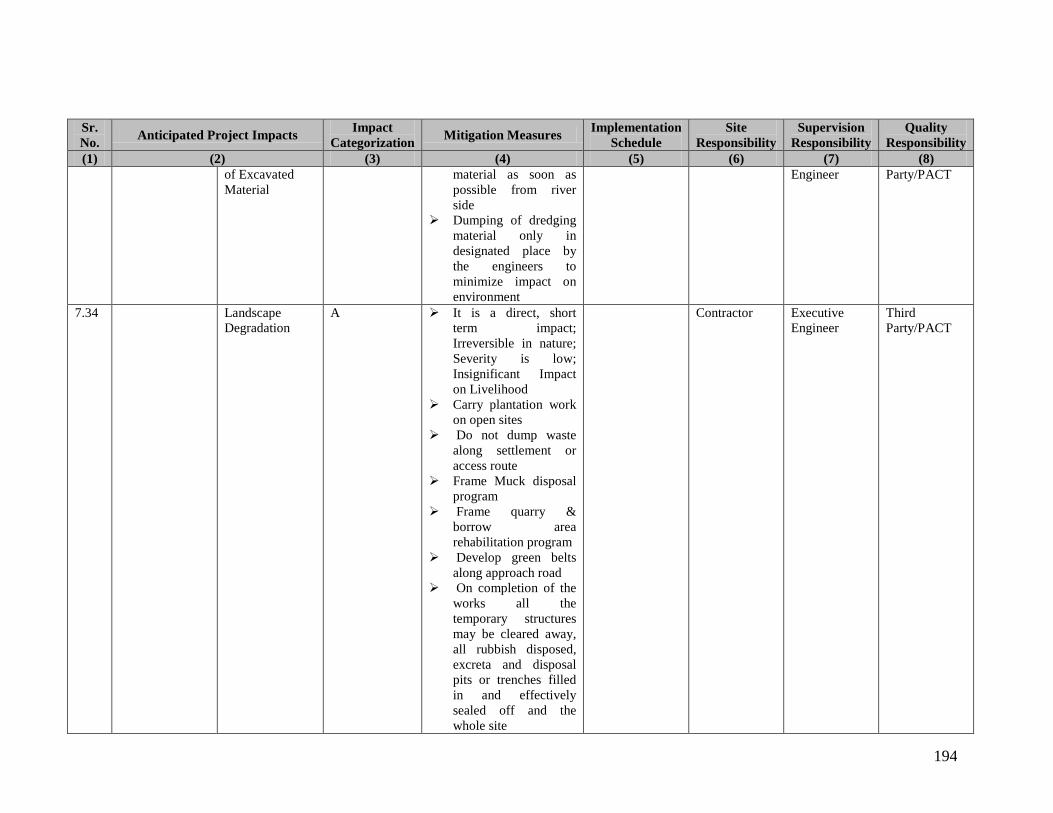
194
Sr. No. Anticipated Project Impacts Impact
Categorization Mitigation Measures Implementation Schedule
Site Responsibility
Supervision Responsibility
Quality Responsibility
(1) (2) (3) (4) (5) (6) (7) (8) of Excavated Material
material as soon as possible from river side
Dumping of dredging material only in designated place by the engineers to minimize impact on environment
Engineer Party/PACT
7.34 Landscape Degradation
A It is a direct, short term impact; Irreversible in nature; Severity is low; Insignificant Impact on Livelihood
Carry plantation work on open sites
Do not dump waste along settlement or access route
Frame Muck disposal program
Frame quarry & borrow area rehabilitation program
Develop green belts along approach road
On completion of the works all the temporary structures may be cleared away, all rubbish disposed, excreta and disposal pits or trenches filled in and effectively sealed off and the whole site
Contractor Executive Engineer
Third Party/PACT

195
Sr. No. Anticipated Project Impacts Impact
Categorization Mitigation Measures Implementation Schedule
Site Responsibility
Supervision Responsibility
Quality Responsibility
(1) (2) (3) (4) (5) (6) (7) (8) 7.35 Quary
Materials/ Area
Air / Noise Pollution
A Air pollution control measure like water sprinkling
Limit hours of operation in populated areas
Use of barriers to reduce exposure
Plants, machinery and equipment may be handled so as to minimize generation of dust.
All crusher used in construction should confirm to relative dust emission devises
Low emission construction equipment, vehicles and generator sets may be used
Air quality monitoring may be conducted at construction sites.
Contractor Executive Engineer
Third Party/PACT
7.36 Soil Pollution A Collection and recycling of lubricants
Measures to prevent accidental Spills
Contractor Executive Engineer
Third Party/PACT
7.37 Trucks Traffic Increase
A Avoid traffic in populated areas as much as possible
Install speed breaker and signages near settlements
Roadside plantation
Contractor Executive Engineer
Third Party/PACT
7.38 Worker/Local A Locate handling sites Contractor Executive Third
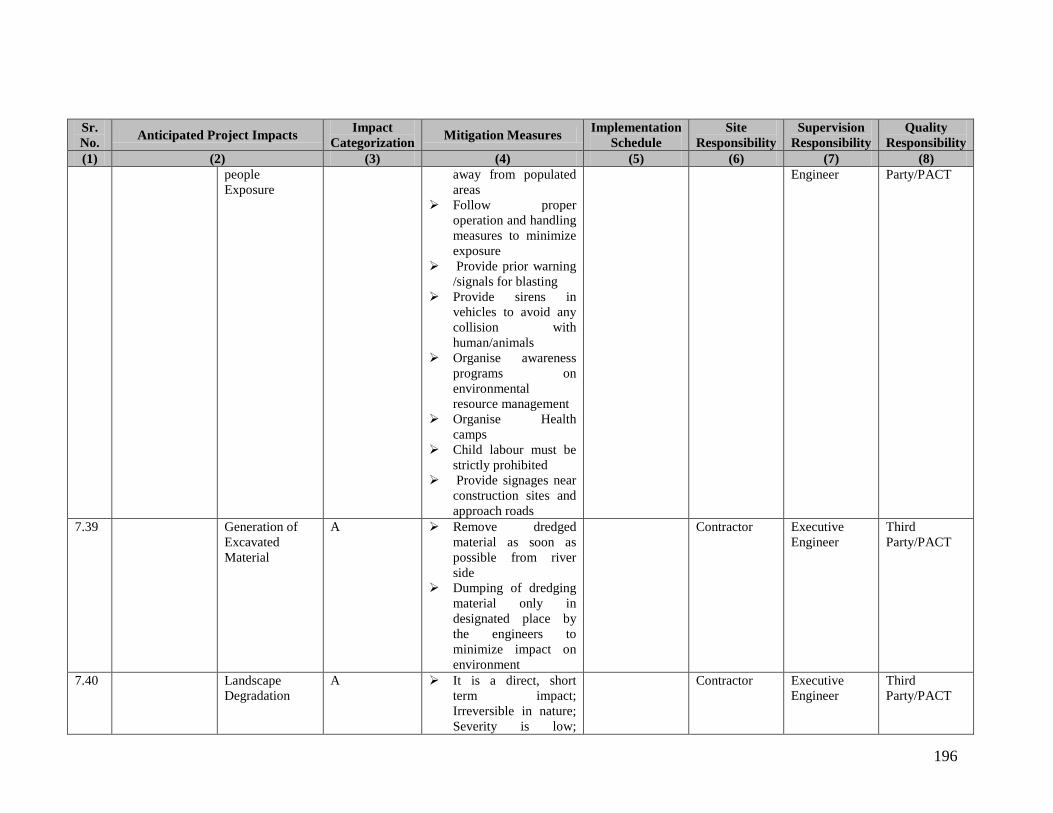
196
Sr. No. Anticipated Project Impacts Impact
Categorization Mitigation Measures Implementation Schedule
Site Responsibility
Supervision Responsibility
Quality Responsibility
(1) (2) (3) (4) (5) (6) (7) (8) people Exposure
away from populated areas
Follow proper operation and handling measures to minimize exposure
Provide prior warning /signals for blasting
Provide sirens in vehicles to avoid any collision with human/animals
Organise awareness programs on environmental resource management
Organise Health camps
Child labour must be strictly prohibited
Provide signages near construction sites and approach roads
Engineer Party/PACT
7.39 Generation of Excavated Material
A Remove dredged material as soon as possible from river side
Dumping of dredging material only in designated place by the engineers to minimize impact on environment
Contractor Executive Engineer
Third Party/PACT
7.40 Landscape Degradation
A It is a direct, short term impact; Irreversible in nature; Severity is low;
Contractor Executive Engineer
Third Party/PACT

197
Sr. No. Anticipated Project Impacts Impact
Categorization Mitigation Measures Implementation Schedule
Site Responsibility
Supervision Responsibility
Quality Responsibility
(1) (2) (3) (4) (5) (6) (7) (8) Insignificant Impact on Livelihood
Carry plantation work on open sites
Do not dump waste along settlement or access route
Frame Muck disposal program
Frame quarry & borrow area rehabilitation program
Develop green belts along approach road
On completion of the works all the temporary structures may be cleared away, all rubbish disposed, excreta and disposal pits or trenches filled in and effectively sealed off and the whole site
7.41 Resettlement & Rehabilitation
Land Acquisition
A Follow National R&R Policy 2007.
The compensation award shall be declared before displacement of the affected families. Full payment of compensation as well as adequate progress in resettlement shall be ensured.
The compensation
Contractor Executive Engineer
Third Party/PACT
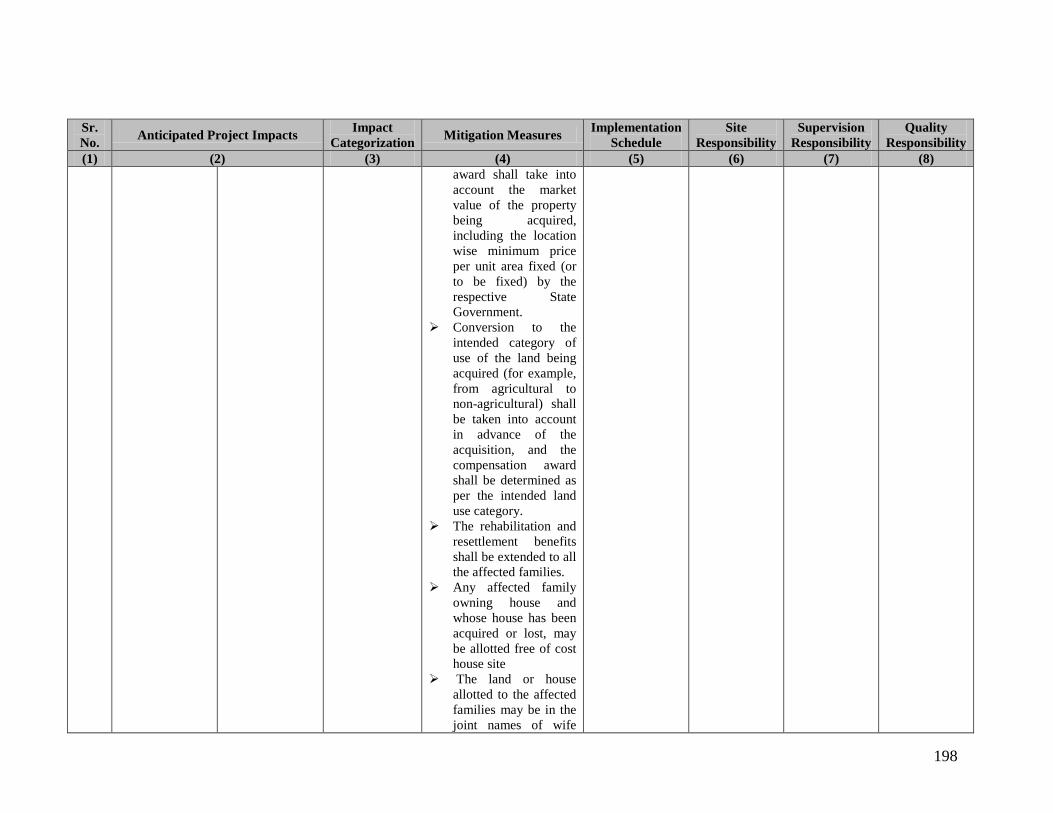
198
Sr. No. Anticipated Project Impacts Impact
Categorization Mitigation Measures Implementation Schedule
Site Responsibility
Supervision Responsibility
Quality Responsibility
(1) (2) (3) (4) (5) (6) (7) (8) award shall take into account the market value of the property being acquired, including the location wise minimum price per unit area fixed (or to be fixed) by the respective State Government.
Conversion to the intended category of use of the land being acquired (for example, from agricultural to non-agricultural) shall be taken into account in advance of the acquisition, and the compensation award shall be determined as per the intended land use category.
The rehabilitation and resettlement benefits shall be extended to all the affected families.
Any affected family owning house and whose house has been acquired or lost, may be allotted free of cost house site
The land or house allotted to the affected families may be in the joint names of wife

199
Sr. No. Anticipated Project Impacts Impact
Categorization Mitigation Measures Implementation Schedule
Site Responsibility
Supervision Responsibility
Quality Responsibility
(1) (2) (3) (4) (5) (6) (7) (8) and husband of the affected family.
Each affected below poverty line family which is without homestead land and has been residing in the affected area and which has been involuntarily displaced from such area, shall be entitled to a house.
In case of involuntary displacement infrastructural facilities and amenities shall be provided in the resettlement area
Facilities and amenities shall, inter alia, include roads, public transport, drainage, sanitation, safe drinking water, drinking water for cattle, community, ponds, grazing land, land for fodder, plantation (social forestry or agroforestry), Fair Price shops, panchayatghars, Cooperative Societies, Post Offices, seedcum- fertilizer storage, irrigation, electricity,

200
Sr. No. Anticipated Project Impacts Impact
Categorization Mitigation Measures Implementation Schedule
Site Responsibility
Supervision Responsibility
Quality Responsibility
(1) (2) (3) (4) (5) (6) (7) (8) health centres, child" and mother supplemental nutritional services, children's playground, community centres, schools, institutional arrangements for training, places of worship, land for traditional tribal institutions, burial/cremation grounds, and security arrangements.
7.42 Impact on local/ tribal communities
A States policy for tribal community has to be followed if livelihood is going to be affected.
Tribal Development Plan shall be prepared, laying down the detailed procedure for settling land rights The Plan shall contain a programme for development of alternate fuel, fodder and nontimber forest produce (NTFP) resources on non-forest lands
In cases of involuntary displacement of two hundred or more Scheduled Tribes
Contractor Executive Engineer
Third Party/PACT

201
Sr. No. Anticipated Project Impacts Impact
Categorization Mitigation Measures Implementation Schedule
Site Responsibility
Supervision Responsibility
Quality Responsibility
(1) (2) (3) (4) (5) (6) (7) (8) families from the Scheduled Areas, the concerned Tribes Advisory Councils (TACs) may be consulted.
Each affected family that is displaced and has cattle, shall get financial assistance for construction of cattle shed.
Each affected family that is displaced must be provided with a one-time financial assistance of such amount as the appropriate but not less than ten thousand rupees, for shifting of the family, building materials, belongings and cattle.
Each affected person who is a rural artisan, small trader or self-employed person and who has been displaced shall be provided a one-time financial assistance.
Preference to the affected families
at least one person per nuclear family - in providing employment

202
Sr. No. Anticipated Project Impacts Impact
Categorization Mitigation Measures Implementation Schedule
Site Responsibility
Supervision Responsibility
Quality Responsibility
(1) (2) (3) (4) (5) (6) (7) (8) in the project
The affected persons shall be offered the necessary training facilities for development of entrepreneurship, technical and professional skills for self employment.
Offer scholarships and other skill development opportunities to the eligible persons from the affected families
7.43 Labour Camps Worker/Local people Exposure
A Locate handling sites away from populated areas
Follow proper operation and handling measures to minimize exposure
Provide prior warning /signals for blasting
Provide sirens in vehicles to avoid any collision with human/animals
Organise awareness programs on environmental resource management
Organise Health camps
Child labour must be strictly prohibited
Contractor Executive Engineer
Third Party/PACT
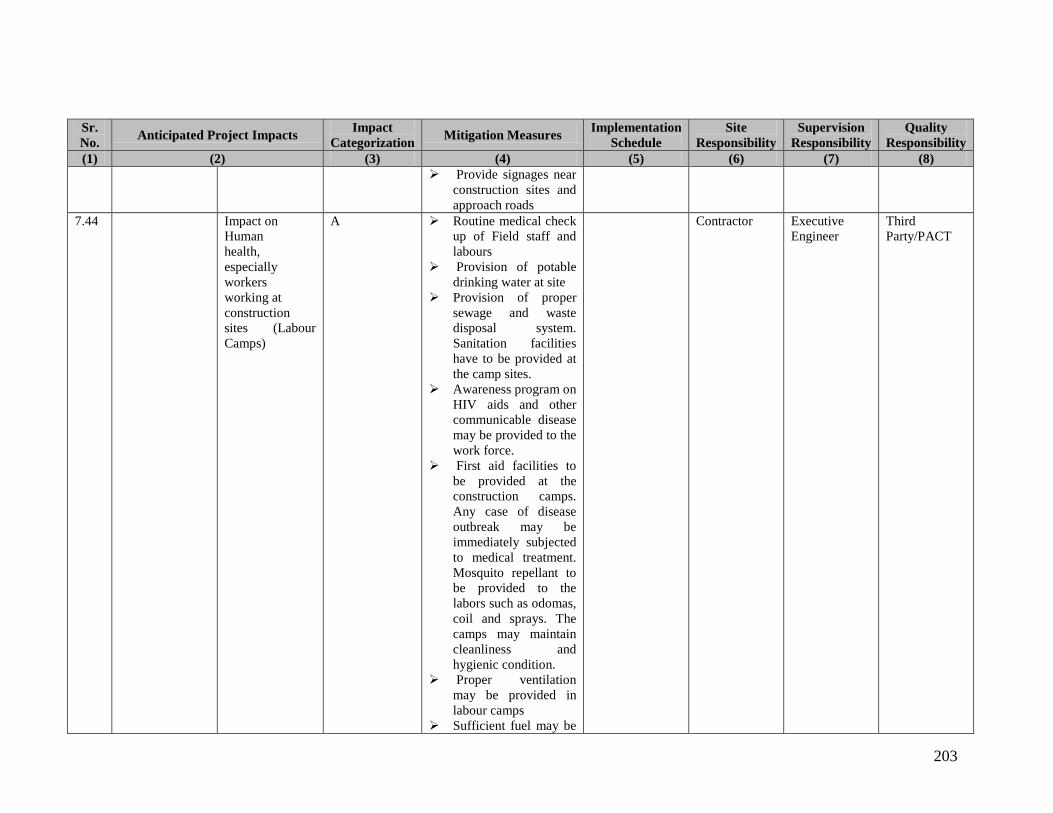
203
Sr. No. Anticipated Project Impacts Impact
Categorization Mitigation Measures Implementation Schedule
Site Responsibility
Supervision Responsibility
Quality Responsibility
(1) (2) (3) (4) (5) (6) (7) (8) Provide signages near
construction sites and approach roads
7.44 Impact on Human health, especially workers working at construction sites (Labour Camps)
A Routine medical check up of Field staff and labours
Provision of potable drinking water at site
Provision of proper sewage and waste disposal system. Sanitation facilities have to be provided at the camp sites.
Awareness program on HIV aids and other communicable disease may be provided to the work force.
First aid facilities to be provided at the construction camps. Any case of disease outbreak may be immediately subjected to medical treatment. Mosquito repellant to be provided to the labors such as odomas, coil and sprays. The camps may maintain cleanliness and hygienic condition.
Proper ventilation may be provided in labour camps
Sufficient fuel may be
Contractor Executive Engineer
Third Party/PACT
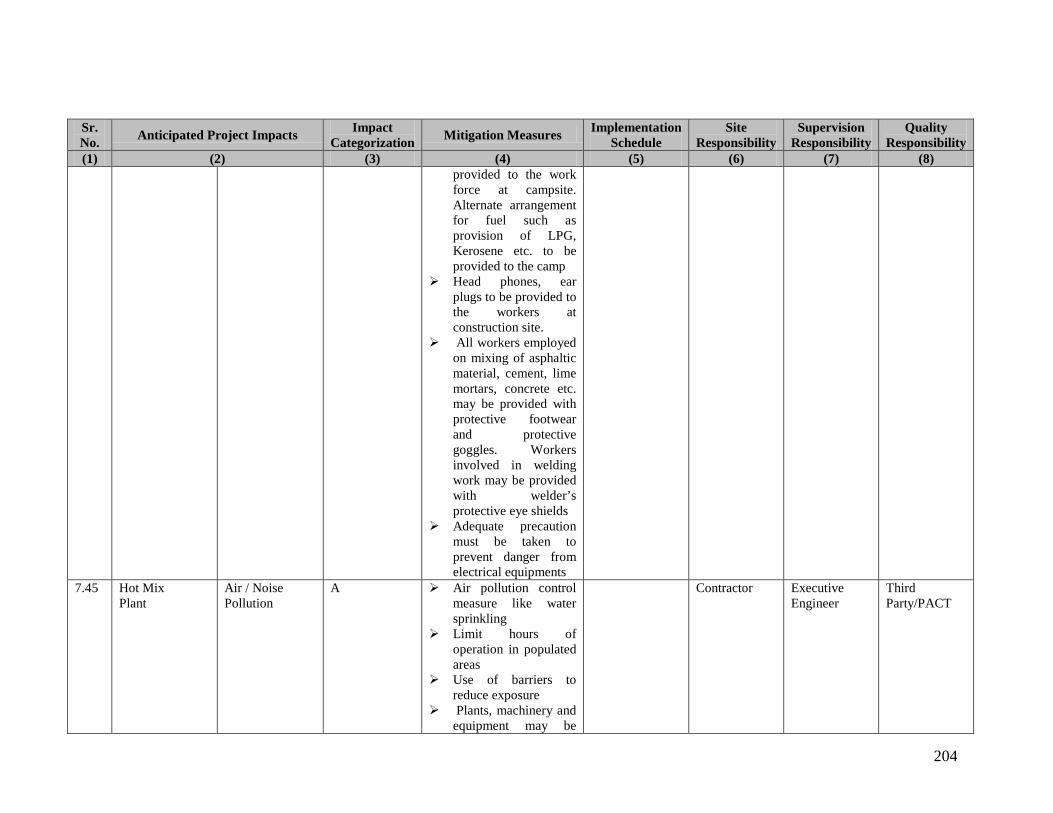
204
Sr. No. Anticipated Project Impacts Impact
Categorization Mitigation Measures Implementation Schedule
Site Responsibility
Supervision Responsibility
Quality Responsibility
(1) (2) (3) (4) (5) (6) (7) (8) provided to the work force at campsite. Alternate arrangement for fuel such as provision of LPG, Kerosene etc. to be provided to the camp
Head phones, ear plugs to be provided to the workers at construction site.
All workers employed on mixing of asphaltic material, cement, lime mortars, concrete etc. may be provided with protective footwear and protective goggles. Workers involved in welding work may be provided with welder’s protective eye shields
Adequate precaution must be taken to prevent danger from electrical equipments
7.45 Hot Mix Plant
Air / Noise Pollution
A Air pollution control measure like water sprinkling
Limit hours of operation in populated areas
Use of barriers to reduce exposure
Plants, machinery and equipment may be
Contractor Executive Engineer
Third Party/PACT

205
Sr. No. Anticipated Project Impacts Impact
Categorization Mitigation Measures Implementation Schedule
Site Responsibility
Supervision Responsibility
Quality Responsibility
(1) (2) (3) (4) (5) (6) (7) (8) handled so as to minimize generation of dust.
All crusher used in construction should confirm to relative dust emission devises
Low emission construction equipment, vehicles and generator sets may be used
Air quality monitoring may be conducted at construction sites.
7.46 Soil Pollution A Collection and recycling of lubricants
Measures to prevent accidental Spills
Contractor Executive Engineer
Third Party/PACT
7.47 Worker/Local people Exposure
A Locate handling sites away from populated areas
Follow proper operation and handling measures to minimize exposure
Provide prior warning /signals for blasting
Provide sirens in vehicles to avoid any collision with human/animals
Organise awareness programs on environmental resource management
Organise Health
Contractor Executive Engineer
Third Party/PACT

206
Sr. No. Anticipated Project Impacts Impact
Categorization Mitigation Measures Implementation Schedule
Site Responsibility
Supervision Responsibility
Quality Responsibility
(1) (2) (3) (4) (5) (6) (7) (8) camps
Child labour must be strictly prohibited
Provide signages near construction sites and approach roads
7.48 Concrete Mixture and Heavy Pumps
Air / Noise Pollution
A Air pollution control measure like water sprinkling
Limit hours of operation in populated areas
Use of barriers to reduce Exposure Plants, machinery and equipment may be handled so as to minimize generation of dust.
All crusher used in construction should confirm to relative dust emission devises
Low emission construction equipment, vehicles and generator sets may be used
Air quality monitoring may beconducted at construction sites.
Contractor Executive Engineer
Third Party/PACT
7.49 Soil Pollution A Collection and recycling of lubricants
Measures to prevent accidental Spills
Contractor Executive Engineer
Third Party/PACT
7.50 Worker/Local A Locate handling sites Contractor Executive Third

207
Sr. No. Anticipated Project Impacts Impact
Categorization Mitigation Measures Implementation Schedule
Site Responsibility
Supervision Responsibility
Quality Responsibility
(1) (2) (3) (4) (5) (6) (7) (8) people Exposure
away from populated areas
Follow proper operation and handling measures to minimize exposure
Provide prior warning /signals for blasting
Provide sirens in vehicles to avoid any collision with human/animals
Organise awareness programs on environmental resource management
Organise Health camp Child labour must be
strictly prohibited Provide signages near
construction sites and approach roads
Engineer Party/PACT
7.51 Temporary Land Acquisition
Air / Noise Pollution
A Air pollution control measure like water sprinkling
Limit hours of operation in populated areas
Use of barriers to reduce exposure
Plants, machinery and equipment may be handled so as to minimize generation of dust.
All crusher used in construction should
Contractor Executive Engineer
Third Party/PACT
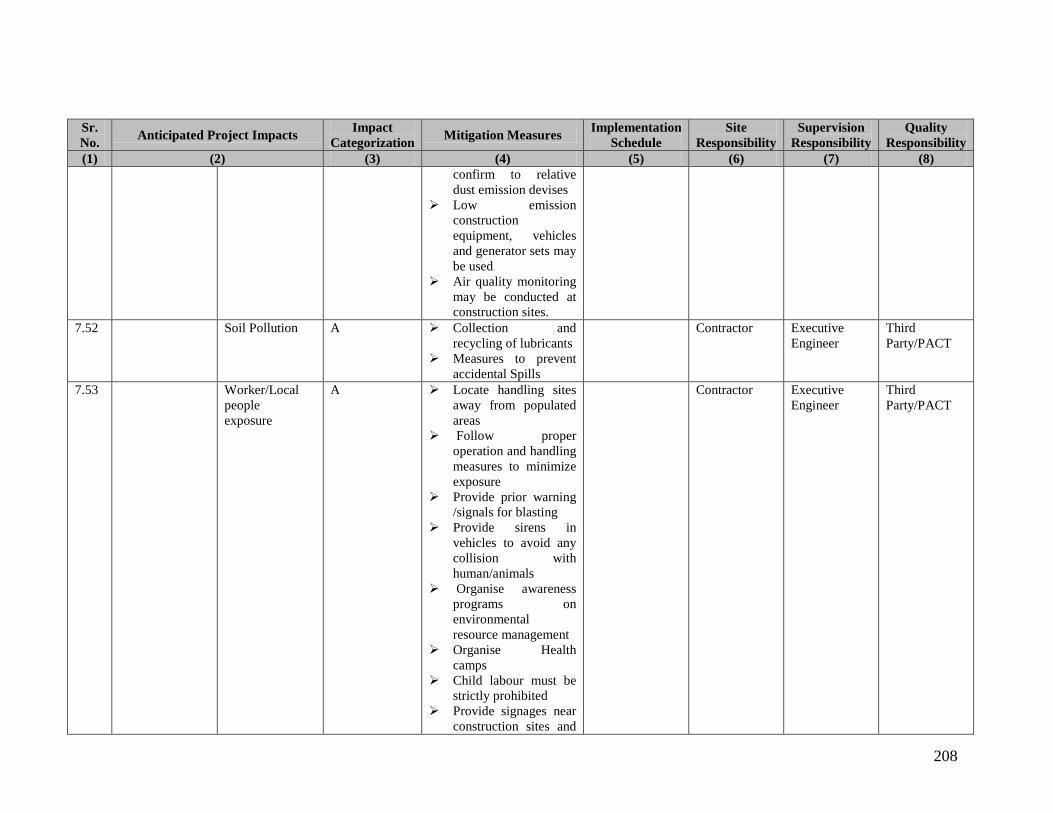
208
Sr. No. Anticipated Project Impacts Impact
Categorization Mitigation Measures Implementation Schedule
Site Responsibility
Supervision Responsibility
Quality Responsibility
(1) (2) (3) (4) (5) (6) (7) (8) confirm to relative dust emission devises
Low emission construction equipment, vehicles and generator sets may be used
Air quality monitoring may be conducted at construction sites.
7.52 Soil Pollution A Collection and recycling of lubricants
Measures to prevent accidental Spills
Contractor Executive Engineer
Third Party/PACT
7.53 Worker/Local people exposure
A Locate handling sites away from populated areas
Follow proper operation and handling measures to minimize exposure
Provide prior warning /signals for blasting
Provide sirens in vehicles to avoid any collision with human/animals
Organise awareness programs on environmental resource management
Organise Health camps
Child labour must be strictly prohibited
Provide signages near construction sites and
Contractor Executive Engineer
Third Party/PACT

209
Sr. No. Anticipated Project Impacts Impact
Categorization Mitigation Measures Implementation Schedule
Site Responsibility
Supervision Responsibility
Quality Responsibility
(1) (2) (3) (4) (5) (6) (7) (8) approach Roads
7.54 Tree Felling, Vegetation Clearance
Landscape Degradation
A It is a direct, short term impact; Irreversible in nature; Severity is low; Insignificant Impact on Livelihood
Carry plantation work on open sites
Do not dump waste along settlement or access route
Frame Muck disposal program
Frame quarry & borrow area rehabilitation program
Develop green belts along approach road
On completion of the works all the temporary structures may be cleared away, all rubbish disposed, excreta and disposal pits or trenches filled in and effectively sealed off and the whole site
Contractor Executive Engineer
Third Party/PACT
7.55 Impact on Flora
A Frame compensatory afforestation plan
If any rare and endangered species present in the area frame conservation plan for the species
Encourage farming of
Contractor Executive Engineer
Third Party/PACT

210
Sr. No. Anticipated Project Impacts Impact
Categorization Mitigation Measures Implementation Schedule
Site Responsibility
Supervision Responsibility
Quality Responsibility
(1) (2) (3) (4) (5) (6) (7) (8) medicinal plants found in the area Distribute fruit plants grown in the region
Plantation with native species along dam periphery, approach road and colony area
Protection/fencing of planted area, provision of guard for three year
Location of camp away from forest area.
7.56 Soil Erosion A Limitation of earth moving to dry periods
Protection of vulnerable areas with mulch
Protection of drainage channels with beams, straw or fabric barriers
Installation of sedimentation basins
Seeding or planting of erodible surfaces as soon as possible
Contractor Executive Engineer
Third Party/PACT
7.57 Sheds to keep Machines and Tools
Air / Noise Pollution
A Air pollution control measure like water sprinkling
Limit hours of operation in populated areas
Use of barriers to reduce exposure
Plants, machinery and equipment may be handled so as to
Contractor Executive Engineer
Third Party/PACT

211
Sr. No. Anticipated Project Impacts Impact
Categorization Mitigation Measures Implementation Schedule
Site Responsibility
Supervision Responsibility
Quality Responsibility
(1) (2) (3) (4) (5) (6) (7) (8) minimize generation of dust.
All crusher used in construction should confirm to relative dust emission devises
Low emission construction equipment, vehicles and generator sets may be used
Air quality monitoring may be conducted at construction sites.
7.58 Blasting Air / Noise Pollution
A Air pollution control measure like water sprinkling
Limit hours of operation in populated areas
Use of barriers to reduce exposure
Plants, machinery and equipment may be handled so as to minimize generation of dust.
All crusher used in construction should confirm to relative dust emission devises
Low emission construction equipment, vehicles and generator sets may be used
Contractor Executive Engineer
Third Party/PACT

212
Sr. No. Anticipated Project Impacts Impact
Categorization Mitigation Measures Implementation Schedule
Site Responsibility
Supervision Responsibility
Quality Responsibility
(1) (2) (3) (4) (5) (6) (7) (8) Air quality monitoring
may be conducted at construction sites.
7.59 Soil Pollution A Collection and recycling of lubricants
Measures to prevent accidental spills
Contractor Executive Engineer
Third Party/PACT
7.60 Worker/Local people exposure
A Locate handling sites away from populated areas
Follow proper operation and handling measures to minimize exposure
Provide prior warning /signals for blasting
Provide sirens in vehicles to avoid any collision with human/animals
Organise awareness programs on environmental resource management
Organise Health camps
Child labour must be strictly prohibited
Provide signages near construction sites and approach roads
Contractor Executive Engineer
Third Party/PACT
7.61 Landscape Degradation
A It is a direct, short term impact; Irreversible in nature; Severity is low; Insignificant Impact on Livelihood
Contractor Executive Engineer
Third Party/PACT

213
Sr. No. Anticipated Project Impacts Impact
Categorization Mitigation Measures Implementation Schedule
Site Responsibility
Supervision Responsibility
Quality Responsibility
(1) (2) (3) (4) (5) (6) (7) (8) Carry plantation work
on open sites Do not dump waste
along settlement or access route
Frame Muck disposal program
Frame quarry & borrow area rehabilitation program
Develop green belts along approach road
On completion of the works all the temporary structures may be cleared away, all rubbish disposed, excreta and disposal pits or trenches filled in and effectively sealed off and the whole site
7.62 Generation of Debris /waste material
A Identification of debris disposal site to minimize the impact on environment and local people.
Debris disposal site should be located at least 500m away from any human settlement and prior NoC has to be obtained from the State Pollution Control Board before duping debris on the identified site.
Contractor Executive Engineer
Third Party/PACT
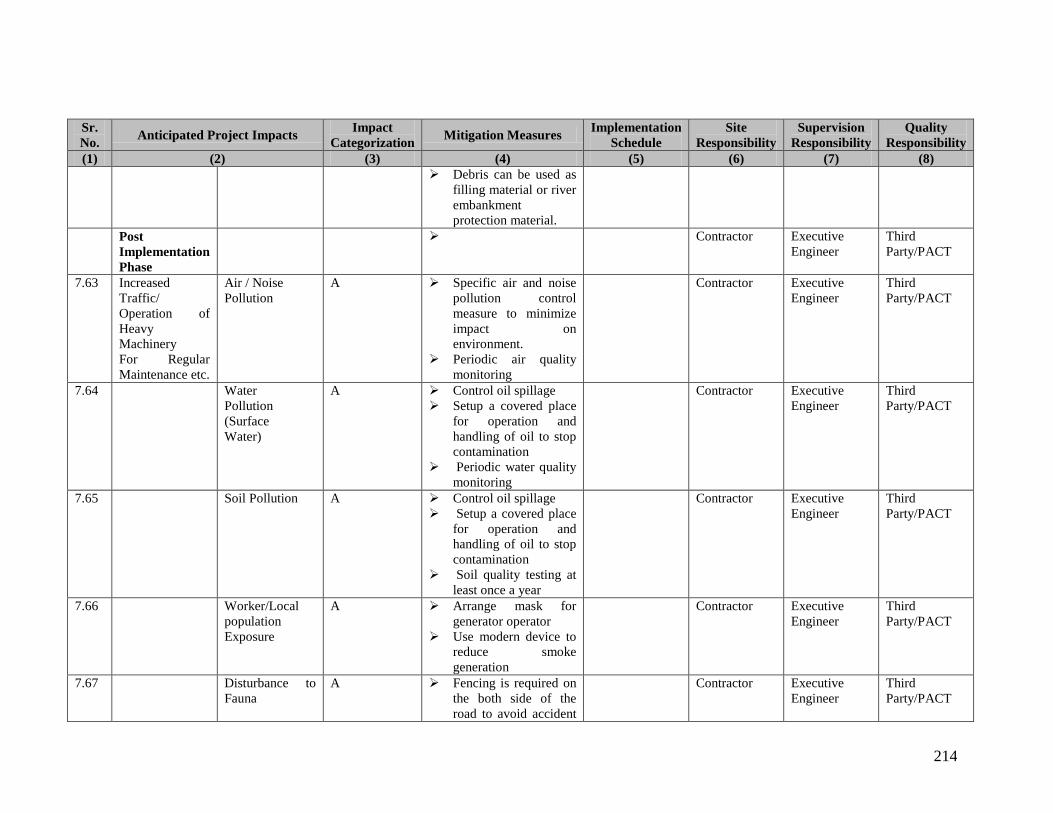
214
Sr. No. Anticipated Project Impacts Impact
Categorization Mitigation Measures Implementation Schedule
Site Responsibility
Supervision Responsibility
Quality Responsibility
(1) (2) (3) (4) (5) (6) (7) (8) Debris can be used as
filling material or river embankment protection material.
Post Implementation Phase
Contractor Executive Engineer
Third Party/PACT
7.63 Increased Traffic/ Operation of Heavy Machinery For Regular Maintenance etc.
Air / Noise Pollution
A Specific air and noise pollution control measure to minimize impact on environment.
Periodic air quality monitoring
Contractor Executive Engineer
Third Party/PACT
7.64 Water Pollution (Surface Water)
A Control oil spillage Setup a covered place
for operation and handling of oil to stop contamination
Periodic water quality monitoring
Contractor Executive Engineer
Third Party/PACT
7.65 Soil Pollution A Control oil spillage Setup a covered place
for operation and handling of oil to stop contamination
Soil quality testing at least once a year
Contractor Executive Engineer
Third Party/PACT
7.66 Worker/Local population Exposure
A Arrange mask for generator operator
Use modern device to reduce smoke generation
Contractor Executive Engineer
Third Party/PACT
7.67 Disturbance to Fauna
A Fencing is required on the both side of the road to avoid accident
Contractor Executive Engineer
Third Party/PACT

215
Sr. No. Anticipated Project Impacts Impact
Categorization Mitigation Measures Implementation Schedule
Site Responsibility
Supervision Responsibility
Quality Responsibility
(1) (2) (3) (4) (5) (6) (7) (8) in forest area
Use of sign boards on the road side to avoid accident
7.68 Increased Traffic A Avoid traffic in populated areas as much as possible
Follow precautionary measures to avoid accident
Install speed breakers and signages near settlement
Contractor Executive Engineer
Third Party/PACT
7.69 Repair of Existing structures of the canal and also new demand of VRBs, DRB, Siphons etc.
Dredging/De-siltation
A Contractor Executive Engineer
Third Party/PACT
7.70 Labor Camps
Worker local People Exposure
Impact on human health (Labor Camps)
A Routine medical check up of Field staff and labours
Provision of potable drinking water at site
Provision of proper sewage and waste disposal system. Sanitation facilities have to be provided at the camp sites.
Awareness program on HIV aids and other communicable disease may be provided to the work force.
Contractor Executive Engineer
Third Party/PACT
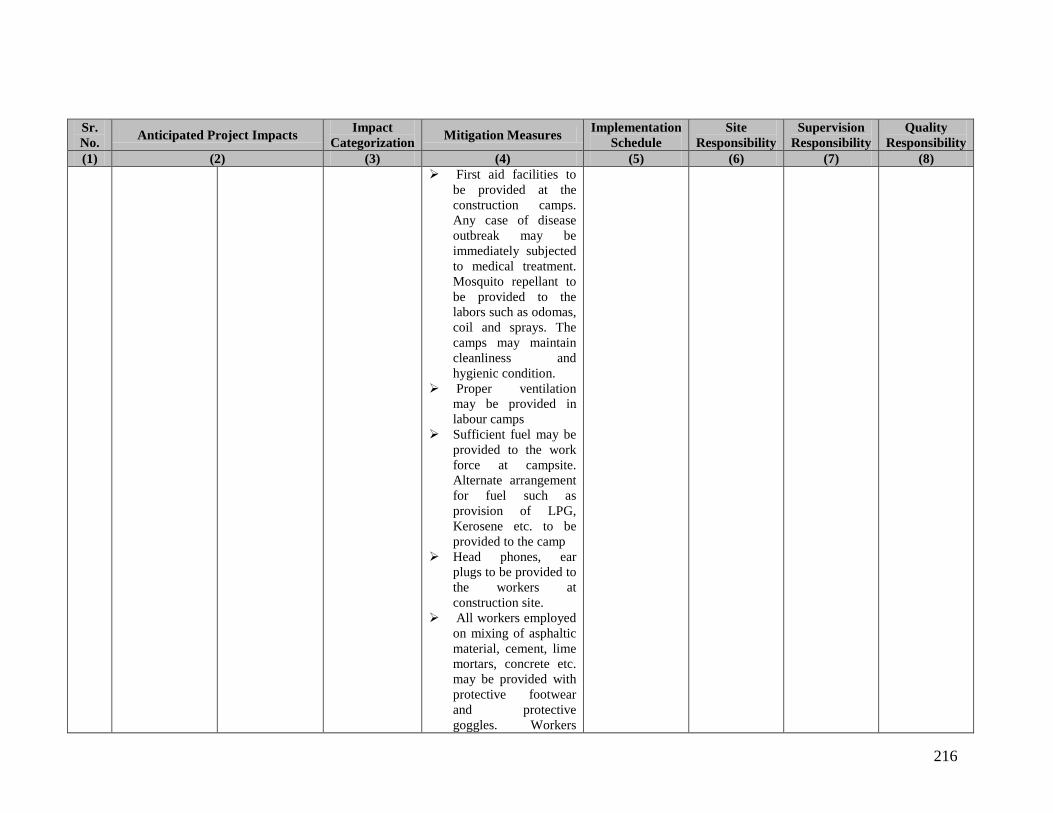
216
Sr. No. Anticipated Project Impacts Impact
Categorization Mitigation Measures Implementation Schedule
Site Responsibility
Supervision Responsibility
Quality Responsibility
(1) (2) (3) (4) (5) (6) (7) (8) First aid facilities to
be provided at the construction camps. Any case of disease outbreak may be immediately subjected to medical treatment. Mosquito repellant to be provided to the labors such as odomas, coil and sprays. The camps may maintain cleanliness and hygienic condition.
Proper ventilation may be provided in labour camps
Sufficient fuel may be provided to the work force at campsite. Alternate arrangement for fuel such as provision of LPG, Kerosene etc. to be provided to the camp
Head phones, ear plugs to be provided to the workers at construction site.
All workers employed on mixing of asphaltic material, cement, lime mortars, concrete etc. may be provided with protective footwear and protective goggles. Workers
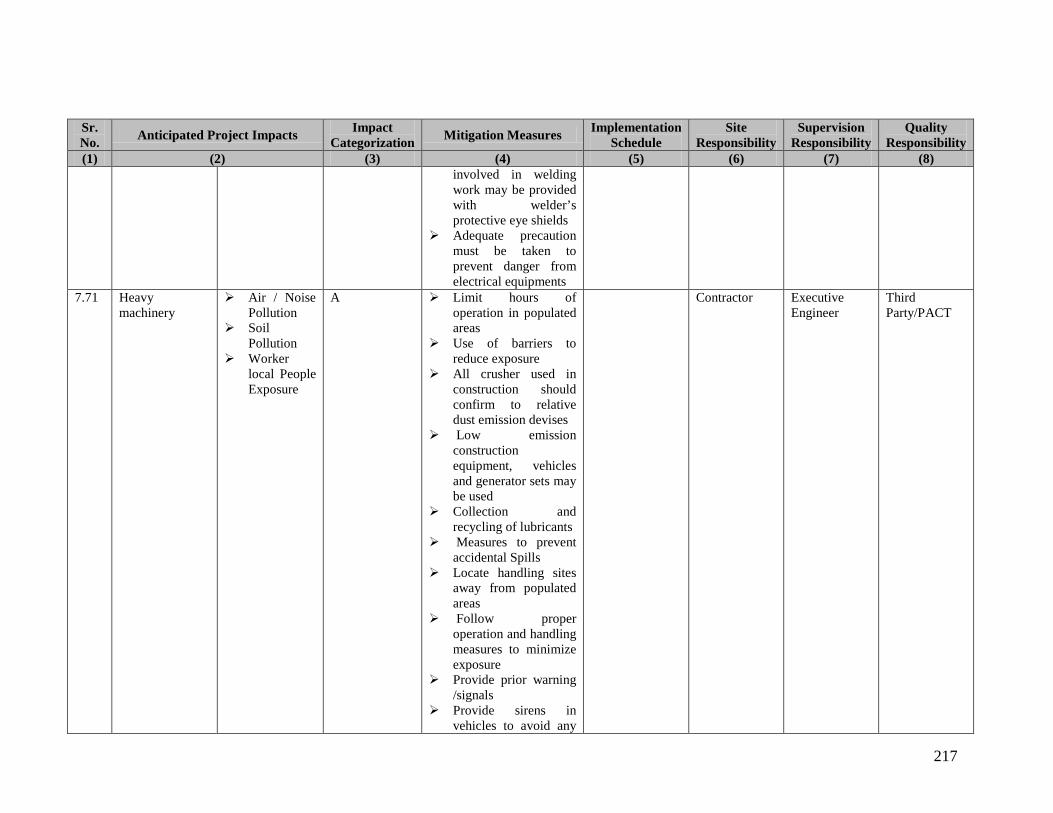
217
Sr. No. Anticipated Project Impacts Impact
Categorization Mitigation Measures Implementation Schedule
Site Responsibility
Supervision Responsibility
Quality Responsibility
(1) (2) (3) (4) (5) (6) (7) (8) involved in welding work may be provided with welder’s protective eye shields
Adequate precaution must be taken to prevent danger from electrical equipments
7.71 Heavy machinery
Air / Noise Pollution
Soil Pollution
Worker local People Exposure
A Limit hours of operation in populated areas
Use of barriers to reduce exposure
All crusher used in construction should confirm to relative dust emission devises
Low emission construction equipment, vehicles and generator sets may be used
Collection and recycling of lubricants
Measures to prevent accidental Spills
Locate handling sites away from populated areas
Follow proper operation and handling measures to minimize exposure
Provide prior warning /signals
Provide sirens in vehicles to avoid any
Contractor Executive Engineer
Third Party/PACT
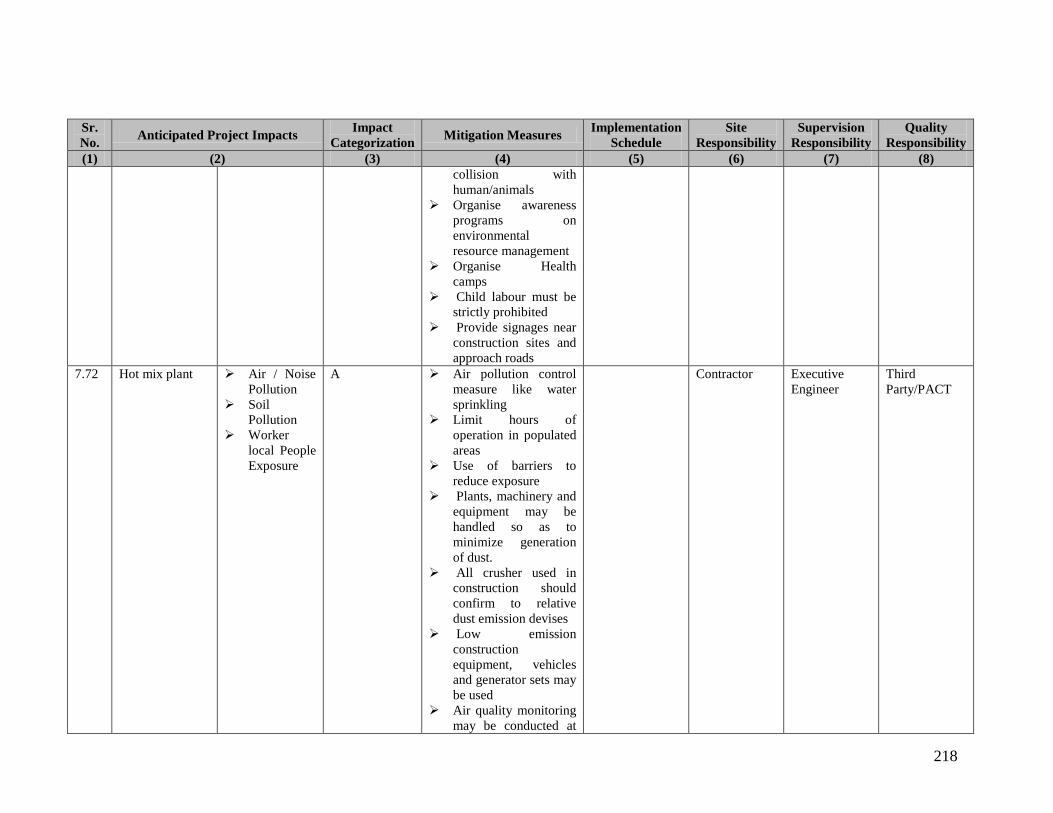
218
Sr. No. Anticipated Project Impacts Impact
Categorization Mitigation Measures Implementation Schedule
Site Responsibility
Supervision Responsibility
Quality Responsibility
(1) (2) (3) (4) (5) (6) (7) (8) collision with human/animals
Organise awareness programs on environmental resource management
Organise Health camps
Child labour must be strictly prohibited
Provide signages near construction sites and approach roads
7.72 Hot mix plant Air / Noise Pollution
Soil Pollution
Worker local People Exposure
A Air pollution control measure like water sprinkling
Limit hours of operation in populated areas
Use of barriers to reduce exposure
Plants, machinery and equipment may be handled so as to minimize generation of dust.
All crusher used in construction should confirm to relative dust emission devises
Low emission construction equipment, vehicles and generator sets may be used
Air quality monitoring may be conducted at
Contractor Executive Engineer
Third Party/PACT

219
Sr. No. Anticipated Project Impacts Impact
Categorization Mitigation Measures Implementation Schedule
Site Responsibility
Supervision Responsibility
Quality Responsibility
(1) (2) (3) (4) (5) (6) (7) (8) construction sites.
Collection and recycling of lubricants
Measures to prevent accidental Spills
Locate handling sites away from populated areas
Follow proper operation and handling measures to minimize exposure
Provide prior warning /signals for blasting
Provide sirens in vehicles to avoid any collision with human/animals
Organise awareness programs on environmental resource management
Organise Health camps
Child labour must be strictly prohibited
Provide signages near construction sites and approach roads
7.73 Concrete mixture and heavy Pumps
Air / Noise Pollution
Soil Pollution
Worker local People Exposure
A Air pollution control measure like water sprinkling
Limit hours of operation in populated areas
Use of barriers to reduce Exposure
Contractor Executive Engineer
Third Party/PACT

220
Sr. No. Anticipated Project Impacts Impact
Categorization Mitigation Measures Implementation Schedule
Site Responsibility
Supervision Responsibility
Quality Responsibility
(1) (2) (3) (4) (5) (6) (7) (8) Plants, machinery and equipment may be handled so as to minimize generation of dust.
All crusher used in construction should confirm to relative dust emission devises
Low emission construction equipment, vehicles and generator sets may be used
Air quality monitoring may beconducted at construction sites.
Collection and recycling of lubricants
Measures to prevent accidental Spills
Locate handling sites away from populated areas
Follow proper operation and handling measures to minimize exposure
Provide prior warning /signals for blasting
Provide sirens in vehicles to avoid any collision with human/animals
Organise awareness programs on
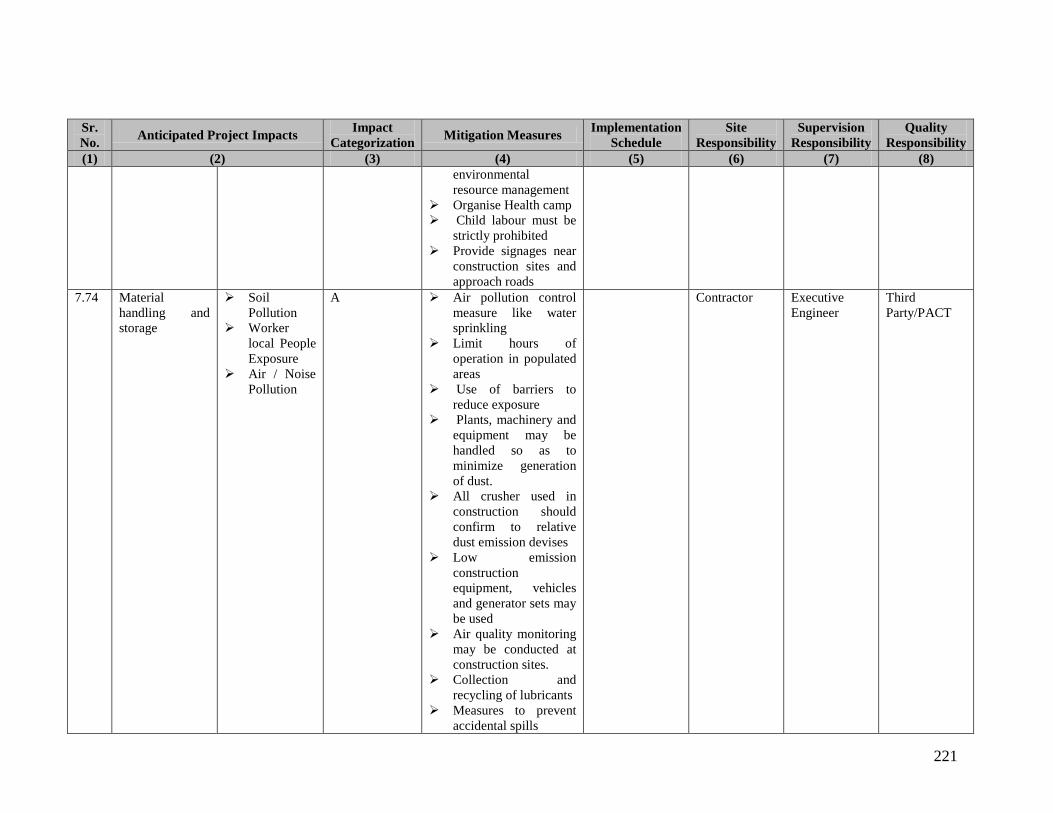
221
Sr. No. Anticipated Project Impacts Impact
Categorization Mitigation Measures Implementation Schedule
Site Responsibility
Supervision Responsibility
Quality Responsibility
(1) (2) (3) (4) (5) (6) (7) (8) environmental resource management
Organise Health camp Child labour must be
strictly prohibited Provide signages near
construction sites and approach roads
7.74 Material handling and storage
Soil Pollution
Worker local People Exposure
Air / Noise Pollution
A Air pollution control measure like water sprinkling
Limit hours of operation in populated areas
Use of barriers to reduce exposure
Plants, machinery and equipment may be handled so as to minimize generation of dust.
All crusher used in construction should confirm to relative dust emission devises
Low emission construction equipment, vehicles and generator sets may be used
Air quality monitoring may be conducted at construction sites.
Collection and recycling of lubricants
Measures to prevent accidental spills
Contractor Executive Engineer
Third Party/PACT
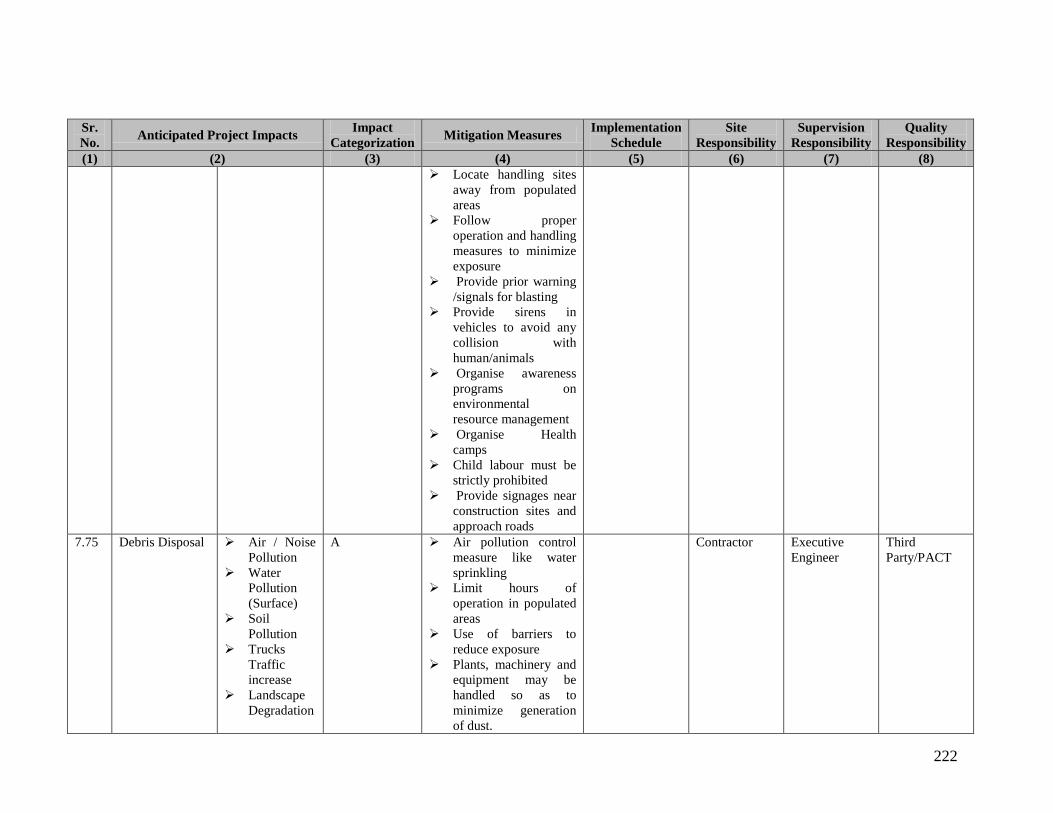
222
Sr. No. Anticipated Project Impacts Impact
Categorization Mitigation Measures Implementation Schedule
Site Responsibility
Supervision Responsibility
Quality Responsibility
(1) (2) (3) (4) (5) (6) (7) (8) Locate handling sites
away from populated areas
Follow proper operation and handling measures to minimize exposure
Provide prior warning /signals for blasting
Provide sirens in vehicles to avoid any collision with human/animals
Organise awareness programs on environmental resource management
Organise Health camps
Child labour must be strictly prohibited
Provide signages near construction sites and approach roads
7.75 Debris Disposal Air / Noise Pollution
Water Pollution (Surface)
Soil Pollution
Trucks Traffic increase
Landscape Degradation
A Air pollution control measure like water sprinkling
Limit hours of operation in populated areas
Use of barriers to reduce exposure
Plants, machinery and equipment may be handled so as to minimize generation of dust.
Contractor Executive Engineer
Third Party/PACT
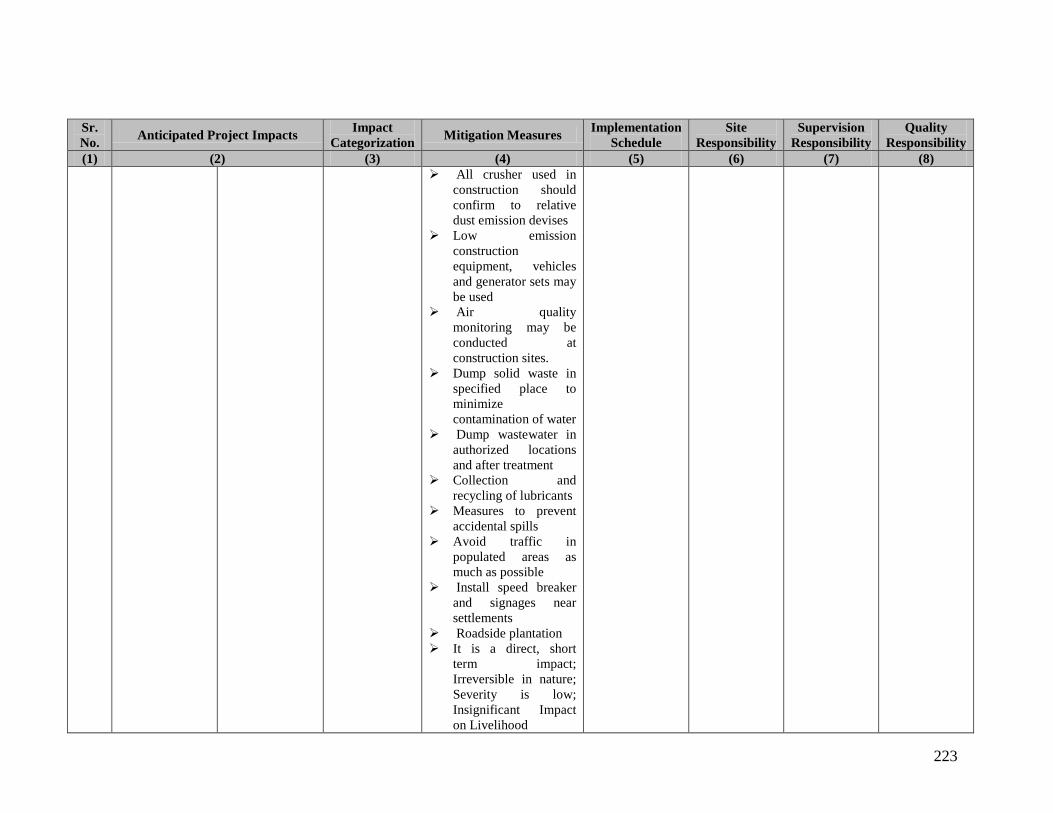
223
Sr. No. Anticipated Project Impacts Impact
Categorization Mitigation Measures Implementation Schedule
Site Responsibility
Supervision Responsibility
Quality Responsibility
(1) (2) (3) (4) (5) (6) (7) (8) All crusher used in
construction should confirm to relative dust emission devises
Low emission construction equipment, vehicles and generator sets may be used
Air quality monitoring may be conducted at construction sites.
Dump solid waste in specified place to minimize contamination of water
Dump wastewater in authorized locations and after treatment
Collection and recycling of lubricants
Measures to prevent accidental spills
Avoid traffic in populated areas as much as possible
Install speed breaker and signages near settlements
Roadside plantation It is a direct, short
term impact; Irreversible in nature; Severity is low; Insignificant Impact on Livelihood

224
Sr. No. Anticipated Project Impacts Impact
Categorization Mitigation Measures Implementation Schedule
Site Responsibility
Supervision Responsibility
Quality Responsibility
(1) (2) (3) (4) (5) (6) (7) (8) Carry plantation work
on open sites Do not dump waste
along settlement or access route
Frame Muck disposal program
Frame quarry & borrow area rehabilitation program
Develop green belts along approach road
On completion of the works all the temporary structures may be cleared away, all rubbish disposed, excreta and disposal pits or trenches filled in and effectively sealed off and the whole site
7.76 Transport of materials
Air / Noise Pollution
Soil Pollution
Trucks Traffic increase
A Air pollution control measure like water sprinkling
Limit hours of operation in populated areas
Use of barriers to reduce exposure
Plants, machinery and equipment may be handled so as to minimize generation of dust.
All crusher used in construction should
Contractor Executive Engineer
Third Party/PACT

225
Sr. No. Anticipated Project Impacts Impact
Categorization Mitigation Measures Implementation Schedule
Site Responsibility
Supervision Responsibility
Quality Responsibility
(1) (2) (3) (4) (5) (6) (7) (8) confirm to relative dust emission devises
Low emission construction equipment, vehicles and generator sets may be used
Air quality monitoring may be conducted at construction sites.
Collection and recycling of lubricants
Measures to prevent accidental Spills
Spillage proof vehicles shall be allowed
Avoid traffic in populated areas as much as possible
Install speed breaker and signages near settlements
Roadside plantation 7.77 Repair and
Clearing of irrigation outlets
Dredging/De-siltation
Contractor Executive Engineer
Third Party/PACT
7.78 Labor Camps
o Worker local People Exposure
o Impact on human health (Labor Camps)
A Routine medical check up of Field staff and labours
Provision of potable drinking water at site
Provision of proper sewage and waste disposal system. Sanitation facilities have to be provided at
Contractor Executive Engineer
Third Party/PACT

226
Sr. No. Anticipated Project Impacts Impact
Categorization Mitigation Measures Implementation Schedule
Site Responsibility
Supervision Responsibility
Quality Responsibility
(1) (2) (3) (4) (5) (6) (7) (8) the camp sites.
Awareness program on HIV aids and other communicable disease may be provided to the work force.
First aid facilities to be provided at the construction camps. Any case of disease outbreak may be immediately subjected to medical treatment. Mosquito repellant to be provided to the labors such as odomas, coil and sprays. The camps may maintain cleanliness and hygienic condition.
Proper ventilation may be provided in labour camps
Sufficient fuel may be provided to the work force at campsite. Alternate arrangement for fuel such as provision of LPG, Kerosene etc. to be provided to the camp
Head phones, ear plugs to be provided to the workers at construction site.
All workers employed on mixing of asphaltic

227
Sr. No. Anticipated Project Impacts Impact
Categorization Mitigation Measures Implementation Schedule
Site Responsibility
Supervision Responsibility
Quality Responsibility
(1) (2) (3) (4) (5) (6) (7) (8) material, cement, lime mortars, concrete etc. may be provided with protective footwear and protective goggles. Workers involved in welding work may be provided with welder’s protective eye shields
Adequate precaution must be taken to prevent danger from electrical equipments
7.79 Heavy machinery
Air / Noise Pollution
Soil Pollution
Worker local People Exposure
A Limit hours of operation in populated areas
Use of barriers to reduce exposure
All crusher used in construction should confirm to relative dust emission devises
Low emission construction equipment, vehicles and generator sets may be used
Collection and recycling of lubricants
Measures to prevent accidental Spills
Locate handling sites away from populated areas
Follow proper operation and handling
Contractor Executive Engineer
Third Party/PACT

228
Sr. No. Anticipated Project Impacts Impact
Categorization Mitigation Measures Implementation Schedule
Site Responsibility
Supervision Responsibility
Quality Responsibility
(1) (2) (3) (4) (5) (6) (7) (8) measures to minimize exposure
Provide prior warning /signals
Provide sirens in vehicles to avoid any collision with human/animals
Organise awareness programs on environmental resource management
Organise Health camps
Child labour must be strictly prohibited
Provide signages near construction sites and approach roads
7.80 Hot mix plant Air / Noise Pollution
Soil Pollution
Worker local People Exposure
A Air pollution control measure like water sprinkling
Limit hours of operation in populated areas
Use of barriers to reduce exposure
Plants, machinery and equipment may be handled so as to minimize generation of dust.
All crusher used in construction should confirm to relative dust emission devises
Low emission
Contractor Executive Engineer
Third Party/PACT

229
Sr. No. Anticipated Project Impacts Impact
Categorization Mitigation Measures Implementation Schedule
Site Responsibility
Supervision Responsibility
Quality Responsibility
(1) (2) (3) (4) (5) (6) (7) (8) construction equipment, vehicles and generator sets may be used
Air quality monitoring may be conducted at construction sites.
Collection and recycling of lubricants
Measures to prevent accidental Spills
Locate handling sites away from populated areas
Follow proper operation and handling measures to minimize exposure
Provide prior warning /signals for blasting
Provide sirens in vehicles to avoid any collision with human/animals
Organise awareness programs on environmental resource management
Organise Health camps
Child labour must be strictly prohibited
Provide signages near construction sites and approach roads
7.81 Concrete mixture and
Air / Noise Pollution
A Air pollution control measure like water
Contractor Executive Engineer
Third Party/PACT

230
Sr. No. Anticipated Project Impacts Impact
Categorization Mitigation Measures Implementation Schedule
Site Responsibility
Supervision Responsibility
Quality Responsibility
(1) (2) (3) (4) (5) (6) (7) (8) heavy Pumps Soil
Pollution Worker
local People Exposure
sprinkling Limit hours of
operation in populated areas
Use of barriers to reduce Exposure Plants, machinery and equipment may be handled so as to minimize generation of dust.
All crusher used in construction should confirm to relative dust emission devises
Low emission construction equipment, vehicles and generator sets may be used
Air quality monitoring may beconducted at construction sites.
Collection and recycling of lubricants
Measures to prevent accidental Spills
Locate handling sites away from populated areas
Follow proper operation and handling measures to minimize exposure
Provide prior warning /signals for blasting

231
Sr. No. Anticipated Project Impacts Impact
Categorization Mitigation Measures Implementation Schedule
Site Responsibility
Supervision Responsibility
Quality Responsibility
(1) (2) (3) (4) (5) (6) (7) (8) Provide sirens in
vehicles to avoid any collision with human/animals
Organise awareness programs on environmental resource management
Organise Health camp Child labour must be
strictly prohibited Provide signages near
construction sites and approach roads
7.82 Material handling and storage
Soil Pollution
Worker local People Exposure
Air / Noise Pollution
A Air pollution control measure like water sprinkling
Limit hours of operation in populated areas
Use of barriers to reduce exposure
Plants, machinery and equipment may be handled so as to minimize generation of dust.
All crusher used in construction should confirm to relative dust emission devises
Low emission construction equipment, vehicles and generator sets may be used
Air quality monitoring
Contractor Executive Engineer
Third Party/PACT

232
Sr. No. Anticipated Project Impacts Impact
Categorization Mitigation Measures Implementation Schedule
Site Responsibility
Supervision Responsibility
Quality Responsibility
(1) (2) (3) (4) (5) (6) (7) (8) may be conducted at construction sites.
Collection and recycling of lubricants
Measures to prevent accidental spills
Locate handling sites away from populated areas
Follow proper operation and handling measures to minimize exposure
Provide prior warning /signals for blasting
Provide sirens in vehicles to avoid any collision with human/animals
Organise awareness programs on environmental resource management
Organise Health camps
Child labour must be strictly prohibited
Provide signages near construction sites and approach roads
7.83 Debris Disposal Air / Noise Pollution
Water Pollution (Surface)
Soil Pollution
A Air pollution control measure like water sprinkling
Limit hours of operation in populated areas
Use of barriers to
Contractor Executive Engineer
Third Party/PACT

233
Sr. No. Anticipated Project Impacts Impact
Categorization Mitigation Measures Implementation Schedule
Site Responsibility
Supervision Responsibility
Quality Responsibility
(1) (2) (3) (4) (5) (6) (7) (8) Trucks
Traffic increase
Landscape Degradation
reduce exposure Plants, machinery and
equipment may be handled so as to minimize generation of dust.
All crusher used in construction should confirm to relative dust emission devises
Low emission construction equipment, vehicles and generator sets may be used
Air quality monitoring may be conducted at construction sites.
Dump solid waste in specified place to minimize contamination of water
Dump wastewater in authorized locations and after treatment
Collection and recycling of lubricants
Measures to prevent accidental spills
Avoid traffic in populated areas as much as possible
Install speed breaker and signages near settlements
Roadside plantation

234
Sr. No. Anticipated Project Impacts Impact
Categorization Mitigation Measures Implementation Schedule
Site Responsibility
Supervision Responsibility
Quality Responsibility
(1) (2) (3) (4) (5) (6) (7) (8) It is a direct, short
term impact; Irreversible in nature; Severity is low; Insignificant Impact on Livelihood
Carry plantation work on open sites
Do not dump waste along settlement or access route
Frame Muck disposal program
Frame quarry & borrow area rehabilitation program
Develop green belts along approach road
On completion of the works all the temporary structures may be cleared away, all rubbish disposed, excreta and disposal pits or trenches filled in and effectively sealed off and the whole site
7.84 Transport of materials
Air / Noise Pollution
Soil Pollution
Worker local People Exposure
A Air pollution control measure like water sprinkling
Limit hours of operation in populated areas
Use of barriers to reduce exposure
Plants, machinery and
Contractor Executive Engineer
Third Party/PACT
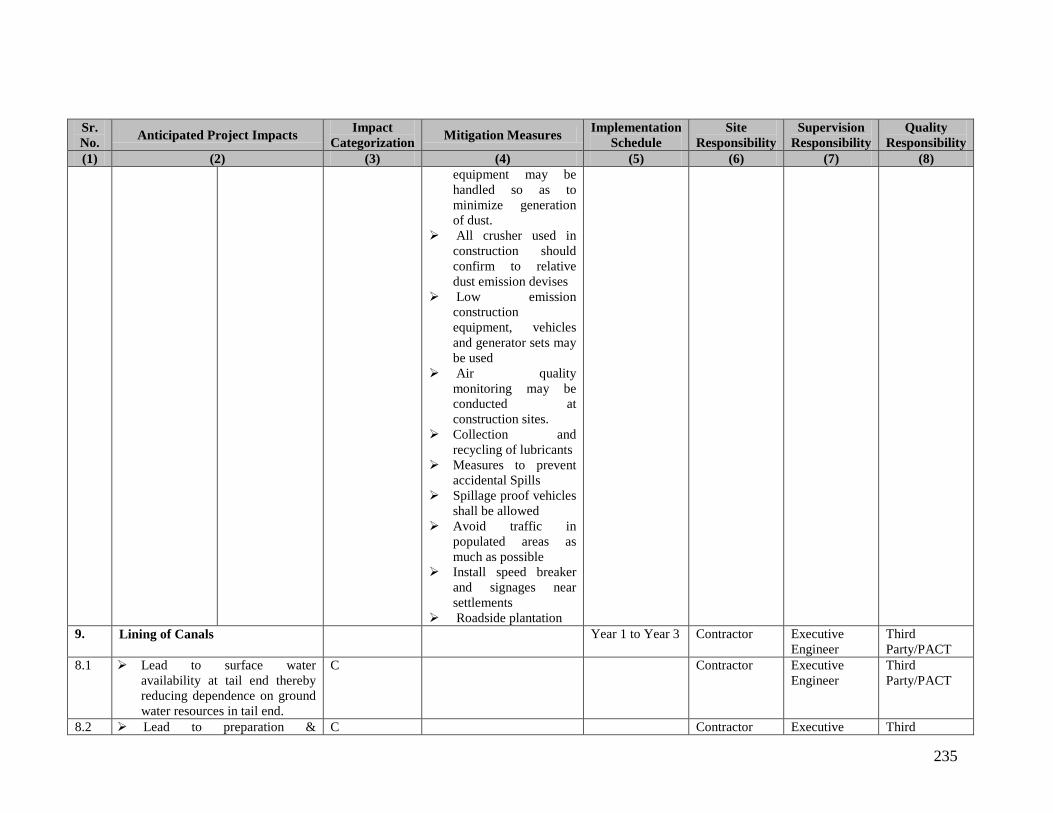
235
Sr. No. Anticipated Project Impacts Impact
Categorization Mitigation Measures Implementation Schedule
Site Responsibility
Supervision Responsibility
Quality Responsibility
(1) (2) (3) (4) (5) (6) (7) (8) equipment may be handled so as to minimize generation of dust.
All crusher used in construction should confirm to relative dust emission devises
Low emission construction equipment, vehicles and generator sets may be used
Air quality monitoring may be conducted at construction sites.
Collection and recycling of lubricants
Measures to prevent accidental Spills
Spillage proof vehicles shall be allowed
Avoid traffic in populated areas as much as possible
Install speed breaker and signages near settlements
Roadside plantation 9. Lining of Canals Year 1 to Year 3 Contractor Executive
Engineer Third Party/PACT
8.1 Lead to surface water availability at tail end thereby reducing dependence on ground water resources in tail end.
C Contractor Executive Engineer
Third Party/PACT
8.2 Lead to preparation & C Contractor Executive Third

236
Sr. No. Anticipated Project Impacts Impact
Categorization Mitigation Measures Implementation Schedule
Site Responsibility
Supervision Responsibility
Quality Responsibility
(1) (2) (3) (4) (5) (6) (7) (8) implementation Crop Plan, which will lead to agriculture intensification & diversification.
Engineer Party/PACT
8.3 Lead to increase in net sown area and bring additional land into agriculture & allied activities.
C Contractor Executive Engineer
Third Party/PACT
8.4 Lead to reduce recharge of Ground Water.
Contractor Executive Engineer
Third Party/PACT
8.5 Lining of Main and branch canal
Air / Noise Pollution
Water Pollution (Surface)
Soil Pollution
Trucks Traffic increase
Worker local People Exposure
Generation Excavated Material
Water Delivery reduction, interruption
A Contractor Executive Engineer
Third Party/PACT
8.6 Labor Camps
Worker local People Exposure
Impact on human health
A Routine medical check up of Field staff and labours
Provision of potable drinking water at site
Provision of proper
Contractor Executive Engineer
Third Party/PACT

237
Sr. No. Anticipated Project Impacts Impact
Categorization Mitigation Measures Implementation Schedule
Site Responsibility
Supervision Responsibility
Quality Responsibility
(1) (2) (3) (4) (5) (6) (7) (8) (Labor Camps)
sewage and waste disposal system. Sanitation facilities have to be provided at the camp sites.
Awareness program on HIV aids and other communicable disease may be provided to the work force.
First aid facilities to be provided at the construction camps. Any case of disease outbreak may be immediately subjected to medical treatment. Mosquito repellant to be provided to the labors such as odomas, coil and sprays. The camps may maintain cleanliness and hygienic condition.
Proper ventilation may be provided in labour camps
Sufficient fuel may be provided to the work force at campsite. Alternate arrangement for fuel such as provision of LPG, Kerosene etc. to be provided to the camp
Head phones, ear plugs to be provided to

238
Sr. No. Anticipated Project Impacts Impact
Categorization Mitigation Measures Implementation Schedule
Site Responsibility
Supervision Responsibility
Quality Responsibility
(1) (2) (3) (4) (5) (6) (7) (8) the workers at construction site.
All workers employed on mixing of asphaltic material, cement, lime mortars, concrete etc. may be provided with protective footwear and protective goggles. Workers involved in welding work may be provided with welder’s protective eye shields
Adequate precaution must be taken to prevent danger from electrical equipments
8.7 Heavy machinery
Air / Noise Pollution
Soil Pollution
Worker local People Exposure
A Limit hours of operation in populated areas
Use of barriers to reduce exposure
All crusher used in construction should confirm to relative dust emission devises
Low emission construction equipment, vehicles and generator sets may be used
Collection and recycling of lubricants
Measures to prevent accidental Spills
Locate handling sites
Contractor Executive Engineer
Third Party/PACT
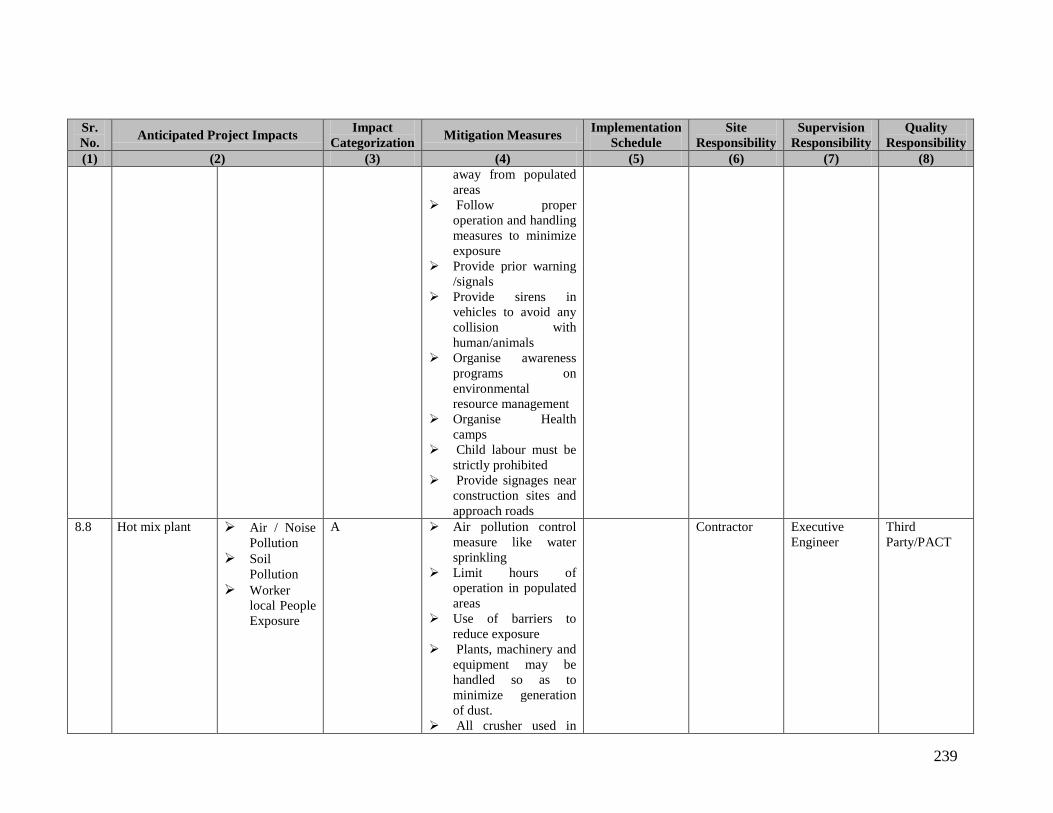
239
Sr. No. Anticipated Project Impacts Impact
Categorization Mitigation Measures Implementation Schedule
Site Responsibility
Supervision Responsibility
Quality Responsibility
(1) (2) (3) (4) (5) (6) (7) (8) away from populated areas
Follow proper operation and handling measures to minimize exposure
Provide prior warning /signals
Provide sirens in vehicles to avoid any collision with human/animals
Organise awareness programs on environmental resource management
Organise Health camps
Child labour must be strictly prohibited
Provide signages near construction sites and approach roads
8.8 Hot mix plant Air / Noise Pollution
Soil Pollution
Worker local People Exposure
A Air pollution control measure like water sprinkling
Limit hours of operation in populated areas
Use of barriers to reduce exposure
Plants, machinery and equipment may be handled so as to minimize generation of dust.
All crusher used in
Contractor Executive Engineer
Third Party/PACT
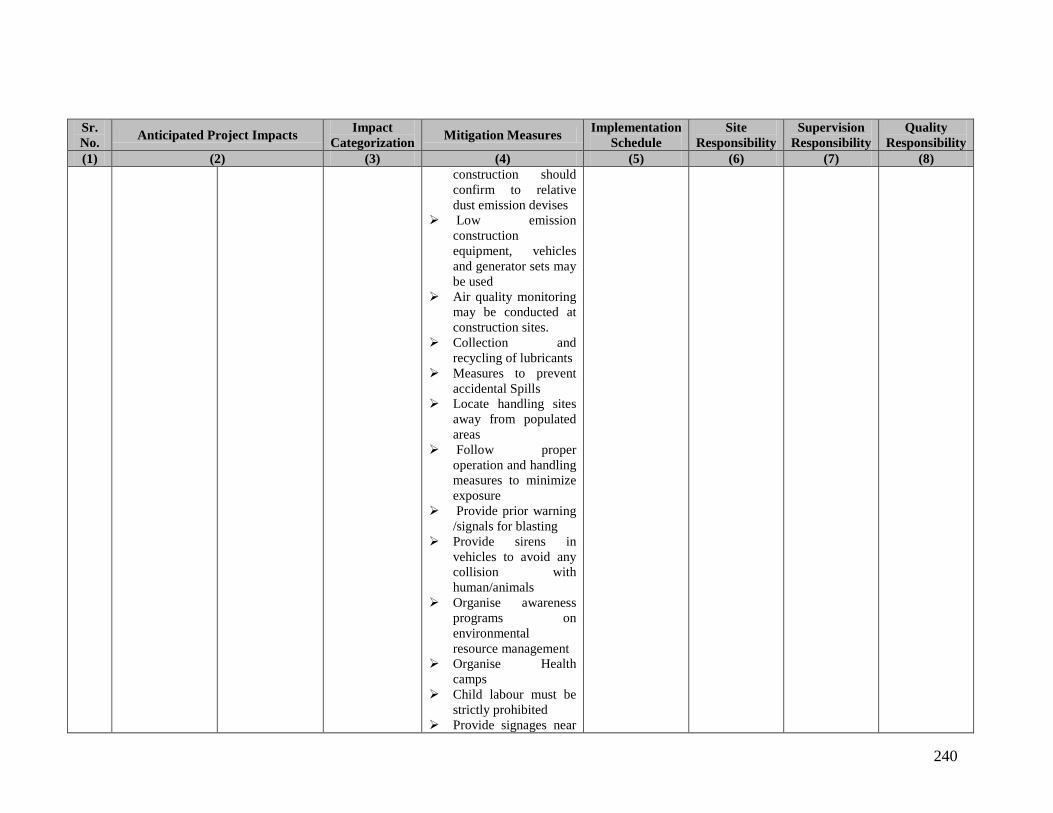
240
Sr. No. Anticipated Project Impacts Impact
Categorization Mitigation Measures Implementation Schedule
Site Responsibility
Supervision Responsibility
Quality Responsibility
(1) (2) (3) (4) (5) (6) (7) (8) construction should confirm to relative dust emission devises
Low emission construction equipment, vehicles and generator sets may be used
Air quality monitoring may be conducted at construction sites.
Collection and recycling of lubricants
Measures to prevent accidental Spills
Locate handling sites away from populated areas
Follow proper operation and handling measures to minimize exposure
Provide prior warning /signals for blasting
Provide sirens in vehicles to avoid any collision with human/animals
Organise awareness programs on environmental resource management
Organise Health camps
Child labour must be strictly prohibited
Provide signages near

241
Sr. No. Anticipated Project Impacts Impact
Categorization Mitigation Measures Implementation Schedule
Site Responsibility
Supervision Responsibility
Quality Responsibility
(1) (2) (3) (4) (5) (6) (7) (8) construction sites and approach roads
8.9 Concrete mixture and heavy Pumps
Air / Noise Pollution
Soil Pollution
Worker local People Exposure
A Air pollution control measure like water sprinkling
Limit hours of operation in populated areas
Use of barriers to reduce Exposure Plants, machinery and equipment may be handled so as to minimize generation of dust.
All crusher used in construction should confirm to relative dust emission devises
Low emission construction equipment, vehicles and generator sets may be used
Air quality monitoring may beconducted at construction sites.
Collection and recycling of lubricants
Measures to prevent accidental Spills
Locate handling sites away from populated areas
Follow proper operation and handling
Contractor Executive Engineer
Third Party/PACT
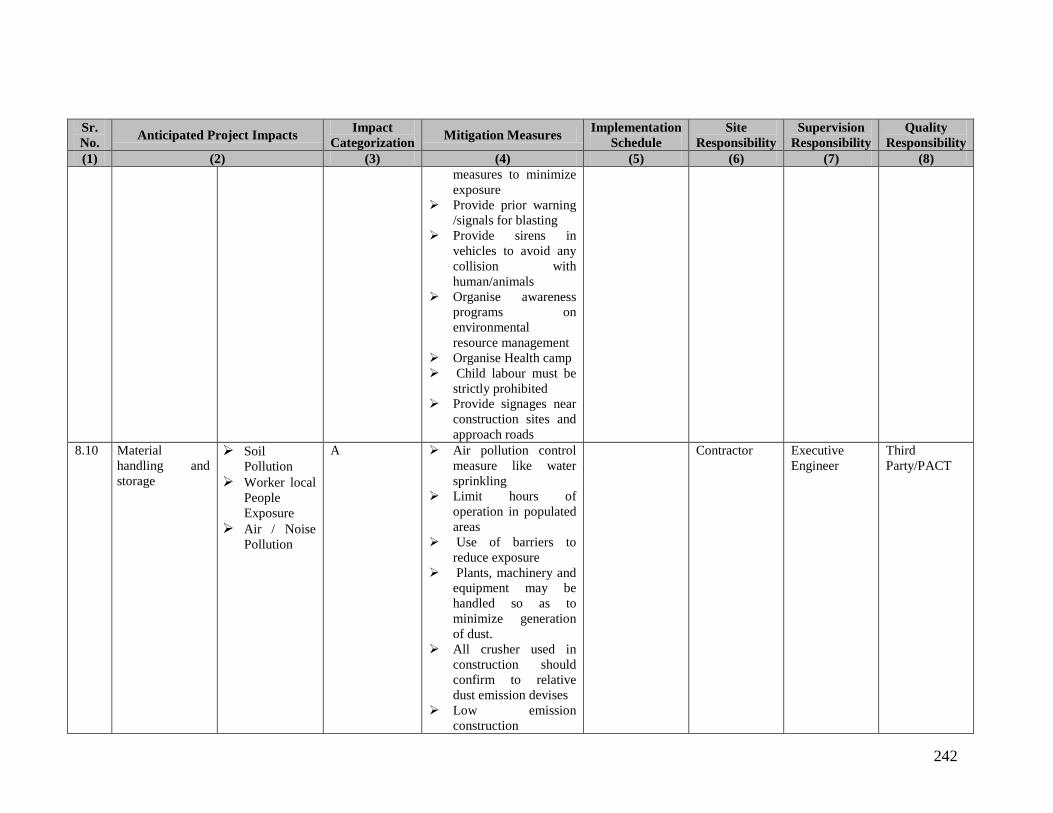
242
Sr. No. Anticipated Project Impacts Impact
Categorization Mitigation Measures Implementation Schedule
Site Responsibility
Supervision Responsibility
Quality Responsibility
(1) (2) (3) (4) (5) (6) (7) (8) measures to minimize exposure
Provide prior warning /signals for blasting
Provide sirens in vehicles to avoid any collision with human/animals
Organise awareness programs on environmental resource management
Organise Health camp Child labour must be
strictly prohibited Provide signages near
construction sites and approach roads
8.10 Material handling and storage
Soil Pollution
Worker local People Exposure
Air / Noise Pollution
A Air pollution control measure like water sprinkling
Limit hours of operation in populated areas
Use of barriers to reduce exposure
Plants, machinery and equipment may be handled so as to minimize generation of dust.
All crusher used in construction should confirm to relative dust emission devises
Low emission construction
Contractor Executive Engineer
Third Party/PACT

243
Sr. No. Anticipated Project Impacts Impact
Categorization Mitigation Measures Implementation Schedule
Site Responsibility
Supervision Responsibility
Quality Responsibility
(1) (2) (3) (4) (5) (6) (7) (8) equipment, vehicles and generator sets may be used
Air quality monitoring may be conducted at construction sites.
Collection and recycling of lubricants
Measures to prevent accidental spills
Locate handling sites away from populated areas
Follow proper operation and handling measures to minimize exposure
Provide prior warning /signals for blasting
Provide sirens in vehicles to avoid any collision with human/animals
Organise awareness programs on environmental resource management
Organise Health camps
Child labour must be strictly prohibited
Provide signages near construction sites and approach roads
8.11 Debris Disposal Air / Noise Pollution
A Air pollution control measure like water sprinkling
Contractor Executive Engineer
Third Party/PACT

244
Sr. No. Anticipated Project Impacts Impact
Categorization Mitigation Measures Implementation Schedule
Site Responsibility
Supervision Responsibility
Quality Responsibility
(1) (2) (3) (4) (5) (6) (7) (8) Water
Pollution (Surface)
Soil Pollution
Trucks Traffic increase
Landscape Degradation
Limit hours of operation in populated areas
Use of barriers to reduce exposure
Plants, machinery and equipment may be handled so as to minimize generation of dust.
All crusher used in construction should confirm to relative dust emission devises
Low emission construction equipment, vehicles and generator sets may be used
Air quality monitoring may be conducted at construction sites.
Dump solid waste in specified place to minimize contamination of water
Dump wastewater in authorized locations and after treatment
Collection and recycling of lubricants
Measures to prevent accidental spills
Avoid traffic in populated areas as much as possible

245
Sr. No. Anticipated Project Impacts Impact
Categorization Mitigation Measures Implementation Schedule
Site Responsibility
Supervision Responsibility
Quality Responsibility
(1) (2) (3) (4) (5) (6) (7) (8) Install speed breaker
and signages near settlements
Roadside plantation It is a direct, short
term impact; Irreversible in nature; Severity is low; Insignificant Impact on Livelihood
Carry plantation work on open sites
Do not dump waste along settlement or access route
Frame Muck disposal program
Frame quarry & borrow area rehabilitation program
Develop green belts along approach road
On completion of the works all the temporary structures may be cleared away, all rubbish disposed, excreta and disposal pits or trenches filled in and effectively sealed off and the whole site
8.12 Transport of materials
Air / Noise Pollution
Soil Pollution
A Air pollution control measure like water sprinkling
Limit hours of operation in populated
Contractor Executive Engineer
Third Party/PACT

246
Sr. No. Anticipated Project Impacts Impact
Categorization Mitigation Measures Implementation Schedule
Site Responsibility
Supervision Responsibility
Quality Responsibility
(1) (2) (3) (4) (5) (6) (7) (8) Trucks
Traffic increase
areas Use of barriers to
reduce exposure Plants, machinery and
equipment may be handled so as to minimize generation of dust.
All crusher used in construction should confirm to relative dust emission devises
Low emission construction equipment, vehicles and generator sets may be used
Air quality monitoring may be conducted at construction sites.
Collection and recycling of lubricants
Measures to prevent accidental Spills
Spillage proof vehicles shall be allowed
Avoid traffic in populated areas as much as possible
Install speed breaker and signages near settlements
Roadside plantation 8.13 Dredging / De-
siltation
Contractor Executive Engineer
Third Party/PACT

247
Sr. No. Anticipated Project Impacts Impact
Categorization Mitigation Measures Implementation Schedule
Site Responsibility
Supervision Responsibility
Quality Responsibility
(1) (2) (3) (4) (5) (6) (7) (8) 8.14 Labor Camps
Worker
local People Exposure
Impact on human health (Labor Camps)
A Routine medical check up of Field staff and labours
Provision of potable drinking water at site
Provision of proper sewage and waste disposal system. Sanitation facilities have to be provided at the camp sites.
Awareness program on HIV aids and other communicable disease may be provided to the work force.
First aid facilities to be provided at the construction camps. Any case of disease outbreak may be immediately subjected to medical treatment. Mosquito repellant to be provided to the labors such as odomas, coil and sprays. The camps may maintain cleanliness and hygienic condition.
Proper ventilation may be provided in labour camps
Sufficient fuel may be provided to the work force at campsite. Alternate arrangement
Contractor Executive Engineer
Third Party/PACT

248
Sr. No. Anticipated Project Impacts Impact
Categorization Mitigation Measures Implementation Schedule
Site Responsibility
Supervision Responsibility
Quality Responsibility
(1) (2) (3) (4) (5) (6) (7) (8) for fuel such as provision of LPG, Kerosene etc. to be provided to the camp
Head phones, ear plugs to be provided to the workers at construction site.
All workers employed on mixing of asphaltic material, cement, lime mortars, concrete etc. may be provided with protective footwear and protective goggles. Workers involved in welding work may be provided with welder’s protective eye shields
Adequate precaution must be taken to prevent danger from electrical equipments
8.15 Heavy machinery
Air / Noise Pollution
Soil Pollution
Worker local People Exposure
A Limit hours of operation in populated areas
Use of barriers to reduce exposure
All crusher used in construction should confirm to relative dust emission devises
Low emission construction equipment, vehicles and generator sets may
Contractor Executive Engineer
Third Party/PACT
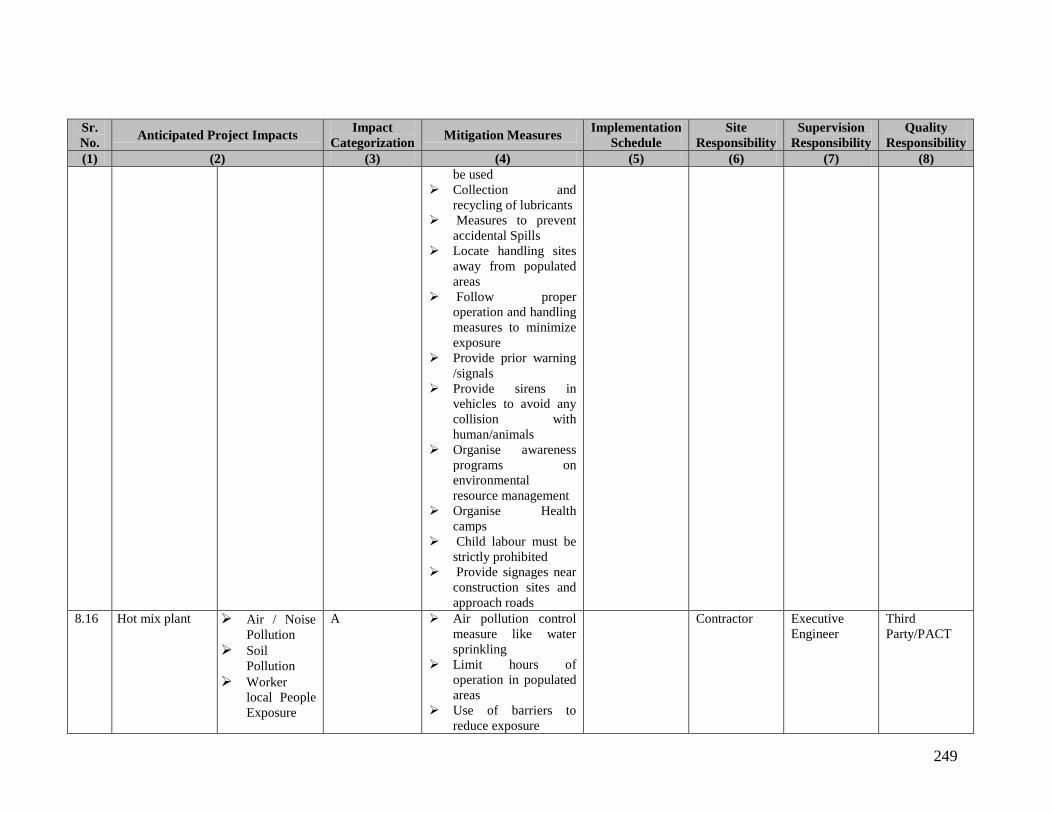
249
Sr. No. Anticipated Project Impacts Impact
Categorization Mitigation Measures Implementation Schedule
Site Responsibility
Supervision Responsibility
Quality Responsibility
(1) (2) (3) (4) (5) (6) (7) (8) be used
Collection and recycling of lubricants
Measures to prevent accidental Spills
Locate handling sites away from populated areas
Follow proper operation and handling measures to minimize exposure
Provide prior warning /signals
Provide sirens in vehicles to avoid any collision with human/animals
Organise awareness programs on environmental resource management
Organise Health camps
Child labour must be strictly prohibited
Provide signages near construction sites and approach roads
8.16 Hot mix plant Air / Noise Pollution
Soil Pollution
Worker local People Exposure
A Air pollution control measure like water sprinkling
Limit hours of operation in populated areas
Use of barriers to reduce exposure
Contractor Executive Engineer
Third Party/PACT
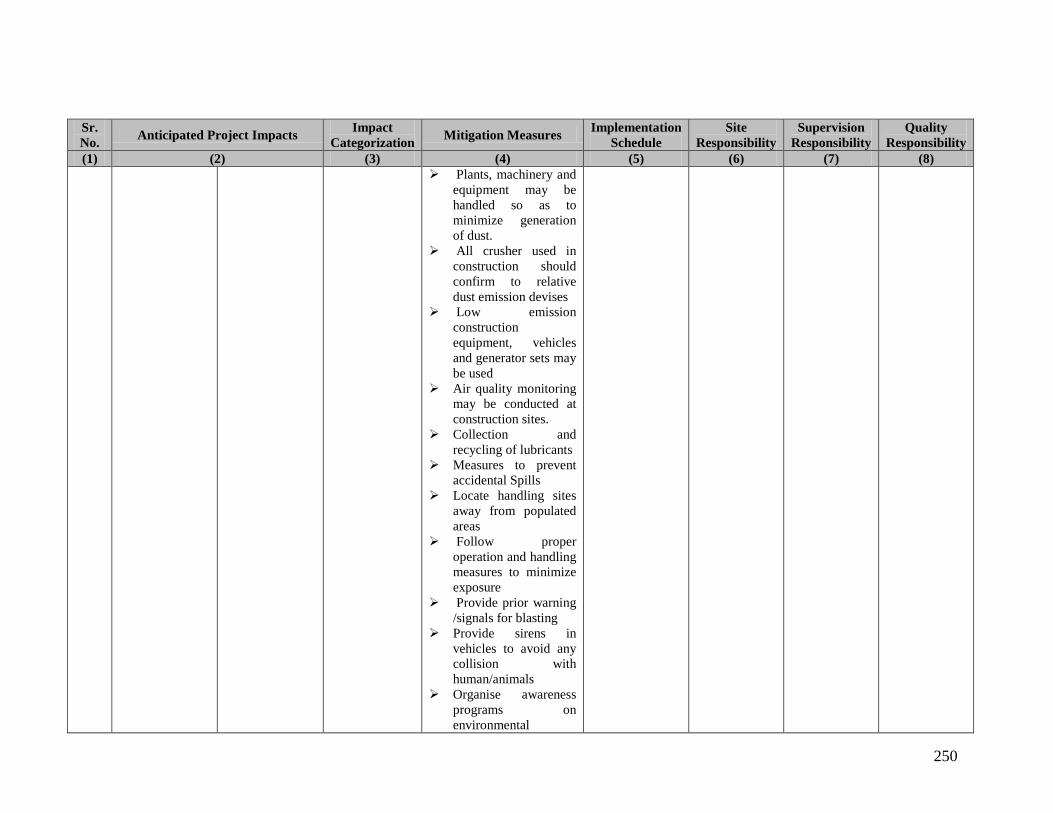
250
Sr. No. Anticipated Project Impacts Impact
Categorization Mitigation Measures Implementation Schedule
Site Responsibility
Supervision Responsibility
Quality Responsibility
(1) (2) (3) (4) (5) (6) (7) (8) Plants, machinery and
equipment may be handled so as to minimize generation of dust.
All crusher used in construction should confirm to relative dust emission devises
Low emission construction equipment, vehicles and generator sets may be used
Air quality monitoring may be conducted at construction sites.
Collection and recycling of lubricants
Measures to prevent accidental Spills
Locate handling sites away from populated areas
Follow proper operation and handling measures to minimize exposure
Provide prior warning /signals for blasting
Provide sirens in vehicles to avoid any collision with human/animals
Organise awareness programs on environmental

251
Sr. No. Anticipated Project Impacts Impact
Categorization Mitigation Measures Implementation Schedule
Site Responsibility
Supervision Responsibility
Quality Responsibility
(1) (2) (3) (4) (5) (6) (7) (8) resource management
Organise Health camps
Child labour must be strictly prohibited
Provide signages near construction sites and approach roads
8.17 Concrete mixture and heavy Pumps
Air / Noise Pollution
Soil Pollution
Worker local People Exposure
A Air pollution control measure like water sprinkling
Limit hours of operation in populated areas
Use of barriers to reduce Exposure Plants, machinery and equipment may be handled so as to minimize generation of dust.
All crusher used in construction should confirm to relative dust emission devises
Low emission construction equipment, vehicles and generator sets may be used
Air quality monitoring may beconducted at construction sites.
Collection and recycling of lubricants
Measures to prevent
Contractor Executive Engineer
Third Party/PACT

252
Sr. No. Anticipated Project Impacts Impact
Categorization Mitigation Measures Implementation Schedule
Site Responsibility
Supervision Responsibility
Quality Responsibility
(1) (2) (3) (4) (5) (6) (7) (8) accidental Spills
Locate handling sites away from populated areas
Follow proper operation and handling measures to minimize exposure
Provide prior warning /signals for blasting
Provide sirens in vehicles to avoid any collision with human/animals
Organise awareness programs on environmental resource management
Organise Health camp Child labour must be
strictly prohibited Provide signages near
construction sites and approach roads
8.18 Material handling and storage
Soil Pollution
Worker local People Exposure
Air / Noise Pollution
A Air pollution control measure like water sprinkling
Limit hours of operation in populated areas
Use of barriers to reduce exposure
Plants, machinery and equipment may be handled so as to minimize generation of dust.
Contractor Executive Engineer
Third Party/PACT
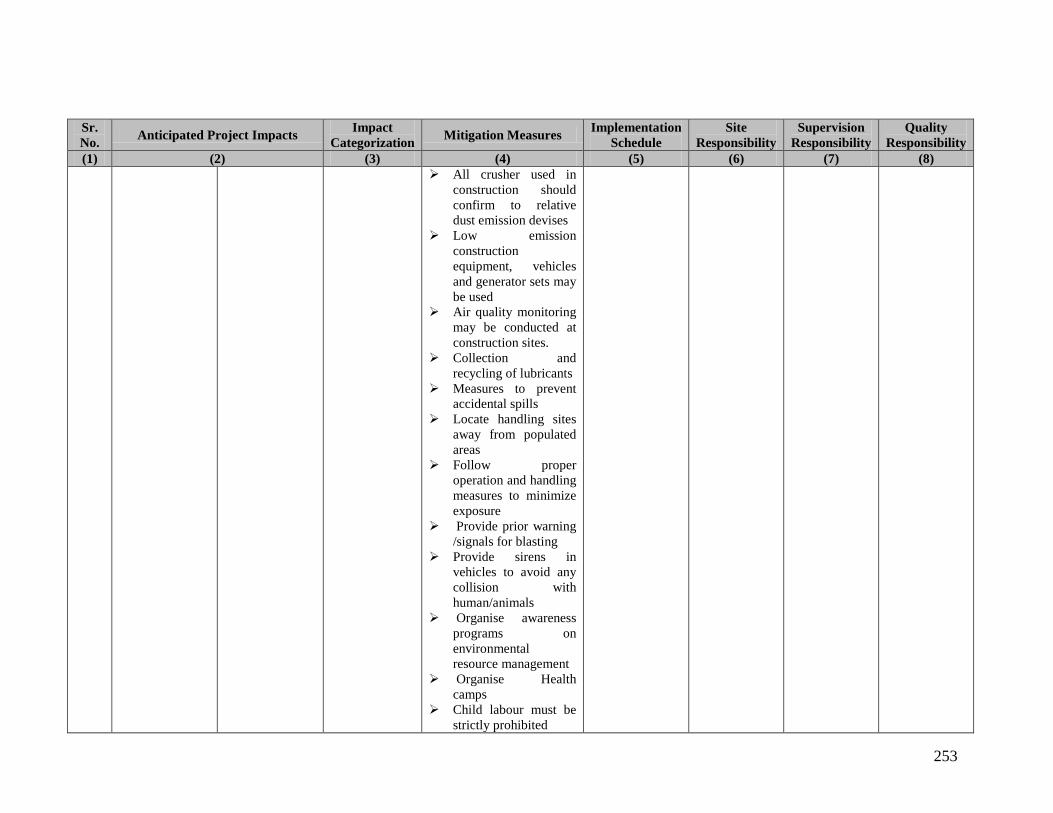
253
Sr. No. Anticipated Project Impacts Impact
Categorization Mitigation Measures Implementation Schedule
Site Responsibility
Supervision Responsibility
Quality Responsibility
(1) (2) (3) (4) (5) (6) (7) (8) All crusher used in
construction should confirm to relative dust emission devises
Low emission construction equipment, vehicles and generator sets may be used
Air quality monitoring may be conducted at construction sites.
Collection and recycling of lubricants
Measures to prevent accidental spills
Locate handling sites away from populated areas
Follow proper operation and handling measures to minimize exposure
Provide prior warning /signals for blasting
Provide sirens in vehicles to avoid any collision with human/animals
Organise awareness programs on environmental resource management
Organise Health camps
Child labour must be strictly prohibited

254
Sr. No. Anticipated Project Impacts Impact
Categorization Mitigation Measures Implementation Schedule
Site Responsibility
Supervision Responsibility
Quality Responsibility
(1) (2) (3) (4) (5) (6) (7) (8) Provide signages near
construction sites and approach roads
8.19 Debris Disposal Air / Noise Pollution
Water Pollution (Surface)
Soil Pollution
Trucks Traffic increase
Landscape Degradation
A Air pollution control measure like water sprinkling
Limit hours of operation in populated areas
Use of barriers to reduce exposure
Plants, machinery and equipment may be handled so as to minimize generation of dust.
All crusher used in construction should confirm to relative dust emission devises
Low emission construction equipment, vehicles and generator sets may be used
Air quality monitoring may be conducted at construction sites.
Dump solid waste in specified place to minimize contamination of water
Dump wastewater in authorized locations and after treatment
Collection and
Contractor Executive Engineer
Third Party/PACT

255
Sr. No. Anticipated Project Impacts Impact
Categorization Mitigation Measures Implementation Schedule
Site Responsibility
Supervision Responsibility
Quality Responsibility
(1) (2) (3) (4) (5) (6) (7) (8) recycling of lubricants
Measures to prevent accidental spills
Avoid traffic in populated areas as much as possible
Install speed breaker and signages near settlements
Roadside plantation It is a direct, short
term impact; Irreversible in nature; Severity is low; Insignificant Impact on Livelihood
Carry plantation work on open sites
Do not dump waste along settlement or access route
Frame Muck disposal program
Frame quarry & borrow area rehabilitation program
Develop green belts along approach road
On completion of the works all the temporary structures may be cleared away, all rubbish disposed, excreta and disposal pits or trenches filled in and effectively sealed off and the
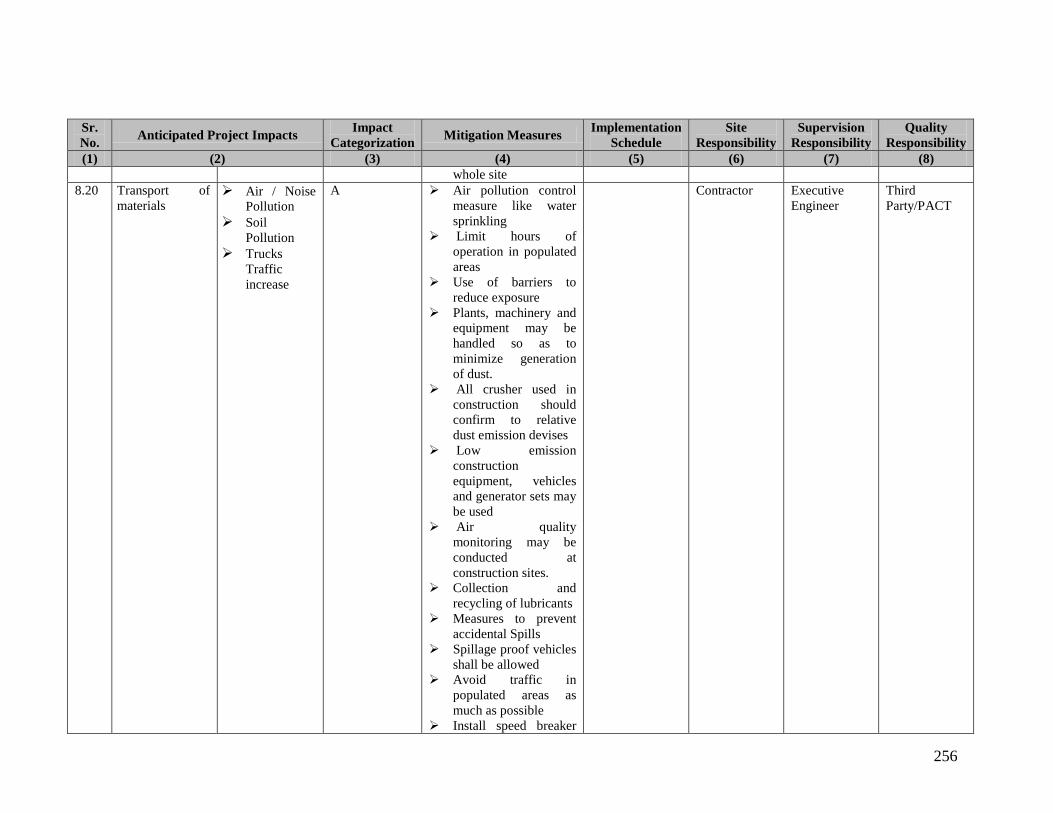
256
Sr. No. Anticipated Project Impacts Impact
Categorization Mitigation Measures Implementation Schedule
Site Responsibility
Supervision Responsibility
Quality Responsibility
(1) (2) (3) (4) (5) (6) (7) (8) whole site
8.20 Transport of materials
Air / Noise Pollution
Soil Pollution
Trucks Traffic increase
A Air pollution control measure like water sprinkling
Limit hours of operation in populated areas
Use of barriers to reduce exposure
Plants, machinery and equipment may be handled so as to minimize generation of dust.
All crusher used in construction should confirm to relative dust emission devises
Low emission construction equipment, vehicles and generator sets may be used
Air quality monitoring may be conducted at construction sites.
Collection and recycling of lubricants
Measures to prevent accidental Spills
Spillage proof vehicles shall be allowed
Avoid traffic in populated areas as much as possible
Install speed breaker
Contractor Executive Engineer
Third Party/PACT

257
Sr. No. Anticipated Project Impacts Impact
Categorization Mitigation Measures Implementation Schedule
Site Responsibility
Supervision Responsibility
Quality Responsibility
(1) (2) (3) (4) (5) (6) (7) (8) and signages near settlements
Roadside plantation 10. Rehabilitation of existing
important Building e.g. Inspection houses, offices, colonies, video conferencing centre etc.
Year 1 to Year 2 Contractor Executive Engineer
9.1 Will require land Contractor Executive Engineer
9.2 Labor Camps Worker local People Exposure
Impact on human health (Labor Camps)
A Routine medical check up of Field staff and labours
Provision of potable drinking water at site
Provision of proper sewage and waste disposal system. Sanitation facilities have to be provided at the camp sites.
Awareness program on HIV aids and other communicable disease may be provided to the work force.
First aid facilities to be provided at the construction camps. Any case of disease outbreak may be immediately subjected to medical treatment. Mosquito repellant to be provided to the labors such as odomas, coil and sprays. The camps may maintain
Contractor Executive Engineer
Third Party/PACT

258
Sr. No. Anticipated Project Impacts Impact
Categorization Mitigation Measures Implementation Schedule
Site Responsibility
Supervision Responsibility
Quality Responsibility
(1) (2) (3) (4) (5) (6) (7) (8) cleanliness and hygienic condition.
Proper ventilation may be provided in labour camps
Sufficient fuel may be provided to the work force at campsite. Alternate arrangement for fuel such as provision of LPG, Kerosene etc. to be provided to the camp
Head phones, ear plugs to be provided to the workers at construction site.
All workers employed on mixing of asphaltic material, cement, lime mortars, concrete etc. may be provided with protective footwear and protective goggles. Workers involved in welding work may be provided with welder’s protective eye shields
Adequate precaution must be taken to prevent danger from electrical equipments
9.3 Heavy machinery
Air / Noise Pollution
Soil
A Limit hours of operation in populated areas
Use of barriers to
Contractor Executive Engineer
Third Party/PACT
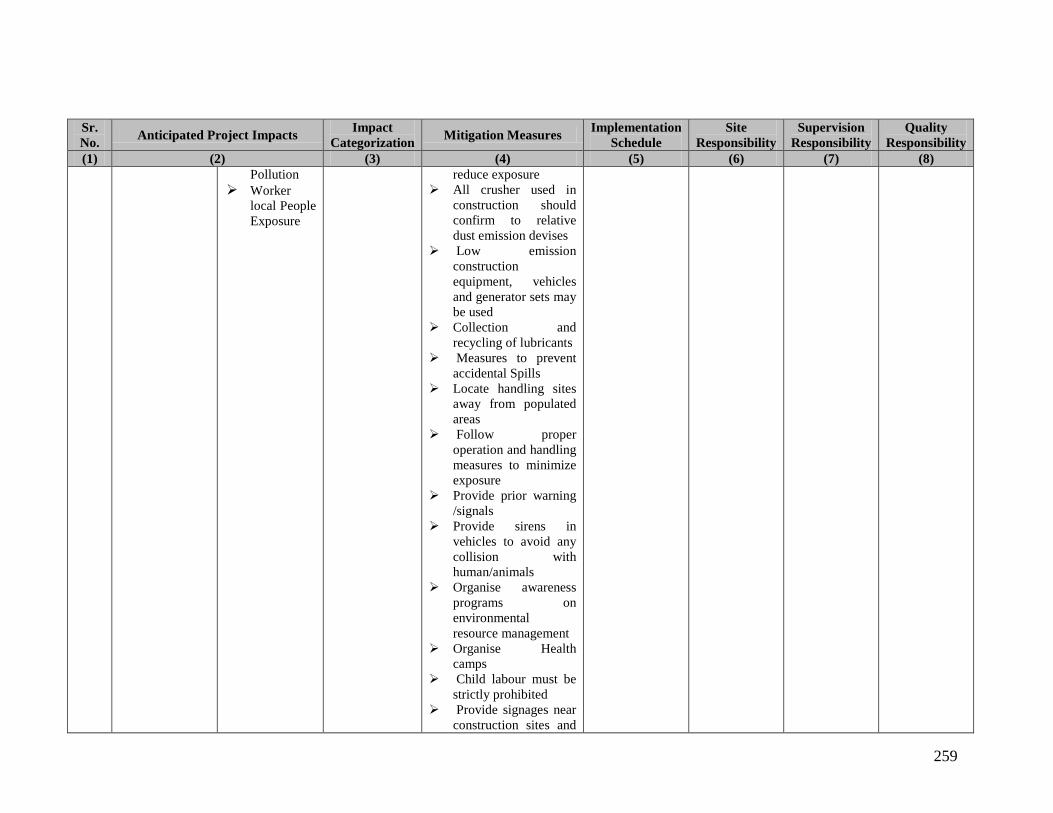
259
Sr. No. Anticipated Project Impacts Impact
Categorization Mitigation Measures Implementation Schedule
Site Responsibility
Supervision Responsibility
Quality Responsibility
(1) (2) (3) (4) (5) (6) (7) (8) Pollution
Worker local People Exposure
reduce exposure All crusher used in
construction should confirm to relative dust emission devises
Low emission construction equipment, vehicles and generator sets may be used
Collection and recycling of lubricants
Measures to prevent accidental Spills
Locate handling sites away from populated areas
Follow proper operation and handling measures to minimize exposure
Provide prior warning /signals
Provide sirens in vehicles to avoid any collision with human/animals
Organise awareness programs on environmental resource management
Organise Health camps
Child labour must be strictly prohibited
Provide signages near construction sites and
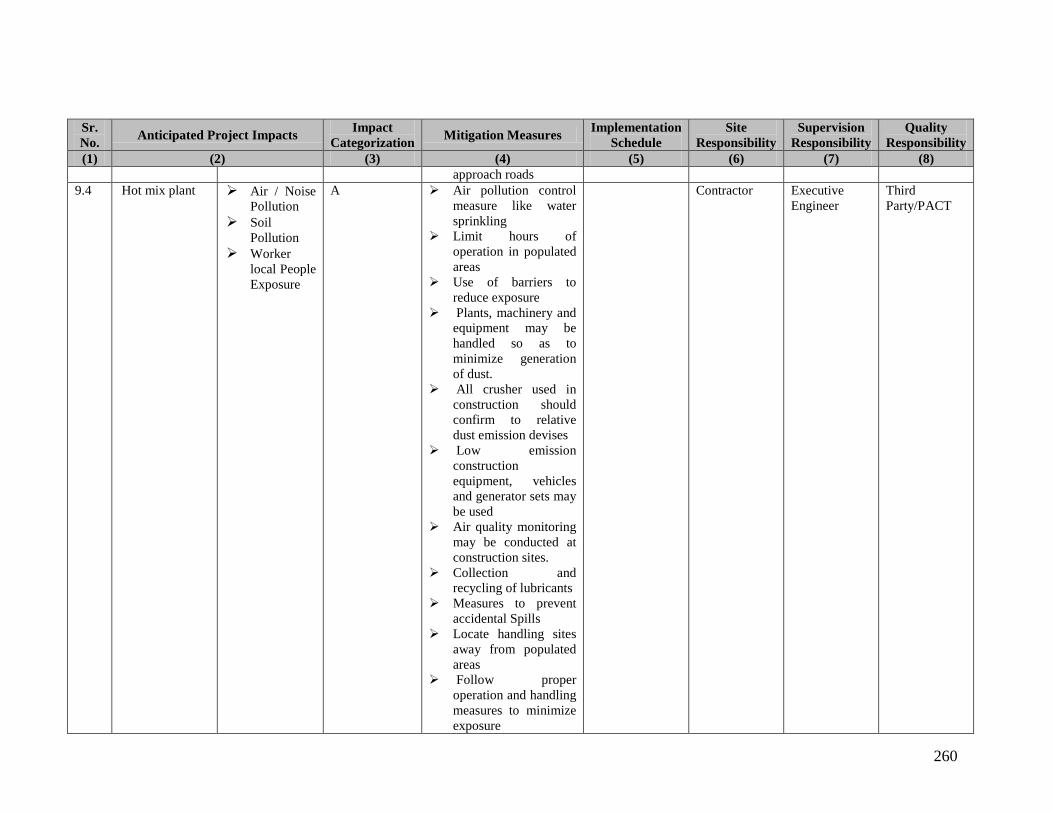
260
Sr. No. Anticipated Project Impacts Impact
Categorization Mitigation Measures Implementation Schedule
Site Responsibility
Supervision Responsibility
Quality Responsibility
(1) (2) (3) (4) (5) (6) (7) (8) approach roads
9.4 Hot mix plant Air / Noise Pollution
Soil Pollution
Worker local People Exposure
A Air pollution control measure like water sprinkling
Limit hours of operation in populated areas
Use of barriers to reduce exposure
Plants, machinery and equipment may be handled so as to minimize generation of dust.
All crusher used in construction should confirm to relative dust emission devises
Low emission construction equipment, vehicles and generator sets may be used
Air quality monitoring may be conducted at construction sites.
Collection and recycling of lubricants
Measures to prevent accidental Spills
Locate handling sites away from populated areas
Follow proper operation and handling measures to minimize exposure
Contractor Executive Engineer
Third Party/PACT

261
Sr. No. Anticipated Project Impacts Impact
Categorization Mitigation Measures Implementation Schedule
Site Responsibility
Supervision Responsibility
Quality Responsibility
(1) (2) (3) (4) (5) (6) (7) (8) Provide prior warning
/signals for blasting Provide sirens in
vehicles to avoid any collision with human/animals
Organise awareness programs on environmental resource management
Organise Health camps
Child labour must be strictly prohibited
Provide signages near construction sites and approach roads
9.5 Concrete mixture and heavy Pumps
Air / Noise Pollution
Soil Pollution
Worker local People Exposure
A Air pollution control measure like water sprinkling
Limit hours of operation in populated areas
Use of barriers to reduce Exposure Plants, machinery and equipment may be handled so as to minimize generation of dust.
All crusher used in construction should confirm to relative dust emission devises
Low emission construction equipment, vehicles
Contractor Executive Engineer
Third Party/PACT
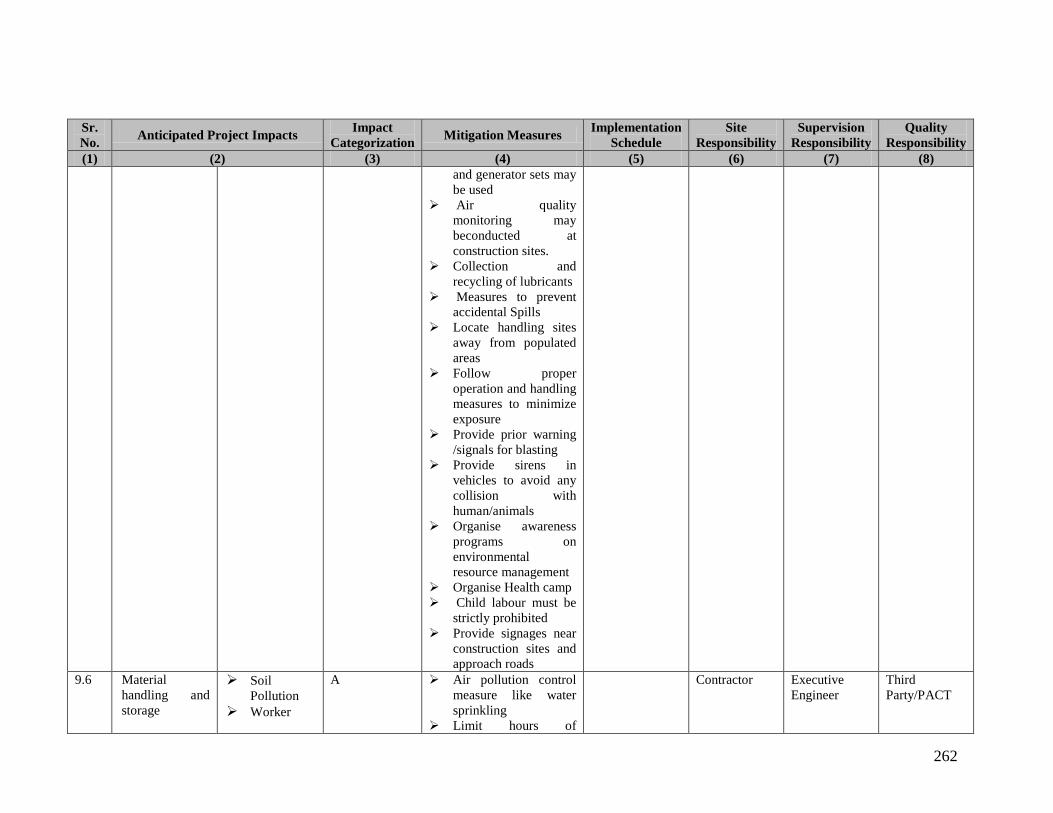
262
Sr. No. Anticipated Project Impacts Impact
Categorization Mitigation Measures Implementation Schedule
Site Responsibility
Supervision Responsibility
Quality Responsibility
(1) (2) (3) (4) (5) (6) (7) (8) and generator sets may be used
Air quality monitoring may beconducted at construction sites.
Collection and recycling of lubricants
Measures to prevent accidental Spills
Locate handling sites away from populated areas
Follow proper operation and handling measures to minimize exposure
Provide prior warning /signals for blasting
Provide sirens in vehicles to avoid any collision with human/animals
Organise awareness programs on environmental resource management
Organise Health camp Child labour must be
strictly prohibited Provide signages near
construction sites and approach roads
9.6 Material handling and storage
Soil Pollution
Worker
A Air pollution control measure like water sprinkling
Limit hours of
Contractor Executive Engineer
Third Party/PACT

263
Sr. No. Anticipated Project Impacts Impact
Categorization Mitigation Measures Implementation Schedule
Site Responsibility
Supervision Responsibility
Quality Responsibility
(1) (2) (3) (4) (5) (6) (7) (8) local People Exposure
Air / Noise Pollution
operation in populated areas
Use of barriers to reduce exposure
Plants, machinery and equipment may be handled so as to minimize generation of dust.
All crusher used in construction should confirm to relative dust emission devises
Low emission construction equipment, vehicles and generator sets may be used
Air quality monitoring may be conducted at construction sites.
Collection and recycling of lubricants
Measures to prevent accidental spills
Locate handling sites away from populated areas
Follow proper operation and handling measures to minimize exposure
Provide prior warning /signals for blasting
Provide sirens in vehicles to avoid any collision with

264
Sr. No. Anticipated Project Impacts Impact
Categorization Mitigation Measures Implementation Schedule
Site Responsibility
Supervision Responsibility
Quality Responsibility
(1) (2) (3) (4) (5) (6) (7) (8) human/animals
Organise awareness programs on environmental resource management
Organise Health camps
Child labour must be strictly prohibited
Provide signages near construction sites and approach roads
9.7 Debris Disposal Air / Noise Pollution
Water Pollution (Surface)
Soil Pollution
Trucks Traffic increase
Landscape Degradation
A Air pollution control measure like water sprinkling
Limit hours of operation in populated areas
Use of barriers to reduce exposure
Plants, machinery and equipment may be handled so as to minimize generation of dust.
All crusher used in construction should confirm to relative dust emission devises
Low emission construction equipment, vehicles and generator sets may be used
Air quality monitoring may be conducted at
Contractor Executive Engineer
Third Party/PACT
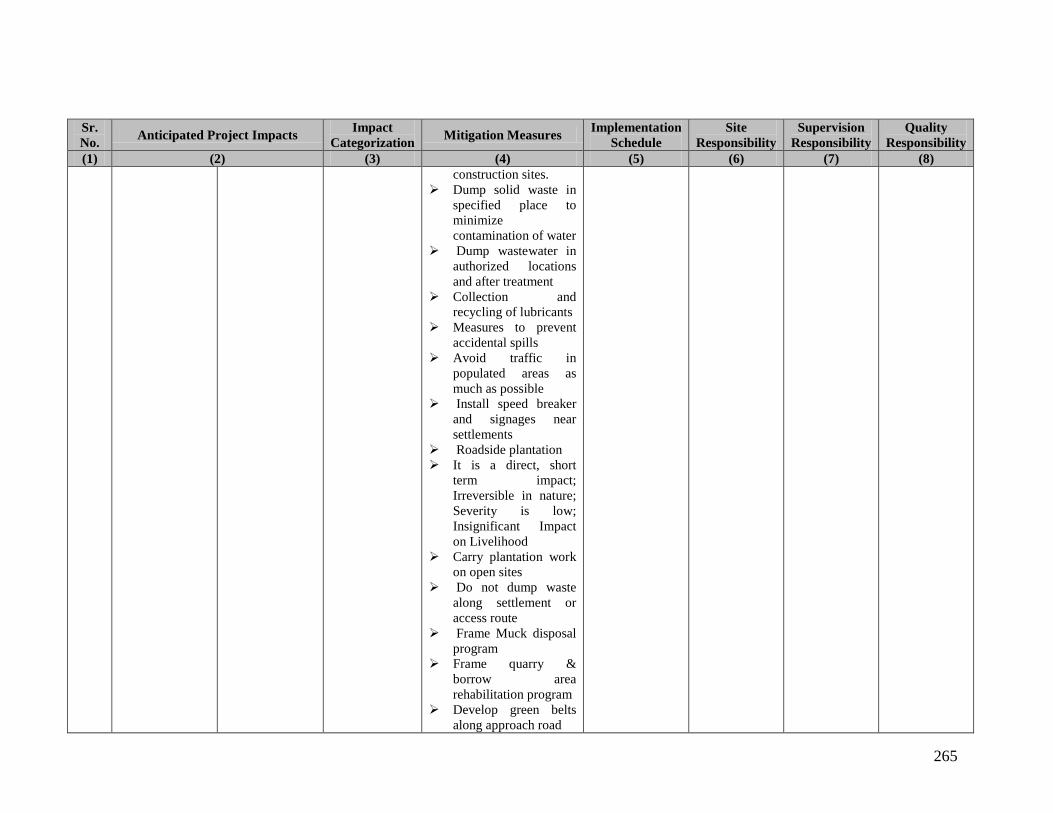
265
Sr. No. Anticipated Project Impacts Impact
Categorization Mitigation Measures Implementation Schedule
Site Responsibility
Supervision Responsibility
Quality Responsibility
(1) (2) (3) (4) (5) (6) (7) (8) construction sites.
Dump solid waste in specified place to minimize contamination of water
Dump wastewater in authorized locations and after treatment
Collection and recycling of lubricants
Measures to prevent accidental spills
Avoid traffic in populated areas as much as possible
Install speed breaker and signages near settlements
Roadside plantation It is a direct, short
term impact; Irreversible in nature; Severity is low; Insignificant Impact on Livelihood
Carry plantation work on open sites
Do not dump waste along settlement or access route
Frame Muck disposal program
Frame quarry & borrow area rehabilitation program
Develop green belts along approach road

266
Sr. No. Anticipated Project Impacts Impact
Categorization Mitigation Measures Implementation Schedule
Site Responsibility
Supervision Responsibility
Quality Responsibility
(1) (2) (3) (4) (5) (6) (7) (8) On completion of the
works all the temporary structures may be cleared away, all rubbish disposed, excreta and disposal pits or trenches filled in and effectively sealed off and the whole site
9.8 Transport of materials
Air / Noise Pollution
Soil Pollution
Trucks Traffic increase
A Air pollution control measure like water sprinkling
Limit hours of operation in populated areas
Use of barriers to reduce exposure
Plants, machinery and equipment may be handled so as to minimize generation of dust.
All crusher used in construction should confirm to relative dust emission devises
Low emission construction equipment, vehicles and generator sets may be used
Air quality monitoring may be conducted at construction sites.
Collection and
Contractor Executive Engineer
Third Party/PACT
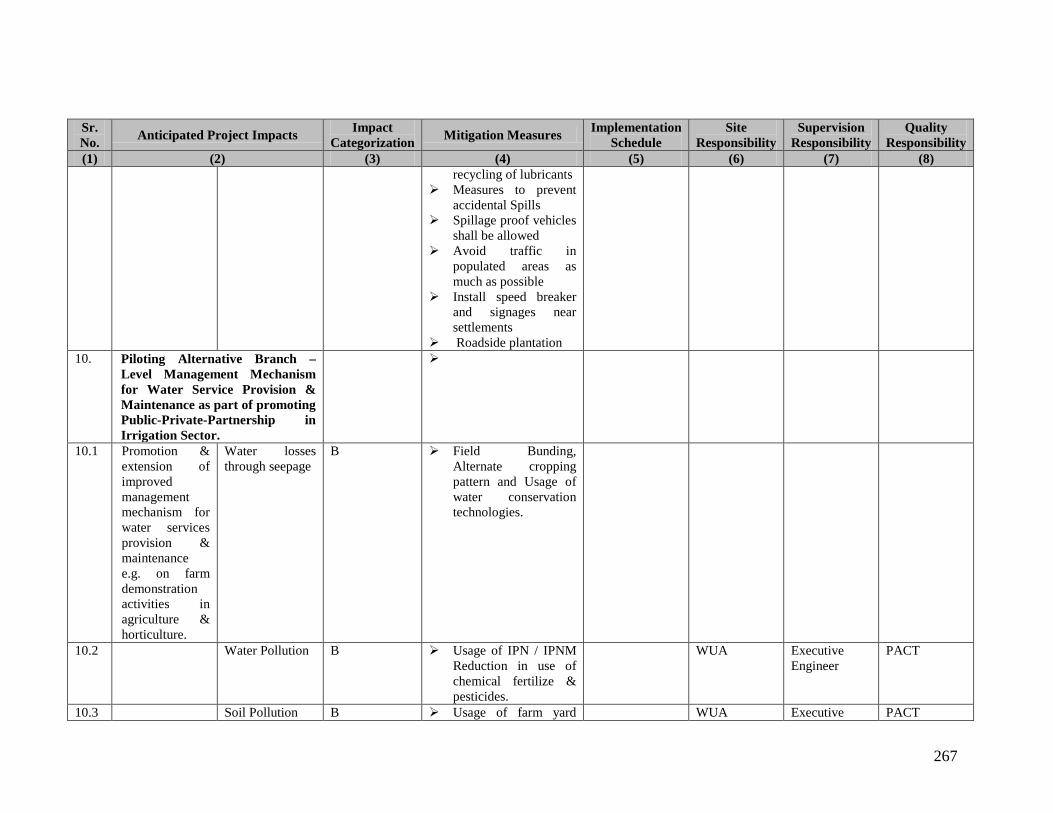
267
Sr. No. Anticipated Project Impacts Impact
Categorization Mitigation Measures Implementation Schedule
Site Responsibility
Supervision Responsibility
Quality Responsibility
(1) (2) (3) (4) (5) (6) (7) (8) recycling of lubricants
Measures to prevent accidental Spills
Spillage proof vehicles shall be allowed
Avoid traffic in populated areas as much as possible
Install speed breaker and signages near settlements
Roadside plantation 10. Piloting Alternative Branch –
Level Management Mechanism for Water Service Provision & Maintenance as part of promoting Public-Private-Partnership in Irrigation Sector.
10.1 Promotion & extension of improved management mechanism for water services provision & maintenance e.g. on farm demonstration activities in agriculture & horticulture.
Water losses through seepage
B Field Bunding, Alternate cropping pattern and Usage of water conservation technologies.
10.2 Water Pollution B Usage of IPN / IPNM Reduction in use of chemical fertilize & pesticides.
WUA Executive Engineer
PACT
10.3 Soil Pollution B Usage of farm yard WUA Executive PACT
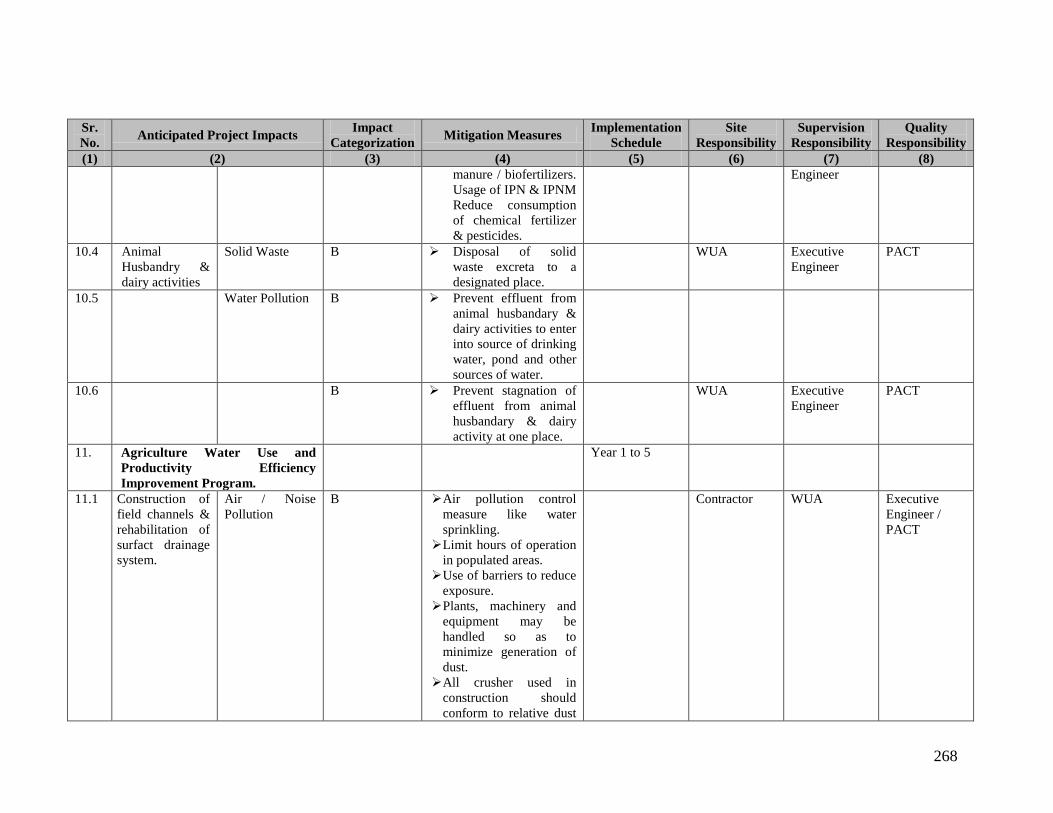
268
Sr. No. Anticipated Project Impacts Impact
Categorization Mitigation Measures Implementation Schedule
Site Responsibility
Supervision Responsibility
Quality Responsibility
(1) (2) (3) (4) (5) (6) (7) (8) manure / biofertilizers. Usage of IPN & IPNM Reduce consumption of chemical fertilizer & pesticides.
Engineer
10.4 Animal Husbandry & dairy activities
Solid Waste B Disposal of solid waste excreta to a designated place.
WUA Executive Engineer
PACT
10.5 Water Pollution B Prevent effluent from animal husbandary & dairy activities to enter into source of drinking water, pond and other sources of water.
10.6 B Prevent stagnation of effluent from animal husbandary & dairy activity at one place.
WUA Executive Engineer
PACT
11. Agriculture Water Use and Productivity Efficiency Improvement Program.
Year 1 to 5
11.1 Construction of field channels & rehabilitation of surfact drainage system.
Air / Noise Pollution
B Air pollution control measure like water sprinkling. Limit hours of operation
in populated areas. Use of barriers to reduce
exposure. Plants, machinery and
equipment may be handled so as to minimize generation of dust. All crusher used in
construction should conform to relative dust
Contractor WUA Executive Engineer / PACT
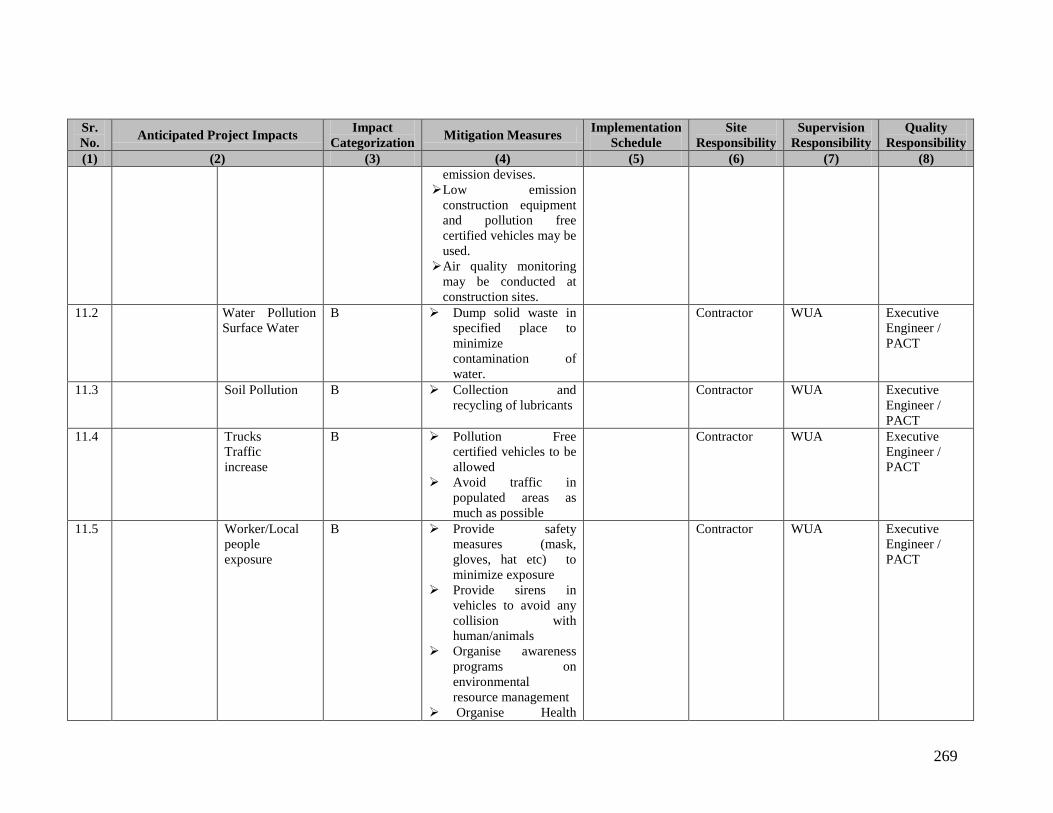
269
Sr. No. Anticipated Project Impacts Impact
Categorization Mitigation Measures Implementation Schedule
Site Responsibility
Supervision Responsibility
Quality Responsibility
(1) (2) (3) (4) (5) (6) (7) (8) emission devises. Low emission
construction equipment and pollution free certified vehicles may be used. Air quality monitoring
may be conducted at construction sites.
11.2 Water Pollution Surface Water
B Dump solid waste in specified place to minimize contamination of water.
Contractor WUA Executive Engineer / PACT
11.3 Soil Pollution B Collection and recycling of lubricants
Contractor WUA Executive Engineer / PACT
11.4 Trucks Traffic increase
B Pollution Free certified vehicles to be allowed
Avoid traffic in populated areas as much as possible
Contractor WUA Executive Engineer / PACT
11.5 Worker/Local people exposure
B Provide safety measures (mask, gloves, hat etc) to minimize exposure
Provide sirens in vehicles to avoid any collision with human/animals
Organise awareness programs on environmental resource management
Organise Health
Contractor WUA Executive Engineer / PACT

270
Sr. No. Anticipated Project Impacts Impact
Categorization Mitigation Measures Implementation Schedule
Site Responsibility
Supervision Responsibility
Quality Responsibility
(1) (2) (3) (4) (5) (6) (7) (8) camps
Child labour must be strictly prohibited
Provide signages near work sites
11.6 Disposal of Excavated Material (Silt/vegetation)
B A silt disposal plan with quantum (generated/ utilized/ disposed off ) shall be part of contract agreement
Disposal Area shall be pre-identified with due consent of local community prior to initiate work
Quality of silt shall be assessed before disposal
Remove extra silt and vegetation material as soon as possible from site
Dumping of silt/vegetation only in designated place to minimize impact on environment
Major Drains (if any) contract agreement shall also have silt disposal plan
Slope of drains/canals shall not be more than 1 m height and 2 m in width
Technical
Contractor WUA Executive Engineer / PACT
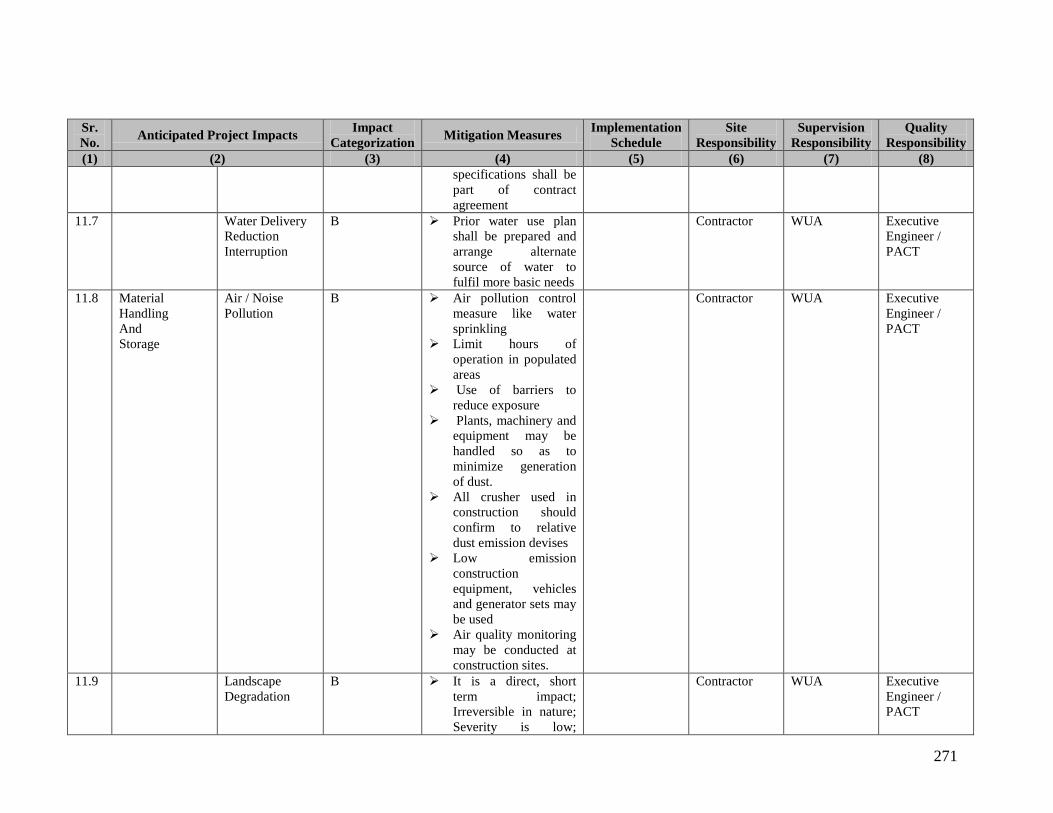
271
Sr. No. Anticipated Project Impacts Impact
Categorization Mitigation Measures Implementation Schedule
Site Responsibility
Supervision Responsibility
Quality Responsibility
(1) (2) (3) (4) (5) (6) (7) (8) specifications shall be part of contract agreement
11.7 Water Delivery Reduction Interruption
B Prior water use plan shall be prepared and arrange alternate source of water to fulfil more basic needs
Contractor WUA Executive Engineer / PACT
11.8 Material Handling And Storage
Air / Noise Pollution
B Air pollution control measure like water sprinkling
Limit hours of operation in populated areas
Use of barriers to reduce exposure
Plants, machinery and equipment may be handled so as to minimize generation of dust.
All crusher used in construction should confirm to relative dust emission devises
Low emission construction equipment, vehicles and generator sets may be used
Air quality monitoring may be conducted at construction sites.
Contractor WUA Executive Engineer / PACT
11.9 Landscape Degradation
B It is a direct, short term impact; Irreversible in nature; Severity is low;
Contractor WUA Executive Engineer / PACT

272
Sr. No. Anticipated Project Impacts Impact
Categorization Mitigation Measures Implementation Schedule
Site Responsibility
Supervision Responsibility
Quality Responsibility
(1) (2) (3) (4) (5) (6) (7) (8) Insignificant Impact on Livelihood
Carry plantation work on open sites
Do not dump waste along settlement or access route
Frame Muck disposal program
Frame quarry & borrow area rehabilitation program
Develop green belts along approach road
On completion of the works all the temporary structures may be cleared away, all rubbish disposed, excreta and disposal pits or trenches filled in and effectively sealed off and the whole site
11.10 Transport of Materials
Air / Noise Pollution
B Air pollution control measure like water sprinkling
Limit hours of operation in populated areas
Use of barriers to reduce exposure
Plants, machinery and equipment may be handled so as to minimize generation of dust.
Contractor WUA Executive Engineer / PACT
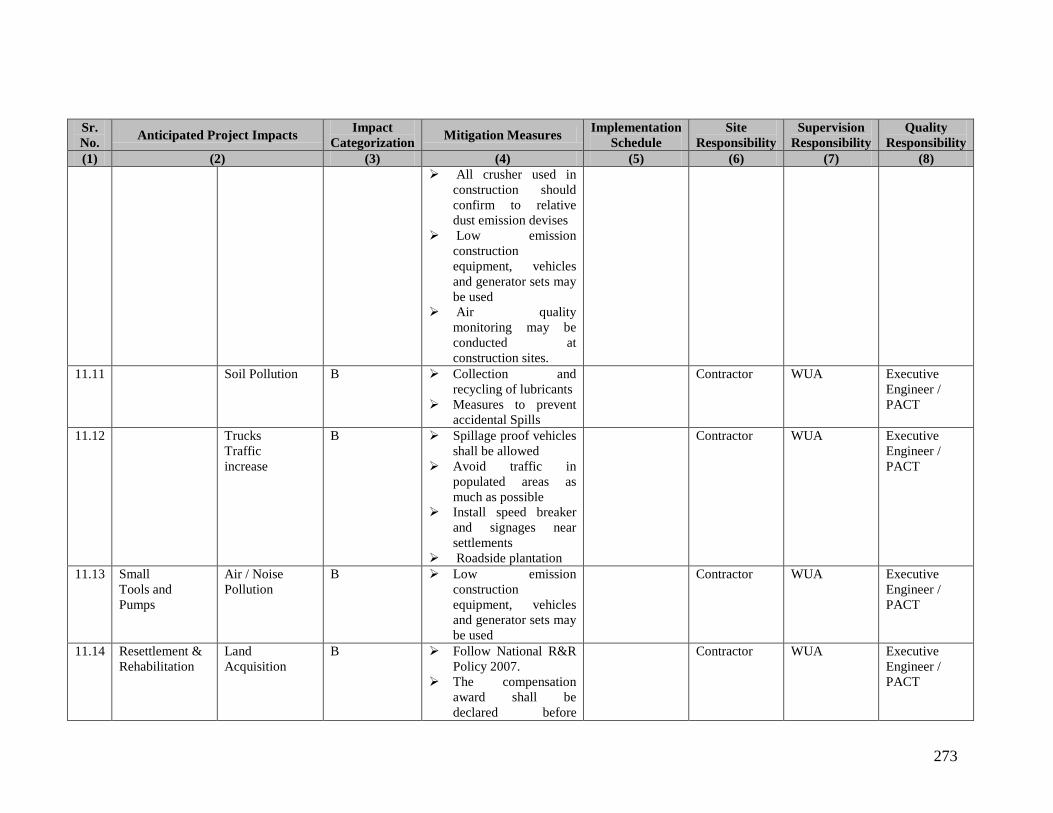
273
Sr. No. Anticipated Project Impacts Impact
Categorization Mitigation Measures Implementation Schedule
Site Responsibility
Supervision Responsibility
Quality Responsibility
(1) (2) (3) (4) (5) (6) (7) (8) All crusher used in
construction should confirm to relative dust emission devises
Low emission construction equipment, vehicles and generator sets may be used
Air quality monitoring may be conducted at construction sites.
11.11 Soil Pollution B Collection and recycling of lubricants
Measures to prevent accidental Spills
Contractor WUA Executive Engineer / PACT
11.12 Trucks Traffic increase
B Spillage proof vehicles shall be allowed
Avoid traffic in populated areas as much as possible
Install speed breaker and signages near settlements
Roadside plantation
Contractor WUA Executive Engineer / PACT
11.13 Small Tools and Pumps
Air / Noise Pollution
B Low emission construction equipment, vehicles and generator sets may be used
Contractor WUA Executive Engineer / PACT
11.14 Resettlement & Rehabilitation
Land Acquisition
B Follow National R&R Policy 2007.
The compensation award shall be declared before
Contractor WUA Executive Engineer / PACT

274
Sr. No. Anticipated Project Impacts Impact
Categorization Mitigation Measures Implementation Schedule
Site Responsibility
Supervision Responsibility
Quality Responsibility
(1) (2) (3) (4) (5) (6) (7) (8) displacement of the affected families. Full payment of compensation as well as adequate progress in resettlement shall be ensured.
The compensation award shall take into account the market value of the property being acquired, including the location wise minimum price per unit area fixed (or to be fixed) by the respective State Government.
Conversion to the intended category of use of the land being acquired (for example, from agricultural to non-agricultural) shall be taken into account in advance of the acquisition, and the compensation award shall be determined as per the intended land use category.
The rehabilitation and resettlement benefits shall be extended to all the affected families.
Any affected family owning house and

275
Sr. No. Anticipated Project Impacts Impact
Categorization Mitigation Measures Implementation Schedule
Site Responsibility
Supervision Responsibility
Quality Responsibility
(1) (2) (3) (4) (5) (6) (7) (8) whose house has been acquired or lost, may be allotted free of cost house site
The land or house allotted to the affected families may be in the joint names of wife and husband of the affected family.
Each affected below poverty line family which is without homestead land and has been residing in the affected area and which has been involuntarily displaced from such area, shall be entitled to a house.
In case of involuntary displacement infrastructural facilities and amenities shall be provided in the resettlement area
Facilities and amenities shall, inter alia, include roads, public transport, drainage, sanitation, safe drinking water, drinking water for cattle, community, ponds, grazing land, land for fodder, plantation (social

276
Sr. No. Anticipated Project Impacts Impact
Categorization Mitigation Measures Implementation Schedule
Site Responsibility
Supervision Responsibility
Quality Responsibility
(1) (2) (3) (4) (5) (6) (7) (8) forestry or agroforestry), Fair Price shops, panchayatghars, Cooperative Societies, Post Offices, seedcum- fertilizer storage, irrigation, electricity, health centres, child" and mother supplemental nutritional services, children's playground, community centres, schools, institutional arrangements for training, places of worship, land for traditional tribal institutions, burial/cremation grounds, and security arrangements.
11.15 Impact on local/ tribal communities
B States policy for tribal community has to be followed if livelihood is going to be affected.
Tribal Development Plan shall be prepared, laying down the detailed procedure for settling land rights The Plan shall contain a programme for development of alternate fuel, fodder and nontimber forest
Contractor WUA Executive Engineer / PACT

277
Sr. No. Anticipated Project Impacts Impact
Categorization Mitigation Measures Implementation Schedule
Site Responsibility
Supervision Responsibility
Quality Responsibility
(1) (2) (3) (4) (5) (6) (7) (8) produce (NTFP) resources on non-forest lands
In cases of involuntary displacement of two hundred or more Scheduled Tribes families from the Scheduled Areas, the concerned Tribes Advisory Councils (TACs) may be consulted.
Each affected family that is displaced and has cattle, shall get financial assistance for construction of cattle shed.
Each affected family that is displaced must be provided with a one-time financial assistance of such amount as the appropriate but not less than ten thousand rupees, for shifting of the family, building materials, belongings and cattle.
Each affected person who is a rural artisan, small trader or self-employed person and who has been

278
Sr. No. Anticipated Project Impacts Impact
Categorization Mitigation Measures Implementation Schedule
Site Responsibility
Supervision Responsibility
Quality Responsibility
(1) (2) (3) (4) (5) (6) (7) (8) displaced shall be provided a one-time financial assistance.
Preference to the affected families
at least one person per nuclear family - in providing employment in the project
The affected persons shall be offered the necessary training facilities for development of entrepreneurship, technical and professional skills for self employment.
Offer scholarships and other skill development opportunities to the eligible persons from the affected families
11.16 Labour Camps Worker/Local people Exposure
B Locate handling sites away from populated areas
Follow proper operation and handling measures to minimize exposure
Provide prior warning /signals for blasting
Provide sirens in vehicles to avoid any collision with human/animals
Contractor WUA Executive Engineer / PACT

279
Sr. No. Anticipated Project Impacts Impact
Categorization Mitigation Measures Implementation Schedule
Site Responsibility
Supervision Responsibility
Quality Responsibility
(1) (2) (3) (4) (5) (6) (7) (8) Organise awareness
programs on environmental resource management
Organise Health camps
Child labour must be strictly prohibited
Provide signages near construction sites and approach roads
11.17 Impact on Human health, especially workers working at construction sites (Labour Camps)
B Routine medical check up of Field staff and labours
Provision of potable drinking water at site
Provision of proper sewage and waste disposal system. Sanitation facilities have to be provided at the camp sites.
Awareness program on HIV aids and other communicable disease may be provided to the work force.
First aid facilities to be provided at the construction camps. Any case of disease outbreak may be immediately subjected to medical treatment. Mosquito repellant to be provided to the labors such as odomas,
Contractor WUA Executive Engineer / PACT

280
Sr. No. Anticipated Project Impacts Impact
Categorization Mitigation Measures Implementation Schedule
Site Responsibility
Supervision Responsibility
Quality Responsibility
(1) (2) (3) (4) (5) (6) (7) (8) coil and sprays. The camps may maintain cleanliness and hygienic condition.
Proper ventilation may be provided in labour camps
Sufficient fuel may be provided to the work force at campsite. Alternate arrangement for fuel such as provision of LPG, Kerosene etc. to be provided to the camp
Head phones, ear plugs to be provided to the workers at construction site.
All workers employed on mixing of asphaltic material, cement, lime mortars, concrete etc. may be provided with protective footwear and protective goggles. Workers involved in welding work may be provided with welder’s protective eye shields
Adequate precaution must be taken to prevent danger from electrical equipments
11.18 Concrete Mixture
Air / Noise Pollution
B Air pollution control measure like water
Contractor WUA Executive Engineer /
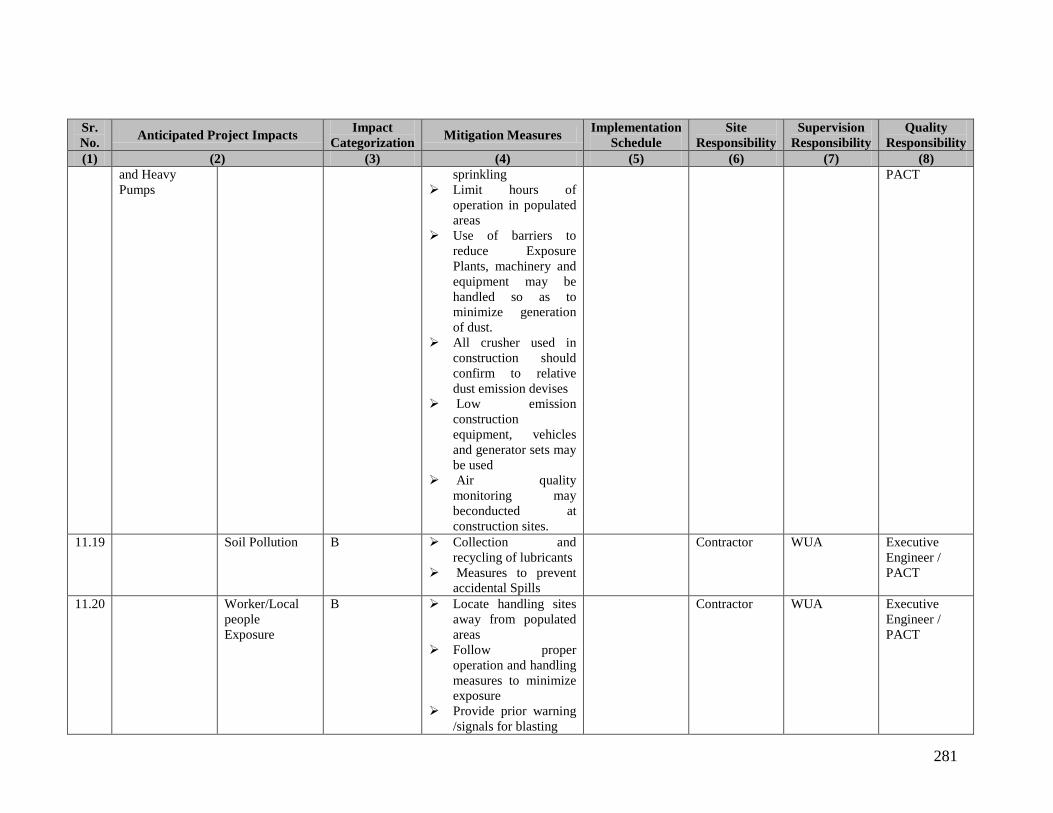
281
Sr. No. Anticipated Project Impacts Impact
Categorization Mitigation Measures Implementation Schedule
Site Responsibility
Supervision Responsibility
Quality Responsibility
(1) (2) (3) (4) (5) (6) (7) (8) and Heavy Pumps
sprinkling Limit hours of
operation in populated areas
Use of barriers to reduce Exposure Plants, machinery and equipment may be handled so as to minimize generation of dust.
All crusher used in construction should confirm to relative dust emission devises
Low emission construction equipment, vehicles and generator sets may be used
Air quality monitoring may beconducted at construction sites.
PACT
11.19 Soil Pollution B Collection and recycling of lubricants
Measures to prevent accidental Spills
Contractor WUA Executive Engineer / PACT
11.20 Worker/Local people Exposure
B Locate handling sites away from populated areas
Follow proper operation and handling measures to minimize exposure
Provide prior warning /signals for blasting
Contractor WUA Executive Engineer / PACT

282
Sr. No. Anticipated Project Impacts Impact
Categorization Mitigation Measures Implementation Schedule
Site Responsibility
Supervision Responsibility
Quality Responsibility
(1) (2) (3) (4) (5) (6) (7) (8) Provide sirens in
vehicles to avoid any collision with human/animals
Organise awareness programs on environmental resource management
Organise Health camp Child labour must be
strictly prohibited Provide signages near
construction sites and approach roads
11.21 Temporary Land Acquisition
Air / Noise Pollution
B Air pollution control measure like water sprinkling
Limit hours of operation in populated areas
Use of barriers to reduce exposure
Plants, machinery and equipment may be handled so as to minimize generation of dust.
All crusher used in construction should confirm to relative dust emission devises
Low emission construction equipment, vehicles and generator sets may be used
Air quality monitoring
Contractor WUA Executive Engineer / PACT
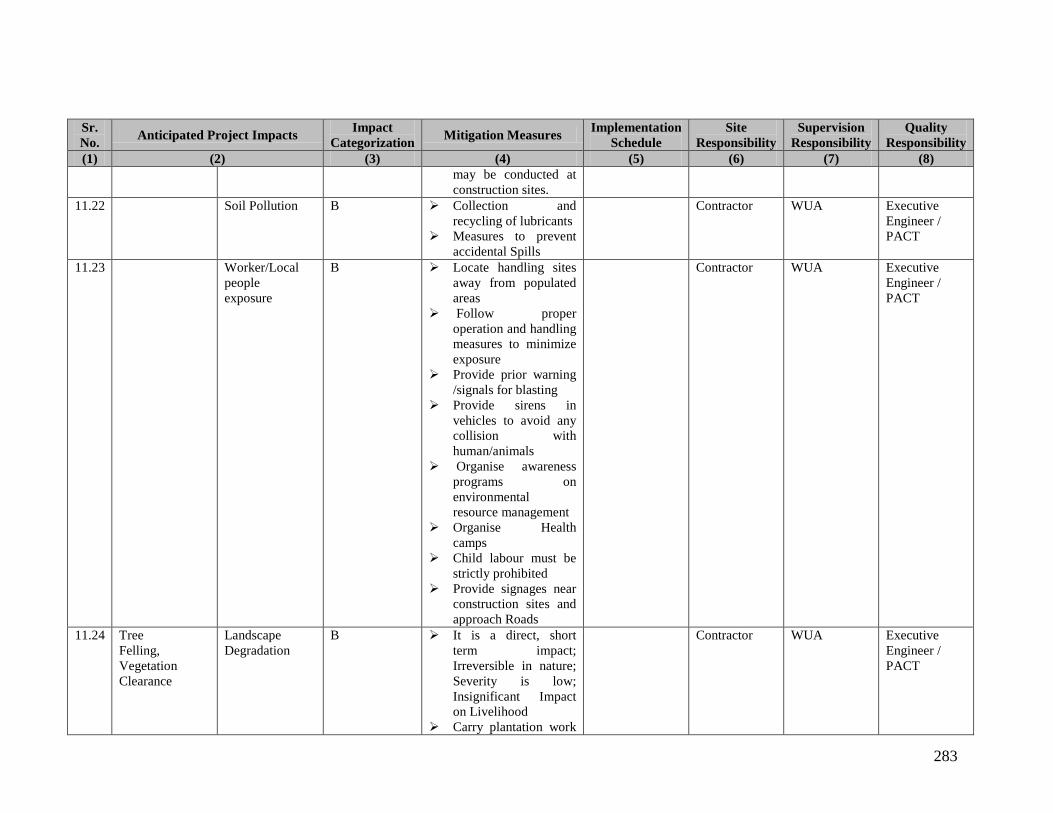
283
Sr. No. Anticipated Project Impacts Impact
Categorization Mitigation Measures Implementation Schedule
Site Responsibility
Supervision Responsibility
Quality Responsibility
(1) (2) (3) (4) (5) (6) (7) (8) may be conducted at construction sites.
11.22 Soil Pollution B Collection and recycling of lubricants
Measures to prevent accidental Spills
Contractor WUA Executive Engineer / PACT
11.23 Worker/Local people exposure
B Locate handling sites away from populated areas
Follow proper operation and handling measures to minimize exposure
Provide prior warning /signals for blasting
Provide sirens in vehicles to avoid any collision with human/animals
Organise awareness programs on environmental resource management
Organise Health camps
Child labour must be strictly prohibited
Provide signages near construction sites and approach Roads
Contractor WUA Executive Engineer / PACT
11.24 Tree Felling, Vegetation Clearance
Landscape Degradation
B It is a direct, short term impact; Irreversible in nature; Severity is low; Insignificant Impact on Livelihood
Carry plantation work
Contractor WUA Executive Engineer / PACT
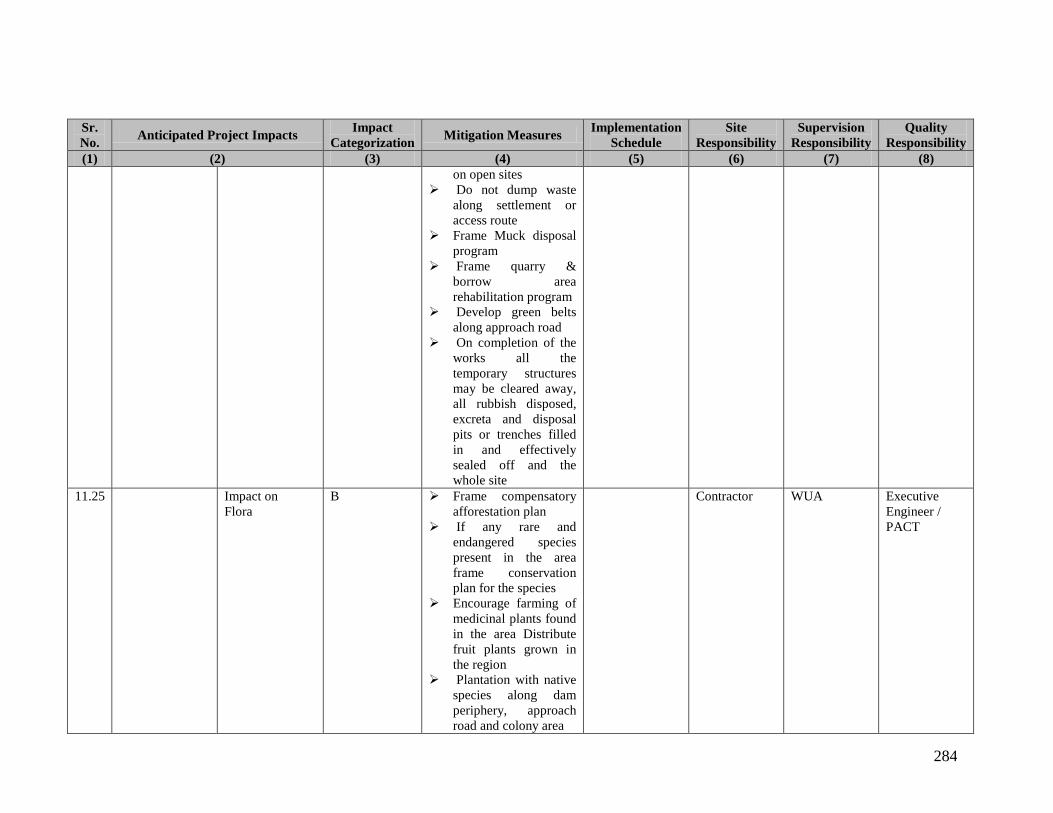
284
Sr. No. Anticipated Project Impacts Impact
Categorization Mitigation Measures Implementation Schedule
Site Responsibility
Supervision Responsibility
Quality Responsibility
(1) (2) (3) (4) (5) (6) (7) (8) on open sites
Do not dump waste along settlement or access route
Frame Muck disposal program
Frame quarry & borrow area rehabilitation program
Develop green belts along approach road
On completion of the works all the temporary structures may be cleared away, all rubbish disposed, excreta and disposal pits or trenches filled in and effectively sealed off and the whole site
11.25 Impact on Flora
B Frame compensatory afforestation plan
If any rare and endangered species present in the area frame conservation plan for the species
Encourage farming of medicinal plants found in the area Distribute fruit plants grown in the region
Plantation with native species along dam periphery, approach road and colony area
Contractor WUA Executive Engineer / PACT
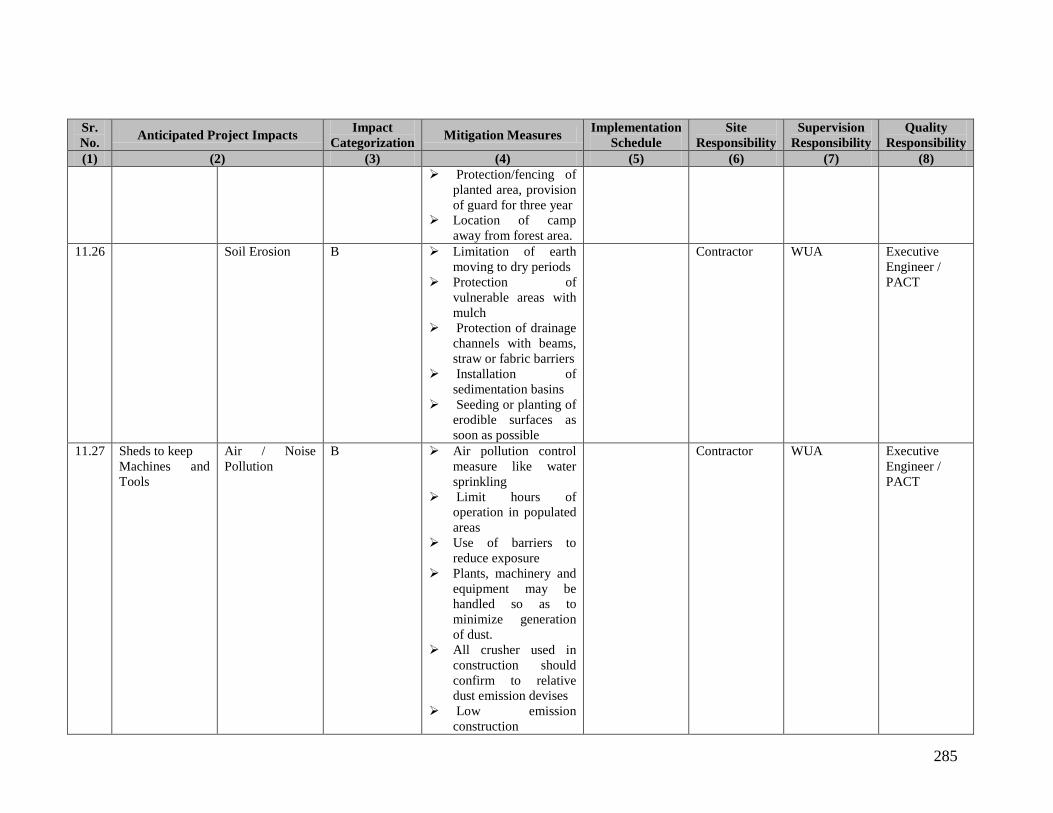
285
Sr. No. Anticipated Project Impacts Impact
Categorization Mitigation Measures Implementation Schedule
Site Responsibility
Supervision Responsibility
Quality Responsibility
(1) (2) (3) (4) (5) (6) (7) (8) Protection/fencing of
planted area, provision of guard for three year
Location of camp away from forest area.
11.26 Soil Erosion B Limitation of earth moving to dry periods
Protection of vulnerable areas with mulch
Protection of drainage channels with beams, straw or fabric barriers
Installation of sedimentation basins
Seeding or planting of erodible surfaces as soon as possible
Contractor WUA Executive Engineer / PACT
11.27 Sheds to keep Machines and Tools
Air / Noise Pollution
B Air pollution control measure like water sprinkling
Limit hours of operation in populated areas
Use of barriers to reduce exposure
Plants, machinery and equipment may be handled so as to minimize generation of dust.
All crusher used in construction should confirm to relative dust emission devises
Low emission construction
Contractor WUA Executive Engineer / PACT
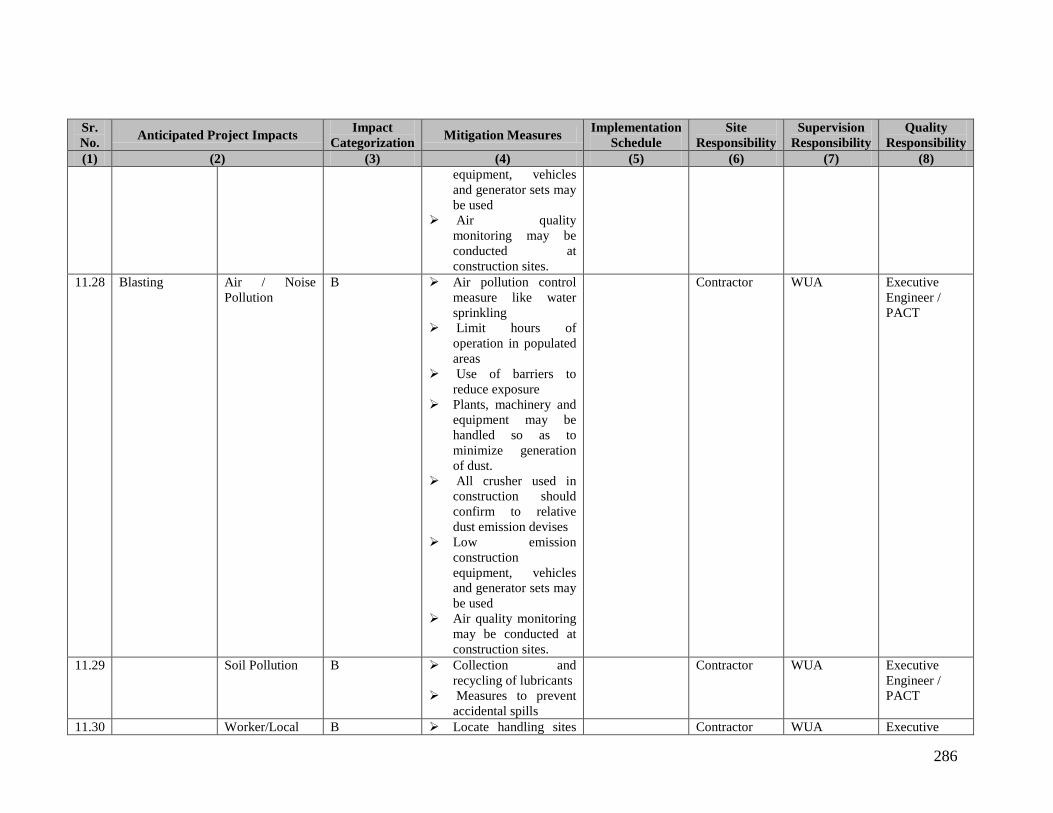
286
Sr. No. Anticipated Project Impacts Impact
Categorization Mitigation Measures Implementation Schedule
Site Responsibility
Supervision Responsibility
Quality Responsibility
(1) (2) (3) (4) (5) (6) (7) (8) equipment, vehicles and generator sets may be used
Air quality monitoring may be conducted at construction sites.
11.28 Blasting Air / Noise Pollution
B Air pollution control measure like water sprinkling
Limit hours of operation in populated areas
Use of barriers to reduce exposure
Plants, machinery and equipment may be handled so as to minimize generation of dust.
All crusher used in construction should confirm to relative dust emission devises
Low emission construction equipment, vehicles and generator sets may be used
Air quality monitoring may be conducted at construction sites.
Contractor WUA Executive Engineer / PACT
11.29 Soil Pollution B Collection and recycling of lubricants
Measures to prevent accidental spills
Contractor WUA Executive Engineer / PACT
11.30 Worker/Local B Locate handling sites Contractor WUA Executive

287
Sr. No. Anticipated Project Impacts Impact
Categorization Mitigation Measures Implementation Schedule
Site Responsibility
Supervision Responsibility
Quality Responsibility
(1) (2) (3) (4) (5) (6) (7) (8) people exposure
away from populated areas
Follow proper operation and handling measures to minimize exposure
Provide prior warning /signals for blasting
Provide sirens in vehicles to avoid any collision with human/animals
Organise awareness programs on environmental resource management
Organise Health camps
Child labour must be strictly prohibited
Provide signages near construction sites and approach roads
Engineer / PACT
11.31 Landscape Degradation
B It is a direct, short term impact; Irreversible in nature; Severity is low; Insignificant Impact on Livelihood
Carry plantation work on open sites
Do not dump waste along settlement or access route
Frame Muck disposal program
Frame quarry &
Contractor WUA Executive Engineer / PACT
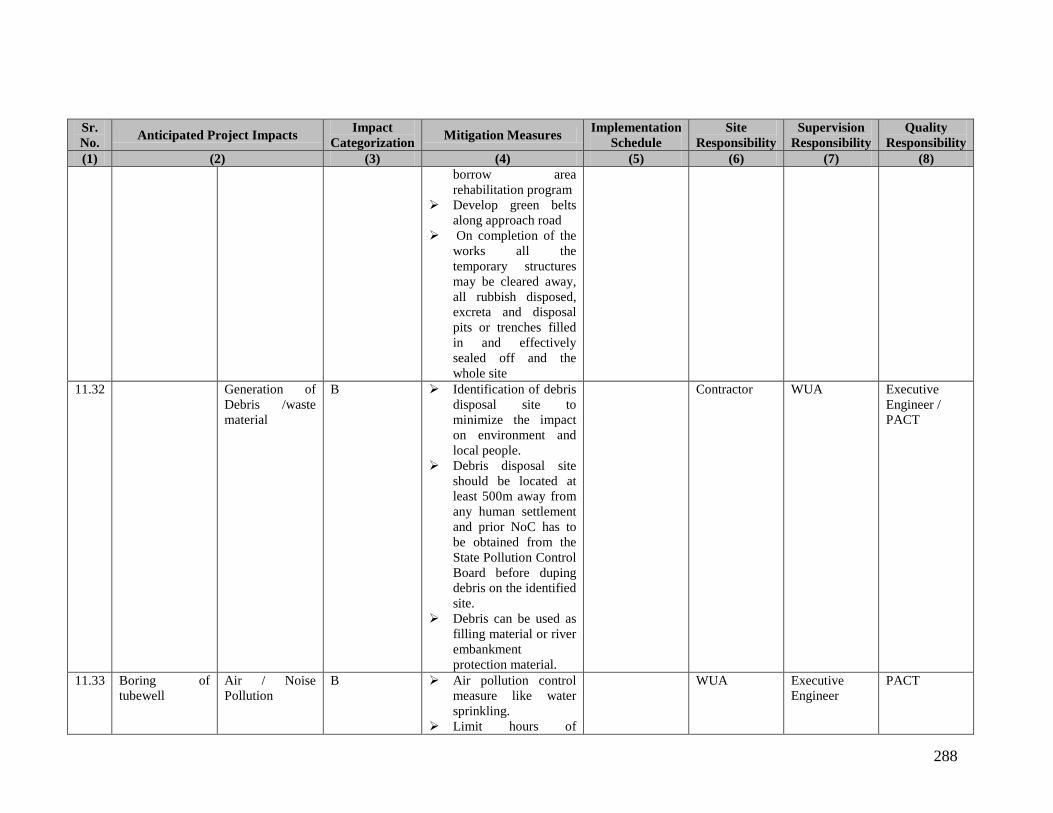
288
Sr. No. Anticipated Project Impacts Impact
Categorization Mitigation Measures Implementation Schedule
Site Responsibility
Supervision Responsibility
Quality Responsibility
(1) (2) (3) (4) (5) (6) (7) (8) borrow area rehabilitation program
Develop green belts along approach road
On completion of the works all the temporary structures may be cleared away, all rubbish disposed, excreta and disposal pits or trenches filled in and effectively sealed off and the whole site
11.32 Generation of Debris /waste material
B Identification of debris disposal site to minimize the impact on environment and local people.
Debris disposal site should be located at least 500m away from any human settlement and prior NoC has to be obtained from the State Pollution Control Board before duping debris on the identified site.
Debris can be used as filling material or river embankment protection material.
Contractor WUA Executive Engineer / PACT
11.33 Boring of tubewell
Air / Noise Pollution
B Air pollution control measure like water sprinkling.
Limit hours of
WUA Executive Engineer
PACT

289
Sr. No. Anticipated Project Impacts Impact
Categorization Mitigation Measures Implementation Schedule
Site Responsibility
Supervision Responsibility
Quality Responsibility
(1) (2) (3) (4) (5) (6) (7) (8) operation in populated areas.
Use of barriers to reduce exposure.
Plants, machinery and equipment may be handled so as to minimize generation dust emission devises.
Low emission construction equipment and pollution free certified vehicles may be used.
11.34 Water Pollution B Dump solid waste in specified place to minimize contamination of water.
WUA Executive Engineer
PACT
11.35 Soil Pollution B Prevent accidental spill of oil.
WUA Executive Engineer
PACT
11.36 Worker / local people Exposure
B Provide safety measures (mask, gloves, hat etc.) to minimize exposure.
WUA Executive Engineer
PACT
11.37 Disposal of excavated material
B Disposal Area shall be pre-identified with due consent of local community prior to initiate work.
Dumping of silt / vegetation only in designated place to minimize impact on environment.
WUA Executive Engineer
PACT
11.38 Agriculture Water losses B Field Bunding, WUA Executive PACT
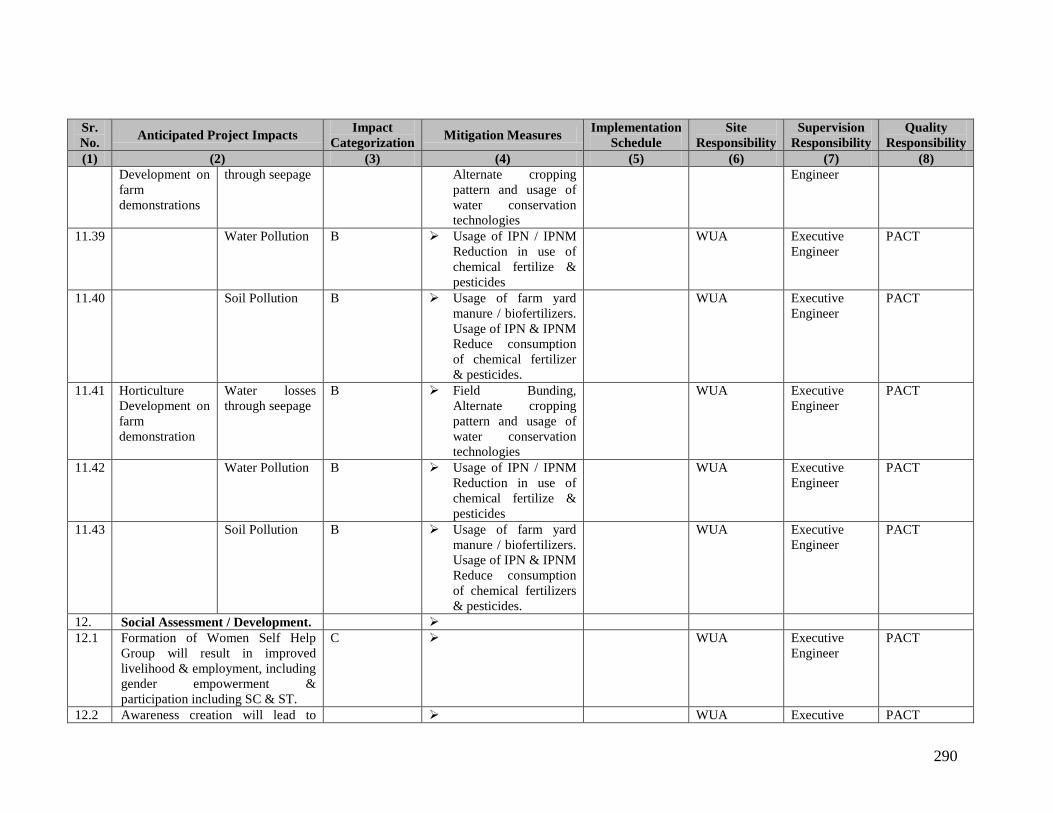
290
Sr. No. Anticipated Project Impacts Impact
Categorization Mitigation Measures Implementation Schedule
Site Responsibility
Supervision Responsibility
Quality Responsibility
(1) (2) (3) (4) (5) (6) (7) (8) Development on farm demonstrations
through seepage Alternate cropping pattern and usage of water conservation technologies
Engineer
11.39 Water Pollution B Usage of IPN / IPNM Reduction in use of chemical fertilize & pesticides
WUA Executive Engineer
PACT
11.40 Soil Pollution B Usage of farm yard manure / biofertilizers. Usage of IPN & IPNM Reduce consumption of chemical fertilizer & pesticides.
WUA Executive Engineer
PACT
11.41 Horticulture Development on farm demonstration
Water losses through seepage
B Field Bunding, Alternate cropping pattern and usage of water conservation technologies
WUA Executive Engineer
PACT
11.42 Water Pollution B Usage of IPN / IPNM Reduction in use of chemical fertilize & pesticides
WUA Executive Engineer
PACT
11.43 Soil Pollution B Usage of farm yard manure / biofertilizers. Usage of IPN & IPNM Reduce consumption of chemical fertilizers & pesticides.
WUA Executive Engineer
PACT
12. Social Assessment / Development. 12.1 Formation of Women Self Help
Group will result in improved livelihood & employment, including gender empowerment & participation including SC & ST.
C WUA Executive Engineer
PACT
12.2 Awareness creation will lead to WUA Executive PACT

291
Sr. No. Anticipated Project Impacts Impact
Categorization Mitigation Measures Implementation Schedule
Site Responsibility
Supervision Responsibility
Quality Responsibility
(1) (2) (3) (4) (5) (6) (7) (8) conjunctive use of water, greater surface 7 ground water availability, agriculture intensification diversification, improved livelihoods, reduced indebtedness & risks & vulnerability, inclusion, improved community health, greater participation.
Engineer
12.3 Organization of workshops, training & capacity building will result in greater empowerment, inclusion, transparency & employment.
WUA Executive Engineer
PACT
12.4 Promotion of saving & credit activity, will lead to improved livelihood, reduced indebtedness & vulnerability of economically weaker section (SC & ST) participation.
WUA Executive Engineer
PACT
12.5 Grading of SHG will result in greater empowerment, participation & transparency.
WUA Executive Engineer
PACT
12.6 Monitoring & evaluation will result in greater transparency & participation.
WUA Executive Engineer
PACT

292
5.3 Screening
Analysis of Table 5.2 indicates that construction activity lead to negative impacts, which may be of short term & long term durations. Construction phase interventions, such as improvement of access roads, labor camps, silt disposal, and other ancillary temporary infrastructure may produce impacts on the communities in proximity. The SEMF does provide for addressing construction phase interventions, including how to deal with labor camps. The template discussed below will describe any major issues related to construction phase interventions that are identified at the investigation and pre-design phase. For example, in the instance there will be reservoir de-silting, the design will have to determine the amount of silt and will have to prepare a specific plan where the silt will be deposited. The SEMF suffices to identify this as an environmental issue to be addressed during design and construction.
There are readily available, well-developed environmental specifications and it will be ensured that such specifications will indeed be included in the technical specifications of each tender document. The contractor will have to factor costs related to the implementation of environmental mitigation aspects in his bid. Site engineers will be instructed to supervise the compliance with the technical specifications, including the environmental clauses. As part of the third-party construction supervision and quality control, the Consultant will ensure compliance as well. In order to assess alternatives scenarios and to identify the preferred alternative an analysis of the proposed sub-project activities was carried out with regard to their environmental and social implications. The analysis was carried out for three scenarios, namely, no-project scenario, no-component scenario and with component scenario. The findings of the analysis are given in the following Table 5.3.
Table 5.3: Analysis of Alternatives
S. No. Sub-Project Activities No-Project
Scenario No-Component
Scenario With Component
Scenario 1. De-silting of canal/drains Existing Degaraded
system will be as such with social problems. No Basin approach No PIM No new technologies use No Water Management No Safty aspects No knowledgebase No sustainable resource management
Local, short term environmental problems like air and noise pollution will reduce but dam safety aspects will suffer.
Better water delivery system Air, water and noise pollution due to Silt disposal cutting of canal bank, dredging etc. have negligible imact by following mitigation measures.
2. Rehabilitation and modernization design/redesign process
Though local, short term environmental problem will be avoided;
Water delivery System will improve. No Land acquisition. Public consent in work with more transparency. Mitigation and enhancement measures will reduce / avoid adverse impacts.
3. Lining of main and branch canal
Local, short term environmental problems like air, water and noise pollution will reduce but environmental and social risks envisaged if not implemented.
Short term impacts during construction which could be minimize with suitable mitigation measures
4. Repairs of existing Local, short term water Surface water pollution
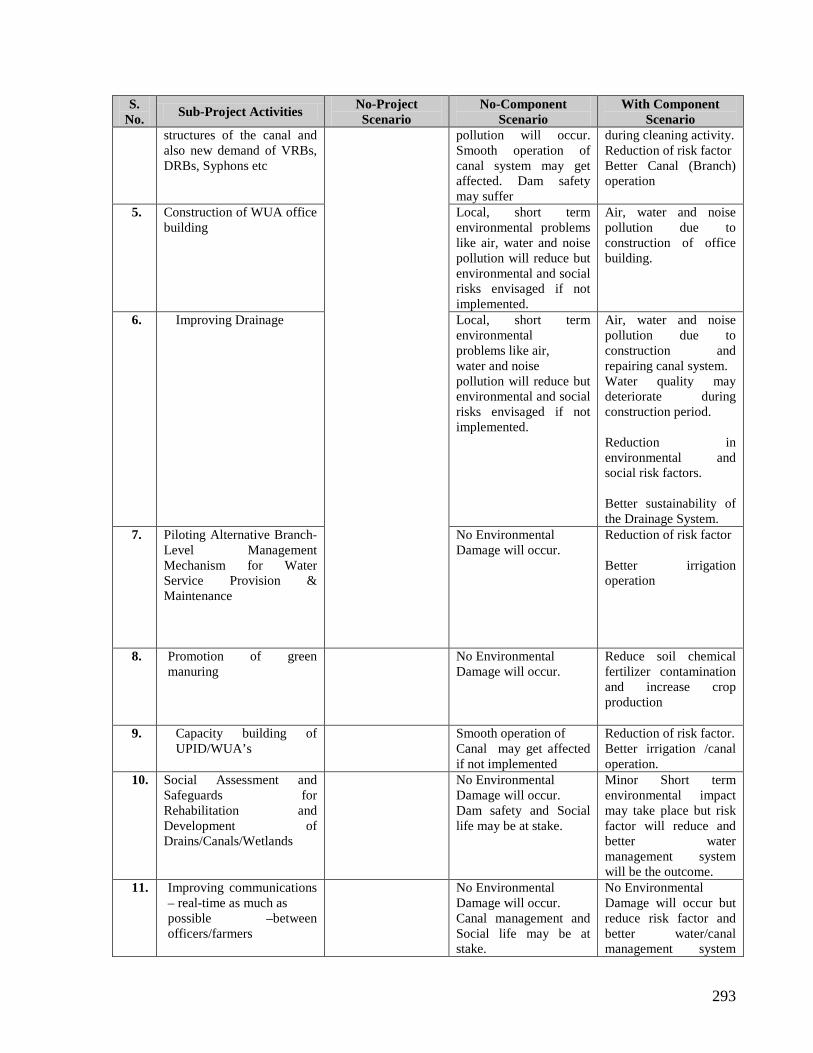
293
S. No. Sub-Project Activities No-Project
Scenario No-Component
Scenario With Component
Scenario structures of the canal and also new demand of VRBs, DRBs, Syphons etc
pollution will occur. Smooth operation of canal system may get affected. Dam safety may suffer
during cleaning activity. Reduction of risk factor Better Canal (Branch) operation
5. Construction of WUA office building
Local, short term environmental problems like air, water and noise pollution will reduce but environmental and social risks envisaged if not implemented.
Air, water and noise pollution due to construction of office building.
6. Improving Drainage
Local, short term environmental problems like air, water and noise pollution will reduce but environmental and social risks envisaged if not implemented.
Air, water and noise pollution due to construction and repairing canal system. Water quality may deteriorate during construction period. Reduction in environmental and social risk factors. Better sustainability of the Drainage System.
7. Piloting Alternative Branch-Level Management Mechanism for Water Service Provision & Maintenance
No Environmental Damage will occur.
Reduction of risk factor Better irrigation operation
8. Promotion of green manuring
No Environmental Damage will occur.
Reduce soil chemical fertilizer contamination and increase crop production
9. Capacity building of UPID/WUA’s
Smooth operation of Canal may get affected if not implemented
Reduction of risk factor. Better irrigation /canal operation.
10. Social Assessment and Safeguards for Rehabilitation and Development of Drains/Canals/Wetlands
No Environmental Damage will occur. Dam safety and Social life may be at stake.
Minor Short term environmental impact may take place but risk factor will reduce and better water management system will be the outcome.
11. Improving communications – real-time as much as possible –between officers/farmers
No Environmental Damage will occur. Canal management and Social life may be at stake.
No Environmental Damage will occur but reduce risk factor and better water/canal management system

294
S. No. Sub-Project Activities No-Project
Scenario No-Component
Scenario With Component
Scenario will be the outcome.
12. Farmers Field School
No Environmental
Damage will occur. Canal water management and Social life may be at stake.
Insignificant/Nil impact on environment. Safer dam operation can be achieved; better water management practices, awareness and crop production will be the outcome.
13. Agriculture Water Use and Productivity Efficiency Improvement Program
No Environmental Damage will occur. Canal water management and Social life may be at stake.
Insignificant/Nil impact on environment. Safer irrigation operation can be achieved; better water management practices, awareness and crop production will be the outcome
14. Outreach and participation of WSHGs in rehabilitation and water management activities
No Environmental Damage will occur. Canal water management and Social life may be at stake.
Insignificant/Nil impact on environment. Safer irrigation operation can be achieved; better water management practices, awareness and crop production will be the outcome
15. Promotion of Women SHGs for raising the income of family
No Environmental Damage will occur. Canal water management and Social life may be at stake.
Insignificant/Nil impact on environment. Safer dam operation can be achieved; better water management practices, awareness, crop production and strengthened farmers income will be the outcome
16. Strengthening of PIM cells
No Environmental Damage will occur. Canal water management system will be the outcome
Insignificant/Nil impact on environment. Safer dam/canal operation can be achieved; better water management practices, awareness, crop production and strengthened farmers income will be the outcome
Based on the analysis, with-component scenario is suggested as the preferred alternative.
Application of Environmental and Social Management Framework

295
The SEMF can be used by the project authorities for incorporation of environmental and social safeguards in the planning, execution and operation stages of each sub-project activity. A step-by-step methodology has been provided that can be followed along with engineering and institutional interventions required for the project activities.
A template will be used that will require the concerned State/Circle level PMUs during the investigation and preliminary design stage to provide detailed information on technical, environmental, social, and all implementation-related aspects of each activity. Details about the data to be collected and the specific forms to be prepared are given in the next sections. The State/Circle level PMU will for each sub-project incorporate in the template the essential elements from the environmental and social screening templates prepared as part of the SEMF. Based on the review of the templates, a final categorization of each of the sub-project activity will be made. Those that have no major environmental or social issues can have the designs finalized and be tendered. Only the few where there may be major environmental or social issues will require the preparation of a site specific EA/EMP. This template will allow an early identification of those activities where major issues can be expected.
It may be mentioned here that though the sub-project activities for the development of this SEMF have been identified based on the analysis of such activities proposed to be taken up under the SEA, this is a live document which can be improved upon at the sub-project level by the concerned authorities, as and when the need arises.
There are 21 sub-project level activities which have been identified for the development of the SEMF. These have been given in Form SC-1 for the purpose of identifying components the activities relevant to a specific sub-project and screening out the other activities. The responsible entity at the diversion level will carry out this task.
For the development of the SEMF, it is necessary to identify the potential environmental / social impacts of an activity. In order to do so, the tasks and facilities required to be performed and provided to implement the activity are needed to be identified, as these will help assess the potential impacts due to the activity. A list of all possible impactss have been prepared, which include requirements of labor, machinery, materials, space, etc. For each activity, the components involved can be identified by diversion level officials. The list of these impacts for screening purpose is given in (Column 2 & column 3) Form SC-1. Based on potential environmental and social impacts associated with each component, these have been categorized as A, B and C.
Form SC-1 has been further developed to identify mitigation measures for each type of potential environmental and social impacts. For ease of understanding and use, the activities identified are given in the first column and corresponding mitigation measures are provided in the second column. The fifth column indicate the entities responsible for execution, supervision and monitoring of the mitigation measures, respectively. Schematic diagram for execution of SEMF is given below in figure 5.1.

296
Figure 5.1: SEMF Execution Mechanism
Screening of Activity (Form SC-
1)
Process Outcomes Executing Responsibilities
Supervising Responsibilities
Monitoring Responsibilities
Screening Categorization of
Components (SC-1)
Impacts Identification (SC-1)
Categorization of Components (SC-1)
Identification of Mitigation
Measures (SC-5)
Documentation of Procedures
(Implementation Plan)
Implementation of Mitigation Measures
Implementation of Plan
Periodical Monitoring of Environmental and Social Indicators
Completion of sub project activities in conformity with SEMF
External Agency appointed by UPID/PACT
Dam site in-charge
UPID/PACT/ SPCB/ State Forest Dept /Agriculture and other allied sector
• Implementation of social and EMP
• Monitoring and compilation of data on social and environmental parameters
• Enhanced relationship among the ID, the other stakeholders resulting in active participation in
• Identification of activities, components, adverse environmental and social impacts
• Categorization of components
• Enhanced awareness among the ID, stakeholders
• Formulation of sub-project work plan that is finalized through stakeholder consultation and integrates social and environmental management plans
Contractor
Junior Engineer/ Asst. Engineer
Dam site in-charge
Executive Engineer
UPID/PACT/ SPCB/ State Forest Dept /Agriculture and other allied sector
SEMF Execution Plan
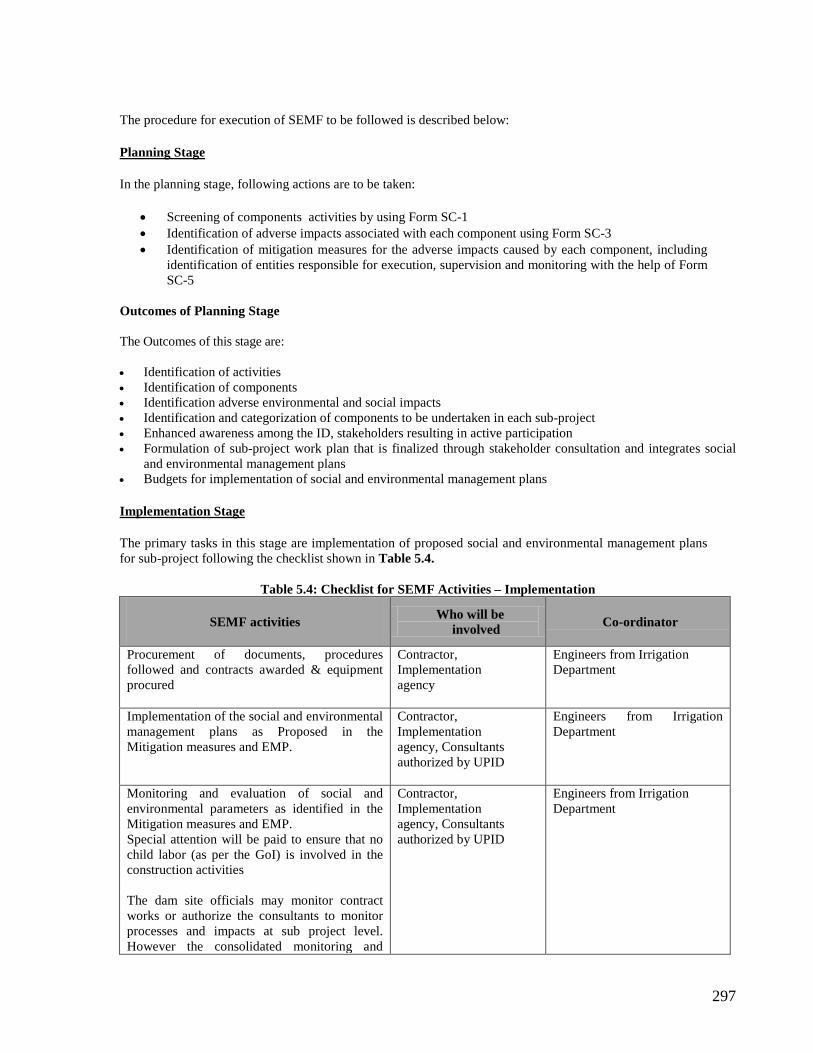
297
The procedure for execution of SEMF to be followed is described below:
Planning Stage
In the planning stage, following actions are to be taken:
• Screening of components activities by using Form SC-1 • Identification of adverse impacts associated with each component using Form SC-3 • Identification of mitigation measures for the adverse impacts caused by each component, including
identification of entities responsible for execution, supervision and monitoring with the help of Form SC-5
Outcomes of Planning Stage The Outcomes of this stage are: • Identification of activities • Identification of components • Identification adverse environmental and social impacts • Identification and categorization of components to be undertaken in each sub-project • Enhanced awareness among the ID, stakeholders resulting in active participation • Formulation of sub-project work plan that is finalized through stakeholder consultation and integrates social
and environmental management plans • Budgets for implementation of social and environmental management plans
Implementation Stage
The primary tasks in this stage are implementation of proposed social and environmental management plans for sub-project following the checklist shown in Table 5.4.
Table 5.4: Checklist for SEMF Activities – Implementation
SEMF activities Who will be involved Co-ordinator
Procurement of documents, procedures followed and contracts awarded & equipment procured
Contractor, Implementation agency
Engineers from Irrigation Department
Implementation of the social and environmental management plans as Proposed in the Mitigation measures and EMP.
Contractor, Implementation agency, Consultants authorized by UPID
Engineers from Irrigation Department
Monitoring and evaluation of social and environmental parameters as identified in the Mitigation measures and EMP. Special attention will be paid to ensure that no child labor (as per the GoI) is involved in the construction activities The dam site officials may monitor contract works or authorize the consultants to monitor processes and impacts at sub project level. However the consolidated monitoring and
Contractor, Implementation agency, Consultants authorized by UPID
Engineers from Irrigation Department

298
SEMF activities Who will be involved Co-ordinator
learning (M & L) report will be furnished by EE, In charge of Project to designated project authority i.e. CE, In-charge, and finally to Division
Outcomes of Implementation Stage
The outcomes of this stage are:
• Implementation of social and environmental management plans • Monitoring and compilation of data on social and environmental parameters • Enhanced relationship among the ID, the other stakeholders resulting in active participation in project
implementation. Post-Implementation Stage
The primary tasks in this stage are to monitor and assess the long-term impacts of the project (through Impact Indicators) and draw lessons from the success and failures, for improvement of subsequent sub-project interventions. Compliance of SEMF provisions has to be ensured through third party monitoring for verification of the sub-project completion report. The Formats for monitoring the above parameters would be developed by PACT. Validation should be carried out before finalizing.
Outcome of Post Implementation Stage
Completion of sub project activities in conformity with SEMF.
The SEMF is a live document which has been developed considering all common major activities associated with sample sub-projects. It can be improved, upgraded or modified at sub-project level as per the site specific requirement and their mitigation measures.
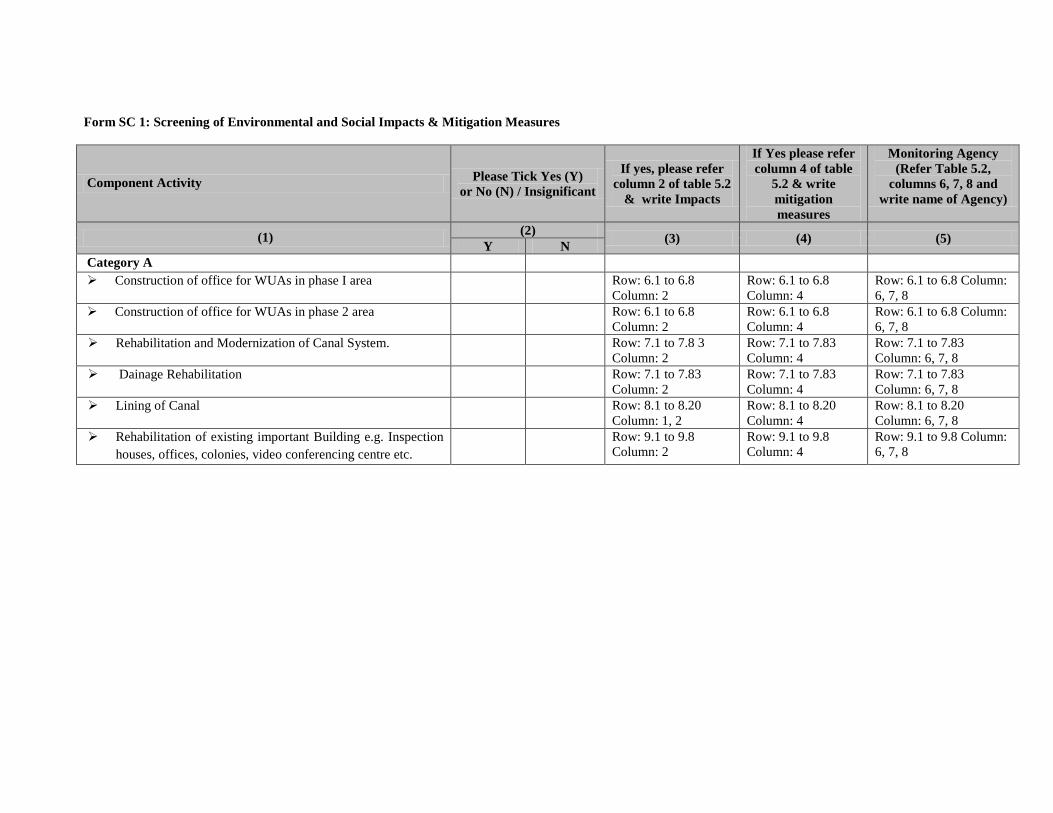
Form SC 1: Screening of Environmental and Social Impacts & Mitigation Measures
Component Activity Please Tick Yes (Y) or No (N) / Insignificant
If yes, please refer column 2 of table 5.2
& write Impacts
If Yes please refer column 4 of table
5.2 & write mitigation measures
Monitoring Agency (Refer Table 5.2,
columns 6, 7, 8 and write name of Agency)
(1) (2) (3) (4) (5) Y N Category A Construction of office for WUAs in phase I area Row: 6.1 to 6.8
Column: 2 Row: 6.1 to 6.8 Column: 4
Row: 6.1 to 6.8 Column: 6, 7, 8
Construction of office for WUAs in phase 2 area Row: 6.1 to 6.8 Column: 2
Row: 6.1 to 6.8 Column: 4
Row: 6.1 to 6.8 Column: 6, 7, 8
Rehabilitation and Modernization of Canal System. Row: 7.1 to 7.8 3 Column: 2
Row: 7.1 to 7.83 Column: 4
Row: 7.1 to 7.83 Column: 6, 7, 8
Dainage Rehabilitation Row: 7.1 to 7.83 Column: 2
Row: 7.1 to 7.83 Column: 4
Row: 7.1 to 7.83 Column: 6, 7, 8
Lining of Canal Row: 8.1 to 8.20 Column: 1, 2
Row: 8.1 to 8.20 Column: 4
Row: 8.1 to 8.20 Column: 6, 7, 8
Rehabilitation of existing important Building e.g. Inspection houses, offices, colonies, video conferencing centre etc.
Row: 9.1 to 9.8 Column: 2
Row: 9.1 to 9.8 Column: 4
Row: 9.1 to 9.8 Column: 6, 7, 8
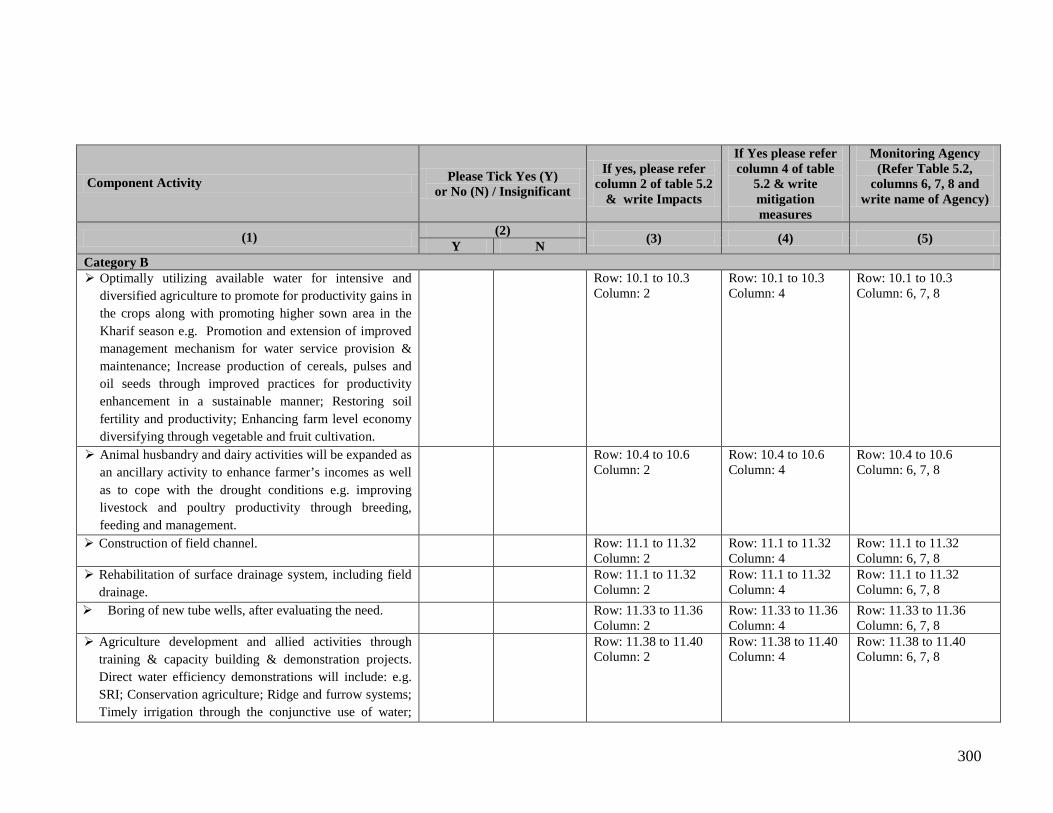
300
Component Activity Please Tick Yes (Y) or No (N) / Insignificant
If yes, please refer column 2 of table 5.2
& write Impacts
If Yes please refer column 4 of table
5.2 & write mitigation measures
Monitoring Agency (Refer Table 5.2,
columns 6, 7, 8 and write name of Agency)
(1) (2) (3) (4) (5) Y N Category B Optimally utilizing available water for intensive and
diversified agriculture to promote for productivity gains in the crops along with promoting higher sown area in the Kharif season e.g. Promotion and extension of improved management mechanism for water service provision & maintenance; Increase production of cereals, pulses and oil seeds through improved practices for productivity enhancement in a sustainable manner; Restoring soil fertility and productivity; Enhancing farm level economy diversifying through vegetable and fruit cultivation.
Row: 10.1 to 10.3 Column: 2
Row: 10.1 to 10.3 Column: 4
Row: 10.1 to 10.3 Column: 6, 7, 8
Animal husbandry and dairy activities will be expanded as an ancillary activity to enhance farmer’s incomes as well as to cope with the drought conditions e.g. improving livestock and poultry productivity through breeding, feeding and management.
Row: 10.4 to 10.6 Column: 2
Row: 10.4 to 10.6 Column: 4
Row: 10.4 to 10.6 Column: 6, 7, 8
Construction of field channel. Row: 11.1 to 11.32 Column: 2
Row: 11.1 to 11.32 Column: 4
Row: 11.1 to 11.32 Column: 6, 7, 8
Rehabilitation of surface drainage system, including field drainage.
Row: 11.1 to 11.32 Column: 2
Row: 11.1 to 11.32 Column: 4
Row: 11.1 to 11.32 Column: 6, 7, 8
Boring of new tube wells, after evaluating the need. Row: 11.33 to 11.36 Column: 2
Row: 11.33 to 11.36 Column: 4
Row: 11.33 to 11.36 Column: 6, 7, 8
Agriculture development and allied activities through training & capacity building & demonstration projects. Direct water efficiency demonstrations will include: e.g. SRI; Conservation agriculture; Ridge and furrow systems; Timely irrigation through the conjunctive use of water;
Row: 11.38 to 11.40 Column: 2
Row: 11.38 to 11.40 Column: 4
Row: 11.38 to 11.40 Column: 6, 7, 8

301
Component Activity Please Tick Yes (Y) or No (N) / Insignificant
If yes, please refer column 2 of table 5.2
& write Impacts
If Yes please refer column 4 of table
5.2 & write mitigation measures
Monitoring Agency (Refer Table 5.2,
columns 6, 7, 8 and write name of Agency)
(1) (2) (3) (4) (5) Y N Category B
Alternative wetting and drying; Micro irrigation & Zero tillage seed drills. Indirect (productivity related) demonstrations e.g. Use of area specific varieties; Use of hybrids; Line transplanting; Use of short duration variety, line sowing; Soil treatment with Trichoderma; Quality seeds and Seed Replacement; Integrated Nutrient Management; Timely Sowings; Timely Transplanting; Proper Plant spacing; Proper Placement of Seed & Fertilizer; Eco- Friendly Pest Management & Soil Testing.
Horticulture Development through training & capacity building & demonstration projects e.g. Area expansion of horticultural crops i.e. fruits, vegetables, flowers, spices & medicinal & aromatic plants through demonstration on farmer's fields; Arrange demonstration and training to the farmers in new techniques of horticultural practices and post harvest technology; Strengthening of District Horticulture office of districts & project implementation unit of horticulture at head office & Study of impact by evaluation of ongoing practices. Horticulture demonstration will include: Quality seeds and Seed Replacement, Quality Planting Material, Balance fertilizer, Timely Showing / Transplanting, Proper Plant spacing, Introduction of new technology, Proper Placement of Seed & Fertilizer, Timely Irrigation through Conjunctive use of water and Eco-Friendly Pest Management.
Row: 11.41 to 11.43 Column: 2
Row: 11.41 to 11.43 Column: 4
Row: 11.41 to 11.43 Column: 4

302
Component Activity Please Tick Yes (Y) or No (N) / Insignificant
If yes, please refer column 2 of table 5.2
& write Impacts
If Yes please refer column 4 of table
5.2 & write mitigation measures
Monitoring Agency (Refer Table 5.2,
columns 6, 7, 8 and write name of Agency)
(1) (2) (3) (4) (5) Y N Category C Hiring of services for formation of WUAs √ Awareness and village motivation campaign on PIM √ Preparation of landholders list and voter list for selected
area √
Election of water users’ associations for selected area √ Election of kulaba and alpika samiti for selected area √ Registration and handling over of management of
irrigation system to the WUAs √
Capacity building of UPID and WUAs; Training of PIM cell at division and circle
√
Exposure trips to successful experiments √ Construction of office for WUAs in phase I area √ Construction of office for WUAs in phase 2 area √ Impact Assessment studies; Strengthening of PIM Cell
PACT (Human Resource) √
Implementation in a participatory mode through active engagement of all the stakeholders at various levels e.g. Ascertain equitable distribution of canal water.
√
Irrigated agriculture technology with conjunctive use of water e.g. Improved irrigation water application systems like drip/sprinkler systems in conjunction with canal water.
√
Marketing infrastructure and agricultural risk management will be important areas of focus.
√
Capacity Building of the farmers, facilitating personnel’s and other stakeholders.
√
Concurrent Training and Awareness Campaigns for the √
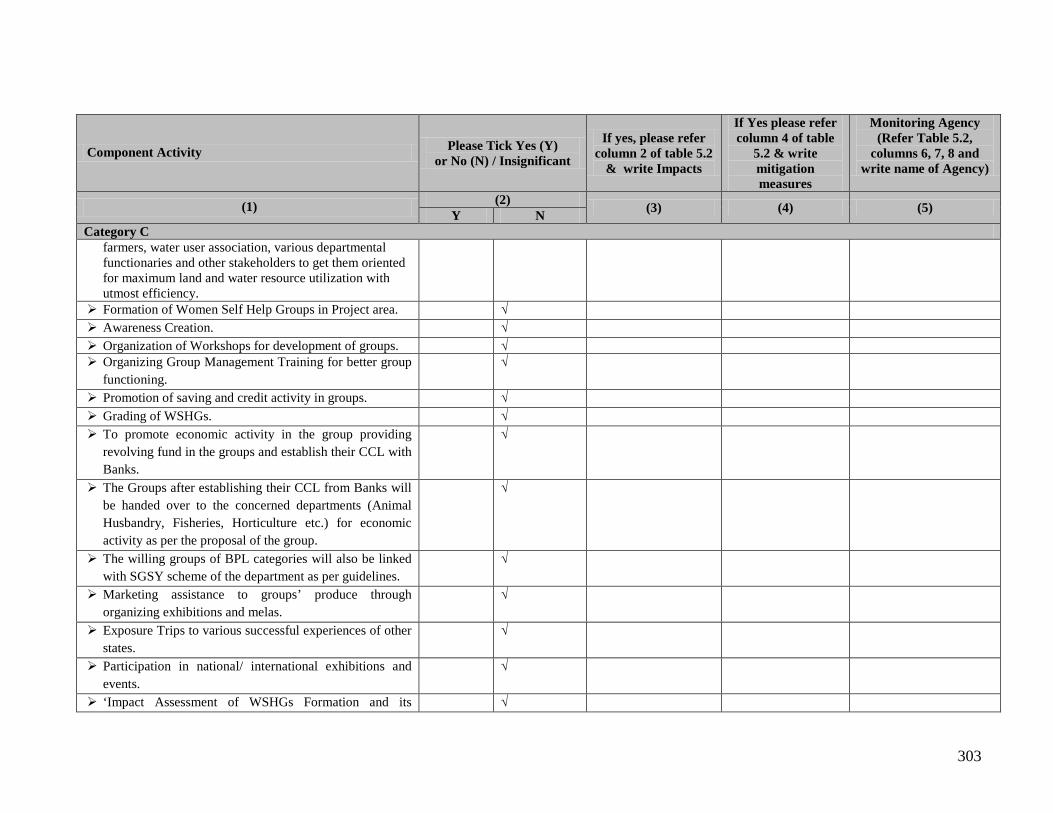
303
Component Activity Please Tick Yes (Y) or No (N) / Insignificant
If yes, please refer column 2 of table 5.2
& write Impacts
If Yes please refer column 4 of table
5.2 & write mitigation measures
Monitoring Agency (Refer Table 5.2,
columns 6, 7, 8 and write name of Agency)
(1) (2) (3) (4) (5) Y N Category C
farmers, water user association, various departmental functionaries and other stakeholders to get them oriented for maximum land and water resource utilization with utmost efficiency.
Formation of Women Self Help Groups in Project area. √ Awareness Creation. √ Organization of Workshops for development of groups. √ Organizing Group Management Training for better group
functioning. √
Promotion of saving and credit activity in groups. √ Grading of WSHGs. √ To promote economic activity in the group providing
revolving fund in the groups and establish their CCL with Banks.
√
The Groups after establishing their CCL from Banks will be handed over to the concerned departments (Animal Husbandry, Fisheries, Horticulture etc.) for economic activity as per the proposal of the group.
√
The willing groups of BPL categories will also be linked with SGSY scheme of the department as per guidelines.
√
Marketing assistance to groups’ produce through organizing exhibitions and melas.
√
Exposure Trips to various successful experiences of other states.
√
Participation in national/ international exhibitions and events.
√
‘Impact Assessment of WSHGs Formation and its √
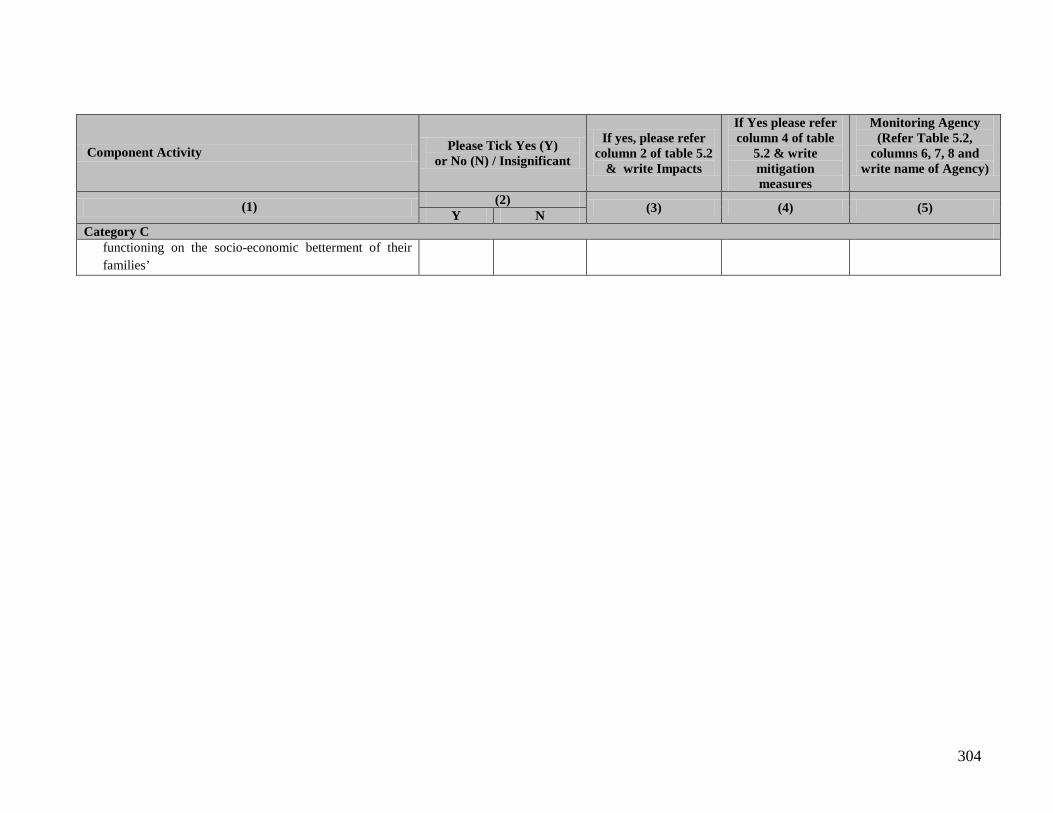
304
Component Activity Please Tick Yes (Y) or No (N) / Insignificant
If yes, please refer column 2 of table 5.2
& write Impacts
If Yes please refer column 4 of table
5.2 & write mitigation measures
Monitoring Agency (Refer Table 5.2,
columns 6, 7, 8 and write name of Agency)
(1) (2) (3) (4) (5) Y N Category C
functioning on the socio-economic betterment of their families’
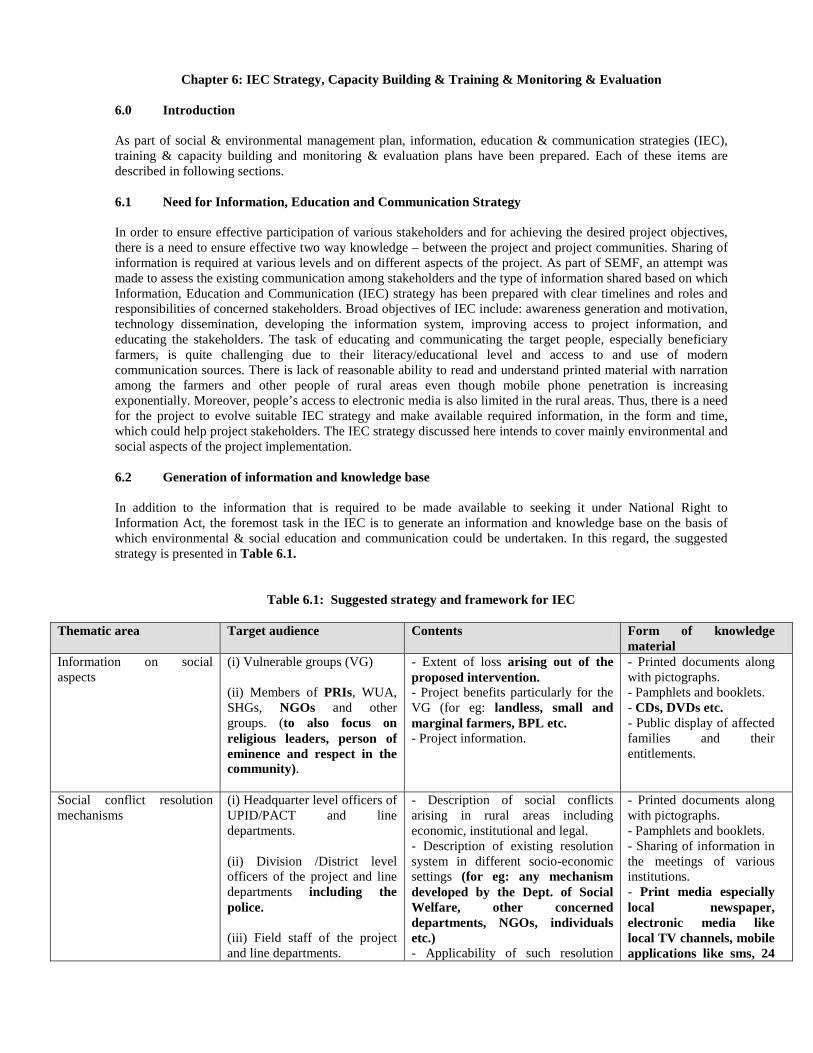
Chapter 6: IEC Strategy, Capacity Building & Training & Monitoring & Evaluation 6.0 Introduction As part of social & environmental management plan, information, education & communication strategies (IEC), training & capacity building and monitoring & evaluation plans have been prepared. Each of these items are described in following sections. 6.1 Need for Information, Education and Communication Strategy In order to ensure effective participation of various stakeholders and for achieving the desired project objectives, there is a need to ensure effective two way knowledge – between the project and project communities. Sharing of information is required at various levels and on different aspects of the project. As part of SEMF, an attempt was made to assess the existing communication among stakeholders and the type of information shared based on which Information, Education and Communication (IEC) strategy has been prepared with clear timelines and roles and responsibilities of concerned stakeholders. Broad objectives of IEC include: awareness generation and motivation, technology dissemination, developing the information system, improving access to project information, and educating the stakeholders. The task of educating and communicating the target people, especially beneficiary farmers, is quite challenging due to their literacy/educational level and access to and use of modern communication sources. There is lack of reasonable ability to read and understand printed material with narration among the farmers and other people of rural areas even though mobile phone penetration is increasing exponentially. Moreover, people’s access to electronic media is also limited in the rural areas. Thus, there is a need for the project to evolve suitable IEC strategy and make available required information, in the form and time, which could help project stakeholders. The IEC strategy discussed here intends to cover mainly environmental and social aspects of the project implementation. 6.2 Generation of information and knowledge base In addition to the information that is required to be made available to seeking it under National Right to Information Act, the foremost task in the IEC is to generate an information and knowledge base on the basis of which environmental & social education and communication could be undertaken. In this regard, the suggested strategy is presented in Table 6.1.
Table 6.1: Suggested strategy and framework for IEC
Thematic area Target audience Contents Form of knowledge material
Information on social aspects
(i) Vulnerable groups (VG) (ii) Members of PRIs, WUA, SHGs, NGOs and other groups. (to also focus on religious leaders, person of eminence and respect in the community).
- Extent of loss arising out of the proposed intervention. - Project benefits particularly for the VG (for eg: landless, small and marginal farmers, BPL etc. - Project information.
- Printed documents along with pictographs. - Pamphlets and booklets. - CDs, DVDs etc. - Public display of affected families and their entitlements.
Social conflict resolution mechanisms
(i) Headquarter level officers of UPID/PACT and line departments. (ii) Division /District level officers of the project and line departments including the police. (iii) Field staff of the project and line departments.
- Description of social conflicts arising in rural areas including economic, institutional and legal. - Description of existing resolution system in different socio-economic settings (for eg: any mechanism developed by the Dept. of Social Welfare, other concerned departments, NGOs, individuals etc.) - Applicability of such resolution
- Printed documents along with pictographs. - Pamphlets and booklets. - Sharing of information in the meetings of various institutions. - Print media especially local newspaper, electronic media like local TV channels, mobile applications like sms, 24

306
Thematic area Target audience Contents Form of knowledge material
(iv) Functionaries & representatives of PRIs, NGO and others. (to also focus on religious leaders, person of eminence and respect in the community). (v) Members of WUA, SHG and marketing groups. (vi) Judges, Lawyers and other members of the legal fraternity.
system in other socio-economic settings. - Information on project implementation – activities and beneficiaries. - Analysis of legal vis-à-vis traditional resolution systems for better understanding.
hour helplines etc. - Availability if wage employment announced in village meetings and in groups. - Organizing ‘goshtis’, workshops, melas etc. for information dissemination and awareness on a mass scale.
Social risks (i) Headquarter level officers of UPID/PACT and line departments. (ii) Divisional/District level officers of the project and line departments including the police. (iii) Field staff of the project and line departments. (iv) Village institutions – PRIs, WUA and other groups. (v) Project beneficiaries. (vi) Judges, Lawyers and other members of the legal fraternity.
- Description of various social risks to implementation of the project activities. - Ways and means to reduce/mitigate such risks (especially if any of them have been tried and tested previously by any Govt. dept. or NGOs, individuals etc.) - Suggested precautions - Description of social risks that are likely to happen post project implementation. - Possible ways and means to resolve such crises. - Dates (and standard agenda if possible) of the meetings of various institutions. - List of beneficiaries and the type of benefits.
- Printed document. - Pamphlets and booklets. - List of beneficiaries and their benefits are publicly displayed in villages. - Making available information in various meetings. - Print and electronic media such as local newspaper, short documentary films etc.
Participatory decision making
(i) Headquarter level officers of UPID/PACT and line departments. (ii) Divisional /District level officers of the project and line departments including the police. (iii) Field staff of the project and line departments. (iv) Functionaries/ representatives of Gram Panchayat, NGO and others (to also focus on religious leaders, person of eminence and respect in the community). (v) General villagers especially women, the landless, small
- Preparation of work breakdown structure for the project components along with delineation of roles and responsibilities of each level of project management. - Delineation of primary and secondary implementing responsibilities along with schedule and quality standards. - Clarification in case work breakdown structure under the project are in conflict or in duplication with the conventional administrative structure. - Delineation of activities with clear cut mention of the roles of beneficiaries, WUAs, Gram Sabha etc. seeking there proactive involvement in planning, implementation and monitoring and evaluation. - Description of participation process
- Descriptive documents along with matrix of roles and responsibilities. - Schematic exhibition of participatory process and participatory structure especially for the illiterate. - Pamphlets, booklets and handouts in the local dialects. - Extensive use of print and electronic media such as local newspaper, cable TV channels etc. - Organizing ‘goshtis’, workshops, melas etc. for information dissemination and awareness on a mass scale. - Wall paintings.

307
Thematic area Target audience Contents Form of knowledge material
and marginal farmers, SCs, OBCs, the farming community.
for the concerned activities with focus on the integrated village planning process to avoid duplication of planning exercises.
Environmental awareness (i) Headquarter level officers of UPID/PACT and line departments. (ii) Divisional/District level officers of the project and line departments. (iii) Field staff of the project and line departments. (iv) Functionaries/ representatives of Gram Panchayat, NGO and others. (v) General villagers with focus on religious leaders, person of eminence and respect in the community, women, landless, small and marginal farmers, SCs, OBCs and the farming community. (vi) Judges, Lawyers and other members of the legal fraternity.
- Interaction between project activities and the environment including air, water and soil. - An account of previous / past positive and negative impacts of similar interventions. - Probable positive and negative impacts of the project activities on the environment - Proposed measures for enhancing the positive impacts and reducing the negative affects along with primary, supervisory and policy-making responsibilities for these measures. - Proposed mechanism for monitoring and evaluation of various impacts and measures at various levels of policy making and implementation. - Expectations from / responsibilities of each and every stakeholder.
- Printed material in descriptive form. - Project activity wise positive and negative impacts along with proposed measures, implementation responsibility and expectations from stakeholders in form of matrix for easy understanding of the information. - Expectations from farmers and general villagers should be straight forward in language and form. - Use of electronic and print media, mobile applications etc. - Organizing ‘goshtis’, workshops, melas etc. for information dissemination and awareness on a mass scale. - Wall paintings.
Monitoring and Evaluation (i) Headquarters level officers of UPID/PACT and line departments. (ii) Divisional/District level officers of the project and line departments. (iii) Field staff of the project and line departments. (iv) Functionaries/ representatives of Gram Panchayat, NGO, WUA and others. (v) General villagers and farming community including women
- Documentation of project activities, targets, timelines, primary and secondary responsibilities for implementation of various measures to improve environmental and social performance of the project and expected output, outcome and impacts. - Timelines for monitoring and evaluation Compliance review mechanism
- Printed material in matrix form. - Clear pictorization / elaboration in local dialect about the outcomes of the project and community monitoring tools like social audit. - Display of such information on the Gram Panchayat building and other prominent places like community centres, choupals etc.
Inter-departmental coordination / convergence
(i) Headquarters level officers of UPID/PACT and line departments. (ii) Divisional/District level
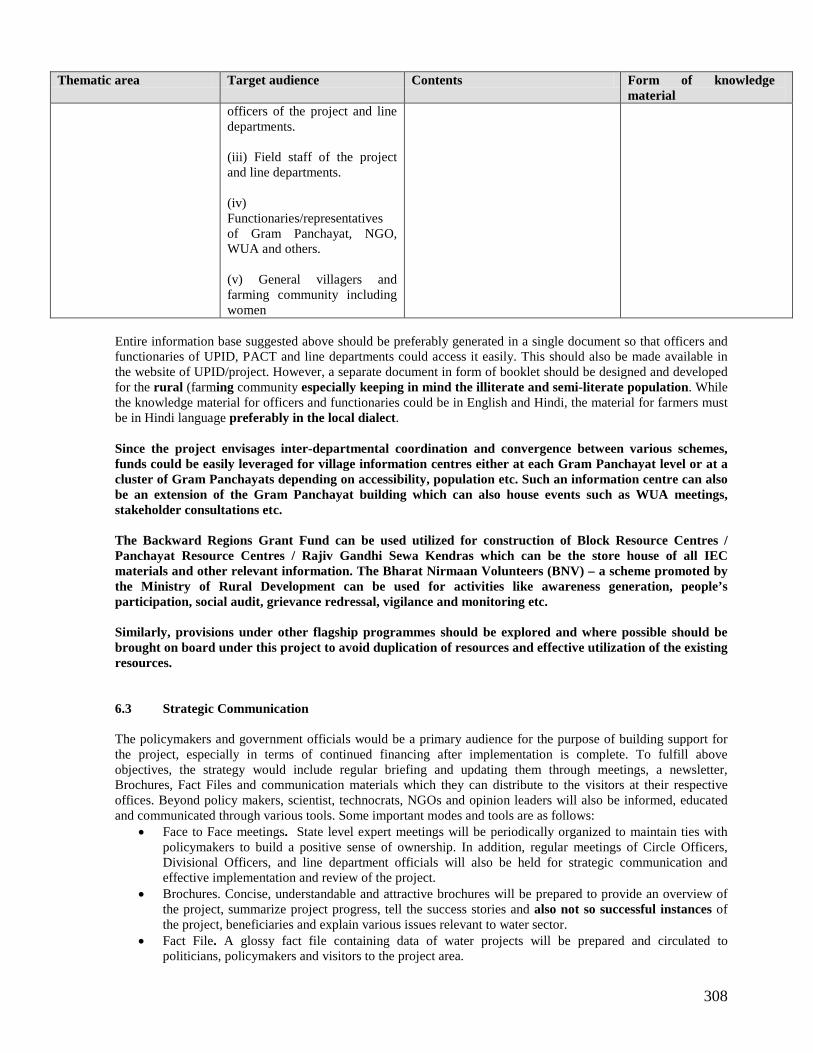
308
Thematic area Target audience Contents Form of knowledge material
officers of the project and line departments. (iii) Field staff of the project and line departments. (iv) Functionaries/representatives of Gram Panchayat, NGO, WUA and others. (v) General villagers and farming community including women
Entire information base suggested above should be preferably generated in a single document so that officers and functionaries of UPID, PACT and line departments could access it easily. This should also be made available in the website of UPID/project. However, a separate document in form of booklet should be designed and developed for the rural (farming community especially keeping in mind the illiterate and semi-literate population. While the knowledge material for officers and functionaries could be in English and Hindi, the material for farmers must be in Hindi language preferably in the local dialect. Since the project envisages inter-departmental coordination and convergence between various schemes, funds could be easily leveraged for village information centres either at each Gram Panchayat level or at a cluster of Gram Panchayats depending on accessibility, population etc. Such an information centre can also be an extension of the Gram Panchayat building which can also house events such as WUA meetings, stakeholder consultations etc. The Backward Regions Grant Fund can be used utilized for construction of Block Resource Centres / Panchayat Resource Centres / Rajiv Gandhi Sewa Kendras which can be the store house of all IEC materials and other relevant information. The Bharat Nirmaan Volunteers (BNV) – a scheme promoted by the Ministry of Rural Development can be used for activities like awareness generation, people’s participation, social audit, grievance redressal, vigilance and monitoring etc. Similarly, provisions under other flagship programmes should be explored and where possible should be brought on board under this project to avoid duplication of resources and effective utilization of the existing resources. 6.3 Strategic Communication The policymakers and government officials would be a primary audience for the purpose of building support for the project, especially in terms of continued financing after implementation is complete. To fulfill above objectives, the strategy would include regular briefing and updating them through meetings, a newsletter, Brochures, Fact Files and communication materials which they can distribute to the visitors at their respective offices. Beyond policy makers, scientist, technocrats, NGOs and opinion leaders will also be informed, educated and communicated through various tools. Some important modes and tools are as follows:
• Face to Face meetings. State level expert meetings will be periodically organized to maintain ties with policymakers to build a positive sense of ownership. In addition, regular meetings of Circle Officers, Divisional Officers, and line department officials will also be held for strategic communication and effective implementation and review of the project.
• Brochures. Concise, understandable and attractive brochures will be prepared to provide an overview of the project, summarize project progress, tell the success stories and also not so successful instances of the project, beneficiaries and explain various issues relevant to water sector.
• Fact File. A glossy fact file containing data of water projects will be prepared and circulated to politicians, policymakers and visitors to the project area.
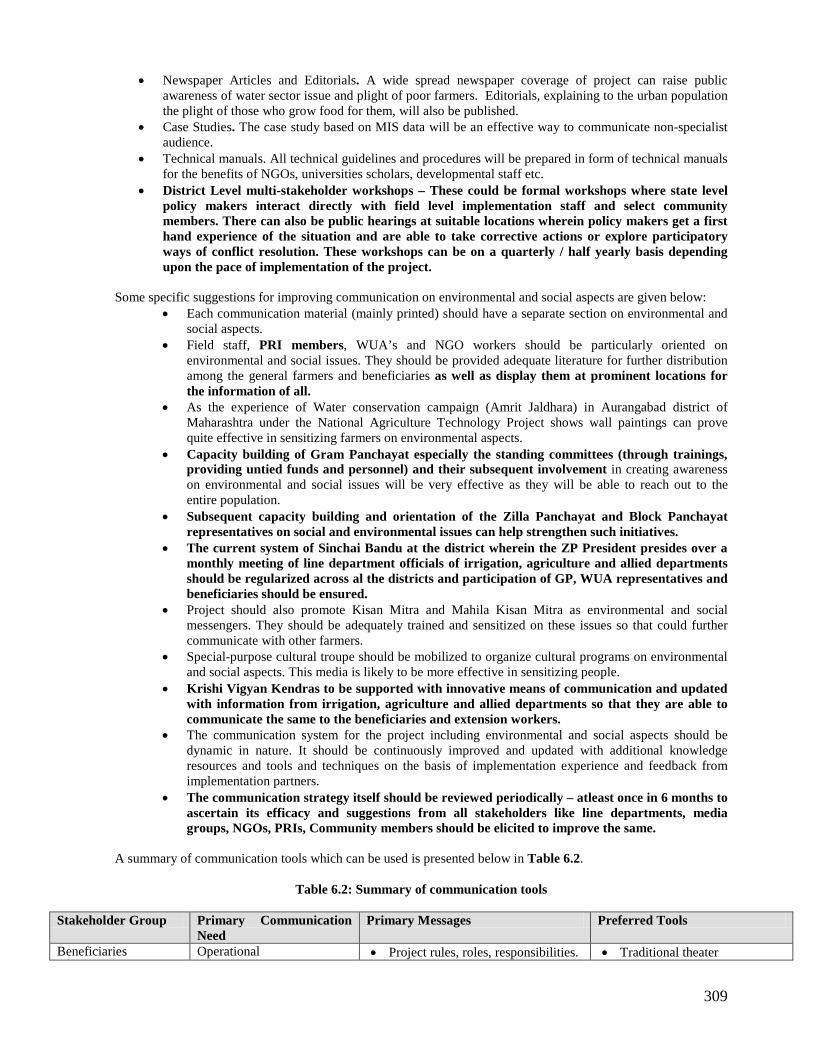
309
• Newspaper Articles and Editorials. A wide spread newspaper coverage of project can raise public awareness of water sector issue and plight of poor farmers. Editorials, explaining to the urban population the plight of those who grow food for them, will also be published.
• Case Studies. The case study based on MIS data will be an effective way to communicate non-specialist audience.
• Technical manuals. All technical guidelines and procedures will be prepared in form of technical manuals for the benefits of NGOs, universities scholars, developmental staff etc.
• District Level multi-stakeholder workshops – These could be formal workshops where state level policy makers interact directly with field level implementation staff and select community members. There can also be public hearings at suitable locations wherein policy makers get a first hand experience of the situation and are able to take corrective actions or explore participatory ways of conflict resolution. These workshops can be on a quarterly / half yearly basis depending upon the pace of implementation of the project.
Some specific suggestions for improving communication on environmental and social aspects are given below:
• Each communication material (mainly printed) should have a separate section on environmental and social aspects.
• Field staff, PRI members, WUA’s and NGO workers should be particularly oriented on environmental and social issues. They should be provided adequate literature for further distribution among the general farmers and beneficiaries as well as display them at prominent locations for the information of all.
• As the experience of Water conservation campaign (Amrit Jaldhara) in Aurangabad district of Maharashtra under the National Agriculture Technology Project shows wall paintings can prove quite effective in sensitizing farmers on environmental aspects.
• Capacity building of Gram Panchayat especially the standing committees (through trainings, providing untied funds and personnel) and their subsequent involvement in creating awareness on environmental and social issues will be very effective as they will be able to reach out to the entire population.
• Subsequent capacity building and orientation of the Zilla Panchayat and Block Panchayat representatives on social and environmental issues can help strengthen such initiatives.
• The current system of Sinchai Bandu at the district wherein the ZP President presides over a monthly meeting of line department officials of irrigation, agriculture and allied departments should be regularized across al the districts and participation of GP, WUA representatives and beneficiaries should be ensured.
• Project should also promote Kisan Mitra and Mahila Kisan Mitra as environmental and social messengers. They should be adequately trained and sensitized on these issues so that could further communicate with other farmers.
• Special-purpose cultural troupe should be mobilized to organize cultural programs on environmental and social aspects. This media is likely to be more effective in sensitizing people.
• Krishi Vigyan Kendras to be supported with innovative means of communication and updated with information from irrigation, agriculture and allied departments so that they are able to communicate the same to the beneficiaries and extension workers.
• The communication system for the project including environmental and social aspects should be dynamic in nature. It should be continuously improved and updated with additional knowledge resources and tools and techniques on the basis of implementation experience and feedback from implementation partners.
• The communication strategy itself should be reviewed periodically – atleast once in 6 months to ascertain its efficacy and suggestions from all stakeholders like line departments, media groups, NGOs, PRIs, Community members should be elicited to improve the same.
A summary of communication tools which can be used is presented below in Table 6.2.
Table 6.2: Summary of communication tools
Stakeholder Group Primary Communication Need
Primary Messages Preferred Tools
Beneficiaries Operational • Project rules, roles, responsibilities. • Traditional theater

310
Stakeholder Group Primary Communication Need
Primary Messages Preferred Tools
• Benefits of participation. • Clarity of roles of PRI, WUAs
and other CBOs. • Guide to conflict resolution. • Right to information • Technical knowledge on land
management (agriculture) • Opportunities for income generation
(livelihoods) • Other programs that can meet their
needs (dovetailing)
• Posters • Village meetings • Newspaper • Radio ads/shows • TV ads • SMS technology (for
extension messages) • Wall paintings • Citizen’s charter in the
Gram Panchayat Bhavan.
Policymakers Strategic • Project progress • To maintain Tie and build
ownership • To show project impacts • To flag deviations, risks and
concerns for timely action. • Oppurtunities of convergence
between departments / schemes / programmes for maximum results.
• Meetings • Brochures • Fact File • Documentaries • TV/radio • Case studies – highlighting
good practices and failures. • Technical manuals.
Opinion Leaders, Academia
Strategic • Project progress • To maintain Tie and build opinion • To show project impacts • Influencing policy
• Meetings • Brochures • Fact File • Documentaries • TV/radio • Case studies
Government officials (practitioners)
Operational • Project rules, roles, responsibilities • Benefits of participation • Right to information • Technical knowledge on land
management related issues • To flag deviations, risks and
concerns for timely action. • Oppurtunities of convergence
between departments / schemes / programmes for maximum results.
• Meetings • Circulars • Brochures • Community interactions like
Goshtis, public hearings etc. • Print and Electronic media •
NGOs Operational • Project rules, roles, responsibilities • Benefits of participation • Right to information • Technical knowledge on land
management related issues • Awareness’ campaign • Legal issues
• Meeting • Extension Literature • Audio/Video • Wall paintings • Social audit and public
hearings • Policy and legal documents
Legal fraternity Operational • Project rules, roles and responsibilities.
• Legal framework. • Stakeholders. • Right to Information. • Technical knowledge on land and
water management. • Rights issues.
• Workshops and seminars • Project related literature • Print and electronic media
(for suo- moto cognizance) • Meeting circulars,
brochures etc.

311
Stakeholder Group Primary Communication Need
Primary Messages Preferred Tools
• Legal interventions in other states.
6.4 Conflict Resolutions As part of SEA, an attempt was made on assessing the type of risks and the existing conflict resolution systems. The major findings are presented below in Table 6.3.
Table 6.3: Conflicts and existing resolution system
S. No.
Conflict areas/risks Existing resolution system
1. In absence of irrigation channel network attached to private boring, sometimes farmers whose field is located away from boring face problem in irrigating their crop because other farmers do not allow conveyance of boring water through fields. Such objections are attributed to personal reasons or anticipated loss of crop or indifferent attitude of concerned farmer. The social status in terms of caste/class issues also play an important role in such cases.
Conflict/objection due to personal reasons (between two farmers) is sorted out through mutual discussion or through intervention from influential people of the village or through peer pressure. Sometimes, it is never resolved.
Conflict/objection due to anticipated loss of crop is addressed through synchronization of sowing and irrigation schedule by the concerned farmers.
Conflict/objection due to indifferent attitude is resolved through peer/social pressure.
2. Pond water is better accessible to those farmers
whose field is located adjacent/closer to the pond. Such farmers develop a sense of first right to use pond water. When owner of distantly-located plot uses pond water, conflict arises. Many a time, this leads to intense conflicts.
Final resolution of conflict depends on relative socio-economic power of the concerned parties. Sometime, decision is taken in favor of stronger party.
In majority cases, adjacent farmer is convinced about equal rights of all farmers of the village to use pond water.
Members of Gram Panchayat, not the Gram Panchayat as an institution, play crucial role in resolution of such conflicts.
3. Conflict arises also in use of canal water for crop irrigation. When quantum of water in canal is low and some intermittent farmer puts on bunds in order to ensure higher quantity of water for his field tail users have smaller quantity of water, conflict among farmers arises.
Such conflicts are resolved generally through mutual negotiation. In many cases, the problem is referred to the Irrigation Department which intervenes to resolve the issue.
Sometimes FIRs are lodged against the erring farmers but no action is taken against them because of political patronage.
4. Community grazing land/pasture should be theoretically accessible to all farmers of the village. However, influential people have better access to such lands/pastures. Many a time, animals belonging to powerful people get privilege. Thus, poor and weaker farmers have lower access.
Such conflicts, when arise, are never resolved. Poor farmers adjust their timing.
5. Absence of proper field/link drain network connecting agricultural fields also leads to conflict among farmers, especially during heavy rains.
Generally, such conflicts are not resolved. However, sometimes, farmers will arrive at mutual consensus to drain
out the entire area. 6. Sowing and harvesting time is generally the same
for all farmers. Hence, their labor requirement is also simultaneous. In majority of cases, a group of labor engaged by a farmer is hired by another farmer through allurement of little higher wages or other mechanisms. Thus, conflict of interest arises between the two parties.
Such conflicts are resolved through mutual discussions. When conflict becomes intense other people and even members of
Gram Panchayat intervene.
7. Some general conflict of interest arises in the villages. These conflicts may relate to property, division of assets between brothers, etc.
These conflicts are generally resolved through informal Panchayat under which elderly and influential people are invited to decide the case. Such elderly people provide an opportunity of hearing to both the parties and take decision on the basis of merit. If the parties are not satisfied with the decision, they approach the court for legal remedy.
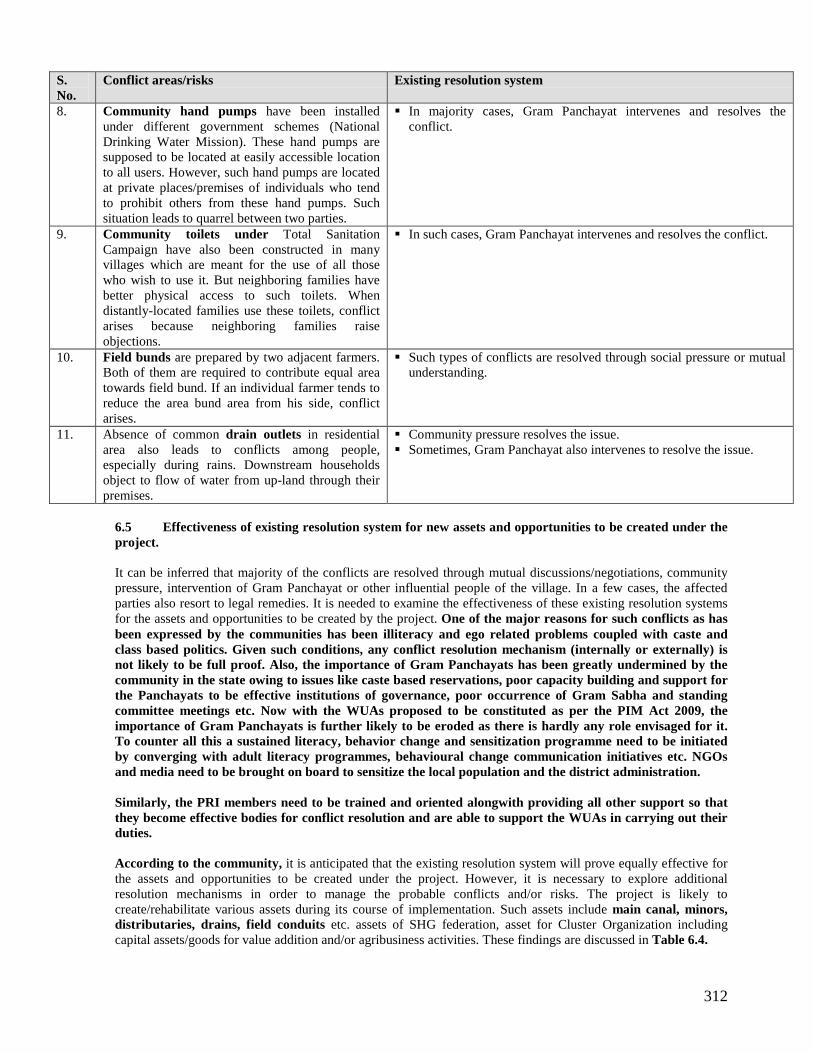
312
S. No.
Conflict areas/risks Existing resolution system
8. Community hand pumps have been installed under different government schemes (National Drinking Water Mission). These hand pumps are supposed to be located at easily accessible location to all users. However, such hand pumps are located at private places/premises of individuals who tend to prohibit others from these hand pumps. Such situation leads to quarrel between two parties.
In majority cases, Gram Panchayat intervenes and resolves the conflict.
9. Community toilets under Total Sanitation Campaign have also been constructed in many villages which are meant for the use of all those who wish to use it. But neighboring families have better physical access to such toilets. When distantly-located families use these toilets, conflict arises because neighboring families raise objections.
In such cases, Gram Panchayat intervenes and resolves the conflict.
10. Field bunds are prepared by two adjacent farmers. Both of them are required to contribute equal area towards field bund. If an individual farmer tends to reduce the area bund area from his side, conflict arises.
Such types of conflicts are resolved through social pressure or mutual understanding.
11. Absence of common drain outlets in residential area also leads to conflicts among people, especially during rains. Downstream households object to flow of water from up-land through their premises.
Community pressure resolves the issue. Sometimes, Gram Panchayat also intervenes to resolve the issue.
6.5 Effectiveness of existing resolution system for new assets and opportunities to be created under the project. It can be inferred that majority of the conflicts are resolved through mutual discussions/negotiations, community pressure, intervention of Gram Panchayat or other influential people of the village. In a few cases, the affected parties also resort to legal remedies. It is needed to examine the effectiveness of these existing resolution systems for the assets and opportunities to be created by the project. One of the major reasons for such conflicts as has been expressed by the communities has been illiteracy and ego related problems coupled with caste and class based politics. Given such conditions, any conflict resolution mechanism (internally or externally) is not likely to be full proof. Also, the importance of Gram Panchayats has been greatly undermined by the community in the state owing to issues like caste based reservations, poor capacity building and support for the Panchayats to be effective institutions of governance, poor occurrence of Gram Sabha and standing committee meetings etc. Now with the WUAs proposed to be constituted as per the PIM Act 2009, the importance of Gram Panchayats is further likely to be eroded as there is hardly any role envisaged for it. To counter all this a sustained literacy, behavior change and sensitization programme need to be initiated by converging with adult literacy programmes, behavioural change communication initiatives etc. NGOs and media need to be brought on board to sensitize the local population and the district administration. Similarly, the PRI members need to be trained and oriented alongwith providing all other support so that they become effective bodies for conflict resolution and are able to support the WUAs in carrying out their duties. According to the community, it is anticipated that the existing resolution system will prove equally effective for the assets and opportunities to be created under the project. However, it is necessary to explore additional resolution mechanisms in order to manage the probable conflicts and/or risks. The project is likely to create/rehabilitate various assets during its course of implementation. Such assets include main canal, minors, distributaries, drains, field conduits etc. assets of SHG federation, asset for Cluster Organization including capital assets/goods for value addition and/or agribusiness activities. These findings are discussed in Table 6.4.

313
Table 6.4: Findings of conflicts and their resolution for various assets
S. No. Asset/ opportunity
Probable conflict/risk Proposed resolution system
1. Field drain The concerned farmers may not be ready to spare land for field drain, hence field drain between two adjacent plots cannot be dug.
Even after digging of field drain, an individual farmer may dismantle its portion and join the area with his field. In such case, field drain will cease to exist.
Since field drain will be dug on private lands, farmers’ willingness to retain it will be the key factor in its sustainability.
Farmers should be adequately sensitized about essentiality of field drain not only for draining out leached water from their fields but also for draining out of excess rainwater in long run. Once, they realize this fact they are likely to retain field drain as it will not acquire much area.
2. Link drain If link drain is dug on private lands, the same problem, as in case of field drain, may arise.
Link drain may not be maintained periodically
Ideally, link drain should be dug on community land.
If it is dug on private land, area under link drain can be declared as the property of Gram Sabha.
Gram Panchayat/WUA should be involved since very beginning so that it takes the responsibility of maintenance of link drain after project withdrawal.
Farmers should be sensitized and motivated to make monetary and/or labor contribution for maintenance of link drain.
3. Main drain Post-rehabilitation maintenance of main drains may not be taken up by the Irrigation Department. It may result into deterioration in the quality of main drains rehabilitated during the project.
Irrigation Department should formally agree to provide adequate fund and undertake periodical maintenance of main drains.
4. Productive assets for SHG
Though productive assets will be provided to the group, some members are deprived from the benefits
Provision of productive asset should be decided on the basis of consensus.
Moreover, the group should formally agree to share the use of such assets among all its members.
5. Assets (Storage, collection center, etc) to Community Organization (CO)
Some members of the Community Organization (CO) may be neglected by the influential members and may not derive the benefits from these assets.
CO should be established as a registered entity and appropriate institutional provisions should be made for hearing of voice of all.
The executive body of the CO should be formed through democratic process so that each and every member has a say.
6.6 Institutional Arrangement, Training and Capacity Building Plan The project is anticipated to leave various environmental and social impacts which may be positive or negative. There will be a need for combination of strategies to address such impacts. While one of the strategy should aim at maximization of minimum possible positive outcomes from each activity, the other strategy should target to minimize the maximum probable undesirable outcomes. Willingness and capacity of different stakeholders will be the most important determinant of the success. Thus, capacity-building of farmers and functionaries of UPID and line departments will be necessary to improve environmental and social performance of the project. The following section describe each of these items. 6.6.1 Mechanisms of environmental and social performance improvement of project Environmental and social performance of the project will depend, on clarity of objectives and goals, meticulous planning, implementation, and rigorous monitoring and evaluation along with compliance review and action mechanism. The aim is to reduce adverse environmental and social impacts and to enhance the positive outcomes. Chapter 5 has described the impacts and Environmental and Social Management Framework, respectively.

314
Environmental issues are mainly technical in nature and need to be handled technically. However, adequate sensitization of various stakeholders, especially implementation partners such as UPID (the agency mainly responsible for implementation of SEMF), Agriculture Department (responsible for organization of demonstrations, crop cutting experiments and seed certification) and Animal Husbandry department (responsible for livestock development through breed improvement, animal health care, etc). Though these departments are aware of both positive and negative impacts of their activities they need additional sensitization so that all possible precautions are taken to avoid negative outcomes and enhance the positive outcomes. Farmers need to be sensitized and cautioned against negative environmental impacts and the steps which they could adopt for the same. Social issues such as probable conflicts, caste and other socio-economic dynamics should be kept in mind while planning and implementing the project activities. Project functionaries including the line department staff should be apprised of these inherent conflicts and socio-economic dynamics which exist in the rural areas so that they take preemptive measures against these negative forces. 6.6.2 Skill and capacity-building requirements Summary of skill & capacity building requirements at various stakeholder levels is given in Table 6.5.
Table 6.5: Summary of capacity-building requirements at various stakeholder levels Stakeholder level Skill and capacity-building requirement Individual Individual level measures to avoid adverse environmental
impacts Sensitization to covariate factors affecting the environment Trade-off between short term and long term gains from
various activities Socio-economic heterogeneity existing the villages and
measures to overcome for common cause Farm/household Individual level measures to avoid adverse environmental
impacts Sensitization to covariate factors affecting the environment Trade-off between short term and long term gains from
various activities Socio-economic heterogeneity existing the villages and
measures to overcome for common cause Orientation and sensitization of women and if possible
children about all the above issues Water Users Groups Necessity of group approach in planning and execution of
irrigation system development including irrigation channel network, field drain network, construction and maintenance of link drains through watershed approach
Water sharing among group members Preparation of water roster on consensus basis to enhance
transparency and to avoid disputes and conflicts in water sharing
Planning of crop rotation and crop mix Collective management of agricultural inputs Ways to overcome socio-economic heterogeneity for the
common cause Community Mass awareness in order to develop a community for
environmental and social aspects Sensitization of community towards environmental and social
issues so that individual efforts of farmers het support from the community
Developing community ownership of various concerns affecting the entire community
Institutional UPID/PACT and other line departments need to prepare separate action plan to address environmental and social

315
Stakeholder level Skill and capacity-building requirement issues concerned with their respective activities
Awareness among all the functionaries of implementing agencies
Officers and functionaries of UPID/PACT and line departments are technically sound. However, they are generally driven by targets set by the project or higher authorities. As a result, they neglect environmental and social aspects of their activities. They need to be alerted against negative outcomes of their activities and probable measures to reduce the same.
Division/District Since Division/district level officers and functionaries of the project and line departments will be entrusted with the direct responsibility of implementation, they need adequate orientation to environmental and social issues.
They need to be trained on environmental and social settings in which they will function for which location-specific knowledge base should be created and communicated to these officers and functionaries.
State State level officers should be oriented about the environmental and social settings of all the project districts and the state as a whole.
Sense of ownership needs to be developed at the top management level
UP irrigation department will be a major stakeholder in both planning & implementation of UPWSRP phase II. Therefore, an effort has been made to identify, develop & implement training & capacity building plan as described below. 6.6.3 Capacity Building and Training Needs of UPID In order to streamline social and environmental issues in planning and implementation of project based on stakeholders’ needs, the institutional capacity of Uttar Pradesh Irrigation Department has been assessed in the context of designing and draft training programs. Firstly, stakeholders’ demand assessment is carried out to identify their needs. Thereafter, the findings of this demand assessment are used to develop relevant training programs for implementation. The five step approach is used to develop these programs. Theses are: (i) present organizational structure of UPID (ii) assessment of functions of UPID in the context of social and environment assessment, (iii) training needs assessment and (iv) design of training programs and (v) implementation mechanism. These steps have been carried out by studying the existing organization structure and by having one to one interaction with officials of UPID various levels. The results of primary survey at grass root level have been extensively used to identify training needs, which have been used to develop the training modules and programs at each level. The following sections describe each of these steps. Organization Structure of UPID Organizational Structure of UPID - Present organization structure of Uttar Pradesh Irrigation Department (UPID) is depicted in Figure 6.1. The organization structure of UPID broadly indicates three functional areas, which are surface water irrigation, irrigation through tube wells and planning and design. All the three functional areas are organized at three levels of hierarchy as given below. Level 1 – Top levels organized at headquarter and scheme level (En-in-Chief/Chief Engineer (Level-1) and Chief Engineer (Level-2), Level 2 – Middle level management at Circle and Division level (Superintending Engineer, Executive Engineer and Assistant Engineer), and Level 3 – Lower management level under each circle/ division (Junior Engineers and other field staff). Assessment of functions of UPID

316
An assessment of existing functions of UPID in the context of social and environmental issues related to water resources has been carried out in terms of the knowledgebase related to subject areas and the existing expertise. The different subject areas included GIS/ AutoCAD, water resources, basin planning, environment and socio–economics and agriculture. It is observed that the knowledgebase exists with respect to all the subject areas in UPID except for social areas at L1 level. The expertise in respect of other areas is notable which is given in Table 6.6.

317
Source: Uttar Pradesh Irrigation Department.
Figure 6.1: Organization Structure of UPID
Level 1
Chairman PACT
Engineer-in-Chief Head of Department
C.E. (East) Level-1
C.E. (West) Level-1
Finance Controller
Finance Controller
C.E. (Sarda Sahayak)
C.E.(Gandak) Gorakhpur) C.E. (Sone)
Varanasi
C.E. (I & P)
C.E. (Sharda)
C.E.(Ganga) Meerut
C.E. (Eastern
Ganga) Moradabad
C.E.
(Ramganga) Kanpur
C.E.
(I & P)
C.E. (Monitorin
C.E (Parivad)
C.E.
(I.S.O.) Computer
Centre
C.E. Level-1 &
Technical Advisor
C.E.
(PACT)
Engineer-in-Chief (Design and Planning)
C.E. (Planning)
Level-1
C.E. (Project) Level-1
C.E. (D.&R.) Level-1
C.E. (Karmik)
C.E. (Madhya Ganga) Aligarh
C.E (Betwa Pariyojana)
Jhansi
C.E. (Bansagar) All h b d
C.E. (Sarya-I) Faizabad
C.E. (Saryu-II)
Gonda C.E. (External Aided Project)
C.E. (Design)
C.E. (W.R.)
Engineer-in-Chief (Mech.)
C.E. (Tubewell)
C.E. (Equip & MM)
C.E. (Nalkoop East) Faizabad
C.E. (Nalkoop
Central)
C.E. (Nalkoop West) Merrut
C.E. (Nalkoop Varanasi
CIRCLE / DIVISION
GRASS ROOT LEVEL
Level 2
Level 3
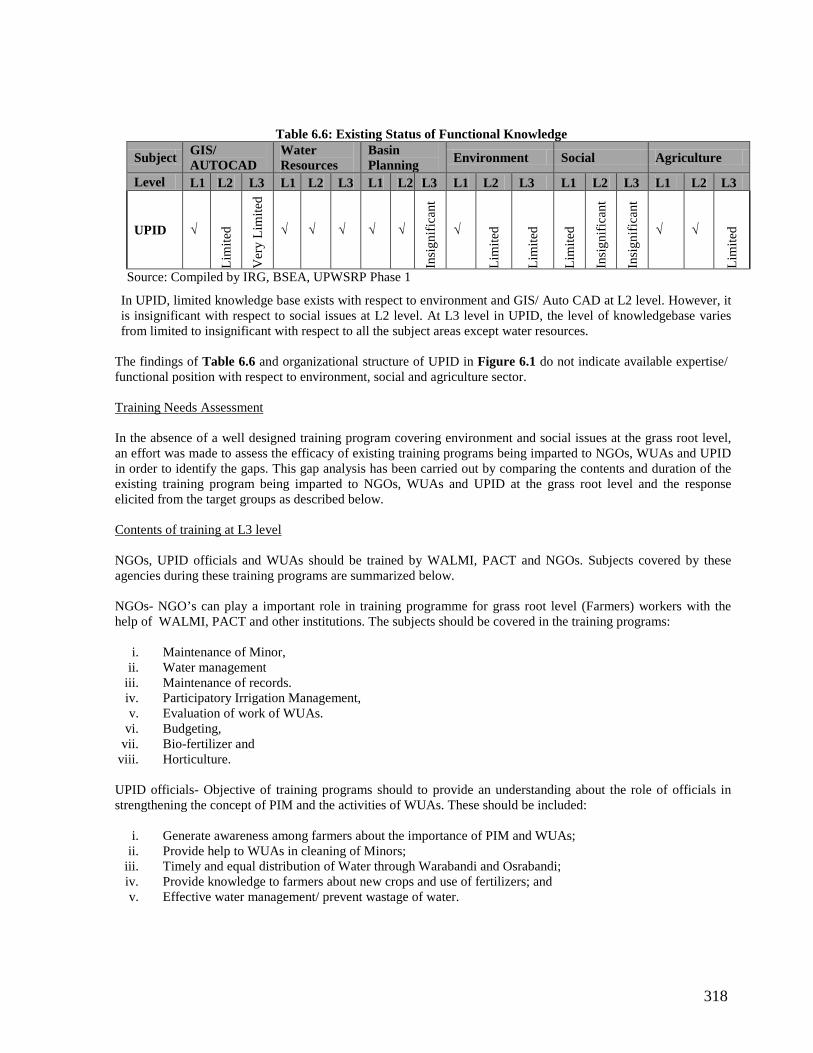
318
Table 6.6: Existing Status of Functional Knowledge
Subject GIS/ AUTOCAD
Water Resources
Basin Planning Environment Social Agriculture
Level L1 L2 L3 L1 L2 L3 L1 L2 L3 L1 L2 L3 L1 L2 L3 L1 L2 L3
UPID √ Li
mite
d
Ver
y Li
mite
d
√ √ √ √ √
Insi
gnifi
cant
√
Lim
ited
Lim
ited
Lim
ited
Insi
gnifi
cant
Insi
gnifi
cant
√ √
Lim
ited
Source: Compiled by IRG, BSEA, UPWSRP Phase 1
In UPID, limited knowledge base exists with respect to environment and GIS/ Auto CAD at L2 level. However, it is insignificant with respect to social issues at L2 level. At L3 level in UPID, the level of knowledgebase varies from limited to insignificant with respect to all the subject areas except water resources.
The findings of Table 6.6 and organizational structure of UPID in Figure 6.1 do not indicate available expertise/ functional position with respect to environment, social and agriculture sector. Training Needs Assessment In the absence of a well designed training program covering environment and social issues at the grass root level, an effort was made to assess the efficacy of existing training programs being imparted to NGOs, WUAs and UPID in order to identify the gaps. This gap analysis has been carried out by comparing the contents and duration of the existing training program being imparted to NGOs, WUAs and UPID at the grass root level and the response elicited from the target groups as described below. Contents of training at L3 level
NGOs, UPID officials and WUAs should be trained by WALMI, PACT and NGOs. Subjects covered by these agencies during these training programs are summarized below.
NGOs- NGO’s can play a important role in training programme for grass root level (Farmers) workers with the help of WALMI, PACT and other institutions. The subjects should be covered in the training programs:
i. Maintenance of Minor, ii. Water management
iii. Maintenance of records. iv. Participatory Irrigation Management, v. Evaluation of work of WUAs.
vi. Budgeting, vii. Bio-fertilizer and
viii. Horticulture.
UPID officials- Objective of training programs should to provide an understanding about the role of officials in strengthening the concept of PIM and the activities of WUAs. These should be included:
i. Generate awareness among farmers about the importance of PIM and WUAs; ii. Provide help to WUAs in cleaning of Minors;
iii. Timely and equal distribution of Water through Warabandi and Osrabandi; iv. Provide knowledge to farmers about new crops and use of fertilizers; and v. Effective water management/ prevent wastage of water.

319
Executive Engineers and Assistant Engineers (AEs) should also imparted training with respect to ways for strengthening of WUAs. The Seenchpals should also train in the maintenance of irrigation record and their responsibilities towards WUA’s.
WUA- Training should be imparted through NGOs and WALMI and the duration of their training ranged between 1 and 5 days. The contents of the training program at WALMI included: Maintenance of minor including de-silting:
i. Benefits of PIM and the role and responsibilities of WUAs; ii. Need of communication among all stakeholders;
iii. Use of high yielding variety (HYV) and new seeds; iv. Maintenance of records; v. Proper use of water and equity in its distribution through Warabandi/Osrabandi;
vi. Prevention of water wastage and vii. Maintenance of drainage system.
Design of Training Program Design of training program should carried be out based on major training needs as summarized below.
i. Water resources sector needs both augmentation of knowledgebase as well as organizational strengthening with respect to mainstreaming of environment and social issues.
ii. At L1 level, there is a need for transforming environmental and social issues related policies both at national and state level into intervention planning, implementation and monitoring for effective mainstreaming from time to time.
iii. L2 and L3 levels need training covering all aspects of social and environmental issues identification, intervention planning, implementation and monitoring. The existing formats of training program at L3/WUA/ NGO level needs to be strengthened in the light of identified gaps.
The above inferences define type of training programs required to be implemented at different levels. These training programs are summarized below in Table 6.7.
Table 6.7: Target Groups and Type of Training Programs
Type of Training Program Target Group L1 L2 L3 NGOs WUAs
Environmental & Social Awareness √ √ √ √ √ Design of Social & Environmental Interventions √ √ Implementation of Social & Environmental Interventions √ √ √ √ √ Monitoring & Evaluation √ √ √ √ √ Source: Compiled by IRG, BSEA Phase 1
These training programs have been designed in terms of target group, frequency of conducting training programs, duration of training programs and format of training programs. The source for developing training material has been identified and is part of SEA study outputs, which will be institutionalized in a time bound manner. Each of these training programs can be implemented in terms of seven sub training modules. These modules have been described in Table 6.8 and Table 6.9. These sub training modules can be implemented either independently or in combination with others. 6.6.4 Implementation Mechanism It is proposed to institutionalize the environmental and social capacity building and training activity at UPID/PACT. The rationale for institutionalizing it at UPID/PACT is given below.
i. Repository of social and environmental knowledgebase

320
ii. Existence of environmental and social expertise iii. Existence of infrastructure/ facilities in terms of operating hardware and software e.g. modeling/ DSS/
GIS/ Auto CAD etc. It is proposed to develop the capacity of UPID/PACT in carrying out environmental and social due diligence so that they can act as trainers to other stakeholders. Further, PACT can act as independent / autonomous agency for monitoring the capacity building effort. The entire implementation mechanism is shown in Figure 6.2. The proposed training areas and faculty for these modules are described in Table 6.10. It is proposed to augment the capacity of faculty at UPID/PACT by conducting training programs under SEA.
Table 6.8: Training Programs for Awareness Raising Target Group
Awareness L1 L2 L3 NGO WUA Frequency Duration Content/ Format Source
Module 1: Policy & Regulations
√ √ Once in three years One Day
Policy (Social/water resources/ Environment) SEA-
Environmental & Social Regulatory Framework
Regulations related to water resources. Regulations related to environment assessment. Regulations related to social assessment.
Module 2: Baseline Environment & social Status
√ √ Once in three years One Day
Environmental & Social regulatory framework. Baseline
Environmental Social database compendium / GIS database
Status based on baseline Environmental Indicators. Status base on Baseline Social Assessment Indicators. Description of hotspots.
Module 3: Area specific baseline Environment & Social Status
√ √ √ √ Once in three years One Day
Area specific environmental issues Baseline
environmental & Social database comparative / maps
Area specific social issues.
- Description of hotspots.
Source: Compiled by IRG, BSEA, Phase 1

321
Table 6.9: Training Programs for Social & Environmental Due Diligence Target Groups Design / Implementation and monitoring of Social & Environmental Intervention
L1 L2 L3 NGO WUA Frequency Duration Content/ Format Source
Module 4: Preplanning Stage (E.A./SA scoping)
√ √
Once in three years
Half day
1- Environmental & Social Screening. 1- Guidelines for usage of
environmental knowledgebase at district & block level (BSEA, UPWSRP Phase 1).
2- Identification of hotspots. 3-Evaluation of engineering interventions.
4-Regulatory Framework. 2- SEA- environmental & Social regulatory framework. (BSEA, UPWSRP Phase 1)
Module 5: Planning Stage (EIA/SA Study)
√ √ Half day
1- Baseline assessment using primary & secondary data.
1- Guidelines for prioritizing the environmental uses (BSEA, UPWSRP Phase 1).
2- Impact identification & quantification and formulation of mitigation measures.
2- Guidelines for impact identification & prioritizing (BSEA, UPWSRP Phase 1).
3- Preparation of BOQ.
3- Guidelines for recommendation of mitigation measures (BSEA, UPWSRP Phase 1). 4- Guidelines for investment scenarios & alternatives (BSEA, UPWSRP Phase 1).
Module 6: Implementation Stage (Implementation of SEMF)
√ √ √ √ √ Half day
1- Monitoring & Management Plan. 2- Implementation of mitigation measures. 3- Overall evaluation of environment & social safeguard framework. 4- Institutional Framework roles & responsibility.
1. Guidelines for monitoring & evaluation (BSEA, UPWSRP Phase 1). Module 7: Post
Implementation Stage (Monitoring & Evaluation)
√ √ √ √ √ Once in three years Half day
Source: Compiled by IRG
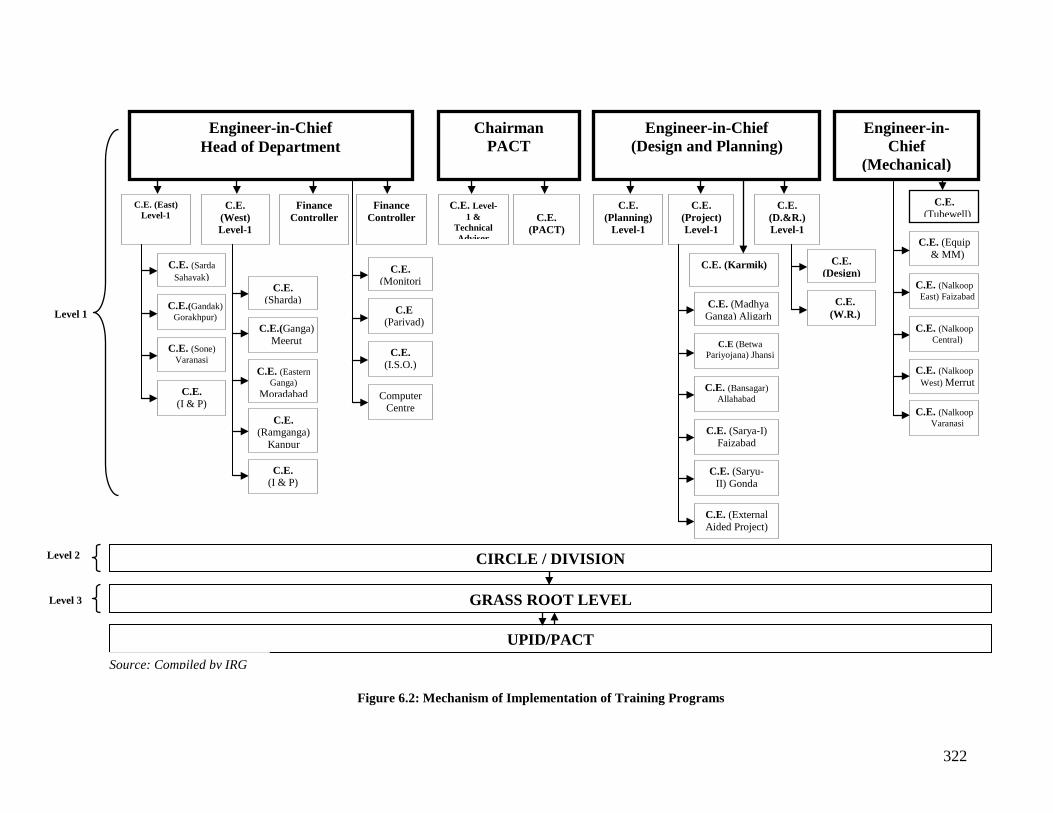
322
Figure 6.2: Mechanism of Implementation of Training Programs
Chairman PACT
Engineer-in-Chief Head of Department
C.E. (East) Level-1
C.E. (West) Level-1
Finance Controller
Finance Controller
C.E. (Sarda Sahayak)
C.E.(Gandak)
Gorakhpur) C.E. (Sone)
Varanasi
C.E.
(I & P)
C.E. (Sharda)
C.E.(Ganga)
Meerut C.E. (Eastern
Ganga) Moradabad
C.E.
(Ramganga) Kanpur
C.E.
(I & P)
C.E. (Monitori
C.E
(Parivad)
C.E. (I.S.O.)
Computer
Centre
C.E. Level-1 &
Technical Advisor
C.E.
(PACT)
Engineer-in-Chief (Design and Planning)
C.E. (Planning)
Level-1
C.E. (Project) Level-1
C.E. (D.&R.) Level-1
C.E. (Karmik)
C.E. (Madhya Ganga) Aligarh
C.E (Betwa
Pariyojana) Jhansi
C.E. (Bansagar) Allahabad
C.E. (Sarya-I)
Faizabad C.E. (Saryu-
II) Gonda C.E. (External Aided Project)
C.E. (Design)
C.E.
(W.R.)
Engineer-in-Chief
(Mechanical)
C.E. (Tubewell)
C.E. (Equip
& MM)
C.E. (Nalkoop East) Faizabad
C.E. (Nalkoop
Central)
C.E. (Nalkoop
West) Merrut
C.E. (Nalkoop Varanasi
Level 1
CIRCLE / DIVISION
GRASS ROOT LEVEL
UPID/PACT
Level 2
Level 3
Source: Compiled by IRG

323
Table 6.10: Training Areas & Faculty Awareness Areas Roles/Responsibility / Faculty
Policy & Regulatories
EIA/ SA scoping : Regulatory review using existing regulatory guide to identify applicable regulations
Environmental / Social Expert/ functional expert (agriculture/water resources/ soil/ economist) team in PACT
Baseline Environment & Social Status
EIA/ SA scoping : Environmental and social screening of sub project using GIS database/ Environmental and Social knowledgebase (developed under SEA) available at UPID/PACT using the screening formats in attached guidelines
Environmental / Social Expert/ functional expert (agriculture/water resources/ soil/ economist) team in PACT
Area and Specific Social Status
EIA/ SA scoping : Identification of hotspots using GIS database/ Environmental and Social knowledgebase (developed under SEA) available at UPID/PACT.
Environmental / Social Expert/ functional expert (agriculture/water resources/ soil/ economist) team in PACT
Pre Planning Stage
EIA/ SA scoping : Environmental and social screening of sub project using GIS database/ Environmental and Social knowledgebase (developed under SEA) available at UPID/PACT using the screening formats in attached guidelines
Environmental / Social Expert/ functional expert (agriculture/water resources/ soil/ economist) team in PACT
EIA/ SA scoping : Identification of hotspots using GIS database/ Environmental and Social knowledgebase (developed under SEA) available at UPID/PACT.
Environmental/ Social Expert/ functional expert (agriculture/water resources/ soil/ economist) team in PACT
EIA/ SA scoping : Evaluation of proposed engineering intervention and their alternatives followed by initial public consultation.
Environmental / Social Expert/ functional expert (agriculture/water resources/ soil/ economist) team in PACT
EIA/ SA scoping : Regulatory review using existing regulatory guide to identify applicable regulations
Environmental / Social Expert/ functional expert (agriculture/water resources/ soil/ economist) team in PACT
Planning and Design Stage
EIA/ SA study: Baseline assessment using secondary data e.g. GIS database/ Environmental and Social knowledgebase (developed under SEA) available at UPID/PACT using the formats in attached guidelines
Environmental / R&R/ Social Expert/ functional expert (agriculture/water resources/ soil/ economist) team in PACT
EIA/ SA study: Baseline assessment using primary data by referring to guidelines as per the procedures and formats/ questionnaires in attached guidelines.
Environmental / Social Expert/ functional expert (agriculture/water resources/ soil/ economist) team in PACT
EIA/ SA study: Impact identification based on project interventions both during construction and operation by referring to guidelines as per the procedures and formats/ questionnaires in attached guidelines.
Environmental / Social Expert/ functional expert (agriculture/water resources/ soil/ economist) team in PACT
EIA/ SA study: Formulation of impact mitigation measures both during construction and operation by referring to soil management framework, water conservation plan, water pollution control plan/ resource use efficiency plan/ green cover improvement plan/ silt disposal plan/ pesticide management plan/ waste management plan/ disaster management plan/ R&R plan and guidelines and as per the procedures and formats in attached guidelines.
Environmental / Social Expert/ functional expert (agriculture/water resources/ soil/ economist) team in PACT
EIA/ SA study: Preparation of bills of quantities (BOQ) and EIA and SA management plan considering
Environmental / Social Expert/ functional expert (agriculture/water

324
Awareness Areas Roles/Responsibility / Faculty mitigation measures both during construction and operation by referring to guidelines and as per the procedures and formats in attached guidelines.
resources/ soil/ economist) team in PACT
EIA/ SA study: Identification of environmental and social parameters to be monitored and time bound monitoring plan both during project implementation and post implementation by referring to guidelines and as per the procedures and formats in attached guidelines.
Environmental / Social Expert/ functional expert (agriculture/water resources/ soil/ economist) team in PACT
Implementation stage
Implementation of EIA/ SA mitigation measures by the contractor/ implementing agency.
Environmental / Social Expert/ functional expert (agriculture/water resources/ soil/ economist) team in PACT
Third party evaluation of the project implementation & safeguard measures undertaken during construction
Environmental / Social Expert/ functional expert (agriculture/water resources/ soil/ economist) team in PACT
Third party evaluation of the success of project implementation & safeguard measures undertaken during construction.
Environmental / Social Expert/ functional expert (agriculture/water resources/ soil/ economist) team in PACT
Post Implementation stage
Third party evaluation of the post project monitoring parameters/ indicators
Environmental / Social Expert/ functional expert (agriculture/water resources/ soil/ economist) team in PACT
Third party evaluation of the post project success & safeguard measures undertaken and follow up activities based on lessons learnt.
Environmental / Social Expert/ functional expert (agriculture/water resources/ soil/ economist) team in PACT
Source: Compiled by IRG, BSEA, UPWSRP Phase 1
6.6.5 Convergence with overall capacity-building plan UPID has already prepared a Project Implementation plan for project functionaries and farmers. Environmental and social aspects could be built into this plan in order to ensure efficiency and effectiveness of these programmes. Various training material planned to be developed for overall training and awareness generation should include a separate section on environmental and social aspects. New sets of pamphlets, flip charts, booklets should be designed, printed and distributed to the concerned stakeholders. At farmers’ field school, some specific-purpose Master Trainers should be identified and trained. These master trainers would impart training to farmers on environmental and social issues. Similarly, environmental and social issues should be included in the training programmes for officers and functionaries of UPID and line departments as described above. Institutional arrangement There should/will be a separate Training Cell at UPID headquarters which will plan, coordinate and implement the training and capacity building activities. The Training Cell at UPID headquarters will coordinate with the identified institutes/agencies for sending batches of trainees there. The Cell will function in close coordination with the Environment Cell and Participatory Management Cell at PACT so that environmental and social issues are adequately addressed in training programmes. At the division/district level, a dedicated staff should/would be posted who will coordinate all training activities in the division/district. At sub-district level, field staff including NGO workers will/should be entrusted the responsibility of coordinating the training and capacity building activities. Farmers’ Field School can play an important role in capacity building on environmental and social aspects of the project intervention. These schools should be adequately strengthened through literature, infrastructure and financial support to organize training programmes at the local level. This arrangement will also improve attendance in training sessions.

325
Timeline Schedule of capacity building should be drawn in such a manner that it caters to both orientation and refresher requirement of a given audience. Thus, training programmes should be organized for different project functionaries immediately after their induction and at regular intervals for reminder/refresher purposes. The suggested timelines of the capacity building of project officers/functionaries and farmers are described below in Table 6.11.
Table 6.11: Timeline of capacity-building initiatives for functionaries and farmers Target group Year-1 Year-2 Year-3 Year-4 Year-5 Individual Farm/household WUG Community Institutional Division/District State
Notes:
Continuous Orientation Refresher 6.7 Monitoring & Evaluation Monitoring and evaluation is primarily required to ensure proper and timely implementation of environmental and social mitigation measures identified in the planning stage, based on the SEMF. Monitoring at regular intervals during implementation and for a specified period in the post implementation stages is necessary to identify and implement any change / improvement needed in the execution of the activity or in the mitigation measures. Monitoring of the SEMF implementation is needed to verify impacts, ensure adherence to approved plans, environmental standards and general compliance. Monitoring of the SEMF would need to cover the entire project. The objective of SEMF monitoring would be:-
• Provide timely information about success or otherwise of the Environmental Management process outline in the SEMF in such a manner that changes can be made as required to ensure continuous improvement to the process; and
• To evaluate the performance of the SEMF by determining whether the mitigation measures designed into proposed activities have been successful.
6.7.1 Social Impact Monitoring Indicators Social assessment indicators have been developed at three levels. At first / base level, indicators will facilitate primary socio-economic assessment of the study area, which may be applicable to any geographic unit (village/block/district). At second level, indicators will facilitate assessment of stakeholders starting from grass root level to policy level. The outcome of level 1 and level 2 indicators will facilitate development of social change impact indicators at the third level. The entire monitoring mechanism is shown in Figure 6.3. At each level, the type of instrument to be used for measurement and frequency of measurement has been described below.

326
Figure 6.3: Social Monitoring Indicator Mechanisms 6.7.2 Level-1 Indicators The level-1 include following monitoring indicators:
i. Demographic indicators such as population, gender ratio, literacy, occupation, and annual income ii. Indicators related to living conditions such as type of house; fuel for cooking; electricity; water supply and
sanitation. iii. Indicators related to economic conditions such as land holding size, source of income, expenditure,
resource consumption, agriculture expenditure, indebtedness and migration iv. Irrigation and agriculture related indicators such as shift in cropping pattern, source of irrigation, condition
of canal irrigation, productivity, problems in agriculture and irrigation, UPID government schemes, marketing, markets for agriculture produce, quantities sold, pesticide use, fertilizer consumption.
v. Gender Issues such as literacy, expenses on female education, health condition, mortality rate, Immunization, women participation in agriculture, households expenses, decision making and social conditions.
6.7.3 Level-2 and Level-3 Indicators Level-2 and level-3 indicators have been developed by adopting following three steps.
Step 1- Establishment of criteria
The criteria used to identify these indicators are given in Table 6.12. This criterion includes adequate representation of socio-economic conditions, ease of measurement and linkage to any geographical unit.
Table 6.12: Criteria for identifying indicators
Sl. No. Criteria
Social Change Impact Indicators
Establishing Social/ organizational / Institutional Assessment Indicators
Establishing Government Institutional Assessment Indicators
1 Adequate representation of socio-economic conditions √ √
2 Ease of measurement and monitoring √ √ √
Level Indicators Instruments
Level-3
Level-2 Institutional/Organizational
Assessment Indicators (UPID)
Social Change Impact Indicators
1. Monitoring Matrix 2. Survey Schedule
1. Monitoring Matrix 2. Survey Schedule
3 Years
Annual
Level-1 Primary Socio-Economic
Assessment (Baseline Indicators)
1. Primary Survey Schedule
5 Years
Frequency
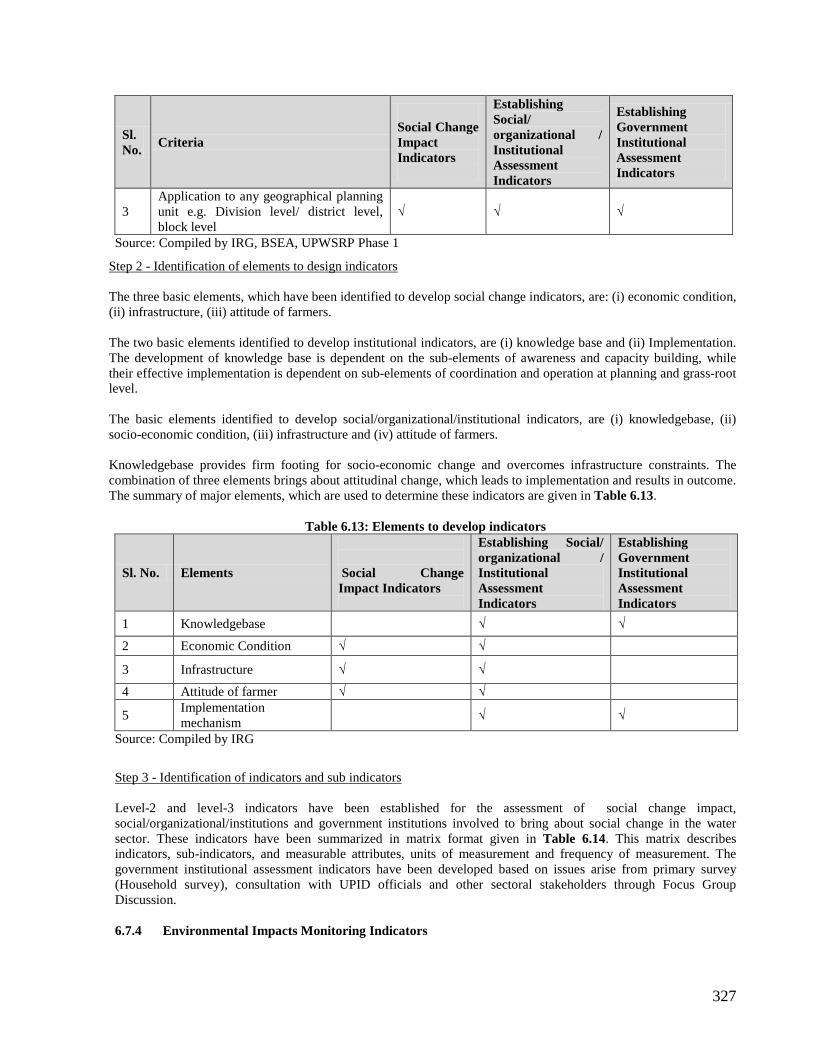
327
Sl. No. Criteria
Social Change Impact Indicators
Establishing Social/ organizational / Institutional Assessment Indicators
Establishing Government Institutional Assessment Indicators
3 Application to any geographical planning unit e.g. Division level/ district level, block level
√ √ √
Source: Compiled by IRG, BSEA, UPWSRP Phase 1
Step 2 - Identification of elements to design indicators The three basic elements, which have been identified to develop social change indicators, are: (i) economic condition, (ii) infrastructure, (iii) attitude of farmers. The two basic elements identified to develop institutional indicators, are (i) knowledge base and (ii) Implementation. The development of knowledge base is dependent on the sub-elements of awareness and capacity building, while their effective implementation is dependent on sub-elements of coordination and operation at planning and grass-root level. The basic elements identified to develop social/organizational/institutional indicators, are (i) knowledgebase, (ii) socio-economic condition, (iii) infrastructure and (iv) attitude of farmers. Knowledgebase provides firm footing for socio-economic change and overcomes infrastructure constraints. The combination of three elements brings about attitudinal change, which leads to implementation and results in outcome. The summary of major elements, which are used to determine these indicators are given in Table 6.13.
Table 6.13: Elements to develop indicators
Sl. No. Elements
Social Change Impact Indicators
Establishing Social/ organizational / Institutional Assessment Indicators
Establishing Government Institutional Assessment Indicators
1 Knowledgebase √ √
2 Economic Condition √ √
3 Infrastructure √ √ 4 Attitude of farmer √ √
5 Implementation mechanism √ √
Source: Compiled by IRG
Step 3 - Identification of indicators and sub indicators Level-2 and level-3 indicators have been established for the assessment of social change impact, social/organizational/institutions and government institutions involved to bring about social change in the water sector. These indicators have been summarized in matrix format given in Table 6.14. This matrix describes indicators, sub-indicators, and measurable attributes, units of measurement and frequency of measurement. The government institutional assessment indicators have been developed based on issues arise from primary survey (Household survey), consultation with UPID officials and other sectoral stakeholders through Focus Group Discussion. 6.7.4 Environmental Impacts Monitoring Indicators

328
Environmental impacts monitoring indicators have been identified based on: (i) expected activities in the Project Area, (ii) identified environmental issues and (iii) expected environmental and socio-economic impacts. It is anticipated that future activities will lead to emergence of environmental issues on account of both short and long term environmental impacts. The indicators to monitor these impacts and their frequency of measurement are summarized in Table 6.15. The frequency of measurement has been fixed for annual and five year monitoring period. These have been fixed considering short and long term basin planning and implementation perspective.

329
Table 6.14: Level-2 and Level-3 Indicators
Indicator Sub indicator Attribute Unit Frequency of Measurement
Source of data
Establishing Government Institutional Assessment Indicator
Awareness & Sensitization of UPID
Awareness about objectives of PIM
Participation of farmers in PIM Opinion expressed (number) Annual Primary Optimum/ Conjunctive use of water
Prevention of wastage of water Drainage of surplus water to the nearest drain
Impact of PIM
Crop wise water management (water usage) e.g. wheat and rice Opinion expressed
(number) Annual Primary Productivity in terms of crop production Adoption of new technology Crop Diversification/ Adoption of new crops Area (Ha)
Capacity Building
Training of trainers (UPID)
Training received on PIM Yes/ No (number)
Annual Primary
Training provided Areas of training Number Duration of training Days
Extent of benefit Opinion expressed (number)
Training by trained trainers
Training provided Yes/ No (number)
Annual Primary
Attendance of UPID Officials meetings Number Major issues of concern in irrigation Opinion expressed
(number) Inspection of irrigation work Women participation in meeting (general body/ executive committee) % Women participation in irrigation activities
Coordination
Coordination with line Line Departments
Updation and validation of secondary data Yearly (time) Annual
Primary Meetings convened Periodicity(yearly/ semiannually) Semiannual
Implementation of recommendation Outcome Annual
Coordination with social groups
Meetings convened Periodicity(yearly/ semiannually) Semiannual Primary
Points of concern in assessment meetings Number Annual Establishing Social/ organizational / Institutional Assessment Indicators Demographic Characteristic (block wise)
Total Population Rural/ Urban/ Total/ Male/ Female Numbers Annual Secondary SC Population Rural/ Urban/ Total/ Male/ Female %
ST Population Rural/ Urban/ Total/ Male/ Female

330
Indicator Sub indicator Attribute Unit Frequency of Measurement
Source of data
Population Density Rural/ Urban/ Total/ Male/ Female Sex Ratio Rural/ Urban/ Total/ Male/ Female Number/ %
Literacy (/ block wise) Literacy Rate Rural/ Urban/ Total/ Male/ Female % Annual Secondary
Institutions (block wise)
Junior Basic Schools Rural/ Urban Number
Annual Secondary Allopathic Hospitals & Dispensaries Rural/ Urban Number per lakh of
population Scheduled/ Cooperative Banks/ Credit Societies Rural/ Urban
Economic Conditions (block wise)
Landholdings Average size Ha Agriculture land use Cropping Intensity % Crop wise Productivity (wheat/rice) Average Yield Quintals/ hectare
Canal Irrigation Net irrigated area by canal Ha and % Tube wells/ Pump set irrigation Net irrigated area by tubewell/ punpsets Ha and %
BPL Population
BPL Families %
BPL SC/ST families Small farmers Marginal farmers
%
Rural Artisans Agriculture Labourers
Social Change Impact Indicators
Change in economic conditions
Cropping Pattern Total coverage area Ha
Annual Secondary
Wheat Cropwise Coverage Area
Ha
Rice Cropwise Coverage Area Barley Cropwise Coverage Area Maize Cropwise Coverage Area Bajra Cropwise Coverage Area Jawar Cropwise Coverage Area Pulses Cropwise Coverage Area Gram Cropwise Coverage Area Oilseeds Cropwise Coverage Area
Cropping Intensity Net Cropping Area Ha Gross Cropping Area
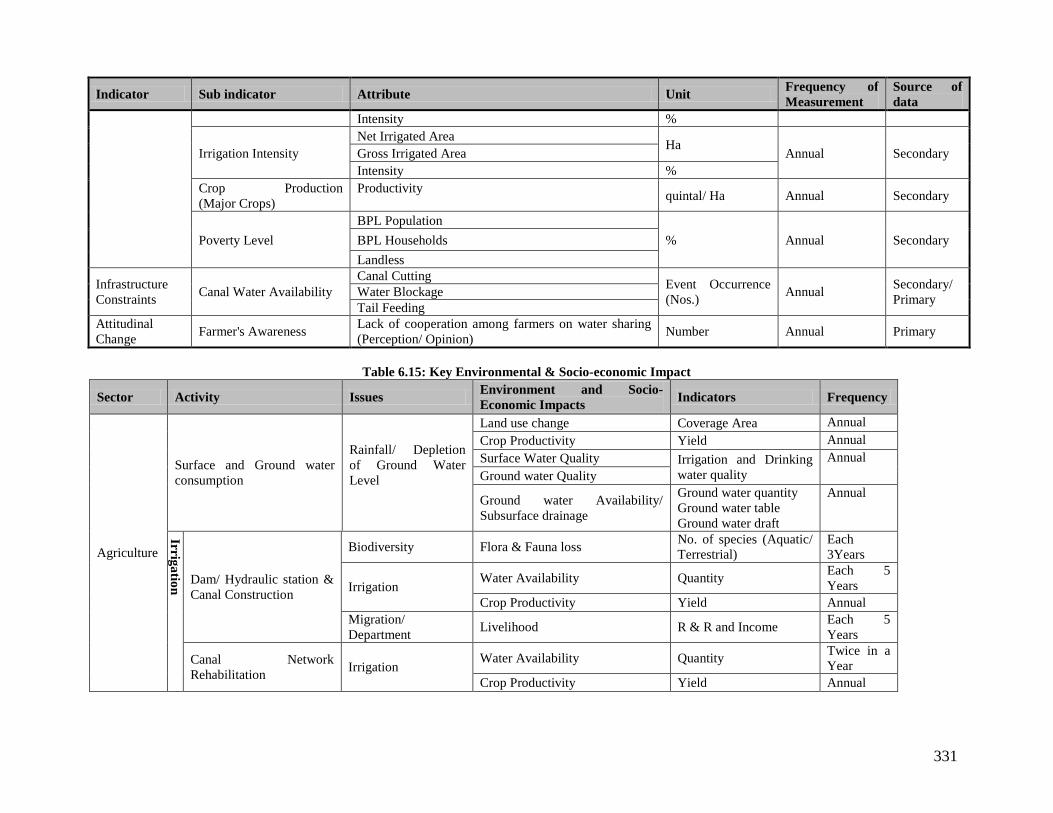
331
Indicator Sub indicator Attribute Unit Frequency of Measurement
Source of data
Intensity %
Irrigation Intensity Net Irrigated Area Ha Annual Secondary Gross Irrigated Area Intensity %
Crop Production (Major Crops)
Productivity quintal/ Ha Annual Secondary
Poverty Level BPL Population
% Annual Secondary BPL Households Landless
Infrastructure Constraints Canal Water Availability
Canal Cutting Event Occurrence (Nos.) Annual Secondary/
Primary Water Blockage Tail Feeding
Attitudinal Change Farmer's Awareness Lack of cooperation among farmers on water sharing
(Perception/ Opinion) Number Annual Primary
Table 6.15: Key Environmental & Socio-economic Impact
Sector Activity Issues Environment and Socio-Economic Impacts Indicators Frequency
Agriculture
Surface and Ground water consumption
Rainfall/ Depletion of Ground Water Level
Land use change Coverage Area Annual Crop Productivity Yield Annual Surface Water Quality Irrigation and Drinking
water quality Annual
Ground water Quality
Ground water Availability/ Subsurface drainage
Ground water quantity Ground water table Ground water draft
Annual
Irrigation
Dam/ Hydraulic station & Canal Construction
Biodiversity Flora & Fauna loss No. of species (Aquatic/ Terrestrial)
Each 3Years
Irrigation Water Availability Quantity Each 5
Years Crop Productivity Yield Annual
Migration/ Department Livelihood R & R and Income Each 5
Years
Canal Network Rehabilitation Irrigation
Water Availability Quantity Twice in a Year
Crop Productivity Yield Annual
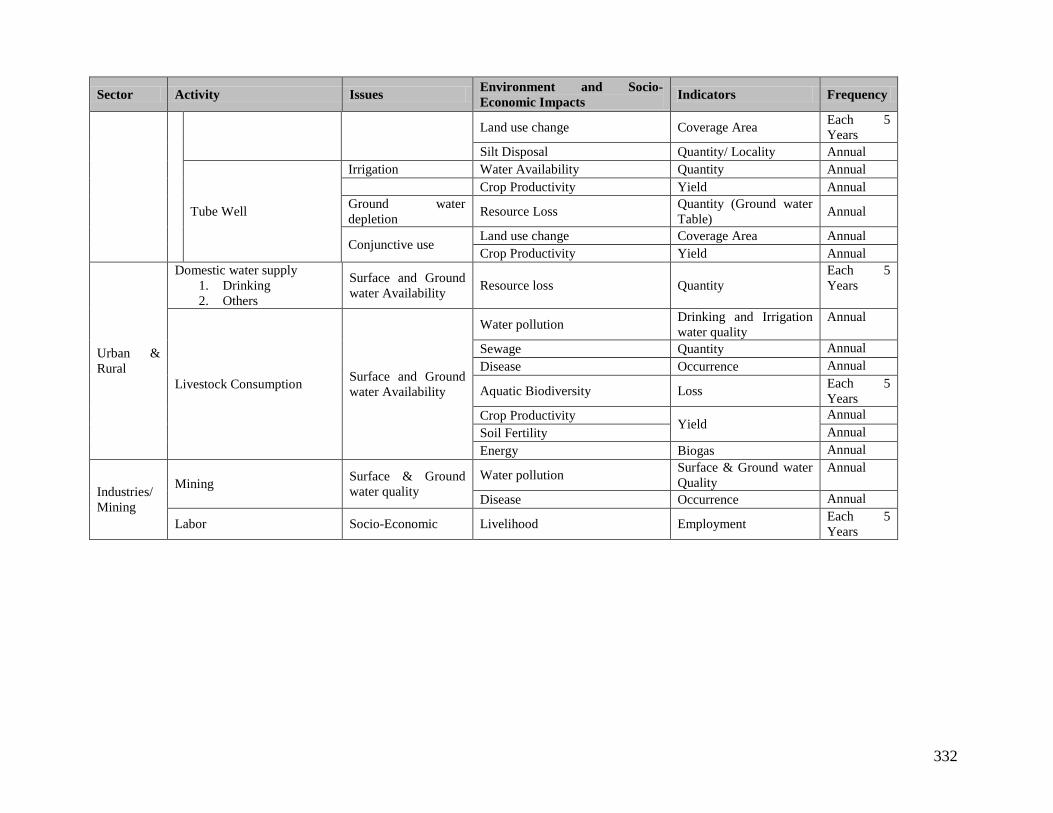
332
Sector Activity Issues Environment and Socio-Economic Impacts Indicators Frequency
Land use change Coverage Area Each 5 Years
Silt Disposal Quantity/ Locality Annual
Tube Well
Irrigation Water Availability Quantity Annual Crop Productivity Yield Annual Ground water depletion Resource Loss Quantity (Ground water
Table) Annual
Conjunctive use Land use change Coverage Area Annual Crop Productivity Yield Annual
Urban & Rural
Domestic water supply 1. Drinking 2. Others
Surface and Ground water Availability Resource loss Quantity
Each 5 Years
Livestock Consumption Surface and Ground water Availability
Water pollution Drinking and Irrigation water quality
Annual
Sewage Quantity Annual Disease Occurrence Annual
Aquatic Biodiversity Loss Each 5 Years
Crop Productivity Yield
Annual Soil Fertility Annual Energy Biogas Annual
Industries/Mining
Mining Surface & Ground water quality
Water pollution Surface & Ground water Quality
Annual
Disease Occurrence Annual
Labor Socio-Economic Livelihood Employment Each 5 Years
333
6.8 Implementation Schedule & Costing The implementation schedule has been detailed in environmental and social impact mitigation / enhancement matrix. Budget for implementation for each of the proposed component of ESMF which includes training and capacity building, pilot demonstration, studies and any investment for mitigation measures is recommended to be prepared and included in the project cost once all the activities are finalized. At EIA level, the detailed scheduling and cost estimates for implementing E&S mitigation measures, training and capacity building and other aspects will be prepared and presented as part of the sub-project proposal document to PACT. 6.9 Integration with the Project The ESMF developed for UPWSRP Phase II can be implemented effectively by integrating it with UPWSRP Project Management Systems and Procedures.

334
Compliance of the Review Committee Minutes dated 18th September’2012 Sr. No. Minutes Points Compliance Status
1. It was agreed that the consultant will show the deliverable status of the deliverables date wise. (As and when the deliverables were due and their date of submission) (Action: IRG Consultant)
Submitted
2. Regarding the activities under the head phase-II Proposed Interventions it was decided that consultant will modify the activity “Construction of WUA office building” under the activity1, as per provisions of in PIM act and will delete the activity “Promotion of Women SHGs for raising the income of family” under the activity 5.
Done in revised report
3. Regarding Applicable Environment Laws and Regulations it was agreed that the consultant in his final report will mention relevant provisions of laws which are important.
Agreed
4. Regarding the Application of World Bank Safeguard Policies it was agreed that the consultant will provide a Hard as well as soft copy of the above said policies before the submission of the final report.
Agreed
5. In table 4.26 Summary of issues (Page-180 of report) consultant was instructed to insert a column of causes before the column of major findings and accordingly remedial measures should be given.
Done in revised report
6. In Annexure 4.5 “Performance of irrigation Projects” data showing % of live storage with respect to rainfall does not follow any logic. It was decided that the consultant will check the data and rectify accordingly.
Dam filling data normally follow the rainfall as depicted form the database eg; lowest rainfall 443mm (2007) dam filling was also lowest in 2007-08 in all three dam’s, However Rohini dam shows more variation may be due to localized problem need to ground verification.
7. It was decided that the wetlands in the command area as listed in the report have to follow the environmental safeguards.
Already mentioned in the report

335
Response of Comments (GWE, PACT) on DFR-Bundelkhand Sr. No. Comments Response
1. Under social environment management frame work for components proposed under the project. Mitigation measures with regard to a few items are not given in the Table 5.4. It is also not clear whether mitigation measures have been incorporated or to be incorporated. Impact of project interventions on protected areas, wetlands and community health be mentioned clearly.
In Table 5.4. Yes (Y) refers to mitigation measures of the project activities incorporated. The No (N) indicates additional input for more awareness training, which may be incorporated and explored by subject Experts. Chapter 5 and Chapter 6 has been revised as per comments recived from World Bank Team and review committee meeting.
2. Interventions required in the project to benefit farmers with regard to conjunctive use of surface & groundwater may be clearly identified.
Table 4.17 indicate Bar block under Semi critical category in project intervention area would mainly require conjunctive use of water by following crop plan as per water availability in canal. This has been added in 4.4.7 (p129)
3. It has been mentioned that quality of surface water is falling hence measures required to improve are to be mentioned along with the parameters of surface water quality.
Though, project activities are not directly polluting the surface water quality, however preventive mitigation measures are given in Table 5.4. Water quality monitoring of nearby water body may be conducted for pre and post project periods (added in SC-5. Status of surface water quality is given in 4.4.10 (p 133-135)
4. Conjunctive water use plan of surface & ground water in critical & deficient ground water areas/drought prone areas be given.
Real Conjunctive water use plan can be prepared only with the actual water availability in canal and crops being grown by the farmers, therefore, shall be prepared by Field Officers in consultation with farmer’s interaction.
5. Water recharge schemes be mentioned and type of recharge system may be suggested
Some of the suggestive recharge methods are as below; • Conservation of rain water, soil and
vegetation by watershed based Interventions will improve stream flows to provide value added surface irrigation.
• Renovation, repairs, desilting, raising embankment and crest height to increase storage capacity of check dams, tanks, ponds, deepening and recharging through dug wells, cleaning of irrigation channels etc. can be taken up. These activities may be dovetailed with Artificial Ground Water Recharging and other such schemes.
• Digging trenches, constructing gully plugs, check dams, loose boulder check dams and

336
Sr. No. Comments Response gabions in non-arable land is the first step to improve biomass productivity. In situ conservation of rains by land shaping, contour/field bunding and many other practices consolidate the gains of interventions in the upper catchment
• watershed management, constructing reservoirs and other surface storage for irrigation is the logical strategy for long term This has been added in point 4.4.5 of the report
6. List of wetlands falling in command areas may be provided for preparation of development programme of wetlands.
This has already given. Please refer point 4.5.3 of the report.
7. Environment management plan needs updatation of final report.
Agreed.