Embed Size (px)
Citation preview

Draft Environmental Impact Assessment
Report
Project proponent
For
Partially Oriented Yarn/Fully Drawn Yarn/
Texturising yarn, Polyster chips & Gas bas
Power Plant
3rd Floor, K. G. Chambers, Opp. Gujarat Samachar Press, Udhna Darwaja, Ring Road,
Surat - 395 002.
Shubhalakshami PolystersLimitedAt
Survey no. 81-87, 90-96, 98-102, 113, 119,120, 123-127,
Village: Bhensali, Taluka: Vagra,
District: Bharuch, State: Gujarat
Prepared By:

Report Details
Draft EIA report
Owner:
Shubhalakshami Polyesters Lim
Work Contractor:
Project Name: ENVIRONMEN
FOR POY/ FD
Copy Holder: SUBHALAKSHAMI
Document title: FINAL ENVIRO
SUB
Total Pages:
Document no.: DT/SPL /EIA/10
© Detox Corporation Pvt. Ltd., J
All rights Reserved. This Publication
condition that this work may not b
the written consent of Detox Corpor
Date
Originator
Project
Engineer
2011 Ankita
Bhairaviya
Pushpak
Shah
mited
NTAL IMPACT ASSESSMENT STUDY REP
DY/ DTY PLANT & GAS BASED POWER P
POLYSTERS LIMITED
ONMENTAL IMPACT ASSESSMENT REPO
FOR
HALAKSHAMI POLYSTERS LIMITED
0-11/24
June 2010
n is the property of Detox Corporation Pvt.
e reproduced or used (entirely or partially
ration Pvt. Ltd.
Reviewer
Project
Director
Pushpak
Shah
Chetan
Contractor
PORT
PLANT
ORT
Ltd. and is released on the
y) for any purpose with out
Draft EIA report for Subhalakshami Polyesters Limited i
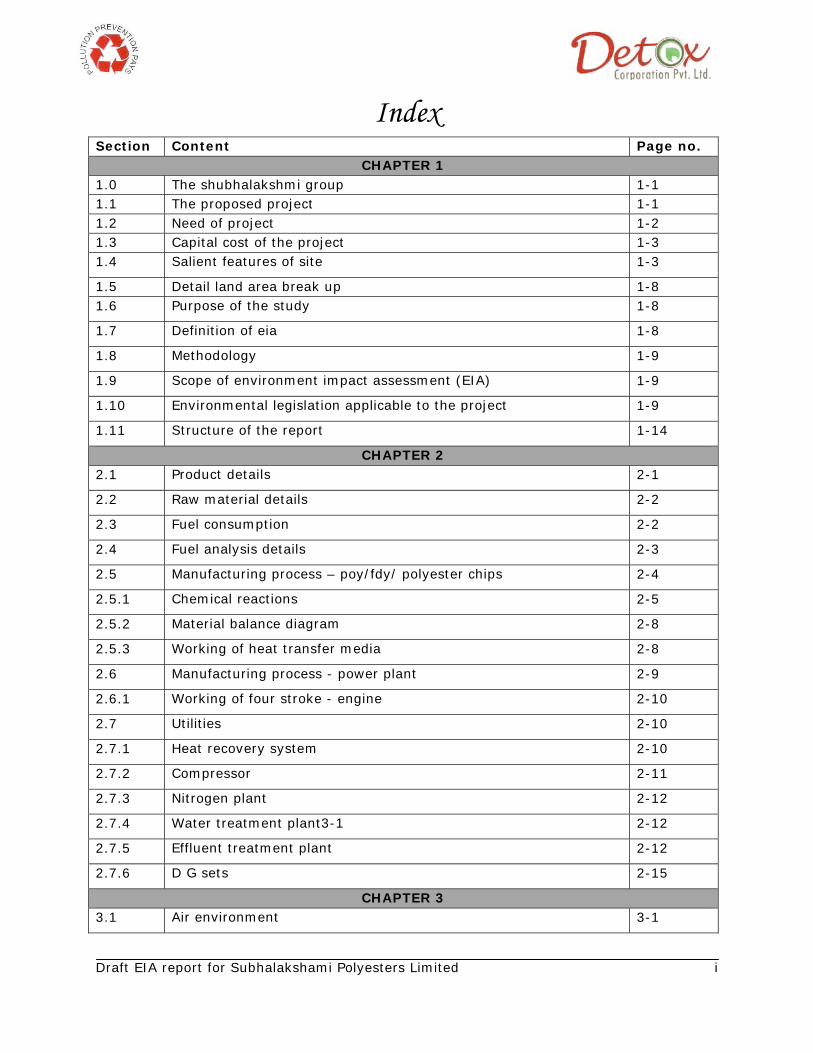
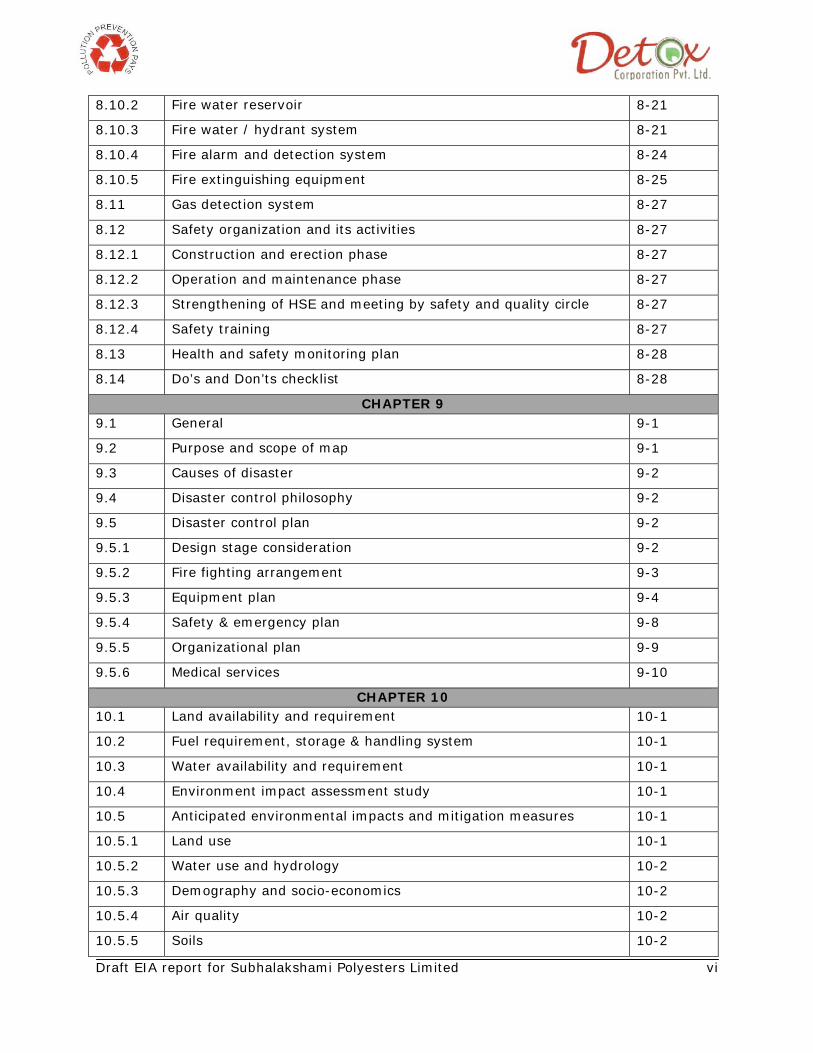
Index Section Content Page no.
CHAPTER 1 1.0 The shubhalakshmi group 1-1 1.1 The proposed project 1-1 1.2 Need of project 1-2 1.3 Capital cost of the project 1-3 1.4 Salient features of site 1-3
1.5 Detail land area break up 1-8 1.6 Purpose of the study 1-8
1.7 Definition of eia 1-8
1.8 Methodology 1-9
1.9 Scope of environment impact assessment (EIA) 1-9
1.10 Environmental legislation applicable to the project 1-9
1.11 Structure of the report 1-14
CHAPTER 2 2.1 Product details 2-1
2.2 Raw material details 2-2
2.3 Fuel consumption 2-2
2.4 Fuel analysis details 2-3
2.5 Manufacturing process – poy/fdy/ polyester chips 2-4
2.5.1 Chemical reactions 2-5
2.5.2 Material balance diagram 2-8
2.5.3 Working of heat transfer media 2-8
2.6 Manufacturing process - power plant 2-9
2.6.1 Working of four stroke - engine 2-10
2.7 Utilities 2-10
2.7.1 Heat recovery system 2-10
2.7.2 Compressor 2-11
2.7.3 Nitrogen plant 2-12
2.7.4 Water treatment plant3-1 2-12
2.7.5 Effluent treatment plant 2-12
2.7.6 D G sets 2-15
CHAPTER 3 3.1 Air environment 3-1
Draft EIA report for Subhalakshami Polyesters Limited ii
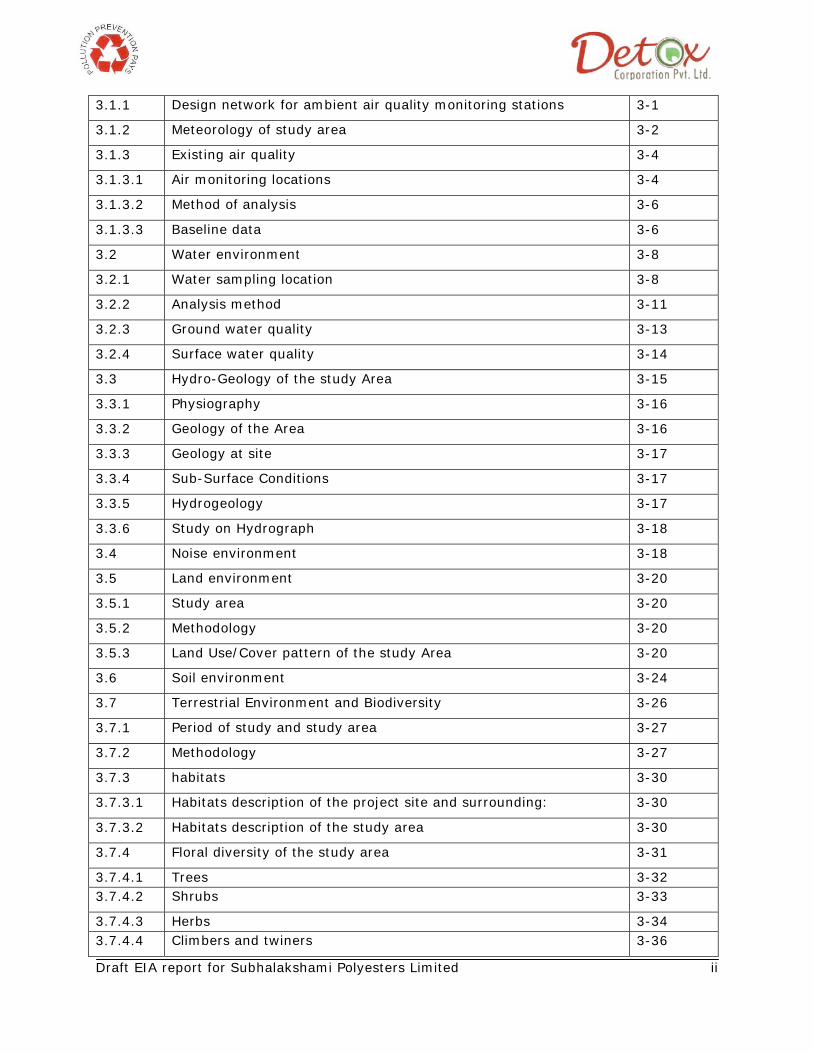
3.1.1 Design network for ambient air quality monitoring stations 3-1
3.1.2 Meteorology of study area 3-2
3.1.3 Existing air quality 3-4
3.1.3.1 Air monitoring locations 3-4
3.1.3.2 Method of analysis 3-6
3.1.3.3 Baseline data 3-6
3.2 Water environment 3-8
3.2.1 Water sampling location 3-8
3.2.2 Analysis method 3-11
3.2.3 Ground water quality 3-13
3.2.4 Surface water quality 3-14
3.3 Hydro-Geology of the study Area 3-15
3.3.1 Physiography 3-16
3.3.2 Geology of the Area 3-16
3.3.3 Geology at site 3-17
3.3.4 Sub-Surface Conditions 3-17
3.3.5 Hydrogeology 3-17
3.3.6 Study on Hydrograph 3-18
3.4 Noise environment 3-18
3.5 Land environment 3-20
3.5.1 Study area 3-20
3.5.2 Methodology 3-20
3.5.3 Land Use/Cover pattern of the study Area 3-20
3.6 Soil environment 3-24
3.7 Terrestrial Environment and Biodiversity 3-26
3.7.1 Period of study and study area 3-27
3.7.2 Methodology 3-27
3.7.3 habitats 3-30
3.7.3.1 Habitats description of the project site and surrounding: 3-30
3.7.3.2 Habitats description of the study area 3-30
3.7.4 Floral diversity of the study area 3-31
3.7.4.1 Trees 3-32 3.7.4.2 Shrubs 3-33
3.7.4.3 Herbs 3-34 3.7.4.4 Climbers and twiners 3-36
Draft EIA report for Subhalakshami Polyesters Limited iii
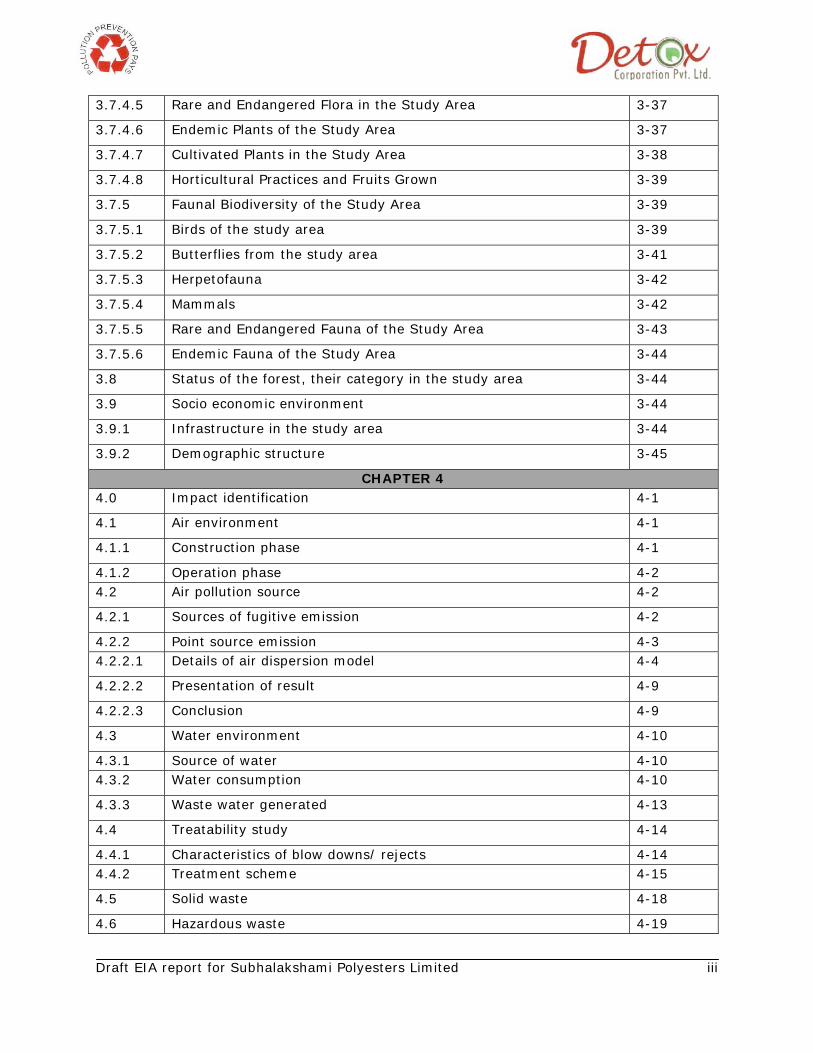
3.7.4.5 Rare and Endangered Flora in the Study Area 3-37
3.7.4.6 Endemic Plants of the Study Area 3-37
3.7.4.7 Cultivated Plants in the Study Area 3-38
3.7.4.8 Horticultural Practices and Fruits Grown 3-39
3.7.5 Faunal Biodiversity of the Study Area 3-39
3.7.5.1 Birds of the study area 3-39
3.7.5.2 Butterflies from the study area 3-41
3.7.5.3 Herpetofauna 3-42
3.7.5.4 Mammals 3-42
3.7.5.5 Rare and Endangered Fauna of the Study Area 3-43
3.7.5.6 Endemic Fauna of the Study Area 3-44
3.8 Status of the forest, their category in the study area 3-44
3.9 Socio economic environment 3-44
3.9.1 Infrastructure in the study area 3-44
3.9.2 Demographic structure 3-45
CHAPTER 4 4.0 Impact identification 4-1
4.1 Air environment 4-1
4.1.1 Construction phase 4-1
4.1.2 Operation phase 4-2 4.2 Air pollution source 4-2
4.2.1 Sources of fugitive emission 4-2
4.2.2 Point source emission 4-3 4.2.2.1 Details of air dispersion model 4-4
4.2.2.2 Presentation of result 4-9
4.2.2.3 Conclusion 4-9
4.3 Water environment 4-10
4.3.1 Source of water 4-10 4.3.2 Water consumption 4-10
4.3.3 Waste water generated 4-13
4.4 Treatability study 4-14
4.4.1 Characteristics of blow downs/ rejects 4-14 4.4.2 Treatment scheme 4-15
4.5 Solid waste 4-18
4.6 Hazardous waste 4-19

Draft EIA report for Subhalakshami Polyesters Limited iv
4.7 Noise environment 4-19
4.7.1 Construction phase 4-19
4.7.2 Operation phase 4-19
4.8 Socio economic environment 4-20
CHAPTER 5 5.0 Introduction 5-1
5.1 Construction phase 5-2
5.2 Air environment 5-3
5.2.1 Construction phase 5-3
5.2.2 Operation phase 5-4
5.2.2.1 Stack height calculations 5-4
5.2.2.2 Technical details of APC measures 5-4
5.2.3 Control of fugitive emissions 5-5
5.2.3.1 Coal handling 5-6
5.2.3.2 Fly ash handling 5-6
5.3 Water environment 5-7
5.3.1 Construction phase 5-7
5.3.2 Operation phase 5-7
5.3.2.1 Water conservation plan 5-7
5.3.2.1.1 rain water harvesting 5-7
5.3.2.2 Waste water management plan 5-7
5.4 Solid/ hazard waste generation 5-8
5.5 Land/ soil environment 5-9
5.6 Noise environment 5-9
5.7 Cleaner production 5-10
5.8 Energy saving 5-11
5.9 Green belt development 5-13
5.9.1 Guidelines for plantation 5-13
5.9.2 Recommended plants for green belt development 5-13
5.9.3 Selection of plants for greenbelts 5-14
5.9.4 Roadside plantation 5-17
5.10 Environment management system 5-18
5.11 Budgetary allocation for environment management plan 5-20
CHAPTER 6 6.0 Pollution monitoring and surveillance system 6-1
Draft EIA report for Subhalakshami Polyesters Limited v
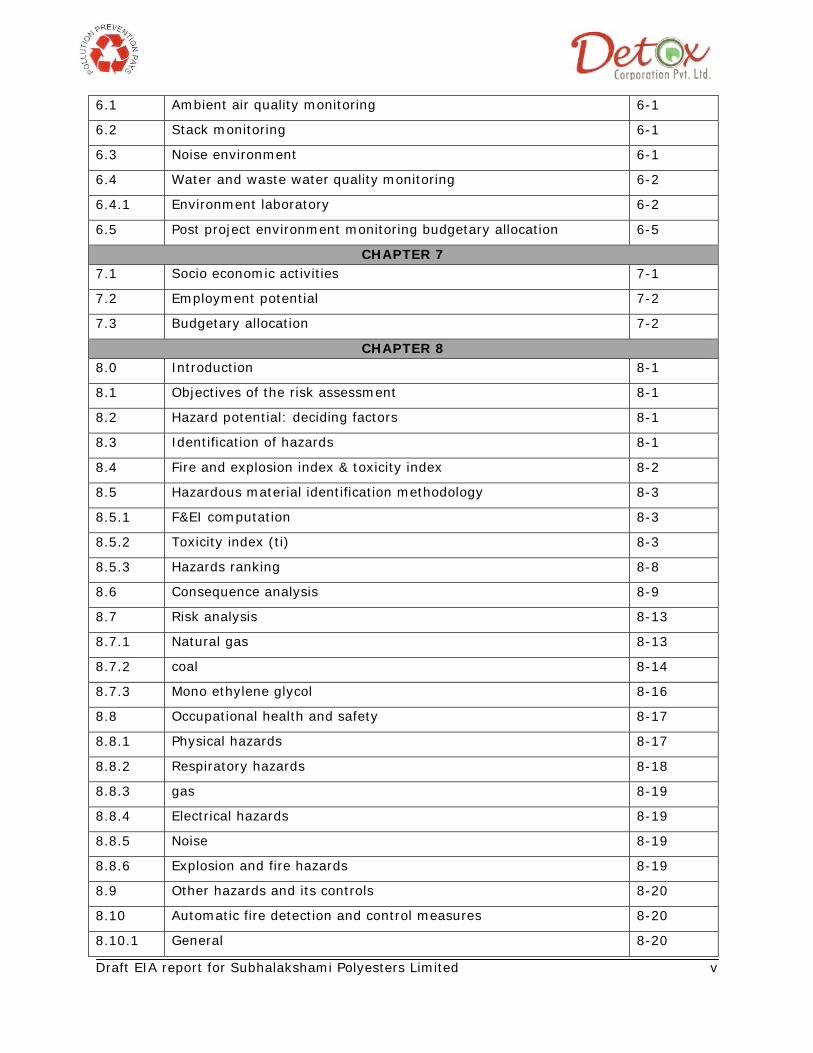
6.1 Ambient air quality monitoring 6-1
6.2 Stack monitoring 6-1
6.3 Noise environment 6-1
6.4 Water and waste water quality monitoring 6-2
6.4.1 Environment laboratory 6-2
6.5 Post project environment monitoring budgetary allocation 6-5
CHAPTER 7 7.1 Socio economic activities 7-1
7.2 Employment potential 7-2
7.3 Budgetary allocation 7-2
CHAPTER 8 8.0 Introduction 8-1
8.1 Objectives of the risk assessment 8-1
8.2 Hazard potential: deciding factors 8-1
8.3 Identification of hazards 8-1
8.4 Fire and explosion index & toxicity index 8-2
8.5 Hazardous material identification methodology 8-3
8.5.1 F&EI computation 8-3
8.5.2 Toxicity index (ti) 8-3
8.5.3 Hazards ranking 8-8
8.6 Consequence analysis 8-9
8.7 Risk analysis 8-13
8.7.1 Natural gas 8-13
8.7.2 coal 8-14
8.7.3 Mono ethylene glycol 8-16
8.8 Occupational health and safety 8-17
8.8.1 Physical hazards 8-17
8.8.2 Respiratory hazards 8-18
8.8.3 gas 8-19
8.8.4 Electrical hazards 8-19
8.8.5 Noise 8-19
8.8.6 Explosion and fire hazards 8-19
8.9 Other hazards and its controls 8-20
8.10 Automatic fire detection and control measures 8-20
8.10.1 General 8-20
Draft EIA report for Subhalakshami Polyesters Limited vi
8.10.2 Fire water reservoir 8-21
8.10.3 Fire water / hydrant system 8-21
8.10.4 Fire alarm and detection system 8-24
8.10.5 Fire extinguishing equipment 8-25
8.11 Gas detection system 8-27
8.12 Safety organization and its activities 8-27
8.12.1 Construction and erection phase 8-27
8.12.2 Operation and maintenance phase 8-27
8.12.3 Strengthening of HSE and meeting by safety and quality circle 8-27
8.12.4 Safety training 8-27
8.13 Health and safety monitoring plan 8-28
8.14 Do’s and Don’ts checklist 8-28
CHAPTER 9 9.1 General 9-1
9.2 Purpose and scope of map 9-1
9.3 Causes of disaster 9-2
9.4 Disaster control philosophy 9-2
9.5 Disaster control plan 9-2
9.5.1 Design stage consideration 9-2
9.5.2 Fire fighting arrangement 9-3
9.5.3 Equipment plan 9-4
9.5.4 Safety & emergency plan 9-8
9.5.5 Organizational plan 9-9
9.5.6 Medical services 9-10
CHAPTER 10 10.1 Land availability and requirement 10-1
10.2 Fuel requirement, storage & handling system 10-1
10.3 Water availability and requirement 10-1
10.4 Environment impact assessment study 10-1
10.5 Anticipated environmental impacts and mitigation measures 10-1
10.5.1 Land use 10-1
10.5.2 Water use and hydrology 10-2
10.5.3 Demography and socio-economics 10-2
10.5.4 Air quality 10-2
10.5.5 Soils 10-2
Draft EIA report for Subhalakshami Polyesters Limited vii
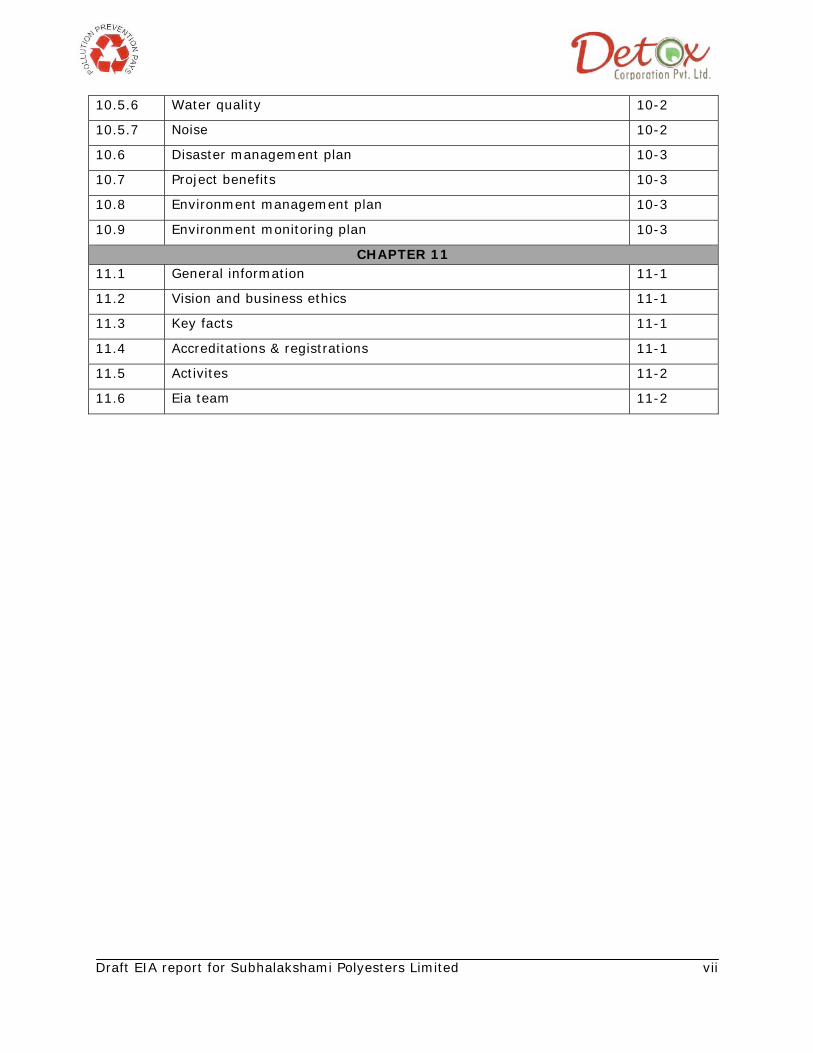
10.5.6 Water quality 10-2
10.5.7 Noise 10-2
10.6 Disaster management plan 10-3
10.7 Project benefits 10-3
10.8 Environment management plan 10-3
10.9 Environment monitoring plan 10-3
CHAPTER 11 11.1 General information 11-1
11.2 Vision and business ethics 11-1
11.3 Key facts 11-1
11.4 Accreditations & registrations 11-1
11.5 Activites 11-2
11.6 Eia team 11-2
Draft EIA report for Subhalakshami Polyesters Limited viii
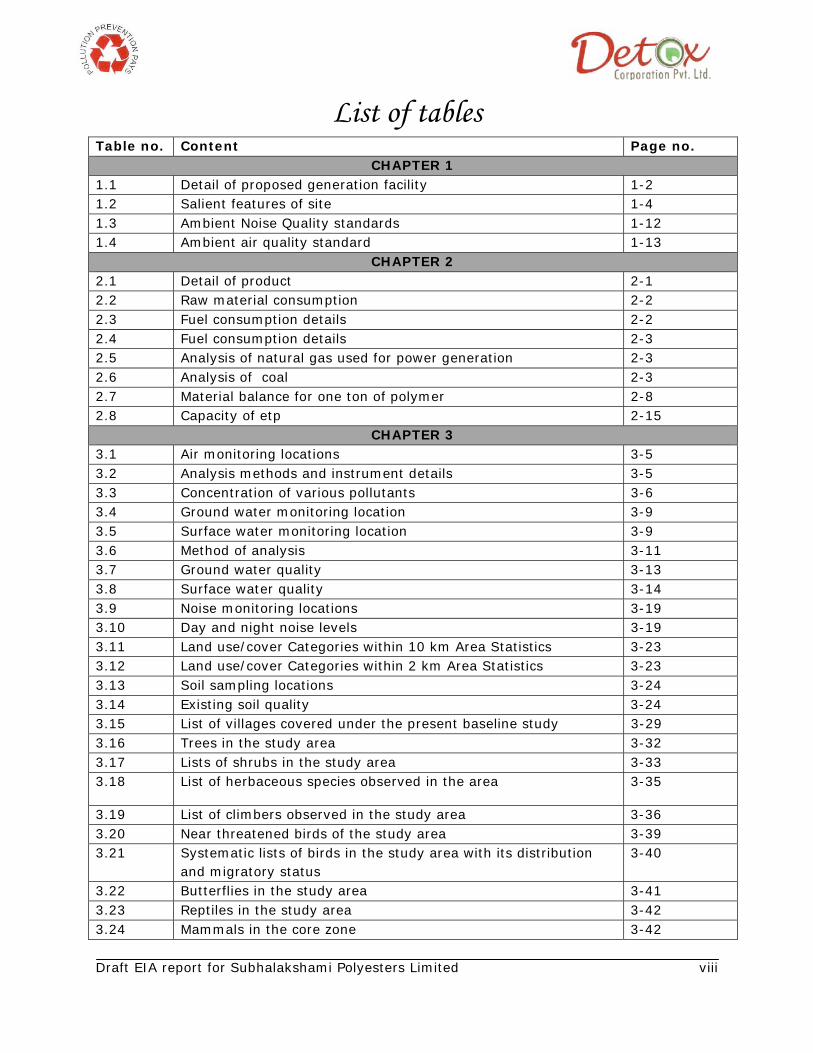
List of tables Table no. Content Page no.
CHAPTER 1 1.1 Detail of proposed generation facility 1-2 1.2 Salient features of site 1-4 1.3 Ambient Noise Quality standards 1-12 1.4 Ambient air quality standard 1-13
CHAPTER 2 2.1 Detail of product 2-1 2.2 Raw material consumption 2-2 2.3 Fuel consumption details 2-2 2.4 Fuel consumption details 2-3 2.5 Analysis of natural gas used for power generation 2-3 2.6 Analysis of coal 2-3 2.7 Material balance for one ton of polymer 2-8 2.8 Capacity of etp 2-15
CHAPTER 3 3.1 Air monitoring locations 3-5 3.2 Analysis methods and instrument details 3-5 3.3 Concentration of various pollutants 3-6 3.4 Ground water monitoring location 3-9 3.5 Surface water monitoring location 3-9 3.6 Method of analysis 3-11 3.7 Ground water quality 3-13 3.8 Surface water quality 3-14 3.9 Noise monitoring locations 3-19 3.10 Day and night noise levels 3-19 3.11 Land use/cover Categories within 10 km Area Statistics 3-23 3.12 Land use/cover Categories within 2 km Area Statistics 3-23 3.13 Soil sampling locations 3-24 3.14 Existing soil quality 3-24 3.15 List of villages covered under the present baseline study 3-29 3.16 Trees in the study area 3-32 3.17 Lists of shrubs in the study area 3-33 3.18 List of herbaceous species observed in the area
3-35
3.19 List of climbers observed in the study area 3-36 3.20 Near threatened birds of the study area 3-39 3.21 Systematic lists of birds in the study area with its distribution
and migratory status 3-40
3.22 Butterflies in the study area 3-41 3.23 Reptiles in the study area 3-42 3.24 Mammals in the core zone 3-42
Draft EIA report for Subhalakshami Polyesters Limited ix
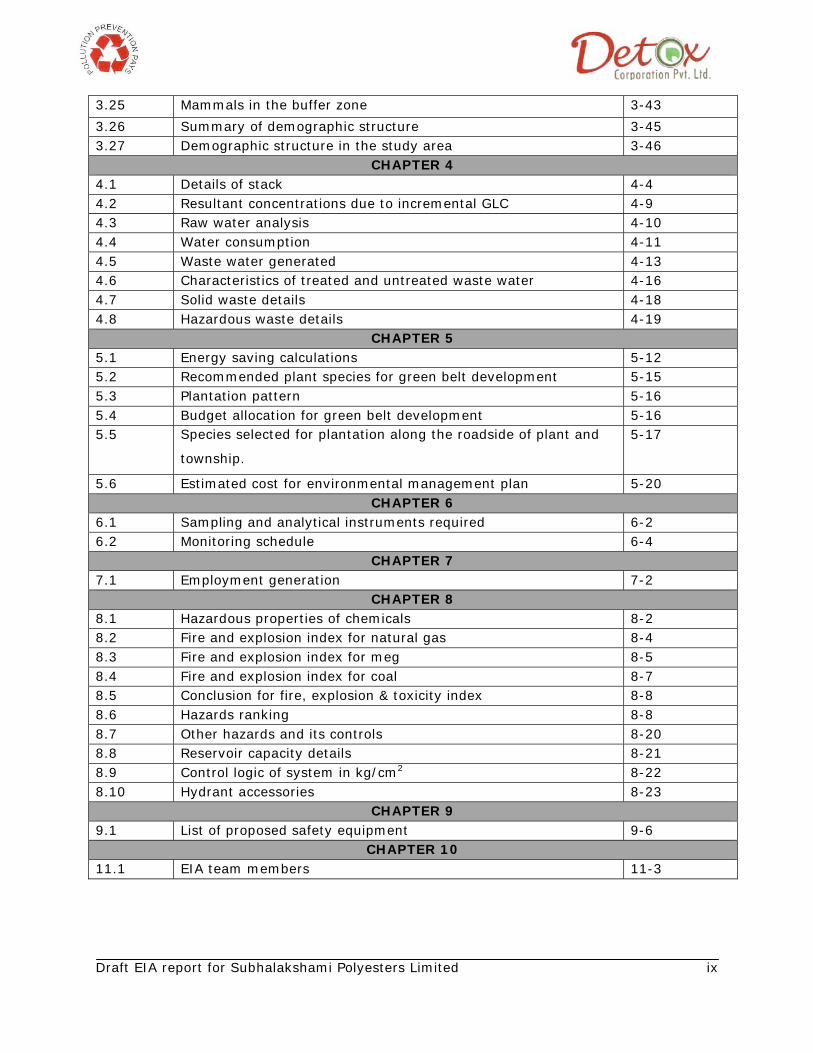
3.25 Mammals in the buffer zone 3-43
3.26 Summary of demographic structure 3-45 3.27 Demographic structure in the study area 3-46
CHAPTER 4 4.1 Details of stack 4-4 4.2 Resultant concentrations due to incremental GLC 4-9 4.3 Raw water analysis 4-10 4.4 Water consumption 4-11 4.5 Waste water generated 4-13 4.6 Characteristics of treated and untreated waste water 4-16 4.7 Solid waste details 4-18 4.8 Hazardous waste details 4-19
CHAPTER 5 5.1 Energy saving calculations 5-12 5.2 Recommended plant species for green belt development 5-15 5.3 Plantation pattern 5-16 5.4 Budget allocation for green belt development 5-16 5.5 Species selected for plantation along the roadside of plant and
township.
5-17
5.6 Estimated cost for environmental management plan 5-20 CHAPTER 6
6.1 Sampling and analytical instruments required 6-2 6.2 Monitoring schedule 6-4
CHAPTER 7 7.1 Employment generation 7-2
CHAPTER 8 8.1 Hazardous properties of chemicals 8-2 8.2 Fire and explosion index for natural gas 8-4 8.3 Fire and explosion index for meg 8-5 8.4 Fire and explosion index for coal 8-7 8.5 Conclusion for fire, explosion & toxicity index 8-8 8.6 Hazards ranking 8-8 8.7 Other hazards and its controls 8-20 8.8 Reservoir capacity details 8-21 8.9 Control logic of system in kg/cm2 8-22 8.10 Hydrant accessories 8-23
CHAPTER 9 9.1 List of proposed safety equipment 9-6
CHAPTER 10 11.1 EIA team members 11-3
Draft EIA report for Subhalakshami Polyesters Limited x
List of figure Figure no. Content Page no.
CHAPTER 1 1.1 Google map of Project site and surrounding area 1-5 1.2 Google map of 10 km radius 1-6 1.3 Base map for 10 km 1-7
CHAPTER 2 2.1 Process flow diagram 2-7 2.2 Flow diagram of htm heater 2-9 2.3 Flow diagram of natural gas bas power plant 2-10 2.4 Flow diagram of etp 2-14
CHAPTER 3 3.1 Wind rose diagram 3-3 3.2 Air sampling locations 3-4 3.3 Ground water sampling locations 3-10 3.4 Surface water sampling locations 3-10 3.5 Satellite imagery 3-20 3.6 Land use land cover map of the study area 3-22 3.7 Map of Study Area 3-28
CHAPTER 4 4.1 Isopleths of particulate matter 4-6 4.2 Isopleths for sox 4-7 4.3 Isopleths of nox 4-8 4.4 Water balance diagram 4-12
CHAPTER 5 5.1 Environment management cell 5-19
CHAPTER 8 8.1(a) Fire model for natural gas 8-10 8.1(b) Input data and result 8-10 8.2(a) Explosion model – natural gas 8-11 8.2(b) Input data and results 8-11 8.3(a) Fire model - MEG 8-12 8.3(b) Input data and result 8-12
Draft EIA report for Subhalakshami Polyesters Limited xi
List of annexure Annexure no. Annexure 1 Lay out map 2 Water allocation confirmation 3 Gas allocation 4 Stack height guidelines 5 Rain water harvesting details 6 TSDF membership certificate 7 Meteorology data 8 TOR copy and its compliance
Draft EIA report for Subhalakshami Polyesters Limited 1-1
Chapter-1 Introduction
1.0 THE SHUBHALAKSHMI GROUP
M/s Shubhalakshmi Polyesters Ltd, is a company under the, Shubhalakshmi group, a
leading industrial group with its operations primarily based at Daman & Silvassa in the
Union Territories Of Daman, Dadra Nagar & Haveli. The core specialization of the group
is polyester yarn, with a strong emphasis on expansion of the existing capacities and
with focus on backward and forward integration made market in the Indian polyester
industry. With its total commitment to achieve customer satisfaction through
maintenance of high quality standards and backed by unmoving faith of our vendors
Shubhalakshmi over a period of time by virtue of hard work and passion to deliver the
thing to perfection, a small seed sown in 1987, has grown in to a huge tree. The
Shubhalakshmi group is promoted by Shri Ramuraman Agarwal (chairman), Shri
Bankeshchandra Agarwal, Shri Ajay Kumar Agarwal (managing director), Shri Manoj
Agarwal and Shri Vikas Agarwal.
The group boasts of an annual production capacity of 30000 metric tons of high quality
polyester filament yarns (POY). In addition to standard yarns, the group manufactures a
wide variety of differentiated and customized products. Among them are high tenacity,
differential shrinkage, micro-filament, cationic, stretch, and specially tailored products.
The group has achieved and maintained industrial excellence and laid a strong
foundation for dynamic group activities. It has emerged as a lean, agile and supremely
fit corporation in the decade of economic liberalization and globalization. It is committed
to make its due presence felt in the domestic as well as international market.
1.1 THE PROPOSED PROJECT
The Shubhalakshami group proposes to install polyester yarn producing unit at Survey
no. 81-87, 90-96, 98-102, 113, 119,120, 123-127, Village: Bhensali, Taluka: Vagra,
District: Bharuch, State: Gujarat.
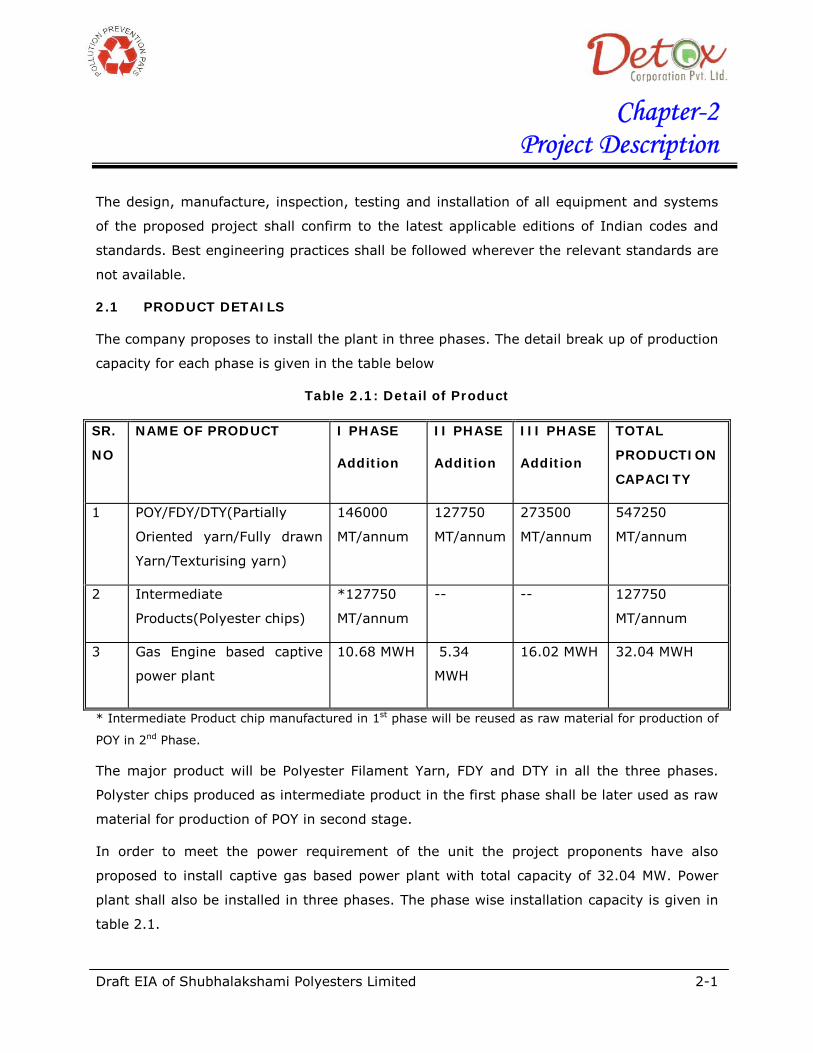
The company proposes to install the plant in three phases. The detail break up of
production capacity for each phase is given in the below table
Draft EIA report for Subhalakshami Polyesters Limited 1-2
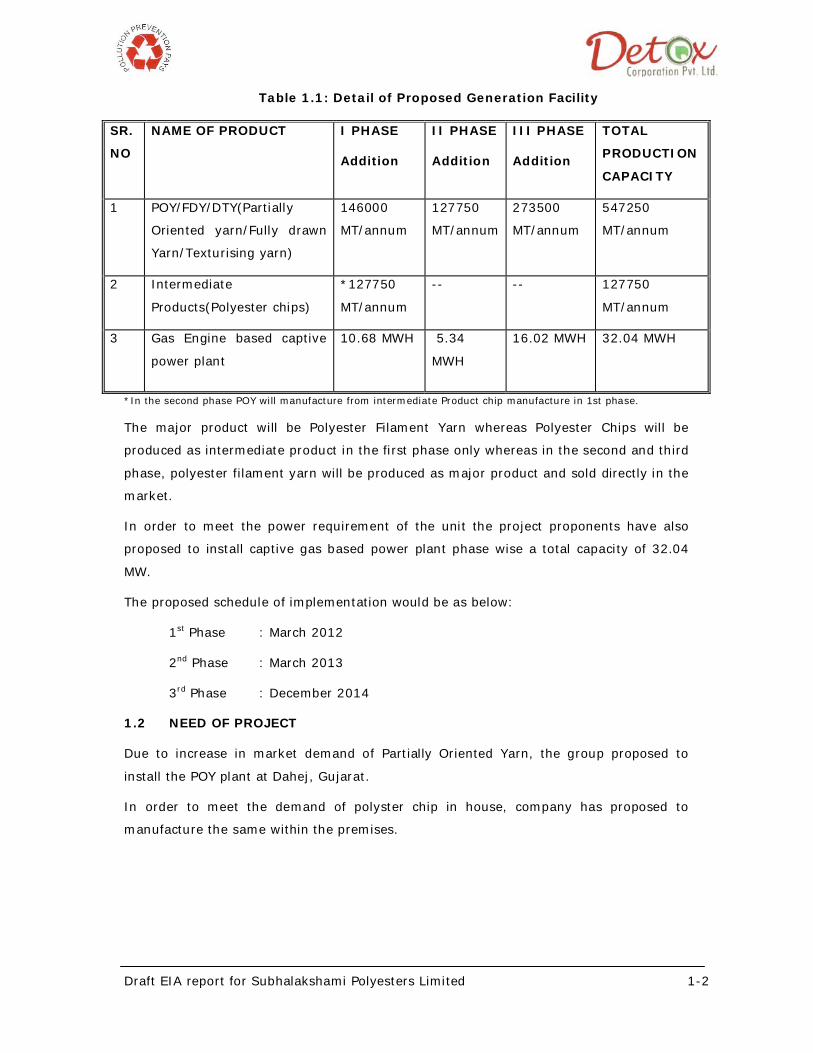
Table 1.1: Detail of Proposed Generation Facility
SR.
NO
NAME OF PRODUCT I PHASE
Addition
II PHASE
Addition
III PHASE
Addition
TOTAL
PRODUCTION
CAPACITY
1 POY/FDY/DTY(Partially
Oriented yarn/Fully drawn
Yarn/Texturising yarn)
146000
MT/annum
127750
MT/annum
273500
MT/annum
547250
MT/annum
2 Intermediate
Products(Polyester chips)
*127750
MT/annum
-- -- 127750
MT/annum
3 Gas Engine based captive
power plant
10.68 MWH
5.34
MWH
16.02 MWH 32.04 MWH
*In the second phase POY will manufacture from intermediate Product chip manufacture in 1st phase.
The major product will be Polyester Filament Yarn whereas Polyester Chips will be
produced as intermediate product in the first phase only whereas in the second and third
phase, polyester filament yarn will be produced as major product and sold directly in the
market.
In order to meet the power requirement of the unit the project proponents have also
proposed to install captive gas based power plant phase wise a total capacity of 32.04
MW.
The proposed schedule of implementation would be as below:
1st Phase : March 2012
2nd Phase : March 2013
3rd Phase : December 2014
1.2 NEED OF PROJECT
Due to increase in market demand of Partially Oriented Yarn, the group proposed to
install the POY plant at Dahej, Gujarat.
In order to meet the demand of polyster chip in house, company has proposed to
manufacture the same within the premises.
Draft EIA report for Subhalakshami Polyesters Limited 1-3
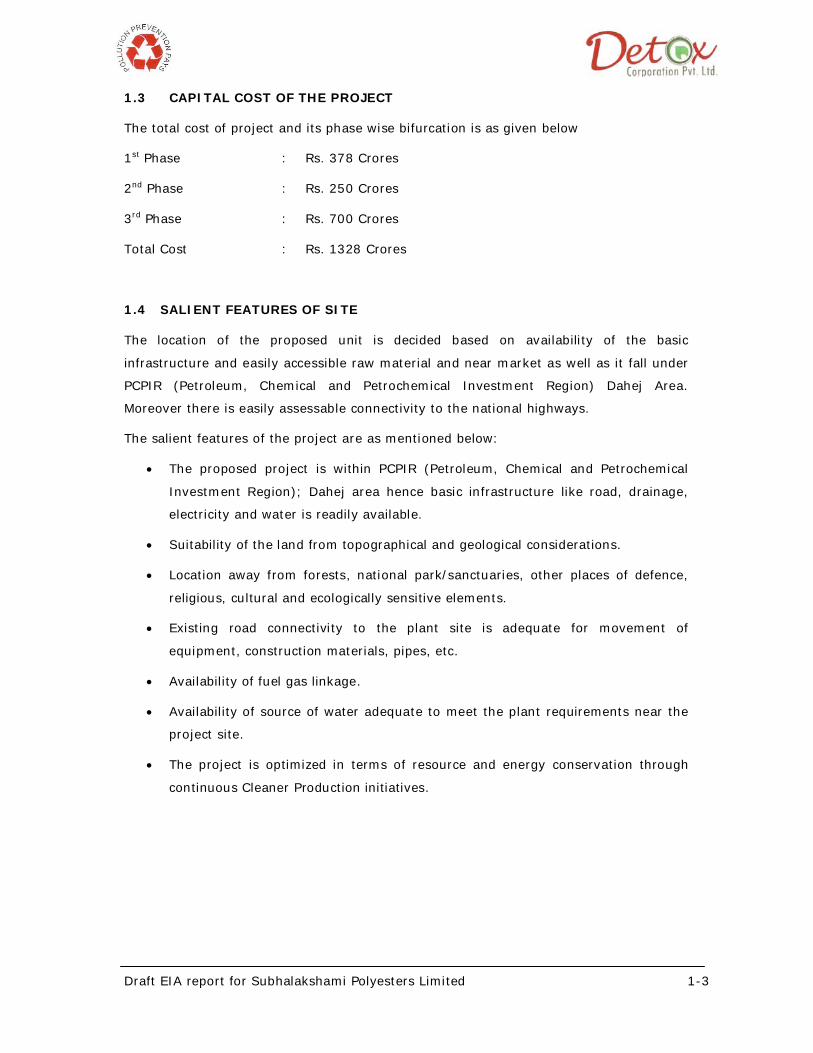
1.3 CAPITAL COST OF THE PROJECT
The total cost of project and its phase wise bifurcation is as given below
1st Phase : Rs. 378 Crores
2nd Phase : Rs. 250 Crores
3rd Phase : Rs. 700 Crores
Total Cost : Rs. 1328 Crores
1.4 SALIENT FEATURES OF SITE
The location of the proposed unit is decided based on availability of the basic
infrastructure and easily accessible raw material and near market as well as it fall under
PCPIR (Petroleum, Chemical and Petrochemical Investment Region) Dahej Area.
Moreover there is easily assessable connectivity to the national highways.
The salient features of the project are as mentioned below:
• The proposed project is within PCPIR (Petroleum, Chemical and Petrochemical
Investment Region); Dahej area hence basic infrastructure like road, drainage,
electricity and water is readily available.
• Suitability of the land from topographical and geological considerations.
• Location away from forests, national park/sanctuaries, other places of defence,
religious, cultural and ecologically sensitive elements.
• Existing road connectivity to the plant site is adequate for movement of
equipment, construction materials, pipes, etc.
• Availability of fuel gas linkage.
• Availability of source of water adequate to meet the plant requirements near the
project site.
• The project is optimized in terms of resource and energy conservation through
continuous Cleaner Production initiatives.
Draft EIA report for Subhalakshami Polyesters Limited 1-4
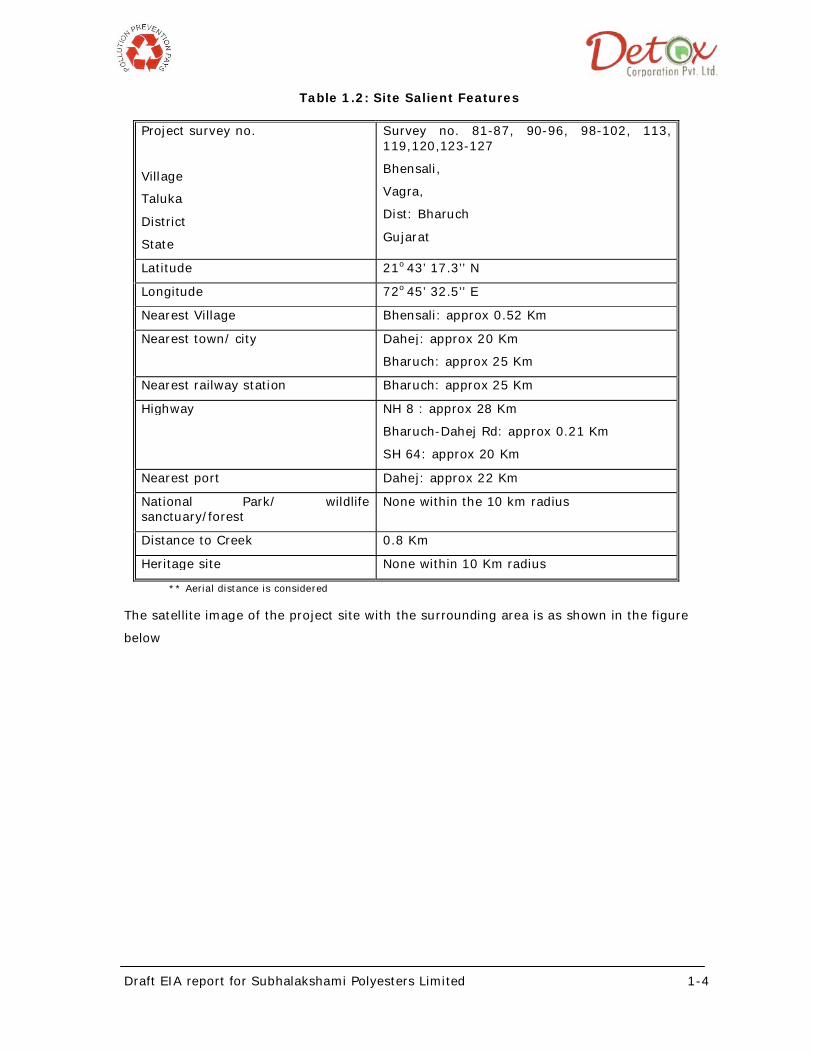
Table 1.2: Site Salient Features
Project survey no.
Village
Taluka
District
State
Survey no. 81-87, 90-96, 98-102, 113, 119,120,123-127
Bhensali,
Vagra,
Dist: Bharuch
Gujarat
Latitude 21o 43’ 17.3’’ N
Longitude 72o 45’ 32.5’’ E
Nearest Village Bhensali: approx 0.52 Km
Nearest town/ city Dahej: approx 20 Km
Bharuch: approx 25 Km
Nearest railway station Bharuch: approx 25 Km
Highway NH 8 : approx 28 Km
Bharuch-Dahej Rd: approx 0.21 Km
SH 64: approx 20 Km
Nearest port Dahej: approx 22 Km
National Park/ wildlife sanctuary/forest
None within the 10 km radius
Distance to Creek 0.8 Km
Heritage site None within 10 Km radius
** Aerial distance is considered
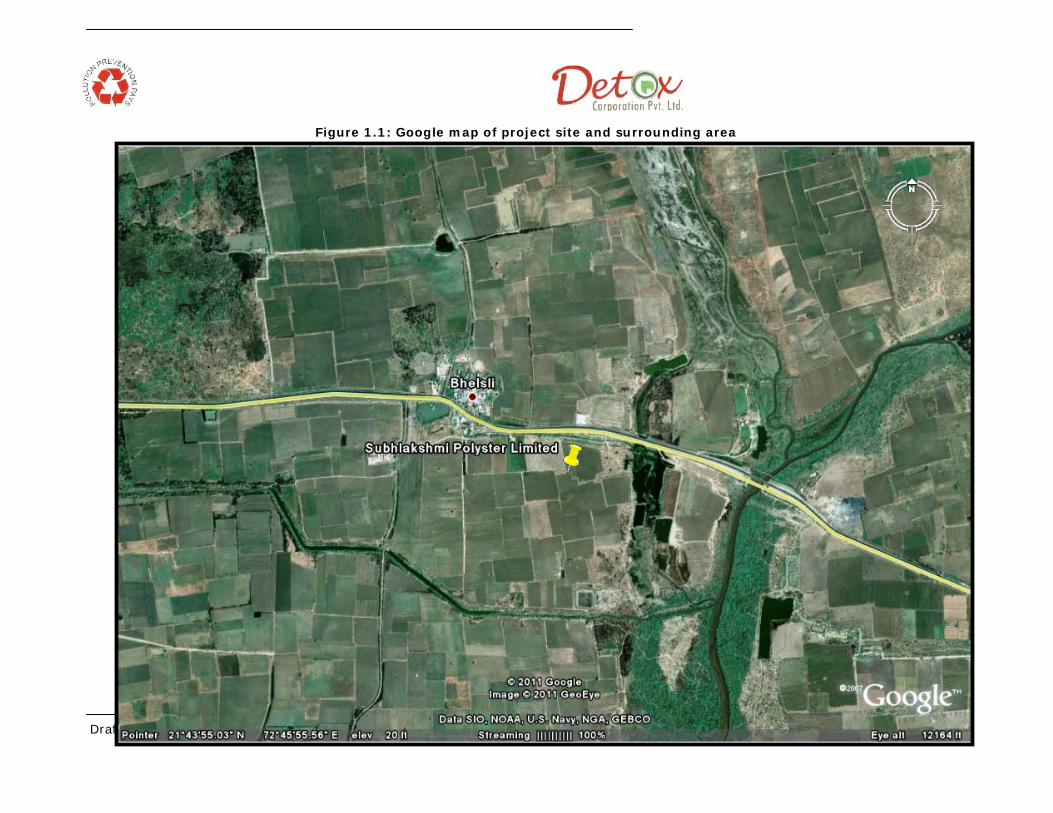
The satellite image of the project site with the surrounding area is as shown in the figure
below
Draft EIA report for Subhalakshami Polyesters Limited 1-5
Figure 1.1: Google map of project site and surrounding area

Draft EIA report for Subhalakshami Polyesters Limited 1-6
Figure 1.2: Google map of 10 Km radius
Bharuch Dahej Road
Narmada River
Draft EIA report for Subhalakshami Polyesters Limited 1-7
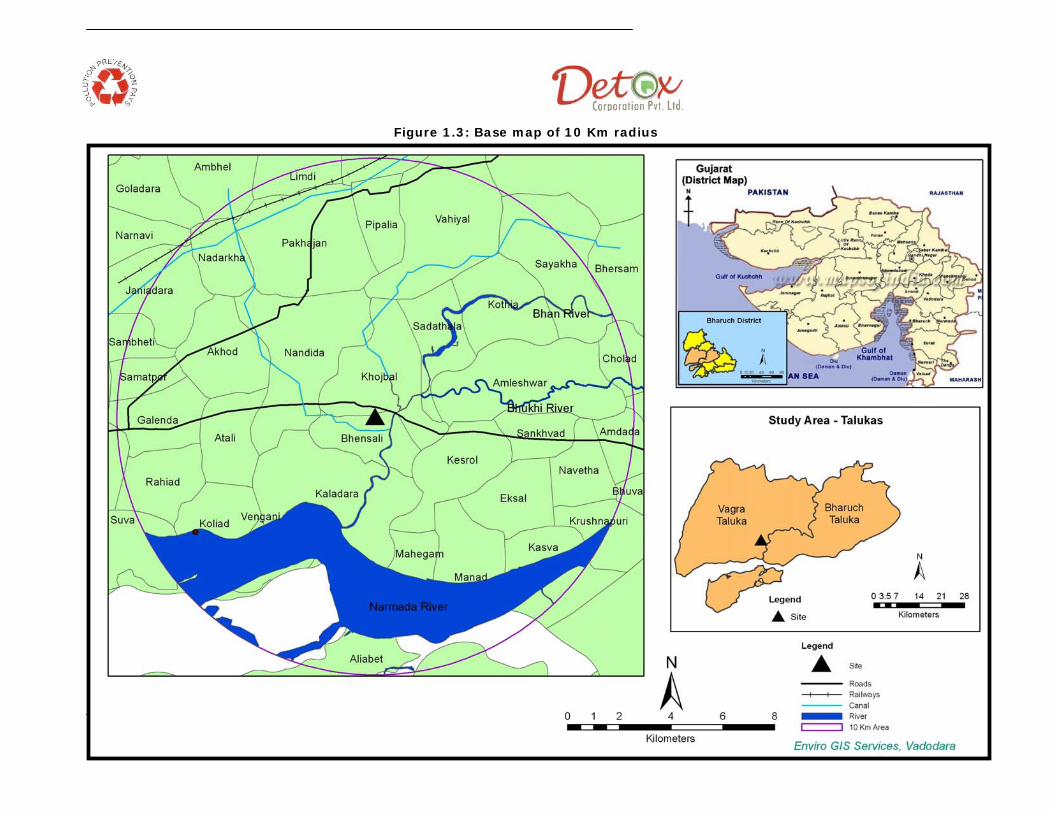
Figure 1.3: Base map of 10 Km radius
Draft EIA report for Subhalakshmi Polyesters Limited 1-8
1.5 DETAIL LAND AREAS BREAK UP
Total build up area (1st phase) : 1,32,520 sq m
Total build up area (2nd phase) : 26,828 sq m
Total build up area (3rd phase) : 43589 sq m
Total build up area for power plant : 4655 sq m
Common plot area/ open area : 37568 sq m
Green belt area : 198200 sq m
ETP : 900 sq m
Water treatment area : 480 sq m
Loading/ unloading/ storage area : 25350 sq m
Storage tank : 510 sq m
Waste storage area : 1000 sq m
Total area acquired : 471600 sq m
The detailed lay out plan with proposed entry/ exit gates and provision of continuous
peripheral open path is attached herewith as annexure 1.
1.6 PURPOSE OF THE STUDY
The proposed project i.e. Man made fibers (others) fall under category B, Sr. no. 5 (d) in
the Government of India Notification no. 1533 dated 14th September, 2006; which require
prior Environmental Clearance before starting construction, production or any other allied
activities related to the project. For getting the Environmental Clearance; it is required to
carry out the Environmental Impact Assessment (EIA) study report.
For the preparation of EIA study, Subhalakshami Polyester Limited retained M/s Detox
Corporation Private Limited, an QCI accredited consultant.
1.7 DEFINITION of EIA
Environmental Impact Assessment (EIA) is a formal process used to predict how industrial
development or construction project will affect natural resources such as water, air, land,
socioeconomic and bio ecological environment.
An EIA usually involves a sequence of steps:
Draft EIA report for Subhalakshmi Polyesters Limited 1-9
(1) Screening to decide if a project requires assessment and to what level of detail.
(2) Preliminary assessment to identify key impacts, their magnitude, significance, and
importance.
(3) Scoping to ensure the EIA focuses on key issues and to determine, where more detailed
information is needed.
(4) Implementing the main EIA study, which involves detailed investigations to predict
impacts, assess their consequences.
1.8 METHODOLOGY
Environmental Impact Assessment (EIA) studies include identification, assessment,
quantitative evaluation and prediction of possible impacts. To minimize the impact of the
project on various environmental attributes, mitigation measures are suggested for
implementation along with the project.
The methodology of this study can be schematized as detailed below:
To gather information on present environmental conditions and relevant national
environmental guidelines and EIA procedures.
Scoping of impacts.
Assessment of significant impacts.
Description of residual impacts.
Development of monitoring plans.
To inform all relevant and involved authorities regarding the impact of the project on
the environment and the proposed mitigation measures.
1.9 SCOPE OF ENVIRONMENT IMPACT ASSESSMENT (EIA)
The EIA report has been prepared as per the TOR issued by State Level Expert Appraisal
Committee vide letter no. EIA-10-2010-762-E/ 75957 dated 28th March 2011. The copy of
same is attached as annexure 8 with its compliance status.
1.10 ENVIRONMENTAL LEGISLATION APPLICABLE TO THE PROJECT
With respect to prevention and control of environmental pollution, the following Acts and
Rules of Ministry of Environment and Forest, Government of India govern the proposed
project:
• Water (Prevention and Control of Pollution) Act, 1974 as amended thereafter
Draft EIA report for Subhalakshmi Polyesters Limited 1-10
• Air (Prevention and Control of Pollution) Act, 1981 as amended thereafter
• Environment (Protection) Act, 1986 amended in 1991 and Environment (Protection)
rules,1986 and amendments thereafter
• Hazardous Waste (Management & Handling) Rules, 1989, as amended thereafter
• The Noise Pollution (Regulation and Control) Rules, 2000 and as amended thereafter
Clearance from Gujarat pollution control board:
According to section 21 of Air (Prevention& control of pollution) Act, 1981 and section 25 of
water (Prevention & Control of pollution) act, 1974, no person shall establish or operate any
activity, which can cause air or water pollution without obtaining Consent to Establish (CTE).
As per the above mentioned Air and Water act, CTE has to be obtained from Gujarat
Pollution Control Board (GPCB) in the form of No Objection Certificate (NOC) after the
submission of Air/water consent forms with requisite fees. This NOC has to be subsequently
followed by Consolidated Consent & Authorization (CC&A) before staring Production
Activities.
Environment Clearance from Environment Impact Assessment Authority (EIAA) As
Per EIA Notification (S.O. 1533) Dated 14th September 2006 & Amended
Thereafter.
In exercise of the powers conferred by sub-section (1) and clause (v) of sub-section (2) of
section 3 of the Environment (Protection) Act, 1986, and clause (d) of sub-rule (3) of rule 5
of the Environment (Protection) Rules, 1986 and in supersession of the notification number
S.O. 60 (E) dated the 27th January, 1994, the Central Government directed that on and
from the date of the publication (14th September 2009) of the EIA notification (SO 1553),
construction of new projects or activities or the expansion or modernization of existing
projects or activities listed in the Schedule shall be undertaken in any part of India only
after the prior environmental clearance from the Central Government or as the case may
be, by the State Level Environment Impact Assessment Authority, duly constituted by the
Central Government under sub-section (3) of section 3 of the said Act, in accordance with
the procedure specified hereinafter in this notification.
Other Environmental Legislation Applicable To the Project:
Any project activities will be governed by various acts and rules and regulation set by
Ministry of Environment and Forest (MoEF) at the central level and other regulatory
Draft EIA report for Subhalakshmi Polyesters Limited 1-11
agencies at the state levels. Various environmental standards and guidelines of Central
Pollution Control Board and Gujarat state pollution Control Board will also be applicable.
The Water (Prevention & Control of Pollution) Act, 1974 as amended deals
comprehensively with water issues. It empowers the Government to constitute Pollution
Control Boards to maintain the wholesomeness of national water bodies. It enables Central
and State Pollution Control Boards to prescribe standards and has provisions for monitoring
& compliance and penal provisions against the violators of the Act. It provides the permit
system i.e. “Consent” procedure to prevent and control of water pollution. The Act
empowers State Boards to issue directions to the defaulters.
Environment (Protection) Act, 1986 has a broad coverage in which ‘Environment’
includes water, air and land and there exists an interrelationship among water, air, land,
human beings and other creatures. It empowers to take measures in protecting and
improving the quality of the environment through preventing, controlling and abating
environmental pollution. The Government is authorized to set national standards for
ambient environmental quality and controlling discharges to regulate industrial locations, to
prescribe procedure for hazardous substance management and to collect and disseminate
information regarding environmental pollution. The Act provides for severe penalties for
those who fail to comply with or contravenes any provision of the Act.
The Manufacture, Storage, Import of Hazardous Chemicals Rules, 1989 and its
amendments under EPA, 1986 has identified the responsibilities of various stakeholders for
management of chemicals and containment of spillage.
The Hazardous Wastes (Management and Handling) Rules, 1989 and its subsequent
Amendment 2000 were created to provide ‘cradle-to grave’ or comprehensive guidance to
the generators, transporters and operators of disposal facilities among others, and
monitoring norms for State governments.
As per the provisions of Hazardous Waste (Management & Handling) Rules, 1989, as
amended, every occupier handling, or recycler recycling, hazardous wastes including facility
for collection, reception, treatment, transport, storage and disposal of such wastes is
required to obtain authorization from concerned State Pollution Control Board
(SPCB)/Pollution Control Committee (PCC) in UT for any of the said activities.
Draft EIA report for Subhalakshmi Polyesters Limited 1-12
MoEF notification S.O.470 (E) – 21st June, 1999 Environment (Siting for Industrial Projects)
Rules, 1999
MoEF Notification G.S.R. 37I (E) dated 17th May, 2002. In exercise of the powers conferred
by sections 6 and 25 of the Environment (Protection) Act, 1986 (29 of 1986), the Central
Government made the following rules further to amend the Environment (Protection) Rules,
1986, regarding noise limit for generator sets run with diesel
The maximum permissible sound pressure level for new diesel generator (DG)sets with
rated capacity up to 1000 KVA, manufactured on or after the 1st July,2003 shall be 75
dB(A) at 1 meter from the enclosure surface.
The diesel generator sets should be provided with integral acoustic enclosure at the
manufacturing stage itself. The user shall make efforts to bring down the noise levels due to
the DG set, outside his premises, within the ambient noise requirements by proper siting
and control measures.
S.O. 123(E). - The Noise Pollution (Regulation and Control) Rules, 2000 dated 14
February, 2000
Due to the increasing ambient noise levels in public places from various sources; industrial
activity, construction activity, generator sets, loud speakers, public address systems, music
systems, vehicular horns and other mechanical devices have deleterious effects on human
health and the psychological well being of the people, it was considered necessary to
regulate and control noise producing and generating sources with the objective of
maintaining the ambient air quality standards. In this respect following noise quality
standard was suggested.
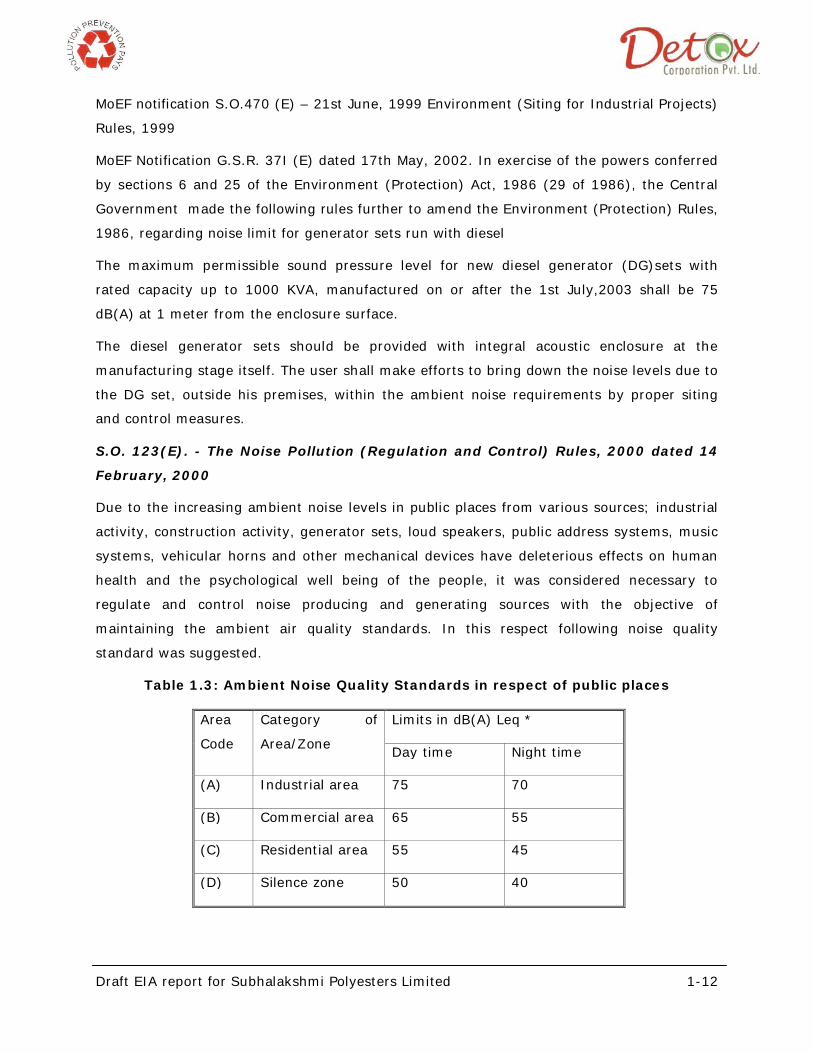
Table 1.3: Ambient Noise Quality Standards in respect of public places
Area
Code
Category of
Area/Zone
Limits in dB(A) Leq *
Day time Night time
(A) Industrial area 75 70
(B) Commercial area 65 55
(C) Residential area 55 45
(D) Silence zone 50 40
Draft EIA report for Subhalakshmi Polyesters Limited 1-13
Day time shall mean from 6.00 a.m. to 10.00 p.m. and Night time shall mean from 10.00
p.m. to 6.00 a.m.
CPCB NATIONAL AMBIENT AIR QUALITY STANDARDS
MoEF amended National Ambient Air Quality Standards by the notification G.S.R. 826(E)
dated 16th November 2009,in exercise of the power conferred by section 6 and section 25
of Environment (protection) act 1986, amended Environment (Protection) rule 1986 as
Environment (Protection) seventh Amendment rules 2009.
Table 1.4 : Ambient air Quality standard
Pollutants Time-
weighted
average
Concentration in Ambient
air
Method of measurement
Industrial
Areas
Residential,
Rural &
other Areas
Ecologically
Sensitive
Areas
Notified
Sulphur
Dioxides
(SO2)
Annual 50 µg/m3 20 µg/m3 Improved West and Geake
Method
- Ultraviolet Fluorescence
24
hours**
80 µg/m3 80 µg/m3
Oxides of
Nitrogen as
(NO2)
Annual*
Average
40 µg/m3 30 µg/m3 Jacob & Hochheiser Modified
(Na-Arsenate) Method
Gas Phase Chemi-
luminescence
24
hours**
80 µg/m3 80 µg/m3
Particulate
Matter (PM)
(size less than
10 microns or
PM10
Annual
Average*
60 µg/m3 60 µg/m3 Gravimetric
TOEM
Beta attenuation 24
hours**
100 µg/m3 100 µg/m3
Particulate
Matter (PM)
(size less than
2.5 microns or
PM 2.5
Annual
Average*
40 µg/m3 40 µg/m3 Gravimetric
TOEM
Beta attenuation 24
hours**
60 µg/m3 60 µg/m3
8 hours* 100 µg/m3 100 µg/m3 UV photometric
Draft EIA report for Subhalakshmi Polyesters Limited 1-14
Ozone 1
hours**
180 µg/m3 180 µg/m3 Chemical methods
Lead (Pb) Annual
Average*
0.5 µg/m3 0.5 µg/m3 ASS/ICP Method after
sampling using EPM 2000 or
equivalent Filter paper
ED-XRF using Teflon filter
paper
24
hours**
1.0 µg/m3 1.0 µg/m3
Ammonia
NH3
Annual
Average*
100 µg/m3 100 µg/m3 Chemi-luminescence ,
Indophenol blue method
24
hours**
400 µg/m3 400 µg/m3
Carbon
Monoxide
(CO)
8
hours**
0.2 mg/m3 0.2 mg/m3 Spectroscopy
Non dispersive infra red
(NDIR) 1 hour 0.4 mg/m3 0.4 mg/m3
* Annual Arithmetic mean of minimum 104 measurements in a year
taken twice a week 24 hourly at uniform interval.
** 24 hourly/8 hourly values should be met 98% of the time in a year.
However, 2% of the time, it may exceed but not on two consecutive
days.
1.11 STRUCTURE OF THE REPORT
This report is organized into eleven sections.
Section 2: Depicts the details of the proposed project, auxiliary and supporting facilities. It
includes technology and process description.
Section 3: Presents the baseline environmental conditions in the vicinity of the project site
and within 10 Km radius of the project. Data pertaining to the ambient air quality, surface
and ground water quality, soil quality, land-use pattern, flaura – fauna study and
socioeconomic environment has been presented.
Section 4: Presents predicted environmental impacts due to construction and operational
phases of the proposed POY and power plant. Air quality modeling results and minimum
required stack heights, water requirement - wastewater generation and solid and hazardous
waste handling requirements have been discussed. In addition to this the likely residual

Draft EIA report for Subhalakshmi Polyesters Limited 1-15
impacts on the ecological and biological environment and socioeconomic aspects have been
analyzed.
Section 5: Presents various environmental management plans. Various resources
conservation and recycling opportunities has been discussed.
Section 6: Presents the post project environment monitoring programme
Section 7: Presents project benefit of the project
Section 8: Presents quantified risks due to handling of raw material and process, if any, at
the proposed project.
Section 9: Presents Disaster management programme for the project
Section 10: Summary & Conclusion
Section 11: Disclosure of Consultants engaged with their brief resume and nature of
Consultancy rendered
Draft EIA of Shubhalakshami Polyesters Limited 2-1
Chapter-2 Project Description
The design, manufacture, inspection, testing and installation of all equipment and systems
of the proposed project shall confirm to the latest applicable editions of Indian codes and
standards. Best engineering practices shall be followed wherever the relevant standards are
not available.
2.1 PRODUCT DETAILS
The company proposes to install the plant in three phases. The detail break up of production
capacity for each phase is given in the table below
Table 2.1: Detail of Product
SR.
NO
NAME OF PRODUCT I PHASE
Addition
II PHASE
Addition
III PHASE
Addition
TOTAL
PRODUCTION
CAPACITY
1 POY/FDY/DTY(Partially
Oriented yarn/Fully drawn
Yarn/Texturising yarn)
146000
MT/annum
127750
MT/annum
273500
MT/annum
547250
MT/annum
2 Intermediate
Products(Polyester chips)
*127750
MT/annum
-- -- 127750
MT/annum
3 Gas Engine based captive
power plant
10.68 MWH
5.34
MWH
16.02 MWH 32.04 MWH
* Intermediate Product chip manufactured in 1st phase will be reused as raw material for production of
POY in 2nd Phase.
The major product will be Polyester Filament Yarn, FDY and DTY in all the three phases.
Polyster chips produced as intermediate product in the first phase shall be later used as raw
material for production of POY in second stage.
In order to meet the power requirement of the unit the project proponents have also
proposed to install captive gas based power plant with total capacity of 32.04 MW. Power
plant shall also be installed in three phases. The phase wise installation capacity is given in
table 2.1.
Draft EIA of Shubhalakshami Polyesters Limited 2-2
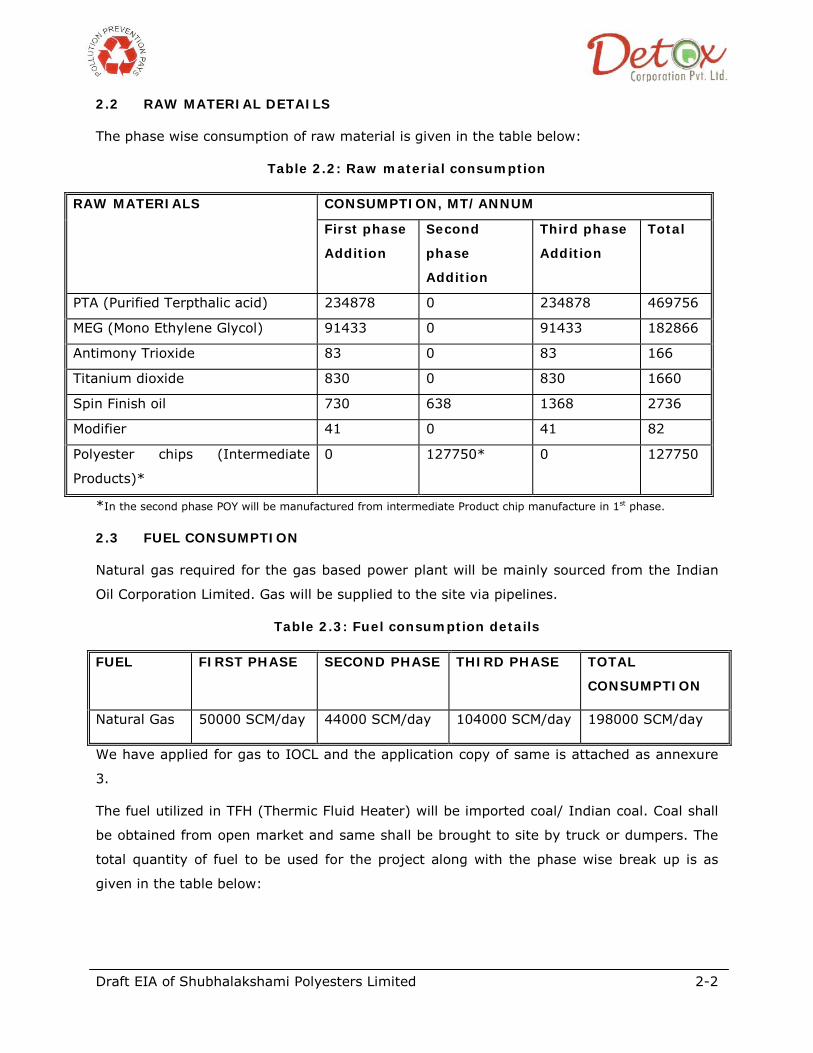
2.2 RAW MATERIAL DETAILS
The phase wise consumption of raw material is given in the table below:
Table 2.2: Raw material consumption
RAW MATERIALS CONSUMPTION, MT/ANNUM
First phase
Addition
Second
phase
Addition
Third phase
Addition
Total
PTA (Purified Terpthalic acid) 234878 0 234878 469756
MEG (Mono Ethylene Glycol) 91433 0 91433 182866
Antimony Trioxide 83 0 83 166
Titanium dioxide 830 0 830 1660
Spin Finish oil 730 638 1368 2736
Modifier 41 0 41 82
Polyester chips (Intermediate
Products)*
0 127750* 0 127750
*In the second phase POY will be manufactured from intermediate Product chip manufacture in 1st phase.
2.3 FUEL CONSUMPTION
Natural gas required for the gas based power plant will be mainly sourced from the Indian
Oil Corporation Limited. Gas will be supplied to the site via pipelines.
Table 2.3: Fuel consumption details
FUEL FIRST PHASE SECOND PHASE THIRD PHASE TOTAL
CONSUMPTION
Natural Gas 50000 SCM/day 44000 SCM/day 104000 SCM/day 198000 SCM/day
We have applied for gas to IOCL and the application copy of same is attached as annexure
3.
The fuel utilized in TFH (Thermic Fluid Heater) will be imported coal/ Indian coal. Coal shall
be obtained from open market and same shall be brought to site by truck or dumpers. The
total quantity of fuel to be used for the project along with the phase wise break up is as
given in the table below:

Draft EIA of Shubhalakshami Polyesters Limited 2-3
Table 2.4: Fuel consumption details
FUEL FIRST PHASE SECOND PHASE THIRD PHASE TOTAL
CONSUMPTION
Coal 100 MT/DAY --- 100 MT/DAY 200 MT/day
2.4 FUEL ANALYSIS DETAILS
The detailed analysis report of fuel is as given below:
Table 2.5: Analysis of Natural Gas Used for power generation
Lower Heating Value 8997.19 kcal/Sm3
Compressibility Factor 0.9776
COMPOSITION (% by volume)
Methane CH4 89.48
Ethane C2H6 7.0
Propane C3H8 2.49
i-Butane C4H10 0.32
n-Butane C4H10 0.44
i-Pentane C5H12 0.01
n-Pentane C5H124 36.05
Hexanes C6H14 0.17
Carbon Dioxide CO2 0.25
Nitrogen N2 0.22
Table 2.6: Analysis of coal
Sr. No Parameter
Indian Coal Imported Coal
1. Total moisture 10-15% 32%
2. Inherent moisture 5.3% 15%
3. Ash 30 % 10 %
4. Volatile matter 20-23% 40%
5. Fixed carbon 20-30R 41%
6. Sulphur 0.5 % 0.7%
7. GCV 3800 kcal/kg 5400 kcal/kg
Draft EIA of Shubhalakshami Polyesters Limited 2-4
8. Carbon 32-40 % 53.4%
9. Hydrogen 2.0-2.5 % 6.2%
10. Oxygen 5.0-8.5 % 35.7%
11. Nitrogen 0.6-0.9 % 0.7%
2.5 MANUFACTURING PROCESS – POY/FDY/ POLYSTER CHIPS
There are total 4 reactors to complete the process
• Estrification Reactor-1
• Estrification Reactor-2
• Prepoly condensation reactor-1
• Final poly condensation reactor-1
In the first step PTA and MEG is mixed in the reactor and slurry is formed. This slurry is fed
in the estrification reactor 1 through pumps.
Estrification Reactor-1
Slurry is fed in this reactor and monomer formation takes place. The temperature during
this process is maintained between 260 to 266 deg C. The monomer formed in reactor 1 is
further fed into reactor 2. The major bye product of this stage is waste water which is send
to ETP for further treatment.
Estrification Reactor-2
In this reactor the temperature is maintained between 265 to 269 deg C. Water is
generated as bye product which is send to ETP. After complete monomer formation in this
reactor the same is transferred to pre poly condensation reactor.
Prepoly condensation reactor-1
Monomer is fed into prepolymerization reactor wherein temperature is maintained between
272-279 deg C. Here 50% polymerization takes place and the product is fed to the final
polycondensation reactor wherein complete polymerization is achieved. Bye product of this
stage is ethylene glycol which is reused after purification.
Final poly condensation reactor-1
50 % converted polymer is fed into reactor from polycondensation reactor-1 to make it 100
% polymer. Final product is obtained at temperature between 280-284 deg C. This final
Draft EIA of Shubhalakshami Polyesters Limited 2-5
product is later cooled and partially converted to chips and the rest are transferred to yarn
plant. By product of this stage is ethylene glycol and it is reused after purification.
Polymers formed are than transferred to the spinning beam of POY plant through booster
pumps. Here polymers are converted to yarn through spinnerets at required pressure
through various gear pumps. The yarn formed is then quenched with cool air and oil
applied.
Yarn is then transferred through interflow tubes and godets on high speed winders. This is
final product and packed on pallets and boxes.
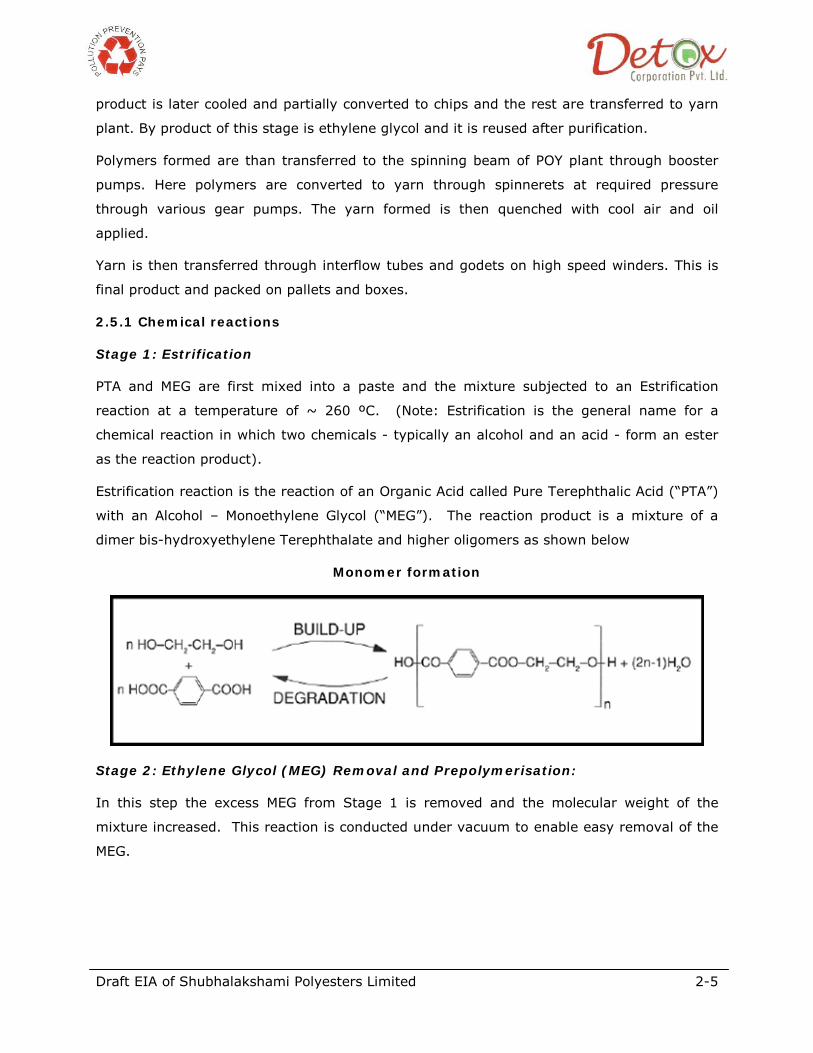
2.5.1 Chemical reactions
Stage 1: Estrification
PTA and MEG are first mixed into a paste and the mixture subjected to an Estrification
reaction at a temperature of ~ 260 ºC. (Note: Estrification is the general name for a
chemical reaction in which two chemicals - typically an alcohol and an acid - form an ester
as the reaction product).
Estrification reaction is the reaction of an Organic Acid called Pure Terephthalic Acid (“PTA”)
with an Alcohol – Monoethylene Glycol (“MEG”). The reaction product is a mixture of a
dimer bis-hydroxyethylene Terephthalate and higher oligomers as shown below
Monomer formation
Stage 2: Ethylene Glycol (MEG) Removal and Prepolymerisation:
In this step the excess MEG from Stage 1 is removed and the molecular weight of the
mixture increased. This reaction is conducted under vacuum to enable easy removal of the
MEG.
Draft EIA of Shubhalakshami Polyesters Limited 2-6
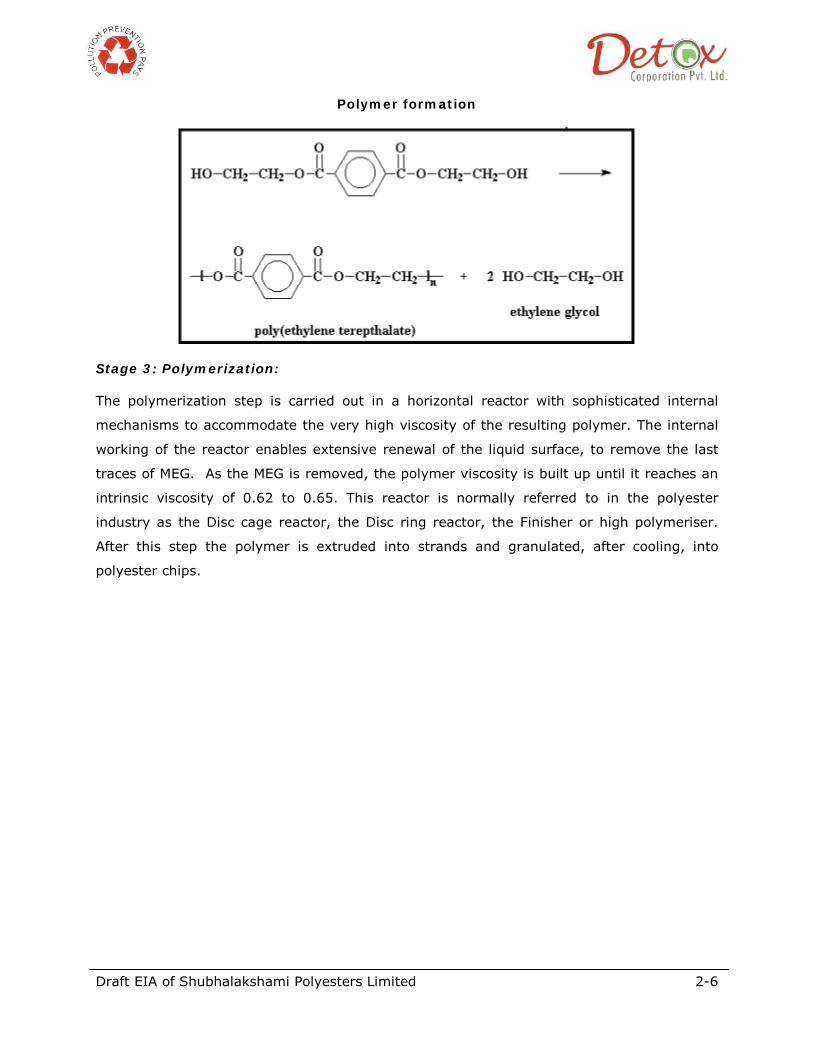
Polymer formation
Stage 3: Polymerization:
The polymerization step is carried out in a horizontal reactor with sophisticated internal
mechanisms to accommodate the very high viscosity of the resulting polymer. The internal
working of the reactor enables extensive renewal of the liquid surface, to remove the last
traces of MEG. As the MEG is removed, the polymer viscosity is built up until it reaches an
intrinsic viscosity of 0.62 to 0.65. This reactor is normally referred to in the polyester
industry as the Disc cage reactor, the Disc ring reactor, the Finisher or high polymeriser.
After this step the polymer is extruded into strands and granulated, after cooling, into
polyester chips.
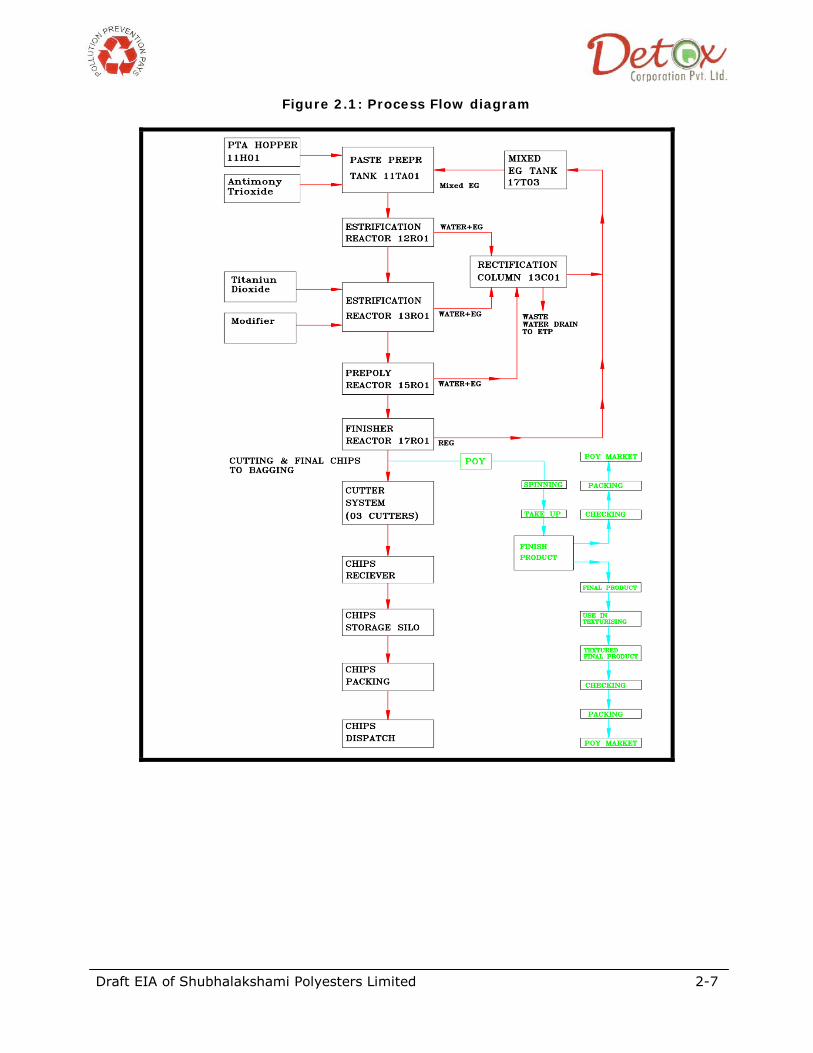
Draft EIA of Shubhalakshami Polyesters Limited 2-7
Figure 2.1: Process Flow diagram
Draft EIA of Shubhalakshami Polyesters Limited 2-8
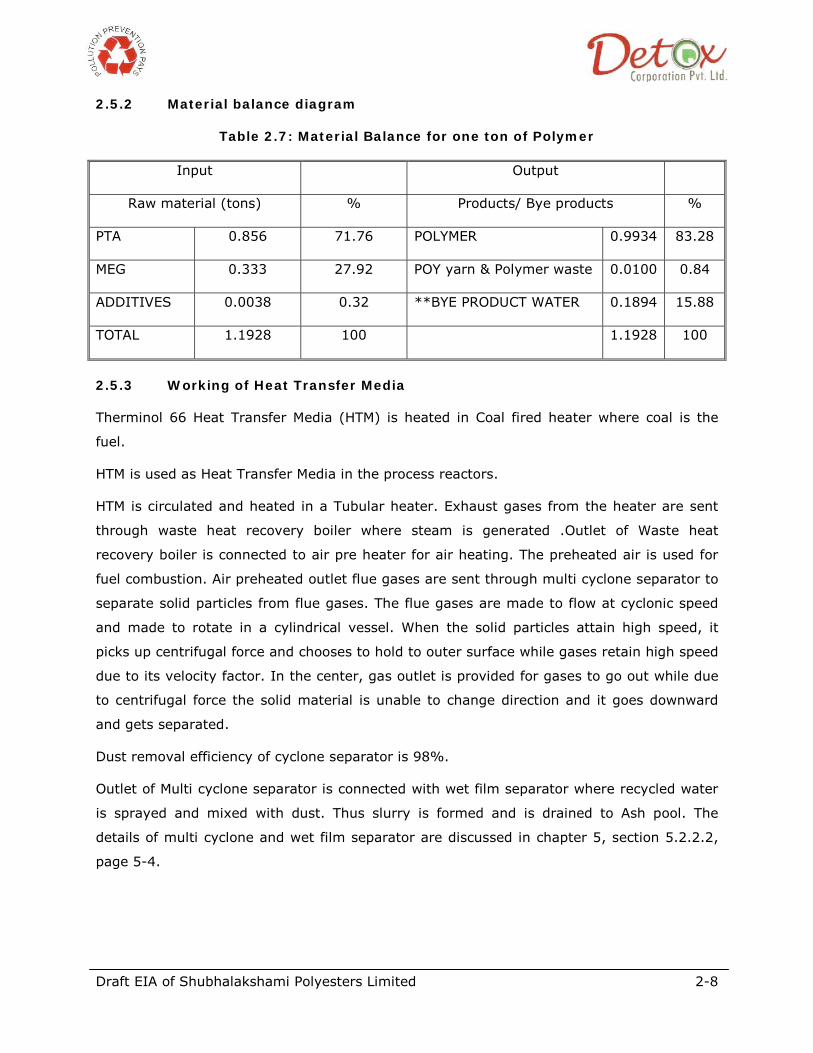
2.5.2 Material balance diagram
Table 2.7: Material Balance for one ton of Polymer
Input Output
Raw material (tons) % Products/ Bye products %
PTA 0.856 71.76 POLYMER 0.9934 83.28
MEG 0.333 27.92 POY yarn & Polymer waste 0.0100 0.84
ADDITIVES 0.0038 0.32 **BYE PRODUCT WATER 0.1894 15.88
TOTAL 1.1928 100 1.1928 100
2.5.3 Working of Heat Transfer Media
Therminol 66 Heat Transfer Media (HTM) is heated in Coal fired heater where coal is the
fuel.
HTM is used as Heat Transfer Media in the process reactors.
HTM is circulated and heated in a Tubular heater. Exhaust gases from the heater are sent
through waste heat recovery boiler where steam is generated .Outlet of Waste heat
recovery boiler is connected to air pre heater for air heating. The preheated air is used for
fuel combustion. Air preheated outlet flue gases are sent through multi cyclone separator to
separate solid particles from flue gases. The flue gases are made to flow at cyclonic speed
and made to rotate in a cylindrical vessel. When the solid particles attain high speed, it
picks up centrifugal force and chooses to hold to outer surface while gases retain high speed
due to its velocity factor. In the center, gas outlet is provided for gases to go out while due
to centrifugal force the solid material is unable to change direction and it goes downward
and gets separated.
Dust removal efficiency of cyclone separator is 98%.
Outlet of Multi cyclone separator is connected with wet film separator where recycled water
is sprayed and mixed with dust. Thus slurry is formed and is drained to Ash pool. The
details of multi cyclone and wet film separator are discussed in chapter 5, section 5.2.2.2,
page 5-4.
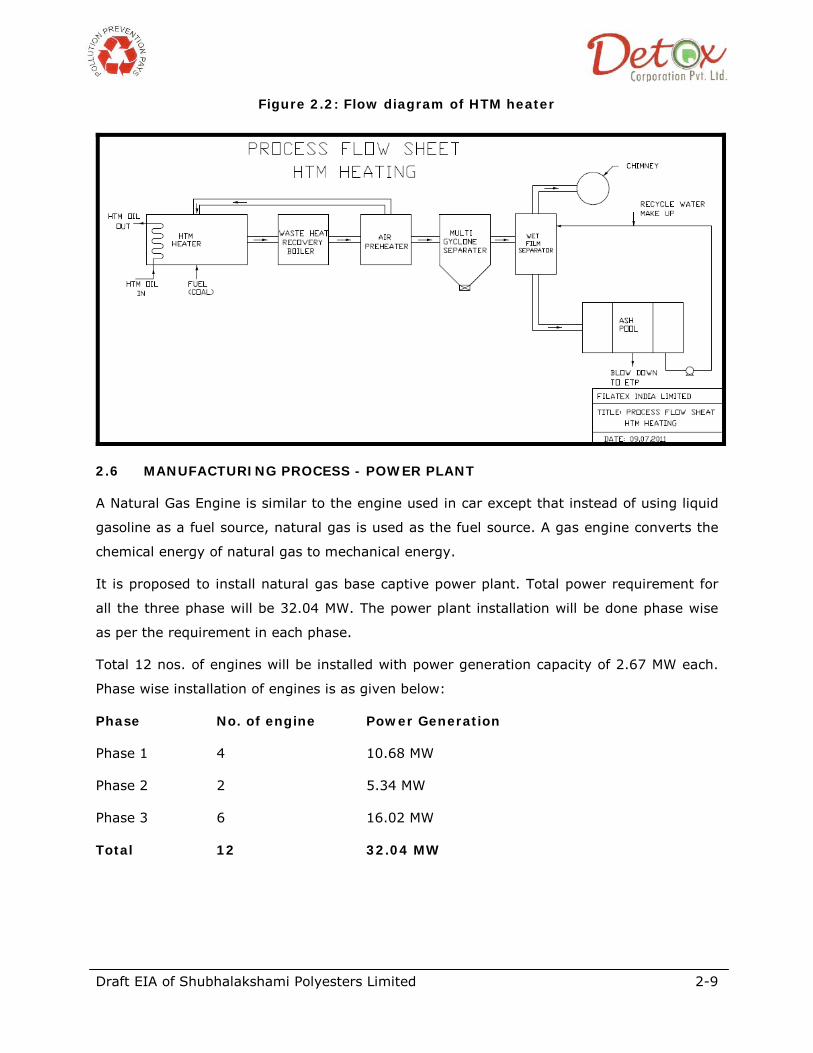
Draft EIA of Shubhalakshami Polyesters Limited 2-9
Figure 2.2: Flow diagram of HTM heater
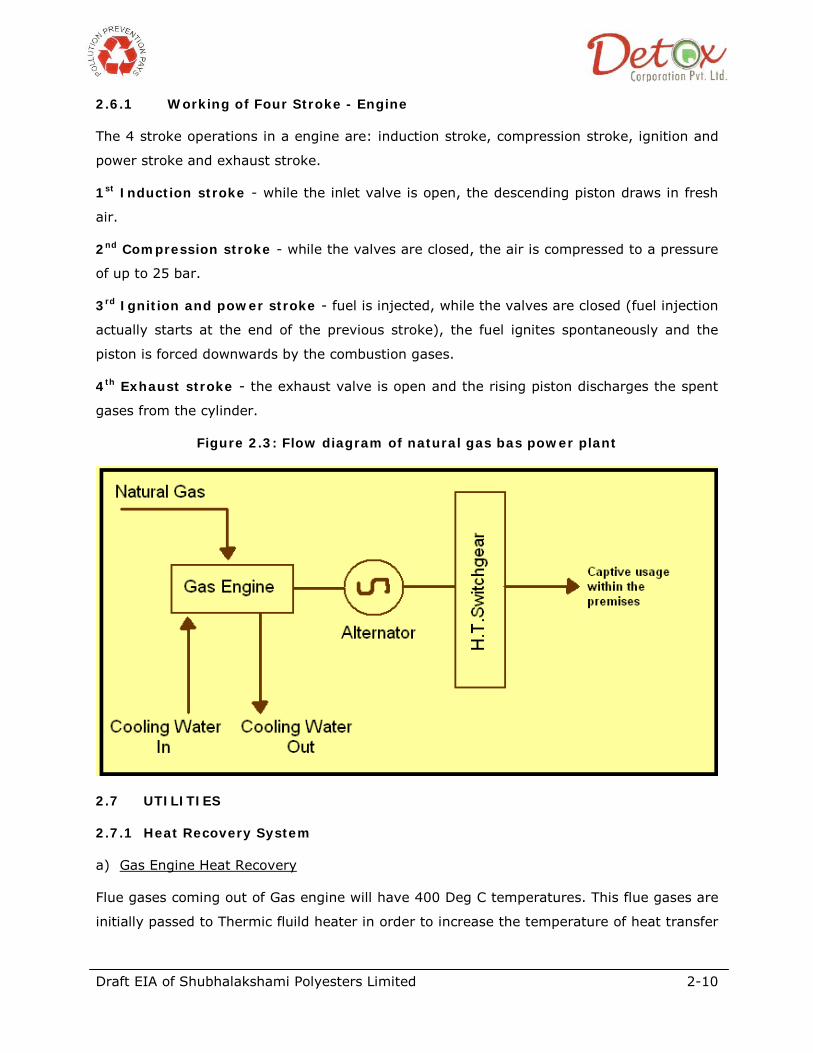
2.6 MANUFACTURING PROCESS - POWER PLANT
A Natural Gas Engine is similar to the engine used in car except that instead of using liquid
gasoline as a fuel source, natural gas is used as the fuel source. A gas engine converts the
chemical energy of natural gas to mechanical energy.
It is proposed to install natural gas base captive power plant. Total power requirement for
all the three phase will be 32.04 MW. The power plant installation will be done phase wise
as per the requirement in each phase.
Total 12 nos. of engines will be installed with power generation capacity of 2.67 MW each.
Phase wise installation of engines is as given below:
Phase No. of engine Power Generation
Phase 1 4 10.68 MW
Phase 2 2 5.34 MW
Phase 3 6 16.02 MW
Total 12 32.04 MW
Draft EIA of Shubhalakshami Polyesters Limited 2-10
2.6.1 Working of Four Stroke - Engine
The 4 stroke operations in a engine are: induction stroke, compression stroke, ignition and
power stroke and exhaust stroke.
1st Induction stroke - while the inlet valve is open, the descending piston draws in fresh
air.
2nd Compression stroke - while the valves are closed, the air is compressed to a pressure
of up to 25 bar.
3rd Ignition and power stroke - fuel is injected, while the valves are closed (fuel injection
actually starts at the end of the previous stroke), the fuel ignites spontaneously and the
piston is forced downwards by the combustion gases.
4th Exhaust stroke - the exhaust valve is open and the rising piston discharges the spent
gases from the cylinder.
Figure 2.3: Flow diagram of natural gas bas power plant
2.7 UTILITIES
2.7.1 Heat Recovery System
a) Gas Engine Heat Recovery
Flue gases coming out of Gas engine will have 400 Deg C temperatures. This flue gases are
initially passed to Thermic fluild heater in order to increase the temperature of heat transfer
Draft EIA of Shubhalakshami Polyesters Limited 2-11
media. The temperature in heating media in the thermic fluid heater is raised from 295 Dec
C to 320 Deg C.
The flue gas from the Thermic fluid heater shall be diverted to heat recovery system. The
flue gases from the heat recovery system shall be passed to Vapor adsorption chiller in
order to reduce the temperature to 150 Deg C. The flue gases emitted in the atmosphere
shall be maintained at 150 deg C.
b) Vam Chillers at Main Plant
Exhaust steam from process column is emitted with the flow of 12000 kg/hr and
temperature of 100 deg C. While passing this steam through the VAM chiller heat recovery
of 6 m kcal is possible
c) Thermic Fluid Heater and Recovery
In case of Thermic fluid heater process that is close loop circulation, Heat transfer media is
heated to 325 Deg C in coal fired heater and then circulated to main plants for heating.
Return temperature of this heat transfer media is about 295 Deg C and then return to
heater through Heat Recovery Unit.
Flue gases with temperature around 360 Deg C are emitted. The same flue gases are
passed through waste Heat Recovery boiler to generate the steam and same steam will be
used in manufacturing process. The flue gases from the heat recovery system shall be
passed to Vapor adsorption chiller in order to reduce the temperature to 150 Deg C.
The flue gases temperature release from the stack will be maintained at 150 Deg C.
Through this process heat recovery of 1.06 m kcal is possible
d) Recovery through Stripper Column
Exhaust steam from STRIPPER column is emitted with the flow of 1000 kg/hr and
temperature of 100 deg c. The same is passed through the HTM Heater and heat recovery
of 0.33 m kcal is done.
2.7.2 Compressor
It is proposed to install three type of compressor low, medium and high having pressure of
4, 7 and 10 kg/cm2 with flow rate of 18,000 Nm3/h, 3500 Nm3/h and 2700 Nm3/h
respectively. Each phase will have installation of single compressor and accordingly three
compressors will be installed in total three phases.
Draft EIA of Shubhalakshami Polyesters Limited 2-12
2.7.3 Nitrogen plant
It is proposed to install one no. of Nitrogen plant having capacity of 150 m3.
The Compressed and purified Process air will flow through an absorber vessel filled with
carbon molecular sieve (CMS). When passing the absorber vessel from the bottom to the
top, oxygen molecules are adsorbed on the surface of the CMS and nitrogen enriched gas
leaves the absorber vessel, this product gas is led into a buffer tank. After a certain time the
CMS in absorber vessel is saturated with oxygen and needs to be regenerated. For
regeneration the adsorption cycle is stopped and the pressure in the absorber vessel is
released. To guarantee a continuous nitrogen supply, a second absorber vessel is utilized.
While one absorber is in regeneration or so-called desorption mode, the second vessel is in
adsorption mode. Since adsorption and desorption are achieved by alternating pressures in
the absorber vessels, this process is called Pressure Swing Adsorption (PSA). The
System Two absorber vessels are used to guarantee a continuous nitrogen supply.
2.7.4 Water Treatment plant
It is proposed to install the softener plant with capacity of 88 m3/h in 1st and 3rd phase. The
same shall be used for cooling tower.
Also proposed to installed DM plant of 6 m3/h capacity in 1st and 3rd phase to fulfill the
requirement of boiler makeup and process water for cutting and preparation of Spin oil
solution.
2.7.5 Effluent Treatment Plant
The waste water generated from the process, spin oil reject and due to the chemical
reaction will be treated in effluent treatment plant of 250 m3/ day capacity in 1st and 3rd
phase. Total two units of ETP shall be installed. The treatment scheme of the effluent
treatment plan is as given below:
• The raw wastewater shall enter in to the equilization tank which is provided with air
purging system to keep the particulate matter in suspension.
• Effluent Transfer Pump shall transfer the effluent from Equalization Tank to Upflow
Anaerobic Sludge Blanket Reactor (UASBR)
• From the UASBR supernatant shall be transferred to the first stage Aeration tank for
further removal of organic load followed with the first stage secondary settling tank.
• Supernatant from the secondary settling tank shall be transferred to secondary stage
aeration tank followed with the Secondary stage settling tank.
Draft EIA of Shubhalakshami Polyesters Limited 2-13
• Supernatant from the Secondary Settling Tank shall be transferred to the Flash Mixer
– 1 where lime dosing takes place and then effluent transferred to Flash mixer -2
where ferrous Sulphate dosing will be done.
• From the Flash mixture the effluent shall be transferred to the flocculation chamber
where gradual dosing of polyelectrolyte shall be done. This mixture is then
transferred to Primary Settling Tank.
• Sludge from the first stage and second stage secondary settling tank shall be
transferred to Sludge drying bed.
• From the Primary Settling Tank Supernetent transferred to the intermediate
collection
• Tank and further treated through Pressure Sand Filter and Activated Carbon Filter.
• Thereafter treated water to be stored in Treated Water Storage Tank for further
utilization of different purposes.
• The sludge from Primary Settling Tank, further dewatered through filter press bed
and after that sludge shall be disposed off to secured land fill site.
• Leachate from the filter Beds shall be collected and directed to equalization tank for
further treatment.
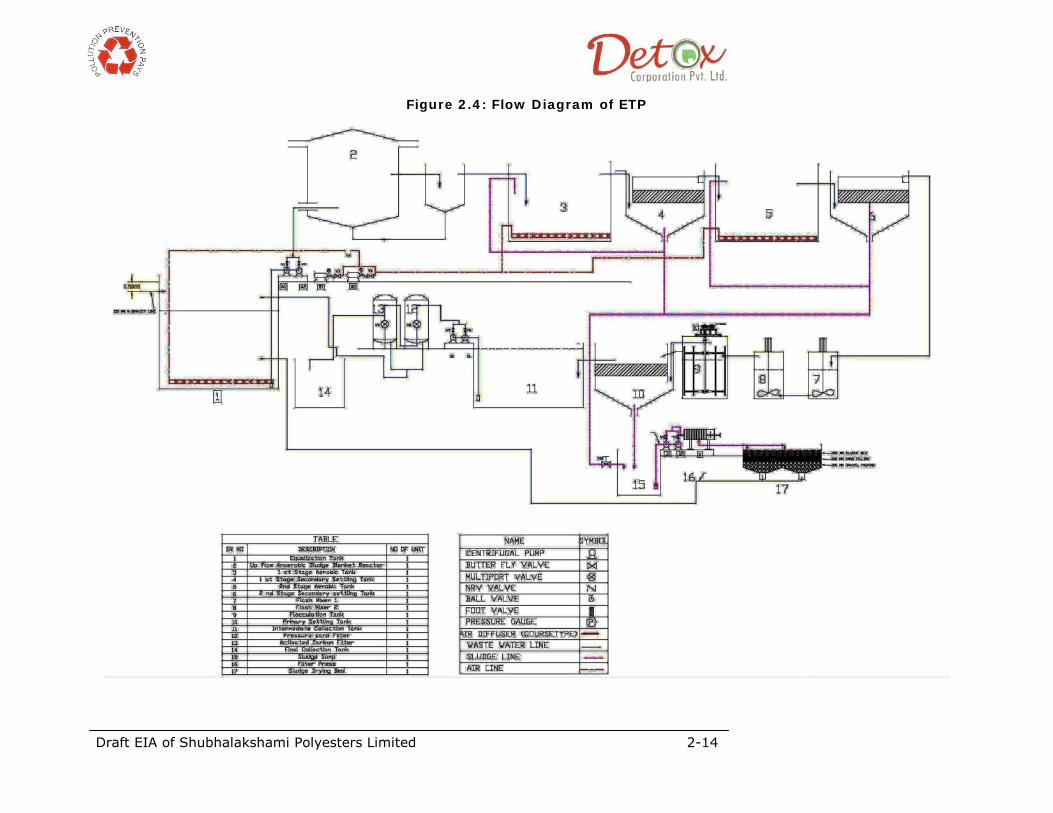
Draft EIA of Shubhalakshami Polyesters Limited 2-14
Figure 2.4: Flow Diagram of ETP
Draft EIA of Shubhalakshami Polyesters Limited 2-15
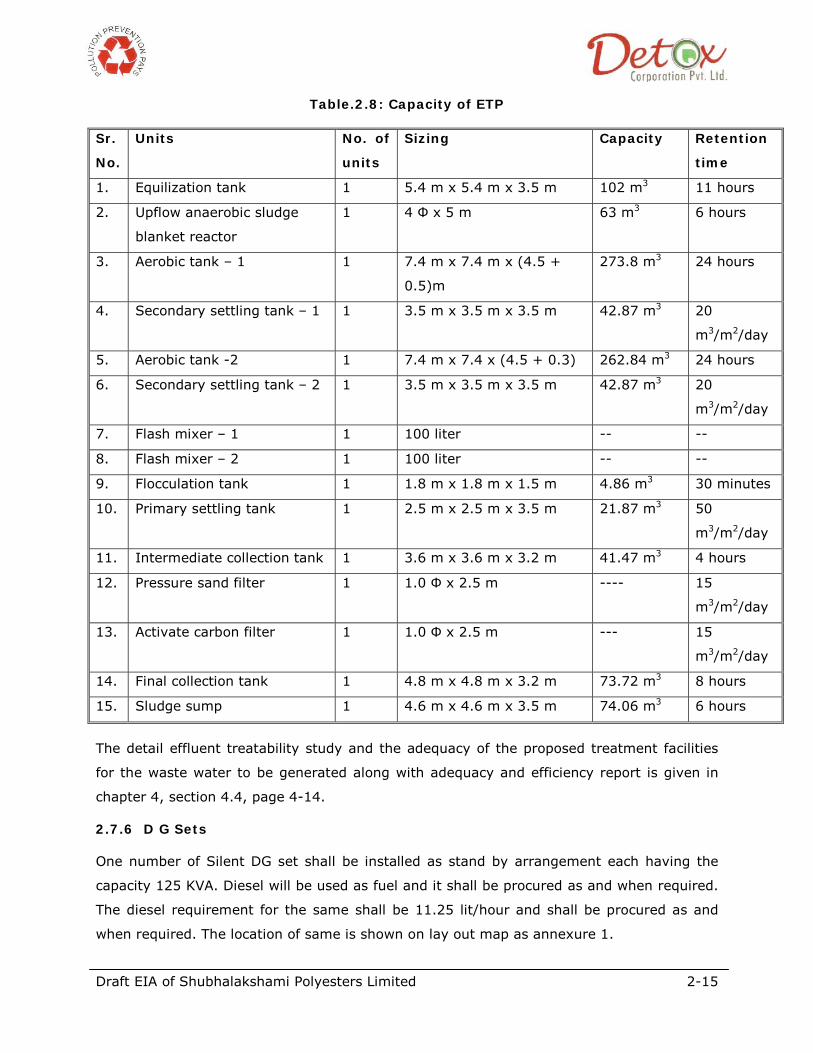
Table.2.8: Capacity of ETP Sr.
No.
Units No. of
units
Sizing Capacity Retention
time
1. Equilization tank 1 5.4 m x 5.4 m x 3.5 m 102 m3 11 hours
2. Upflow anaerobic sludge
blanket reactor
1 4 Φ x 5 m 63 m3 6 hours
3. Aerobic tank – 1 1 7.4 m x 7.4 m x (4.5 +
0.5)m
273.8 m3 24 hours
4. Secondary settling tank – 1 1 3.5 m x 3.5 m x 3.5 m 42.87 m3 20
m3/m2/day
5. Aerobic tank -2 1 7.4 m x 7.4 x (4.5 + 0.3) 262.84 m3 24 hours
6. Secondary settling tank – 2 1 3.5 m x 3.5 m x 3.5 m 42.87 m3 20
m3/m2/day
7. Flash mixer – 1 1 100 liter -- --
8. Flash mixer – 2 1 100 liter -- --
9. Flocculation tank 1 1.8 m x 1.8 m x 1.5 m 4.86 m3 30 minutes
10. Primary settling tank 1 2.5 m x 2.5 m x 3.5 m 21.87 m3 50
m3/m2/day
11. Intermediate collection tank 1 3.6 m x 3.6 m x 3.2 m 41.47 m3 4 hours
12. Pressure sand filter 1 1.0 Φ x 2.5 m ---- 15
m3/m2/day
13. Activate carbon filter 1 1.0 Φ x 2.5 m --- 15
m3/m2/day
14. Final collection tank 1 4.8 m x 4.8 m x 3.2 m 73.72 m3 8 hours
15. Sludge sump 1 4.6 m x 4.6 m x 3.5 m 74.06 m3 6 hours
The detail effluent treatability study and the adequacy of the proposed treatment facilities
for the waste water to be generated along with adequacy and efficiency report is given in
chapter 4, section 4.4, page 4-14.
2.7.6 D G Sets
One number of Silent DG set shall be installed as stand by arrangement each having the
capacity 125 KVA. Diesel will be used as fuel and it shall be procured as and when required.
The diesel requirement for the same shall be 11.25 lit/hour and shall be procured as and
when required. The location of same is shown on lay out map as annexure 1.

Draft EIA for Shubhalakshami Polyesters Limited 3-1
Chapter-3 Baseline Environment
The pre project assessment of environmental quality in the vicinity of a site identified for
the proposed industrial development serves as the baseline data and also helps in the
identification of impacts corresponding to project activities. The baseline environmental
quality is the assessement through field studies within the impact zone (10 km radius) for
various environmental parameters, viz. Ambient Air, Noise level, Surface and ground Water
quality, Land environment, Biological environment and Socio-economic aspects. The present
Rapid Environmental Impact Assessment study is based on pre-project environmental
quality monitored during winter season within 10 km around the proposed site. The field
surveys of all environmental components were accomplished during 1st December 2010 to
28 February 2011
3.1 AIR ENVIRONMENT
The quality of air depends on the meteorological conditions, the back ground concentration
of the pollutants and the nearby emission source. Based on the existing air environment,
the impact due to the upcoming project is quantified by the help of the mathematical model
(ISC-ST3).
3.1.1 Design Network for Ambient Air Quality Monitoring Stations
The following criterion was taken into account while selcting ambient air quality monitoring
network:
• Air monitoring network is identified by considering the predominant wind direction
and wind speed using the meteorological data obtained from the continous weather
monitoring station located near IPCL, Dahej,
• Density of population within the region
• Residential and sensitive areas
Meteorological data at the project site during study period is an essential requirement for
proper interpretation of baseline air quality status. The same data is also useful in prediction
of impacts through mathematical modelling.
Draft EIA for Shubhalakshami Polyesters Limited 3-2
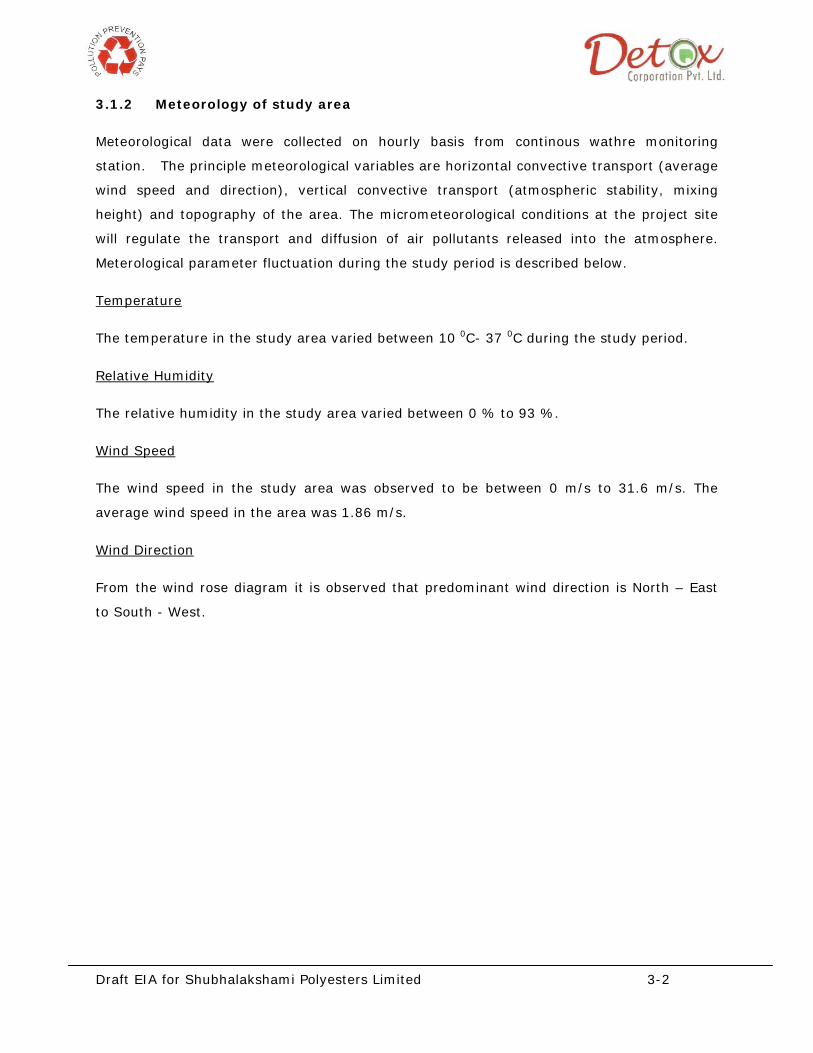
3.1.2 Meteorology of study area
Meteorological data were collected on hourly basis from continous wathre monitoring
station. The principle meteorological variables are horizontal convective transport (average
wind speed and direction), vertical convective transport (atmospheric stability, mixing
height) and topography of the area. The micrometeorological conditions at the project site
will regulate the transport and diffusion of air pollutants released into the atmosphere.
Meterological parameter fluctuation during the study period is described below.
Temperature
The temperature in the study area varied between 10 0C- 37 0C during the study period.
Relative Humidity
The relative humidity in the study area varied between 0 % to 93 %.
Wind Speed
The wind speed in the study area was observed to be between 0 m/s to 31.6 m/s. The
average wind speed in the area was 1.86 m/s.
Wind Direction
From the wind rose diagram it is observed that predominant wind direction is North – East
to South - West.
Draft EIA for Shubhalakshami Polyesters Limited 3-3
Figure 3.1: Wind Rose Diagram
Draft EIA for Shubhalakshami Polyesters Limited 3-4
3.1.3 Existing Air quality
Ambient air quality was monitored twice in week for 24 hourly average basis as per
guidelines of CPCB and NAAQS. The conventional and project specific parameters such as
PM10, PM2.5, Sulphur Dioxide (SO2), oxides of nitrogen (NOx), were monitored at different
monitoring locations within 10 Km radius from the project site during the study period.
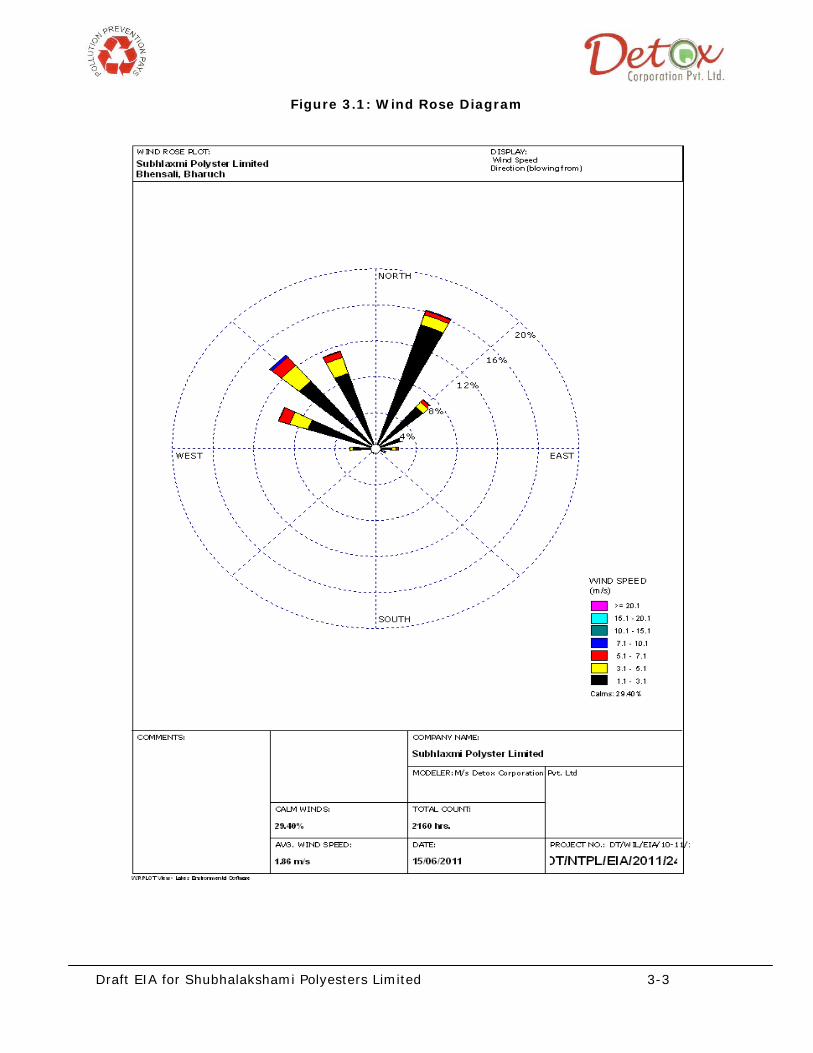
3.1.3.1 Air monitoring locations
Total of 6 locations were considered for study of air quality within 10 Km radius from the
project site. Based on the prevailing wind direction and as per the guidelines of MoEF and
CPCB two upwind sites and three downwind location with respect to the project sites were
monitored for air quality apart from the project site itself. The details of air monitoring
locations are enlisted in the table 3.1 and also depicted in Figure no. 3.2 below.
Figure 3.2: Air sampling locations
AAQ -1
AAQ -6 AAQ -5
AAQ -4
AAQ -3
AAQ -2
Draft EIA for Shubhalakshami Polyesters Limited 3-5
The distance and direction of monitoring station with respect to project site is given in the
table 3.1 below.
Table 3.1: Air monitoring locations
Village Sampling code Direction Distance Latitude Longitude
Project Site AAQ 1 -- -- 21° 43’ 29.4” N 72° 45’ 15.2” E
Atali AAQ 2 West 5.29 Km 21° 43’ 20.6” N 72° 42’ 17.7” E
Kaladara AAQ 3 South West 7.67 Km 21° 41’ 26.8” N 72° 44’ 34.4” E
Koliyad AAQ 4 South West 7.10 Km 21° 41’ 37.9” N 72° 41’ 35.1” E
Khojbal AAQ 5 North West 2.02 Km 21° 44’ 27.6” N 72° 45’ 5.8” E
Amleshwar AAQ 6 North West 7.16 Km 21° 44’ 18” N 72° 49’ 13.1” E
3.1.3.2 Method of Analysis
The different analysis method used for different pollutants with the minimum detection limit
is given in the table below.
Table 3.2: Analysis methods and Instrument details
Sr
No.
Name Of
Parameter
Monitoring Technique Detection
Limit
Instrument Details
1 PM10 IS 5182 (Pt 23) 1 μg/Nm3 High volume air sampler with
RSPM
2 PM2.5 --- --- Fin e Particulate Sampler
3 SO2 IS-5182(part 2):2001
EPA modified West and
Gaeke method
0.5 μg/Nm3 High volume air sampler
Spectro Photometer
4 NOx IS-5182(part 6):2006
Jacobs – Hochheiser
method – First revision
5.5 μg/Nm3 High volume air sampler
Spectro Photometer

Draft EIA for Shubhalakshami Polyesters Limited 3-6
3.1.3.3 Baseline Data
The average concentration of the environment parameters along with the minimum and
maximum concentrations at the monitored sites are given in the table 3.3.
Table 3.3: Concentration of Various pollutants
Parameters Observed values
SAMPLING LOCATIONS CPCB Standards
Project Site Atali Kaladra Koliyad Kojbal
Amlew- shwer
24 hourly
PM2.5 Minimum 23 20 19 22 22 21 60
Maximum 35 34 29 31 31 33 Average 30 25 23 27 27 26
PM10 Minimum 63 32 39 42 36 41 100
Maximum 87 66 62 66 65 60
Average 75 54 48 54 54 52 NOx Minimum 15.69 12.12 12.98 12.84 10.45 11.17 80
Maximum 21.98 18.9 19.02 18.54 17.11 19.02 Average 19.05 15.33 15.46 15.57 12.85 15.15
SOx Minimum 4.9 3.92 3.96 2.91 3.52 2.91 80
Maximum 8.03 7.05 8 6.03 6.83 6.17 Average 6.43 5.32 5.5 4.3 4.81 4.5
PM10
The level of PM10 varies between 32 µg/m3 to 87 µg/m3. The maximum average
concentration of PM10 was found to be 75 µg/m3 at the Project Sites. PM10 concentrations
for all the locations are graphically represented as below.
Draft EIA for Shubhalakshami Polyesters Limited 3-7
PM2.5
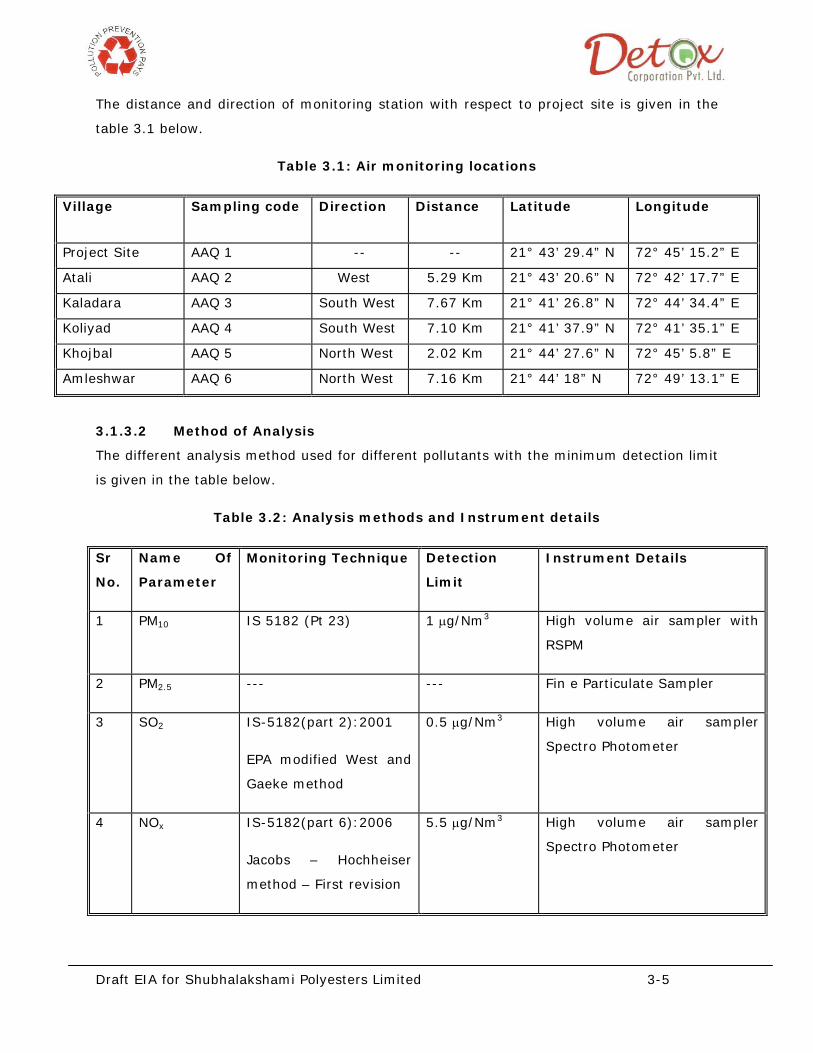
The minimum and maximum value for PM2.5 in the study area was found 19 µg/m3 at
Kaladra village to maximum level of 35 µg/m3 at project site. The maximum average
concentration, 30 µg/m3 observed at Projet Site. Results for all locations are graphically
represented as below.
NOx
The nitrogen dioxide concentration in the study area varied between 10.45 µg/m3 to 21.98
µg/m3 where as the maximum average concentration was found to be 19.05 µg/m3 at
Project Site. Results for all locations are ploted as below.
Draft EIA for Shubhalakshami Polyesters Limited 3-8
SOx
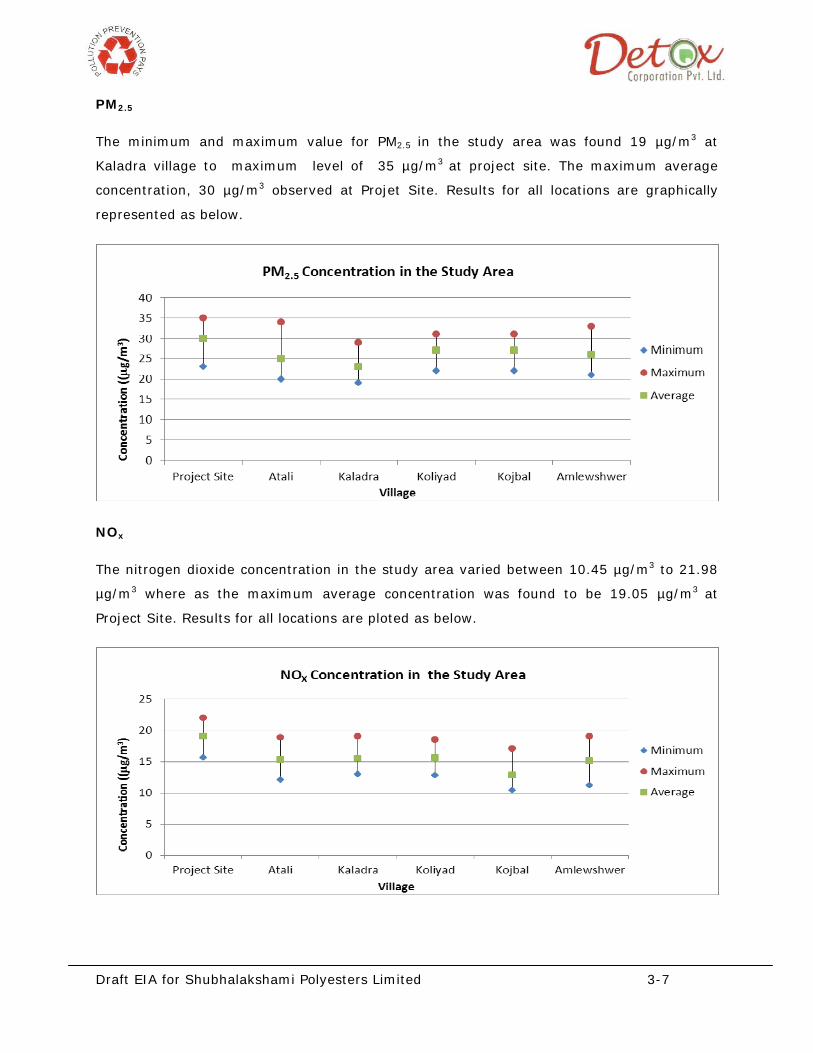
The maximum average concentration of sulphur dioxide i.e. 6.43 µg/m3 observed at Project
Site; where as the minimum and maximum value ranges between 2.91 µg/m3 to 8.03
µg/m3 respectively. Graphical representation for all the locations is represented as below.
Conclusion
The above study for ambient air quality reveals that the pollutant parameters PM10, PM2.5,
NOX, SO2 were found below the CPCB norms in the study area.
3.2 WATER ENVIRONMENT
The existing water quality in the study area, with respect to ground water and surface water
was evaluated during the study period. Ground water samples were collected from the
existing bore wells and surface water samples were collected from inland water bodies
located from the villages fall in the study area. All together 4 ground water samples and 6
surafce water samples collected and analyzed for various parameters.
3.2.1 Water Sampling Location
The details of sampling location with the distance and direction with respect to project site
are given in table 3.4 and 3.5 below.
Draft EIA for Shubhalakshami Polyesters Limited 3-9
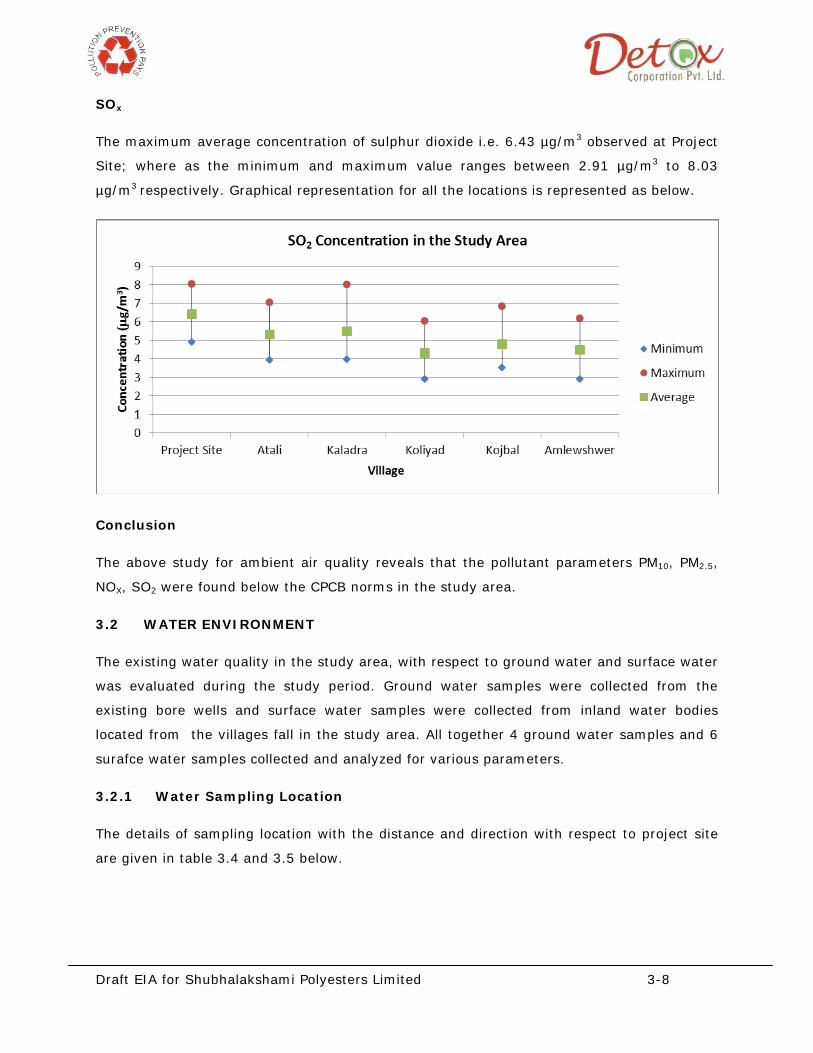
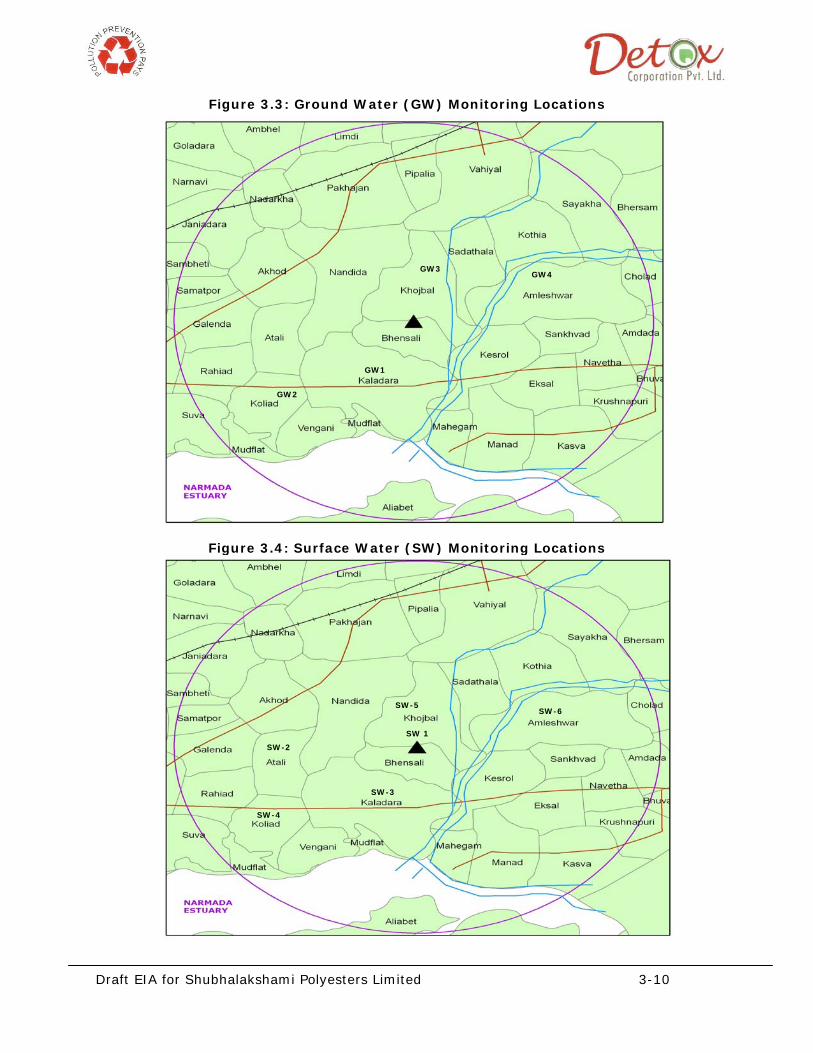
Table 3.4: Ground water monitoring location
Village Sampling code Source
Kaladara GW1 Ground
Koliyad GW2 Ground
Khojbal GW3 Ground
Amleshwar GW4 Ground
Table 3.5: Surface water monitoring location
Village Sampling code Source
Project site SW1 Surface
Atali SW2 Surface
Kaladara SW3 Surface
Koliyad SW4 Surface
Khojbal SW5 Surface
Amleshwar SW6 Surface
Draft EIA for Shubhalakshami Polyesters Limited 3-10
Figure 3.3: Ground Water (GW) Monitoring Locations
Figure 3.4: Surface Water (SW) Monitoring Locations
GW3 GW4
GW2
GW1
SW-5
SW-2
SW-6
SW-4
SW 1
SW-3
Draft EIA for Shubhalakshami Polyesters Limited 3-11
3.2.2 Analysis Method
The different analysis method used for the measuring different parameters in water is given
in the table below:
Table 3.6: Method of Analysis
Sr. No. PARAMETERS Applicable standard method of analysis
Detection limit
Desirable limits (Permissible
limit)
PHYSICAL PARAMETERS
1.
pH Electrometric method IS-3025(part 11)-1983
0.01 6.5 – 8.5
2. Temperature (deg C)
Thermometer -- NS
3. Conductivity (µmho)
IS-3025(part 14) 1984
1st Revision 1996
0 NS
4. Turbidity (NTU) IS-3025(part 10)-1984
1st Rev – Reaffirmed 1996
0 NTU 5
5. Total Dissolved Solids (TDS) (mg/l)
Gravimetric method IS-3025(part 16)-1984
4 500 mg/l (2000 mg/l)
6. Total Suspended Solids (mg/l)
Gravimetric method IS-3025(part 17)-1984
Reaffirmed 1998 1st Rev
4 NS
INORGANIC PARAMETERS
7. Chlorides (mg/l) Argentometric titration IS-3025(part 32)-1988
Reaffirmed 1999
1 250 mg/l (1000 mg/l)
8. Total Hardness as CaCO3 (mg/l)
EDTA-titrametric method
APHA & AWWA 21st edition 2340C2-37
2 300 mg/l (600 mg/l)
9. Sulphates (mg/l) Turbidity method IS-3025(part24)-1986
Reaffirmed 1992
2 200 mg/l (400 mg/l)
Draft EIA for Shubhalakshami Polyesters Limited 3-12
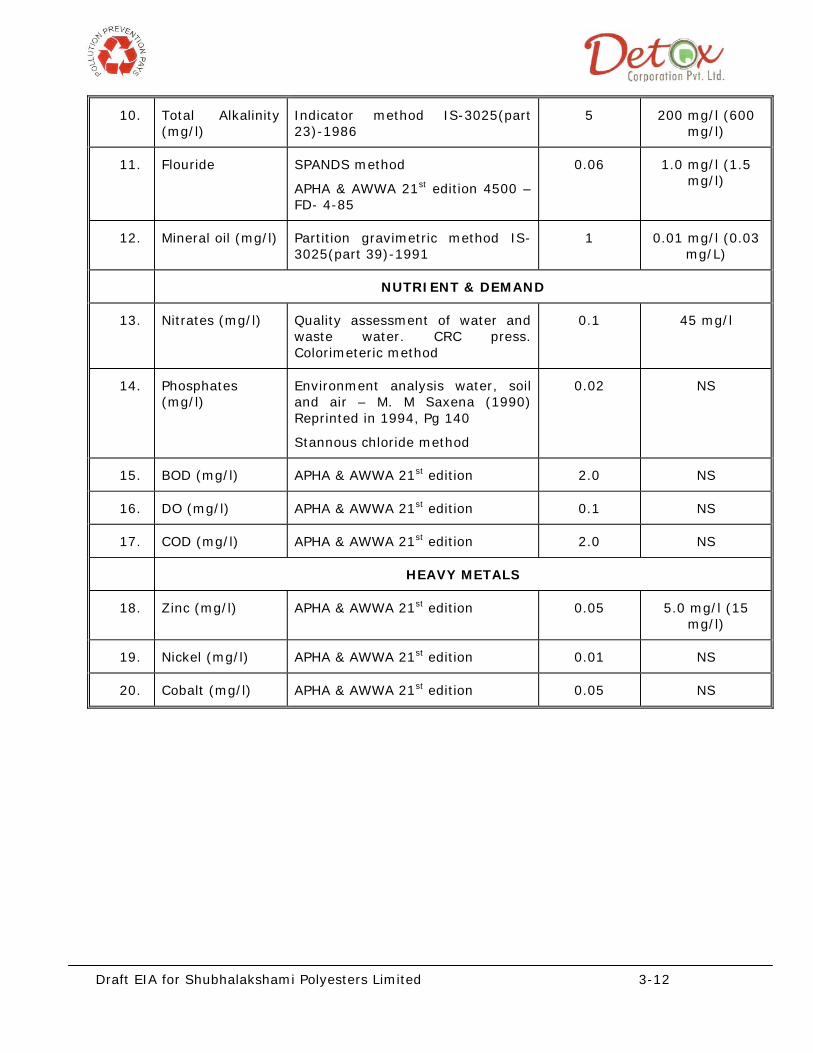
10. Total Alkalinity (mg/l)
Indicator method IS-3025(part 23)-1986
5 200 mg/l (600 mg/l)
11. Flouride SPANDS method
APHA & AWWA 21st edition 4500 – FD- 4-85
0.06 1.0 mg/l (1.5 mg/l)
12. Mineral oil (mg/l) Partition gravimetric method IS-3025(part 39)-1991
1 0.01 mg/l (0.03 mg/L)
NUTRIENT & DEMAND
13. Nitrates (mg/l) Quality assessment of water and waste water. CRC press. Colorimeteric method
0.1 45 mg/l
14. Phosphates (mg/l)
Environment analysis water, soil and air – M. M Saxena (1990) Reprinted in 1994, Pg 140
Stannous chloride method
0.02 NS
15. BOD (mg/l) APHA & AWWA 21st edition 2.0 NS
16. DO (mg/l) APHA & AWWA 21st edition 0.1 NS
17. COD (mg/l) APHA & AWWA 21st edition 2.0 NS
HEAVY METALS
18. Zinc (mg/l) APHA & AWWA 21st edition 0.05 5.0 mg/l (15 mg/l)
19. Nickel (mg/l) APHA & AWWA 21st edition 0.01 NS
20. Cobalt (mg/l) APHA & AWWA 21st edition 0.05 NS
Draft EIA for Shubhalakshami Polyesters Limited 3-13
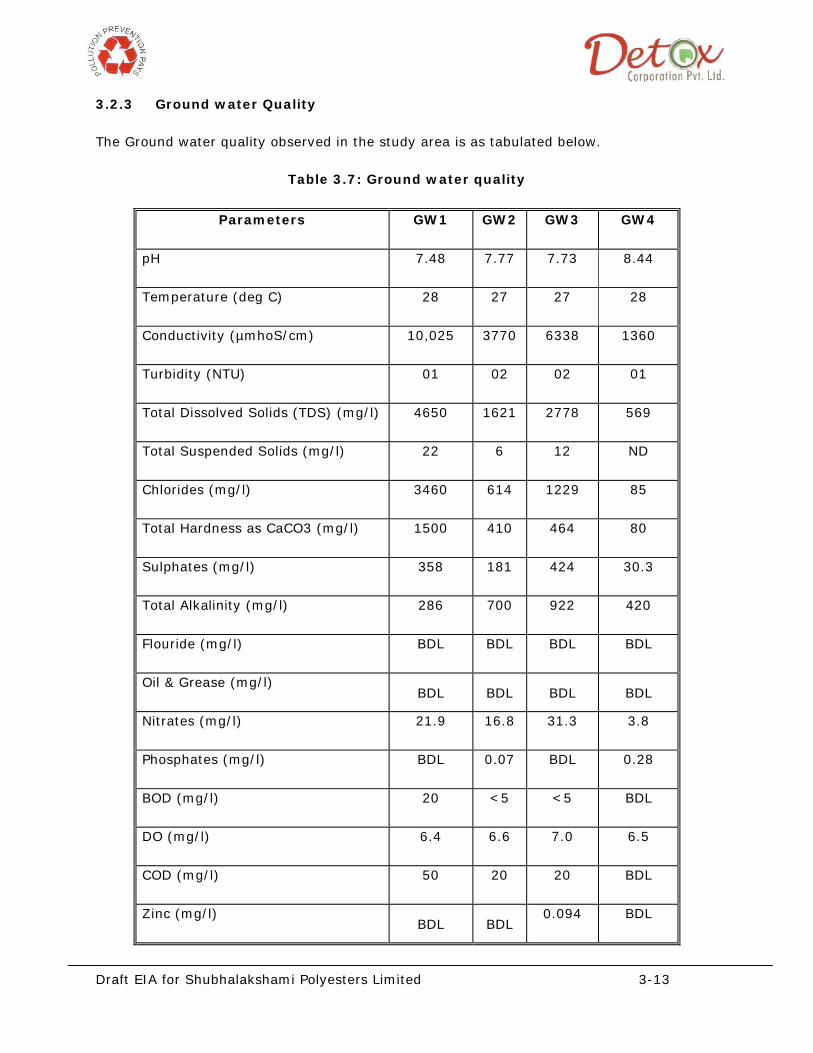
3.2.3 Ground water Quality
The Ground water quality observed in the study area is as tabulated below.
Table 3.7: Ground water quality
Parameters GW1 GW2 GW3 GW4
pH 7.48 7.77 7.73 8.44
Temperature (deg C) 28 27 27 28
Conductivity (µmhoS/cm) 10,025 3770 6338 1360
Turbidity (NTU) 01 02 02 01
Total Dissolved Solids (TDS) (mg/l) 4650 1621 2778 569
Total Suspended Solids (mg/l) 22 6 12 ND
Chlorides (mg/l) 3460 614 1229 85
Total Hardness as CaCO3 (mg/l) 1500 410 464 80
Sulphates (mg/l) 358 181 424 30.3
Total Alkalinity (mg/l) 286 700 922 420
Flouride (mg/l) BDL BDL BDL BDL
Oil & Grease (mg/l) BDL BDL BDL BDL
Nitrates (mg/l) 21.9 16.8 31.3 3.8
Phosphates (mg/l) BDL 0.07 BDL 0.28
BOD (mg/l) 20 <5 <5 BDL
DO (mg/l) 6.4 6.6 7.0 6.5
COD (mg/l) 50 20 20 BDL
Zinc (mg/l) BDL BDL
0.094 BDL
Draft EIA for Shubhalakshami Polyesters Limited 3-14
Nickel (mg/l) BDL BDL BDL BDL
Cobalt (mg/l) 0.050 BDL 0.1 BDL
BDL- Below Detection Limit, Fluride- 0.5 mg/l, TSS-4 mg/l, , Oil & Grease-1 mg/l, Cu- 0.02mg/l, Cd-
0.002mg/l, Hg-0.001mg/l
Results
In the study area, TDS level in the sampled well found to be between 569 to 4650 mg/l and
Chloride level was varying from 85 to 3460 mg/l. In general, ground water quality is in
saline nature.
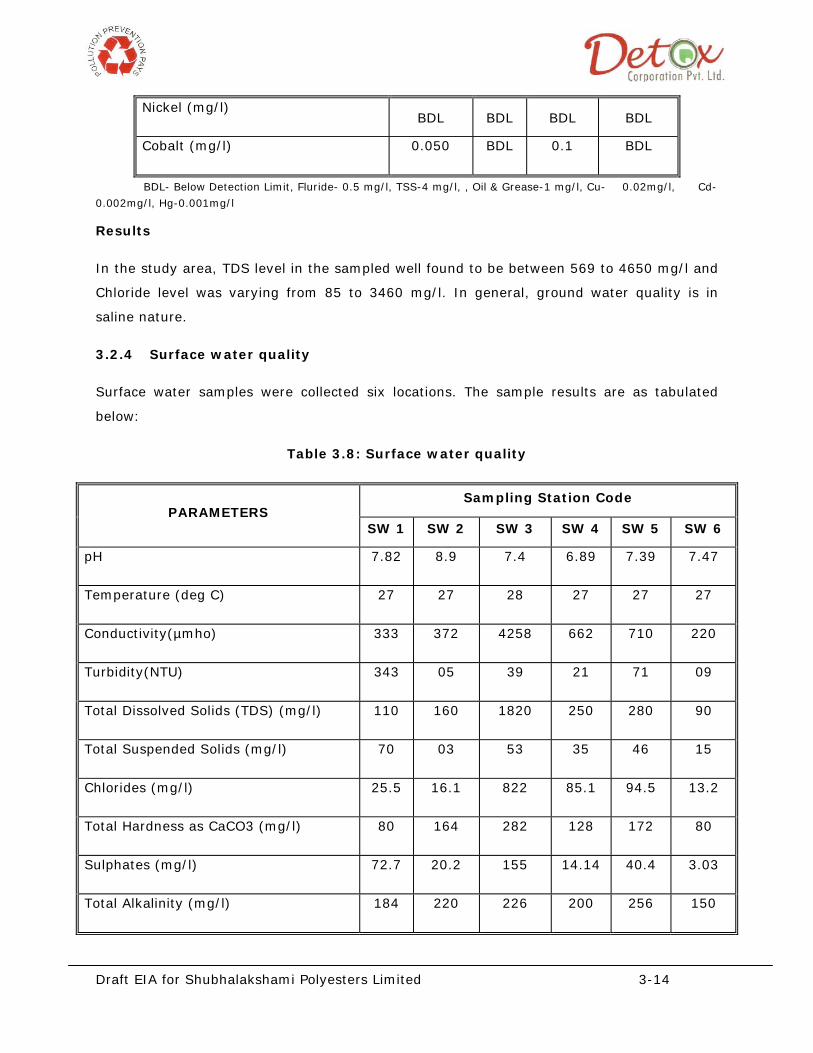
3.2.4 Surface water quality
Surface water samples were collected six locations. The sample results are as tabulated
below:
Table 3.8: Surface water quality
PARAMETERS Sampling Station Code
SW 1 SW 2 SW 3 SW 4 SW 5 SW 6
pH 7.82 8.9 7.4 6.89 7.39 7.47
Temperature (deg C) 27 27 28 27 27 27
Conductivity(µmho) 333 372 4258 662 710 220
Turbidity(NTU) 343 05 39 21 71 09
Total Dissolved Solids (TDS) (mg/l) 110 160 1820 250 280 90
Total Suspended Solids (mg/l) 70 03 53 35 46 15
Chlorides (mg/l) 25.5 16.1 822 85.1 94.5 13.2
Total Hardness as CaCO3 (mg/l) 80 164 282 128 172 80
Sulphates (mg/l) 72.7 20.2 155 14.14 40.4 3.03
Total Alkalinity (mg/l) 184 220 226 200 256 150
Draft EIA for Shubhalakshami Polyesters Limited 3-15
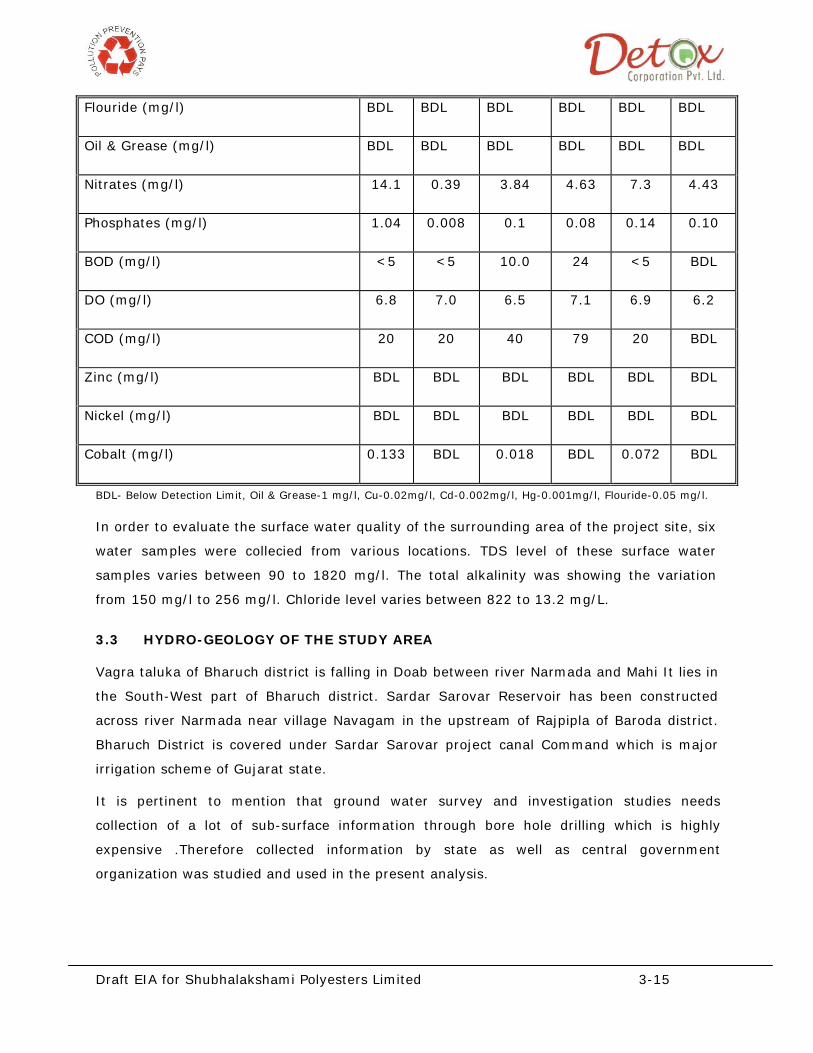
Flouride (mg/l) BDL BDL BDL BDL BDL BDL
Oil & Grease (mg/l) BDL BDL BDL BDL BDL BDL
Nitrates (mg/l) 14.1 0.39 3.84 4.63 7.3 4.43
Phosphates (mg/l) 1.04 0.008 0.1 0.08 0.14 0.10
BOD (mg/l) <5 <5 10.0 24 <5 BDL
DO (mg/l) 6.8 7.0 6.5 7.1 6.9 6.2
COD (mg/l) 20 20 40 79 20 BDL
Zinc (mg/l) BDL BDL BDL BDL BDL BDL
Nickel (mg/l) BDL BDL BDL BDL BDL BDL
Cobalt (mg/l) 0.133 BDL 0.018 BDL 0.072 BDL
BDL- Below Detection Limit, Oil & Grease-1 mg/l, Cu-0.02mg/l, Cd-0.002mg/l, Hg-0.001mg/l, Flouride-0.05 mg/l.
In order to evaluate the surface water quality of the surrounding area of the project site, six
water samples were collecied from various locations. TDS level of these surface water
samples varies between 90 to 1820 mg/l. The total alkalinity was showing the variation
from 150 mg/l to 256 mg/l. Chloride level varies between 822 to 13.2 mg/L.
3.3 HYDRO-GEOLOGY OF THE STUDY AREA
Vagra taluka of Bharuch district is falling in Doab between river Narmada and Mahi It lies in
the South-West part of Bharuch district. Sardar Sarovar Reservoir has been constructed
across river Narmada near village Navagam in the upstream of Rajpipla of Baroda district.
Bharuch District is covered under Sardar Sarovar project canal Command which is major
irrigation scheme of Gujarat state.
It is pertinent to mention that ground water survey and investigation studies needs
collection of a lot of sub-surface information through bore hole drilling which is highly
expensive .Therefore collected information by state as well as central government
organization was studied and used in the present analysis.
Draft EIA for Shubhalakshami Polyesters Limited 3-16
The work pertaining to Geo hydrological Investigation is confined mainly in and around the
Plant site of Subhlaxmi Polyester Ltd at Village: Bhensali, Taluka: Vagra, District: Bharuch.
It is Doab (area between two rivers and/or tributary) between Narmada and Mahi River.
3.3.1 Physiography
The study area is well drained by two natural drains, which are located in north of
village Bhensali and meet near village Bhensali. Study area is a Doab (area between
two rivers and/or tributary) between perennial Narmada River in North and Mahi River in
south. The climate of the study area is Arid. Hot summer and general dryness characterize
it, except during the southwest monsoon season which experiences heavy rain. Monthly
Maximum Temperature 40º.C and Monthly Mean Minimum Temperature ranges from 11º.C
The period from mid-June to Sept. is the Southwest monsoon season. Over 90%of annual rainfall
occurs during Southwest monsoon period that is from 15th June to 15th September. Taluka wise
normal rainfall (in mm) revised provisional based from 1901-1970 for Vagra taluka, is 816.3 mm
with average rainy days as 38.3
The average long term annual rainfall for 45 years from 1963to 1970 is 678mm
The average Short term annual rainfall for 10 years from 1997 to 2007 is 826 mm
3.3.2 Geology of the Area
In Vagra Taluka of Bharuch district falls geomorphic units of alluvial plain and coastal
zone. The major perennial rivers are Narmada and Kim debouching into the Arabian
Sea. The northerly flowing Karjan, Amaravat and Kaveri and southwesterly flowing
Bhukhi and Bhadra rivers merge with Namada River.
The area comprises mainly of Deccan basalts overlying the infratrappean Bagh formation.
The Deccan Volcanics are unconformably overlain by the Tertiary rocks
The quaternary sediments are overlying tertiary formation. They comprise older tidal flat and
tidal marsh deposit of Rann Clay Formation and younger tidal flat deposit (spit /bar and shoal)
representing marine environment of deposition, flood plain deposit representing fluvial
environmental deposition and coastal dune and sand dune deposits representing Aeolian
environment of deposition.
The soil at site is fine to coarse, loamy, clayey, and calcareous
Ground water prospects are good to excellent in alluvial plain flood plain, pediplain (sedimentary
and vegetation anomaly domains. The depth of water level is less than 10 m
Draft EIA for Shubhalakshami Polyesters Limited 3-17
3.3.3 Geology at Site
From the observation of the litho logical logs of the borehole data within the depth
explored in and around the study area, the formation comprises of Alluvium both
Aeolian and fluvial composed of sand, silt, gravel clay and kankar. The thickness
of alluvium is estimated to be about 20 to 60 m
3.3.4 Sub-Surface Conditions
In order to have an idea about the sub-surface disposition of aquifers its lateral extent,
thickness and inter connection with the adjacent areas, sub surface geological cross section
was drawn. In case of any waste storage/ land fill site, specifically, such knowledge on sub-
surface condition and its inter connection is very important and essential. It enable design
engineer to take all precautionary measures in designing such waste storage/ landfill site to
reduce all probable& possible leakage and consequent upon reduce possibility of polluting
underneath ground waster reservoir.
3.3.5 Hydrogeology
Field data together with other relevant required information was collected and compiled to
study the groundwater condition in and around the study area.To assess the prevailing
ground water conditions both along and across these existing, well inventory was carried out
of selected representative wells on suitable grid pattern. The well details like depth,
diameter, discharge, pump sets, etc. were collected and compiled. During the course of Geo
hydrological Investigation water samples were also collected on the selected wells and
analyzed to assess the present ground condition and ground water quality.
In and around the the study area formation comprises a cover of thin alluvium formation. It
comprises of Alluvium both of Aeolian and fluvial and composed of sand, silt, clay and
kankar. The thickness of alluvium is estimated to be about 20 to 40m. Topographically, the
study area is almost Pene palai. The general ground slope is from East to West to or more
precisely North-East to South-West. The Ground water occurs in alluvium aquifer
under unconfined as well as semi-confined condition. In major part of study area
the ground water, occur under semi- confined condition. The depth of dug well
ranges from 9.45 to 12.45 m below ground level. The depth to water level ranges
from 2.45 m to 4.65 m below ground level.
Draft EIA for Shubhalakshami Polyesters Limited 3-18
3.3.6 Study on Hydrograph
State Government Ground Water Investigation Department has fixed up the number of
observation wells all over the Gujarat State for monitoring and collecting information on
water level fluctuations and water quality variatios. The observation well falling in the close
proximity of the study area was considered for its analysis and used as supplementary data.
The water level fluctuation data of observation piezometer well located at village Atali of
Vagra taluka, for the period 1990-2010 was studied. It is located in the Southern part and
close proximity of the study area. From the observation of this hydrographs, it is inferred
that the upper unconfined and semi-confined aquifers are very sensitive to rainfall/canal
recharge.
The area is inherent salinity in aquifer but there is improvement inground water
quality due to operation Sardar Sarovar Project Canal Command.
The ground water occurs under unconfined as well as semi-confined conditions in alluvial
area. But due to inherent salinity of aquifer and very few numbers of wells exist. Now as
this area falls in canal command Sardar Sardar Project ground water development is very
meager /negligible. Specific yield value is very low (1 to 3%) resulting higher rise. Water
level depth below ground level is very shaloow (2.45 to 4.65m below ground level). From
the ground water development point of view it falls in safe category. As Saradar Sarovar
Project Canal Command is already in operation, there is rising trend in water level profile
and there is improvement ground water quality as inferred from the chemical analysis of
water sample collected during the geo hydrological investigation. Therefore, in this area
instead of recharging we must plan systematic planned ground water pumping so as to
protect the environment.
3.4 NOISE ENVIRONMENT
The ambient noise environment consists of the total noise generated in the area at various
distance around the sampling locations. The noise level varies depending on the type of
activities carried out in the surrounding area. The baseline noise environment was studied
at the project site as well as the surrounding villages. The locations considered for the noise
monitoring are tabulated below along with the CPCB limits.
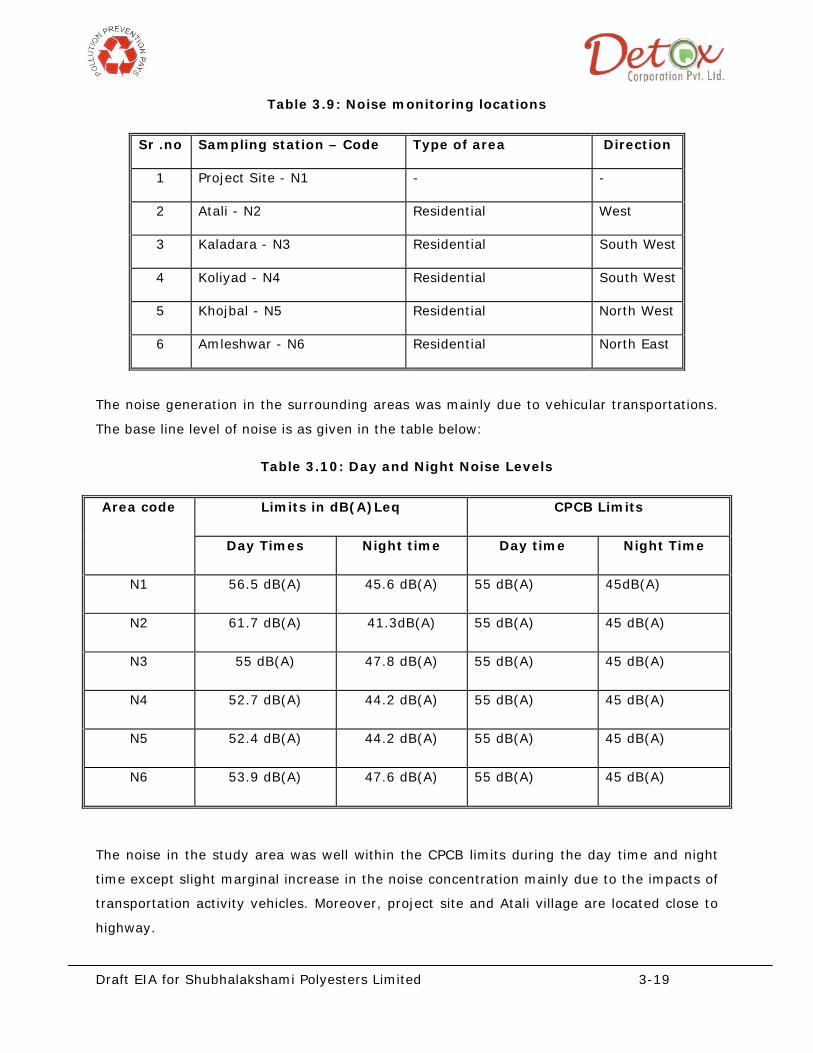
Draft EIA for Shubhalakshami Polyesters Limited 3-19
Table 3.9: Noise monitoring locations
Sr .no Sampling station – Code Type of area Direction
1 Project Site - N1 - -
2 Atali - N2 Residential West
3 Kaladara - N3 Residential South West
4 Koliyad - N4 Residential South West
5 Khojbal - N5 Residential North West
6 Amleshwar - N6 Residential North East
The noise generation in the surrounding areas was mainly due to vehicular transportations.
The base line level of noise is as given in the table below:
Table 3.10: Day and Night Noise Levels
Area code Limits in dB(A)Leq CPCB Limits
Day Times Night time Day time Night Time
N1 56.5 dB(A) 45.6 dB(A) 55 dB(A) 45dB(A)
N2 61.7 dB(A) 41.3dB(A) 55 dB(A) 45 dB(A)
N3 55 dB(A) 47.8 dB(A) 55 dB(A) 45 dB(A)
N4 52.7 dB(A) 44.2 dB(A) 55 dB(A) 45 dB(A)
N5 52.4 dB(A) 44.2 dB(A) 55 dB(A) 45 dB(A)
N6 53.9 dB(A) 47.6 dB(A) 55 dB(A) 45 dB(A)
The noise in the study area was well within the CPCB limits during the day time and night
time except slight marginal increase in the noise concentration mainly due to the impacts of
transportation activity vehicles. Moreover, project site and Atali village are located close to
highway.
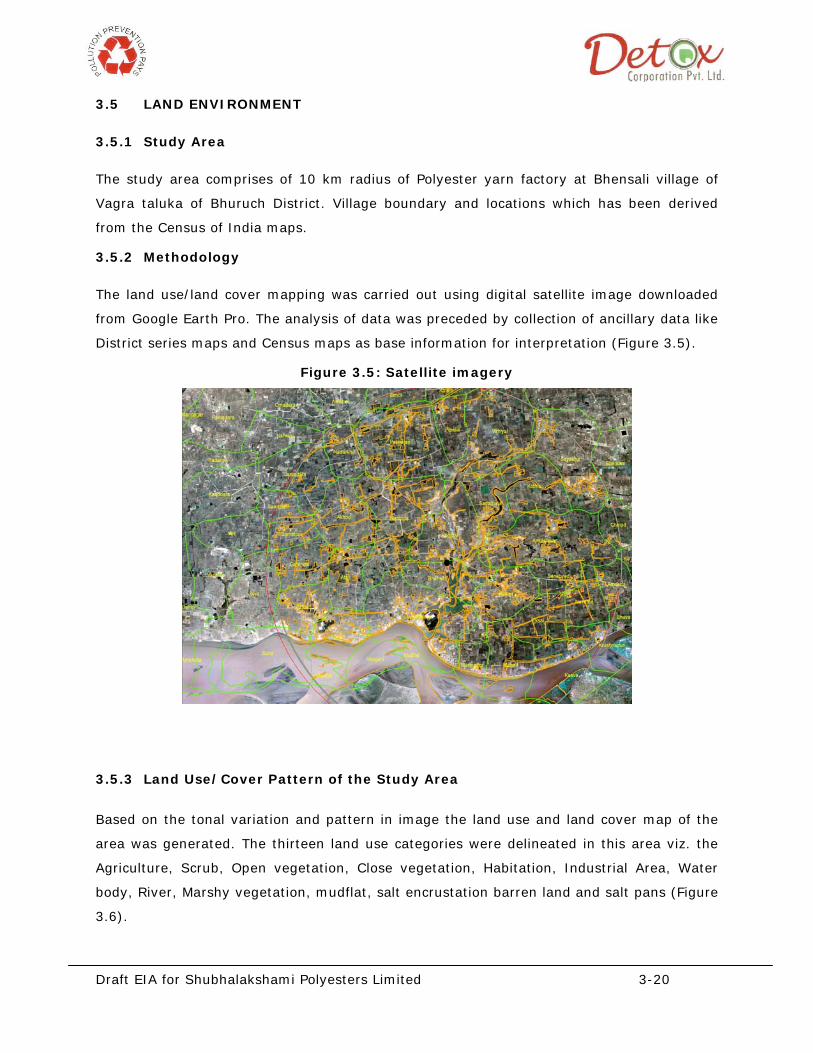
Draft EIA for Shubhalakshami Polyesters Limited 3-20
3.5 LAND ENVIRONMENT
3.5.1 Study Area
The study area comprises of 10 km radius of Polyester yarn factory at Bhensali village of
Vagra taluka of Bhuruch District. Village boundary and locations which has been derived
from the Census of India maps.
3.5.2 Methodology
The land use/land cover mapping was carried out using digital satellite image downloaded
from Google Earth Pro. The analysis of data was preceded by collection of ancillary data like
District series maps and Census maps as base information for interpretation (Figure 3.5).
Figure 3.5: Satellite imagery
3.5.3 Land Use/Cover Pattern of the Study Area
Based on the tonal variation and pattern in image the land use and land cover map of the
area was generated. The thirteen land use categories were delineated in this area viz. the
Agriculture, Scrub, Open vegetation, Close vegetation, Habitation, Industrial Area, Water
body, River, Marshy vegetation, mudflat, salt encrustation barren land and salt pans (Figure
3.6).
Draft EIA for Shubhalakshami Polyesters Limited 3-21
Major portion in the study area is covered by Agriculture i.e. 64 per cent. The main crop
grown in the area was Wheat, Cotton, Tuver and Sugarcane this indicates availability of the
water in the study area. The area had a good network of Narmada canal.
The vegetation categories had been segregated into scrub, open and close vegetation
according to the crown cover. There are areas having sparse vegetation it is mainly covered
by grasses these areas were delineated as Scrub. As per the classification based on Forest
Survey of India the category denotes land having bushes and poor tree growth with canopy
density less than 10 percent. These areas are mostly found on the bank of the river, and
canal also near the habitation area.
The vegetation category Open was segregated based on the canopy density of 10 to 20 per
cent and Close as greater than 20 per cent canopy cover. These two categories cover only
9.5 per cent of the study area. Due to good network of Narmada canals within the study
area along the road there were growth of hydrophytes which had been categorise into open
and close vegetation as per the crown cover. These areas was mostly covered by Typha
spp. and along the tributaries of Narmada river there was dense patch of vegetation in the
central region which was covered by Prosopis juliflora species.
There are around 117 number of small and big water bodies covering only 0.56 per cent of
the area. The big stretch of Narmada River its tributaries and the connected Bhan and
Bhukhi rivers flows through the study area.
Marshy vegetation was 4 per cent of the study areas which is dominated by Suaeda sp.
along the coast and on the bet. Some of the bets were covered by luxuriant growth of salt
tolerant species Prosopis juliflora. Also there was small stretch mudflat region covering only
1.3 per cent of the area.
During high tide in the Narmada river its water flows to the tributary and when it recedes
that region is barren and it is covered with layer of salt, that has been categorise by salt
encrustation. Only in the Koliad and Kaladara village salt pan activity had been carried out
covering 0.43 per cent of the area. As known from the Figure 3.6 study area had Aliabet
region which used to be covered with Mangrove vegetation but now it had been merged
with the land where there is no growth of vegetation which had been delineated as barren
land having 1.25 per cent of the area. The area statistics of land use/cover classes within 10
km radius are presented in table 3.11 and within 2 km radius are as given in table 3.12.
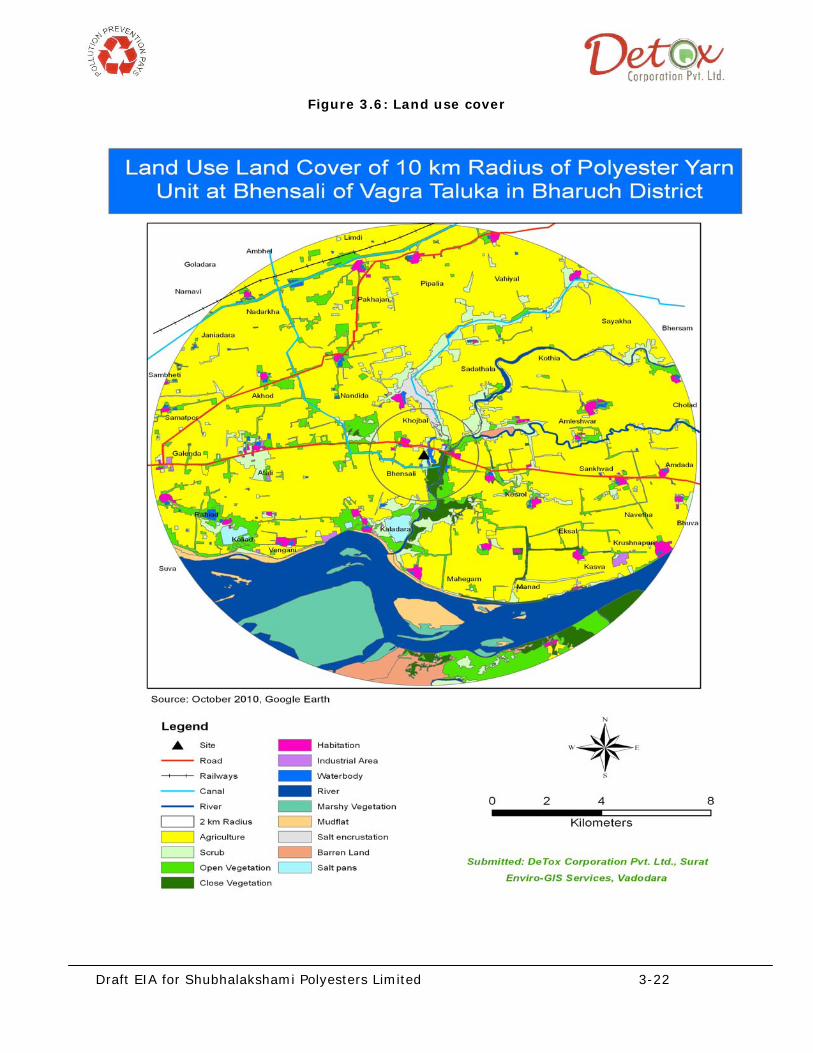
Draft EIA for Shubhalakshami Polyesters Limited 3-22
Figure 3.6: Land use cover
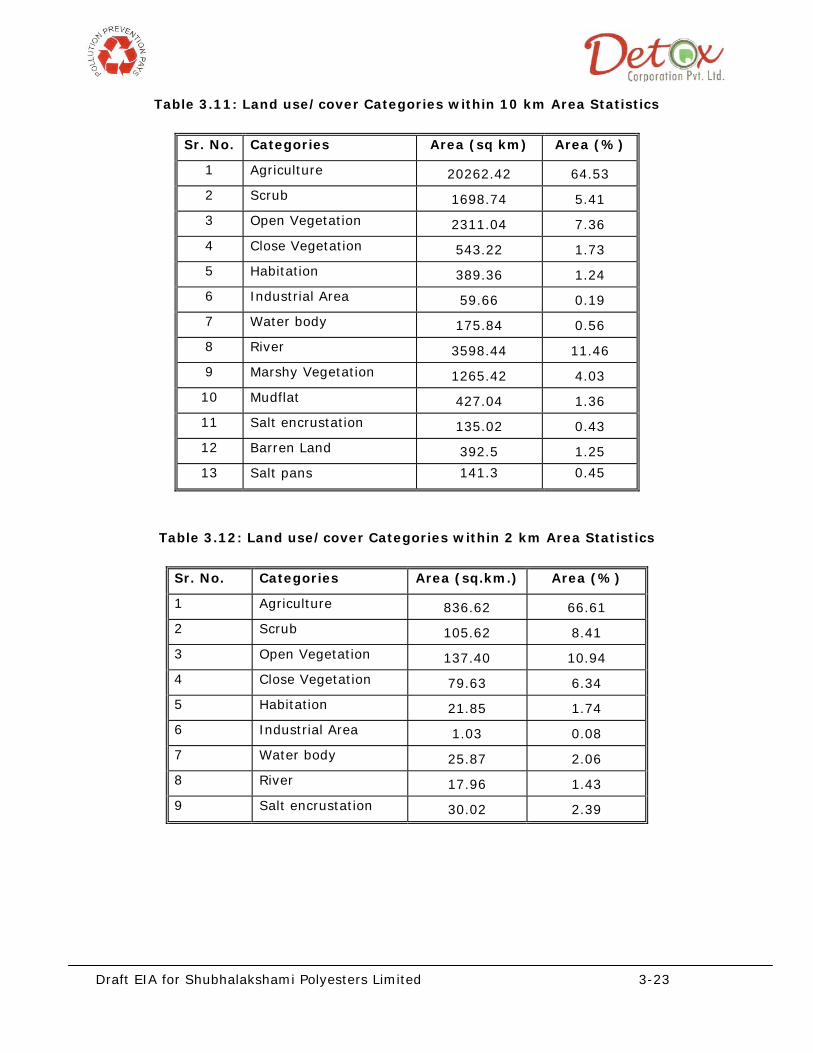
Draft EIA for Shubhalakshami Polyesters Limited 3-23
Table 3.11: Land use/cover Categories within 10 km Area Statistics
Sr. No. Categories Area (sq km) Area (%)
1 Agriculture 20262.42 64.53
2 Scrub 1698.74 5.41
3 Open Vegetation 2311.04 7.36
4 Close Vegetation 543.22 1.73
5 Habitation 389.36 1.24
6 Industrial Area 59.66 0.19
7 Water body 175.84 0.56
8 River 3598.44 11.46
9 Marshy Vegetation 1265.42 4.03
10 Mudflat 427.04 1.36
11 Salt encrustation 135.02 0.43
12 Barren Land 392.5 1.25
13 Salt pans 141.3 0.45
Table 3.12: Land use/cover Categories within 2 km Area Statistics
Sr. No. Categories Area (sq.km.) Area (%)
1 Agriculture 836.62 66.61
2 Scrub 105.62 8.41
3 Open Vegetation 137.40 10.94
4 Close Vegetation 79.63 6.34
5 Habitation 21.85 1.74
6 Industrial Area 1.03 0.08
7 Water body 25.87 2.06
8 River 17.96 1.43
9 Salt encrustation 30.02 2.39
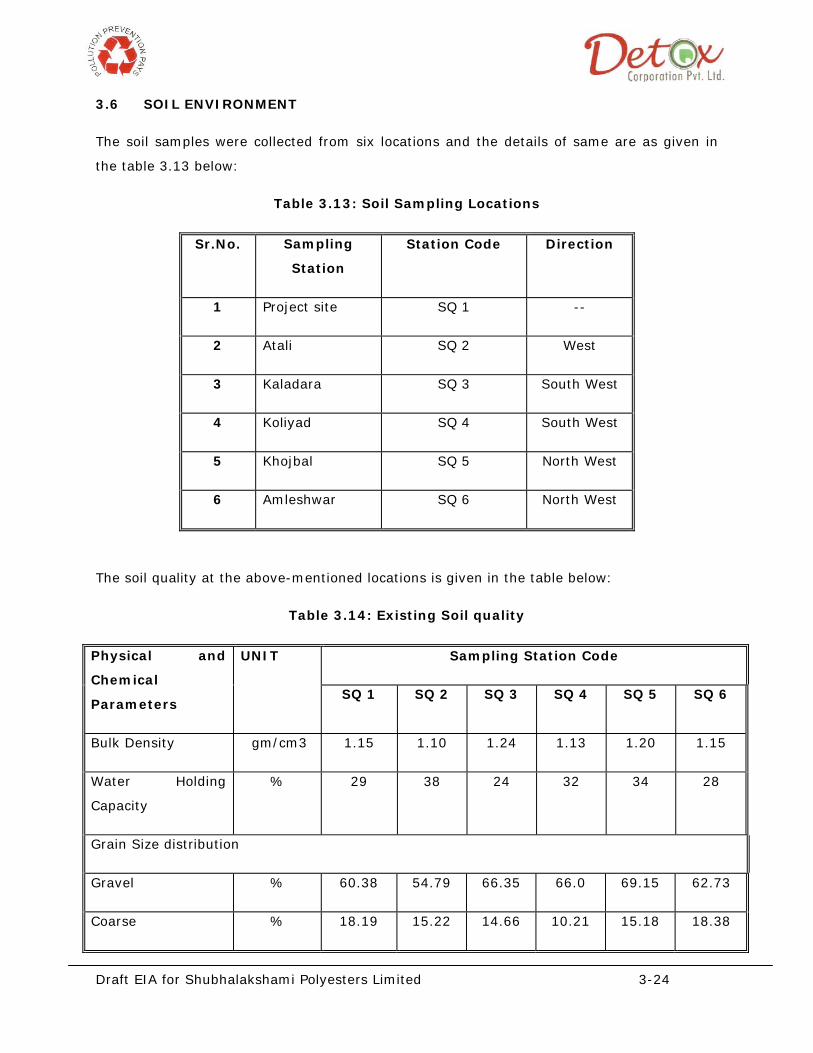
Draft EIA for Shubhalakshami Polyesters Limited 3-24
3.6 SOIL ENVIRONMENT
The soil samples were collected from six locations and the details of same are as given in
the table 3.13 below:
Table 3.13: Soil Sampling Locations
Sr.No. Sampling
Station
Station Code Direction
1 Project site SQ 1 --
2 Atali SQ 2 West
3 Kaladara SQ 3 South West
4 Koliyad SQ 4 South West
5 Khojbal SQ 5 North West
6 Amleshwar SQ 6 North West
The soil quality at the above-mentioned locations is given in the table below:
Table 3.14: Existing Soil quality
Physical and
Chemical
Parameters
UNIT Sampling Station Code
SQ 1 SQ 2 SQ 3 SQ 4 SQ 5 SQ 6
Bulk Density gm/cm3 1.15 1.10 1.24 1.13 1.20 1.15
Water Holding
Capacity
% 29 38 24 32 34 28
Grain Size distribution
Gravel % 60.38 54.79 66.35 66.0 69.15 62.73
Coarse % 18.19 15.22 14.66 10.21 15.18 18.38
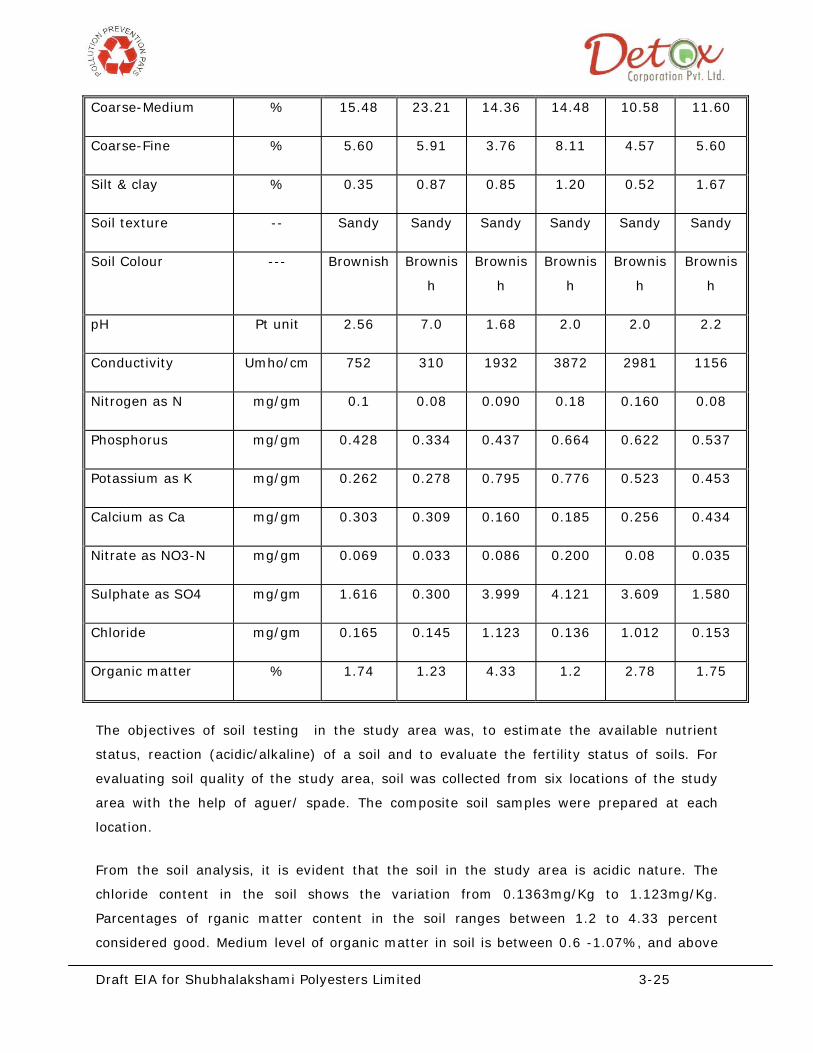
Draft EIA for Shubhalakshami Polyesters Limited 3-25
Coarse-Medium % 15.48 23.21 14.36 14.48 10.58 11.60
Coarse-Fine % 5.60 5.91 3.76 8.11 4.57 5.60
Silt & clay % 0.35 0.87 0.85 1.20 0.52 1.67
Soil texture -- Sandy Sandy Sandy Sandy Sandy Sandy
Soil Colour --- Brownish Brownis
h
Brownis
h
Brownis
h
Brownis
h
Brownis
h
pH Pt unit 2.56 7.0 1.68 2.0 2.0 2.2
Conductivity Umho/cm 752 310 1932 3872 2981 1156
Nitrogen as N mg/gm 0.1 0.08 0.090 0.18 0.160 0.08
Phosphorus mg/gm 0.428 0.334 0.437 0.664 0.622 0.537
Potassium as K mg/gm 0.262 0.278 0.795 0.776 0.523 0.453
Calcium as Ca mg/gm 0.303 0.309 0.160 0.185 0.256 0.434
Nitrate as NO3-N mg/gm 0.069 0.033 0.086 0.200 0.08 0.035
Sulphate as SO4 mg/gm 1.616 0.300 3.999 4.121 3.609 1.580
Chloride mg/gm 0.165 0.145 1.123 0.136 1.012 0.153
Organic matter % 1.74 1.23 4.33 1.2 2.78 1.75
The objectives of soil testing in the study area was, to estimate the available nutrient
status, reaction (acidic/alkaline) of a soil and to evaluate the fertility status of soils. For
evaluating soil quality of the study area, soil was collected from six locations of the study
area with the help of aguer/ spade. The composite soil samples were prepared at each
location.
From the soil analysis, it is evident that the soil in the study area is acidic nature. The
chloride content in the soil shows the variation from 0.1363mg/Kg to 1.123mg/Kg.
Parcentages of rganic matter content in the soil ranges between 1.2 to 4.33 percent
considered good. Medium level of organic matter in soil is between 0.6 -1.07%, and above
Draft EIA for Shubhalakshami Polyesters Limited 3-26
1.2% is considered as high. The available nitrogen content in the soil varies from 0.2% to
0.8%. Phosphorous varies from 0.08 mg/gm to 0.160 mg/gm. Calcium content in the soil
varies from 0.160 to 0.434 mg/gm and Nitrate content in the soil varies from 0.08 to 0.200
mg/gm.
3.7 TERRESTRIAL ENVIRONMENT AND BIODIVERSITY
The variety and variability of organisms and ecosystems is referred to as biological diversity
or Bio diversity. The biodiversity we see today is the fruit of billions of years of evolution,
shaped by natural processes. The vast array of interactions among the various components
of biodiversity makes the planet habitable for all species, including humans. There is a
growing recognition that, biological diversity is a global asset of tremendous value to
present and future generations. At the same time, the threat to species and ecosystems has
never been as great as it is today. Species extinction caused by human activities continues
at an alarming rate. Protecting biodiversity is in our self-interest.
Ecological impact assessment (EcIA) is used to predict and evaluate the impacts of
development activities on ecosystems and their components, thereby providing the
information needed to ensure that ecological issues are given full and proper consideration
in development planning. Environmental impact assessment (EIA) has emerged as a key to
sustainable development by integrating social, economic and environmental issues in many
countries. EcIA has a major part to play as a component of EIA but also has other potential
applications in environmental planning and management. Ecological Impact Assessment
provides a comprehensive review of the EcIA process and summarizes the ecological
theories and tools that can be used to understand, explain and evaluate the ecological
consequences of development proposals.
At the 1992 Earth Summit in Rio de Janeiro, world leaders agreed on a comprehensive
strategy for "sustainable development” to meet our needs while ensuring that we leave a
healthy and viable world for future generations. One of the key agreements adopted at Rio
de Janerio was the Convention on Biological Diversity. Article14 of Convention on
Biodiversity ( Impact Assessment and Minimizing Adverse Impacts), stressed the need to
Introduce appropriate procedures of environmental impact assessment for proposed
projects that are likely to have significant adverse effects on biological diversity with a view
to avoiding or minimizing such effects.
Environmental impact assessments have become an integral part of development projects in
India ever since 1994, to formulate policies and guidelines for environmentally sound

Draft EIA for Shubhalakshami Polyesters Limited 3-27
economic development. Proper assessment of biological environment and compilation of its
taxonomical data is essential for the impact prediction.
3.7.1 Period of the study and Study area:
The baseline study, for the evaluation of the floral and faunal biodiversity of the terrestrial
environment of the study area, with in 10 km radius from the proposed site near Bensali
village, in Bharuch District has been conducted during April, 2011.
3.7.2 Methodology:
The primary objective of survey was to describe the floral and faunal communities within
the study area. The sampling plots for floral inventory were selected randomly in the
suitable habitats within the 10km radius from the project site. The methodology adopted for
faunal survey involve; Random survey, Opportunistic observations, Diurnal bird observation,
active search for reptiles, faunal habitat assessment, active search for scats and foot prints
and review of previous studies, Desktop literature review was conducted to indentify the
representative spectrum of threatened species, population and ecological communities listed
by IUCN, WCMC, ZSI, BSI and Indian wild Life Protection act, 1972.
The villages covered for the present baseline study are given in the table 3.15. The study
area falls under Bharuch District of Gujarat state. The area of for the present biological
baseline study falls under 28, villages. 4 villages were selected in the core area (Project site
and surrounding villages) and 24 villages were selected in the buffer zone (other villages’
within10km radius) (Figure 3.7).
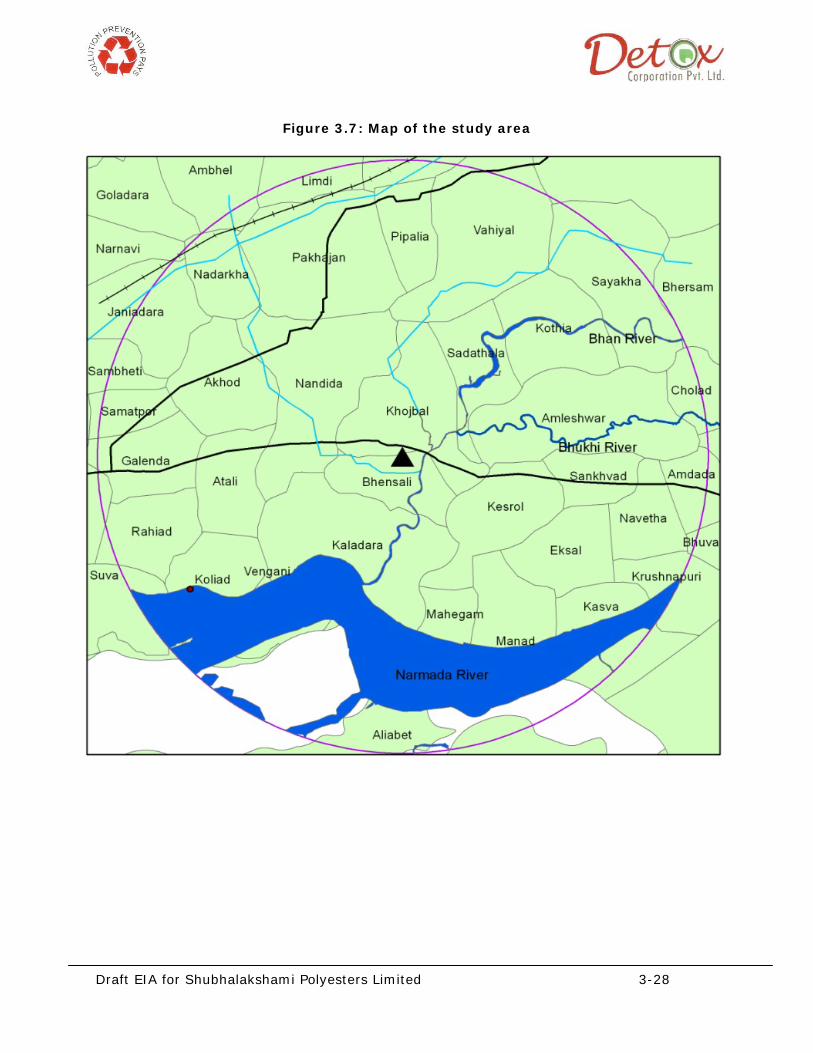
Draft EIA for Shubhalakshami Polyesters Limited 3-28
Figure 3.7: Map of the study area
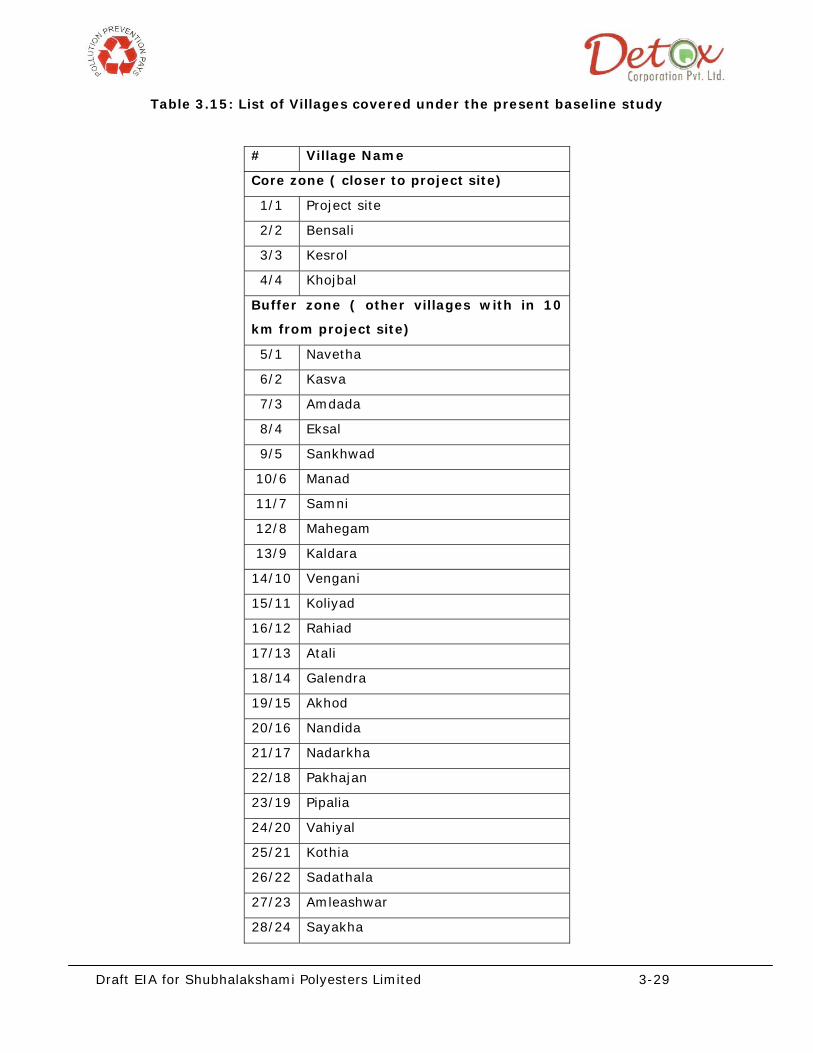
Draft EIA for Shubhalakshami Polyesters Limited 3-29
Table 3.15: List of Villages covered under the present baseline study
# Village Name
Core zone ( closer to project site)
1/1 Project site
2/2 Bensali
3/3 Kesrol
4/4 Khojbal
Buffer zone ( other villages with in 10
km from project site)
5/1 Navetha
6/2 Kasva
7/3 Amdada
8/4 Eksal
9/5 Sankhwad
10/6 Manad
11/7 Samni
12/8 Mahegam
13/9 Kaldara
14/10 Vengani
15/11 Koliyad
16/12 Rahiad
17/13 Atali
18/14 Galendra
19/15 Akhod
20/16 Nandida
21/17 Nadarkha
22/18 Pakhajan
23/19 Pipalia
24/20 Vahiyal
25/21 Kothia
26/22 Sadathala
27/23 Amleashwar
28/24 Sayakha
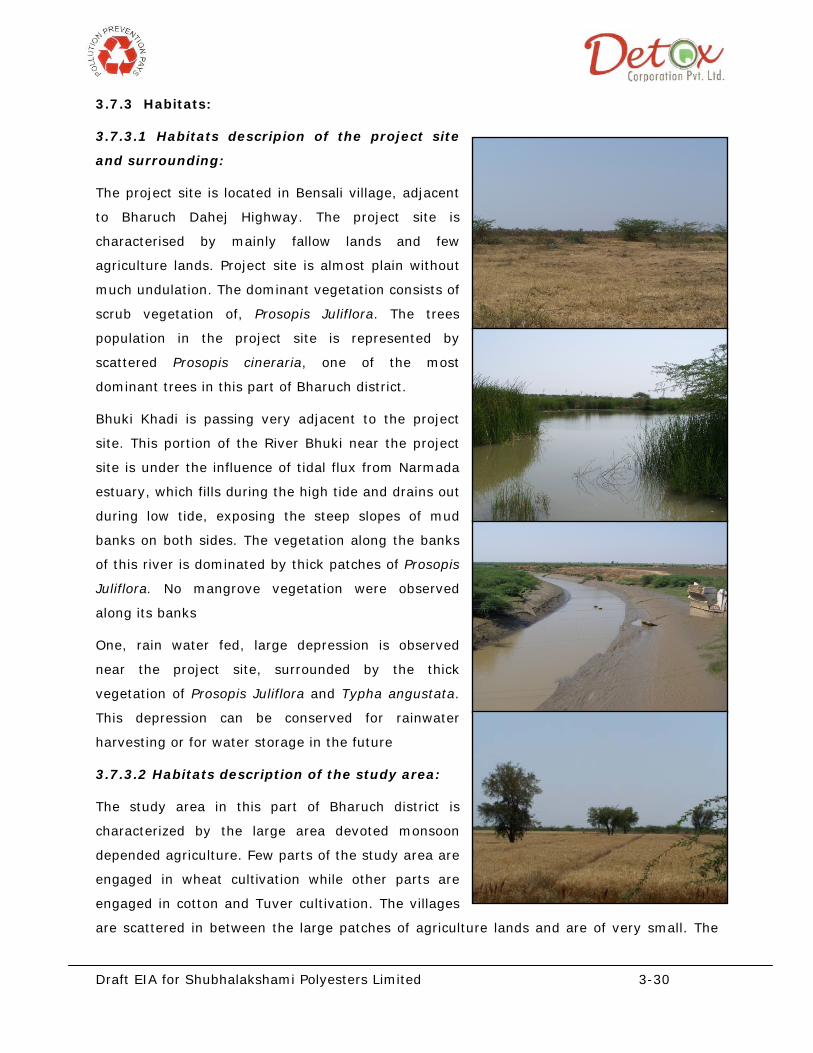
Draft EIA for Shubhalakshami Polyesters Limited 3-30
3.7.3 Habitats:
3.7.3.1 Habitats descripion of the project site
and surrounding:
The project site is located in Bensali village, adjacent
to Bharuch Dahej Highway. The project site is
characterised by mainly fallow lands and few
agriculture lands. Project site is almost plain without
much undulation. The dominant vegetation consists of
scrub vegetation of, Prosopis Juliflora. The trees
population in the project site is represented by
scattered Prosopis cineraria, one of the most
dominant trees in this part of Bharuch district.
Bhuki Khadi is passing very adjacent to the project
site. This portion of the River Bhuki near the project
site is under the influence of tidal flux from Narmada
estuary, which fills during the high tide and drains out
during low tide, exposing the steep slopes of mud
banks on both sides. The vegetation along the banks
of this river is dominated by thick patches of Prosopis
Juliflora. No mangrove vegetation were observed
along its banks
One, rain water fed, large depression is observed
near the project site, surrounded by the thick
vegetation of Prosopis Juliflora and Typha angustata.
This depression can be conserved for rainwater
harvesting or for water storage in the future
3.7.3.2 Habitats description of the study area:
The study area in this part of Bharuch district is
characterized by the large area devoted monsoon
depended agriculture. Few parts of the study area are
engaged in wheat cultivation while other parts are
engaged in cotton and Tuver cultivation. The villages
are scattered in between the large patches of agriculture lands and are of very small. The

Draft EIA for Shubhalakshami Polyesters Limited 3-31
tree cover in the study area is scanty restricted
only in the habituated areas of the village and
few along the boundary of the agricultural
fields and roadsides. The study area is also
characterized by large number of ditches and
pools, which were occupied by many
hydrophytes.
River Narmada flows along the southern
boundary of the study area before meeting the
Gulf of Khambath. Two more perennial rivers
passing through the study area, Bhan River and Bhuki River, they join together as Bhuki
Khadi and join the Narmada River near Kaladara village.
A large freshwater reservoir is created by the construction of check dam across, Bhan River
in Sadathara village before; it meets Bhuki River and proceed towards the Narmada
estuary.
The tree species, herbs, shrubs, and major crops, were documented during this base line
study. The list of floral species documented in the study area is enlisted in table 2-6.
3.7.4 Floral Diversity of the Study Area:
The objective this floral inventory of the study area, is to provide necessary information on
floristic structure in the study area for formulating effective management and conservation
measures. The climatic, edaphic and biotic variations with their complex interrelationship
and composition of species, which are adapted to these variations, have resulted in different
vegetation cover, characteristic of each region. The following account of floral inventory has
been, based on the field survey conducted for a short duration in the April, 2011, is not very
comprehensive data and is aimed only to give a general pattern of vegetation of this region
during the study period as a baseline data in absence of available secondary data. Listing of
the endangered, threatened and endemic species of flora in a locality and drawing the
attention to the occurrence of such species, would aid in creating awareness amongst the
local people as a whole to protect such species from extinction, and to take necessary
measures for their conservation. This type of floristic study is an inventory for such purpose
and hence a necessity.The dominant tree species, herbs, shrubs, climbers and major crops,
were documented during this base line study.
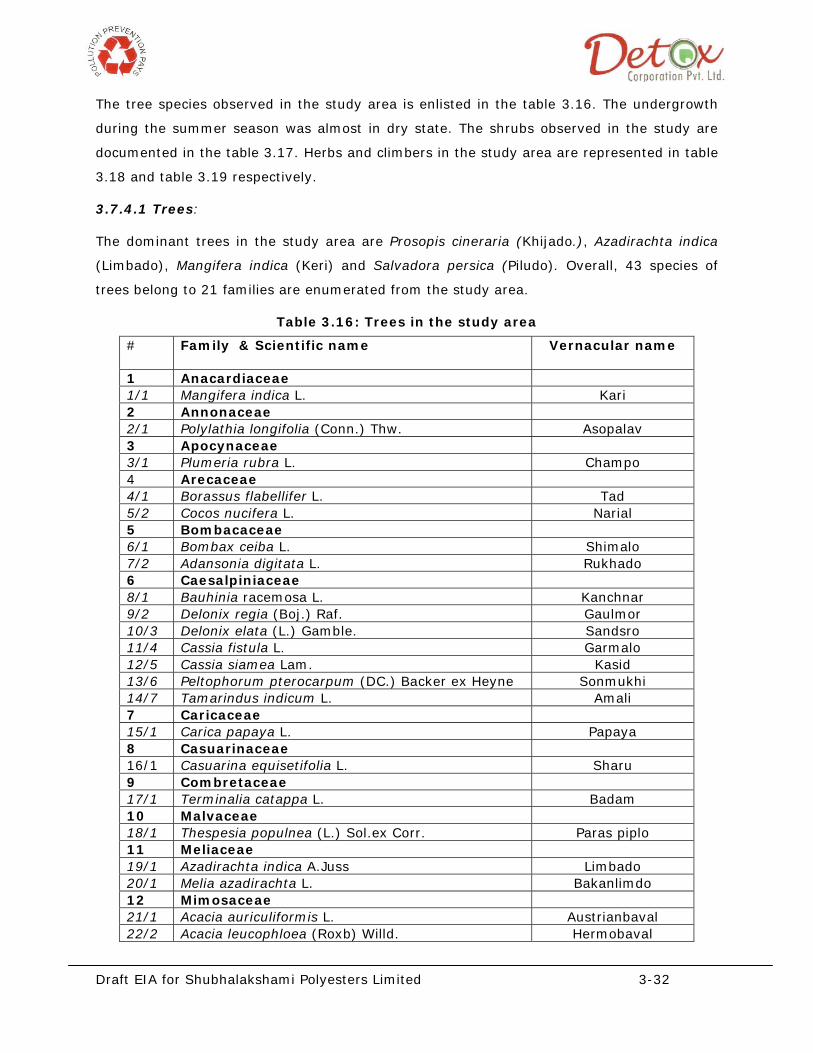
Draft EIA for Shubhalakshami Polyesters Limited 3-32
The tree species observed in the study area is enlisted in the table 3.16. The undergrowth
during the summer season was almost in dry state. The shrubs observed in the study are
documented in the table 3.17. Herbs and climbers in the study area are represented in table
3.18 and table 3.19 respectively.
3.7.4.1 Trees:
The dominant trees in the study area are Prosopis cineraria (Khijado.), Azadirachta indica
(Limbado), Mangifera indica (Keri) and Salvadora persica (Piludo). Overall, 43 species of
trees belong to 21 families are enumerated from the study area.
Table 3.16: Trees in the study area
#
Family & Scientific name Vernacular name
1 Anacardiaceae 1/1 Mangifera indica L. Kari 2 Annonaceae 2/1 Polylathia longifolia (Conn.) Thw. Asopalav 3 Apocynaceae 3/1 Plumeria rubra L. Champo 4 Arecaceae 4/1 Borassus flabellifer L. Tad 5/2 Cocos nucifera L. Narial 5 Bombacaceae 6/1 Bombax ceiba L. Shimalo 7/2 Adansonia digitata L. Rukhado 6 Caesalpiniaceae 8/1 Bauhinia racemosa L. Kanchnar 9/2 Delonix regia (Boj.) Raf. Gaulmor 10/3 Delonix elata (L.) Gamble. Sandsro 11/4 Cassia fistula L. Garmalo 12/5 Cassia siamea Lam. Kasid 13/6 Peltophorum pterocarpum (DC.) Backer ex Heyne Sonmukhi 14/7 Tamarindus indicum L. Amali 7 Caricaceae 15/1 Carica papaya L. Papaya 8 Casuarinaceae 16/1 Casuarina equisetifolia L. Sharu 9 Combretaceae 17/1 Terminalia catappa L. Badam 10 Malvaceae 18/1 Thespesia populnea (L.) Sol.ex Corr. Paras piplo 11 Meliaceae 19/1 Azadirachta indica A.Juss Limbado 20/1 Melia azadirachta L. Bakanlimdo 12 Mimosaceae 21/1 Acacia auriculiformis L. Austrianbaval 22/2 Acacia leucophloea (Roxb) Willd. Hermobaval