Embed Size (px)
Citation preview

65
Prepared by:The U.S. General Services Administration
For the National Foreign Affairs Training Center (NFATC)2016 Master Plan Update
Draft Environmental Assessment
December 2016
Draft Environmental Assessment National Foreign Affairs Training Center (NFATC) 2016 Master Plan Update Arlington, VA
Responsible Agency:
U.S. General Services Administration Public Buildings Service, National Capital Region
For information concerning this document contact: Ms. Alexis Gray, NEPA Compliance Specialist U.S. General Services Administration National Capital Region 301 7th Street, SW, Room 4004 Washington, DC 20407 [email protected]
Abstract
The United States (U.S.) General Services Administration (GSA), National Capital Region, has prepared
this Environmental Assessment (EA) for George P. Shultz National Foreign Affairs Training Center
(NFATC) 2016 Master Plan Update, located at 4000 Arlington Boulevard in Arlington County, Virginia.
The NFATC site comprises approximately 71 acres of land where the State Department maintains the
property as an educational and training center. The center serves as a major federal government
education facility serving trainees in the Foreign Service and also as a professional training and
conference center for Department of State(DOS) staff. The proposed action calls for phased
improvements to this essential facility to accommodate its evolving training mission, as well as its
growing campus population (on-site and distance learners) over the next decade. Improvements include
expansion of existing facilities, as well as construction of new facilities. All improvements will remain
within the existing, 71-acre site. Three Master Plan Alternatives and the No-Action Alternative have
been considered. The EA has been prepared pursuant to the National Environmental Policy Act (NEPA)
of 1969, as amended; the Council on Environmental Quality (CEQ) regulations implementing NEPA; the
GSA Public Buildings Service NEPA Desk Guide; and the National Historic Preservation Act (NHPA) of
1966, as amended.
December 2016

NFATC 2016 Master Plan Update EA
Appendices
A. Scoping Letters and Distribution Lists ............................................................................... A-1
B. Agency Coordination ......................................................................................................... B-1
C. Section 106 Consultation .................................................................................................. C-1
D. NFATC Traffic Analysis ....................................................................................................... D-1
E. Visual Analysis ................................................................................................................... E-1

NFATC 2016 Master Plan Update Draft EA
D-1 | P a g e
D. NFATC TRAFFIC ANALYSIS

DRAFT TRAFFIC STUDYNATIONAL FOREIGN AFFAIRS TRAINING CENTER:
MASTER PLAN UPDATE
NOVEMBER 18, 2016
NFATC Traffic Study
i
Contents1. Introduction .......................................................................................................................................... 1
2. Study Area ............................................................................................................................................. 1
3. Existing Conditions ................................................................................................................................ 4
3.1 Existing Conditions Traffic Volumes ................................................................................................. 4
3.2 Existing Conditions Operational Analysis ......................................................................................... 4
4. Future Conditions .................................................................................................................................. 7
4.1 Study Area Background Growth ....................................................................................................... 7
4.2 NFATC Expansion .............................................................................................................................. 7
4.3 Future Student and Faculty Population projections ...................................................................... 11
4.4 Planned Transportation Improvements ......................................................................................... 11
4.5 Trip Generation .............................................................................................................................. 12
4.6 Trip Distribution ............................................................................................................................. 13
4.7 Future Year 2017 Operational Analysis .......................................................................................... 17
4.8 Future Year 2025 Operational Analysis .......................................................................................... 24
5. Recommendations .............................................................................................................................. 30
5.1 Warrants and Operational Analysis ................................................................................................ 30
5.2 Opinion of Cost ............................................................................................................................... 33
NFATC Traffic Study
ii
TableofFiguresFigure 1‐1: NFATC Project Location……………………………………………………………………….………………………………..2
Figure 2‐1: NFATC Traffic Analysis Study Area ............................................................................................. 3
Figure 3‐1: Existing Conditions Peak Hour Traffic Volumes ......................................................................... 5
Figure 3‐2: Existing Conditions Peak Hour Levels of Service ........................................................................ 6
Figure 4‐1: 2017 Background Growth Traffic Volumes ................................................................................ 9
Figure 4‐2: 2025 Background Growth Traffic Volumes .............................................................................. 10
Figure 4‐3: Future Year Trip Distribution at NFATC Gates ......................................................................... 13
Figure 4‐4: 2017 No‐Build Trip Distribution Traffic Volumes ..................................................................... 14
Figure 4‐5: 2017 Build Trip Distribution Traffic Volumes ........................................................................... 15
Figure 4‐6: 2025 No‐Build Trip Distribution Traffic Volumes ..................................................................... 16
Figure 4‐7: 2025 Build Trip Distribution Traffic Volumes ........................................................................... 17
Figure 4‐8: 2017 No‐Build Total Traffic Volumes ....................................................................................... 20
Figure 4‐9: 2017 Build Total Traffic Volumes ............................................................................................. 21
Figure 4‐10: 2017 No‐Build Delay and Level of Service ............................................................................. 22
Figure 4‐11: 2017 Build Delay and Level of Service ................................................................................... 23
Figure 4‐12: 2025 No‐Build Total Traffic Volumes ..................................................................................... 26
Figure 4‐13: 2025 Build Total Traffic Volumes ........................................................................................... 27
Figure 4‐14: 2025 No‐Build Delay and Level of Service ............................................................................. 28
Figure 4‐15: 2025 Build Delay and Level of Service ................................................................................... 29
Figure 5‐1: 2025 Build Left Turn Lane Warrant at South Gate Intersection .............................................. 30
Figure 5‐2: 2025 Build Peak Hour Signal Warrant Analysis at South Gate Intersection ............................ 31
Figure 5‐3: 2025 Build Four Hour Signal Warrant Analysis at South Gate Intersection ............................ 31
Figure 5‐4: Delay and LOS at South Gate Intersection with Recommendations ....................................... 32
TableofTables:Table 4‐1: NFATC Master Plan Build‐Out Scenario Summary ...................................................................... 8
Table 4‐2: Annual Student Population Increase ........................................................................................ 11
Table 4‐3: Year 2017 NFATC Gate Queue Lengths ..................................................................................... 18
Table 4‐4: Year 2025 NFATC Gate Queue Lengths ..................................................................................... 24
Table 5‐1: 2025 Queue Lengths at South Gate Intersection with Recommendations .............................. 33
NFATC Traffic Study
1
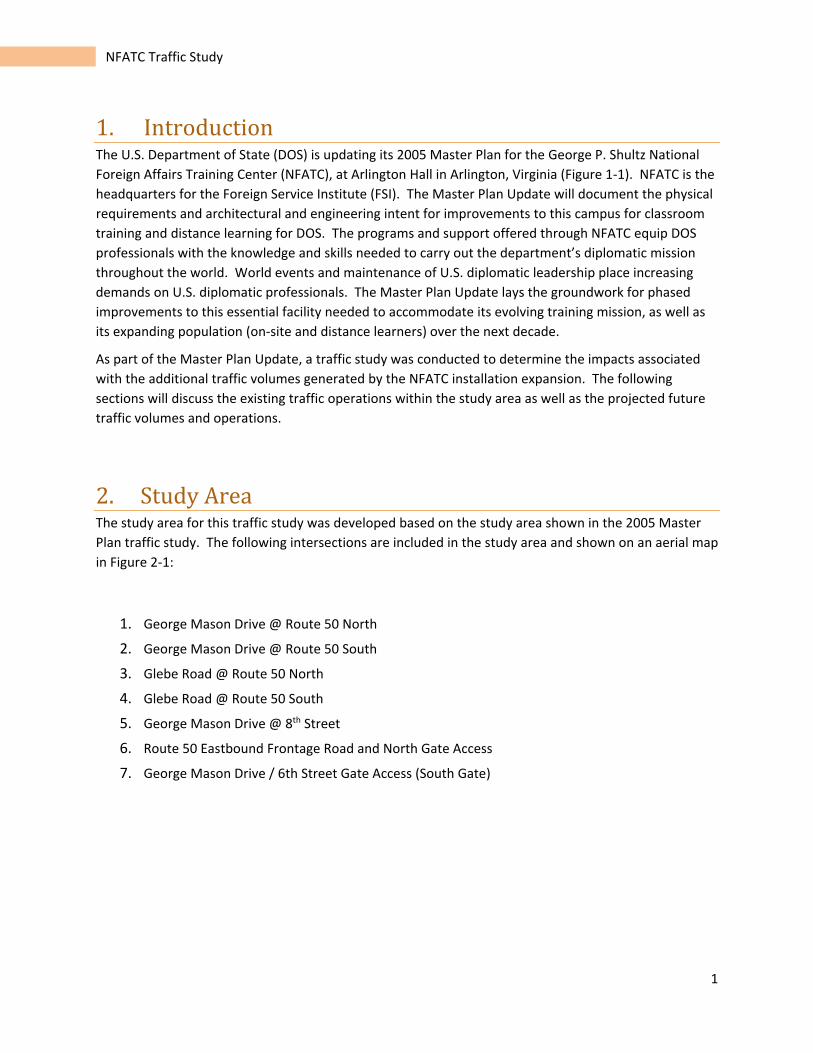
1. IntroductionThe U.S. Department of State (DOS) is updating its 2005 Master Plan for the George P. Shultz National
Foreign Affairs Training Center (NFATC), at Arlington Hall in Arlington, Virginia (Figure 1‐1). NFATC is the
headquarters for the Foreign Service Institute (FSI). The Master Plan Update will document the physical
requirements and architectural and engineering intent for improvements to this campus for classroom
training and distance learning for DOS. The programs and support offered through NFATC equip DOS
professionals with the knowledge and skills needed to carry out the department’s diplomatic mission
throughout the world. World events and maintenance of U.S. diplomatic leadership place increasing
demands on U.S. diplomatic professionals. The Master Plan Update lays the groundwork for phased
improvements to this essential facility needed to accommodate its evolving training mission, as well as
its expanding population (on‐site and distance learners) over the next decade.
As part of the Master Plan Update, a traffic study was conducted to determine the impacts associated
with the additional traffic volumes generated by the NFATC installation expansion. The following
sections will discuss the existing traffic operations within the study area as well as the projected future
traffic volumes and operations.
2.StudyAreaThe study area for this traffic study was developed based on the study area shown in the 2005 Master
Plan traffic study. The following intersections are included in the study area and shown on an aerial map
in Figure 2‐1:
1. George Mason Drive @ Route 50 North
2. George Mason Drive @ Route 50 South
3. Glebe Road @ Route 50 North
4. Glebe Road @ Route 50 South
5. George Mason Drive @ 8th Street
6. Route 50 Eastbound Frontage Road and North Gate Access
7. George Mason Drive / 6th Street Gate Access (South Gate)

NFATC Traffic Study
2
Figure 1‐1: NFATC Project Location

Study Intersections
1. George Mason Drive @ Route 50 North
2. George Mason Drive @ Route 50 South
3. Glebe Road @ Route 50 North
4. Glebe Road @ Route 50 South
5. George Mason Drive @ 8th Street
6. Route 50 Eastbound Frontage Road & North Gate Access
7. George Mason Drive / 6th Street Gate Access (South Gate)
NFATC Traffic Study
Figure 2-1
NFATC Study Area
Sheet 1 of 1
1
2
3
4
6
7
5

NFATC Traffic Study
4
3.ExistingConditions
3.1ExistingConditionsTrafficVolumesVehicular turning movement counts were collected at the study area intersections to conduct the
existing conditions traffic analysis. The counts were conducted during fiscal year 2015, Tuesday through
Thursday during the week of November 17, 2014 during the AM peak period (7‐9 AM) and PM peak
period (4:30‐6:30 PM). The adjacent roadways peak hours were determined to be 7:30 to 8:30 AM and
4:30 to 5:30 PM. The existing traffic volumes for the AM/PM peak hours are shown in Figure 3‐1.
3.2ExistingConditionsOperationalAnalysisThe operational analysis for the existing conditions was conducted using the HCM 2000 module of the
Synchro v8.0 software as specified by the VDOT Traffic Operations Analysis Tool Guidebook. The results
of the analysis are shown in Figure 3‐2 for both the AM and PM peak hours.
The results of the analysis show that all of the intersections included in the study currently operate at
LOS C or better during the AM peak hour. Individual turning movements or approaches that operate at
LOS E or LOS F during the AM peak hour are listed below:
1. George Mason Drive @ Route 50 North – None
2. George Mason Drive @ Route 50 South – None
3. Glebe Road @ Route 50 North – Westbound approach from Route 50 westbound off ramp
4. Glebe Road @ Route 50 South – Eastbound approach from Route 50 eastbound off ramp
5. George Mason Drive @ 8th Street – Eastbound approach from 8th Street
6. Route 50 Eastbound Frontage Road and North Gate Access – None
7. George Mason Drive / 6th Street (South Gate) – Eastbound and Westbound approaches
During the PM peak hour, all of the study intersections currently operate with an overall LOS C or better
with the exception of the unsignalized intersection of George Mason and 6th Street which operates at
LOS F. The significant delay results from large northbound and southbound traffic volumes containing
very few traffic flow gaps to allow for the turning movements from the eastbound and westbound
approaches. Individual turning movements or approaches that operate at LOS E or LOS F during the PM
peak hour are listed below:
1. George Mason Drive @ Route 50 North – None
2. George Mason Drive @ Route 50 South – None
3. Glebe Road @ Route 50 North – Westbound through movement and left turn from Route 50
westbound off ramp
4. Glebe Road @ Route 50 South – Eastbound approach from Route 50 eastbound off ramp
5. George Mason Drive @ 8th Street – Westbound approach from 8th Street
6. Route 50 Eastbound Frontage Road and North Gate Access – None
7. George Mason Drive / 6th Street Gate Access (South Gate) – Eastbound and Westbound
approaches


NFATC Traffic Study
7
4.FutureConditions
4.1StudyAreaBackgroundGrowthThe future conditions for the NFATC study area were analyzed for an interim year, 2017 and a build‐out
year, 2025. For each future year, a no‐build and full build‐out condition were analyzed. For both
conditions, the daily staff and faculty remained unchanged from the existing condition at a daily on‐site
rate of 1400 faculty members. Also for both scenarios, the daily student population includes an annual
increase of three percent. The only difference between the no‐build and build condition is the number
of daily students that will be on site within the NFATC study area; for the no‐build conditions, 450 of the
daily students will be off‐site while in the build conditions, all students will remain on site.
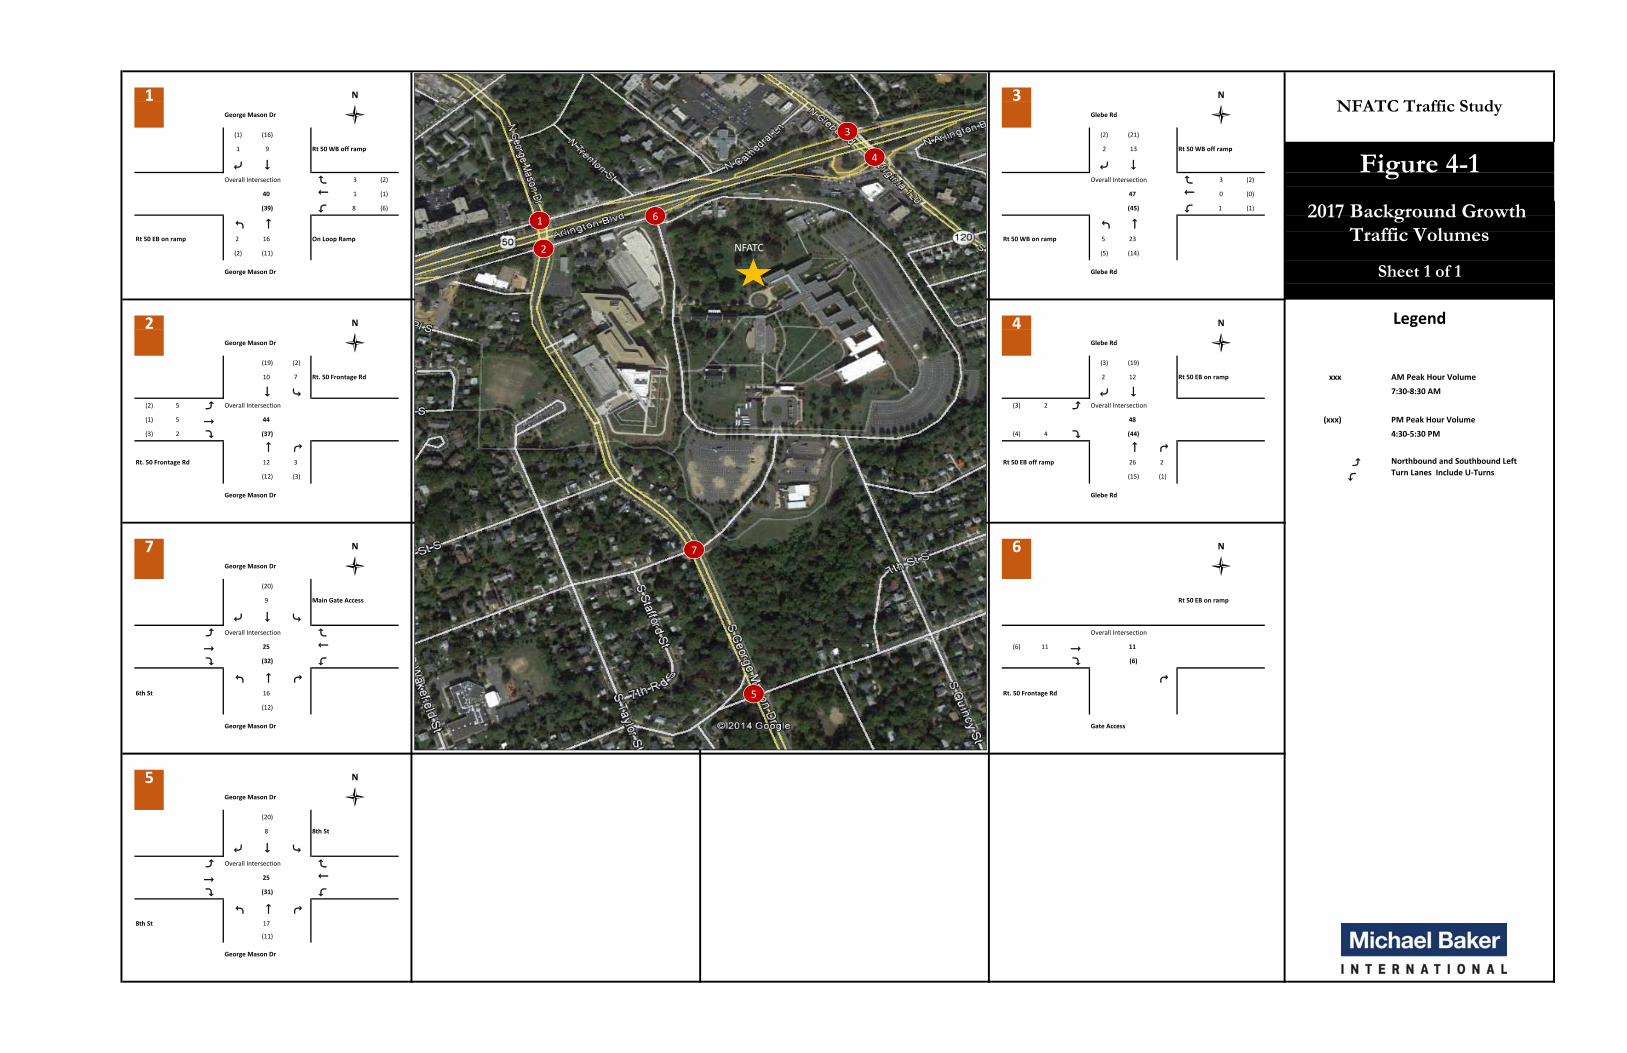
To develop future background traffic volumes, a 0.5 percent compounded annual growth rate was
applied (as directed by Arlington County) to the existing traffic volumes shown previously in Figure 3‐1.
This growth rate was not applied to individual turning movements into and out of neighborhoods
because the land is already built‐out and no further growth is expected for these movements. The
background growth rate was also not applied to the turning movements into and out of the NFATC
facility; these traffic volumes will be calculated using a trip generation procedure. The resulting future
traffic volumes to be added to the existing traffic volumes are shown in Figure 4‐1 for the year 2017, and
Figure 4‐2 for the year 2025.
4.2NFATCExpansionThere are three build options being evaluated in the Environmental Assessment (EA) for the NFATC
Master Plan Update. These are discussed in detail in the EA and a summary of each is presented in
Table 4‐1. Although the three site plans differ slightly, the type of development in each site plan is the
same. Depending on the build option, the proposed improvements under consideration include a new
or expanded Visitor Center, a new building for classes (Building B), and the expansion of Buildings F, K,
and the Child Care Facility. These new and/or expanded facilities are needed to accommodate projected
student growth and changing teaching needs.

NFATC Traffic Study
8
Table 4‐1: NFATC Master Plan Build‐Out Scenario Summary
Existing
Condition /
No‐Action
Alternative
Build
Alternative
1
Build
Alternative
2
Build
Alternative
3
gsf gsf gsf gsf
A Visitor Center 9,600 9,600 9,600 ‐
C Cafeteria & Dining 43,900 43,900 43,900 43,900
D Gym 12,480 12,480 12,480 12,480
E Old Main Building 43,000 43,000 43,000 43,000
F Classroom & Administration 391,450 391,450 391,450 391,450
G Central Plant 6,400 6,400 6,400 6,400
H Cottage 50 5,760 5,760 5,760 5,760
I Cottage 51 5,760 5,760 5,760 5,760
J Facility Management Office 6,456 6,456 6,456 6,456
K Multipurpose Building 87,850 87,850 87,850 87,850
L Childcare Center 10,891 10,891 10,891 10,891
623,547 623,547 623,547 613,947
Existing
Condition /
No‐Action
Alternative
Build
Alternative
1
Build
Alternative
2
Build
Alternative
3
gsf gsf gsf gsf
A New ‐ Visitor Center ‐ ‐ ‐ 6,010
A Expansion ‐ Visitors Center ‐ 6,800 5,078 ‐
B New ‐ Building B (5 floors) ‐ 200,797 200,797 200,797
F North Expansion ‐ Classroom & Administration (4 floors) ‐ 75,000 75,284 ‐
G Expansion ‐ Central Plant ‐ 6,165 6,165 ‐
K Expansion ‐ Auditorium 12,000 13,013 ‐
K Vertical Expansion ‐ Auditorium ‐ ‐ 25,452 ‐
F&K New ‐ Consolidate Buildings F&K (5 floors) ‐ ‐ ‐ 113,201
L Expansion ‐ Childcare Center ‐ 10,000 10,000 10,000
0 310,762 335,789 330,008
623,547 934,309 959,336 943,955Total Existing and New/Expansion Square Footage
Proposed New or Expansion Building NameBuilding
ID
Building
IDExisting Building Name
Subtotal of Existing Building Square Footage
Subtotal of Proposed Building GrossSquare Footage
1 N 0 0 3 N
George Mason Dr Glebe Rd
(1) (16) + + + + + + (2) (21)
1 9 Rt 50 WB off ramp + + + + + + 2 13 Rt 50 WB off ramp
⤶ ↓ @ @ ⤶ ↓ Overall Intersection
⤶
3 (2) + +
+ + + +
+ + Overall Intersection
⤶
3 (2)
40
↓
1 (1) + + @ +
@
+ + + + @ +
@
+ + 47
↓
0 (0)
(39)
⤷
8 (6) + + +
+ + + + +
+ + (45)
⤷
1 (1)
⤴ → @ @ ⤴ →
Rt 50 EB on ramp 2 16 On Loop Ramp + + + + + + Rt 50 WB on ramp 5 23
(2) (11) + + + + + + (5) (14)
George Mason Dr Glebe Rd
2 N 0 0 4 N
George Mason Dr Glebe Rd
+ (19) (2) + + + + + + (3) (19)
10 7 Rt. 50 Frontage Rd + + + + + + 2 12 Rt 50 EB on ramp xxx AM Peak Hour Volume
↓ ⤷ @ @ ⤶ ↓ 7:30‐8:30 AM
(2) 5 ⤷ Overall Intersection
+ +
+ + + +
+ + (3) 2 ⤷ Overall Intersection
(1) 5 ↓ 44 + + @ +
@
+ + + + @ +
@
+ + 48 (xxx) PM Peak Hour Volume
(3) 2 ⤶ (37)
+ + +
+ + + + +
+ + (4) 4 ⤶ (44)
4:30‐5:30 PM
+ + + → ⤵ @ @ → ⤵
Rt. 50 Frontage Rd 12 3 + + + + + + Rt 50 EB off ramp 26 2 ⤷
(12) (3) + + + + + + (15) (1)
⤷
George Mason Dr Glebe Rd
7 N 0 0 6 N
George Mason Dr
(20) + + + + + +
9 Main Gate Access + + + + + + Rt 50 EB on ramp
⤶ ↓ ⤷ + @ @
⤷ Overall Intersection
⤶
+ +
+ + + +
+ + Overall Intersection
↓ 25
↓
+ + @ +
@
+ + + + @ +
@
+ + (6) 11 ↓ 11
⤶ (32)
⤷
+ + +
+ + + + +
+ + ⤶ (6)
+ + + ⤴ → ⤵ @ @ ⤵
6th St 16 + + + + + + Rt. 50 Frontage Rd
(12) + + + + + +
George Mason Dr Gate Access
5 N
George Mason Dr
(20)
8 8th St
⤶ ↓ ⤷
⤷ Overall Intersection
⤶
+
↓ 25
↓
+
⤶ (31)
⤷
+
+ + + ⤴ → ⤵
8th St 17
(11)
George Mason Dr
Northbound and Southbound Left
Turn Lanes Include U‐Turns
NFATC Traffic Study
Legend
Figure 4-1
Sheet 1 of 1
2017 Background Growth Traffic Volumes
1
NFATC2
3
4
5
6
7

1 N 0 0 3 N
George Mason Dr Glebe Rd
(4) (58) + + + + + + (9) (78)
2 34 Rt 50 WB off ramp + + + + + + 7 48 Rt 50 WB off ramp
⤶ ↓ @ @ ⤶ ↓ Overall Intersection
⤶
11 (9) + +
+ + + +
+ + Overall Intersection
⤶
12 (8)
144
↓
3 (5) + + @ +
@
+ + + + @ +
@
+ + 175
↓
0 (0)
(149)
⤷
29 (22) + + +
+ + + + +
+ + (168)
⤷
3 (4)
⤴ → @ @ ⤴ →
Rt 50 EB on ramp 7 58 On Loop Ramp + + + + + + Rt 50 WB on ramp 20 85
(9) (42) + + + + + + (18) (51)
George Mason Dr Glebe Rd
2 N 0 0 4 N
George Mason Dr Glebe Rd
+ (73) (9) + + + + + + (12) (70)
39 25 Rt. 50 Frontage Rd + + + + + + 9 44 Rt 50 EB on ramp xxx AM Peak Hour Volume
↓ ⤷ @ @ ⤶ ↓ 7:30‐8:30 AM
(7) 19 ⤷ Overall Intersection
+ +
+ + + +
+ + (10) 8 ⤷ Overall Intersection
(3) 18 ↓ 167 + + @ +
@
+ + + + @ +
@
+ + 180 (xxx) PM Peak Hour Volume
(10) 6 ⤶ (137)
+ + +
+ + + + +
+ + (16) 15 ⤶ (166)
4:30‐5:30 PM
+ + + → ⤵ @ @ → ⤵
Rt. 50 Frontage Rd 47 13 + + + + + + Rt 50 EB off ramp 98 6 ⤷
(44) (13) + + + + + + (58) (4)
⤷
George Mason Dr Glebe Rd
7 N 0 0 6 N
George Mason Dr
(75) + + + + + +
35 Main Gate Access + + + + + + Rt 50 EB on ramp
⤶ ↓ ⤷ + + @ @ + +
⤷ Overall Intersection
⤶
+ +
+ + + +
+ + Overall Intersection
↓ 96
↓
+ + @ +
@
+ + + + @ +
@
+ + (23) 42 ↓ 42
⤶ (122)
⤷
+ + +
+ + + + +
+ + ⤶ (23)
+ + + ⤴ → ⤵ @ @ ⤵
6th St 61 + + + + + + Rt. 50 Frontage Rd
(47) + + + + + +
George Mason Dr Gate Access
5 N 0 0 0
George Mason Dr
(75) + + +
31 8th St + + +
⤶ ↓ ⤷ @
⤷ Overall Intersection
⤶
+ + + + + +
+ + + +
↓ 93
↓
+ + + + + + @ +
@
+ + + +
⤶ (116)
⤷
+ + +
+ + + + +
+ + + +
+ + + ⤴ → ⤵ @ @
8th St 62 + + + + + +
(41) + + + + + + + + +
George Mason Dr
NFATC Traffic Study
Northbound and Southbound Left
Turn Lanes Include U‐Turns
Legend
Figure 4-2
2025 Background Growth Traffic Volumes
Sheet 1 of 1
1
NFATC2
3
4
5
6
7

NFATC Traffic Study
11
4.3FutureStudentandFacultyPopulationprojectionsThe expansion of the current NFATC installation is being evaluated to accommodate changing teaching
techniques and future student attendance projections, which were provided by NFATC and as shown in
Table 4‐2. NFATC has stated that the number of students will increase at a three percent growth rate
through 2025 with or without a site expansion. However, without the site expansion, NFATC has stated
that 450 students will attend a different off‐site facility and will not be part of the daily on‐site
population. It was also stated that the faculty (teaching) staff is not expected to increase along with the
student population and will remain at a constant daily on‐site attendance of 1400 starting in 2018.
Table 4‐2 presents the percent increase in total on‐campus population in the far right column. This rate
was used to develop the vehicle trips generated by the NFATC installation for each of the analysis years.
As shown in the table, for the 2017 no‐build condition, the total on‐campus population is approximately
11 percent less than the 2015 population due to the daily off‐campus population.
Table 4‐2: Annual Student Population Increase
4.4PlannedTransportationImprovementsThe following planning documents were reviewed to note any planned transportation improvements in
the vicinity of the NFATC installation:
National Capital Region Transportation Planning Board 2015 Amendment ‐ Financially
Constrained Long‐Range Transportation Plan for the National Capital Region
Arlington County, VA Transportation Master Plan, updated April 2016
Washington Area Bicyclist Association Advocacy Priorities, 2013
Students
Student
Population
Increase from
Fiscal Year 2015
Faculty Total
Total Population
Increase from
Fiscal Year 2015
FY2015 0 1,765 0 1,400 3,165 0
FY2017 450 1,452 ‐18% 1,370 2,822 ‐11%
FY2025 450 1,959 11% 1,400 3,359 6%
Students
Student
Population
Increase from
Fiscal Year 2015
Faculty Total
Total Population
Increase from
Fiscal Year 2015
FY2015 0 1,765 0 1,400 3,165 0
FY2017 0 1,902 8% 1,370 3,272 3%
FY2025 0 2,409 37% 1,400 3,809 20%
Fiscal
Year
Daily Off‐
Campus
Population
Daily On‐Campus PopulationNo‐Build Condition
Build Condition
Fiscal
Year
Daily Off‐
Campus
Population
Daily On‐Campus Population
NFATC Traffic Study
12
Arlington County, VA, Budget and Finance – Adopted FY 2015 – FY 2024 Capital Improvement
Plan
Arlington County, VA, Budget and Finance – Proposed FY 2017 – FY 2026 Capital Improvement
Plan
Arlington County, VA, Projects and Planning ‐ Private Development Projects, 2016
The Arlington County, VA Transportation Master Plan (ACTMP) was last updated in April 2016 and
includes a comprehensive list of transportation projects envisioned for the entire county. According to
the ACTMP, intersection roadway improvements are planned for the intersection of Arlington Boulevard
(Route 50) and Glebe Road. The project is not yet completely defined or programmed into the county’s
adopted FY 2015 – FY 2024 Capital Improvement Plan (CIP) or the proposed FY 2017 – FY 2026 CIP;
however, both the adopted and proposed CIPs’ “Metro and Transportation” sections include Arlington
Boulevard as a focus area for the implementation of Arlington’s complete streets program. The
complete streets program includes projects designed to provide accessible walking routes, adequate
transit stops, curbside parking and loading areas, and safe accommodations for bicycling. As a
component of the Complete Streets Program, the Washington Area Bicyclist Association (WABA) plans
to work with Arlington and Fairfax Counties to complete the planning and development of a 22‐mile
long bike path along the Route 50 corridor. Currently, the portion of Arlington Boulevard adjacent to
NFATC is considered not “bike‐friendly,” and represents a focus area for future bicycle infrastructure
development.
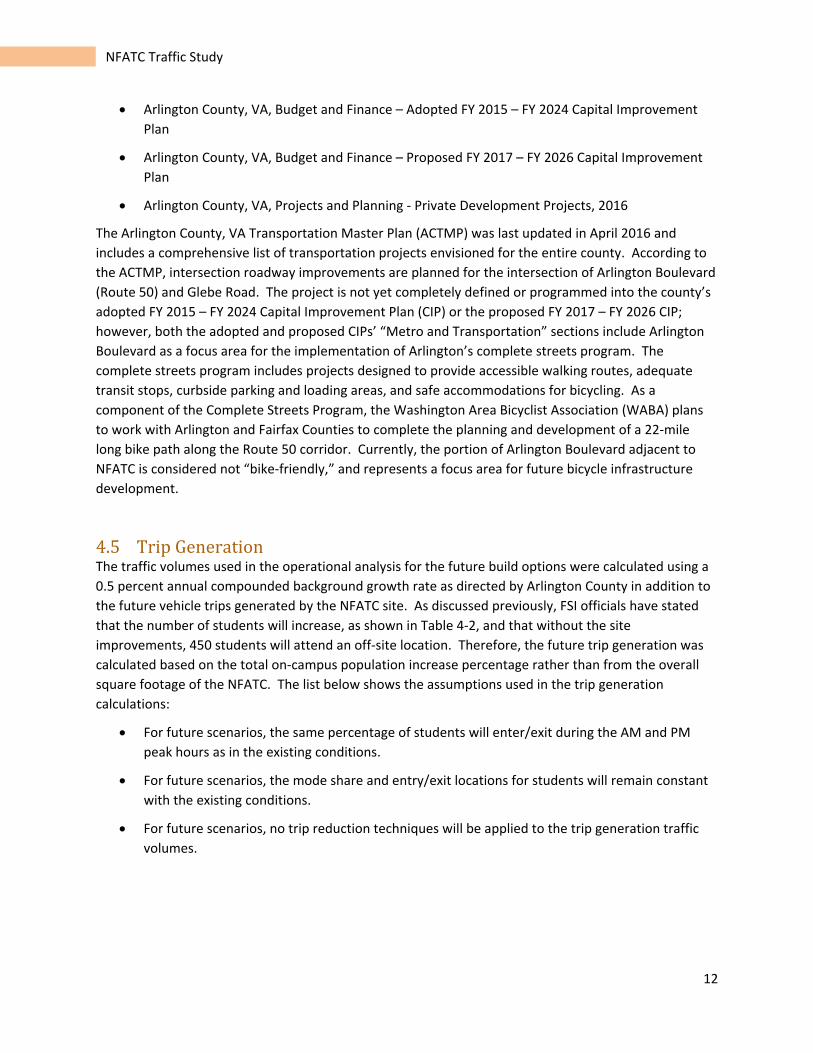
4.5TripGenerationThe traffic volumes used in the operational analysis for the future build options were calculated using a
0.5 percent annual compounded background growth rate as directed by Arlington County in addition to
the future vehicle trips generated by the NFATC site. As discussed previously, FSI officials have stated
that the number of students will increase, as shown in Table 4‐2, and that without the site
improvements, 450 students will attend an off‐site location. Therefore, the future trip generation was
calculated based on the total on‐campus population increase percentage rather than from the overall
square footage of the NFATC. The list below shows the assumptions used in the trip generation
calculations:
For future scenarios, the same percentage of students will enter/exit during the AM and PM
peak hours as in the existing conditions.
For future scenarios, the mode share and entry/exit locations for students will remain constant
with the existing conditions.
For future scenarios, no trip reduction techniques will be applied to the trip generation traffic
volumes.

NFATC Traffic Study
13
4.6TripDistributionBased on the aforementioned assumptions, the vehicle trip distribution for the projected student
population is also expected to remain constant with the existing conditions. The observed trip
distribution percentages for the north and south gate intersections were applied to the future vehicle
trips for the no‐build and build scenarios and are shown in Figure 4‐3 (PM peak hour percentages are
shown in bold). Figure 4‐4 and Figure 4‐5 show how the future trips will be distributed throughout the
study area roadway network for the 2017 no‐build and build scenarios. Figure 4‐6 and 4‐7 show the
future trip distribution for the 2025 no‐build and build scenarios.
Figure 4‐3: Future Year Trip Distribution at NFATC Gates
7 N
George Mason Dr 19.0%
28.9% South Gate
⤶ ↓ ⤷ + +
⤷
⤶18.2% 21.8%
0.0% 0.4% ↓
↓0.0% 0.0%
⤶
⤷15.9% 26.5%
+ + + ⤴ → ⤵
6th St 25.6%
20.6%
George Mason Dr
6 N
Rt 50 EB on ramp
+ +
↓60.3% 45.1% ⤶
⤵
Rt. 50 Frontage Rd 65.9%
51.7%
North Gate

1 N 0 0 3 N
George Mason Dr Glebe Rd
‐(1) + + + + + + (0)
‐3 Rt 50 WB off ramp + + + + + + ‐1 Rt 50 WB off ramp
⤶ ↓ @ @ ⤶ ↓
⤶
+ +
+ + + +
+ +
⤶
↓
+ + @ +
@
+ + + + @ +
@
+ +
↓
⤷
‐3 (0) + + +
+ + + + +
+ +
⤷
⤴ → @ @ ⤴ →
Rt 50 EB on ramp 0 0 On Loop Ramp + + + + + + Rt 50 WB on ramp 0
(0) ‐(2) + + + + + + ‐(1)
George Mason Dr Glebe Rd
2 N 0 0 4 N
George Mason Dr Glebe Rd
+ (0) ‐(1) + + + + + +
‐3 ‐3 + + + + + + Rt 50 EB on ramp xxx AM Peak Hour Volume
↓ ⤷ @ @ ⤶ ↓ Generation Volume
⤷
+ +
+ + + +
+ + ‐(1) 0 ⤷
7:30‐8:30 AM
(0) ‐2 ↓ + + @ +
@
+ + + + @ +
@
+ +
(0) 0 ⤶
+ + +
+ + + + +
+ + ⤶
+ + + → ⤵ @ @ → ⤵ (xxx) PM Peak Hour Volume
Rt. 50 Frontage Rd 0 0 + + + + + + Rt 50 EB off ramp Generation Volume
‐(2) (0) + + + + + + 4:30‐5:30 PM
George Mason Dr Glebe Rd
⤷⤷
7 N 0 0 6 N
George Mason Dr
(0) + + + + + +
‐3 Main Gate Access + + + + + + Rt 50 EB on ramp
⤶ ↓ ⤷ + + @ @ + +
⤷
⤶
0 ‐(2) + +
+ + + +
+ +
(0) 0 ↓
↓
0 (0) + + @ +
@
+ + + + @ +
@
+ + (0) 0 ↓
⤶
⤷
0 ‐(2) + + +
+ + + + +
+ + ‐(1) ‐5 ⤶
+ + + ⤴ → ⤵ @ @ ⤵
6th St ‐3 + + + + + + Rt. 50 Frontage Rd ‐1
(0) + + + + + + ‐(5)
George Mason Dr Gate Access
5 N 0 0 0
George Mason Dr
(0) ‐(2) (0) + + + + + +
0 0 0 8th St + + + + + +
⤶ ↓ ⤷ @ @
(0) 0 ⤷
⤶
0 (0) + +
+ + + +
+ + + +
↓
↓
+ + @ +
@
+ + + + @ +
@
+ + + +
⤶
⤷
+ + +
+ + + + +
+ + + +
+ + + ⤴ → ⤵ @ @
8th St ‐3 + + + + + +
(0) + + + + + +
George Mason Dr
Legend
Northbound and Southbound Left
Turn Lanes Include U‐Turns
Figure 4-4
2017 No-Build Trip Distribution Traffic Volumes
Sheet 1 of 1
NFATC Traffic Study
1
NFATC2
3
4
5
6
7

1 N 0 0 3 N
George Mason Dr Glebe Rd
(1) + + + + + + (0)
5 Rt 50 WB off ramp + + + + + + 1 Rt 50 WB off ramp
⤶ ↓ @ @ ⤶ ↓
⤶
+ +
+ + + +
+ +
⤶
↓
+ + @ +
@
+ + + + @ +
@
+ +
↓
⤷
4 (0) + + +
+ + + + +
+ +
⤷
⤴ → @ @ ⤴ →
Rt 50 EB on ramp 0 0 On Loop Ramp + + + + + + Rt 50 WB on ramp 0
(1) (2) + + + + + + (2)
George Mason Dr Glebe Rd
2 N 0 0 4 N
George Mason Dr Glebe Rd
+ (0) (1) + + + + + +
4 5 + + + + + + Rt 50 EB on ramp xxx AM Peak Hour Volume
↓ ⤷ @ @ ⤶ ↓ Generation Volume
⤷
+ +
+ + + +
+ + (2) 0 ⤷
7:30‐8:30 AM
(0) 4 ↓ + + @ +
@
+ + + + @ +
@
+ +
(0) 1 ⤶
+ + +
+ + + + +
+ + ⤶
+ + + → ⤵ @ @ → ⤵ (xxx) PM Peak Hour Volume
Rt. 50 Frontage Rd 0 0 + + + + + + Rt 50 EB off ramp Generation Volume
(3) (1) + + + + + + 4:30‐5:30 PM
George Mason Dr Glebe Rd
⤷⤷
7 N 0 0 6 N
George Mason Dr
(0) + + + + + +
5 Main Gate Access + + + + + + Rt 50 EB on ramp
⤶ ↓ ⤷ + + @ @ + +
⤷
⤶
0 (4) + +
+ + + +
+ +
(0) 0 ↓
↓
0 (0) + + @ +
@
+ + + + @ +
@
+ + (1) 0 ↓
⤶
⤷
0 (4) + + +
+ + + + +
+ + (1) 9 ⤶
+ + + ⤴ → ⤵ @ @ ⤵
6th St 5 + + + + + + Rt. 50 Frontage Rd 1
(0) + + + + + + (9)
George Mason Dr Gate Access
5 N 0 0 0
George Mason Dr
(0) (4) (0) + + + + + +
0 0 0 8th St + + + + + +
⤶ ↓ ⤷ @ @(0) 0 ⤷
⤶
0 (0) + +
+ + + +
+ +
↓
↓
+ + @ +
@
+ + + + @ +
@
+ +
⤶
⤷
+ + +
+ + + + +
+ +
+ + + ⤴ → ⤵ @ @
8th St 4 + + + + + +
(0) + + + + + +
George Mason Dr
Legend
Northbound and Southbound Left
Turn Lanes Include U‐Turns
Figure 4-5
2017 Build Trip Distribution Traffic Volumes
Sheet 1 of 1
NFATC Traffic Study
1
NFATC2
3
4
5
6
7

1 N 0 0 3 N
George Mason Dr Glebe Rd
(2) + + + + + + (0)
10 Rt 50 WB off ramp + + + + + + 2 Rt 50 WB off ramp
⤶ ↓ @ @ ⤶ ↓
⤶
+ +
+ + + +
+ +
⤶
↓
+ + @ +
@
+ + + + @ +
@
+ +
↓
⤷
8 (1) + + +
+ + + + +
+ +
⤷
⤴ → @ @ ⤴ →
Rt 50 EB on ramp 0 1 On Loop Ramp + + + + + + Rt 50 WB on ramp 0
(1) (4) + + + + + + (3)
George Mason Dr Glebe Rd
2 N 0 0 4 N
George Mason Dr Glebe Rd
+ (1) (2) + + + + + +
9 9 + + + + + + Rt 50 EB on ramp xxx AM Peak Hour Volume
↓ ⤷ @ @ ⤶ ↓ Generation Volume
⤷
+ +
+ + + +
+ + (3) 0 ⤷
7:30‐8:30 AM
(0) 6 ↓ + + @ +
@
+ + + + @ +
@
+ +
(0) 1 ⤶
+ + +
+ + + + +
+ + ⤶
+ + + → ⤵ @ @ → ⤵ (xxx) PM Peak Hour Volume
Rt. 50 Frontage Rd 1 0 + + + + + + Rt 50 EB off ramp Generation Volume
(5) (2) + + + + + + 4:30‐5:30 PM
George Mason Dr Glebe Rd
⤷⤷
7 N 0 0 6 N
George Mason Dr
(1) + + + + + +
10 Main Gate Access + + + + + + Rt 50 EB on ramp
⤶ ↓ ⤷ + + @ @ + +
⤷
⤶
1 (7) + +
+ + + +
+ +
(0) 0 ↓
↓
0 (0) + + @ +
@
+ + + + @ +
@
+ + (2) 0 ↓
⤶
⤷
0 (8) + + +
+ + + + +
+ + (2) 15 ⤶
+ + + ⤴ → ⤵ @ @ ⤵
6th St 9 + + + + + + Rt. 50 Frontage Rd 2
(1) + + + + + + (16)
George Mason Dr Gate Access
5 N 0 0 0
George Mason Dr
(0) (7) (0) + + + + + +
0 0 0 8th St + + + + + +
⤶ ↓ ⤷ @ @(0) 0 ⤷
⤶
1 (0) + +
+ + + +
+ +
↓
↓
+ + @ +
@
+ + + + @ +
@
+ +
⤶
⤷
+ + +
+ + + + +
+ +
+ + + ⤴ → ⤵ @ @
8th St 8 + + + + + +
(1) + + + + + +
George Mason Dr
Legend
Northbound and Southbound Left
Turn Lanes Include U‐Turns
Figure 4-6
2025 No-Build Trip Distribution Traffic Volumes
Sheet 1 of 1
NFATC Traffic Study
1
NFATC2
3
4
5
6
7

1 N 0 0 3 N
George Mason Dr Glebe Rd
(6) + + + + + + (1)
31 Rt 50 WB off ramp + + + + + + 7 Rt 50 WB off ramp
⤶ ↓ @ @ ⤶ ↓
⤶
+ +
+ + + +
+ +
⤶
↓
+ + @ +
@
+ + + + @ +
@
+ +
↓
⤷
27 (2) + + +
+ + + + +
+ +
⤷
⤴ → @ @ ⤴ →
Rt 50 EB on ramp 0 2 On Loop Ramp + + + + + + Rt 50 WB on ramp 1
(3) (14) + + + + + + (10)
George Mason Dr Glebe Rd
2 N 0 0 4 N
George Mason Dr Glebe Rd
+ (2) (6) + + + + + +
29 29 + + + + + + Rt 50 EB on ramp xxx AM Peak Hour Volume
↓ ⤷ @ @ ⤶ ↓ Generation Volume
⤷
+ +
+ + + +
+ + (10) 1 ⤷
7:30‐8:30 AM
(2) 22 ↓ + + @ +
@
+ + + + @ +
@
+ +
(0) 4 ⤶
+ + +
+ + + + +
+ + ⤶
+ + + → ⤵ @ @ → ⤵ (xxx) PM Peak Hour Volume
Rt. 50 Frontage Rd 2 0 + + + + + + Rt 50 EB off ramp Generation Volume
(17) (5) + + + + + + 4:30‐5:30 PM
George Mason Dr Glebe Rd
⤷⤷
7 N 0 0 6 N
George Mason Dr
(2) + + + + + +
33 Main Gate Access + + + + + + Rt 50 EB on ramp
⤶ ↓ ⤷ + + @ @ + +
⤷
⤶
2 (22) + +
+ + + +
+ +
(0) 0 ↓
↓
0 (0) + + @ +
@
+ + + + @ +
@
+ + (5) 0 ↓
⤶
⤷
1 (27) + + +
+ + + + +
+ + (8) 51 ⤶
+ + + ⤴ → ⤵ @ @ ⤵
6th St 29 + + + + + + Rt. 50 Frontage Rd 6
(3) + + + + + + (52)
George Mason Dr Gate Access
5 N 0 0 0
George Mason Dr
(1) (25) (1) + + + + + +
0 1 0 8th St + + + + + +
⤶ ↓ ⤷ @ @(0) 1 ⤷
⤶
2 (0) + +
+ + + +
+ + +
↓
↓
+ + @ +
@
+ + + + @ +
@
+ + +
⤶
⤷
+ + +
+ + + + +
+ + +
+ + + ⤴ → ⤵ @ @
8th St 26 + + + + + +
(3) + + + + + +
George Mason Dr
Legend
Northbound and Southbound Left
Turn Lanes Include U‐Turns
Figure 4-7
2025 Build Trip Distribution Traffic Volumes
Sheet 1 of 1
NFATC Traffic Study
1
NFATC2
3
4
5
6
7
NFATC Traffic Study
18
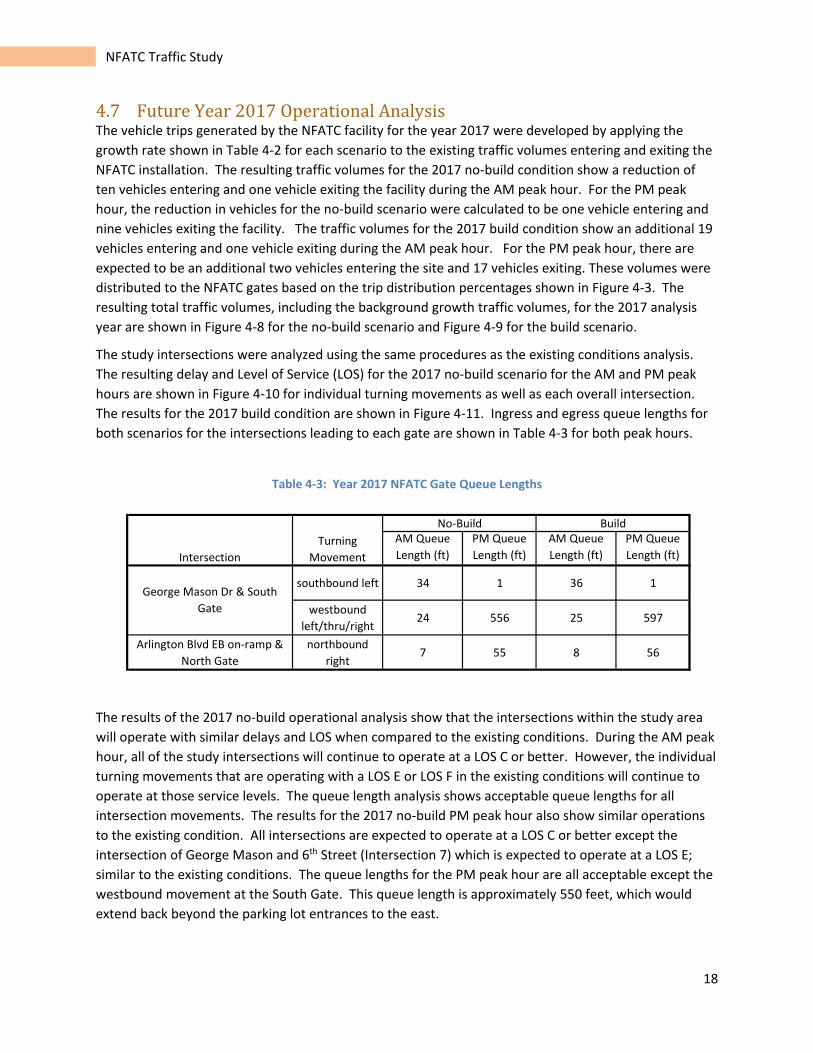
4.7FutureYear2017OperationalAnalysisThe vehicle trips generated by the NFATC facility for the year 2017 were developed by applying the
growth rate shown in Table 4‐2 for each scenario to the existing traffic volumes entering and exiting the
NFATC installation. The resulting traffic volumes for the 2017 no‐build condition show a reduction of
ten vehicles entering and one vehicle exiting the facility during the AM peak hour. For the PM peak
hour, the reduction in vehicles for the no‐build scenario were calculated to be one vehicle entering and
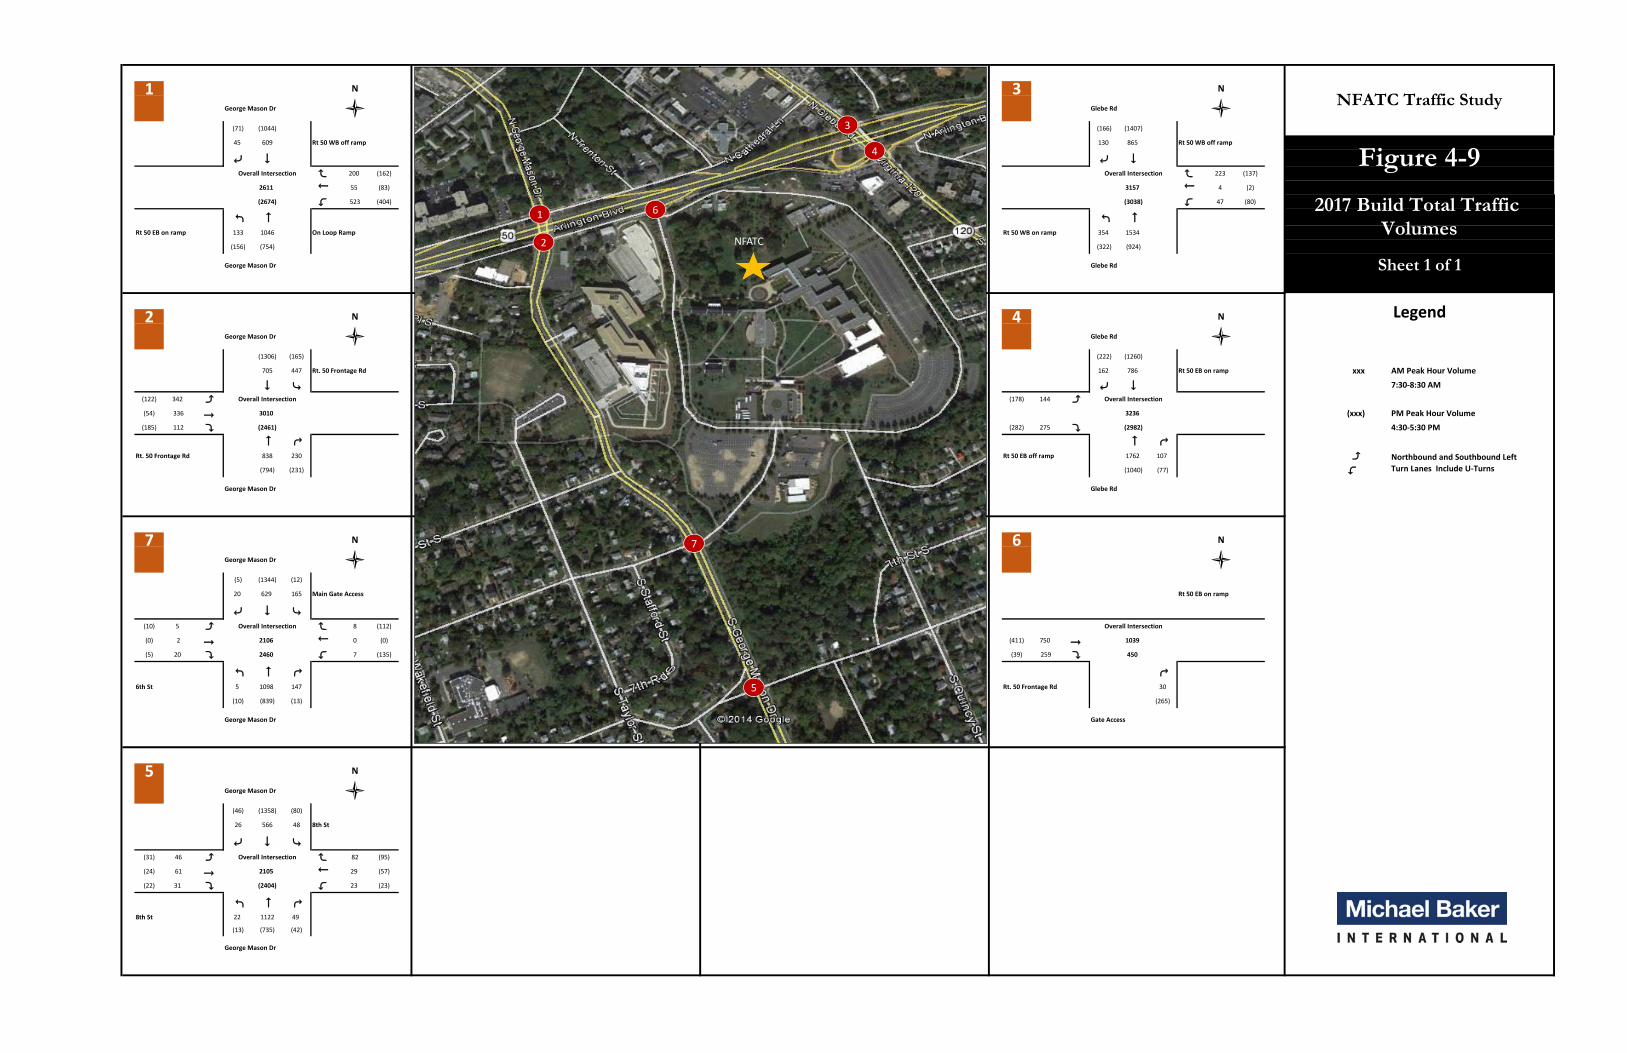
nine vehicles exiting the facility. The traffic volumes for the 2017 build condition show an additional 19
vehicles entering and one vehicle exiting during the AM peak hour. For the PM peak hour, there are
expected to be an additional two vehicles entering the site and 17 vehicles exiting. These volumes were
distributed to the NFATC gates based on the trip distribution percentages shown in Figure 4‐3. The
resulting total traffic volumes, including the background growth traffic volumes, for the 2017 analysis
year are shown in Figure 4‐8 for the no‐build scenario and Figure 4‐9 for the build scenario.
The study intersections were analyzed using the same procedures as the existing conditions analysis.
The resulting delay and Level of Service (LOS) for the 2017 no‐build scenario for the AM and PM peak
hours are shown in Figure 4‐10 for individual turning movements as well as each overall intersection.
The results for the 2017 build condition are shown in Figure 4‐11. Ingress and egress queue lengths for
both scenarios for the intersections leading to each gate are shown in Table 4‐3 for both peak hours.
Table 4‐3: Year 2017 NFATC Gate Queue Lengths
The results of the 2017 no‐build operational analysis show that the intersections within the study area
will operate with similar delays and LOS when compared to the existing conditions. During the AM peak
hour, all of the study intersections will continue to operate at a LOS C or better. However, the individual
turning movements that are operating with a LOS E or LOS F in the existing conditions will continue to
operate at those service levels. The queue length analysis shows acceptable queue lengths for all
intersection movements. The results for the 2017 no‐build PM peak hour also show similar operations
to the existing condition. All intersections are expected to operate at a LOS C or better except the
intersection of George Mason and 6th Street (Intersection 7) which is expected to operate at a LOS E;
similar to the existing conditions. The queue lengths for the PM peak hour are all acceptable except the
westbound movement at the South Gate. This queue length is approximately 550 feet, which would
extend back beyond the parking lot entrances to the east.
AM Queue
Length (ft)
PM Queue
Length (ft)
AM Queue
Length (ft)
PM Queue
Length (ft)
southbound left 34 1 36 1
westbound
left/thru/right24 556 25 597
Arlington Blvd EB on‐ramp &
North Gate
northbound
right7 55 8 56
George Mason Dr & South
Gate
BuildNo‐Build
Turning
MovementIntersection

NFATC Traffic Study
19
The results of the operational analysis shown in Figure 4‐11 for the 2017 build condition show that the study area intersections will operate similarly to the 2017 no‐build condition and the existing condition. This is due to the low student and background growth rates (discussed in Sections 4.1 and 4.3) which are expected to add a minimal amount of traffic to the roadway network for both 2017 scenarios. Similar to the operational results for the 2017 no‐build scenario, all study intersections are projected to operate with a LOS C or better for both peak periods with the exception of the intersection of George Mason and 6th Street (Intersection 7) which is expected to operate at a LOS F. Although this location has a degraded LOS when compared to the 2017 no‐build condition, the overall delay is only expected to increase approximately eight seconds. The queue lengths for the PM peak hour are all acceptable except the westbound movement at the South Gate. This queue length is approximately 600 feet, which would extend back beyond the parking lot entrances to the east.

1 N 0 0 3 N
George Mason Dr Glebe Rd
(71) (1042) + + + + + + (166) (1407)
45 601 Rt 50 WB off ramp + + + + + + 128 865 Rt 50 WB off ramp
⤶ ↓ @ @ ⤶ ↓ Overall Intersection
⤶
200 (162) + +
+ + + +
+ + Overall Intersection
⤶
223 (137)
2596
↓
55 (83) + + @ +
@
+ + + + @ +
@
+ + 3155
↓
4 (2)
(2667)
⤷
516 (404) + + +
+ + + + +
+ + (3035)
⤷
47 (80)
⤴ → @ @ ⤴ →
Rt 50 EB on ramp 133 1046 On Loop Ramp + + + + + + Rt 50 WB on ramp 354 1534
(155) (750) + + + + + + (322) (921)
George Mason Dr Glebe Rd
2 N 0 0 4 N
George Mason Dr Glebe Rd
+ (1306) (163) + + + + + + (222) (1260)
698 439 Rt. 50 Frontage Rd + + + + + + 162 786 Rt 50 EB on ramp xxx AM Peak Hour Volume
↓ ⤷ @ @ ⤶ ↓ 7:30‐8:30 AM
(122) 342 ⤷ Overall Intersection
+ +
+ + + +
+ + (175) 144 ⤷ Overall Intersection
(54) 330 ↓ 2988 + + @ +
@
+ + + + @ +
@
+ + 3236 (xxx) PM Peak Hour Volume
(185) 111 ⤶ (2456)
+ + +
+ + + + +
+ + (282) 275 ⤶ (2979)
4:30‐5:30 PM
+ + + → ⤵ @ @ → ⤵
Rt. 50 Frontage Rd 838 230 + + + + + + Rt 50 EB off ramp 1762 107 ⤷
(789) (230) + + + + + + (1040) (77)
⤷
George Mason Dr Glebe Rd
7 N 0 0 6 N
George Mason Dr
(5) (1344) (12) + + + + + +
20 629 157 Main Gate Access + + + + + + Rt 50 EB on ramp
⤶ ↓ ⤷ + + @ @ + +
(10) 5 ⤷ Overall Intersection
⤶
8 (106) + +
+ + + +
+ + Overall Intersection
(0) 2 ↓ 2090
↓
0 (0) + + @ +
@
+ + + + @ +
@
+ + (410) 750 ↓ 1023
(5) 20 ⤶ 2448
⤷
7 (129) + + +
+ + + + +
+ + (37) 245 ⤶ 447
+ + + ⤴ → ⤵ @ @ ⤵
6th St 5 1098 139 + + + + + + Rt. 50 Frontage Rd 28
(10) (839) (13) + + + + + + (251)
George Mason Dr Gate Access
5 N 0 0 0
George Mason Dr
(46) (1352) (80) + + +
26 566 48 8th St + + +
⤶ ↓ ⤷ @
(31) 46 ⤷ Overall Intersection
⤶
82 (95) + +
+ + + +
+ + + +
(24) 61 ↓ 2098
↓
29 (57) + + @ +
@
+ + + + @ +
@
+ + + +
(22) 31 ⤶ (2398)
⤷
23 (23) + + +
+ + + + +
+ + + +
+ + + ⤴ → ⤵ @ @
8th St 22 1115 49 + + + + + +
(13) (735) (42) + + + + + +
George Mason Dr
Northbound and Southbound Left
Turn Lanes Include U‐Turns
Figure 4-8
2017 No-Build Total Traffic Volumes
Sheet 1 of 1
Legend
NFATC Traffic Study
1
NFATC2
3
4
5
6
7
1 N 0 0 3 N
George Mason Dr Glebe Rd
(71) (1044) + + + + + + (166) (1407)
45 609 Rt 50 WB off ramp + + + + + + 130 865 Rt 50 WB off ramp
⤶ ↓ @ @ ⤶ ↓ Overall Intersection
⤶
200 (162) + +
+ + + +
+ + Overall Intersection
⤶
223 (137)
2611
↓
55 (83) + + @ +
@
+ + + + @ +
@
+ + 3157
↓
4 (2)
(2674)
⤷
523 (404) + + +
+ + + + +
+ + (3038)
⤷
47 (80)
⤴ → @ @ ⤴ →
Rt 50 EB on ramp 133 1046 On Loop Ramp + + + + + + Rt 50 WB on ramp 354 1534
(156) (754) + + + + + + (322) (924)
George Mason Dr Glebe Rd
2 N 0 0 4 N
George Mason Dr Glebe Rd
+ (1306) (165) + + + + + + (222) (1260)
705 447 Rt. 50 Frontage Rd + + + + + + 162 786 Rt 50 EB on ramp xxx AM Peak Hour Volume
↓ ⤷ @ @ ⤶ ↓ 7:30‐8:30 AM
(122) 342 ⤷ Overall Intersection
+ +
+ + + +
+ + (178) 144 ⤷ Overall Intersection
(54) 336 ↓ 3010 + + @ +
@
+ + + + @ +
@
+ + 3236 (xxx) PM Peak Hour Volume
(185) 112 ⤶ (2461)
+ + +
+ + + + +
+ + (282) 275 ⤶ (2982)
4:30‐5:30 PM
+ + + → ⤵ @ @ → ⤵
Rt. 50 Frontage Rd 838 230 + + + + + + Rt 50 EB off ramp 1762 107 ⤷
(794) (231) + + + + + + (1040) (77)
⤷
George Mason Dr Glebe Rd
7 N 0 0 6 N
George Mason Dr
(5) (1344) (12) + + + + + + +
20 629 165 Main Gate Access + + + + + + + Rt 50 EB on ramp
⤶ ↓ ⤷ + + @ @ + +
(10) 5 ⤷ Overall Intersection
⤶
8 (112) + +
+ + + +
+ + Overall Intersection
(0) 2 ↓ 2106
↓
0 (0) + + @ +
@
+ + + + @ +
@
+ + (411) 750 ↓ 1039
(5) 20 ⤶ 2460
⤷
7 (135) + + +
+ + + + +
+ + (39) 259 ⤶ 450
+ + + ⤴ → ⤵ @ @ ⤵
6th St 5 1098 147 + + + + + + Rt. 50 Frontage Rd 30
(10) (839) (13) + + + + + + (265)
George Mason Dr Gate Access
5 N 0 0 0
George Mason Dr
(46) (1358) (80) + + + +
26 566 48 8th St + + + +
⤶ ↓ ⤷ @
(31) 46 ⤷ Overall Intersection
⤶
82 (95) + +
+ + + +
+ + + +
(24) 61 ↓ 2105
↓
29 (57) + + @ +
@
+ + + + @ +
@
+ + + +
(22) 31 ⤶ (2404)
⤷
23 (23) + + +
+ + + + +
+ + + +
+ + + ⤴ → ⤵ @ @
8th St 22 1122 49 + + + + + +
(13) (735) (42) + + + + + + + + +
George Mason Dr
Northbound and Southbound Left
Turn Lanes Include U‐Turns
Figure 4-9
2017 Build Total Traffic Volumes
Sheet 1 of 1
Legend
NFATC Traffic Study
1
NFATC2
3
4
5
6
7

1 N 0 0 3 N
George Mason Dr Glebe Rd
(29.6‐C) (29.6‐C) + + + + + + (17.9‐B) (31.5‐C)
35‐D 35‐D Rt 50 WB off ramp + + + + + + 17.3‐B 23.9‐C Rt 50 WB off ramp
⤶ ↓ @ @ ⤶ ↓ Overall Intersection
⤶
35.2‐D (36.5‐D) + +
+ + + +
+ + Overall Intersection
⤶
56.7‐E (62.3‐E)
20.3‐C
↓
35.2‐D (36.5‐D) + + @ +
@
+ + + + @ +
@
+ + 34.6‐C
↓
59.2‐E (62.3‐E)
(22.7‐C)
⤷
37.7‐D (37.9‐D) + + +
+ + + + +
+ + (31.3‐C)
⤷
59.2‐E (54‐D)
⤴ → @ @ ⤴ →
Rt 50 EB on ramp 1.8‐A 0.9‐A On Loop Ramp + + + + + + Rt 50 WB on ramp 42.7‐D 36.1‐D
(17.8‐B) (0.8‐A) + + + + + + (39.8‐D) (22.7‐C)
George Mason Dr Glebe Rd
2 N 0 0 4 N
George Mason Dr Glebe Rd
+ (1.9‐A) (18.3‐B) + + + + + + (3.8‐A) (3.8‐A)
1.3‐A 40.4‐D Rt. 50 Frontage Rd + + + + + + 2.4‐A 2.4‐A Rt 50 EB on ramp xx ‐ A AM Peak Hour Delay (seconds) LOS
↓ ⤷ @ @ ⤶ ↓ 7:30‐8:30 AM
(52.5‐D) 50.8‐D ⤷ Overall Intersection
+ +
+ + + +
+ + (54.3‐D) 87.3‐F ⤷ Overall Intersection
(51.1‐D) 44.6‐D ↓ 33.7‐C + + @ +
@
+ + + + @ +
@
+ + 13.8‐B (xx ‐ A) PM Peak Hour Delay (seconds) LOS
(51.1‐D) 44.6‐D ⤶ (18.8‐B)
+ + +
+ + + + +
+ + (71.9‐E) 58.6‐E ⤶ (13.9‐B)
4:30‐5:30 PM
+ + + → ⤵ @ @ → ⤵
Rt. 50 Frontage Rd 42.3‐D 42.3‐D + + + + + + Rt 50 EB off ramp 6.9‐A 6.9‐A ⤷
(28.6‐C) (28.6‐C) + + + + + + (6.3‐A) (6.3‐A)
⤷
George Mason Dr Glebe Rd
7 N 0 0 6 N
George Mason Dr
(0‐A) (0‐A) (0.5‐A) + + + + + +
0‐A 0‐A 9.3‐A Main Gate Access + + + + + + Rt 50 EB on ramp
⤶ ↓ ⤷ + + @ @(157.9‐F) 37.6‐E ⤷ Overall Intersection
⤶
81.2‐F (669.6‐F) + +
+ + + +
+ + Overall Intersection
(157.9‐F) 37.6‐E ↓ 2.7‐A
↓
81.2‐F (669.6‐F) + + @ +
@
+ + + + @ +
@
+ + (0‐A) 0‐A ↓ 0.4‐A
(157.9‐F) 37.6‐E ⤶ (65.8‐E)
⤷
81.2‐F (669.6‐F) + + +
+ + + + +
+ + (0‐A) 0‐A ⤶ (5.5‐A)
+ + + ⤴ → ⤵ @ @ ⤵
6th St 0.2‐A 0.2‐A 0‐A + + + + + + Rt. 50 Frontage Rd 16.1‐C
(0.8‐A) (0‐A) (0‐A) + + + + + + (15‐C)
George Mason Dr Gate Access
5 N
George Mason Dr
(9.9‐A) (9.9‐A) (9.9‐A)
6.6‐A 6.6‐A 6.6‐A 8th St
⤶ ↓ ⤷(55.8‐E) 83.8‐F ⤷ Overall Intersection
⤶
49.4‐D (64.1‐E)
(55.8‐E) 83.8‐F ↓ 16.6‐C
↓
49.4‐D (64.1‐E)
(55.8‐E) 83.8‐F ⤶ (13.9‐B)
⤷
49.4‐D (64.1‐E)
+ + + ⤴ → ⤵
8th St 7.9‐A 7.9‐A 7.9‐A
(5.3‐A) (5.3‐A) (5.3‐A)
George Mason Dr
Northbound and Southbound Left
Turn Lanes Include U‐Turns
Figure 4-10
2017 No-Build Delay and LOS
Sheet 1 of 1
Legend
NFATC Traffic Study
1
NFATC2
3
4
5
6
7

1 N 0 0 3 N
George Mason Dr Glebe Rd
(29.6‐C) (29.6‐C) + + + + + + (17.9‐B) (31.5‐C)
33.9‐C 33.9‐C Rt 50 WB off ramp + + + + + + 17.3‐B 23.9‐C Rt 50 WB off ramp
⤶ ↓ @ @ ⤶ ↓ Overall Intersection
⤶
40.1‐D (36.5‐D) + +
+ + + +
+ + Overall Intersection
⤶
56.5‐E (62.3‐E)
21.9‐C
↓
40.1‐D (36.5‐D) + + @ +
@
+ + + + @ +
@
+ + 33.6‐C
↓
58.9‐E (62.3‐E)
(22.7‐C)
⤷
45.5‐D (37.9‐D) + + +
+ + + + +
+ + (31.4‐C)
⤷
58.9‐E (54‐D)
⤴ → @ @ ⤴ →
Rt 50 EB on ramp 1.4‐A 0.7‐A On Loop Ramp + + + + + + Rt 50 WB on ramp 47.3‐D 33.1‐C
(17.9‐B) (0.8‐A) + + + + + + (39.8‐D) (22.8‐C)
George Mason Dr Glebe Rd
2 N 0 0 4 N
George Mason Dr Glebe Rd
+ (1.9‐A) (19.1‐B) + + + + + + (3.8‐A) (3.8‐A)
1.7‐A 61‐E Rt. 50 Frontage Rd + + + + + + 2.6‐A 2.6‐A Rt 50 EB on ramp xx ‐ A AM Peak Hour Delay (seconds) LOS
↓ ⤷ @ @ ⤶ ↓ 7:30‐8:30 AM
(52.5‐D) 43.4‐D ⤷ Overall Intersection
+ +
+ + + +
+ + (54.7‐E) 52.4‐E ⤷ Overall Intersection
(51.1‐D) 39.7‐D ↓ 34.5‐C + + @ +
@
+ + + + @ +
@
+ + 14.1‐B (xx ‐ A) PM Peak Hour Delay (seconds) LOS
(51.1‐D) 39.7‐D ⤶ (18.9‐C)
+ + +
+ + + + +
+ + (71.9‐E) 60.9‐E ⤶ (14‐B)
4:30‐5:30 PM
+ + + → ⤵ @ @ → ⤵
Rt. 50 Frontage Rd 40.4‐D 40.4‐D + + + + + + Rt 50 EB off ramp 9.4‐A 9.4‐A ⤷
(28.6‐C) (28.6‐C) + + + + + + (6.3‐A) (6.3‐A)
⤷
George Mason Dr Glebe Rd
7 N 0 0 6 N
George Mason Dr
(0‐A) (0‐A) (0.5‐A) + + + + + +
0‐A 0‐A 9.8‐A Main Gate Access + + + + + + Rt 50 EB on ramp
⤶ ↓ ⤷ + + @ @(163.6‐F) 39.6‐E ⤷ Overall Intersection
⤶
86.3‐F (720.2‐F) + +
+ + + +
+ + Overall Intersection
(163.6‐F) 39.6‐E ↓ 2.9‐A
↓
86.3‐F (720.2‐F) + + @ +
@
+ + + + @ +
@
+ + (0‐A) 0‐A ↓ 0.4‐A
(163.6‐F) 39.6‐E ⤶ (74.1‐F)
⤷
86.3‐F (720.2‐F) + + +
+ + + + +
+ + (0‐A) 0‐A ⤶ (5.6‐A)
+ + + ⤴ → ⤵ @ @ ⤵
6th St 0.2‐A 0‐A 0‐A + + + + + + Rt. 50 Frontage Rd 16.2‐C
(0.8‐A) (0.8‐A) (0‐A) + + + + + + (15.1‐C)
George Mason Dr Gate Access
5 N
George Mason Dr
(9.9‐A) (9.9‐A) (9.9‐A)
6.6‐A 6.6‐A 6.6‐A 8th St
⤶ ↓ ⤷(55.8‐E) 84.6‐F ⤷ Overall Intersection
⤶
49.4‐D (64.1‐E)
(55.8‐E) 84.6‐F ↓ 16.7‐C
↓
49.4‐D (64.1‐E)
(55.8‐E) 84.6‐F ⤶ (13.9‐B)
⤷
49.4‐D (64.1‐E)
+ + + ⤴ → ⤵
8th St 8‐A 8‐A 8‐A
(5.3‐A) (5.3‐A) (5.3‐A)
George Mason Dr
Northbound and Southbound Left
Turn Lanes Include U‐Turns
Figure 4-11
2017 Build Delay and LOS
Sheet 1 of 1
Legend
NFATC Traffic Study
1
NFATC2
3
4
5
6
7
NFATC Traffic Study
24
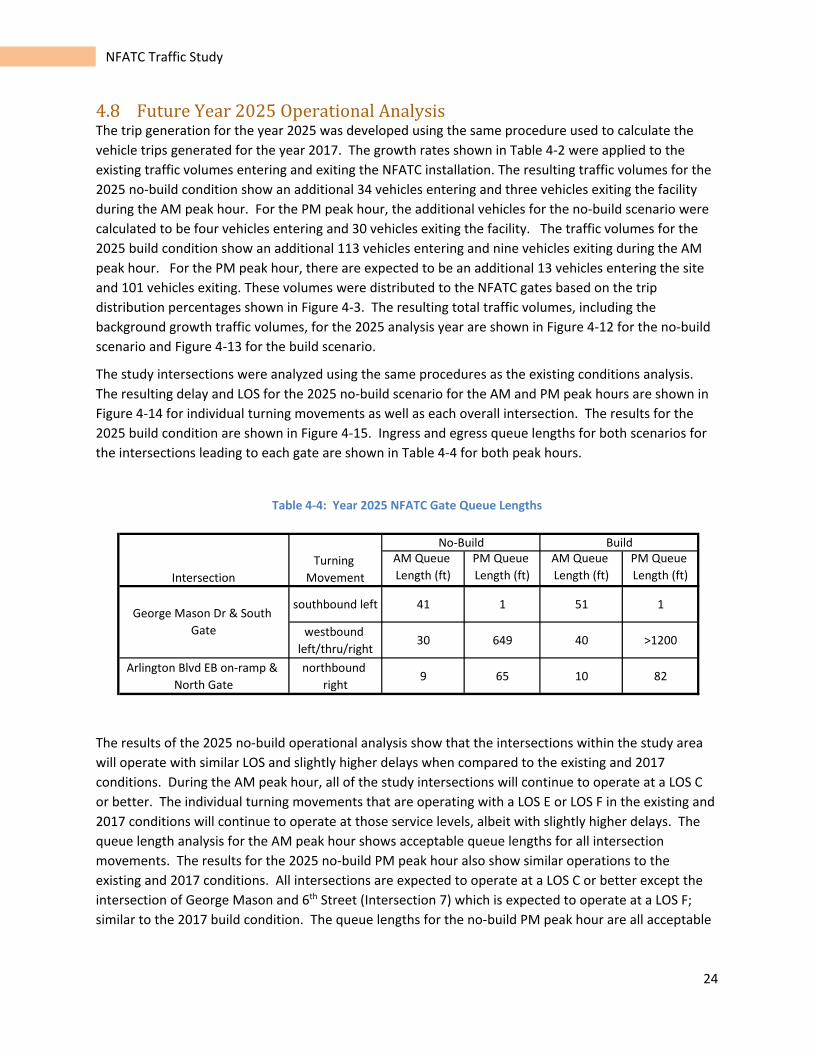
4.8FutureYear2025OperationalAnalysisThe trip generation for the year 2025 was developed using the same procedure used to calculate the
vehicle trips generated for the year 2017. The growth rates shown in Table 4‐2 were applied to the
existing traffic volumes entering and exiting the NFATC installation. The resulting traffic volumes for the
2025 no‐build condition show an additional 34 vehicles entering and three vehicles exiting the facility
during the AM peak hour. For the PM peak hour, the additional vehicles for the no‐build scenario were
calculated to be four vehicles entering and 30 vehicles exiting the facility. The traffic volumes for the
2025 build condition show an additional 113 vehicles entering and nine vehicles exiting during the AM
peak hour. For the PM peak hour, there are expected to be an additional 13 vehicles entering the site
and 101 vehicles exiting. These volumes were distributed to the NFATC gates based on the trip
distribution percentages shown in Figure 4‐3. The resulting total traffic volumes, including the
background growth traffic volumes, for the 2025 analysis year are shown in Figure 4‐12 for the no‐build
scenario and Figure 4‐13 for the build scenario.
The study intersections were analyzed using the same procedures as the existing conditions analysis.
The resulting delay and LOS for the 2025 no‐build scenario for the AM and PM peak hours are shown in
Figure 4‐14 for individual turning movements as well as each overall intersection. The results for the
2025 build condition are shown in Figure 4‐15. Ingress and egress queue lengths for both scenarios for
the intersections leading to each gate are shown in Table 4‐4 for both peak hours.
Table 4‐4: Year 2025 NFATC Gate Queue Lengths
The results of the 2025 no‐build operational analysis show that the intersections within the study area
will operate with similar LOS and slightly higher delays when compared to the existing and 2017
conditions. During the AM peak hour, all of the study intersections will continue to operate at a LOS C
or better. The individual turning movements that are operating with a LOS E or LOS F in the existing and
2017 conditions will continue to operate at those service levels, albeit with slightly higher delays. The
queue length analysis for the AM peak hour shows acceptable queue lengths for all intersection
movements. The results for the 2025 no‐build PM peak hour also show similar operations to the
existing and 2017 conditions. All intersections are expected to operate at a LOS C or better except the
intersection of George Mason and 6th Street (Intersection 7) which is expected to operate at a LOS F;
similar to the 2017 build condition. The queue lengths for the no‐build PM peak hour are all acceptable
AM Queue
Length (ft)
PM Queue
Length (ft)
AM Queue
Length (ft)
PM Queue
Length (ft)
southbound left 41 1 51 1
westbound
left/thru/right30 649 40 >1200
Arlington Blvd EB on‐ramp &
North Gate
northbound
right9 65 10 82
BuildNo‐Build
George Mason Dr & South
Gate
Turning
MovementIntersection
NFATC Traffic Study
25
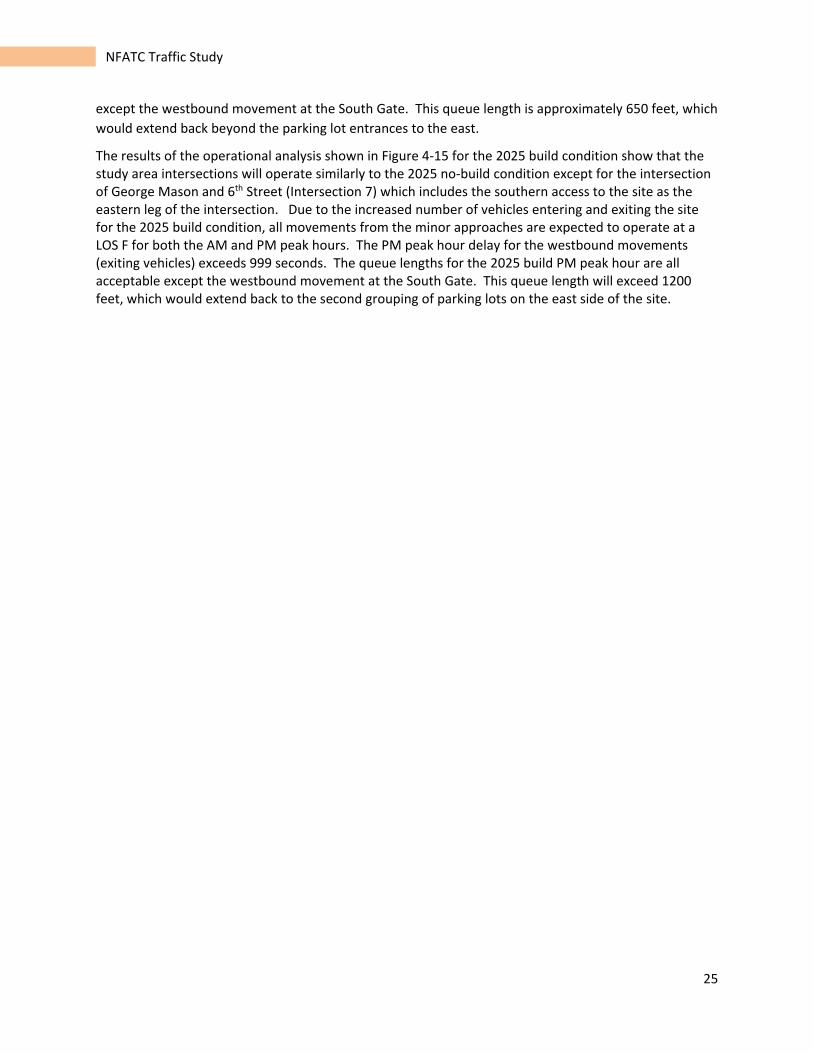
except the westbound movement at the South Gate. This queue length is approximately 650 feet, which
would extend back beyond the parking lot entrances to the east.
The results of the operational analysis shown in Figure 4‐15 for the 2025 build condition show that the study area intersections will operate similarly to the 2025 no‐build condition except for the intersection of George Mason and 6th Street (Intersection 7) which includes the southern access to the site as the eastern leg of the intersection. Due to the increased number of vehicles entering and exiting the site for the 2025 build condition, all movements from the minor approaches are expected to operate at a LOS F for both the AM and PM peak hours. The PM peak hour delay for the westbound movements (exiting vehicles) exceeds 999 seconds. The queue lengths for the 2025 build PM peak hour are all acceptable except the westbound movement at the South Gate. This queue length will exceed 1200 feet, which would extend back to the second grouping of parking lots on the east side of the site.

1 N 0 0 3 N
George Mason Dr Glebe Rd
(74) (1087) + + + + + + (173) (1464)
46 639 Rt 50 WB off ramp + + + + + + 136 900 Rt 50 WB off ramp
⤶ ↓ @ @ ⤶ ↓ Overall Intersection
⤶
208 (169) + +
+ + + +
+ + Overall Intersection
⤶
232 (143)
2725
↓
57 (87) + + @ +
@
+ + + + @ +
@
+ + 3286
↓
4 (2)
(2788)
⤷
548 (421) + + +
+ + + + +
+ + (3162)
⤷
49 (83)
⤴ → @ @ ⤴ →
Rt 50 EB on ramp 138 1089 On Loop Ramp + + + + + + Rt 50 WB on ramp 369 1596
(163) (787) + + + + + + (335) (962)
George Mason Dr Glebe Rd
2 N 0 0 4 N
George Mason Dr Glebe Rd
+ (1361) (173) + + + + + + (231) (1311)
739 469 Rt. 50 Frontage Rd + + + + + + 169 818 Rt 50 EB on ramp xxx AM Peak Hour Volume
↓ ⤷ @ @ ⤶ ↓ 7:30‐8:30 AM
(127) 356 ⤷ Overall Intersection
+ +
+ + + +
+ + (186) 150 ⤷ Overall Intersection
(56) 351 ↓ 3145 + + @ +
@
+ + + + @ +
@
+ + 3368 (xxx) PM Peak Hour Volume
(192) 116 ⤶ (2564)
+ + +
+ + + + +
+ + (294) 286 ⤶ (3105)
4:30‐5:30 PM
+ + + → ⤵ @ @ → ⤵
Rt. 50 Frontage Rd 874 240 + + + + + + Rt 50 EB off ramp 1834 111 ⤷
(828) (242) + + + + + + (1083) (80)
⤷
George Mason Dr Glebe Rd
7 N 0 0 6 N
George Mason Dr
(5) (1399) (13) + + + + + +
20 655 170 Main Gate Access + + + + + + Rt 50 EB on ramp
⤶ ↓ ⤷ + + @ @ + +
(10) 5 ⤷ Overall Intersection
⤶
9 (115) + +
+ + + +
+ + Overall Intersection
(0) 2 ↓ 2187
↓
0 (0) + + @ +
@
+ + + + @ +
@
+ + (429) 781 ↓ 1077
(5) 20 ⤶ 2557
⤷
7 (139) + + +
+ + + + +
+ + (40) 265 ⤶ 469
+ + + ⤴ → ⤵ @ @ ⤵
6th St 5 1143 151 + + + + + + Rt. 50 Frontage Rd 31
(10) (874) (14) + + + + + + (272)
George Mason Dr Gate Access
5 N 0 0 0
George Mason Dr
(46) (1416) (80) + + + +
26 589 48 8th St + + + +
⤶ ↓ ⤷ @
(31) 46 ⤷ Overall Intersection
⤶
83 (95) + +
+ + + +
+ + + +
(24) 61 ↓ 2178
↓
29 (57) + + @ +
@
+ + + + @ +
@
+ + + +
(22) 31 ⤶ (2493)
⤷
23 (23) + + +
+ + + + +
+ + + +
+ + + ⤴ → ⤵ @ @
8th St 22 1171 49 + + + + + +
(13) (766) (42) + + + + + +
George Mason Dr
Legend
Northbound and Southbound Left
Turn Lanes Include U‐Turns
Figure 4-12
2025 No-Build Total Traffic Volumes
Sheet 1 of 1
NFATC Traffic Study
1
NFATC2
3
4
5
6
7

1 N 0 0 3 N
George Mason Dr Glebe Rd
(74) (1091) + + + + + + (174) (1464)
46 660 Rt 50 WB off ramp + + + + + + 141 900 Rt 50 WB off ramp
⤶ ↓ @ @ ⤶ ↓ Overall Intersection
⤶
208 (169) + +
+ + + +
+ + Overall Intersection
⤶
232 (143)
2766
↓
57 (87) + + @ +
@
+ + + + @ +
@
+ + 3292
↓
4 (2)
(2805)
⤷
567 (422) + + +
+ + + + +
+ + (3170)
⤷
49 (83)
⤴ → @ @ ⤴ →
Rt 50 EB on ramp 138 1090 On Loop Ramp + + + + + + Rt 50 WB on ramp 369 1597
(165) (797) + + + + + + (335) (969)
George Mason Dr Glebe Rd
2 N 0 0 4 N
George Mason Dr Glebe Rd
+ (1362) (177) + + + + + + (231) (1311)
759 489 Rt. 50 Frontage Rd + + + + + + 169 818 Rt 50 EB on ramp xxx AM Peak Hour Volume
↓ ⤷ @ @ ⤶ ↓ 7:30‐8:30 AM
(127) 356 ⤷ Overall Intersection
+ +
+ + + +
+ + (193) 151 ⤷ Overall Intersection
(58) 367 ↓ 3205 + + @ +
@
+ + + + @ +
@
+ + 3369 (xxx) PM Peak Hour Volume
(192) 119 ⤶ (2579)
+ + +
+ + + + +
+ + (294) 286 ⤶ (3112)
4:30‐5:30 PM
+ + + → ⤵ @ @ → ⤵
Rt. 50 Frontage Rd 875 240 + + + + + + Rt 50 EB off ramp 1834 111 ⤷
(840) (245) + + + + + + (1083) (80)
⤷
George Mason Dr Glebe Rd
7 N 0 0 6 N
George Mason Dr
(5) (1399) (14) + + + + + +
20 655 193 Main Gate Access + + + + + + Rt 50 EB on ramp
⤶ ↓ ⤷ + + @ @ + +
(10) 5 ⤷ Overall Intersection
⤶
10 (130) + +
+ + + +
+ + Overall Intersection
(0) 2 ↓ 2232
↓
0 (0) + + @ +
@
+ + + + @ +
@
+ + (432) 781 ↓ 1117
(5) 20 ⤶ 2591
⤷
8 (158) + + +
+ + + + +
+ + (46) 301 ⤶ 478
+ + + ⤴ → ⤵ @ @ ⤵
6th St 5 1143 171 + + + + + + Rt. 50 Frontage Rd 35
(10) (874) (16) + + + + + + (308)
George Mason Dr Gate Access
5 N
George Mason Dr
(47) (1434) (81)
26 590 48 8th St
⤶ ↓ ⤷
(31) 47 ⤷ Overall Intersection
⤶
84 (95) +
(24) 61 ↓ 2199
↓
29 (57) +
(22) 31 ⤶ (2514)
⤷
23 (23) +
+ + + ⤴ → ⤵
8th St 22 1189 49
(13) (768) (42) + + + + + + + + +
George Mason Dr
Northbound and Southbound Left
Turn Lanes Include U‐Turns
Figure 4-13
2025 Build Total Traffic Volumes
Sheet 1 of 1
Legend
NFATC Traffic Study
1
NFATC2
3
4
5
6
7

1 N 0 0 3 N
George Mason Dr Glebe Rd
(31.7‐C) (31.7‐C) + + + + + + (18‐B) (33.3‐C)
35.9‐D 35.9‐D Rt 50 WB off ramp + + + + + + 17.4‐B 24.4‐C Rt 50 WB off ramp
⤶ ↓ @ @ ⤶ ↓ Overall Intersection
⤶
35.4‐D (37.8‐D) + +
+ + + +
+ + Overall Intersection
⤶
56.4‐E (62.5‐E)
20.6‐C
↓
35.4‐D (37.8‐D) + + @ +
@
+ + + + @ +
@
+ + 36.9‐D
↓
58.9‐E (62.5‐E)
(24‐C)
⤷
38.1‐D (39.7‐D) + + +
+ + + + +
+ + (32.3‐C)
⤷
58.9‐E (53.9‐D)
⤴ → @ @ ⤴ →
Rt 50 EB on ramp 2.1‐A 0.9‐A On Loop Ramp + + + + + + Rt 50 WB on ramp 48‐D 39.7‐D
(20‐B) (0.7‐A) + + + + + + (41.1‐D) (23.1‐C)
George Mason Dr Glebe Rd
2 N 0 0 4 N
George Mason Dr Glebe Rd
+ (2.2‐A) (21.8‐C) + + + + + + (4.6‐A) (4.3‐A)
1.3‐A 43.3‐D Rt. 50 Frontage Rd + + + + + + 2.7‐A 2.7‐A Rt 50 EB on ramp xx ‐ A AM Peak Hour Delay (seconds) LOS
↓ ⤷ @ @ ⤶ ↓ 7:30‐8:30 AM
(48.9‐D) 50.2‐D ⤷ Overall Intersection
+ +
+ + + +
+ + (52.9‐D) 59.8‐E ⤷ Overall Intersection
(30.6‐C) 44.1‐D ↓ 34.8‐C + + @ +
@
+ + + + @ +
@
+ + 15.1‐B (xx ‐ A) PM Peak Hour Delay (seconds) LOS
(30.6‐C) 44.1‐D ⤶ (19.5‐C)
+ + +
+ + + + +
+ + (72.4‐E) 65.1‐E ⤶ (14.5‐B)
4:30‐5:30 PM
+ + + → ⤵ @ @ → ⤵
Rt. 50 Frontage Rd 44.7‐D 44.7‐D + + + + + + Rt 50 EB off ramp 10.5‐B 10.5‐B ⤷
(30.6‐C) (23.1‐C) + + + + + + (7.1‐A) (7.1‐A)
⤷
George Mason Dr Glebe Rd
7 N 0 0 6 N
George Mason Dr
(0‐A) (0‐A) (0.5‐A) + + + + + +
0‐A 0‐A 10.7‐B Main Gate Access + + + + + + Rt 50 EB on ramp
⤶ ↓ ⤷ + + @ @(204.3‐F) 45.9‐E ⤷ Overall Intersection
⤶
103.8‐F (884‐F) + +
+ + + +
+ + Overall Intersection
(204.3‐F) 45.9‐E ↓ 3.3‐A
↓
103.8‐F (884‐F) + + @ +
@
+ + + + @ +
@
+ + (0‐A) 0‐A ↓ 0.5‐A
(204.3‐F) 45.9‐E ⤶ (89.7‐F)
⤷
103.8‐F (884‐F) + + +
+ + + + +
+ + (0‐A) 0‐A ⤶ (6‐A)
+ + + ⤴ → ⤵ @ @ ⤵
6th St 0.2‐A 0‐A 0‐A + + + + + + Rt. 50 Frontage Rd 17.1‐C
(0.9‐A) (0‐A) (0‐A) + + + + + + (16.1‐C)
George Mason Dr Gate Access
5 N
George Mason Dr
(10.7‐B) (10.7‐B) (10.7‐B)
6.7‐A 6.7‐A 6.7‐A 8th St
⤶ ↓ ⤷(55.8‐E) 84.6‐F ⤷ Overall Intersection
⤶
49.4‐D (64.1‐E)
(55.8‐E) 84.6‐F ↓ 16.6‐B
↓
49.4‐D (64.1‐E)
(55.8‐E) 84.6‐F ⤶ (14.2‐B)
⤷
49.4‐D (64.1‐E)
+ + + ⤴ → ⤵
8th St 8.2‐A 8.2‐A 8.2‐A
(5.4‐A) (5.4‐A) (5.4‐A)
George Mason Dr
Northbound and Southbound Left
Turn Lanes Include U‐Turns
Figure 4-14
2025 No-Build Delay and LOS
Sheet 1 of 1
Legend
NFATC Traffic Study
1
NFATC2
3
4
5
6
7
1 N 0 0 3 N
George Mason Dr Glebe Rd
(29.6‐C) (29.6‐C) + + + + + + (18‐B) (33.3‐C)
37.2‐C 37.2‐C Rt 50 WB off ramp + + + + + + 13.9‐B 19.3‐B Rt 50 WB off ramp
⤶ ↓ @ @ ⤶ ↓ Overall Intersection
⤶
33.1‐C (38‐D) + +
+ + + +
+ + Overall Intersection
⤶
59.2‐E (62.5‐E)
20.6‐C
↓
33.1‐C (38‐D) + + @ +
@
+ + + + @ +
@
+ + 31.3‐D
↓
59.2‐E (62.5‐E)
(23.1‐C)
⤷
35‐D (39.9‐D) + + +
+ + + + +
+ + (32.4‐C)
⤷
59.2‐E (53.9‐D)
⤴ → @ @ ⤴ →
Rt 50 EB on ramp 3.3‐A 1.2‐A On Loop Ramp + + + + + + Rt 50 WB on ramp 63.5‐E 27.5‐C
(19.7‐B) (0.7‐A) + + + + + + (40.9‐D) (23.4‐C)
George Mason Dr Glebe Rd
2 N 0 0 4 N
George Mason Dr Glebe Rd
+ (2‐A) (21.1‐C) + + + + + + (4.3‐A) (4.3‐A)
1.1‐A 41.8‐D Rt. 50 Frontage Rd + + + + + + 2.3‐A 2.3‐A Rt 50 EB on ramp xx ‐ A AM Peak Hour Delay (seconds) LOS
↓ ⤷ @ @ ⤶ ↓ 7:30‐8:30 AM
(51.4‐D) 61.8‐E ⤷ Overall Intersection
+ +
+ + + +
+ + (53.7‐E) 92.7‐F ⤷ Overall Intersection
(28.7‐C) 48.9‐D ↓ 37‐D + + @ +
@
+ + + + @ +
@
+ + 15.2‐B (xx ‐ A) PM Peak Hour Delay (seconds) LOS
(28.7‐C) 48.9‐D ⤶ (19‐C)
+ + +
+ + + + +
+ + (72.4‐E) 67.1‐E ⤶ (14.6‐B)
4:30‐5:30 PM
+ + + → ⤵ @ @ → ⤵
Rt. 50 Frontage Rd 46.7‐D 46.7‐D + + + + + + Rt 50 EB off ramp 7.7‐B 7.7‐B ⤷
(28.7‐C) (23.4‐C) + + + + + + (7.1‐A) (7.1‐A)
⤷
George Mason Dr Glebe Rd
7 N 0 0 6 N
George Mason Dr
(0‐A) (0‐A) (0.5‐A) + + + + + +
0‐A 0‐A 12.5‐B Main Gate Access + + + + + + Rt 50 EB on ramp
⤶ ↓ ⤷ + + @ @(224‐F) 57.8‐F ⤷ Overall Intersection
⤶
141.5‐F (>999‐F) + +
+ + + +
+ + Overall Intersection
(224‐F) 57.8‐F ↓ 4.2‐A
↓
141.5‐F (>999‐F) + + @ +
@
+ + + + @ +
@
+ + (0‐A) 0‐A ↓ 0.5‐A
(224‐F) 57.8‐F ⤶ (1118.8‐F)
⤷
141.5‐F (>999‐F) + + +
+ + + + +
+ + (0‐A) 0‐A ⤶ (7‐A)
+ + + ⤴ → ⤵ @ @ ⤵
6th St 0.2‐A 0‐A 0‐A + + + + + + Rt. 50 Frontage Rd 17.2‐C
(0.4‐A) (0‐A) (0‐A) + + + + + + (17.6‐C)
George Mason Dr Gate Access
5 N
George Mason Dr
(11.3‐B) (11.3‐B) (11.3‐B)
6.7‐A 6.7‐A 6.7‐A 8th St
⤶ ↓ ⤷(55.1‐E) 88.9‐F ⤷ Overall Intersection
⤶
49.5‐D (63.8‐E)
(55.1‐E) 88.9‐F ↓ 17‐B
↓
49.5‐D (63.8‐E)
(55.1‐E) 88.9‐F ⤶ (14.6‐B)
⤷
49.5‐D (63.8‐E)
+ + + ⤴ → ⤵
8th St 8.3‐A 8.3‐A 8.3‐A
(5.5‐A) (5.5‐A) (5.5‐A)
George Mason Dr
Figure 4-15
2025 Build Delay and LOS
Sheet 1 of 1
Northbound and Southbound Left
Turn Lanes Include U‐Turns
Legend
NFATC Traffic Study
1
NFATC2
3
4
5
6
7
NFATC Traffic Study
30
5.Recommendations
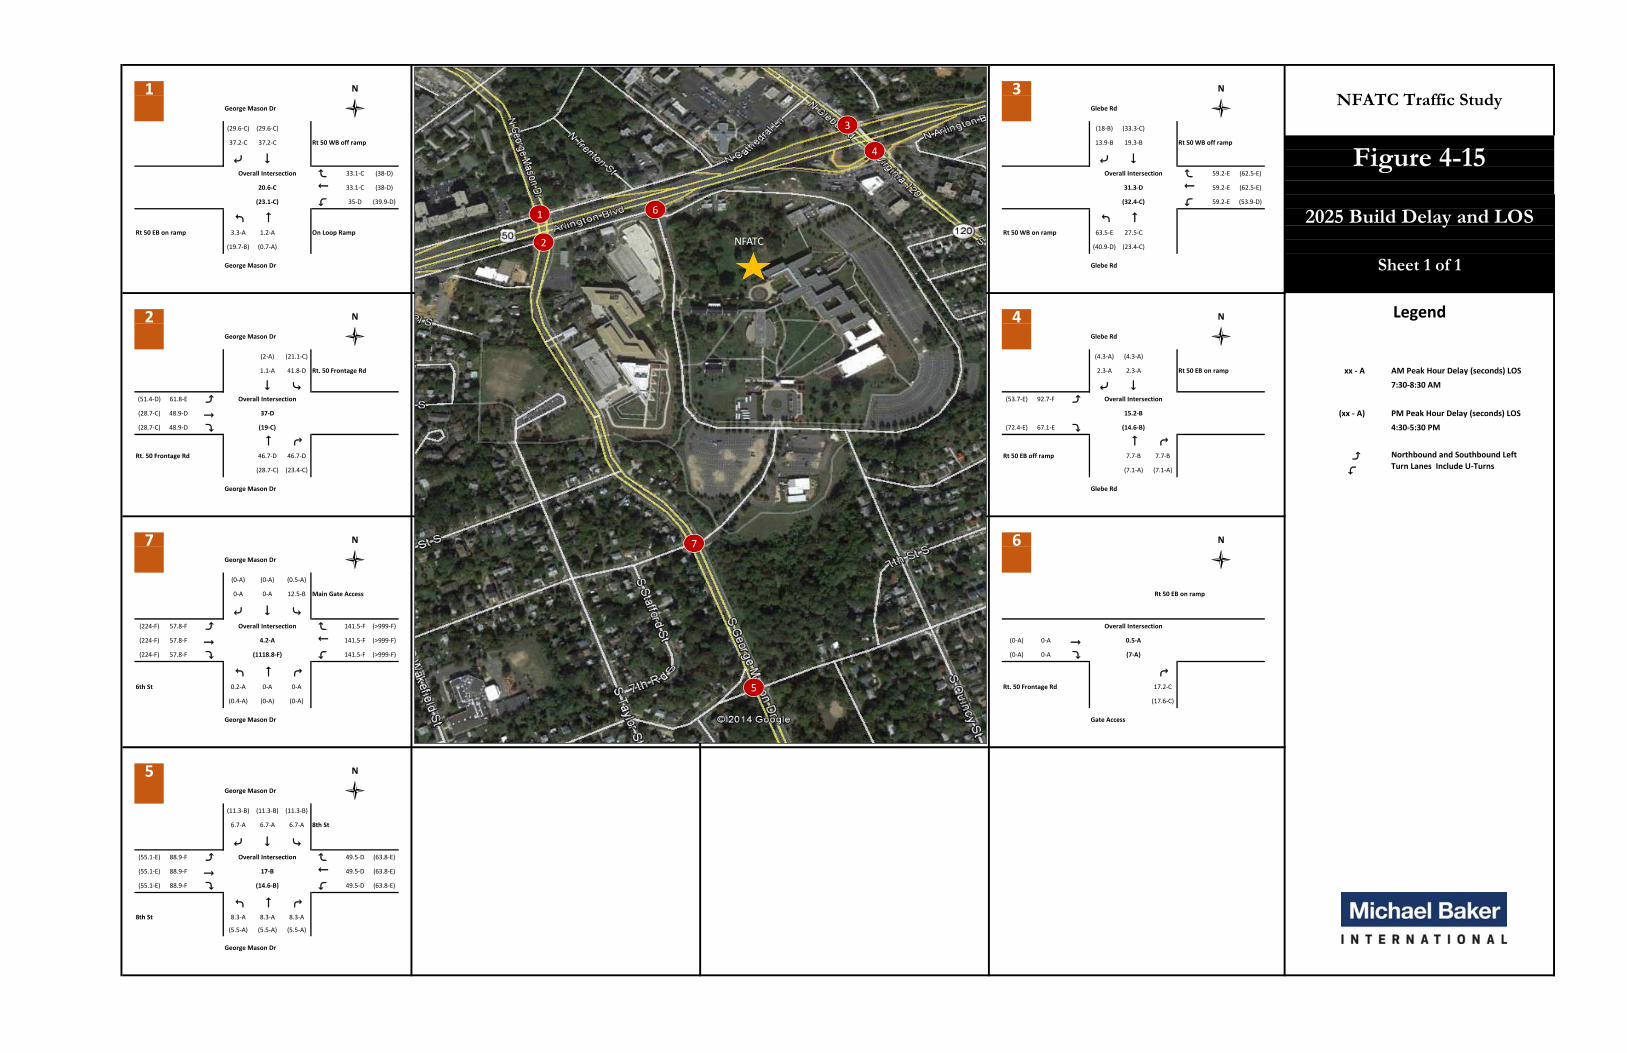
5.1WarrantsandOperationalAnalysisRecommendations were developed to mitigate the traffic impacts associated with the NFATC expansion
at the unsignalized intersections leading to the North and South gate entrances. A left‐turn lane warrant
analysis was conducted for the 2025 build scenario for the southbound left turn at the intersection of
George Mason Drive and the South Gate intersection. The results are shown in Figure 5‐1. Signal
warrant analyses were also conducted for this intersection using the MUTCD peak hour warrant and
four hour warrant. The results of the peak hour signal warrant analysis are shown in Figure 5‐2 and the
results of the four hour signal warrant analysis are shown in Figure 5‐3.
Figure 5‐1: 2025 Build Left Turn Lane Warrant at South Gate Intersection
AM Peak Hour
PM Peak Hour

NFATC Traffic Study
31
Figure 5‐2: 2025 Build Peak Hour Signal Warrant Analysis at South Gate Intersection
Figure 5‐3: 2025 Build Four Hour Signal Warrant Analysis at South Gate Intersection
NFATC Traffic Study
32
As shown in the previous figures, a southbound left‐turn lane is warranted at the intersection of George
Mason Drive and the Southern Gate Access. The volumes at the intersection also meet the peak hour
and four‐hour signal warrants as presented in 2009 MUTCD (Revisions 1 and 2). It is important to note
that the left‐turn warrant and peak hour signal warrants are also met in the existing conditions and 2017
condition. It is recommended that both a traffic signal and southbound left turn lane be constructed at
this location. The VDOT minimum spacing standards between signals on a minor arterial with a 30 mph
speed limit is 880 feet; while the spacing between the recommended signal and the signal at the
intersection of George Mason Drive and 8th street is 830 feet. While the signal spacing would not meet
spacing, it is possible a design waiver would be granted from VDOT considering the spacing is close to
standard. Construction of the southbound left‐turn lane would require a slight shift in the geometry of
the northbound and southbound through lanes on George Mason Drive as well as the removal of the on‐
street parking along George Mason Drive between 6th Street and 4th Street. An analysis was conducted
using the same process as previous operational analyses for a 2025 scenario with the southbound left
turn lane and traffic signal in place. The delay and LOS results are shown in Figure 5‐4 for both the AM
and PM peak hours. The queue lengths are shown in Table 5‐1.
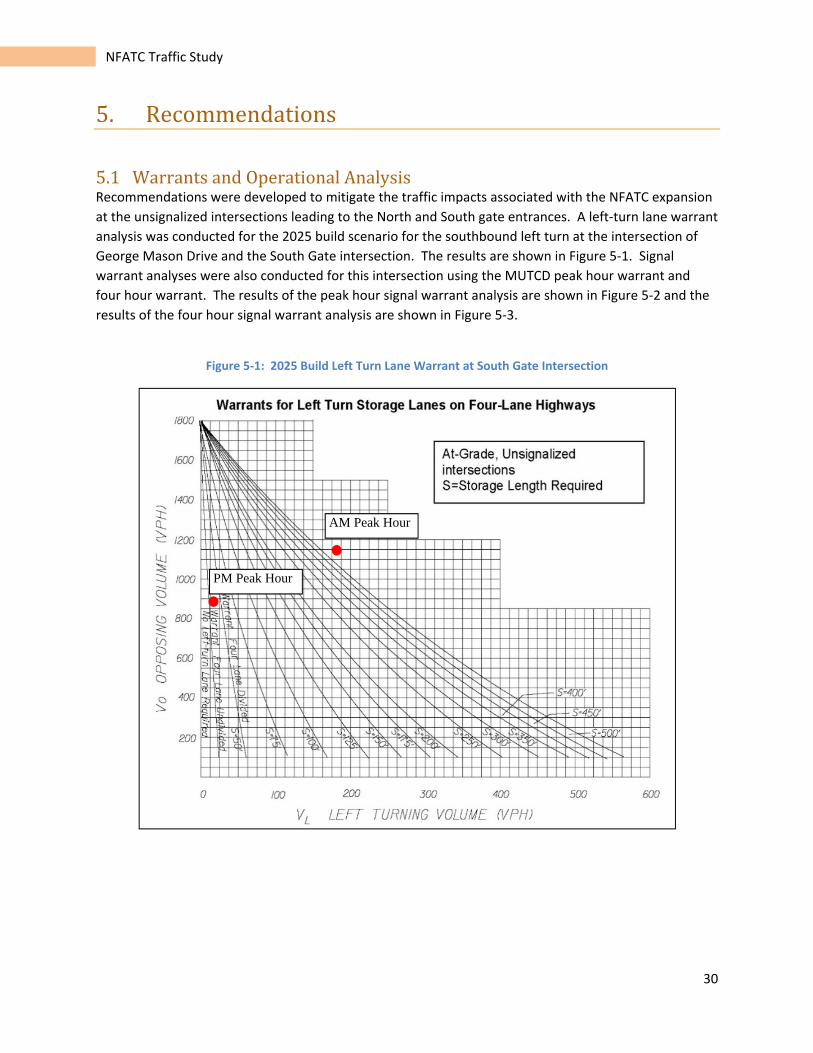
Figure 5‐4: Delay and LOS at South Gate Intersection with Recommendations
7 N
George Mason Dr
(6.8‐A) (13‐B) (68.9‐E)
4.2‐A 4.2‐A 50.8‐D Main Gate Access
⤶ ↓ ⤷ + +
(63‐E) 62.1‐E ⤷ Overall Intersection
⤶
61.9‐E (64.8‐E)
(63‐E) 62.1‐E ↓ 27.1‐C
↓
61.9‐E (64.8‐E)
(63‐E) 62.1‐E ⤶ (21.8‐C)
⤷
61.9‐E (64.8‐E)
+ + + ⤴ → ⤵
6th St 34.1‐C 34.1‐C 34.1‐C
(20.5‐C) (20.5‐C) (20.5‐C)
George Mason Dr
NFATC Traffic Study
33
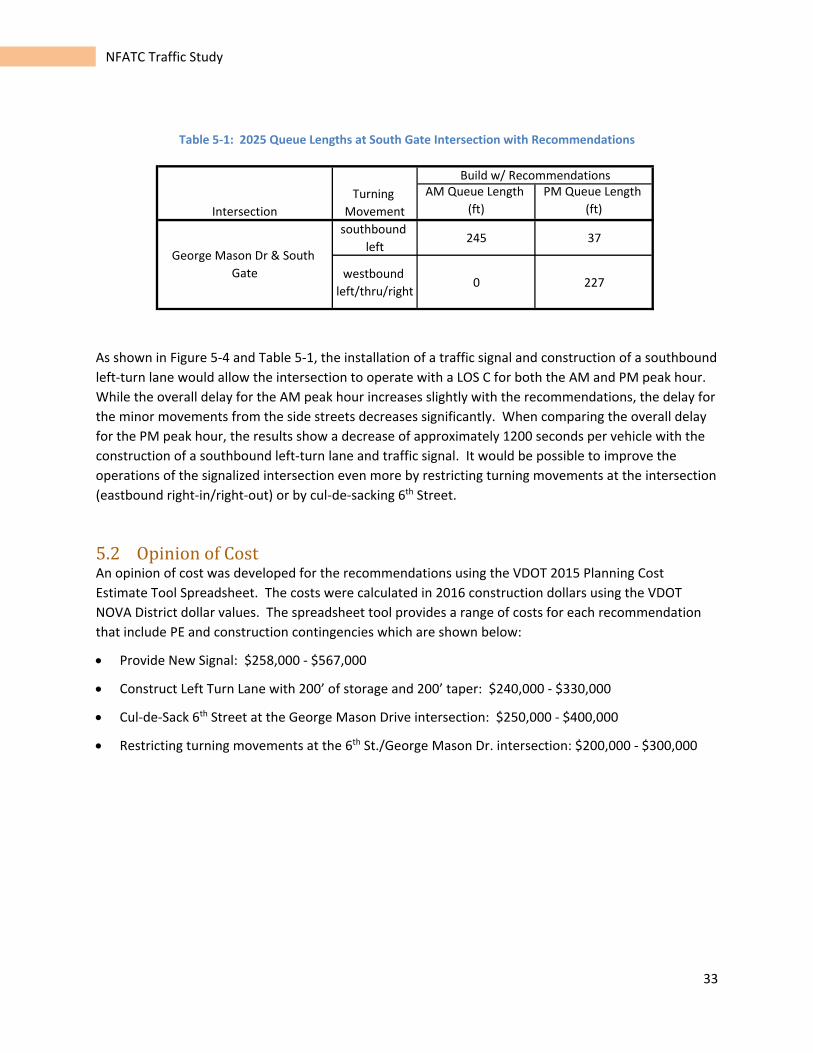
Table 5‐1: 2025 Queue Lengths at South Gate Intersection with Recommendations
As shown in Figure 5‐4 and Table 5‐1, the installation of a traffic signal and construction of a southbound
left‐turn lane would allow the intersection to operate with a LOS C for both the AM and PM peak hour.
While the overall delay for the AM peak hour increases slightly with the recommendations, the delay for
the minor movements from the side streets decreases significantly. When comparing the overall delay
for the PM peak hour, the results show a decrease of approximately 1200 seconds per vehicle with the
construction of a southbound left‐turn lane and traffic signal. It would be possible to improve the
operations of the signalized intersection even more by restricting turning movements at the intersection
(eastbound right‐in/right‐out) or by cul‐de‐sacking 6th Street.
5.2OpinionofCostAn opinion of cost was developed for the recommendations using the VDOT 2015 Planning Cost
Estimate Tool Spreadsheet. The costs were calculated in 2016 construction dollars using the VDOT
NOVA District dollar values. The spreadsheet tool provides a range of costs for each recommendation
that include PE and construction contingencies which are shown below:
Provide New Signal: $258,000 ‐ $567,000
Construct Left Turn Lane with 200’ of storage and 200’ taper: $240,000 ‐ $330,000
Cul‐de‐Sack 6th Street at the George Mason Drive intersection: $250,000 ‐ $400,000
Restricting turning movements at the 6th St./George Mason Dr. intersection: $200,000 ‐ $300,000
AM Queue Length
(ft)
PM Queue Length
(ft)
southbound
left245 37
westbound
left/thru/right0 227
Build w/ Recommendations
George Mason Dr & South
Gate
Intersection
Turning
Movement

NFATC 2016 Master Plan Update Draft EA
E-1 | P a g e
E. VISUAL ANALYSIS
Visual Analysis excerpt from:
U.S. Department of State (DOS) and Government Services Administration (GSA). NFATC 2016
Master Plan Update (Draft). Agency Review – November 18, 2016. Pages 32 through 42 and
pages 71 through 75.

NATIONAL FOREIGN AFFAIRS TRAINING CENTER | 2016 Master Plan Update | SENSITIVE BUT UNCLASSIFIED Destroy by Shredding | AGENCY REVIEW NOVEMBER 18, 2016
32
4.8 LANDSCAPE AND VIEWS
Site EcologyOpen space in Arlington, VA was historically comprised of
estates, agricultural areas and tributaries of Four Mile Run.
The signifi cant ecological corridors of the region follow the
riparian corridors and regional hydrology of the area. These
were comprised of native, riparian vegetation that fi ltered
runoff and supported habitat in a continuous linear form
along the waterway.
Through the 20th and 21st Centuries, these corridors were
disrupted with development; impervious hardscape areas
Regional EcologyArlington, Virginia falls within the Northern Virginia
Piedmont region. Riparian vegetation is centered around
streams and other waterways and is networked together
to form ecological corridors that support native fl ora and
fauna. The area is a range of sunny areas, occasionally
inundated with full sun, to moist or dry shady areas. The
region experiences a range of seasonal fl uctuations in
temperature and climate.
Vegetation, particularly in riparian zones, is a native or
mixed deciduous woodland condition. Smaller, fl owering
understory trees are also prevalent. There are many species
Figure 4.18 Historic Ecological Corridor Figure 4.19 Current Condition
DOCTORS RUNFOUR MILE RUN
EXISTING CONDITIONS ANALYSIS
covered or reduced the riparian corridors. Open space
currently exists in some areas along these waterways, but
it is disconnected as an ecological corridor. Larger open
parcels exist as manicured parks or cemeteries but do not
provide the same level of ecological function/habitat as the
original riparian corridors.
The NFATC site was previously bisected by one drainageway
and skirted by other intermittent/ephemeral tributaries that
fl owed to Doctors Run and on to Four Mile Run. There is
a Resource Protection Area buffer associated with Doctors
Run. Through development of the campus and surroundings,
these corridors and waterways were interrupted,
disconnected, and even buried to create level, usable and
occupiable space. Vegetation shifted from native, riparian
plantings to lawn areas.”
There is no permanent surface water located on the site. The
manmade pond was removed by the time the Army began
using the site.
The site is also designated a Wildlife Protection Area.

NATIONAL FOREIGN AFFAIRS TRAINING CENTER | 2016 Master Plan Update | SENSITIVE BUT UNCLASSIFIED Destroy by Shredding | AGENCY REVIEW NOVEMBER 18, 2016
33
County Parks/Open SpaceThere are several Arlington County parks located within
walking distance of NFATC. The closest is Alcova Heights
Park, which is located adjacent to the southern edge of
the NFATC site at South George Mason Drive and South
6th Street. This 13-acre park contains picnic areas, a
playground, athletic fi elds, and a portion of Doctor’s Branch,
a small tributary stream of Four Mile Run.
Doctors Branch Park
Alcova Heights Park
Thomas Jefferson Park
Arlington Forest Park
Lubber Run Park
EXISTING CONDITIONS ANALYSIS
Immediately to the east is the Thomas Jefferson Community
Center and Park which focuses on active recreation such as
playgrounds, athletic fi elds and courts, and a fi tness trail.
Access to this park is outside the NFATC campus boundary.
Lubber Run Park is located approximately ½ mile to the
west of NFATC. This linear green space follows Lubber
Run, another tributary of Four Mile Run. Lubber Run Park
contains a mix of active and passive recreation as well as an
amphitheater for theatrical performance.
Also within a half mile of the NFATC site is the 95-
acre Glencarlyn Park. This large, secluded natural area
contains portions of Four Mile Run and the Washington
and Old Dominion Trail, a 45-mile paved trail running from
Shirlington to Purcellville, Virginia. The trail is used for
walking, running, bicycling, horseback riding and roller
skating. The park contains a wide range of recreation
activities including nature trails, fi shing, playgrounds, and the
Long Branch Nature Center.
of plants that support local and migratory pollinator habitat.
Higher and drier areas give way to grasses and meadows
with successional species at forest edges.
Figure 4.20 Neighborhood Parks/Open Space Figure 4.21 Alcova Heights Park

NATIONAL FOREIGN AFFAIRS TRAINING CENTER | 2016 Master Plan Update | SENSITIVE BUT UNCLASSIFIED Destroy by Shredding | AGENCY REVIEW NOVEMBER 18, 2016
34
Campus Landscape/Open Space The natural systems and open spaces of the NFATC campus
can be organized into a series of landscape typologies that
refl ect the wide range of conditions and uses of the site.
Historical and pastoral landscapes are located on the
northwestern side of the NFATC site and refl ect the
original campus character of large turf/lawn areas defi ned
and shaded by tall canopy trees, typical of historic park
landscapes.
The Campus Meadow* is a large open area at the center of
the Academic Campus and is a primary organizing element
to the current campus.
*the term “meadow” was used in some historic documents
to refer to the area between Old Main and the Cottages.
See Arlington Hall Station Historic Resources Assessments, Volume 1 and 2, June 1988 by Browne, Eichman, Dalglish,
Gilpin & Paxton, PC.
Campus entrances occur at the north and south edges of the
site and act as vehicular and pedestrian arrival points from
Route 50 and South George Mason Drive. The West Parcel
provides a secondary pedestrian entry to the campus from
EXISTING CONDITIONS ANALYSIS
Historic Landscape
Visitor Entrance
Passive Landscape
Garden
Service
Natural
Recreation
Gathering/Meeting
Parking
Employee Support
Figure 4.22 Landscape Typologies
Resource Protection Area
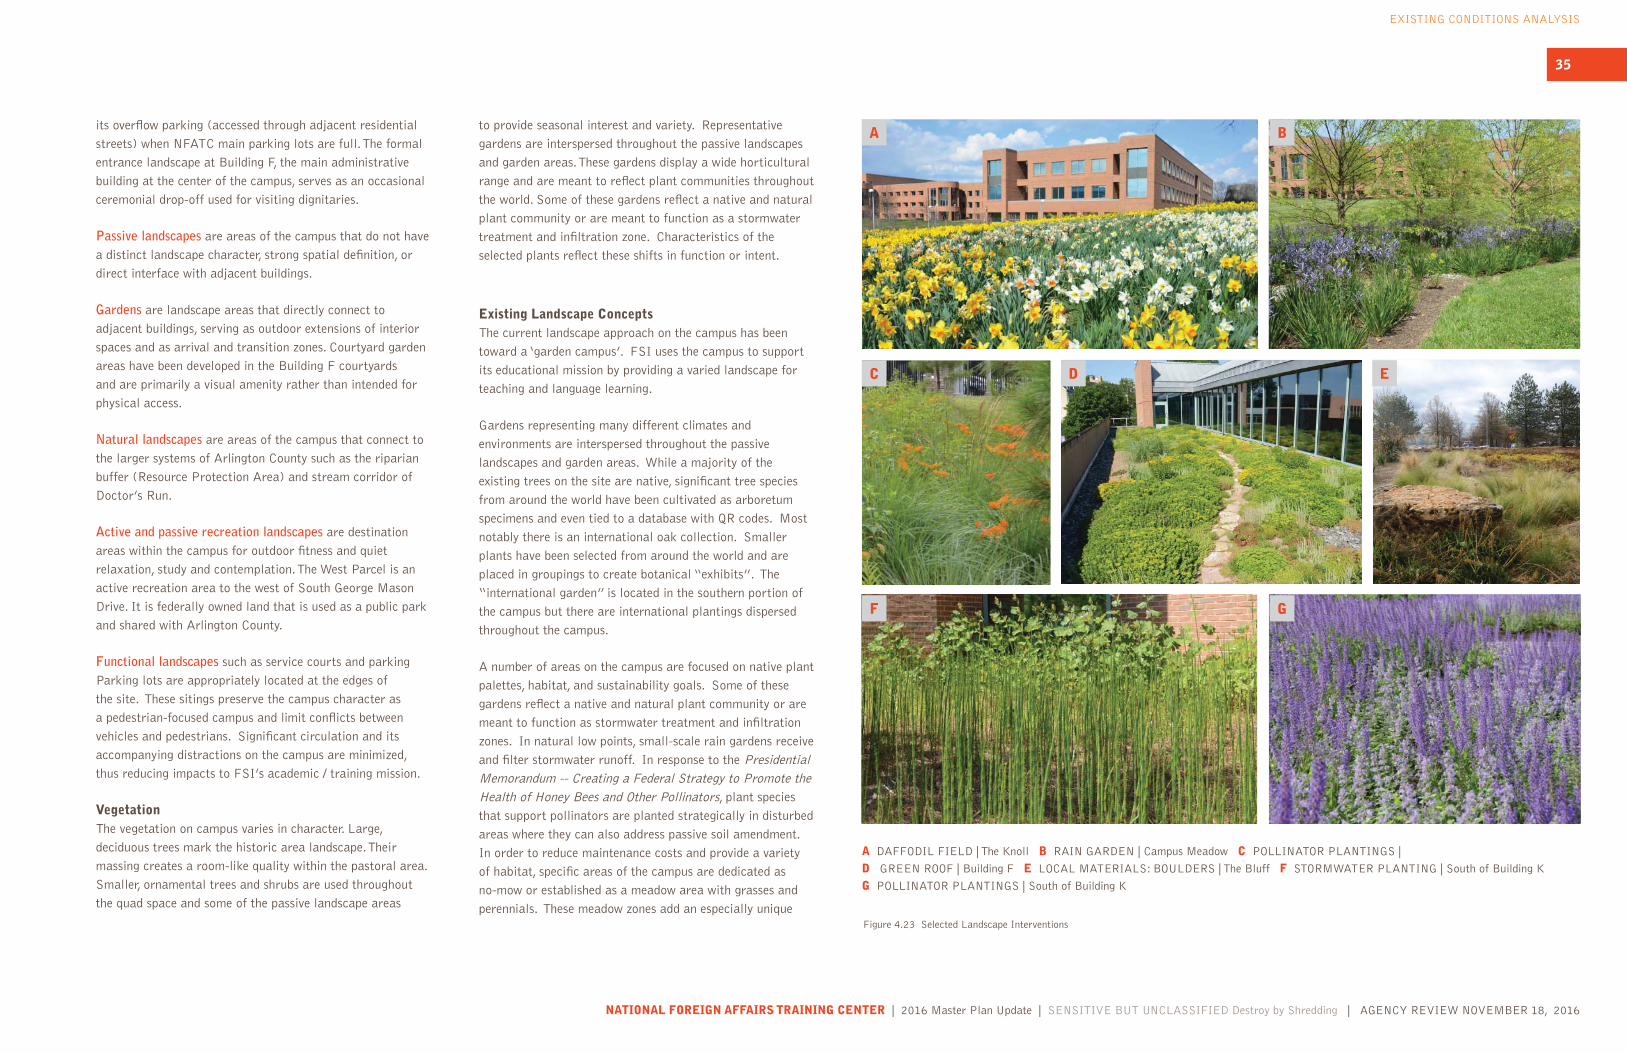
NATIONAL FOREIGN AFFAIRS TRAINING CENTER | 2016 Master Plan Update | SENSITIVE BUT UNCLASSIFIED Destroy by Shredding | AGENCY REVIEW NOVEMBER 18, 2016
35
its overfl ow parking (accessed through adjacent residential
streets) when NFATC main parking lots are full. The formal
entrance landscape at Building F, the main administrative
building at the center of the campus, serves as an occasional
ceremonial drop-off used for visiting dignitaries.
Passive landscapes are areas of the campus that do not have
a distinct landscape character, strong spatial defi nition, or
direct interface with adjacent buildings.
Gardens are landscape areas that directly connect to
adjacent buildings, serving as outdoor extensions of interior
spaces and as arrival and transition zones. Courtyard garden
areas have been developed in the Building F courtyards
and are primarily a visual amenity rather than intended for
physical access.
Natural landscapes are areas of the campus that connect to
the larger systems of Arlington County such as the riparian
buffer (Resource Protection Area) and stream corridor of
Doctor’s Run.
Active and passive recreation landscapes are destination
areas within the campus for outdoor fi tness and quiet
relaxation, study and contemplation. The West Parcel is an
active recreation area to the west of South George Mason
Drive. It is federally owned land that is used as a public park
and shared with Arlington County.
Functional landscapes such as service courts and parking
Parking lots are appropriately located at the edges of
the site. These sitings preserve the campus character as
a pedestrian-focused campus and limit confl icts between
vehicles and pedestrians. Signifi cant circulation and its
accompanying distractions on the campus are minimized,
thus reducing impacts to FSI’s academic / training mission.
Vegetation The vegetation on campus varies in character. Large,
deciduous trees mark the historic area landscape. Their
massing creates a room-like quality within the pastoral area.
Smaller, ornamental trees and shrubs are used throughout
the quad space and some of the passive landscape areas
Existing Landscape ConceptsThe current landscape approach on the campus has been
toward a ‘garden campus’. FSI uses the campus to support
its educational mission by providing a varied landscape for
teaching and language learning.
Gardens representing many different climates and
environments are interspersed throughout the passive
landscapes and garden areas. While a majority of the
existing trees on the site are native, signifi cant tree species
from around the world have been cultivated as arboretum
specimens and even tied to a database with QR codes. Most
notably there is an international oak collection. Smaller
plants have been selected from around the world and are
placed in groupings to create botanical “exhibits”. The
“international garden” is located in the southern portion of
the campus but there are international plantings dispersed
throughout the campus.
A number of areas on the campus are focused on native plant
palettes, habitat, and sustainability goals. Some of these
gardens refl ect a native and natural plant community or are
meant to function as stormwater treatment and infi ltration
zones. In natural low points, small-scale rain gardens receive
and fi lter stormwater runoff. In response to the Presidential Memorandum -- Creating a Federal Strategy to Promote the Health of Honey Bees and Other Pollinators, plant species
that support pollinators are planted strategically in disturbed
areas where they can also address passive soil amendment.
In order to reduce maintenance costs and provide a variety
of habitat, specifi c areas of the campus are dedicated as
no-mow or established as a meadow area with grasses and
perennials. These meadow zones add an especially unique
A DAFFODIL FIELD | The Knoll B RAIN GARDEN | Campus Meadow C POLLINATOR PLANTINGS |
D GREEN ROOF | Building Fi E LOCAL MATERIALS: BOULDERS | The Bluff F STORMWATER PLANTING | South of Building Ki
G POLLINATOR PLANTINGS | South of Building K
A
C
F G
D E
Bto provide seasonal interest and variety. Representative
gardens are interspersed throughout the passive landscapes
and garden areas. These gardens display a wide horticultural
range and are meant to refl ect plant communities throughout
the world. Some of these gardens refl ect a native and natural
plant community or are meant to function as a stormwater
treatment and infi ltration zone. Characteristics of the
selected plants refl ect these shifts in function or intent.
EXISTING CONDITIONS ANALYSIS
Figure 4.23 Selected Landscape Interventions
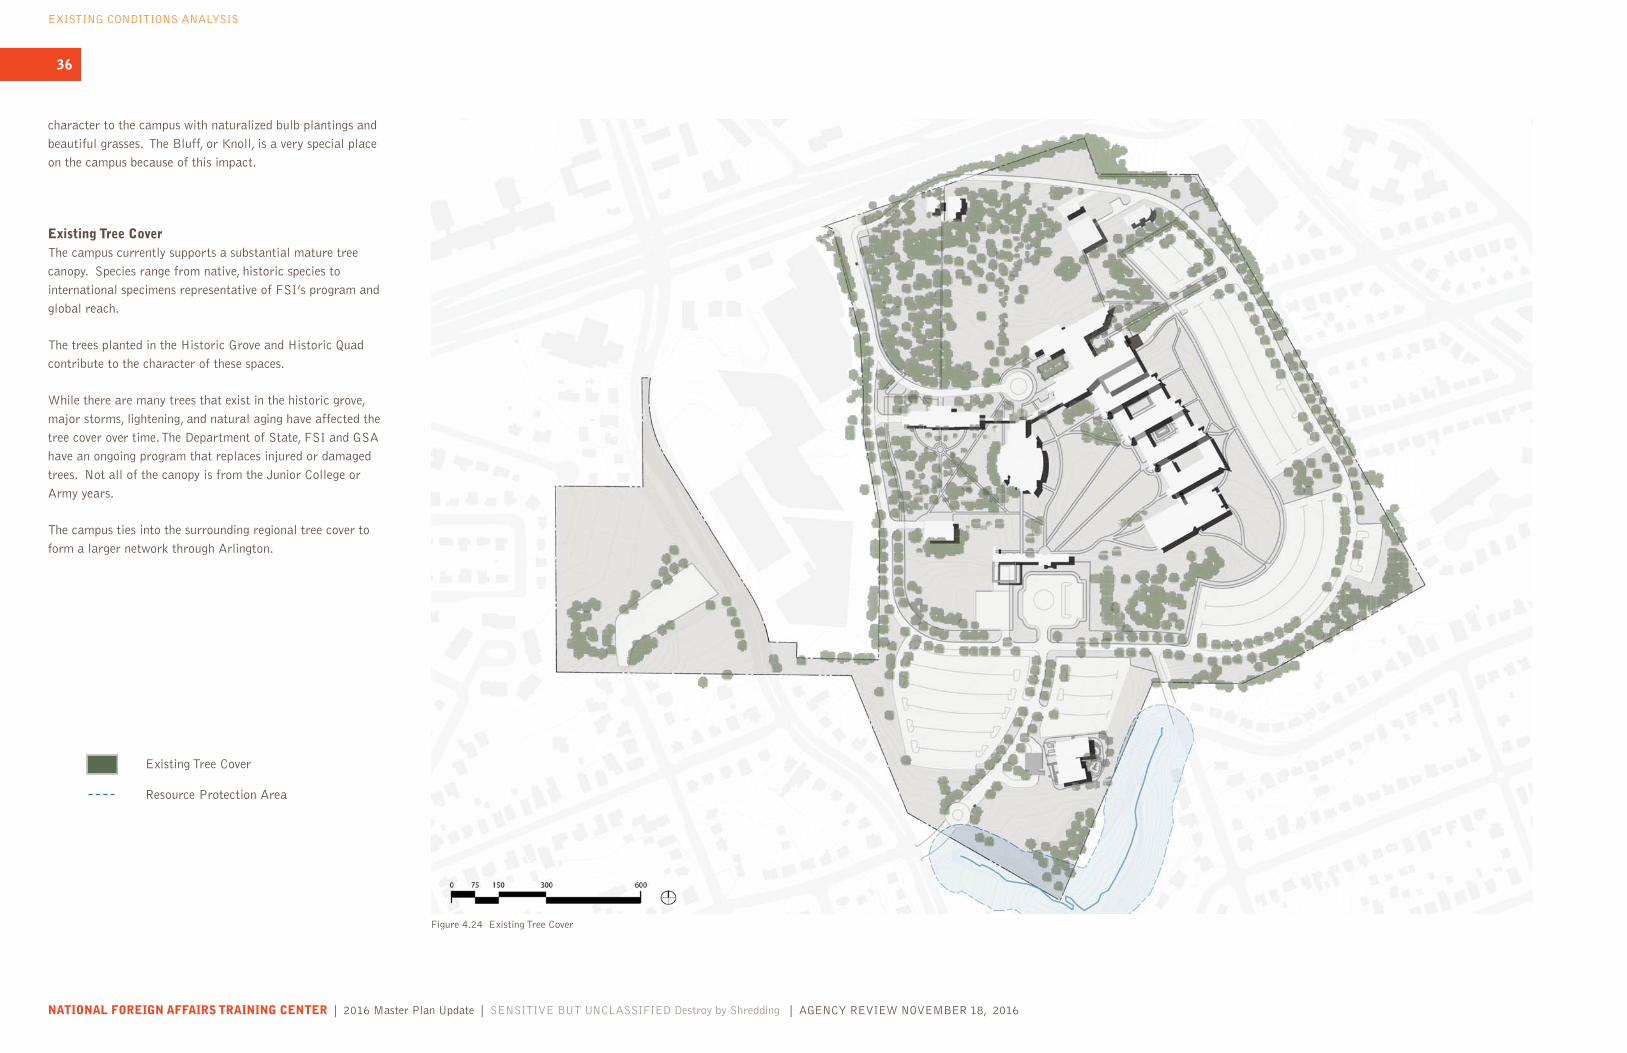
NATIONAL FOREIGN AFFAIRS TRAINING CENTER | 2016 Master Plan Update | SENSITIVE BUT UNCLASSIFIED Destroy by Shredding | AGENCY REVIEW NOVEMBER 18, 2016
36
Existing Tree CoverThe campus currently supports a substantial mature tree
canopy. Species range from native, historic species to
international specimens representative of FSI’s program and
global reach.
The trees planted in the Historic Grove and Historic Quad
contribute to the character of these spaces.
While there are many trees that exist in the historic grove,
major storms, lightening, and natural aging have affected the
tree cover over time. The Department of State, FSI and GSA
have an ongoing program that replaces injured or damaged
trees. Not all of the canopy is from the Junior College or
Army years.
The campus ties into the surrounding regional tree cover to
form a larger network through Arlington.
character to the campus with naturalized bulb plantings and
beautiful grasses. The Bluff, or Knoll, is a very special place
on the campus because of this impact.
EXISTING CONDITIONS ANALYSIS
Figure 4.24 Existing Tree Cover
Existing Tree Cover
Resource Protection Area

NATIONAL FOREIGN AFFAIRS TRAINING CENTER | 2016 Master Plan Update | SENSITIVE BUT UNCLASSIFIED Destroy by Shredding | AGENCY REVIEW NOVEMBER 18, 2016
37
Neighborhood ViewsThe campus is tucked away from major roads and maintains
a discrete presence in Arlington County. There is a landscape
buffer surrounding much of the campus.
These views capture the vistas that connect the campus to its
surrounding neighborhoods and provide the campus with an
understated identity.
EXISTING CONDITIONS ANALYSIS
Figure 4.27 View looking north to NFATC South Entry from George Mason Drive
Figure 4.26 View looking south to NFATC Main Entry from Arlington Boulevard Access Road (Eastbound)
Figure 4.25 View Diagram (1 and 2)
1
2

NATIONAL FOREIGN AFFAIRS TRAINING CENTER | 2016 Master Plan Update | SENSITIVE BUT UNCLASSIFIED Destroy by Shredding | AGENCY REVIEW NOVEMBER 18, 2016
38
Neighborhood Views (Cont.)
4
EXISTING CONDITIONS ANALYSIS
Figure 4.30 View looking north to NFATC from South Quincy Street
Figure 4.29 View looking west to NFATC from South 6th Street
3
Figure 4.28 View Diagram (3 and 4)
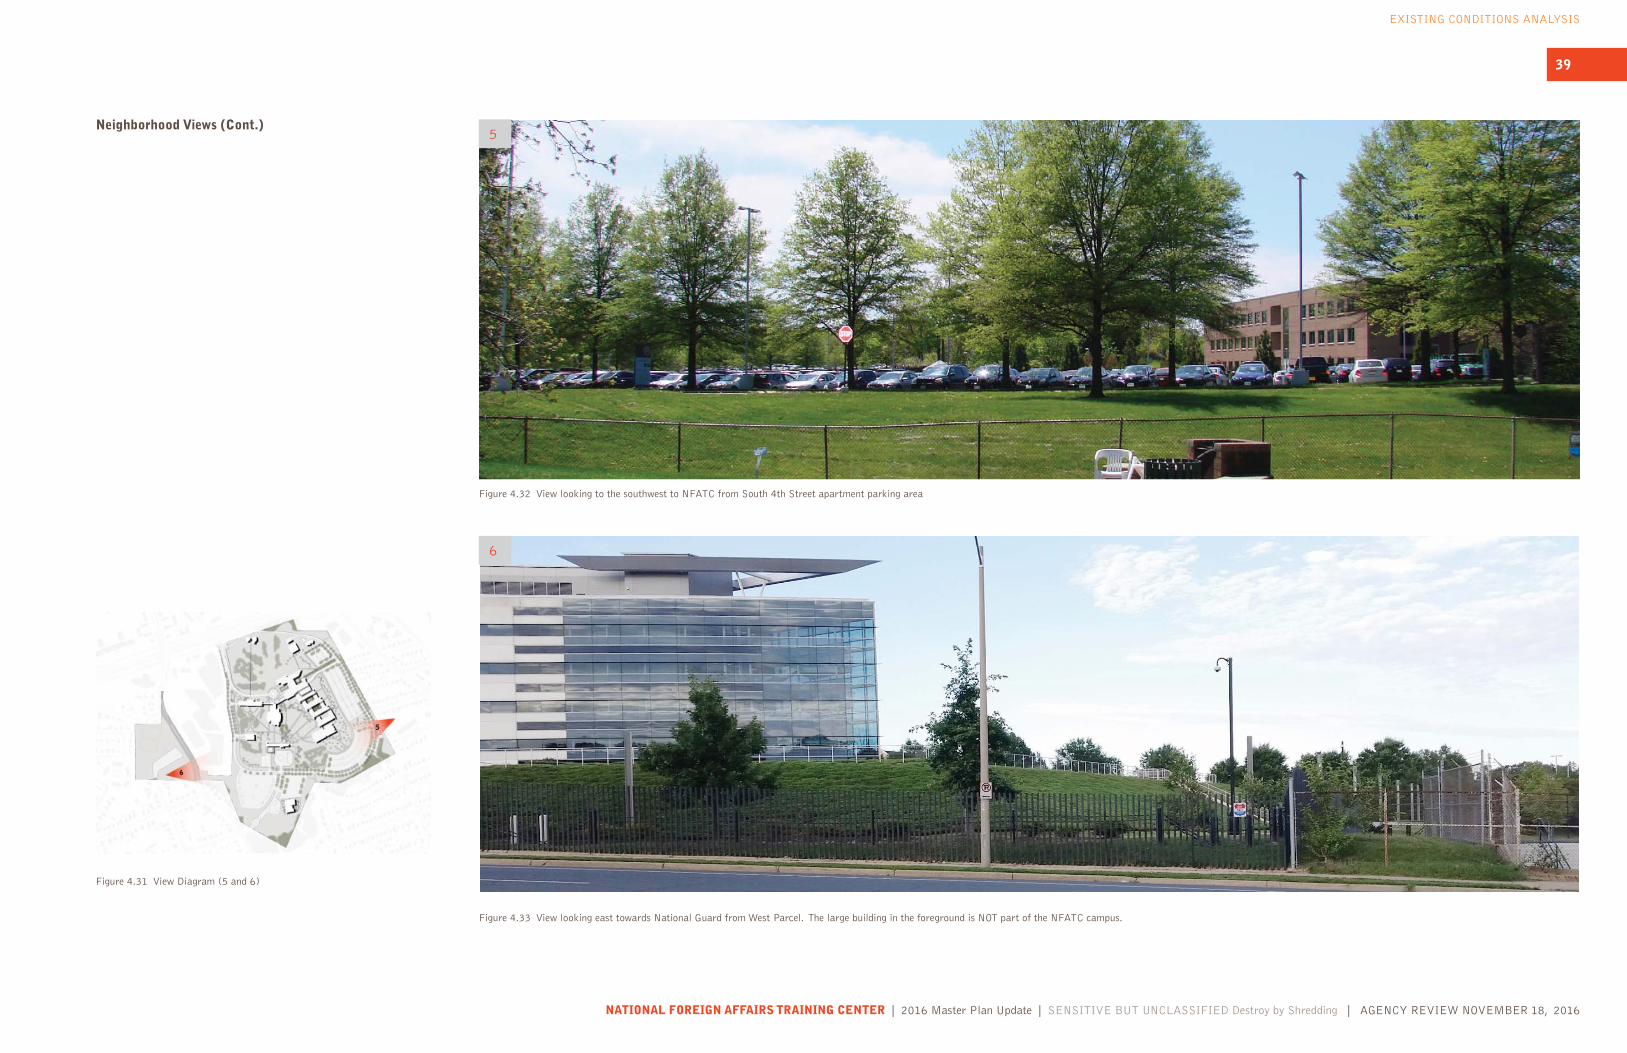
NATIONAL FOREIGN AFFAIRS TRAINING CENTER | 2016 Master Plan Update | SENSITIVE BUT UNCLASSIFIED Destroy by Shredding | AGENCY REVIEW NOVEMBER 18, 2016
39
5Neighborhood Views (Cont.)
6
EXISTING CONDITIONS ANALYSIS
Figure 4.32 View looking to the southwest to NFATC from South 4th Street apartment parking area
Figure 4.31 View Diagram (5 and 6)
Figure 4.33 View looking east towards National Guard from West Parcel. The large building in the foreground is NOT part of the NFATC campus.

NATIONAL FOREIGN AFFAIRS TRAINING CENTER | 2016 Master Plan Update | SENSITIVE BUT UNCLASSIFIED Destroy by Shredding | AGENCY REVIEW NOVEMBER 18, 2016
40
NEED PHOTO
Views Within the CampusThe primary views and landmarks contributing to the
landscape and site character at NFATC are located within
Site Parcel 2: Historic Elements and in the quadrangle
west of Classroom Buildings F and K in Site Parcel 1: The
Conteporary Academic Campus. View 7 is located near
the two historic cottages at the northern edge and high
point of the campus. The vista looking south captures the
overall scale of the site, the large central swale and sloping
landforms, and the original Old Main (Building E) that was
the heart of the historic campus. View 7 shows the vista
looking north from Old Main to the chiller plant. This view
highlights the bowl-shaped topography that defi nes the major
outdoor space for the historic campus. This view emphasizes
the character of the site as a classic American academic
campus, with large outdoor spaces of lawn defi ned and
shaded by large canopy trees. The third viewpoint is located
on a small knoll southwest of Building K. This vista looking
north shows the primary outdoor space and landform of the
modern NFATC campus, defi ned by the Visitor Center, Dining
Hall, and classroom buildings.
7
8
EXISTING CONDITIONS ANALYSIS
Figure 4.34 View Diagram (7 and 8)
Figure 4.36 Campus view looking north towards Cottages
Figure 4.35 Campus view looking north towards Chiller plant

NATIONAL FOREIGN AFFAIRS TRAINING CENTER | 2016 Master Plan Update | SENSITIVE BUT UNCLASSIFIED Destroy by Shredding | AGENCY REVIEW NOVEMBER 18, 2016
41
Views Within the Campus (cont.)
These views capture internal vistas and landmarks within the
campus.
9
10
EXISTING CONDITIONS ANALYSIS
Figure 4.38 Campus view looking south to Gym
Figure 4.37 View Diagram (9 and 10)
Figure 4.39 Campus view looking east to Buildings F and K

NATIONAL FOREIGN AFFAIRS TRAINING CENTER | 2016 Master Plan Update | SENSITIVE BUT UNCLASSIFIED Destroy by Shredding | AGENCY REVIEW NOVEMBER 18, 2016
42
Views Within the Campus (cont.)
NEED PHOTO
11
EXISTING CONDITIONS ANALYSIS
Figure 4.41 View approaching Old Main looking southwest
Figure 4.42 Selected NFATC campus views
Figure 4.40 View Diagram (11)
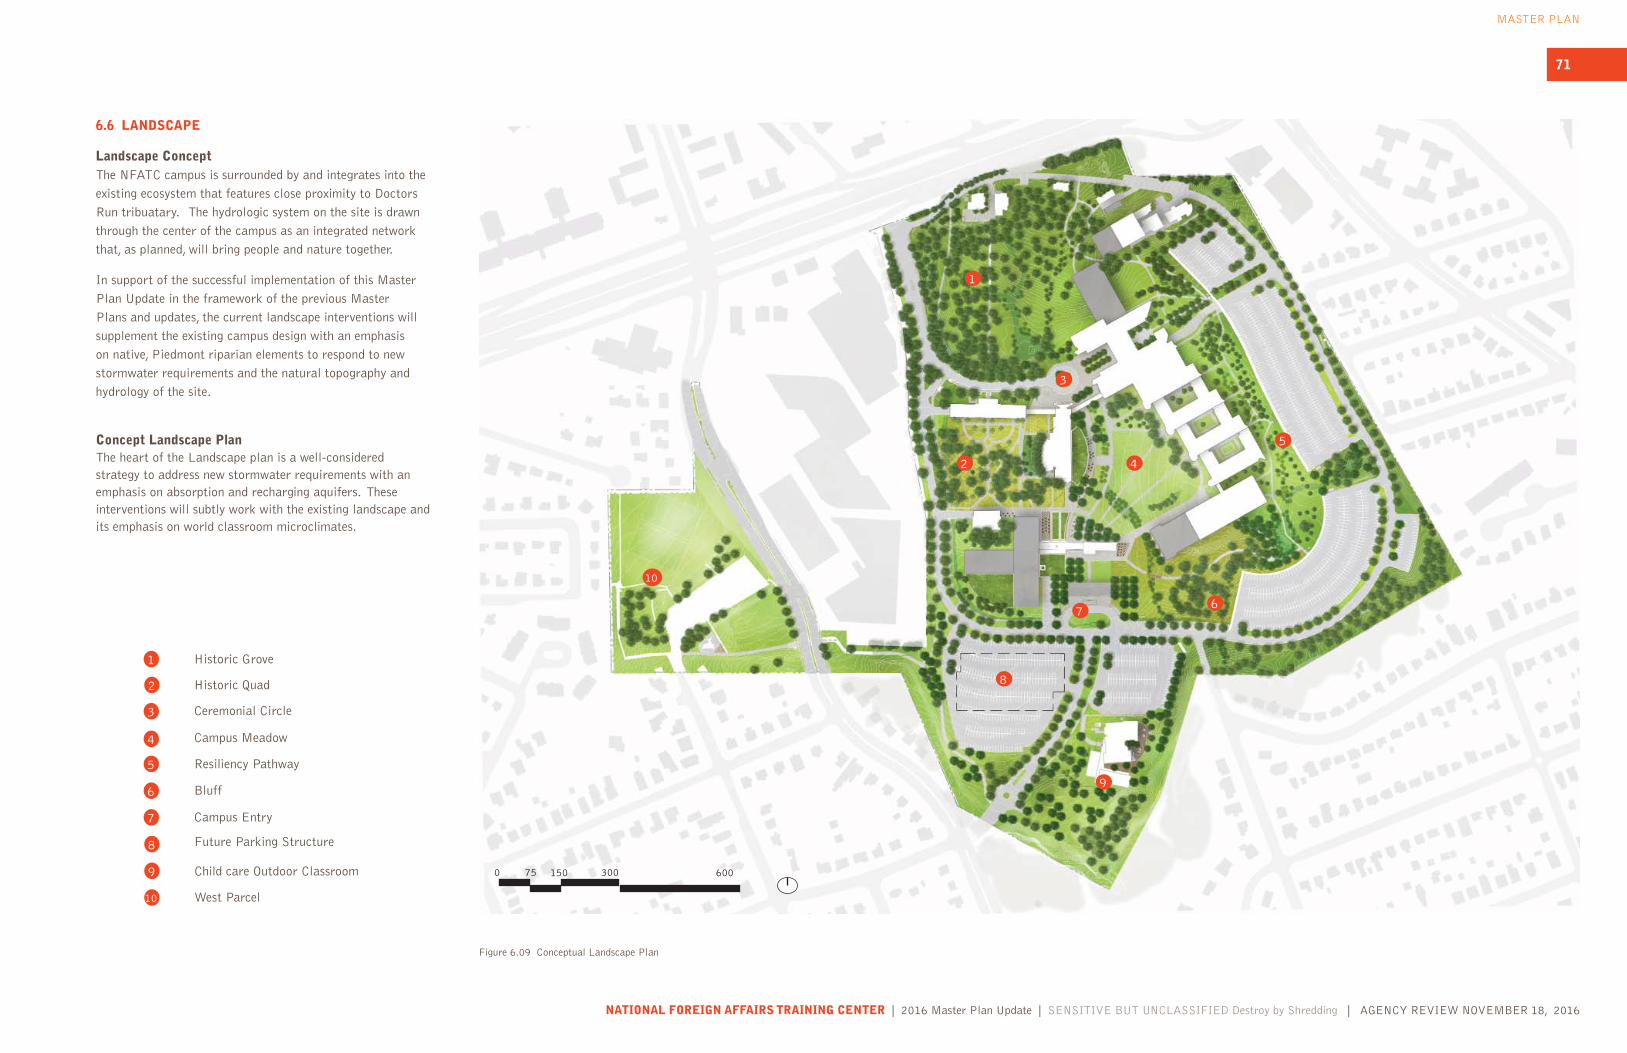
NATIONAL FOREIGN AFFAIRS TRAINING CENTER | 2016 Master Plan Update | SENSITIVE BUT UNCLASSIFIED Destroy by Shredding | AGENCY REVIEW NOVEMBER 18, 2016
71
MASTER PLAN
Figure 6.09 Conceptual Landscape Plan
0 75 150 300 600
3
4
5
76
9
8
6.6 LANDSCAPE
Landscape ConceptThe NFATC campus is surrounded by and integrates into the
existing ecosystem that features close proximity to Doctors
Run tribuatary. The hydrologic system on the site is drawn
through the center of the campus as an integrated network
that, as planned, will bring people and nature together.
In support of the successful implementation of this Master
Plan Update in the framework of the previous Master
Plans and updates, the current landscape interventions will
supplement the existing campus design with an emphasis
on native, Piedmont riparian elements to respond to new
stormwater requirements and the natural topography and
hydrology of the site.
Concept Landscape Plan The heart of the Landscape plan is a well-considered strategy to address new stormwater requirements with an emphasis on absorption and recharging aquifers. These interventions will subtly work with the existing landscape and its emphasis on world classroom microclimates.
10
2
1
1
2
3
4
5
6
7
8
9
10
Historic Grove
Historic Quad
Ceremonial Circle
Campus Meadow
Resiliency Pathway
Bluff
Campus Entry
Future Parking Structure
Child care Outdoor Classroom
West Parcel

NATIONAL FOREIGN AFFAIRS TRAINING CENTER | 2016 Master Plan Update | SENSITIVE BUT UNCLASSIFIED Destroy by Shredding | AGENCY REVIEW NOVEMBER 18, 2016
72
MASTER PLAN
In the Academic Campus, creating additional outdoor seating and community space was encouraged at signifi cant campus locations, such as the Dinishing Facilty and the Visitor Center. The Dining Facility is where a high concentration of students can be found between classes and is considereed the social heart of the campus and the Visitor Center as it presents the public face to visitors and other non-employees.
The landscape interactions at the dining facility have been planned to provide comfortable space for spontaneous gatherings and also fl exibility for program and campus use and support a variety of social experiences. Small group study space and outdoor dining will extend usable, occupiabl ecampus space into the landscape.
Other landscape spaces have been organized by a green infrastructure system that will collect, treat, and cleanse stormwater runoff before it discharges to Doctor’s Run. This collection of water will cultivate a rich, native plant palette and create a variety of social amenity spaces integrated into a sustainable network throughout the campus.
Planting The primary focus of the proposed planting strategy has been to provide a diverse and low-maintenance plant palette to support native wildlife, provide seasonal interest, and contribute to environmentally appropriate stormwater collection and fi ltration.
Some areas of the campus have been dedicated to deciduous forest plantings featuring canopy trees, understory, and woodland shrubs native to the Piedmont forests surrounding the site. Denser plantings will frame more open areas to create a subtle diversity within the landscape.
Other areas have been designated for naturalized grasses, perennials, and other herbaceous plantings rather than the currently existing fi ne lawn. This change will reduce the resources required for growth and maintenance, and discourage pests, such as geese, from landing and establishing on site. In accordance with LEED guidelines, plant selection has been planned for reduction of potable water use for irrigation. Where possible, xeriscaping techniques have been envisioned to reduce resource intensive planting zones while still providing visual interest and spatial variation. Integrating social amenity space with this plant palette will provide for variety and connect to the natural environment.
Campus Visitor Center The new Visitor Center expansion will frame a new landscape
room, planned to make visitor access to the academic
campus highly identifi able and welcoming. Upon approach,
wayfi nding strategies will be employed to defi ne visitor
circulation for pedestrians and vehicles. A proposed raised
table intersection has been planned to calm traffi c and
prioritize the pedestrian experience. Clear, defi ned vehicular
circulation/drop-off will benefi t pedestrians and drivers. As
visitors enter the secured Academic Campus, the welcoming
landscape will be extended by a post-entry outdoor amenity
space and views to the open lawn area. Higher quality,
more formal materials will lend substance to the entrance
experience.
The planting strategy at the campus entry will introduce the
overall character of the campus landscape and showcase
sustainability goals. To promote visibility and security, low
plantings have been selected to provide clear sight lines. No-
mow fescue is a sustainable strategy for an entry lawn for
pedestrians to meet, gather, sit on the grass, and begin the
day. The proposed plant species are salt tolerant in light of
the proximity of vehicular circulation.
0 25 50 100 200Figure 6.10 Landscape Detail, Campus Entry
Key Plan - Campus Visitor CenterFigure 6.11 Section View, Post-Entry Amenity Space1/32”= 1’0”

NATIONAL FOREIGN AFFAIRS TRAINING CENTER | 2016 Master Plan Update | SENSITIVE BUT UNCLASSIFIED Destroy by Shredding | AGENCY REVIEW NOVEMBER 18, 2016
73
MASTER PLAN
Historic Quad The historic quadis a more formal, historic
area of the NFATC campus, its signifi cance enhanced
through plant and material selection. Historically places for
gathering, gardens should refl ect the importance of space.
This function will remain unchanged in the Master Plan. To
provide more dining space to the west of the dining hall, the
patio will be enlarged.
This area was once known as the ‘Oak Grove’, it will be
emphasized through the proposed landscape approach. The
historic, mature planting will be maintained and new plants
selected from the historic palette will be used to reinforce
and complement the existing character. Selected areas
will be highlighted with more robust planting. Plants have
been selected for their suitability to a garden, but are low-
maintenance and appropriate for both sun and shade. The
mature Quercus Alba is a majestic canopy tree; the proposed
understory plantings have been selected to complement them
and enhance the ground plane. The peony walk highlighted
in the 1937 brochure can be re-established to once again
contribute to the historic garden character of the Historic
Quad.
Campus Meadow The campus meadow is framed by existing
and new buildings; it is and will continue to be a large,
fl exible room meant to function as the main campus “quad”
or heart. The space will continue to support daily use with
pedestrian pathways for circulation and smaller gathering
spaces throughout. It also can accommodate special events
for the entire campus population.
Constructed terraces will make the existing sloped
embankment occupiable and scattered trees will add shade
and a sense of enclosure for movable tables and chairs to the
east of the Dining Hall.
Bioretention plantings will carry stormwater through the
terraces and open lawn.
0 25 50 100 200Figure 6.12 Landscape Detail, Campus Meadow
B
Key Plan--Campus Meadow
Figure 6.14 Campus Meadow; 4500 people, Daily use, 1500 people
Key Plan--Historic Quad
Figure 6.13 Section View B, Campus Meadow1/32”= 1’0”
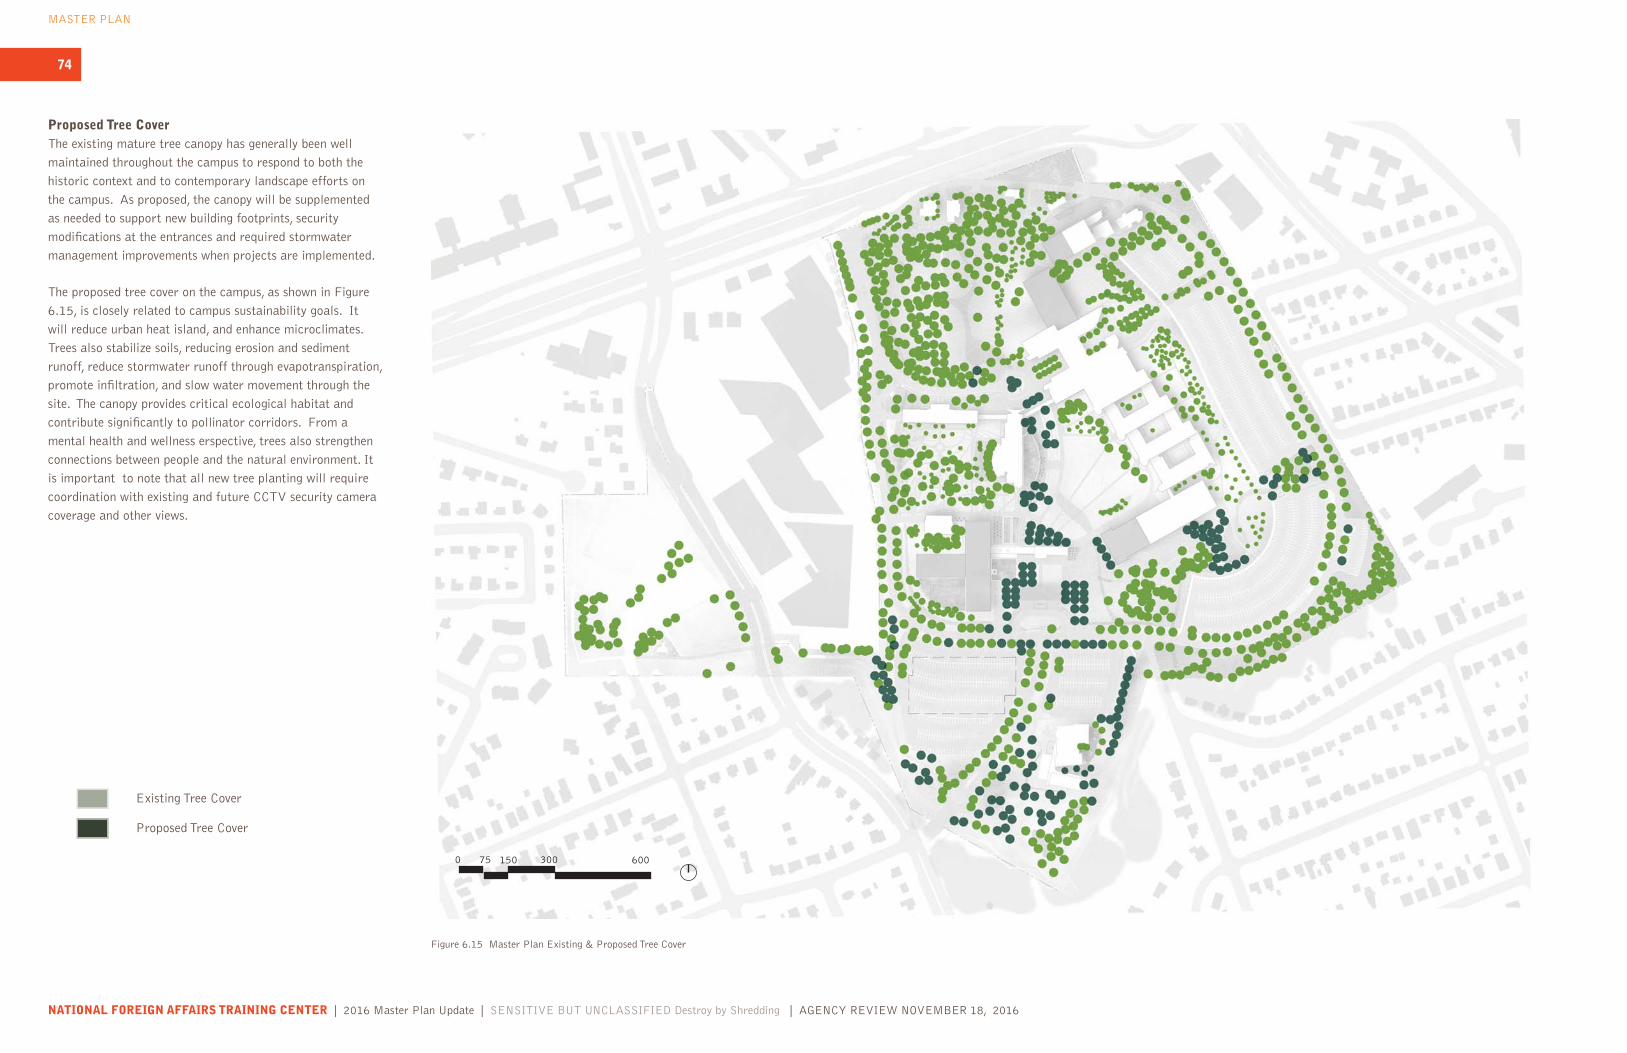
NATIONAL FOREIGN AFFAIRS TRAINING CENTER | 2016 Master Plan Update | SENSITIVE BUT UNCLASSIFIED Destroy by Shredding | AGENCY REVIEW NOVEMBER 18, 2016
74
MASTER PLAN
Existing Tree Cover
Proposed Tree Cover
Figure 6.15 Master Plan Existing & Proposed Tree Cover
Proposed Tree CoverThe existing mature tree canopy has generally been well
maintained throughout the campus to respond to both the
historic context and to contemporary landscape efforts on
the campus. As proposed, the canopy will be supplemented
as needed to support new building footprints, security
modifi cations at the entrances and required stormwater
management improvements when projects are implemented.
The proposed tree cover on the campus, as shown in Figure
6.15, is closely related to campus sustainability goals. It
will reduce urban heat island, and enhance microclimates.
Trees also stabilize soils, reducing erosion and sediment
runoff, reduce stormwater runoff through evapotranspiration,
promote infi ltration, and slow water movement through the
site. The canopy provides critical ecological habitat and
contribute signifi cantly to pollinator corridors. From a
mental health and wellness erspective, trees also strengthen
connections between people and the natural environment. It
is important to note that all new tree planting will require
coordination with existing and future CCTV security camera
coverage and other views.
0 75 150 300 600
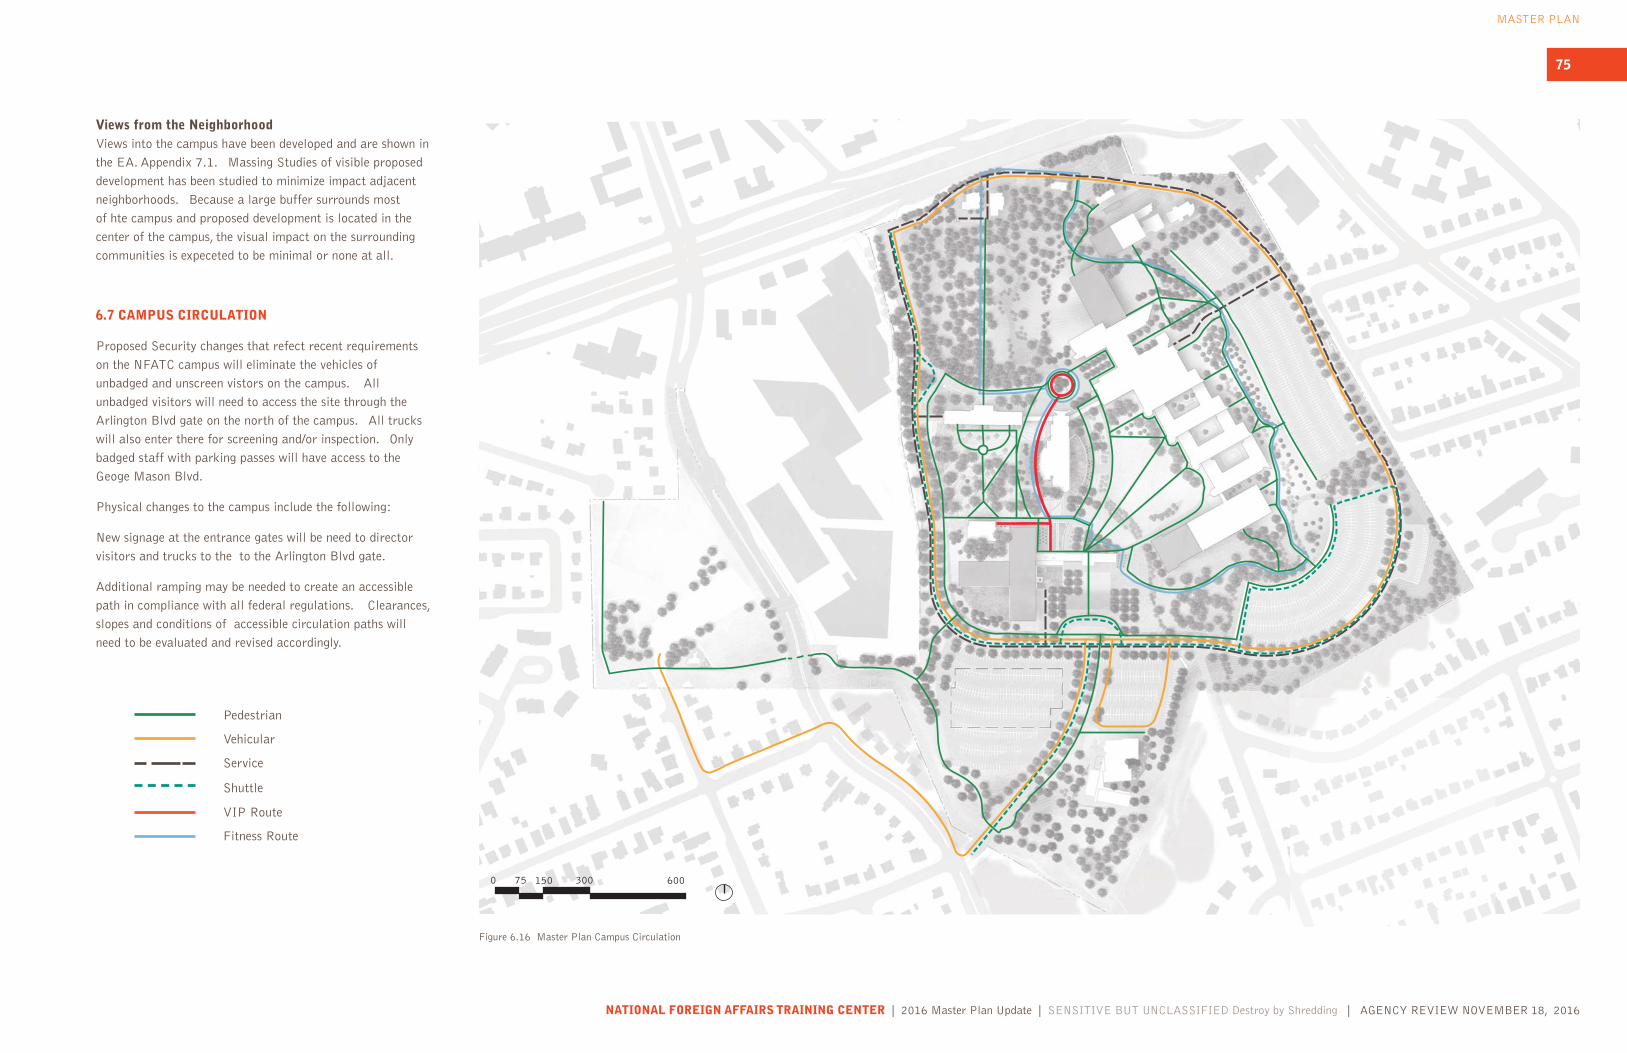
NATIONAL FOREIGN AFFAIRS TRAINING CENTER | 2016 Master Plan Update | SENSITIVE BUT UNCLASSIFIED Destroy by Shredding | AGENCY REVIEW NOVEMBER 18, 2016
75
MASTER PLAN
6.7 CAMPUS CIRCULATION
Proposed Security changes that refect recent requirements
on the NFATC campus will eliminate the vehicles of
unbadged and unscreen vistors on the campus. All
unbadged visitors will need to access the site through the
Arlington Blvd gate on the north of the campus. All trucks
will also enter there for screening and/or inspection. Only
badged staff with parking passes will have access to the
Geoge Mason Blvd.
Physical changes to the campus include the following:
New signage at the entrance gates will be need to director
visitors and trucks to the to the Arlington Blvd gate.
Additional ramping may be needed to create an accessible
path in compliance with all federal regulations. Clearances,
slopes and conditions of accessible circulation paths will
need to be evaluated and revised accordingly.
Views from the NeighborhoodViews into the campus have been developed and are shown in
the EA. Appendix 7.1. Massing Studies of visible proposed
development has been studied to minimize impact adjacent
neighborhoods. Because a large buffer surrounds most
of hte campus and proposed development is located in the
center of the campus, the visual impact on the surrounding
communities is expeceted to be minimal or none at all.
Figure 6.16 Master Plan Campus Circulation
0 75 150 300 600
Pedestrian
Vehicular
Service
Shuttle
VIP Route
Fitness Route