Embed Size (px)
Citation preview

BoR (17) 184
5 October 2017
BEREC Report on IP-Interconnection practices in the Context of
Net Neutrality

BoR (17) 184
1
Table of Contents
List of Figures
1 Introduction 5
2 Legal basis 5
3 Major developments since BERECs report 2012 6
3.1 Traffic evolution 6
3.2 Pricing and costing developments 7
3.3 Changing players along the value chain and changes in traffic delivery 7
3.3.1 CDNs 7
3.3.2 Infrastructure deployment of CAPs 8
3.3.3 Regionalisation of traffic 8
3.3.4 IXP traffic developments 9
3.3.5 Peering developments 9
4 A generic outline of typical IP interconnection disputes 11
4.1 An illustrative example 11
4.2 Issues at stake 13
5 Measuring congestion at IP-interconnection links 14
6 Activities of authorities 19
6.1 National Regulatory Authorities in Europe 19
6.1.1 France 19
6.1.2 Netherlands 21
6.1.3 Spain 21
6.1.4 Switzerland 22
6.2 European Commission 24
6.3 FCC 24
7 Conclusions 25
Annex 31

BoR (17) 184
2
List of Figures
Figure 3-1: Traffic concentration trends (2007, 2009, 2013) 9
Figure 4-1: Netflix Video quality 13
Figure 5-1: Distribution of 95th percentile peak ingress utilization across all ISPs, with all ISPs equally weighted 15
Figure 5-2: Round-trip time measurement to identify congestion 17
Figure 5-3: Possible locations of congestion 18
Figure 6-1: Peering vs. Transit in France* 19
Figure 6-2: Free Peering vs. Paid Peering in France* 20
Figure A 1: Cisco VNI Forecasts 194 EB per Month of IP Traffic by 2020 31
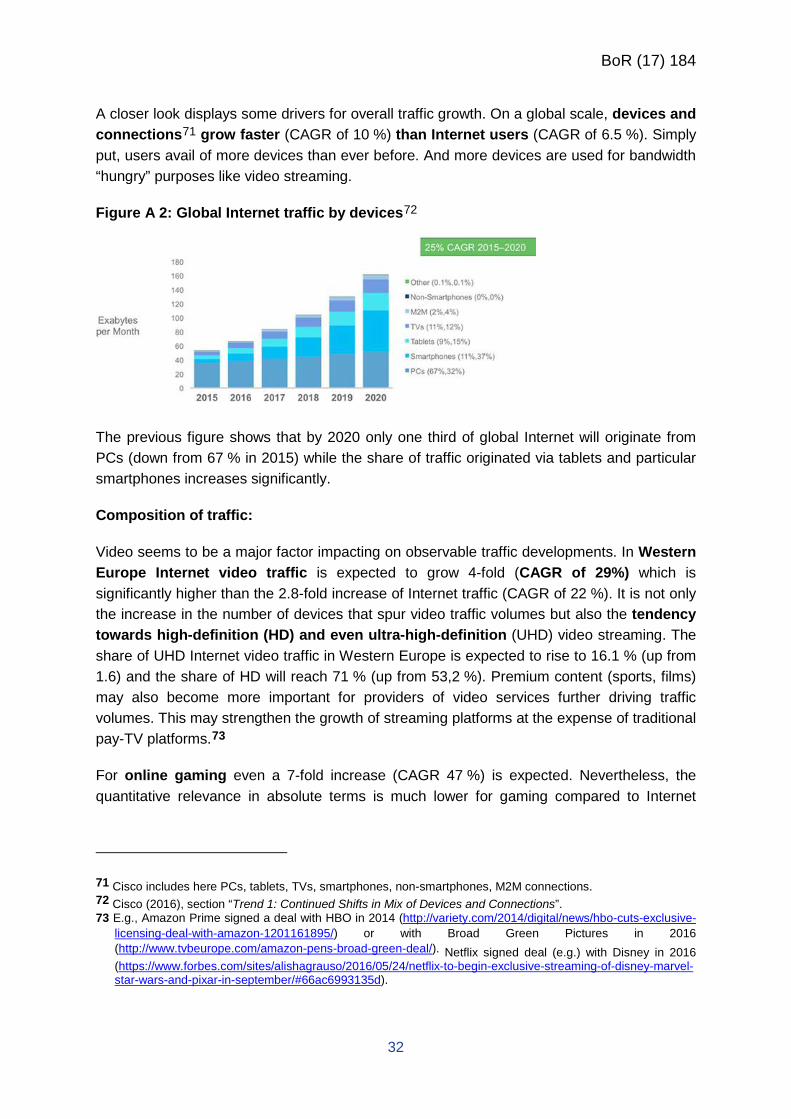
Figure A 2: Global Internet traffic by devices 32
Figure A 4: Percent of streaming traffic during peak hours 2009-2015 34
Figure A 5: Busy-Hour Compared with Average Internet Traffic Growth 34
Figure A 6: Internet Transit Pricing (1998-2015) 35
Figure A 7: 10 GigE IP Transit Prices & Price Declines 36
Figure A 8: Estimate for transit revenues 36
Figure A 9: Prices for CDN services in relation to bandwidth used 37
Figure A 10: CDN growth 39
Figure A 11: Global Content Delivery Network Internet Traffic, 2015 and 2020 39
Figure A 12: Traffic development at the DE-CIX, 5-year graph 44
BoR (17) 184
3
Executive Summary
In 2012 BEREC published the report “An assessment of IP interconnection in the context of Net Neutrality” which had concluded that the Internet ecosystem managed to adapt IP interconnection arrangement to reflect changes in technology, in the (relative) market power of players, in demand patterns and in business models, all this happening without a need for regulatory intervention.
In November 2016 BEREC held the 3rd expert workshop in IP-interconnection in co-operation with the OECD – bringing together members of academia, market experts and participants as well as public authorities including European NRAs, the FCC, the Mexican Regulator as well as DG Competition.1 The insights gained at the workshop have informed the current project.
The report is now updated and puts these findings to the test considering the developments having occurred since 2012. Empirical evidence shows that many developments observed in 2012 are still ongoing:
- Internet traffic volumes continue to increase - mainly driven by video streaming services.
- Prices for transit or CDN services are still declining. BEREC considers that the price decline for transit services indicates that the market is highly competitive but at the same time put under pressure, both from peering services as well as CDN services.
- Costs of delivering data packets (on a per unit basis) continue to decline.
Furthermore, this report displays recent developments with regard to business models (e.g. CDNs), changes in traffic delivery and institutional arrangements (e.g. peering). Internal servers such as on-net CDNs or cache servers are becoming more prevalent within the market reducing the need for interconnection capacity. The increasing importance of CDNs as a means of traffic delivery coincides with the general growth in traffic, in particular video, as well as the gaining relevance of large CAPs with huge volumes of content.
Some large CAPs also participate in different network infrastructure projects. It can be generally observed, that the Internet becomes more densely interconnected than in the past. Informal “handshake” agreements concluded without a written contract continue to make up for more than 99% of all peering agreement. However, the evidence suggests that paid peering is not uncommon involving some larger European Internet access service providers. Also, traffic volumes exchanged at the biggest European IXPs – DE-CIX, AMS-IX, LINX continue to grow.
This report also provides a generic outline of recent IP interconnection disputes in recent years. Traffic asymmetries are a major factor in those instances where disputes emerged in practice. Often, these disputes are characterized by mutual recriminations between the parties involved.
1 BEREC (2016b).

BoR (17) 184
4
Furthermore, BEREC sets out the challenges of identifying the exact location of congestion as well as the party responsible for this. While congested Internet links may exist in practice, this does not seem to be a general phenomenon as empirical findings show.
A country case section displays how different European NRAs / NCAs have engaged in IP interconnection issues since 2012. This includes France, the Netherlands, Spain and Switzerland as well as the European Commission and the US.
Based on the evidence provided in this report BEREC draws in particular the following conclusions:
- While aggregate Internet traffic volumes continue to grow, prices for transit and CDN services also continue to decline. BEREC considers that the Internet ecosystem’s ability to cope with increasing traffic volumes is still given.
- Where disputes have emerged in practice these seem to involve complex relationships as well as economic/strategic considerations of the providers.
- They were typically solved in the market without regulatory intervention. However, NRAs should carefully monitor whether this continues to be the case.
- The availability of transit and its substitutability with peering is one of several factors relevant for the assessment of a competitive bottleneck
- While transit is declining as a proportion of traffic it remains a very significant form of interconnection. Hence the availability and pricing of transit might be expected to constrain negotiations over the settlement basis of peering agreements. However, transit’s ability to substitute for peering may be less clear in case of video streaming, where demand for capacity is very large and a high quality is required.
- Other relevant factors are retail competition and switching, CAPs’, CDNs’ and transit providers’ countervailing power in negotiations with internet access service providers. However, these factors are predicated on conditions which may not always hold (e.g. availability of alternative transit routes, ease of consumer switching, etc),Broadly, to date NRAs have found that factors like the above do mitigate potential concerns. It should be noted, however, that NRAs’ conclusions apply mainly to their respective national markets and caution should be exercised when considering wider implications . If a complaint is addressed to the NRA the case has to be carefully assessed based on the specifics of the individual case.
- NRAs should consider monitoring developments. If they have the relevant powers NRAs may wish to collect data on interconnection markets, for example covering the role of transit and peering and the extent of paid peering thereby enhancing transparency.
- Competition and transparency for consumers remain key factors ensuring that market forces work efficiently
- NRAs should continue to apply a careful approach when considering whether regulation is actually warranted.

BoR (17) 184
5
1 Introduction
BEREC published a first report “An assessment of IP interconnection in the context of Net Neutrality” in 2012.2 In that report BEREC described how the Internet ecosystem had managed to adapt IP interconnection arrangements to reflect changes in technology, in the (relative) market power of players, in demand patterns and in business models. This had happened without the need for regulatory intervention.
Now, five years later, BEREC provides an update reflecting developments that have occurred since 2012. In order to inform this update BEREC – in co-operation with the OECD – held a workshop on IP-interconnection on November 2016.3 During that workshop the topic of IP interconnection was addressed from different perspectives, covering latest empirical trends on internet interconnection, measurement performance, industry viewpoints on Internet traffic exchange as well as public authorities approach to IP interconnection.
A condensed look at the legal basis for IP interconnection also considering the Regulation 2015/2120 as well as BEREC’s Guidelines on Net Neutrality serves as a starting point (chapter 2). The following chapter 3 encompasses an updated description of various developments allowing to juxtapose them to the developments described in 2012. This includes a description of recent traffic (3.1) as well as pricing and costing developments (3.2) allowing to verify the hypothesis that – broadly speaking – the Internet is able to cope with increasing traffic volumes particularly resulting from the growing popularity of video streaming services. Chapter 3.3. then displays recent developments with regard to business models (e.g. CDNs), changes in traffic delivery and institutional arrangements (e.g. peering). Chapter 4 describes in a generic way the nature of IP-interconnection disputes that have occurred since BEREC’s previous report, first providing an illustrative example of such disputes in (4.1) and identifying then (4.2) in particular factors relevant for assessing whether a termination bottleneck can be exploited. As such disputes typically involve claims of congestion, Chapter 5 assess whether this has become more prevalent, but also the challenges of identifying location as well as causation of congestion. This is followed (Chapter 6) by some country cases of European NRAs / NCAs having engaged in IP interconnection issues since 2012 as well as a focussed look at the European Commission’s and the FCC. The annex provides a more comprehensive view at various empirical findings.
2 Legal basis
In its 2012 report BEREC displayed the regulatory context for IP interconnection. According to this obligations to interconnect may be imposed under Art. 8 and Ar. 12 (1) lit I AD as a
2 BEREC (2012a). 3 BEREC (2016b).

BoR (17) 184
6
result of SMP. The current Commission’s Relevant Market Recommendation4 does not identify a market for wholesale Internet connectivity susceptible to ex ante regulation. Where end-to-end connectivity is at stake, an obligation to interconnect could also be imposed (independent of SMP) under Arts. 4 and 5 AD. The regulatory context set out by BEREC is still applicable.5
The focus of the Regulation 2015/2120 is on internet access services provided to end-users. With regard to IP-interconnection BEREC’s Guidelines clarified that the EU-Regulation 2015/2120 in its Art. 3 (3) concerns equal treatment of all traffic “when providing internet access service” and therefore excludes IP interconnection practices from its scope.6
The Regulation does not create powers in addition to those existing under the Regulatory Framework. However, BEREC acknowledges in its Guidelines on Net Neutrality that NRAs may take into account the interconnection policies and practices of ISPs in so far as they have the effect of limiting the exercise of end-user rights under Art.3(1) of the Regulation. This may be relevant e.g. if interconnection is implemented in a way which seeks to circumvent the Regulation.7
3 Major developments since BERECs report 2012
3.1 Traffic evolution
In its report from 2012 BEREC showed that IP traffic was increasing although at a declining growth rate. This development is continuing. IP traffic is estimated to grow with a compound annual growth rate (CAGR) of 20 % for Western Europe and 27 % for Central and Eastern Europe respectively (2015-2020).8 Also, mobile Internet traffic growth rates continue to level off.
Traffic growth is largely driven by video traffic. The share of consumer Internet video traffic of all consumer Internet traffic in Western Europe is expected grow from 66 % (2015) to 83 % (2020).9 This development is spurred as users increasingly use multiple devices for video streaming. On the other hand, file sharing traffic is declining in relative terms. Given that video is typically consumed at peak hours it seems plausible that Internet traffic is expected
4 “Commission Recommendation of 9 October 2014 on relevant product and service markets within the electronic communications sector susceptible to ex ante regulation in accordance with Directive 2002/21/EC of the European Parliament and of the Council on a common regulatory framework for electronic communications networks and services”,
http://eur-lex.europa.eu/legal-content/EN/TXT/PDF/?uri=CELEX:32014H0710&from=EN 5 For details see BEREC (2012a), Ch. 5. 6 BEREC (2016a), para. 50. 7 BEREC (2016a), para. 6. 8 Further empirial findings on traffic developments as well as other major developments are set out in the annex. 9 Cisco, VNI Forecast Highlights Tool.
BoR (17) 184
7
to see a more pronounced peak-to-average ratio. Busy hour Internet traffic is forecasted to grow at a CAGR of 36 % (2015-2020) while the corresponding figure for average hour Internet traffic is 25 % “only”.10
Furthermore, Internet traffic via mobile and Wi-Fi devices is expected to become even more important. Its share will grow from 62 % (2015) to 78 % (2020) while the share of Internet traffic from wired devices will decline to 22 %.11 These developments are driven by smartphones and increasingly tablets as well as the growing availability of public Wi-Fi hotspots. While mobile Internet traffic excels fixed Internet traffic in terms of growth rates, absolute volumes of traffic remain higher for fixed traffic.
3.2 Pricing and costing developments
Generally, the pricing developments described in BEREC’s last report from 2012 are continuing. For example, transit prices fell by 33 % in 2015.12 In addition to this general trend, transit markets exhibit geographic differences. Less mature markets display steeper price decline while transit prices in more mature markets have already reached a lower level in particular due to competitive pressures.
Similarly, also the prices for CDN services continue to decline. They fell by 25 % in 2014 and 20 % in 2015.13 However, it should be noted that this only provides a broad picture, while in practice CDN prices vary between providers and also depending on the size of the customers. Economies of scale largely impact on the actual prices for CDN services.
As shown by BEREC in its 2012 report the costs of delivering traffic on a per unit basis were subject to continuous declines which was due to competitive pressure as well as technological progress. BEREC sees no indications that this general trend has either stopped or even reversed. This seems plausible as prices for certain services (see above) continue to decline. In general, investment in networks is more or less stable as costs of delivering traffic on a per unit basis decreases and traffic volume is increasing.
3.3 Changing players along the value chain and changes in traffic delivery
3.3.1 CDNs
The economic relevance of CDNs continues to grow as CDNs account for an increasing share of total traffic. On a global scale, CDN traffic is expected to grow with a CAGR of 34%
10 Cisco (2016), section „Trend 10: Traffic-Pattern Analysis (Peak Compared to Average and CDN Uptake“. 11 Cisco (2016), section „Trend 9: Mobility (Wi-Fi) Continues to Gain Momentum“,These figures relate to the type
of device used and not whether the connection is fixed or mobile.. 12 DrPeering. 13 Rayburn (2016). http://blog.streamingmedia.com/wp-content/uploads/2016/05/2016CDNSummit-Rayburn-
Pricing.pdf

BoR (17) 184
8
increasing its share of all Internet traffic to 64 % by 2020 (45 % in 2015). This is largely driven by the increasing quantitative relevance of video streaming traffic.
In the recent past many CAPs seem to increasingly rely on a multi-CDN strategy as this may enhance resilience. Self-delivery of CDN services is a viable option, but only for very large CAPs (like Facebook, Amazon, Google, Microsoft, Netflix etc.).14
Besides this, internal servers such as on-net CDNs or cache servers are becoming more prevalent within the market. These platforms located within the network of an ISP are used to locally store copies of certain contents available on the Internet. They aim to bring content closer to users, with the intention of optimizing costs and performance. The need for interconnection capacity is reduced as content that is requested by a large number of customers needs to be sent only once through the interconnection link to feed these servers which subsequently serve users as often as the content is requested.
According to the information collected by ARCEP in its report on the state of the art of Internet in France15 published in May 2017, the internal CDNs/cache provide around 11 % of the traffic for main ISPs in France - with great variability from one ISP to another. Besides, a standard ratio between incoming and outgoing traffic for a cache server or a CDN can vary between 1:8 and 1:25. In other words, each content stored is accessed 8 to 25 times on average, reducing the need to use interconnection capacity for these contents.
3.3.2 Infrastructure deployment of CAPs
In recent years, large CAPs such as Google or Facebook participated in different network infrastructure projects. With projects such as deployment of sea-cables these players not only reduce their dependence from third party transit providers’ services but also gain flexibility when it becomes necessary to further upgrade capacities. In addition, large CAPs tend to set up internal CDNs within ISPs networks.
3.3.3 Regionalisation of traffic
A recent study provides some insights to what extent network operators in a given country are interconnected with other domestic networks in comparison to foreign networks. For example, while in 2011 29 % of US networks interconnection partners were US networks, this figure declined to 23 % in 2016.16 Similar developments can be observed for the UK (declining from 41 % in 2011 to 33 %) and Germany (declining from 32 % to 17 %).
14 More specifically, see Rayburn (2016b). 15 See ARCEP (2017), L’état de l’internet en France, May 2017. 16 Woodcock/Frigino (2016), p.6.

BoR (17) 184
9
But at the same time the number of interconnected networks is increasing another trend is traffic concentration as the following figure shows:
Figure 3-1: Traffic concentration trends (2007, 2009, 2013)17
3.3.4 IXP traffic developments
BEREC’s report from 2012 showed that the traffic volumes exchanged at the biggest European IXPs (DE-CIX, AMS-IX, LINX) were constantly growing. Peak capacities as well as average throughput continue to rise since the time of BEREC’s last report. This supports the assumption that the non-profit IXP model turned out to be an efficient way for traffic exchange in Europe.
3.3.5 Peering developments
A recent study shows that 99.93% of peering agreements are informal “handshake” agreements concluded without a written contract.18 In the previous study this figure was 99.51 %.19 Furthermore, 99.98% of peering agreements are now based on symmetric terms, which is up from 99.73 % in 2011. However, these figures may look very different in terms of traffic volumes. In addition, these figures reflect the situation at a global (rather than European) level and do not distinguish between large and small Internet access service providers. The evidence we discuss in chapters 4 and 6 suggests that paid peering is not uncommon involving some larger European Internet access service providers. At least in some cases paid peering seems to have been a result of disputes on congested peering links.
17 Arthur D. Little (2014), p. 7. 18 Woodcock/Frigino (2016), p. 3. 19 Weller/Woodcock (2013), p. 9.

BoR (17) 184
10
As pointed out already video streaming amounts to a substantial percentage of all Internet traffic. To the extent that interconnection disputes would end with paid peering agreements – as between Netflix and Comcast e.g. – this would obviously, imply that the percentage of paid peering in terms of traffic volumes is at least significantly greater as in terms of number of peering agreements.
Generally, the Internet is becoming more densely interconnected. One indication for this is that across all networks the average number of interconnections per network rose from 77 to now 292.
The study also emphasizes the prevalence of multilateral peering where more than two parties exchange traffic, which is the case at IXPs. According to this study, multilateral peering became the dominant practice in 2011 as it accounts for more AS-adjacencies than bilateral peering.20 However, some large eyeballs ISPs do not follow this trend and peer with only a few other networks, They prefer to have paid peering agreements on a bilateral basis rather than joining multilateral peerings at IXPs.21
Given these properties and benefits it seems plausible to assume that usage of IXPs will rather gain more importance in the next years, particularly considering a catch-up effect in developing countries displaying higher growth rates.22
Between 2012 and 2016 in France, transit has decreased from 61% of inbound traffic volume to 55%. During that period the share of paid peering increased from 22% to 36% at the expense of free peering with the “captive” networks operated by the largest CAPs.23 These interconnections are in most cases paid ones. This explains the increase of the paid peering during the same period.
The evidence provided in the previous section of Ch. 3 suggests that the relative importance of transit seems to be declining24, a tendency which BEREC already mentioned in its previous report25.
The increasing volumes of video traffic in the internet, delivered by CDNs, seems to be a major factor contributing to this development. Using CDNs enhances quality and reduces latency as traffic needs to be transported over a shorter distance. Caching content locally or closer to eyeballs implies that less international transit is needed.
20 However, Woodcock/Frigino (2016) point out as a caveat that there are uncertainties whether this relates to corresponding volumes of traffic (p. 11).
21 Woodcock/Frigino [(2016), p.12/13] interpret this as a rent seeking strategy where dominant carriers try to extract rents from third parties using paid peering agreements rather than joining multilateral peerings at IXPs.
22 See also Internet Society (2016a). 23 ARCEP (2017) 24 See e.g. figure 6.1 for France. 25 BEREC (2012a), in particular Ch. 4.4.
BoR (17) 184
11
Nonetheless, transit remains a very significant form of interconnection and hence the availability and pricing of transit might be expected to constrain negotiations over the settlement basis of peering agreements. However, this may not always be the case, for example where demand for capacity is very large (see Chapter 4.2).26
Given this, it seems important that NRAs should monitor market developments. If they have relevant powers NRAs may wish to collect data on interconnection markets, for example covering the role of transit and peering and the extent of paid peering. Ofcom and ARCEP for example already collect and publish relevant data.
4 A generic outline of typical IP interconnection disputes
In its 2012 report, BEREC concluded that the market had developed well so far without any regulatory intervention. Nevertheless, this did not preclude that disruptions in IP interconnection due to disputes between ISPs may occur. BEREC pointed out that such instances had been few and had to date been solved in a relatively short time without regulatory intervention.27
4.1 An illustrative example
The dispute on IP-interconnection between Netflix and eyeball ISPs such as Comcast or Verizon that popped up during 2013/2014 may be used as a generic example for such instances that have occurred since BEREC’s previous report was published.
In the past, Netflix has used different options to get its content delivered to the consumer: third party CDNs, own CDN, transit services and direct interconnection with eyeball ISPs. Originally, Netflix had agreements with different CDN providers. Netflix has pointed out that Comcast had tried to impose terminating fees on various CDNs.28 Then, during 2012, Netflix increasingly had relied on different transit providers who had settlement free peerings with Comcast. Between mid 2013 and early 2014 Comcast users had experienced high latency during peak hours when streaming video.29
The parties involved debated heavily about which side had caused the decline in video streaming quality: 30
26 Transit may not be a substitute for peering if the demand for capacity is very large (see ACM, 2015). 27 According to Arthur D. Little (2014, p. 38), disputes concern less than 1 % of all IP interconnection
agreements, and are solved by commercial agreements in more than 50 % of cases. 28 Netflix (2014). 29 Verizon customers made similar experience in 2014 (see e.g.
http://www.theverge.com/2014/7/10/5888239/verizon-netflix-congestion). 30 It should be emphasized that BEREC does not judge upon this case. It is only intended here to illustrate the
respective arguments and perspectives of the parties involved.
BoR (17) 184
12
The CAP’s perspective:
o Netflix pointed out that it has already paid their transit providers. Thus it was in the responsibility of the eyeball ISP and the transit providers to ensure that interconnection links were properly dimensioned. Ultimately, Netflix reasoned that Comcast let the interconnection links congest in order to extract termination payments.31
o It asserted that Comcast did not upgrade interconnection capacities thereby causing congestion in order to extract payments from the CAPs.
The eyeball ISP’s perspective:
o Eyeball ISPs on the other hand referred to significanct increases in traffic volumes due to streaming services thus exceeding traffic ratios of typical settlement-free peering arrangements.32 It was even argued that Netflix was causing congestion by sending traffic via certain transit paths that could not handle these traffic volumes in order to force the eyeball ISPs to increase capacities.33
In February 2014 Netflix finally entered into a paid peering arrangement for direct interconnection of its own CDN (called Open Connect) with Comcast34 and soon after this the quality of Netflix streaming improved for customers of that eyeball ISP. Nevertheless, it would be too simple to infer from this improvement of quality which party had caused the problem previously. For example, Rayburn argues that “the return to normal in March 2014 was caused by a decision that Netflix and Comcast made, but that was Netflix’s decision to pay Comcast for a direct connection, rather than continuing to use congested paths through the transit providers.”35
While it may be tempting to infer from a certain result (e.g. low streaming quality) which parties have caused the problem, a closer look may be necessary.
31 Netflix (2014).https://ecfsapi.fcc.gov/file/7521825167.pdf 32 http://www.theverge.com/2014/7/14/5897743/google-netflix-facebook-fcc-interconnection-fees-net-neutrality 33 Feamster (2015a); see also http://www.theverge.com/2014/7/10/5888239/verizon-netflix-congestion. 34 https://gigaom.com/2014/02/21/comcast-netflix-peering/ 35 Feamster (2015a); see also https://www.engadget.com/2014/03/10/netflix-reportedly-reaches-another-
comcast-style-agreement-with/.

BoR (17) 184
13
Figure 4-1: Netflix Video quality36
4.2 Issues at stake
From a regulatory standpoint, disputes like the above give raise to a number of relevant questions, including:
- can eyeball ISPs exploit a termination monopoly to charge content providers for access to its subscribers?
- is a vertically integrated eyeball ISP able to foreclose the market by favouring its own content over other CAPs content and are there incentives to do so?
- can an ISP’s refusal to upgrade interconnection capacity amount interference with end-users’ right to access CAPs of their choice?
Such concerns have been considered by some NRAs in the context of their national markets – for example, in a 2015 report ACM considered the first two concerns as relevant ‘theories of harm’.37 While the answer to the questions above crucially depends on the specifics of each situation, previous work has identified the following factors as relevant:
- Are transit and peering substitutes? Assuming that an eyeball ISP refuses to peer with a CDN38 or network, are there other routes for content to reach the eyeball ISP’s customers using transit? In its 2012 report BEREC concluded that “the peering market is generally taken to function more or less competitively as long as ISPs have a choice of transit providers ”. However, transit may not be a substitute for peering if the demand for capacity is very large.39 More specifically, in case of streaming
36 https://qz.com/256586/the-inside-story-of-how-netflix-came-to-pay-comcast-for-internet-traffic/ 37 See ACM (2015) as well as section 6.1.2. below. 38 Including “captive” CDNs such as Netflix Open Connect 39 ACM (2015).

BoR (17) 184
14
transit’s ability to substitute for peering may also be less clear because a high quality is required.
- Do CAPs resp. CDNs and other networks have significant countervailing bargaining power? For example, a CAP or a CDN might have strong counterveiling power if it delivers ‘must have’ content which is only available from that CAP or CDN.40 Ultimately, this boils down to whether CAPs depend more on eyeball ISPs or vice versa or in other words, who derives higher benefits from a peering relation.
- Are consumers single- or multi-homed? Can traffic reach the consumers via different access networks, with comparable levels of quality-of-experience?
- Are there switching barriers for customers? Would customers react to a price increase or quality decrease and switch to another internet access service provider or are there any switching barriers (e.g. contract duration)?
Broadly, to date NRAs have found that factors like the above do mitigate potential concerns. It should be noted, however, that NRAs’ conclusions apply mainly to their respective national markets and caution should be exercised when considering wider implications.
5 Measuring congestion at IP-interconnection links
The previous sections showed that congestion issues may occur in practice. However, it seems necessary to adress some related questions:
- is congestion rather short-lived or is it becoming more prevalent; - where across the whole value chain (from the CAP to the consumer) does congestion
occur; - how can congestion be identified and measured; - is it possible to clearly identify who causes congestion?
ARCEP takes the following approach to have an overview of interconnection links. It consists in collecting periodically and on ad-hoc basis information about links capacities as well as inbound and outbound traffic.41 Comparing the amount of traffic going through a link with this link’s capacity may give some hints about potential congestion and helps to locate the problem as soon as it occurs. ARCEP has noticed a regular increase in the capacity of
40 More generally, a CDN’s countervailing power may be linked to its ability to help ISPs deliver a better experience to their subscribers, and/or to do so without paying transit fees – and it may increase if a CAP’s content is not available through other CDNs.
41 ARCEP collects other information (finacial terms, location,etc.). This will be explained in more details in 6.1.1.
BoR (17) 184
15
interconnection links. This increase in capacity explains why congestion is not a prevalent problem even though traffic volume is increasing tremendously.
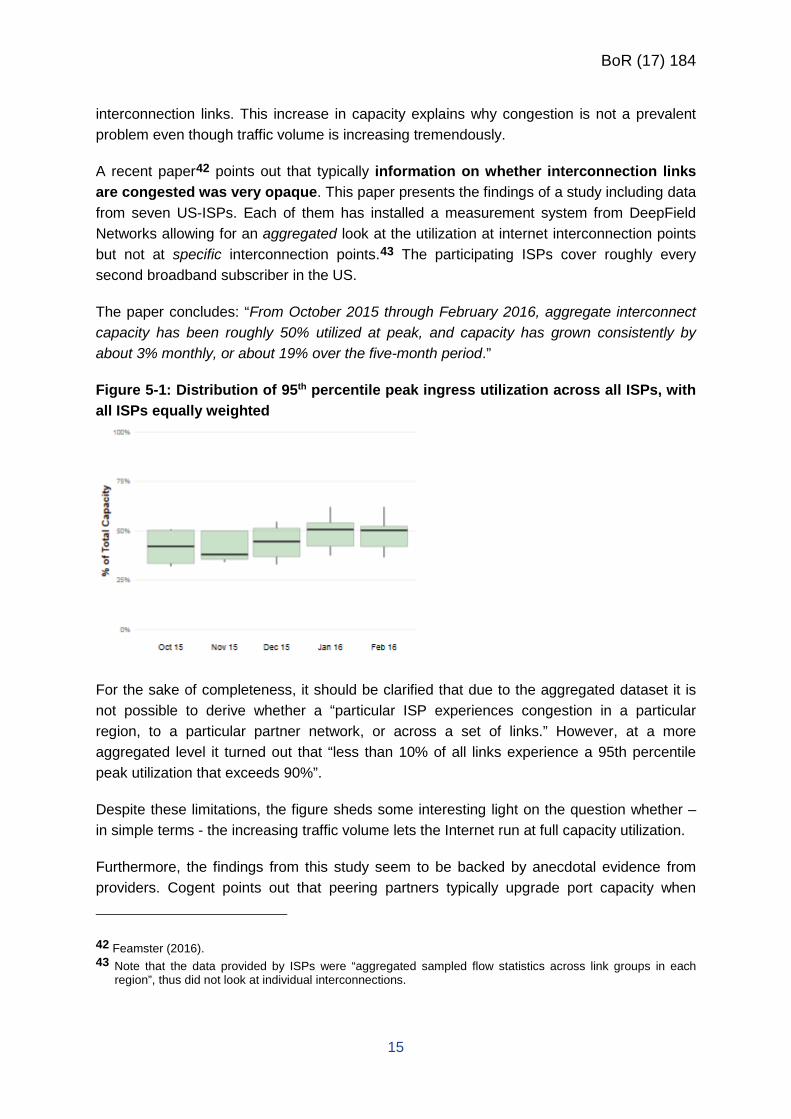
A recent paper42 points out that typically information on whether interconnection links are congested was very opaque. This paper presents the findings of a study including data from seven US-ISPs. Each of them has installed a measurement system from DeepField Networks allowing for an aggregated look at the utilization at internet interconnection points but not at specific interconnection points.43 The participating ISPs cover roughly every second broadband subscriber in the US.
The paper concludes: “From October 2015 through February 2016, aggregate interconnect capacity has been roughly 50% utilized at peak, and capacity has grown consistently by about 3% monthly, or about 19% over the five-month period.”
Figure 5-1: Distribution of 95th percentile peak ingress utilization across all ISPs, with all ISPs equally weighted
For the sake of completeness, it should be clarified that due to the aggregated dataset it is not possible to derive whether a “particular ISP experiences congestion in a particular region, to a particular partner network, or across a set of links.” However, at a more aggregated level it turned out that “less than 10% of all links experience a 95th percentile peak utilization that exceeds 90%”.
Despite these limitations, the figure sheds some interesting light on the question whether – in simple terms - the increasing traffic volume lets the Internet run at full capacity utilization.
Furthermore, the findings from this study seem to be backed by anecdotal evidence from providers. Cogent points out that peering partners typically upgrade port capacity when
42 Feamster (2016). 43 Note that the data provided by ISPs were “aggregated sampled flow statistics across link groups in each
region”, thus did not look at individual interconnections.

BoR (17) 184
16
utilization reaches about 50 %.44 And Level3 explained in a blog-post that the average utilization across all its interconnected ports is 36 % percent.45
Similarly, another study from the MIT also assesses whether congestion of interconnection transit and peering links is a widespread phenomenon.46 It argues that long-lived/recurring congestion would be a signal of mismatch between capacity and demand. Where such a mismatch occurs the underlying cause is rather considered economic as disputes, such as between Netflix and eyeball ISPs, are mainly about which party should provide (and pay for) an increase of interconnection capacities.47 The study has measured interconnection links of major broadband providers. It turned out that even congestion of peering links carrying Netflix traffic that were congested for 18 hours a day “vanishes essentially overnight” when the involved parties concluded a new business agreement. It is also emphasized that congestion “can come and go essentially overnight as a result of network reconfiguration and decisions by content providers as how to route content”.48,49
The study concludes that congestion at interconnection links among US broadband providers does not appear to be a widespread issue. Instead, congestion occurs rather occasionally.50 Congestion rather results from business disputes. Once these are settled, congestion vanishes. These findings generally support BEREC’s 2012 reasoning that in those few instances where disputes occurred these were typically settled by the market mechanism.51 It remains to be seen, whether these general findings will also apply in the future, given that peak hour Internet traffic – driven by video streaming – is the major source of traffic growing at a faster pace than average hour traffic.
A study from MIT and CAIDA researchers aims at localizing and quantifying inter-domain congestion in the Internet.52 For this purpose time-sequence latency probes are used. This approach applies frequently repeated round trip time measurements from a vantage point to the near and far routers of an inter-domain link (figure 5.2 below). “The measured round trip
44 http://arstechnica.com/information-technology/2014/02/netflix-packets-being-dropped-every-day-because-verizon-wants-more-money/
45 Level3 (2014). 46 MIT (2014). 47 Aside from this, eyeballs have tried to promote a change of the interconnection charging mechanism (from Bill
and Keep towards Sending Party Network Pays), often referring to large traffic volumes “caused” by CAPs. See BEREC’s (2012b) on these proposals.
48 Dyn Research provides an “Outages Bulletin” (http://b2b.renesys.com/eventsbulletin/ ) which displays when and how often such issues occur.
49 Nevertheless, it might also be the case that the CAP is “forced” to reroute the traffic due to the ISP’s practice. 50 “We typically see two or three links congested for a given ISP, perhaps for one or two hours a day which is not
surprising in even a well-engineered network, since traffic growth continues in general, and new capacity must be added from time to time as paths become overloaded. We see some congestion on costly links, such as trans-oceanic links.”
51 The relative market power between the parties involved as well as the opportunity costs of not finding an agreement may be factors impacting on the outcome of such disputes.
52 Clark et al (2014).

BoR (17) 184
17
times are a function of the queue lengths of the routers on the forward and reverse paths: as queue lengths increase, so does round trip time.” When round trip times increase to the far router but not to the near router, it is inferred that a queue between these two routers induced the delay. The study concludes that no evidence of widespread persistent congestion was found.
Figure 5-2: Round-trip time measurement to identify congestion53
Another paper specifically addresses the question where Internet congestion is occurring.54 Figure 5-2 displays that congestion may occur at two different locations:
- at interconnection points: Disputes in practices that occurred since BEREC’s 2012 report reflect this possible location of congestion “at the entry” to the eyeball’s network (see above).
- in transit providers’ networks: the author55 refers to the dispute between Netflix and Comcast. He argues that Netflix’s shift from using Akamai as a CDN to Level 3 and Limelight coincided with extreme congestion starting in the middle of 2011. While this shift may cut Netflix’s costs of delivering its content significantly, its new wholesale providers delivering content to the user may have not had sufficient capacities to cope with these traffic volumes.
Thus, the main challenge may not be to find evidence of congestion as such but to associate congestion with a particular link.56
53 Clark et al (2014). 54 Feamster (2015b). 55 Feamster (2015b). 56 See also Feamster (2015b) who elaborates on the limitations of using the approach applied by MIT/CAIDA.
He concludes that the study suggests that congestion occurs at interconnection points but is inconclusive as to whether congestion also occurs within a transit provider’s network.

BoR (17) 184
18
Figure 5-3: Possible locations of congestion57
Feamster points out that congestion seems to have occurred in both locations, at interconnections points and in transit providers’ networks.
The challenges of exactly localizing congestion let the FCC conclude: “We decline at this time to require disclosure of the source, location, timing, or duration of network congestion, noting that congestion may originate beyond the broadband provider’s network and the limitations of a broadband provider’s knowledge of some of these performance characteristics…While we have more than a decade’s worth of experience with last-mile practices, we lack a similar depth of background in the Internet traffic exchange context.”58
It can be concluded that while it is possible to identify whether there is congestion, it poses a much greater challenge to unambiguously identify the location of that congestion, particularly when considering that the details of interconnection agreements are typically subject to non-disclosure agreements. But even if it is clearly identified that congestion occurs at the interconnection links only, this does not provide an answer to the question which of the involved parties has caused this congestion either by not upgrading port capacities according to the traffic requirements or for example by routing traffic via certain routes to let interconnection links congest. As pointed out above disputes in practice typically involved mutual recriminations of the parties involved.
57 Feamster (2015b). 58 FCC (2015), para 168.

BoR (17) 184
19
6 Activities of authorities
6.1 National Regulatory Authorities in Europe
6.1.1 France
Since 2012, ARCEP has collected, every 6 months, information about interconnection conditions of autonomous systems in France: peers, providers and clients, locations and capacities, inbound and outbound volumes and financial information. Thanks to these data collection campaigns, ARCEP has become closer to technical experts and has acquired high knowledge about interconnection issues. This knowledge is shared regularly with the whole community during national and international conferences.
In France, the overall interconnection traffic exchanged by the four main ISPs increased by around 27%, between the end of 2015 and the end of 2016, to reach a total inbound traffic of 8.4 Tbps. Traffic is mainly carried through transit, but ISPs in France are increasingly using peering. A strong growth in traffic generated by major content and application providers (sometimes up to 150%) is noted in the French interconnection market. It is explained by a more intensive use of direct interconnection between CAPs and ISPs.
Furthermore, in May 2017, ARCEP presented a report on the state of the market in France.59 This report includes aggregated data about the interconnection market in France between 2012 and 2016. This information consists of the evolution of interconnection capacity, inbound traffic, peering vs transit ratio, paid peering and free peering ratio, etc.
Figure 6-1: Peering vs. Transit in France*
39%
61%
Peering vs. Transit H1-2012
Peering Transit
45%
55%
Peering vs. Transit H2-2016
Peering Transit
*Weighted by inbound traffic volume
59 Arcep (2017)

BoR (17) 184
20
Figure 6-2: Free Peering vs. Paid Peering in France*
78%
22%
Free Peering vs. Paid Peering – H1-2012
Peering gratuit Peering Payant
64%
36%
Free Peering vs. Paid Peering – H2-2016
Free Peering Paid Peering
*Weighted by inbound traffic volume
Besides, two IP interconnection cases were reported. First, in 2011 a Cogent vs Orange dispute was taken to the competition authority by Cogent over the opacity of Orange’s interconnection offers and the financial terms asked. Cogent considered that Orange was abusing its dominant position by asking to be paid for extra bandwidth capacity. Cogent and Open Transit International (Orange transit operator) had a peering agreement where the exchange of traffic between the operators was free, based on an asymmetry ratio threshold set at 2.5 to 1. ARCEP provided an expert opinion to the competition authority that held the view that requiring compensation for the provision of extra bandwidth capacity in peering agreements in case of a significant traffic imbalance was not to be considered as anti-competitive behavior. ARCEP stated, from a market analysis point of view, that transit constitutes also an alternative to peering to reach ISPs, as transit and peering are relatively substitutable. Thus, the authority validated Orange’s behavior after the latter committed to some transparency measures. This case was an incentive for ARCEP to start gathering interconnection data both on a periodical and an ad hoc basis. Second, in 2012 ARCEP investigated Free’s interconnection practices after numerous consumers’ complaints when accessing Internet services such as YouTube. In this case, Free’s transit ports proved congested but it was affecting similarly all services. It resulted mainly from the sizing of Free’s interconnection links with IP transit operators and IP peering partners. Both when the investigation was publicly opened then closed, Free reacted swiftly by increasing its transit capacity limits.
ARCEP intends to continue monitoring the interconnection market but will not regulate, only reacting in case of necessity. Further areas of expansion are QoS and information to consumers; ARCEP is also investigating new market developments such as internal CDNs. Starting from the second semester of 2017, ARCEP is likely to consider extending the interconnection data gathering campaign to include information about internal CDNs.

BoR (17) 184
21
6.1.2 Netherlands
The IP interconnection study carried out by ACM in 2015 was triggered by the Netflix/Comcast dispute in the US and aimed at answering the following questions: is there any restrictive IP interconnection behaviour in the Netherlands? Does ACM have sufficient power/tools to regulate if necessary? The report methodology included the analysis of existing cases, theories of harm, interviews with stakeholders, evaluate market circumstances and input from interviews to assess the likelihood of competition problems. ACM concluded that the likelihood of competition problems resulting in consumer harm is currently60 very low in the Netherlands. Problems that do occur, can be dealt with by ACM using Section 24 (1) of the DCA regarding the abuse of dominance. In addition and depending on the classification of the actor in terms of the Dutch Telecommunications Act, this act provides ACM with relevant norms to address problems regarding willingness to negotiate in the field of IP interconnection. Based on these conclusions, ACM considers its current set of instruments sufficient to guarantee a competitive IP interconnection market in the Netherlands. However, the regulatory analysis showed that it’s unclear whether or not various actors in the field of IP interconnection are subject to the Dutch Telecommunications Act. As the classification of an actor as a provider of Public Electronic Communications Network and Public Electronic Communications Service can imply a variety of norms to which the actor can be subjected, ACM recommends legislators to provide clarity on this matter and resolve ambiguities in this regard.
6.1.3 Spain
In Spain, in the context of the acquisition of DTS (main pay TV player in Spain) by Telefónica, the final remedies offered by the notifying party included terms applying to the Telefónica's Internet interconnection. CNMC considered this sufficient to ensure that the problems posed by the merger would be adequately addressed enabling it to give the authorisation.
In relation to the access to its network, Telefónica could have the incentives (it can block or restrict access to its network and to its customers) to substantially reduce competition from third-party Internet-based pay television operators. In that regard, the remedies approved allow those Internet-based pay television providers to access Telefónica's broadband customers on terms which allow them to compete effectively.
In order to provide access to its network in Spain with sufficient capacity and quality assurances for third-party operators and content providers, Telefónica will ensure that its interconnection with, at least, three relevant operators providing transit services will not suffer congestion exceeding 80%. Telefónica also undertakes to negotiate interconnection
60 October 2015.

BoR (17) 184
22
agreements, for the delivery of audiovisual content to its fixed or mobile broadband end users, on equitable, reasonable, transparent, objective and non-discriminatory terms.
Finally, in this context, Telefónica also undertakes not to employ network and traffic management techniques in Spain which could, in a discriminatory manner, degrade the flow of third-party video or similar data over its Internet network.
On the other hand content providers such as Netflix have their own monitoring tools and figures61 about networks behaviour and up to now there have not been any official complaints on Telefonica’s commitments. Anyway, a further analysis would be required if a formal complaint is received, since this information shows the point of view of one of the parties involved.
6.1.4 Switzerland
Init7, a rather small transit provider in Switzerland, submitted in 2013 a request to regulate (ex post sector-specific regulation) the peering conditions of the incumbent in Switzerland, Swisscom. The trigger for this request was the introduction of a maximum traffic exchange ratio of 2:1 (inbound:outbound) as a peering condition by Swisscom. Init7, which greatly exceeded this maximum traffic exchange ratio, refused to sign a paid-peering agreement. Swisscom therefore throttled Init7’s peering connection. As a result, Init7 lost one of its main transit costumers, a TV streaming provider, to Swisscom. The Swiss NRA (ComCom) provisionally obliged Swisscom to re-establish the peering connection with Init7 according to the peering conditions applicable before 2012 (settlement-free peering). In accordance with procedural rules, ComCom initiated a market investigation into IP interconnection markets in cooperation with the Swiss competition authority (ComCo). During this market investigation, the Swiss competition authority found indications of an unlawful IP interconnection agreement affecting competition between Swisscom and its main transit provider Deutsche Telekom AG and opened a new, additional competition law case targeting the relation between Deutsche Telekom and Swisscom. The assessment of the contract in question indicated that the agreement between Swisscom and Deutsche Telekom might have restricted competition through collusion on prices, volumes and geographic markets. However, since the involved parties agreed to adjust the contract and avoided the problematic clauses, in addition to the fact that the involved revenues are modest, the competition authority closed in 2017 the competition law case against Deutsche Telekom and Swisscom prematurely and without imposing sanctions.
The Swiss NRA ComCom suspended its ongoing sector-specific regulatory procedure Init7 against Swisscom during the investigation by the competition authority. The NRA will now assess, on the basis of the survey and analysis conducted in collaboration with the
61 https://ispspeedindex.netflix.com/

BoR (17) 184
23
competition authority62, whether Swisscom has a dominant position in the market, which could justify a sector specific regulation. The definitive decision of the NRA is still outstanding, thus the preventative provision relating to settlement-free peering for Init7 is still in place.
The (so far published) main findings of the Swiss competition authority in the context of its investigation into IP interconnection markets and the commercial relationship between Swisscom and Deutsche Telekom AG are as follows:63
The authority identified a “technical monopoly” in relation to direct IP access to Swisscom customers. However, due to the architecture of the internet, it is in general possible to access Swisscom’s customers indirectly via other providers with a direct Swisscom interconnection. The test of a small but significant and non-transitory increase in price (SSNIP) showed that Swisscom could not increase prices for direct interconnection in a profitable way, since more traffic would be routed indirectly and without payment to Swisscom. The authority therefore concluded that there exists (a limited number of) substitutes to direct interconnection with Swisscom, particularly the transit and paid-peering services of Swisscom’s transit providers. Hence, Swisscom’s transit providers belong to the same relevant market for IP access to Swisscom’s customers. Furthermore, large peering partners of Swisscom could possibly belong to this market, though the market boundaries are not very clear. In terms of the geographic scope of the relevant market, the authority defined these as (at least) all interexchange points in Europe where Swisscom and Deutsche Telekom offer interconnection services.
According to the Swiss competition authority, the contract between the Tier 1 operator Deutsche Telekom AG and the Tier 2 operator Swisscom entailed elements of a transit agreement as well as of a peering agreement (“a hybrid agreement”). The contract obliged Swisscom as well as promoted incentives for Swisscom to route as much data traffic as possible via the transit service of Deutsche Telekom. Since Swisscom in fact did not have to pay for the transit services of Deutsche Telekom (due to revenue and cost sharing), Swisscom’s incentives to agree on settlement-free peering with other AS were significantly reduced, affecting the market power of Swisscom in the whole relevant market. Since transit providers of Swisscom were deemed as competitors of Swisscom in the relevant market, the competition authority qualified the contract as a possibly unlawful horizontal agreement, which potentially restricts competition in the market for IP access to Swisscom’s customers. The authority found indications of an unlawful agreement on minimum prices for Deutsche Telekom’s transit services (into the Swisscom network), of an unlawful agreement on volumes as well as on geographic markets and customers.
62 As a result of the market survey, the Competition Authority provided a broader analysis of the IP Interconnection markets for the attention of the NRA (confidential).
63 Commission de la concurrence (2017), p. 73.
BoR (17) 184
24
However, the competition authority closed the preliminary investigation and did not open a formal investigation, which would be a precondition for imposing sanctions. To open a formal investigation had been seen as disproportionate, after the adaption of the contract in question and the deletion of the problematic clauses, which resolved the competition authority’s concerns. Opening an investigation in order to be (potentially) able to impose sanctions was not deemed as justified due to the high complexity and the expected associated administrative costs, in addition to the relatively modest revenues involved. Furthermore, the outcome of the investigation would have been uncertain, since the authority identified only indications of unlawful behaviour, though no concrete evidence of this.
6.2 European Commission
The European Commission conducted an investigation on competition law during 2011 to 2014. The investigation looked at whether telecommunication operators such as Deutsche Telecom, Telefonica and Orange, were behaving in an anticompetitive way, thus violating the prohibition to abuse a dominant market position.64
The European Commission announced in October 2014 to close the investigations but to continue monitoring the sector.65 Since the above operators had very limited content themselves, it was concluded there was no incentive to favour their own content because of vertical integration. Furthermore, it was at stake who can ask for money. In cases without a commercial agreement, the effect was that traffic from certain routes was congested at the point of entry of the domestic network. If Telcos do not want to pay to mitigate that, then that is a fact. The European Commission found no evidence of behaviour aimed at foreclosing transit services from the market.
It was considered better to let the commercial negotiations go on without interference of a competition authority. However, consumers may not know where the issue is when their experience is unsatisfactory. Therefore transparency was considered important to identify the problem.
6.3 FCC
The Open Internet Order of February 2015 concluded that it would be premature to apply prescriptive rules to interconnection agreements. The FCC monitors IP interconnection and considers claims involving IP interconnection agreements on a case-by-case basis under section 201 ff. of the Communications Act, which prohibit unjust and unreasonable conduct by common carriers, including broadband service providers. A number of cases for disputes were identified. The claim on one side was that artificial congestion took place because
64 Article 102 of the Treaty on the Functioning of the European Union – TFEU. 65 http://europa.eu/rapid/press-release_IP-14-1089_en.htm

BoR (17) 184
25
capacity upgrade was not taking place, to trigger paid peering. The other party rather argued that it was edge providers sending extremely large traffic volumes imposing a cost, by constantly requiring an upgrade. Therefore, paid peering was required to allocate such cost. In 2015 however no application of bright line rules to IP-interconnection took place, which is traditionally governed by commercial regulation. With regard to two merger cases requirements were imposed to file all interconnection agreements the FCC. In addition, in one case a request was imposed to provide interconnection performance metrics to the FCC (latency packet loss and utilisation). In the other case mandatory interconnection requirements were imposed for 7 years.
7 Conclusions
The evidence identified by BEREC shows that, in general, developments in the interconnection market since 2012 can be described as evolution rather than revolution. This holds for ongoing price declines for transit and CDN services which can be interpreted as an indicator for the competitiveness of the market. It also holds for increasing traffic volumes, in particular resulting from video streaming services. The market increasingly relies on usage of CDN cache servers, IXPs or direct interconnection while at the same time the (relative) importance of transit declines. Generally, the ability of markets to adapt to changing market conditions, business models and technological developments seems to be unbroken.
Nevertheless, there have also been potentially significant developments since BEREC’s 2012 report. In particular the evidence suggests that paid peering has grown in importance; that commercial negotiations around this have sometimes led to disputes.
Broadly, NRAs involved in such cases (see Ch. 6.1) have typically concluded that interconnection (i.e. transit, peering, CDN) markets are functioning adequately and that intervention is therefore not required. Specifically, NRAs have highlighted the roles played by transit as a substitute for peering66 (a point also made in BEREC’s 2012 report, as noted earlier); of retail competition and switching; and of CAPs’, CDNs’ and transit providers’ countervailing power in negotiations with internet access service provides. However, these factors are predicated on conditions which may not always hold (e.g. availability of alternative transit routes, ease of consumer switching, etc); moreover, NRAs’ assessments have been carried out in the context of national markets and/or specific cases and caution should be exercised when considering wider implications.
In case a complaint is addressed to an NRA the case has to be carefully assessed based on the specifics of the individual case.
66 See also ACM (2015), Ch. 4.2.2.4. However, ACM also points out that transit may not be a substitute for peering if the demand for capacity is very large.

BoR (17) 184
26
In this report BEREC has provided an overview of developments in the IP-interconnection markets of the past 5 years including a generic assessment of recent disputes. More specifically, BEREC has identified the following points relating to market developments (a.-d.), IP interconnection disputes (e.-h.) as well as the role of NRAs (i.-l.):
a. Generally, it is expected that aggregate Internet traffic volumes continue to grow significantly. This seems to be largely driven by the increasing popularity of video streaming services. In order to avoid congestions, Interconnection links capacity should continue to increase also to handle this volume increase.
b. This implies a more accentuated peak to off-peak traffic ratio as video services are typically consumed at peak times.
c. The development of traffic volumes is further reinforced as users increasingly tend to have multiple devices for accessing the Internet. Usage of mobile and Wi-Fi devices gains importance.
d. Prices for transit or CDN services continue to decline at a pace corresponding to this traffic increase. This is due to competitive pressures as well as technological progress. Given these price declines BEREC considers that the Internet ecosystem’s ability to cope with increasing traffic volumes is still given.
e. Typically, traffic asymmetries are a major factor in those instances where disputes emerged in practice. Often, these disputes are characterized by mutual recriminations between the parties involved.
f. Even where it is possible to identify that congestion occurs, it remains a challenge to clearly identify its exact location across the value chain and even more who is responsible for the problem.
g. This holds in particular because IP interconnection issues seem to involve complex relationships as well as economic/strategic considerations of the providers. Often providers have different options to overcome a problem (e.g. using transit, peering, CDNs, caching services in access networks etc.)
h. While transit is declining as a proportion of traffic it remains a very significant form of interconnection. Hence the availability and pricing of transit might be expected to constrain negotiations over the settlement basis of peering agreements. However, transit’s ability to substitute for peering may be less clear in case of video streaming, where demand for capacity is very large and a high quality is required.
i. So far, such disputes were typically solved in the market without regulatory intervention. However, NRAs should carefully monitor whether this continues to be the case. In case a complaint is addressed to the NRA the case has to be carefully assessed based on the specifics of the individual case.

BoR (17) 184
27
j. Furthermore NRAs should consider monitoring developments. If they have the relevant powers NRAs may wish to collect data on interconnection markets, for example covering the role of transit and peering and the extent of paid peering thereby enhancing transparency.
k. From a NRAs perspective competition and transparency for consumers remain key factors ensuring that market forces work efficiently thereby contributing that either disputes do no emerge or are solved in the market.
l. Against the background as well as the empirical findings displayed in this report NRAs should continue to apply a careful approach when considering whether regulatory intervention is actually warranted.

BoR (17) 184
28
Literature
ACM (2015), IP interconnection in the Netherlands: a regulatory assessment, The Netherlands Authority for Consumers and Markets, October 2015, https://www.acm.nl/en/publications/publication/14821/Study-into-IP-interconnection-in-the-Netherlands/
ARCEP (2015), ARCEP: opinion on the structure of the bandwidth use of Internet access networks in
France, July 7, 2015, http://www.arcep.fr/uploads/tx_gsavis/15-0832.pdf (http://www.arcep.fr/uploads/tx_gsavis/15-
0832-ENG.pdf (English version)
ARCEP (2017), L’état d’internet en France 2017, May 2017, https://www.arcep.fr/uploads/tx_gspublication/rapport-etat-internet-france-2017-mai2017.pdf
Arthur D. Little (2014), The Future of the Internet. Innovation and Investment in IP Interconnection, May 2014, http://www.adlittle.de/uploads/tx_extthoughtleadership/ADL_LibertyGlobal_2014_FutureOfTheInternet_01.pdf
BEREC (2012a), An assessment of IP interconnection in the context of Net Neutrality, BoR (12) 130. December 6, 2012, http://berec.europa.eu/eng/document_register/subject_matter/berec/reports/1130-an-assessment-of-ip-interconnection-in-the-context-of-net-neutrality
BEREC (2012b), BEREC’s comments on the ETNO proposal for ITU/WCIT or similar initiatives along these lines, BoR (12) 120 rev.1,
http://berec.europa.eu/eng/document_register/subject_matter/berec/others/1076-berecs-comments-on-the-etno-proposal-for-ituwcit-or-similar-initiatives-along-these-lines
BEREC (2016a), BEREC Guidelines on the Implementation by National Regulators of European Net Neutrality Rules, BoR (16) 127, August 30, 2016, http://berec.europa.eu/eng/document_register/subject_matter/berec/regulatory_best_practices/guidelines/6160-berec-guidelines-on-the-implementation-by-national-regulators-of-european-net-neutrality-rules
BEREC (2016b), BEREC expert workshop on IP-Interconnection in co-operation with the OECD, Brussels, November 21, 2016, http://berec.europa.eu/eng/events/berec_events_2016/139-berec-expert-workshop-on-ip-interconnection-in-co-operation-with-the-oecd
Cisco (2016), The Zettabyte Era- Trends and Analysis, June 2, 2016, http://www.cisco.com/c/en/us/solutions/collateral/service-provider/visual-networking-index-vni/vni-hyperconnectivity-wp.html
Cisco, VNI Forecast Highlights Tool, http://www.cisco.com/c/m/en_us/solutions/service-provider/vni-forecast-highlights.html
Clark, David; Steven Bauer, William Lehr, kc claffy, Amogh Dhamdhere, Bradley Huffacker, Matthew Luckie (2014), Measurement and Analysis of Internet Interconnection and Congestion, September 9, 2014, https://groups.csail.mit.edu/ana/Measurement-and-Analysis-of-Internet-Interconnection-and-Congestion-September2014.pdf
Commission de la concurrence (2017), Droit et politique de la concurrence – DPC . 2017/1, https://www.weko.admin.ch/dam/weko/de/dokumente/2017/RPW%202017-1.pdf.download.pdf/RPW%202017-1.pdf

BoR (17) 184
29
DrPeering, An International Peering Model (Part 2 of 2),
http://drpeering.net/AskDrPeering/blog/articles/Ask_DrPeering/Entries/2013/4/29_An_International_Peering_Model_%28Part_2_of_2%29.html [retrieved: April 21, 2017]
Dyn Research, Outages Bulletin, http://b2b.renesys.com/eventsbulletin/
FCC (2015), Report and Order on Remand, Declatory Ruling, and Order, February 26, 2015, http://transition.fcc.gov/Daily_Releases/Daily_Business/2015/db0312/FCC-15-24A1.pdf
Feamster, Nick (2015a), Why Your Netflix Traffic is Slow, and Why the Open Internet Order Won't (Necessarily) Make It Faster, March 25, 2015, https://freedom-to-tinker.com/2015/03/25/why-your-netflix-traffic-is-slow-and-why-the-open-internet-order-wont-necessarily-make-it-faster/
Feamster, Nick (2015b), Where is Internet Congestion Occurring?, April 2, 2015, https://freedom-to-tinker.com/2015/04/02/where-is-internet-congestion-occurring/
Feamster, Nick (2016), Revealing Utilization at Internet Interconnection Points, 5 Sept. 2016, https://arxiv.org/pdf/1603.03656.pdf
Internet Society (2012), Assessment of the impact of Internet Exchange Points (IXPs) – empirical study of Kenya and Nigeria, 2 Apr 2012, http://www.internetsociety.org/ixpimpact
Internet Society (2016a), IXPs level up in emerging Asia-Pacific, February 15, 2016, http://www.internetsociety.org/blog/asia-pacific-bureau/2016/02/ixps-level-emerging-asia-pacific
Internet Society (2016b), Policy Brief Slides: Internet Exchange Points (IXPs), November 4, 2016 http://www.internetsociety.org/policybriefs/slides/ixps
ITU (2016), Recommendation D.52 (10/16) : Establishing and connecting regional Internet exchange points to reduce costs of international Internet connectivity, October 25, 2016, http://www.itu.int/rec/T-REC-D.52-201610-I
Kovacs, Anna-Maria (2012), Internet Peering and Transit, April 4, 2012, http://www.broadbandforamerica.com/sites/default/themes/broadband/images/mail/AMKInternetPeeringandTransit_FINAL.pdf
Labovitz, Craig (2013), Massive Ongoing Changes in Content Distribution, Content Delivery Summit, Spring 2013, http://conferences.infotoday.com/documents/172/2013CDNSummit-B102A.pdf
Level3 (2014), Observations of an Internet Middleman, May 5, 2014, http://blog.level3.com/open-internet/observations-internet-middleman/ [not retrievable anymore]
Massachusetts Institute of Technology (2014), Measuring Internet congestion: A preliminary report, June 18, 2014, https://www.ncta.com/sites/prod/files/MIT-Congestion-DC.pdf
Netflix (2014), Petition to deny of Netflix, Inc., August 27, 2014, https://ecfsapi.fcc.gov/file/7521825167.pdf
Rayburn, Dan (2014), Apple Building Out Their Own CDN To Deliver Content To Consumers, February 3, 2014, http://blog.streamingmedia.com/2014/02/apple-building-cdn-software-video-delivery.html
Rayburn, Dan (2016a), By My Estimate, Apple’s Internal CDN Now Delivers 75% Of Their Own Content, April 20, 2016, http://blog.streamingmedia.com/2016/04/apple-cdn-traffic-volume.html

BoR (17) 184
30
Rayburn, Dan (2016b), Current State Of The CDN Market: DIY, Pricing Trends, Competitive Dynamics, May 9 2016, http://blog.streamingmedia.com/wp-content/uploads/2016/05/2016CDNSummit-Rayburn-Pricing.pdf
Rayburn, Dan (2017), Best Practices For Using A Multi-CDN Strategy: How To Balance, Prioritize and Optimize Traffic, January 25, 2017, http://blog.streamingmedia.com/2017/01/using-multi-cdn-strategy.html
Sandvine (2011), Sandvine’s Take on Netflix’s Impact on P2P File Sharing; May 4t 2011, http://www.internetphenomena.com/2011/05/netflix%E2%80%99s-impact-on-p2p-file-sharing/
Telegeography (2015), IP transit price and peering trends yield regional revenue divide, July 9, 2015, https://www.telegeography.com/products/commsupdate/articles/2015/07/09/ip-transit-price-and-peering-trends-yield-regional-revenue-divide/
Telegeography (2015), IP Transit Prices Continue Falling, Major Discrepancies Remain, September 09, 2015, https://www.telegeography.com/press/press-releases/2015/09/09/ip-transit-prices-continue-falling-major-discrepancies-remain/index.html
Weller, Dennis; Bill Woodcock (2013), Internet Traffic Exchange: Market Developments and Policy Challenges, OECD Digital Economy Papers, No. 207, OECD Publishing, Paris, http://dx.doi.org/10.1787/5k918gpt130q-en
Woodcock, Bill; Marco Frigino (2016), 2016 Survey of Internet Carrier Interconnection Agreements, Survey presented during BEREC’s expert workshop on IP-Interconnection in co-operation with the OECD 21 November 2016, Brussels http://berec.europa.eu/eng/document_register/subject_matter/berec/others/6574-2016-survey-of-internet-carrier-interconnection-agreements

BoR (17) 184
31
Annex Traffic developments
It does not come as a surprise that traffic volumes continue to grow. Global IP traffic is expected to grow nearly threefold between 2015 and 2020 which translates into a compound annual growth rate of 22 % from 2015 to 2020.67 The corresponding growth rate for Western Europe is 20 % and 27 % for Central and Eastern Europe. The amount of global IP traffic reached in 2020 is “equivalent to 504 billion DVDs per year”.
Figure A 1: Cisco VNI Forecasts 194 EB per Month of IP Traffic by 202068
Fixed Internet traffic which accounts for approx. two thirds of all traffic as of year end 202069 is expected to grow at an almost constant pace 21 % from 2015 to 2020.
Per capita bandwidth usage of IP traffic in Western Europe is expected to grow by factor 2.44 from 27 GB (2015) to 66 GB (2020) while the growth rate for Internet traffic alone is even more distinct (x2.71 2015 to 2020) which may largely be attributed to the increase in video traffic delivered over the Internet.70
Mobile data traffic is still developing at a faster pace (CAGR of 53 %) than fixed IP-traffic. This may still be due to the fact that mobile traffic started from a significantly lower level. Nevertheless, while mobile Internet traffic growth rates in Western Europe are still at a high level they are levelling off (down from 64 % growth between 2015 and 2016 to 36 % between 2019 and 2020). The corresponding figures for Eastern Europe resp. the whole world display the same tendency albeit at a higher level. Lower growth rates may indicate that mobile markets are in a more mature state.
67 Cisco (2016). 68 Cisco (2016). 69 67 % Internet, 17 % managed IP, 16 % mobile data. 70 Cisco, VNI Forecast Highlights Tool.
BoR (17) 184
32
A closer look displays some drivers for overall traffic growth. On a global scale, devices and connections71 grow faster (CAGR of 10 %) than Internet users (CAGR of 6.5 %). Simply put, users avail of more devices than ever before. And more devices are used for bandwidth “hungry” purposes like video streaming.
Figure A 2: Global Internet traffic by devices72
The previous figure shows that by 2020 only one third of global Internet will originate from PCs (down from 67 % in 2015) while the share of traffic originated via tablets and particular smartphones increases significantly.
Composition of traffic:
Video seems to be a major factor impacting on observable traffic developments. In Western Europe Internet video traffic is expected to grow 4-fold (CAGR of 29%) which is significantly higher than the 2.8-fold increase of Internet traffic (CAGR of 22 %). It is not only the increase in the number of devices that spur video traffic volumes but also the tendency towards high-definition (HD) and even ultra-high-definition (UHD) video streaming. The share of UHD Internet video traffic in Western Europe is expected to rise to 16.1 % (up from 1.6) and the share of HD will reach 71 % (up from 53,2 %). Premium content (sports, films) may also become more important for providers of video services further driving traffic volumes. This may strengthen the growth of streaming platforms at the expense of traditional pay-TV platforms.73
For online gaming even a 7-fold increase (CAGR 47 %) is expected. Nevertheless, the quantitative relevance in absolute terms is much lower for gaming compared to Internet
71 Cisco includes here PCs, tablets, TVs, smartphones, non-smartphones, M2M connections. 72 Cisco (2016), section “Trend 1: Continued Shifts in Mix of Devices and Connections”. 73 E.g., Amazon Prime signed a deal with HBO in 2014 (http://variety.com/2014/digital/news/hbo-cuts-exclusive-
licensing-deal-with-amazon-1201161895/) or with Broad Green Pictures in 2016 (http://www.tvbeurope.com/amazon-pens-broad-green-deal/). Netflix signed deal (e.g.) with Disney in 2016 (https://www.forbes.com/sites/alishagrauso/2016/05/24/netflix-to-begin-exclusive-streaming-of-disney-marvel-star-wars-and-pixar-in-september/#66ac6993135d).

BoR (17) 184
33
video. While gaming amounts to 5 % of consumer Internet traffic (Western Europe) in 2020 (up from 2 % 2015), consumer Internet video traffic will reach 83 % (up from 66 %).
Figure A 3: Consumer Internet Traffic (PB per month) in Western Europe: 74
2015 2016 2017 2018 2019 2020
CAGR 2015-2020
Total 6,957 8,618 10,712 13,088 16,180 19,723 23% Web, Email, and Data Traffic 1,269 1,435 1,593 1,695 1,692 2,021 10% P2P file transfer 4,798 4,550 4,224 3,840 2,207 2,340 -5% Consumer Internet Video 4,545 6,047 7,978 10,247 13,334 16,433 29%
Positive growth rates can be observed for all traffic categories, despite at different growth rates. However, this is not the case for file sharing, which actually does not grow in absolute terms in Western Europe. Thus, the relative decline of the share of P2P traffic, which BEREC mentioned in its 2012 report, continues.
This development becomes obvious with a closer look at the impact of Netflix and other streaming services on File Sharing.75 Between 2009 to 2015 the percentage of real-time entertainment services in North America during peak hours more than doubled reaching almost two thirds of all Internet traffic. During the same period the share of file-sharing services dropped from 15.1 % to 5 %.
74 Cisco VNI Forecast Highlights Tool. 75 http://www.vocativ.com/196575/netflix-vs-bittorent-streaming-traffic-is-dwarfing-file-sharing-traffic/ (based on
Sandvine data).

BoR (17) 184
34
Figure A 4: Percent of streaming traffic during peak hours 2009-201576
The increasing relevance of video traffic delivered over the Internet implies that busy hour traffic grows at a faster rate (global CAGR 36 %) than average traffic (CAGR 24.9).
Figure A 5: Busy-Hour Compared with Average Internet Traffic Growth77
This seems obvious considering most people’s habits when they typically consume video. Overall this contributes to a more pronounced peak of overall Internet traffic. This is relevant for the ISPs as they dimension their networks according to the busy hour.
76 http://www.vocativ.com/196575/netflix-vs-bittorent-streaming-traffic-is-dwarfing-file-sharing-traffic/; Sandvine (2011).
77 Cisco (2016), section „Trend 10: Traffic Pattern Analysis (Peak Compared to Average and CDN Uptake“.

BoR (17) 184
35
Pricing and costing developments
Transit pricing
In its 2012 report BEREC noted that transit prices dropped at an annual rate of approx. 36 % since 1998. Having a look at more recent figures shows that this decline continues (see figure X).
Figure A 6: Internet Transit Pricing (1998-2015)78
It should be noted however that other sources identify a lower decrease of transit prices. Telegeography refers to an average 14 % decrease compounded annually between 2012 and 2015 for median 10 gigabit per second Ethernet (10 GigE) port prices across key global transit markets.79 The figures displayed in the figure above however focus on US transit prices. Besides this, such differences in price decline rates may also be due to methodological differences. 80 BEREC considers that the price decline indicates that the market for transit services is highly competitive but at the same time put under pressure, both from peering services as well as CDN services.
Geographic differences in the transit market:
Besides this general tendency the transit market is characterized by geographic differences, with regard to absolute transit prices, price developments (in %) as well as transit revenues.
The following figure illustrates that major transit hubs (London, Los Angeles, Miami) display significantly lower prices and steeper price declines compared to Sao Paulo or Sydney. Telegeography explains that Sao Paulo, which exhibits higher prices and lower price declines exchanges most of its Internet traffic in Miami.81
78 DrPeering (2013). 79 https://www.telegeography.com/press/press-releases/2015/09/09/ip-transit-prices-continue-falling-major-
discrepancies-remain/index.html 80 Kovacs (2012) reasons “While the TeleGeography data we cite above is specific to particular cities and port
types and sizes, our impression is that Norton’s data cuts across those variations.”, http://www.broadbandforamerica.com/sites/default/themes/broadband/images/mail/AMKInternetPeeringandTransit_FINAL.pdf , p. 19.
81 Similar, a major part of Sydney’s Internet traffic is exchanges in Los Angeles.

BoR (17) 184
36
Figure A 7: 10 GigE IP Transit Prices & Price Declines82
Differences in the rate of price declines and differences in the share of Internet traffic exchanged via transit agreements are the factors driving this regional difference.83 While emerging markets display the highest Internet traffic growth rates, Telegeography points out that ISPs in these areas are more quickly switching from transit services to free peering agreements than in more mature markets. At the same time transit prices in these less mature markets display steeper price declines leading to the results illustrated in figure X below.84
Figure A 8: Estimate for transit revenues85
CDN pricing
Generally, the price decline for CDN services seems to continue, commodity CDN prices dropped 25 % in 2014 and 20 % in 2015.86 It should be noted however, that these figures
82 https://www.telegeography.com/press/press-releases/2015/09/09/ip-transit-prices-continue-falling-major-discrepancies-remain/index.html
83 https://www.telegeography.com/products/commsupdate/articles/2015/07/09/ip-transit-price-and-peering-trends-yield-regional-revenue-divide/
84 The compounded annual price decline until 2021 (price per Mbps for a 10GigE port) is forecasted to be between 27 % and 29 % in Africa, Latin America and the Middle East and 20 % in North America and Europe (https://www.telegeography.com/products/commsupdate/articles/2015/07/09/ip-transit-price-and-peering-trends-yield-regional-revenue-divide/).
85 https://www.telegeography.com/products/commsupdate/articles/2015/07/09/ip-transit-price-and-peering-trends-yield-regional-revenue-divide/

BoR (17) 184
37
only provide a “broad picture” considering that CDN prices vary between providers and also depending on the size of the customers. For the biggest customers prices dropped even 45 % in 2015. These differences also become evident with the following figure illustrating that CDN prices are largely driven by economies of scale. Given that both, prices for transit as well as CDN services see a constant decline, it seems plausible to assume that the prices of each of these services impacts on the other (and vice versa).
Figure A 9: Prices for CDN services in relation to bandwidth used87
Costing developments
In its 2012 report BEREC also had a closer look at cost issues. Overall, it turned out that the costs of delivering traffic were subject to a significant decline (e.g. the router costs $ per Gbps. This development seems to be largely due to competition, technological progress as well as economies of scale that become relevant in the light of increasing traffic volumes. The decline in costs has offset increasing traffic volumes. This contributed to the fact that the Internet was well able to cope with increasing traffic volumes.
Generally, there are no indications that this development has stopped. As illustrated above the prices for various services are still declining. Given that prices in competitive markets reflect underlying costs, it seems plausible to assume that the costs of delivering data packets (on a per unit basis) are also declining.
E.g. it is assumed that it costs about $ 0.008 to deliver one hour of premium over-the-top video via a 3rd party CDN.88 This would amount to less than $1 for a user consuming 60 hours per month.
Anecdotal evidence also supports these findings. The CEO of Sonic (US-based ISP) pointed out that a few years ago it had spent about 20 % of its revenue on basic infrastructure. Since
86 Rayburn (2016b). 87 https://stratusly.com/akamai-amazon-cloudflare-fastly-maxcdn-verizon-cdn-comparison/ 88 Rayburn, 3 Jan. 2017, https://twitter.com/DanRayburn/status/817498806006796288.

BoR (17) 184
38
the cost of routers, switching equipment and other related gear declined so much, this ISP’s infrastructure costs are now slightly above 1.5 % of its revenue.89
Furthermore, in practice disputes between CAPs and eyeball ISPs are often centered on increasing available port capacities, and who should bear these costs. Unsurprisingly, cost estimations of providing additional capacity at interconnection points, differ depending on which party involved in such disputes is asked. Comcast assess that adding a new port “involves capital costs of about $50,000 and ongoing recurring costs of about $25,000 a year”.90 On the other hand, Level3 pointed out in a blog-post that the expense is “not significant”.91 And Netflix assesses the marginal costs of adding a port at less than $10.000 with an amortization period of three to five years.92
Changing players along the value chain and changes in traffic delivery
CDNs
In its 2012 report BEREC elaborated on the properties and functionalies of content delivery networks (CDNs) and also provided a legal classification.93 These descriptions still hold. The increasing relevance of CDNs was one of the major developments carved out by BEREC in 2012.
This gaining relevance of CDNs is a tendency which is now going on for several years which supports the finding of the competitiveness of the CDN market: The following figure illustrates that CDNs account for an increasing share of total consumer traffic in the USA, exceeding a share of 50 % in 2013. There are no indications that this trend is stopped or even reverted.
89 http://www.cio.com/article/3075975/internet-service-providers/what-big-isps-dont-want-you-to-know-about-data-caps.html (27 May 2016).
90 Letter from Joseph W. Waz, Jr., Senior Vice President, External Affairs and Public Policy Counsel, Comcast Corp., and Lynn R. Charytan, Vice President, Legal Regulatory Affairs, Comcast Corp. to Sharon Gillett, Chief Wireline Competition Bureau, Federal Communications Commission, GN Docket No. 09-191, at 3 n.4 (Nov. 30, 2010). Cited from https://ecfsapi.fcc.gov/file/7521825167.pdf , p. 65.
91 Level3 (2014). 92 Netflix (2014), p. 65. 93 BoR (12) 130, Chapters 2.4 and 4.4.

BoR (17) 184
39
Figure A 10: CDN growth94
Figure A 11: Global Content Delivery Network Internet Traffic, 2015 and 202095
On a global scale CDN traffic is expected to grow with a CAGR of 34 % increasing its share of all Internet traffic to 64 % by 2020 (45 % 2015). Total CDN industry’s revenue grew approx. 14 % year over year between 2014 and 2016.96 Given that the development of CDNs coincides in particular with the increase of video streaming over the Internet (e.g. Netflix) it is plausible that the share of all Internet video traffic that is delivered via CDNs is even higher (61 % in 2015 / 73 % in 2020).97
The increasing importance of CDNs as a means of traffic delivery coincides with the general growth in traffic, in particular video, as well as the gaining relevance of large CAPs with huge volumes of content. The impact of video on the development of CDNs is not only due to the traffic volumes. The quality enhancing properties of CDNs will even reinforce this impact.
94 Labovitz (2013). 95http://www.cisco.com/c/en/us/solutions/collateral/service-provider/visual-networking-index-vni/vni-
hyperconnectivity-wp.html 96 Rayburn (2016b). 97 http://www.cisco.com/c/m/en_us/solutions/service-provider/vni-forecast-highlights.html#

BoR (17) 184
40
Some voices in the industry are sceptical whether 4K streaming and virtual reality streaming will drive revenue growth for CDNs.98 They doubt whether 4K will be a mass phenomenon and point out that not only the cost of traffic delivery (via CDN) is a relevant factor. Other factors such as edit, store, transcode are also relevant for the provision of 4K as well as the availability of 4K-enabled devices among end-users and their willingness to pay for such high-end video services. Furthermore, it is argued that OTT services (e.g. PlayStation Vue99) are not the main driver for CDN growth. Correspondingly, the largest growth in OTT is not delivered by third party CDNs but rather by those players who provide CDN services themselves.100
In the recent past many CAPs seem to increasingly rely on a multi-CDN strategy.101 This development gained momentum in recent years particularly for companies delivering content to many users on a global scale in many different locations. In simple terms, deploying multiple CDNs may improve resilience. Where CAPs use several CDNs they may also use a load balancer to efficiently distribute traffic between them.102 Based on the location of the users requesting the content either CDN A or CDN B may be used.103 There are also aggregators104 who provide CDN service from several CDNs (which implies one-stop shopping from the CAPs perspective).
Generally, the CDN market continues to consist of a great variety of players: pure CDN providers, in-house CDNs, telcos providing CDN services.
For a CAP self-delivery of CDN services may be an alternative to buying CDN services from third parties. However, this is likely only a viable strategy for very large CAPs. For example, Apple, which originally relied on third-party CDN services to deliver its software updates, videos, apps etc., started (around 2013/2014) to build their own CDN.105 According to estimations, Apple delivered approx. 75 % of their own content via its internal CDN.106
Other companies that also provide their own CDN services are e.g. Google, Amazon or Facebook.107 Similarly, Netflix also relies on an internal-CDN strategy. Netflix launched its CDN Open Connect in June 2012.108 While Netflix in the past had relied on various transit
98 Rayburn (2016b). 99 TV service that streams live TV, movies, and sports on a variety of devices without a cable or satellite
subscription. 100 Rayburn (2016b). 101 Rayburn (2016b; 2017); https://www.maxcdn.com/blog/multi-cdns/. 102 https://www.maxcdn.com/blog/multi-cdns/ 103 https://www.maxcdn.com/blog/multi-cdns/ 104 E.g. http://www.turbobytes.com/ 105 Rayburn (2014). 106 Rayburn (2016a). 107 Note: statement not to be understood as “use only their internal CDN” 108 See https://openconnect.netflix.com/en/ for a description and the requirements for participation.

BoR (17) 184
41
and third party CDNs it now provides its traffic [all?] using its own CDN. Netflix is said to have invested +100 million dollars in its CDN.109
Obviously, the decision to build and deploy an internal CDN is driven by economic considerations. Relevant factors for this make or buy decision are: content volumes, economies of scale, opportunity costs of using self-deployed, third-party CDN or using transit services, quality considerations etc.
Infrastructure deployment of CAPs
One of the developments mentioned in BEREC’s 2012 report was that large CAPs began to deploy their own networks. For example, late 2016 Google and Facebook teamed up to lay a nearly 8,000-mile cable between Los Angeles and Hong Kong with a bandwidth of 120 terabits per seconds.110 Google also was part of a consortium that invested in cable infrastructure between the US-westcoast and Japan.111 In another project, Facebook and Microsoft have built a 6,600 km submarine cable with a capacity of 160Tbps cable crossing the Atlantic.112
All these submarine cable projects link data centers of these large content providers. Telegeography views these projects as a new trend. Traffic volumes are large enough that “make instead of buy” is a rational choice. Furthermore, owning such submarine cables allows them to flexibly upgrade capacity without depending on third parties.113
Regionalisation of traffic
A recent study provides some insights to what extent network operators in a given country are interconnected with other domestic networks respectively with foreign networks. For example, while in 2011 29 % of US networks interconnection partners were US networks, this figure declined to 23 % in 2016.114 Similar developments, can be observed for the UK (declining from 41 % in 2011 to 33 %) and Germany (declining from 32 % to 17 %).
109 Encompassing deployment costs and R&D, https://qz.com/256586/the-inside-story-of-how-netflix-came-to-pay-comcast-for-internet-traffic/
110 http://www.theverge.com/2016/10/12/13255858/google-facebook-submarine-cable-trans-pacific 111 The consortium includes Google, Global Transit, China Telecom Global, Singtel, China Mobile International,
and KDDI (http://www.nec.com/en/press/201606/global_20160629_02.html) 112 https://blogs.technet.microsoft.com/hybridcloud/2016/05/26/microsoft-and-facebook-to-build-subsea-cable-
across-atlantic/ 113 http://www.wired.co.uk/article/google-facebook-plcn-internet-cable. According to Telegoegraphy, despite
these new cable builds, there is a lot of spare capacity in existing subsea systems to last for a long time. 114 Woodcock/Frigino (2016), p.6.

BoR (17) 184
42
However, these figures require careful interpretation. They may indicate that the Internet becomes more densely interconnected than in the past.115 Assuming that a large percentage of US traffic is domestically produced and consumed, the declining share of US networks domestic interconnection partners may presumably reflect such a tendency towards a more interconnected Internet. On the other hand, many developing countries tend to have a relative high percentage of international connectivity which may rather reflect a low degree of domestic production of content.
Peering developments
A recent study provides some insights into the dissemination of peering agreements.116 A previous version of this study was conducted in 2011117 analyzing 142,210 Internet carrier interconnection agreements. The updated study now builds upon 1,935,822 interconnection agreements representing 10,794 carrier networks in 148 countries.118
It turned out that 99.93% of peering agreements are informal “handshake” agreements concluded without a written contract. In the previous study this figure was 99.51 %. Thus, the percentage of written, formal contracts declined from 0.49 % to now 0.07 %. The report refers to interviewees who even expect the portion of written contracts to decline further over time.
Furthermore, 99.98% of peering agreements are based on symmetric terms now, which is up from 99.73 % in 2011. Thus, only 0.02 % of all peering agreements are currently based on asymmetric terms. However, in terms of traffic volumes these shares may look very different.
Since the previous report the dozen largest networks have increased the number of peering partners from a range of 700 – 2.400 in 2011 to 2.200 – 4.500 in 2016. The percentage of networks with ten or fewer peering partners declined from 62 % in 2011 to 35% in 2016. Across all networks the average number of interconnections per network rose from 77 to now 292. These developments indicate that network operators regardless of their size are more inclined to peer and tend to increase the number of peering partners. Generally, this results in a more densely interconnected Internet, which also improves quality as more direct paths are established.
The study also emphasizes the prevalence of multilateral peering where more than two parties exchange traffic, which is the case at IXPs. According to this study, multilateral
115 This is in line with the findings presented in Ch. XXX [increasing number of peering partners per network]. 116 Woodcock/Frigino, (2016). 117 Weller/Woodcock (2013). 118 These countries include all OECD countries.

BoR (17) 184
43
peering became the dominant practice in 2011 as it accounts for more AS-adjacencies than bilateral peering.119 Referring to the focus of Russian, French, Canadian IXPs on multilateral peering it is expected in this study that the predominance of this peering mode will further accelerate.120
As pointed out above, traffic volumes in the Internet are still increasing. Growth rates are particularly high in developing countries, which is largely due to the fact that traffic volumes in absolute terms are at a significantly lower level. With such developments ongoing, the question arises what the most efficient way of exchanging traffic across networks is.
A study121 from 2012 analyses the benefits of using an IXP in developing countries, using Kenya and Nigeria as examples. It depicts that countries in the first phase of their Internet development largely rely on tromboning using their international connections for exchanging domestic traffic. Establishing IXPs in these countries helped to eliminate reliance on tromboning, thereyby significantly reducing costs122 and reducing latency. Growth of IXPs again makes it increasingly attractive for other ISPs as well as content providers to participate. Google has installed a cache in Kenya in 2011.123 This cache led to an immediate and significant spike of traffic volumes exchanged at the IX as users increasingly used Google content (e.g. Youtube).124
Using IXPs may thus have several positive effects, saving transit costs, enhancing quality, spurring bandwidth consumption, lower prices for end-users, as well as fueling the emergence of a national Internet ecosystem, both in terms of communications infrastructure as well as the production of local content and applications.125 All these aspects and effects are to some extent interrelated. Acknowledging these positive effects, the International Telecommunication Union (ITU) recommends promoting local or regional IXP (ITU-T Recommendation D.52126)
119However, Woodcock/Frigino (2016) point out as a caveat that there are uncertainties whether this relates to corresponding volumes of traffic (p. 11)
120 Ibid, p 11. 121 Internet Society (2012). 122 According to this study the Kenya Internet Exchange Point (KIXO) accounts for estimated cost savings on
international connectivity of almost $1.5 million per year. And latency reduced significantly from 200-600 ms to 2-10 ms.
123 Originally, the cache was initially provided to one operator in Nairobi, under the condition that the contents would be made available to all members of KIXP.
124The usage of the IXP also had positive effects for mobile operators in Kenya. Mobile data revenues increased by an estimated $6 million for operators having generated at least an additional traffic of 100Mbit/s per year.
125 Internet Society (2016b). 126 ITU (2016).http://www.itu.int/rec/T-REC-D.52-201610-I

BoR (17) 184
44
Given these properties and benefits it seems plausible to assume that usage of IXPs will rather gain more importance in the next year, particularly considering a catch-up effect in developing countries displaying higher growth rates.127
IXP traffic developments
Generally, peering at a public IX economizes on the costs for establishing cross connects, because it allows to reach several networks with one cross connection instead of establishing a cross connect with each individual network.128 More generally, using an IX saves transactions costs. Besides this using IX peering allows networks saving in costs for IP transit.
Corresponding to the overall growth in Internet traffic also the traffic volumes exchanged at the biggest European IXPs – DE-CIX, AMS-IX129, LINX130 continue to grow.
Figure A 12: Traffic development at the DE-CIX, 5-year graph131
The figure above depicts the traffic development at the DE-CIX. While the peak capacity exceeded a 2.000 Gbit/s in the last quarter of 2012 it spiked above 5.600 Gbit/s at the end of 2016. It was late in the last quarter of 2008 when the peak exceeded 500 Gbit/s. Average throughput climbed from less than 200 Gbit/s (end of 2007), to approx. 1.500 (end of 2012) to 3.428 (19 January 2017).132
127See also Internet Society, 15 Februar 2016, “IXPs level up in emerging Asia-Pacific”, http://www.internetsociety.org/blog/asia-pacific-bureau/2016/02/ixps-level-emerging-asia-pacific.
128 However, this does not hold where two networks peer on a private basis at an IXP. 129 E.g. for 2016 see https://ams-ix.net/technical/statistics/historical-traffic-data?year=2016. 130 https://www.linx.net/tech-info-help/traffic-stats (displaying the development at the LINX since late 2011). 131 https://www.de-cix.net/de/locations/germany/frankfurt/statistics 132 https://en.wikipedia.org/wiki/List_of_Internet_exchange_points_by_size
BoR (17) 184
45
Similar developments are observable at the AMS-IX. Peak capacity has reached 5.284 Gbit/s (19 January 2017).133 Also the average throughput grew constantly at the AMS-IX: it grew from about 750 Gbit/s (end of 2011), to slightliy more than 1.000 Gbits (April 2012), now reaching is 3.451 (19 January 2017).134 Corrspendingly, average througput at the LINX rose from approx. 600 Gbit/s (end of 2011), to 745 Gbit/s (18 March 2012), climbing to 2.089 (18 January 2017).135
US-corporation Equinix ranks 7 with regard to average throughput. However, it is not only providing IXP facilites in the US but also in Europa. The largest pure north-american IX SIX , providing facilities in the US and Canada, ranks 13 with an average throughput of 458 Gbit/s (19 October 2016).136 And the largest pure US IX only ranks 19.
133 https://en.wikipedia.org/wiki/List_of_Internet_exchange_points_by_size 134 https://en.wikipedia.org/wiki/List_of_Internet_exchange_points_by_size 135 https://en.wikipedia.org/wiki/List_of_Internet_exchange_points_by_size 136 https://en.wikipedia.org/wiki/List_of_Internet_exchange_points_by_size