Embed Size (px)
Citation preview
DRAFT Bennington Town Plan Energy Element-August 7, 2017
I. Introduction
The Town of Bennington recognizes that it is necessary to work toward a sustainable energy future in a manner that minimizes environmental impacts and supports the local economy. The purpose of this energy element is to further those goals and recommended actions by increasing public awareness of energy issues, assessing local energy use and conservation opportunities, reducing the number of energy-related dollars exported from the town, and evaluating the potential for utilization of various renewable energy resources to meet the town's stated goals of:
• Reducing our dependence on non-renewable and imported energy sources; • Promoting energy conservation and efficiency in residential, commercial, and industrial
structures and operations; • Reducing energy consumption in all taxpayer funded buildings and operations; and • Developing sustainable, local renewable energy resources.
These goals are consistent with Vermont's energy goals and policies, including:
O Obtaining 90% of energy for all uses from renewable sources by 2050; O Reducing greenhouse gas emissions to 50% below 1990 levels by 2028 and 75% by 2050; O Relying on in-state renewable energy sources to supply 25% of energy use by 2025; O Improving the energy efficiency of 25% of homes by 2020; O Meeting the Vermont Renewable Energy Standard through renewable generation and
energy transformation.
A thorough understanding of energy and a plan to address future challenges is essential because energy is critical to every aspect of our lives. At the most basic level, we need the energy we obtain from food to survive. And it is the energy contained in oil, propane, and wood that heats our homes and the energy in gasoline and diesel fuel that moves our vehicles. Energy also generates the electricity that runs our appliances, machinery, computers, and telecommunication systems.
Most of the energy that we use, and have come to rely upon, is derived from "nonrenewable" fossil fuels and, to a lesser extent, nuclear fuels. This energy has been abundant and cheap, but supplies are becoming scarcer and oil, natural gas, coal, and uranium will become increasingly expensive to obtain. Moreover, serious and longstanding environmental concerns with coal mining, offshore oil drilling, acid rain, and other pollution resulting from fossil fuel use are now overshadowed by potentially catastrophic global climate change that is driven by the release of tens of millions of years of stored carbon in just a few decades.
Fortunately, alternative energy sources such as solar, wind, hydroelectric, and biomass-based fuels can provide significant amounts of clean energy well into the future. Developing these resources is extremely important, but the total amount of energy that can be extracted from such resources is markedly less than what we currently obtain from fossil fuels. To maintain a good quality of life, vibrant communities, and prospering economies, we will have to develop conservation strategies and improve energy efficiency as we transition to the widespread use of renewable energy.
II. Energy Use in Bennington
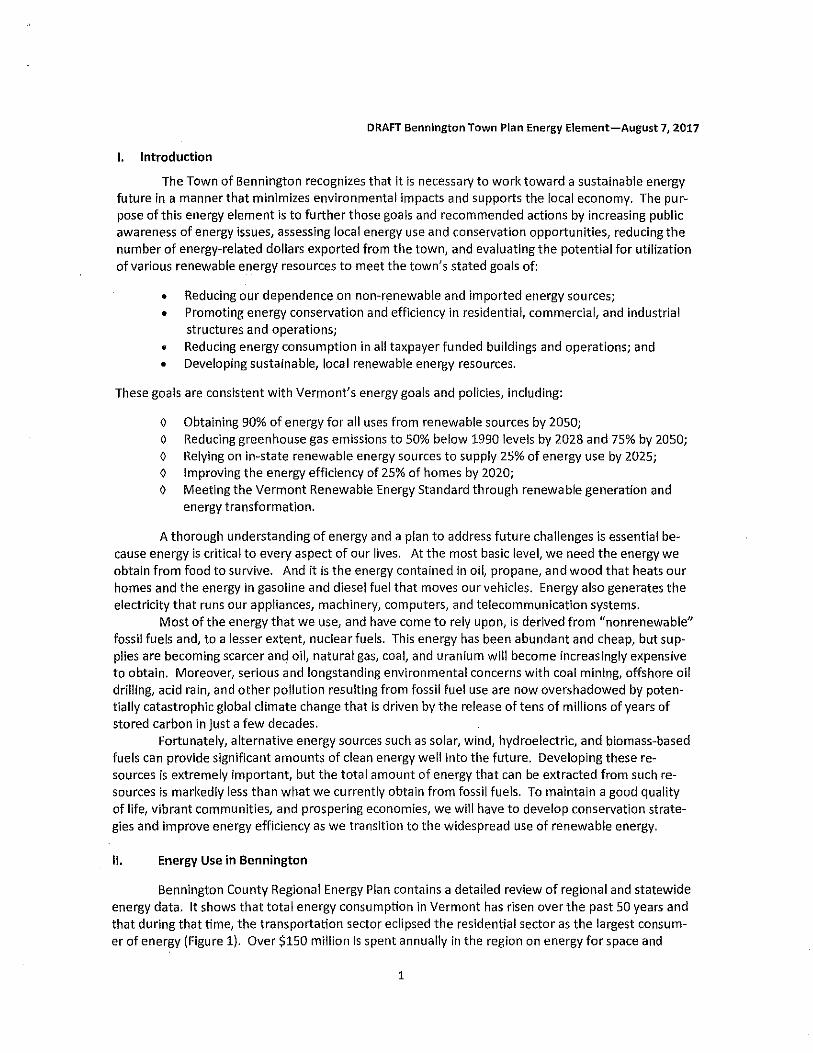
Bennington County Regional Energy Plan contains a detailed review of regional and statewide energy data. It shows that total energy consumption in Vermont has risen over the past 50 years and that during that time, the transportation sector eclipsed the residential sector as the largest consumer of energy (Figure 1). Over $150 million is spent annually in the region on energy for space and
1
DRAFT Bennington Town Plan Energy Element-August 7, 2017
water heating, transportation, and electricity - with most of that money leaving the area to pay for imported fuels. The following section will provide estimates of current energy use by sector as well as proj ections illustrating the magnitude of conservation, efficiency, and transition to alternative fue ls needed to meet Ben nington's energy goals.
Residential Sector Energy Demand
With over 6,000 residential units in Benn ington, space and water heating and electricity usage for lighting and appliances consumes a large amount of energy and offers opportunities for considerable energy savings in the future. A majority of home
Figure 1. Energy Use by Sector in the Bennington Region. Source: 2017 Bennington County Regional Energy Plan.
heating in Bennington continues to rely on oil, although fuel switching to wood (particularly wood pellet s in recent years) has been observed to occur with oil prices increase. Transportation energy demand also is influenced by the location of residential development, and that data w ill be presented separately in the discussion of the transportation sector.
The magnitude of residential energy consumption in Bennington can be estimated by considering the fuel usage of a typica l Vermont home. An average single family home in the northeast requires approximately 60,000 Btu (British Thermal Units) of energy per square foot for annual space heating. A gallon of home heating oil contains approximately 140,000 Btu of energy. The average annual heating oil consumption of a Vermont home - 850 gallons - (based on an average house size of 2,000 square feet) is consistent with this data. An evaluation of the composition of Bennington's housing stock and heating fuel and electricity usage provides an estimate of total residential energy consumption (Table 1).
It is useful to consider scenarios illustrating how this level pf energy demand and accompanying mix of fuels may change over time in a way that would allow the town to meet its energy goals. The BCRC, working with the Vermont Energy Investment Corporation, made use of the Long-range Energy Alternatives Planning ("LEAP") computer modeling tool to assess how the region's energy demand profile might change over time based on a realistic t rajectory toward achieving 90% of all energy from renewable sources by 2050.
The model first was run at the statewide level, and then adjusted based on regional conditions and the output customized for the Bennington Region. The resulting regional data was then used to provide town-level estimates (consequently, the data in Table 1 will not align perfectly with the LEAP data, but the trends and the magnitude of the changes are clear). Severa l key points become clear when looking at the overall residential energy demand for the Bennington County region (Figure 2). Of particu lar importance is the significant reduction in the total amount of energy used. The redu ction displayed on the graph assumes continuing and effective deployment of existing conservation and efficiency programs plus additional measures that result in a further increase in the number of existing homes that are weatherized and additional efficiency gains from advanced heating and cooling systems (t he "Avoided vs. Reference" blocks on the chart). The transitions in fuel usage (for space and water heating; i.e., not including non-thermal electric use) within the Town of Bennington that correlate with the regional LEAP scenario are outlined in Tables 2 and 3.
2
DRAFT Bennington Town Plan Energy Element-August 7, 2017
Table 1. Estimate of Bennington's annual residential energy use and cost.
Residential Total Oil Use Total LP Gas Total Wood Use Electric Use for Non-heat Elec-
Units (gallons) Use (gallons) (pellet bags) Heat (kwH) tric Use (kwH)
Single Family 3,508 2,414,850 501,800 44,280 3,080,000 24,556,000
Two-Family 638 335,900 69,160 6,096 425,600 3,828,000
Multi-Family 1,722 627, 750 130,221 11,448 797,650 8,610,000
Mobile Home 510 265,200 55,328 4,925 345,800 2,550,000
Total 6,378 3,643,700 756,509 66,749 4,649,050 39,544,000
Cost Factor $2.50/gal $3.50/gal $5.00/bag $0.15/kwH $0.15/kwH
Total Cost $9,109,250 $2,647,782 $333,745 $697,358 $5,931,600
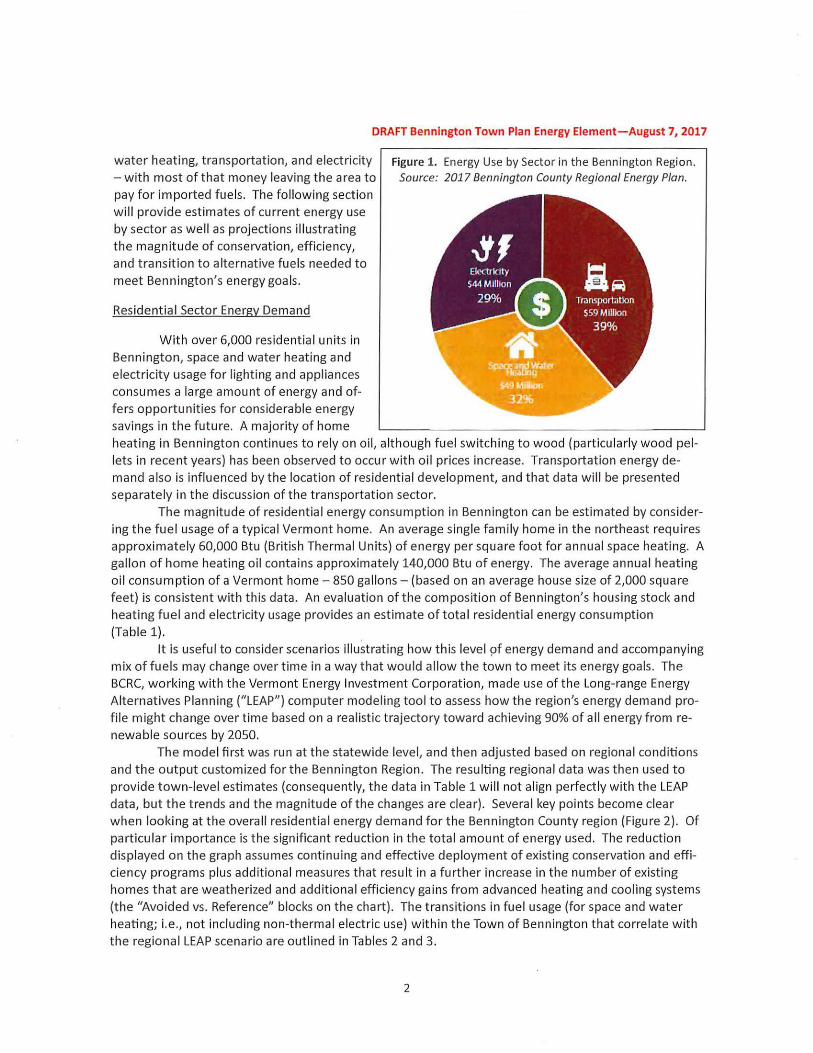
This data provides a rough estimate of total residential energy consumption and costs for Bennington. The com
bined total cost of residentia l purchases of heating oil, LP gas, wood/pellets, and electricity is $18, 719, 735; wi t h a
population of 15, 764, the per capita cost of residential energy use (not including transportation energy costs) is
$1,187. Data was obtained from the 2010 US Census, the Vermont State Data Center-Housing Statistics, and the US
Energy Information Administration. The following assumptions were used in the calculations: average single-family house size of 2,000 square feet, two-family dwelling unit of 1,500 square feet, and mu lt i-family dwelling unit at 1,000
square feet (estimates of fuel usage rounded to nearest 50 gallons of oil/Ip gas and ratios used for wood and electric
heating use calculations. Heating fuel usage for mobile homes were generated based on the two-family dwell ing un it
(larger than a typical mobile home) because of generally lower insulation values and inefficient heating geometry for
mobile homes. Electric use estimated at 7,000 KwH per year for a single-family home, 6,000 KwH per year for a two
family dwelling unit, and 5,000 KwH per year for a multi-family dwelling unit and mobile home. Energy use for
domestic hot water production assumed included in the space heating and/or electric usage data. "Wood" heat in
cludes both cord wood and wood pellet fuel; for simplicity, quantities and cost are presented using only wood pellet
data.
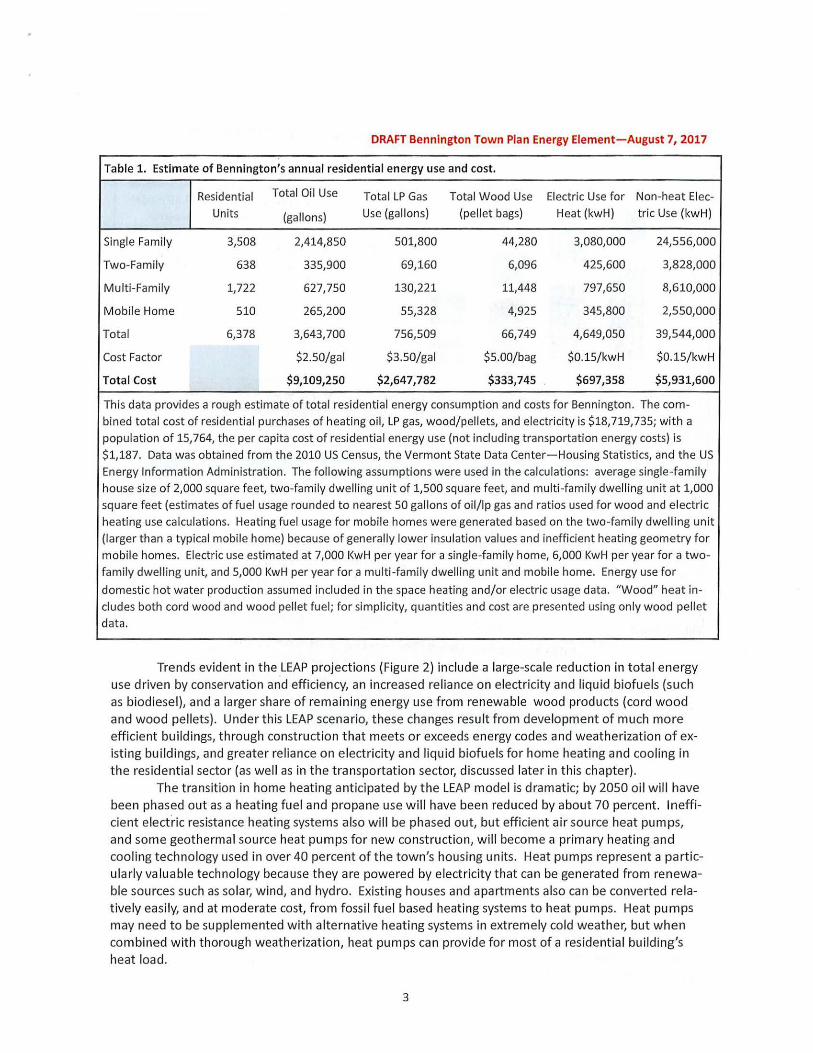
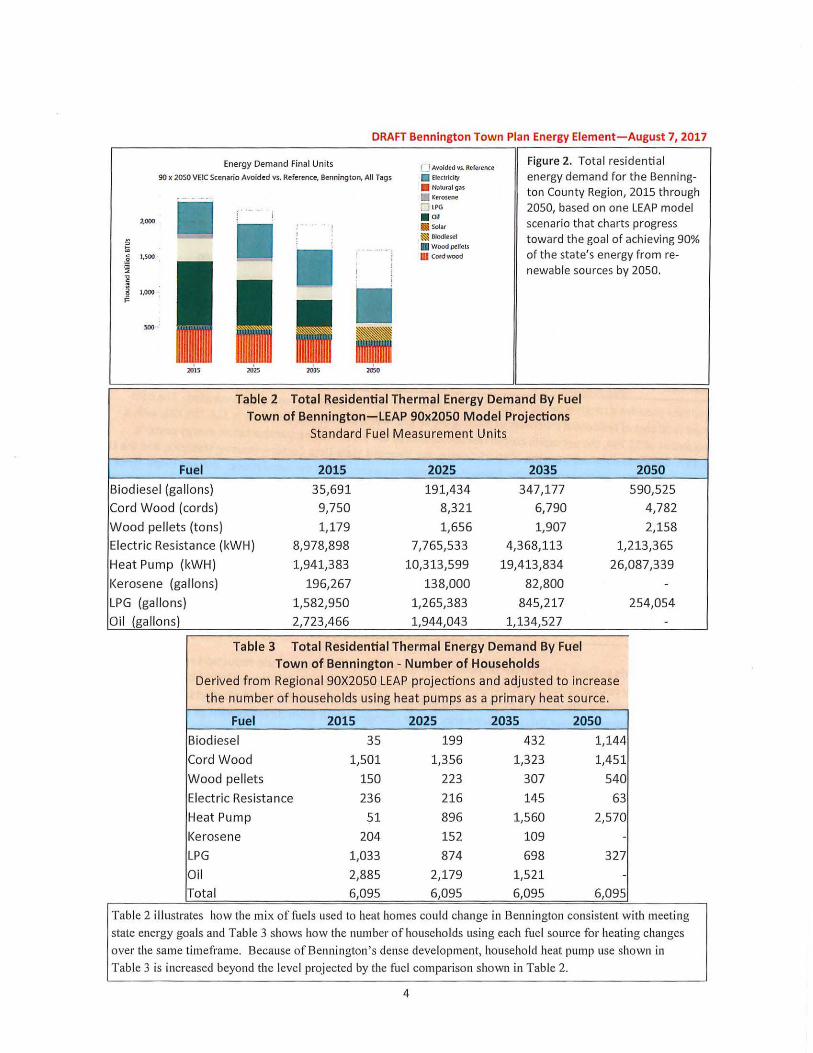
Trends evident in the LEAP projections (Figure 2) include a large-scale reduction in total energy use driven by conservat ion and efficiency, an increased rel iance on electricity and liquid biofuels (such as biodiese l), and a larger share of rema ining energy use from renewable wood products (cord wood and wood pellets). Under this LEAP scenario, these changes result from development of much more efficient bu ildings, through construction t hat meets o r exceeds energy codes and weatherization of existing bu ildings, and greater re liance on electricity and liquid biofuels for home heating and cooling in the res idential sector (as well as in the transportat ion sector, discussed later in this chapter).
The transit ion in home heating anticipated by the LEAP model is dramatic; by 2050 oil will have been phased out as a heating fuel and propane use will have been reduced by about 70 percent. Inefficient elecfric resistance heating systems also w ill be phased out, but efficient air source heat pumps, and some geothermal source heat pumps for new construction, w ill become a primary heating and coo ling technology used in over 40 percent of the town's housing units. Heat pumps represent a particularly va luable technology because they are powered by electricity t hat can be generated from renewable sources such as solar, wind, and hydro. Existing houses and apartments also can be converted relat ively eas ily, and at moderate cost, from fossil fuel based heating systems to heat pumps. Heat pumps may need to be supplemented with alternative heating systems in extremely cold weather, but when combined with t horough weatherizat ion, heat pumps can provide for most of a residential bu ilding's heat load.
3
DRAFT Bennington Town Plan Energy Element-August 7, 2017
Energy Demand Final Units
90 x 2050 VEIC Scenario Avoided vs. Reference, Benning Ion, All Tags
2,000
1,500 i !
l I
1,000 .
500 .. I • 201
1s 20)5 Ms.,
fl Avoided vs. Reference . EleCUlcity • NJ1Ut31 QJS
• Kerost"ne !"] LPG
• oil 11 Sclir ~ Olodltsel a w oodp<llelS
DJ C0<dwood
Figure 2. Total residential energy demand for the Bennington County Region, 2015 through 2050, based on one LEAP model scenario that charts progress toward the goal of achieving 90% of the state's energy from renewable sources by 2050.
Table 2 Total Residential Thermal Energy Demand By Fuel Town of Bennington-LEAP 90x2050 Model Projections
Standard Fuel Measurement Units
Fuel 2015 2025 2035 2050
Biodiesel (gallons) 35,691 191,434 347,177 590,525 Cord Wood (cords) 9,750 8,321 6,790 4,782
Wood pellets (tons) 1,179 1,656 1,907 2,158 Electric Resistance (kWH) 8,978,898 7,765,533 4,368,113 1,213,365
Heat Pump (kWH) 1,941,383 10,313,599 19,413,834 26,087,339
l<erosene (gallons) 196,267 138,000 82,800
LPG (gallons)
Oil (gallons)
1,582,950 1,265,383 845,217
2,723,466 1,944,043 1,134,527
Table 3 Total Residential Thermal Energy Demand By Fuel i Town of Bennington - Number of Households
Derived from Regional 90X2050 LEAP projections and adjusted to increase the number of households using heat pu mps as a primary heat source.
Fuel 2015 2025 2035 2050
Biodiesel 35 199 432 1,144
Cord Wood 1,501 1,356 1,323 1,451
Wood pellets 150 223 307 540
Electric Resistance 236 216 145 63
Heat Pump 51 896 1,560 2,570
l<erosene 204 152 109 -LPG 1,033 874 698 327
Oi l 2,885 2,179 1,521 -
Total 6,095 6,095 6,095 6,095
254,054
Table 2 illustrates how the mix of fuels used to heat homes could change in Bennington consistent with meeting
state energy goals and Table 3 shows how the number of households using each fuel source for heating changes
over the same timeframe. Because of Bennington's dense development, ho usehold heat pump use shown in
Table 3 is increased beyond the level projected by the fuel comparison shown in Table 2.
4
DRAFT Bennington Town Plan Energy Element-August 7, 2017
Another fuel that may contribute to a relatively straightforward transition away from oil and propane based heating systems is biod iesel-with similar properties to petroleum diese l, but produced from oil crops such as canola, sunflower, and even algae. Whi le efficiencies in production technologies are needed to make these fuels affordable and to meet renewable standards, once developed (an assumption built into this LEAP scenario), biodiesel powered furnaces and boilers can take advantage of existing fuel delivery infrastructure and in-home ductwork and plumbing.
Vermont has an abundant supply of wood that can be used for space heating. The LEAP scenarios proj ect an increased reliance on wood as a thermal energy source for the residentia l sector, even t hough the total amount of wood energy use declines slightly (attributable to building efficiency improvements). The use of wood pellets, produced in or near the region, is expected to expand significantly, either as a prim ary home heating fuel or as a cold-weather supplement to air source heat pumps. Larger multifam ily residential buildings and residential complexes such as apartment/ condominium developments, dormitories, and even mobile home parks may convert to pellet or woodchip based heating systems. A recent example of this efficient and renewable energy based resident ia l "district heating" is the replacement of 29 oil-burning boilers at the 104 unit Applegate Apartment complex with a single efficient biomass boi ler (together with major weatherization improvements to the buildings) .
Commercial and Industrial Energy Demand
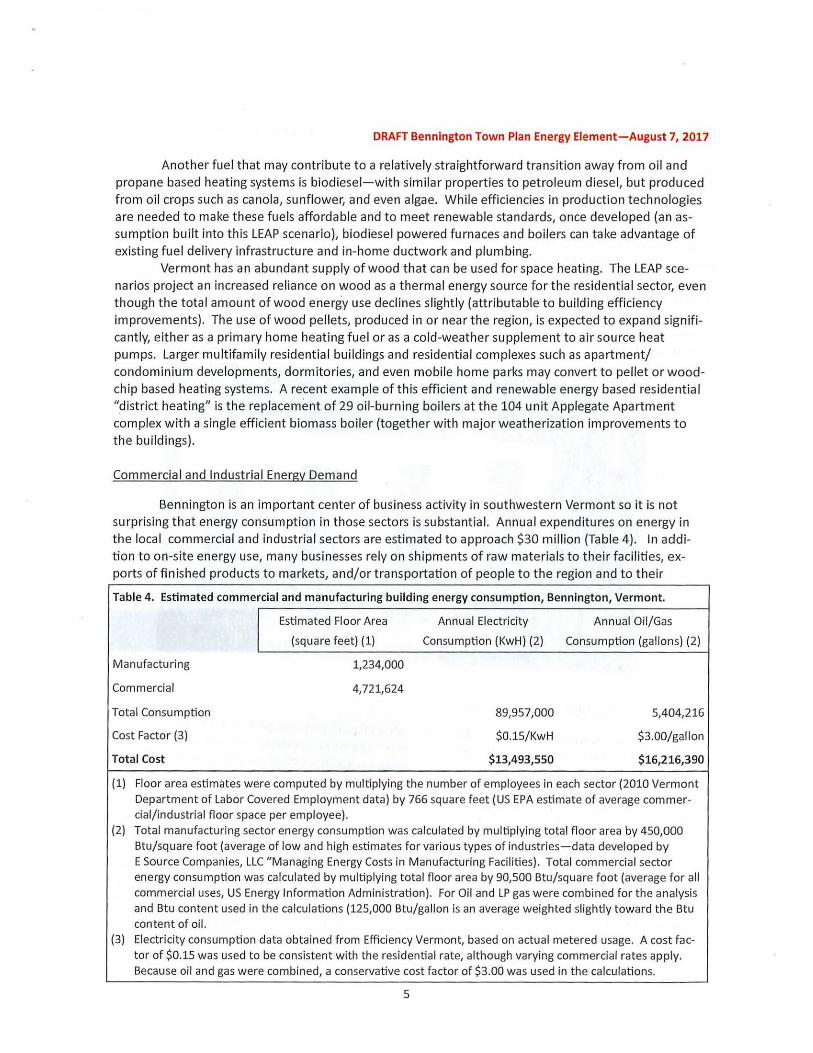
Benn ington is an important center of business activity in southwestern Vermont so it is not surprising that energy consumption in those sectors is substantial. Annual expenditures on energy in the local commercial and industrial sectors are estimated to approach $30 million (Table 4). In addition to on-site energy use, many businesses rely on shipments of raw materials to their facilities, exports of finished products to markets, and/or transportation of people to the region and to their
Table 4. Estimated commercial and manufacturing building energy consumption, Bennington, Vermont.
Manufacturing
Commercial
Total Consumption
Cost Factor (3)
Total Cost
Estimated Floor Area
(square feet) (1)
1,234,000
4,721,624
Annual Electricity
Consumption (KwH) (2)
89,957,000
$0.15/KwH
$13,493,550
Annual Oil/Gas
Consumption (gallons) (2)
5,404,216
$3.00/gal lon
$16,216,390
(1) Floor area estimates were computed by multiplying the number of employees in each sector (2010 Vermont Department of Labor Covered Employment data) by 766 square feet (US EPA estimate of average commercial/industrial floor space per employee).
(2) Total manufacturing sector energy consumption was calculated by multiplying tota l floor area by 450,000 Btu/square foot (average of low and high estimates for various types of industries-data developed by E Source Companies, LLC "Managing Energy Costs in Manufacturing Facilities). Total commercial sector energy consumption was calculated by multiplying total floor area by 90,500 Btu/square foot (average for all commercial uses, US Energy Information Administration) . For Oil and LP gas were combined for the analysis and Btu content used in the calculations (125,000 Btu/gallon is an average weighted slight ly toward the Btu content of oil.
(3) Electricity consumption data obtained from Efficiency Vermont, based on actual metered usage. A cost factor of $0.15 was used to be consistent with the residential rate, although varying commercial rates apply. Because oil and gas were combined, a conservative cost factor of $3.00 was used in the calculations.
5

DRAFT Bennington Town Plan Energy Element-August 7, 2017
establishments. Those energy demands are accounted for in the transportation sector-which has seen a very large increase in consumption of fossil fuels in recent years.
The LEAP energy forecasting models project a decrease of over 20 percent in overall commercia l and industrial energy demand in Bennington through 2050 (Figure 3). This reduction is achieved through both conservation and deploym ent of more efficient systems, often utilizing alternative fuels. Use of petroleum oil is expected to decline by over 80 percent during this period, whi le propane (LPG) use is expected to fall by over 50 percent. On the other hand, use of woody biomass, a locally available fuel, is projected to nearly double, wh ile biodiesel consumption is expected to begin to become a regionally significant fuel in these sectors. Electricity use will displace much of the current nonrenewable fuel demand in these sectors while contributing to the overall reduction in energy consumption through use of more efficient electrical syst ems.
Municipal and Institutional Energy Usage
Loca l government, schools, co lleges, and other institutional uses such as the Southwestern Vermont Medical Center all are major users of energy. The costs associat ed with energy use by those entities has a d irect bearing on taxes and critica l issues such as the cost of education and hea lth care. Energy conservation and the use of alternative energy systems in th is sector have the potentia l to produce significant savings and to promote economic development.
Municipal Government
The Town of Bennington relies on energy to provide services t o the community. The town owns and operates several buildings, a large fleet of vehicles and equipment, and is responsible for other services such as the provision of water, disposal of wastewater, and street lighting. The town already has taken steps to redu ce its energy use through use of more efficient lighting and equipment in office buildings, installation of a hydroelectric generator at the water treatment facility, and by pursuing other initiatives through Efficiency Vermont and other resources. An assessment of municipal energy use was conducted recently and is reported in this section.
6
DRAFT Bennington Town Plan Energy Element-August 7, 2017
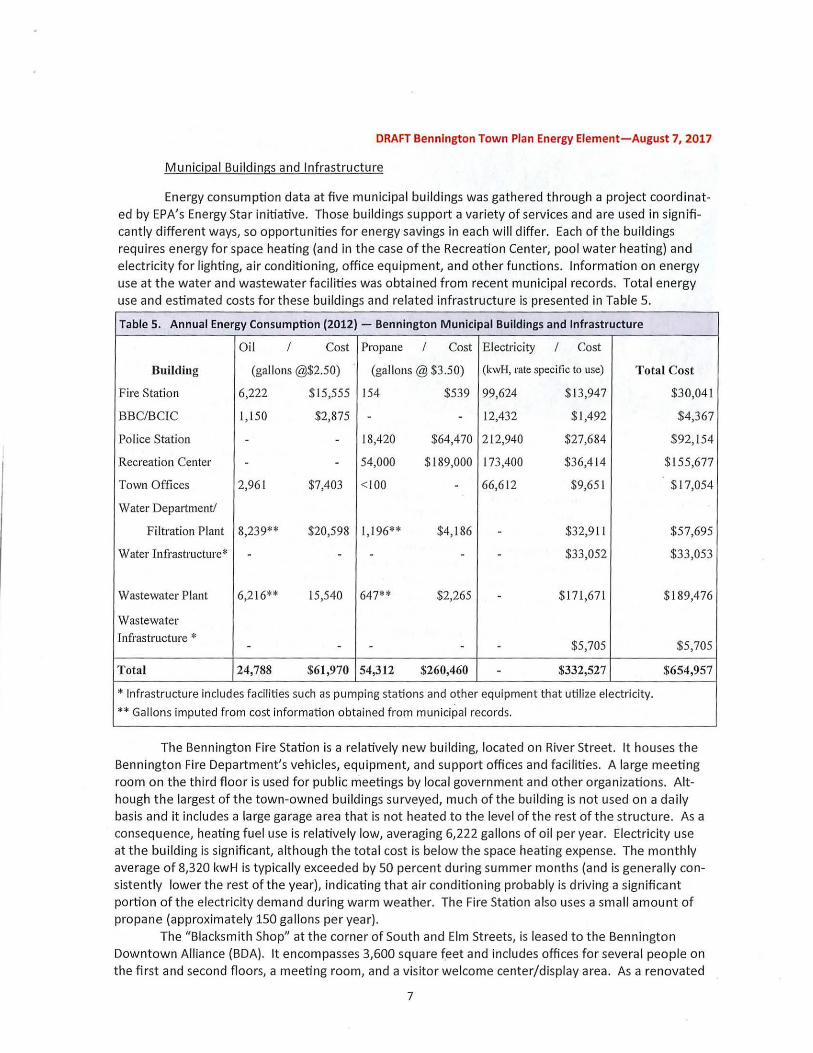
Municipal Buildings and Infrastructure
Energy consumption data at five municipal buildings was gathered through a project coordinated by EPA's Energy Star initiative. Those buildings su pport a variety of services and are used in significant ly different ways, so opportun ities for energy savings in each w ill differ. Each of the buildings requires energy for space heating (and in the case of the Recreation Center, pool water heating) and electricity for lighting, air condition ing, office equipment, and other functions. Information on energy use at the water and wastewater facilities was obtained from recent municipal records. Total energy use and estimated costs for t hese buildings and related infrastructure is presented in Table 5.
Table 5. Annual Energy Consumption (2012) - Bennington Municipal Buildings and Infrastructure
Oil I Cost Propane I Cost Electricity I Cost
Building (gallons @$2.50) (gallons @$3.50) (kwH, rate specific to use) Total Cost
Fire Station 6,222 $15,555 154 $539 99,624 $ 13,947 $30,041
BBC/BCIC 1,150 $2,875 - - 12,432 $ 1,492 $4,367
Police Station - - 18,420 $64,470 212,940 $27,684 $92,154
Recreation Center - - 54,000 $189,000 173,400 $36,4 14 $155,677
Town Offices 2,96 1 $7,403 <100 - 66,612 $9,651 $ 17,054
Water Department/
Filtration Plant 8,239** $20,598 1, 196** $4,186 - $32,9 11 $57,695
Water Infrastructure* - - - - - $33,052 $33,053
Wastewater Plant 6,216** 15,540 647** $2,265 - $171,671 $ 189,476
Wastewater
Infrastructure * $5,705 $5,705 - - - - -
Total 24,788 $61 ,970 54,312 $260,460 - $332,527 $654,957
* Infrastructure includes faci lities such as pumping stations and other equipment that utilize electricity.
**Gallons imputed from cost information obtained from municipal records.
The Bennington Fire Station is a relatively new building, located on River Street. It houses the Bennington Fire Department's vehicles, equipment, and support offices and facilities. A la rge meeting room on the third floor is used for public meetings by local government and other organizations. Although the largest of the town-owned buildings surveyed, much of the building is not used on a daily basis and it includes a large garage area that is not heated to the level of the rest of the structure. As a consequence, heating fuel use is relatively low, averaging 6,222 gallons of oil per year. Electricity use at the bu ilding is significant, although the total cost is below the space heating expense. The month ly average of 8,320 kwH is typically exceeded by 50 percent during summer months (and is generally consistently lower the rest of the year), indicating that air conditioning probably is driving a significant portion of the electricity demand during warm weather. The Fire Station also uses a small amount of propane (approximately 150 ga llons per year).
The "Blacksmith Shop" at t he corner of South and Elm Streets, is leased to the Bennington Downtown Alliance (BDA). It encompasses 3,600 square f_eet and includes offices for severa l people on the first and second floors, a meeting room, and a visito r welcome center/display area. As a renovated
7
DRAFT Bennington Town Plan Energy Element-August 7, 2017 historic building with a high heating cost per square foot, it can be assumed that there exist significant opportunities for weatherization. Electricity use for the building averages approximately 1,036 kwH per month.
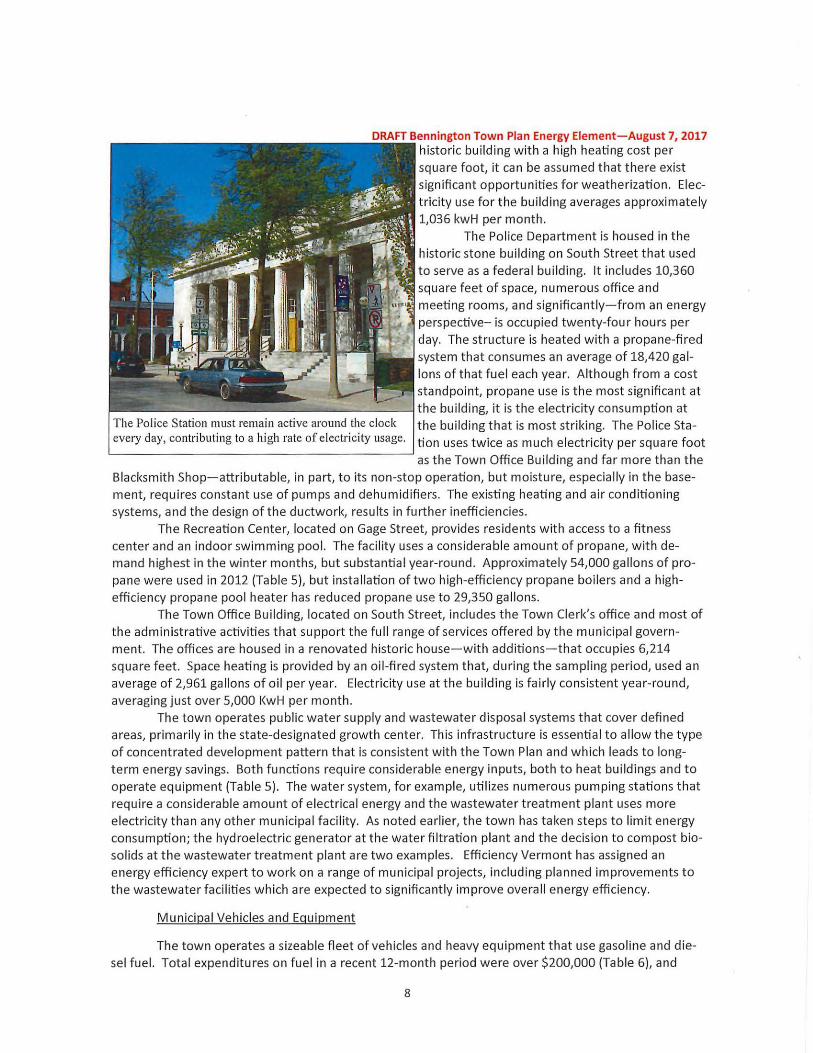
The Police Department is housed in the historic stone building on South Street that used
11
- · - - to serve as a federal building. It includes 10,360 square feet of space, numerous office and meeting rooms, and significantly- from an energy perspective- is occupied twenty-four hours per day. The structure is heated with a propane-fired system that consumes an average of 18,420 gallons of that fuel each year. Although from a cost standpoint, propane use is the most sign ificant at
"""'-,__..~---~the building, it is t he electricity consumption at The Police Station must remain active around the clock the building that is most striking. The Police Sta-every day, contributing to a high rate of electricity usage. tion uses twice as much electricity per square foot
as the Town Office Building and far more than t he Blacksmith Shop-attributable, in part, to its non-stop operation, but moisture, especially in the basement, requires constant use of pumps and dehumidifiers . The existing heating and air conditioning systems, and the design of the ductwork, results in further inefficiencies.
The Recreation Center, located on Gage Street, provides residents with access to a fitness center and an indoor swimming pool. The faci lity uses a considerable amount of propane, with demand highest in the winter months, but substantial year-round. Approximately 54,000 gallons of propane were used in 2012 (Table S), but installation of two high-efficiency propane boile rs and a highefficiency propane pool heater has reduced propane use to 29,350 gallons.
The Town Office Building, located on South Street, includes the Town Clerk's office and most of the administrative activities that support the full range of services offered by the municipal government. The offices are housed in a renovated historic house-with additions-that occupies 6,214 square feet. Space heating is provided by an oil-fired system that, during the sampling period, used an average of 2,961 gallons of oil per year. Electricity use at the building is fairly consist ent yea r-round, averaging just over 5,000 l<wH per month.
The town operates public water supply and wastewater disposal systems that cover defined areas, primarily in the state-designated growth center. This infrastructure is essential to allow the type of concentrated development pattern that is consistent with the Town Plan and wh ich leads to longt erm energy savings. Both functions require considerable energy inputs, both to heat buildings and to operate equipment (Table 5). The water system, for example, utilizes numerous pumping stations that require a considerable amount of electrical energy and the wastewater treatment plant uses more electricity than any other municipal facility. As noted earlier, the town has taken steps to limit energy consumption; the hydroelectric generator at the water filtration plant and the decision to compost bioso lids at the wastewater trea tment plant are two examples. Efficiency Vermont has assigned an energy efficiency expert to work on a range of municipal projects, including planned improvements t o the wastewater facilities which are expected to significantly improve overa ll energy efficiency.
Municipal Vehicles and Equipment
The town operates a sizeable fleet of vehicles and heavy equipment that use gasoline and diesel fuel. Total expenditures on fuel in a recent 12-month period were over $200,000 (Table 6), and
8
DRAFT Bennington Town Plan Energy Element- August 7, 2017
with rising costs that number ca n be expected to increase sign ificantly in the cu rrent and ensu ing years. Several municipal departments (Fire, Recreation, Senior Center, Planning and Code Enforcement), use relatively l ittle fuel for transportation and to operate their equipment, but others (Police, Highway, Water, and Wastewater) depend heavily on those fuels to accomplish their work.
Table 6. Fuel cost - municipal vehicles and equipment.
Department Inventory Annual Fuel Cost
Police 9 vehicles $54,607
Fire 6 trucks and one sedan $3,348
Recreation I pickup truck and 2 mowers $3,350
Senior Center 2 vans $2,904
Highway I 0 dump trucks, 9 pickup trucks 16 pieces heavy equipme nt $1 13,29 1
Water 6 pickup trucks, l dump truck, 2 pieces heavy equipment $16,293
Wastewater 4 pickup trucks 5 pieces heavy equipment $9,194
Planning and Code Enforcement l sedan $547
Total $203,534
The Bennington Pol ice Department has specific requirements for the types of veh icles it operates. The department has indicated a preference for SUVs because of their capacity and greater durability; use of hybrid SUVs and battery systems that allow for reduced idling might achieve significant fuel savings. Some limited patrols also are conducted on foot. The Highway Department, with its dump trucks, pickup trucks, and array of heavy equipment is the largest user of transportation fuel in the local government. Consequently, its costs w ill rise more rapidly than any other departm ent as gasoline and diesel fuel costs increase. The Water and Wastewater Departments also rely on vehicles and heavy equipment, t ogether spending over $25,000 per yea r on transportation f uels.
Streetlighti ng
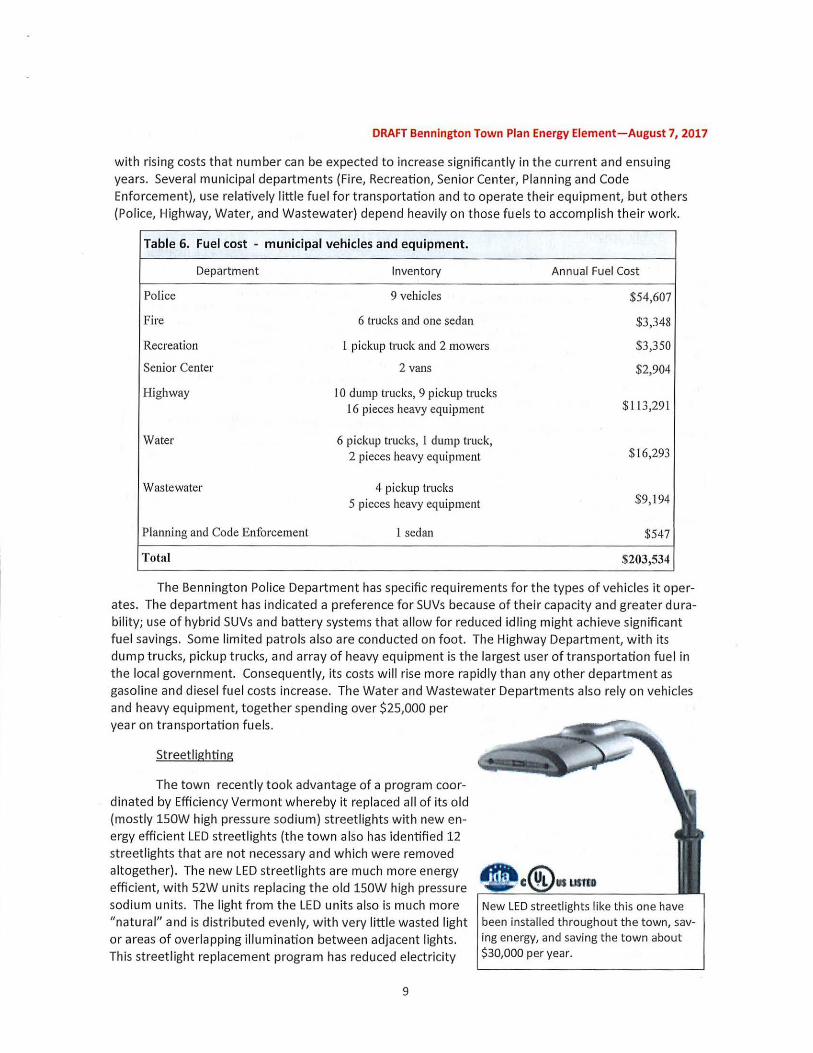
The town recently took advantage of a program coo rdinated by Efficiency Vermont whereby it replaced all of its old (mostly 150W high pressure sodium) streetlights with new energy efficient LED streetlights (the town also has identified 12 streetlights that are not necessary and which were removed altogether). The new LED streetlights are much more energy efficient, with 52W units replacing the old 150W high pressure sodium units. The light from the LED units also is much more "natural" and is distributed evenly, w ith very little wasted light or areas of overlapping illumination between adjacent lights. Th is streetlight replacement program has reduced electricity
9
New LED streetlights like this one have been installed throughout t he town, saving e nergy, and saving the town about $30,000 per year.
DRAFT Bennington Town Plan Energy Element-August 7, 2017
use by approximately 50% while saving the town over 20% on its streetl ighting bil l. The electric distribution company, Green Mountain Power, also benefits because it achieves comparable savings on the amount of electricity it must purchase.
Public Schools
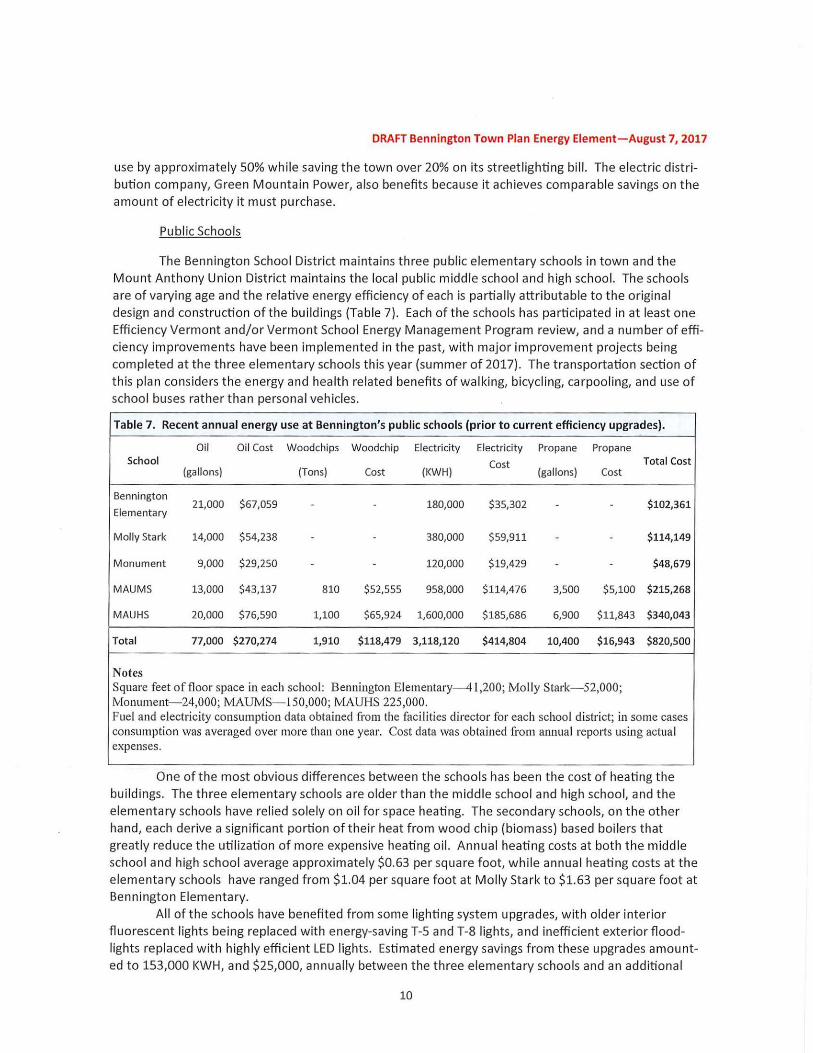
The Bennington School District maintains three public elementa ry schools in town and the Mount Anthony Union District maintains the loca l public middle school and high school. The schools are of varying age and the relative energy efficiency of each is partially attributable to the original design and construction of the buildings (Table 7). Each of the schools has participated in at least one Efficiency Vermont and/or Vermont School Energy Management Program review, and a number of efficiency improvements have been implemented in the past, with major improvement projects being completed at the three elementary schools this year (summer of 2017). The transportation section of this plan considers the energy and health related benefits of walking, bicycl ing, ca rpool ing, and use of school buses rather than persona l vehicles.
Table 7. Recent annual energy use at Bennington's public schools (prior to current efficiency upgrades).
Oil Oil Cost Woodchi ps Woodchip Electricity Electricity Propane Propane School Cost Total Cost
(gallons) (Tons) Cost (KWH) (gallons) Cost
Bennington 21,000 $67,059 180,000 $35,302 $102,361 - - - -
Elementary
Molly Stark 14,000 $54,238 - - 380,000 $59,911 - - $114,149
Monument 9,000 $29,250 - - 120,000 $19,429 - - $48,679
MAU MS 13,000 $43,137 810 $52,555 958,000 $114,476 3,500 $5,100 $215,268
MAU HS 20,000 $76,590 1,100 $65,924 1,600,000 $185,686 6,900 $11,843 $340,043
Total 77,000 $270,274 1,910 $118,479 3,118,120 $414,804 10,400 $16,943 $820,500
Notes Square feet of floor space in each school: Bennington Elementary-41,200; Molly Stark- 52,000; Monument- 24,000; l'v1AUN1S- 150,000; f\/1AUHS 225,000. Fuel and electricity consumption data obtained from the fac ilities director for each school district; in some cases consumption was averaged over more than one year. Cost data was obtained from annual reports using actual expenses.
One of the most obvious differences between the schools has been the cost of heating the bu ildings. The three elementary schools are older than the middle school and high school, and the elementary schools have relied solely on oil for space heating. The secondary schools, on the other hand, each derive a sign ificant portion of their heat from wood chip (biomass) based boilers t hat greatly reduce the utilization of more expens ive heating oi l. Annual heating costs at both the midd le school and high school average approximately $0.63 per square foot, while annual heating costs at the elementary schools have ranged from $1.04 per square foot at Molly Stark to $1.63 per square foot at Bennington Elementary.
All of the schools have benefited from some lighting system upgrades, with older interior fluorescent lights being replaced with energy-saving T-5 and T-8 lights, and ineffi cient exterior floodlights replaced w ith high ly efficient LED lights. Estimated energy savings from these upgrades amounted to 153,000 KWH, and $25,000, annually between t he th ree elementary schools and an additional
10
DRAFT Bennington Town Plan Energy Element-August 7, 2017
$18,000 in savings at the high school. The most recently constructed school building, Mount Anthony Union Middle School, also benefited from $52,000 in energy conservation incentives (light and heating controls and other measures) during its construction several years ago.
The current energy efficiency work being completed at each of the three elementary schools involve a range of improvements, including:
• Installation of efficient LP boilers and elimination of oil boi lers from the schools; • Upgraded contro l systems and new energy recovery ventilators; • Replacement of interior and exterior lighting with high efficiency LED fixtures; • Air sealing and other weatherization work.
Tota l cost savings to be realized as a resu lt of t hese improvements is expected to exceed $107,000 per year.
Hospital Campus
The Southwest ern Vermont Health Care's (SVHC) main campus in Bennington includes a fullservice 99-bed hosp ital, a 150-bed nursing facility, a medica l office building, cancer treatment center, and smaller buildings housing additional administrative and medical functions. SVHC currently is in the final stages of developing a plan for modernization of its facilities, and those plans include replacement of the aging oil boilers, along with other improvements that wi ll affect energy use on the campus. At the present time, SVHC consumes over 600,000 gallons of(# 6) heating oil per yea r and uses over of 12 million l<WH of electricity-clearly, medical facil ities are among the biggest energy users in most communities, and certainly in Bennington. Consider, for example, that SVHC annually uses as much oil as nearly 1,000 average houses and as much electricity as several thousand houses. Fortunately, SVHC recently has placed a strong emphasis on energy efficiency, having cooperated with Efficiency Vermont in conducting a comprehensive analysis of its facilities and considering alternative options for rep lacing its heating plant.
SVHC has commissioned severa l studies to evaluate alternative solutions fo r replacing the heating plant. That facil ity until recent ly was also used to provide energy for a large institutional laundry, but all laundering is now done off-site. In addition, the faci lity has converted to an electric chiller syst em, further reducing future need for energy derived from the heating plant. By removing the laundry fun ction, converting to an electric chiller system, and instal ling more efficient bo ilers that utilize compressed natural gas (CNG) rather than #6 heating oil (currently planned and permitted), SVHC has signifi ca nt ly reduced its overall energy demand.
In planning for the new centra l boiler pla.nt, it became clear that the most energy-efficient and cost-effect option, from an operationa l standpoint , is a syst em that uses a woodchip-based boiler with new CNG boilers as a backup. That option, however, is the most expensive to construct initia lly, even though an analysis completed for SVHC by the Biomass Energy Resource Center shows that, factoring in the cost of financing as well as expected rat es of increase in both oil and woodchips, the annual savings associated with the woodchip/oil system exceed $1 million annually.
SVHC has decided to install the new CNG-powered system, but to include a primary converti ble boiler to allow for woodchip use should that option become preferable based on future fuel costs. The site plan and buildings have been designed to accommodate the future change with minimal disruption or additiona l expense.
11
DRAFT Bennington Town Plan Energy Element-August 7, 2017
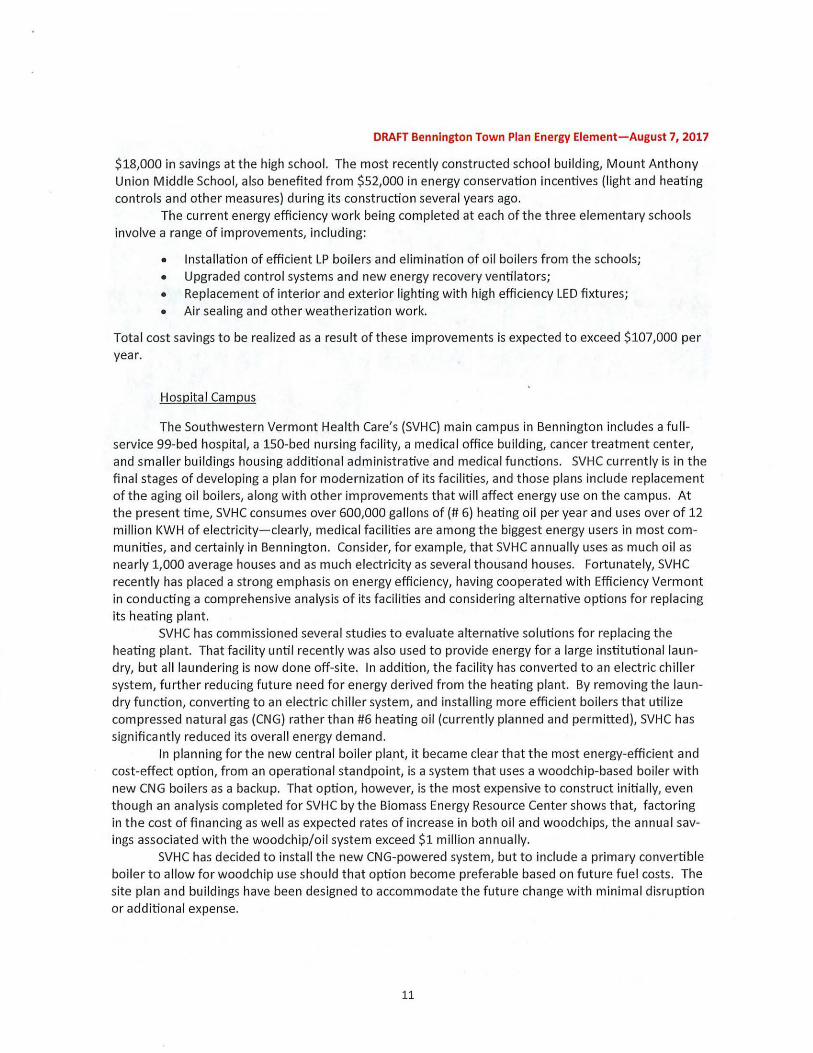
Forests cover most of Bennington County; the wood available from Bennington County and surrounding areas can provide energy for faci lities such as this 400 horsepower wood boiler system at Bennington College, which has reduced oi l consumption on the campus by more than 300,000 gallons per year.
College Campuses
Bennington is home to two college campuses, Bennington College and Southern Vermont Co llege (the smaller Community College of Vermont, the Vermont Technical Co llege, and the Northeast Baptist College, are considered for the purposes of this ana lysis to be part of the commercial sector). Colleges use a considerable amount of energy for heating residentia l and academic bu ildings, and to power the lights, computers, and other special equipment required at such institutions.
Several years ago Bennington College inst alled a biomass heating syst em to serve as the primary heat source for most of the college's buildings. Accord ing to a study of that system conducted by the Biomass Resource Center, the co llege uses approximate ly 4,000 tons of woodchips annually ($208,000 at current prices), displacing approximately 350,000 ga llons of oil use. Oi l boilers still are used as a supplement and back up t o the primary biomass system. The college has reported that the biomass system has been reliable and has saved several hundred thousand dollars per year in fuel costs. The college's faciliti es director has reported that the campus uses approximately 3,186,000 KWH of electricity per year, at a total cost of $552,000. Bennington College has worked w ith Efficiency Vermont to implement a wide array of measures t o reduce electric usage, and, in addition t o its biomass heating system, has constructed a new building that is highly energy efficient and which uses a geothermal heating system. Many of the older buildings on campus would benefit from air-sea ling, insu lation, and other weatherization work; projects that w ill be taken on as funding becomes available.
Southern Ve rmont College is a smaller campus (in terms of both student enrollment and buildings); with approximately half of the number of residentia l students, two main academic buildings, and a field house/gymnasium, so its energy consumption is significant ly less than that of Bennington Co llege. Because the campus does not have a biomass boiler system like Bennington College, it's heat energy must be provided by oil and propane gas - and the campus uses approximately 16,000 gallons of propane and 15,000 ga llons of oil per yea r. Annual electricity consumption amounts to 703,000 KwH per year at a cost of $130,000. Many of SVC's buildings are relatively new, although the main academic building (The Mansion) is a historic st one building that certainly could benefit from weatherization work-the design and historic nature of the building w ill complicate any such work, however.
12

DRAFT Bennington Town Plan Energy Element-August 7, 2017
Both colleges are interested in using local food in their dining ha lls, and both have considerable acreages of prime agricultura l land on their campuses, suggesti ng the potential fo r cultivation and processing of food at appropriate locations on their campuses.
Transportation Sector Energy Demand
The amount of energy used for transportation in Vermont has grown steadily and now accounts for more energy consumption than any other single sector. Although significant gains in the overall efficiency of the combined vehicle fleet have not been observed during this time period, improved technology has led to the production of some highly efficient vehicles. However, low fuel prices for gasoline and diesel (generally half to one-third of what consumers pay in many developed countries) have encouraged people to buy large fuel-inefficient vehicles; and even people with fuelefficient vehicles are able to drive more miles so may not actually be conserving much energy relative t o their SUV-driving neighbors.
Inexpensive energy in the transportation sector also has facil itated a land use pattern where people live relatively far from where they work, attend school, shop, and obtain other important services. Until the era of good roads and inexpensive fuel, most peop le lived in close proxim ity to urban and village centers where goods and services were close at hand. People who lived in the countryside had to be more se lf-sufficient, and indeed, most were involved in some type of agricultura l activity. Some people have observed that cheap and easy personal transportation has allowed people to live an urban lifestyle in rural locations.
The persona l automobile has come to be seen as an indispensable component of modern life, used to get to work, shopping, school, visiting friends, recreational and entertainment venues, and more. Consequently, the amount of fue l used-and dollars spent-to drive ourselves around has become an increasingly important issue for many people. The amount of money spent on gasoline by Bennington residents, for example, is approximately equa l to the amount of money spent on all fuels for home heating and electricity (Table 8). According to the 2010 US Census, the average Bennington worker commutes a tota l of approximately 15 miles per day; with over 8,000 resident workers, mostly commuting in single-occupancy vehicles, commuting alone accounts for over 100,000 miles per day of travel, and over 1.1 million ga llons per year (and $3,000,000) of gasoline consumption.
A number of electric and "plug-in hybrid" electric vehicles recently have been introduced to the market and some area residents and businesses have purchased them, although relatively few are
Table 8. Transportation fuel use (personal and commercial/industrial) estimates for Bennington.
Annual Miles Gallons Fuel Total Fuel
Driven (2) Used (3) Expenditures (4)
Number of Personal
Vehicles 12,118 169,652,000 6,786,080 $16,965,200
Comme rcial/Industrial Diesel Fuel Use 1,357,200 $4,071,600
Tota l 8,143,280 $21,036,800
( I ) 6,378 housing units * 1.90 average vehicles per unit (20 IO US Census). (2) Based on 14,000 miles per year per vehicle-current estimates, Federal Highway Administration. (3) Personal vehicle fuel (gasoline) consumption based on 25 miles per gallon average (US EPA);
commercial/industrial estimate based on 20% of persona l vehicle fuel consumption (Vermont Depariment of Publ ic Service data).
(4) Expenditures based on gasoline cost of$2.50/gallon and diesel fue l cost of$3.00/gallon.
13
DRAFT Bennington Town Plan Energy Element-August 7, 2017
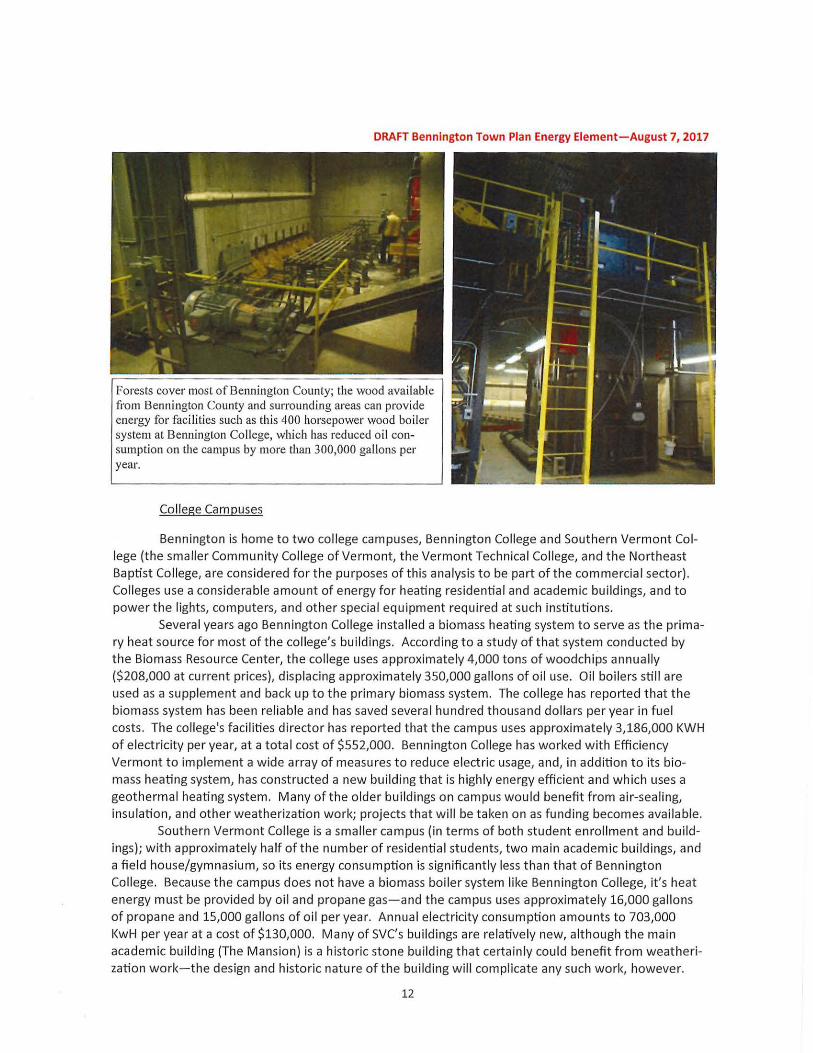
The Town of Bennington has installed several new highspeed electric vehicle charging stations in municipal parking lots in the downtown area. ~~~~~~~~~~~~~~~~~~~~~
available from local dealerships. The Town has obtained grant fund ing to install several EV charging stations in the downtown area, and they receive considerable usage.
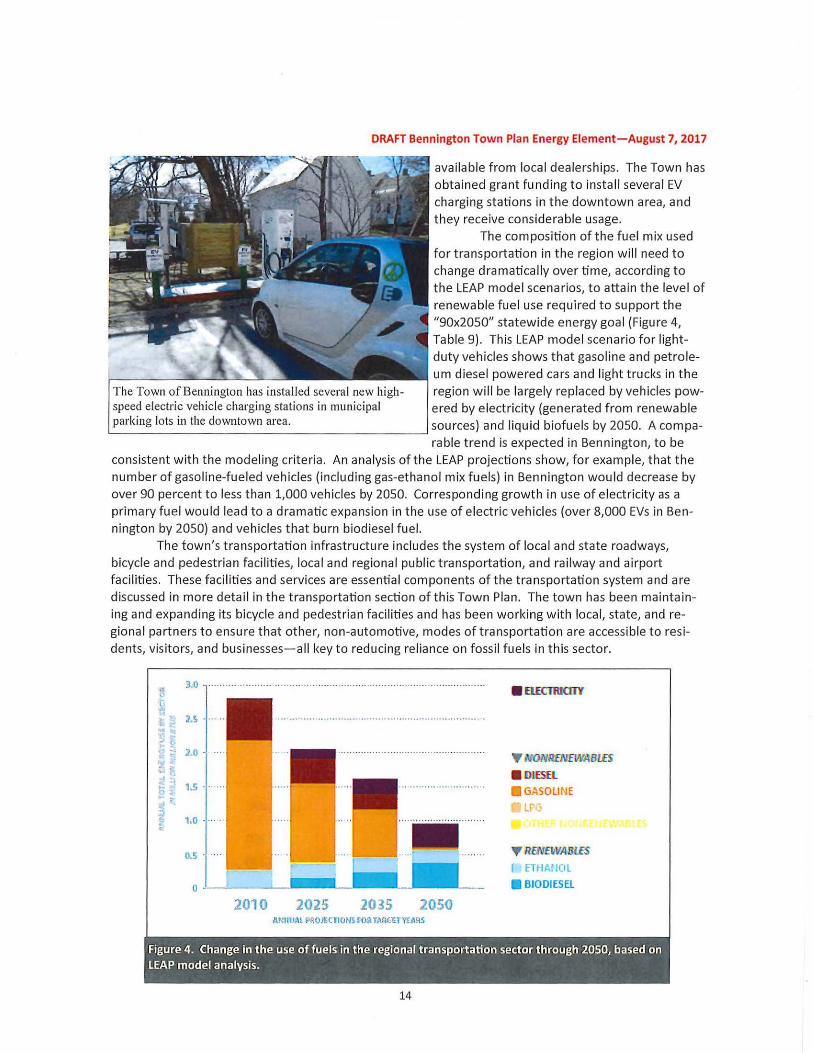
The composition of the fuel mix used for transportation in the region wi ll need to change dramatically over time, according to the LEAP model scenarios, to attain the level of renewable fuel use requ ired to support the "90x2050" statewide energy goal (Figure 4, Table 9). This LEAP model scenario for lightduty vehicles shows that gasoline and petroleum diesel powered cars and light trucks in the region will be largely replaced by vehicles powered by electricity (generated from renewable sources) and liquid biofuels by 2050. A com pa-rable trend is expected in Bennington, to be
consistent with the modeling criteria. An analysis of the LEAP projections show, for example, that the number of gasoline-fueled veh icles (including gas-ethanol mix fuels) in Bennington wou ld decrease by over 90 percent to less than 1,000 veh icles by 2050. Corresponding growth in use of electricity as a primary fuel would lead to a dramatic expansion in t he use of electric vehicles (over 8,000 EVs in Bennington by 2050) and vehicles that burn biodiesel fuel.
The town's transportation infrastructure includes t he system of loca l and state roadways, bicycle and pedestrian facilities, loca l and regional public t ransportation, and railway and airport faci lities. These facil ities and services are essential components of the transportation system and are discussed in more detai l in t he transportation section of th is Town Plan. The town has been maintaining and expand ing its bicycle and pedestrian facil ities and has been working with local, state, and regional partners to ensure that other, non-automotive, modes of transportation are accessible to residents, visitors, and businesses- all key to reducing reliance on fossil fuels in this sector.
3 0 .......... .......... . ........ .. .... ..... .. ..... .. ......... .... ........ .................. .. ..
1.5
1.0
0 L L_l__._L 2010 2025 2035
-... ....... 2050
• llfCTRIC11Y
Y ill'O.NRINIWABlfi
• otBEL
•GASOLINE
8LP0 OTHffi UOUREUEWASLES
Y RINnVABlES
t ETHAtJOL
.BIODIESEL
Figure 4. Change in the use of fuels in the regional transportation sector through 2050, based on LEAP model analysis.
14

DRAFT Bennington Town Plan Energy Element-August 7, 2017
Table 9. Fuel use and number of vehicles using each fuel as a primary energy source through 2050 LEAP model projections (Vermont Energy Investment Corporation.
2015 2025
Fuel Type #Vehicles Total Fuel
#Vehicles Total Fuel
Demand Demand
Gasoline 7,177 3,444,902 6,859 2,743,563
(gallons)
Ethanol 981 654,296 761 434,733
(gallons)
Electricity 36 109,027 572 1,526,377
(KwH)
Diesel 300 102,754 207 62,193
{gallons)
Biodiesel 23 8,746 128 43,732
(gallons)
Notes: Although, vehicle numbers for base year differ from current estimates (Table 8) because projections are derived from statewide "LEAP" model data-trends are consistent. The model assumes no overall growth in total miles driven. Ethanol includes mix with gasoline and vehicle numbers can be combined for gas/ethanol.
Loca l Energy Production
The vast majority of energy used in Bennington is imported from outside the town (and generally from outside the state and nation) in the form of gasoline, oil, propane, and electricity. Some of the imported electricity is generated from renewable sources, primarily electricity obtained from hydroelectric generating facilities in Quebec and Labrador (via utility contracts with Hydro Quebec). Some energy production currently occu rs in Bennington, all of which is electricity generated from renewable sources including a 360 KW capacity hydroelectric faci lity on the Wa lloomsac River and roughly 3 MW of sola r capacity in small private and moderate-sized commercial photovoltaic systems. For current generation sites and capacities, refer to the Community Energy Dashboard:
http://www. vtenergydash boa rd.org/my-comm unity /ben n ington/statistics.
15
A local energy entrepreneur re
established the hydroelectric gen
erating capacity at the "Paper
Mill" site along the Walloomsac
River in Bennington. The facil ity
is rated at 360KW generating
capacity and produces e lectricity
with greater consistency and
reliability than solar or wind
facilit ies.
DRAFT Bennington Town Plan Energy Element-August 7, 2017
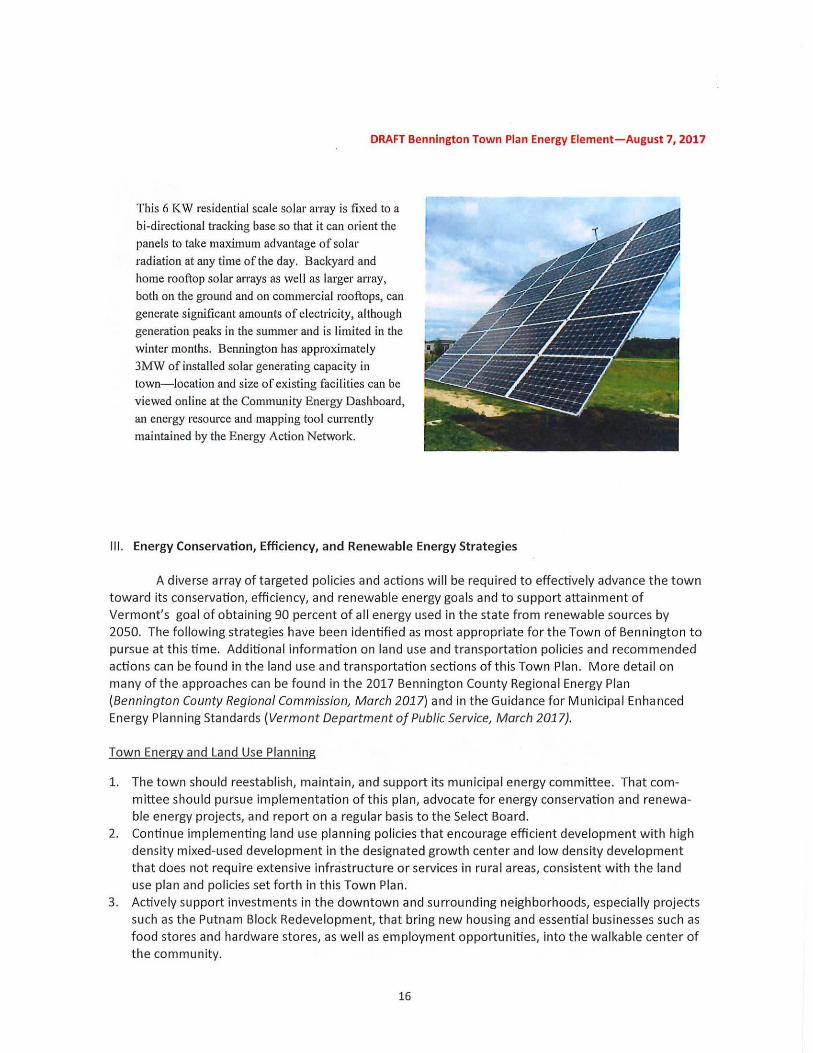
This 6 KW residential scale solar array is fixed to a
bi-directional tracking base so that it can orient the
panels to take maximum advantage of solar
radiation at any time of the day. Backyard and
home rooftop solar arrays as well as larger array,
both on the ground and on commercial rooftops, can
generate significant amounts of electricity, although
generation peaks in the summer and is lin1ited in the
winter months. Bennington has approximately
3MW of installed solar generating capacity in
town- location and size of existing facilities can be
viewed online at the Community Energy Dashboard,
an energy resource and mapping tool currently
maintained by the Energy Action Network.
Ill. Energy Conservation, Efficiency, and Renewable Energy Strategies
A dive rse array of t argeted policies and actions will be required to effectively advance the town t oward its conservation, effi ciency, and renewable energy goa ls and to support attainment of Ve rmont's goa l of obtaining 90 percent of all energy used in the state from renewable sources by 2050. The following strategies have been identified as most appropriate for the Town of Bennington to pursue at this time. Additional information on land use and transportation policies and recommended actions can be found in the land use and transportation sections of this Town Plan. More detail on many of the approaches can be found in the 2017 Bennington County Regional Energy Plan (Bennington County Regional Commission, March 2017) and in the Guidance for Municipal Enhanced Energy Planning Standards (Vermont Department of Public Service, March 2017).
Town Energy and Land Use Planning
1. The town shou ld reestablish, maintain, and support its municipal energy committee . That committee should pursue implementation of this plan, advocate for energy conservation and renewable energy projects, and report on a regu lar basis to the Select Board.
2. Continue implementing land use planning policies that encourage effi cient development with high density mixed-used deve lopment in the designated growth center and low density development that does not require ext ensive infrastructu re or se rvices in rural areas, consistent with the land use plan and policies set forth in this Town Plari.
3. Actively support investments in the downtown and surrounding neighborhoods, especia lly project s such as the Putnam Block Redevelopment, that bring new housing and essential businesses such as food sto res and hardware stores, as well as employment opportunities, into the walkable center of the community.
16
DRAFT Bennington Town Plan Energy Element-August 7, 2017
4. All developments should be planned to take advantage of opportunities for utilization of solar energy.
Residential Sector Energy Conservation and Efficiency
5. The town should routinely provide information on the state mandated Residential Building Energy Standards to all building permit applicants, and take steps to require and verify that all new residential building meets those Standards.
6. The town should promote use of the "Energy Star'' building performance rating system and related building practices that limit energy consumption in new and remodeled homes, and promote the use of Vermont's residential building energy label/score.
7. Energy education programs sponsored by Efficiency Vermont, the Bennington County Regional Commission, and other organizations-particularly those that focus on home weatherization improvements and energy savings-should be supported and widely publicized.
8. Programs that provide funding for weatherization of the homes of lower-income residents, including the Weatherization Assistance Program offered through the Bennington Rutland Opportunity Council (BROC), should be supported.
9. Work with NeighborWorks of Western Vermont (NWWVT) t o widely publicize their "Heat Squad" home energy improvement programs, including low-cost audits and assistance with construction and financing.
10. Efforts to assist homeowners to switch to alternative space heating systems, including stoves and systems that burn wood and wood pellets, as well as air source heat pumps, should be supported. Woody biomass fuels can be sourced locally and heat pumps are highly efficient systems powered by electricity that can be generated from renewable energy sources.
11. A high percentage of Bennington's housing stock are rental properties, and many of those in the center oftown would benefit from energy audits, weatherization work, and installation of alternative heating systems, especially air source heat pumps. The town shou ld work w ith the BCRC to organize and hold another walk-thorough and information session for owners of residential rental properties.
Commercial and Industria l Sector Energy Conservation and Efficiency
12. Obtaining feedstock for heating systems from local sources supports regiona l economic development and renewable energy goals. The town shou ld work with the regional development corporation, the Bennington County Sustainable Forestry Consortium, and other organizations to support existing forest products businesses and new businesses involved in managing forest lands, transporting and processing woody biomass for home, business, or institutional applications, and should assist with locating sites for manufacturing facilities (especially production of wood pellets).
13. The town should cooperate in effo rts to reach out to electrical contractors and others to provide information about opportunities to se ll, insta ll, and service heat pumps. Air source heat pumps are an efficient and cost-effective way to reduce reliance on oil and/or propane fuels in many homes and businesses. Bennington also is well-suited for new geothermal heat pump systems-an option that may be particula rly viable for new construction and larger commercial/industria l projects. Developers of such projects should be made aware of the value of geothermal systems and efforts to support development of business that provide geothermal system and support (well drillers, excavators, etc.) and coordination between those businesses and electrical contractors shou ld be supported.
17

DRAFT Bennington Town Plan Energy Element- August 7, 2017
14. All new commercial and industrial buildings must meet the state mandated Commercial Bui lding Energy Standards. The town should encourage developers of commercial properties to consider using the "Stretch Codes," mandated through Act 250, in any new commercial construction.
15. Commercial and industria l business owners should be encouraged to work with Efficiency Vermont and energy service companies to assess the potential for converting all or part of their space heating and cooling to efficient air source heat pumps.
16. Business owners should be encouraged to obtain the services of an energy auditor who can assist in identifying measures to adjust operations to minimize energy use.
17. Employees should consider alternative ways of commuting to work and employers should provide facilities to encourage bicycling, wa lking, and carpooling. Loca l business groups and the town should promote participation in the annua l "Way to Go" commuter program.
18. Business shou ld be provided information about electric vehicle charging stations and encouraged to install such facilities to support employees who would like to use electric vehicles for commuting.
19. The town should make sure that incentives offered t hrough Efficiency Vermont are widely publicized to businesses.
Energy Conservation and Efficiency in the Transportation Sector
20. The town shou ld continue to improve and maintain the town's network of off-road bicycle and pedestrian facilities, identifying safety improvement needs, gaps between important destinations, and other needs. The town shou ld continue to seek funding through the VTrans Bicycle -Pedestrian and Transportation Alternatives programs, as wel l as from local funds and other sources to plan and implement those projects.
21. The town should ensure that local and state roadway construction and maintenance projects include accommodations for pedestrian and bicycle travel, incorporating "Complete Streets" principles whenever possible. The town should continue to work wit h the BCRC to plan and implement modifications to local streets to make them more bicycle and pedestrian friendly and to present more attractive streetscapes for all residents and users of the transportation system.
22. The town should work with the Green Mountain Community Network {GMCN) to support wider uti lization of the loca l public transportation system. Employers, shopping centers, and service centers shou ld be contacted and asked to provide information about GMCN routes and services to employees, customers, and clients.
23. Outreach should be conducted through the loca l school system to encourage greater use of school buses {rather than individual cars) and wa lking and biking to school.
24. Actively support expansion of intercity bus travel, including the new d irect bus connection to the Amtrak rai l station in Rensse laer. Work with t he Bennington Area Chamber of Commerce and local businesses to ensure that the services are well publicized and that stop and transfer locations are convenient, comfortable, and attractive.
25. Continue to participate in rai l planning projects to promote commercial and industrial development that can use rail for freight shipments. Support expenditure of transportation funds on projects to maintain and upgrade rai l lines, bridges, crossings, and other critical infrastructure.
26. Actively promote electric vehicle use through cooperation with Drive Electric Vermont and other organizations. Encourage loca l auto dealers to supply electric and plug-in hybrid electric vehicles.
27. Insta ll EV charging stations in public parking lots and encourage businesses, to instal l charging stations for their employers and customers. The Bennington Area Chamber and other organizations shou ld highlight the ava ilability and location of EV infrastructure in the community through their websites and other methods.
18

DRAFT Bennington Town Plan Energy Element-August 7, 2017
28. Promote the Go Vermont website to support carpooling, ridesharing, and other opportunities. Support efforts to broaden participation in the "Way to Go" alternative commuting program.
29. Large new commercial, industrial, and multifamily developments should be required to provide EV charging stations at convenient locations, and to provide a location for a public transportation stop.
Local Food Systems
30. Support efforts to develop a more robust local food and agricultural system; participate in efforts to match food producers with large institutional and other consumers.
Municipal Government Energy Practices
31. Pursue energy audits at municipal buildings focusing on weatherization work at older buildings such as the town office building and old blacksmith shop and heating and electrical upgrades at the police station.
32. Consider alternative energy systems such as a small biomass district heat project to heat public buildings in the downtown, solar hot water production at the recreation center, and a demonstration project with liquid biofuels for some town equipment. Assess the potential for deploying air source heat pumps for heating and cooling in all municipal buildings.
33. Consider purchase of more fuel efficient vehicles, including electric vehicles where practical, for all departments; hybrid sedans and SUVs might be particularly effective for the police department, as would new anti-idling technologies.
34. Publicize the successful LED streetlight conversion and encourage business owners to make similar changes on their external lights.
Energy Use in Schools and Institutions
35. The public schools should regularly participate in the School Energy Management Program reviews and continue to work with Efficiency Vermont to obtain incentives for weatherization and efficiency improvements.
36. All schools should promote and encourage the use of school buses and walking and biking to school-including participation in the Safe Routes to Schools program-to reduce reliance on single-passenger vehicle transport.
37. The Southwestern Vermont Medical Center should continue to work with Efficiency Vermont to improve energy conservation at its campus and should continue to move toward utilization of locally sourced woody biomass fuel for use in its new central boiler plant.
38. Southern Vermont College should investigate development of a central biomass based district heating system for its campus.
General Electricity Conservation and Efficiency Measures
39. Support integration of advanced energy storage in the area through cooperation with utilities and review of town plan policies and land use standards.
40. Support full integration of "smart grid" technology throughout the town and region and use of "smart rate" pricing plans.
19
DRAFT Bennington Town Plan Energy Element- August 7, 2017
41. Cooperate w ith Green Mountain Power and VELCO to ensure that areas planned for new renewable energy generation are consistent with the capacity of the grid infrastructure and to ensure that any upgrades needed are implemented.
Renewab le Energy Development
Biomass and Liquid Biofuels
42. The town should support efforts to develop appropriate cost-effective biomass energy resources and help promote combined heat and power biomass projects.
43. The town shou ld support efforts to help farmers produce oil seed crops and liquid biofuels that can be used to operate equipment and machinery on their fa rms, and potentially supply other businesses and the town with renewable fu els.
Hydroelectric Generation
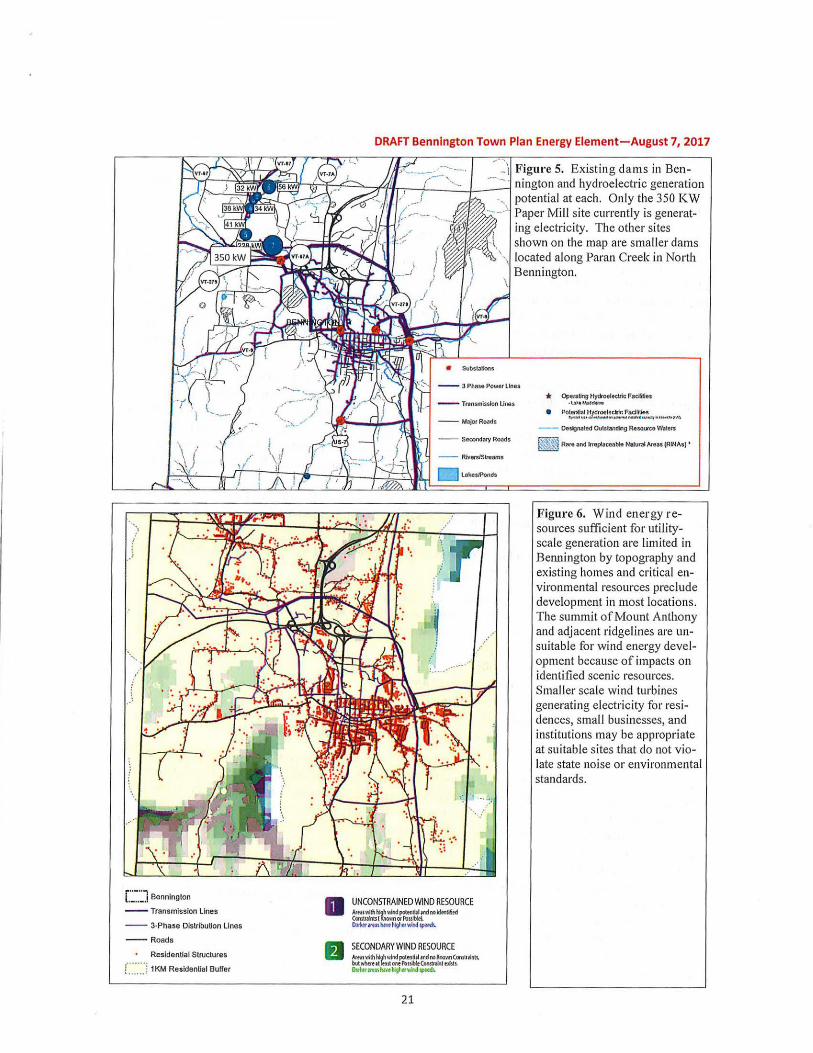
44. The town has added hydroelectric generation equipment at its water supply facility and has supported deve lopment of the 350 KW hydro generating faci lity at the "Paper Mill" dam site on the Wa lloomsac River. The town shou ld conti nue t o look for opportunities to develop small hydro projects to support efficient municipal operations. Additiona l commercia l-scale hydroelect ric generation is limited due to the fact that the only existing dam sites (other than the Paper Mill dam) are located on Paran Creek in North Bennington Village, between Lake Pa ra n and the Wa lloomsac River (Figure 5). The town supports efforts by North Benn ingt on, Bennington College, and involved property owners to develop the hydro potential at that series of small dams on Paran Creek.
Generation from Wind Resources
45. Bennington has limited potential for utility-scale wind energy development, as areas with sufficient access to cons istent wind are restricted primarily to higher elevations on Mount Anthony and adjacent ridgelines. These areas are relatively close to established residences, and Mount Anthony has been specifically identified as a criti cal scenic resource for the town in its Scenic Resource Inventory. Deve lopment in that area would have a profoundly negative impact on critical v iewsheds throughout t he community, as the natura l profile of the mountain forms an icon ic backdrop from both in-town and rural va lley locations. The town has consistently objected to and testified aga inst development, including construction of larger telecommunication towers, on and near the summit and ridgeline of Mount Anthony. Because no other locations in Bennington have suitable w ind resource, infrastructure avai lability, or are free from significa nt environmenta l constra ints (Figure 6), no utility-scale (100 KW capacity or greater) wind energy facilities should be located n the town. Smaller sca le wind projects, including residential-scale turbines (generally less than 10 KW) and turbines that may be installed at farms, institutions (such as college campuses), or sma ll businesses, up to 100 KW, may be appropriate as long as noise from the turbines does not adversely affect neighboring residential properties and as long as they are not prominently visible from any town-identified historic district.
Solar Energy Generation
46. The town strongly supports the deve lopment of sma ll-scale (150 KW capacity or less) electricity generation from solar energy at homes, businesses, schools, and other institutions. The town particularly encou rages so lar energy development, of any sca le, on build ing rooftops.
20
DRAFT Bennington Town Plan Energy Element-August 7, 2017
----- ~-~\ Figure 5. Existing dams in Ben-rJit1~~~~~~-(;T,~:::~7'-1J/r.---,{___:::::_:j_~--::_:_- . nington and hydroelectric generation
-, potential at each. Only the 350 KW ___ .\ Paper Mill site currently is generat-
•..... , L. ..•. I Benninglon
-- Transmission Lines
-- 3-Phase Dislribulion Lines
- - Roads
Resldenlial Slruclures
c:.-::1 1KM Resldenlial Buffer
D
% ing electricity. The other sites -l, shown on the map are smaller dams
)
\ located along Paran Creek in North Bennington.
/
UNCONSTRAINED WIND RESOURCE rc:~~~~e:':JndMkttn~fd °"""""''""'!Mgl-"vMdsp<<dl.
21
• Operating Hy<totltctric Fadities •la.111.\i'"-""'
e Pclentlal Hyd1oeleciic Fadlities ....,.Q,_"'\_ fW' _ _., .. ~~-..i\I\\
-- Oe~naled Outslamfing Resource V/alets
"'1ii~ ~ Raia and lrteptaccable Nalural A.leas (RINA•) •
Figure 6. W ind energy resources sufficient for utilityscale generation are limited in Bennington by topography and existing homes and critical environmental resources preclude development in most locations. The summit of Mount Anthony and adjacent ridgelines are unsuitable for wind energy development because of impacts on identified scenic resources. Smaller scale wind turbines generating electricity for residences, small businesses, and insti tutions may be appropriate at suitable sites that do not violate state noise or environmental standards .

DRAFT Bennington Town Plan Energy Element-August 7, 2017
Any larger scale so lar development shall be subject to the following policies, map, siting guidelines, and the town's solar facility screening ordinance.
Solar Energy Faci lity Siting Policy and Map
The So lar Energy Resource Map (Figure 7) shall serve as a guide for developers wishing to identify land suitable for solar energy generation facilities within the Town of Bennington. This map identifies sites which have been determined by the Town of Bennington, through official action of the Select Board, to be suitable for solar facilities and sites which are preferred sites for solar energy generating facilities. Only sites identified as preferred sites on this map or located in a preferred area as defined in this section of the Town Plan may be developed with solar generating facilities in excess 150 l<W of rated capacity.
The Solar Energy Resource Map (Figure 7) shall be used in concert with the Town's Screening of Solar Facilities Ordinance and the Solar Facility Siting Guidelines (incorporating the Community Standards and Siting Criteria) included in this section of the Town Plan to direct the development and design of solar facilities. Although solar energy development at these preferred sites and locations is an appropriate land use, all such development shall be carefully planned to limit adverse impacts to neighboring properties and to public viewsheds, giving consideration to The Town's Screening of Solar Facilities Ordinance and Solar Facility Siting Guidelines.
The sites indicated on this map as suitable for solar energy development were selected after a thorough analysis of availab le geographic data, including an assessment of access t o solar energy as well as environmental, aesthetic, cultural, and related regulatory constraints. State-identified environmental constraints are discussed in more detail in the Bennington County.Regional Energy Plan, and include the following resource areas:
• Class 1 and 2 wetlands, verna l pools, and hydric soi ls; • Mapped river corridors and FEM A-defined floodways; • Natural communities and rare, threatened, and endangered species; • Federal wilderness areas; • Important agricultura l soils; • FE MA-defined special flood hazard areas; • Lands protected for conservation purposes; • Deer wintering areas; and • State-identified high priority "Conservation Design Forest Blocks.
Lands with one or more of the above constraints were excluded from consideration as preferred sites, while areas that did not have any state-identified constraints were carefully analyzed by the Town, and sites most likely to comply with the Town Plan's Community Standards and Siting Standards for Solar Facilities were identified as potentially suitable. Specifically excluded from consideration as sites suitable for development were land located in the Forest or Agriculture land use districts, privately owned land in the Rural Conservation land use district, land within 100 feet of public roads, land within 0.25 miles of any of the three covered bridges, Willow Park, and land within scenic viewsheds identified in the Scenic Resource Inventory of Bennington. Potentially suitable sites were determined to be appropriate for development only if they were likely to be developed with solar generating facilities based on property size, landowner interest, proximity to infrastructure, and community benefit.
Approximately 540 acres of land are shown on the Solar Energy Resource Map as being suitable and preferred for development of these facilities. This acreage, together with projected future development on rooftops and other preferred locations, far exceeds the acreage needed to meet the
22

DRAFT Bennington Town Plan Energy Element-August 7, 2017
town's so lar energy generation target, 25 MW of capacity by the year 2050, identified in the Benningt on County Regional Energy Plan. Moreover, that targeted level of generation includes residential, rooftop, and other small-scale generation that is expected to account for up to 10 MW of capacity by 2050. Therefore, all locations other than these mapped areas and land specifi ca lly identified as preferred areas in this Town Plan, are considered unsuitable for so lar generating facilities in excess of 150 KW of rated capacity.
Solar Electricity Facility Siting Guidelines
The term "so lar facility" sha ll have the following meaning: a solar electricity generation and transmission facility w ith a 150kW{AC) or greater capacity, including all on-site and off-site improvements necessary for the development and operation, and on-going maintenance of t he facility.
The Town of Bennington has developed community standards and siting standards for the development of solar facilities for reference and use by faci lit y developers and local property owners and for consideration in Section 248 proceedings (30 VSA §248). These standards are set forth below. In addition, The Bennington Planning Commission, in consultation w ith the Bennington County Regional Commission, has identified and mapped {Figure 7) those areas of Bennington that are most suitable for sola r facility development based on facility siting requirements and municipal energy, conservation, and development policies and objectives set forth in the Bennington Town Plan, the Bennington Screening of So lar Facilities Ordinance, and t he Bennington Land Use and Development Regulations.
Pursuant to 30 VSA Sec. 248, prior to t he construction of a solar facil ity, the VT Public Utility Commiss ion {PUC) must issue a Certificate of Public Good. A Section 248 review addresses environmental, economic, and social impacts associated with a particula r project, similar to Act 250. In making its determ ination, the PUC must give due cons ideration to the recommendations of municipal planning commissions and their respective plan{s). Accordingly, it is appropriate that Bennington's Town Plan address these land uses and provide guidance to town officia ls, regulators, and faci lity developers.
The Town of Bennington may participate in the Public Utility Commiss ion's review of new and expanded generation facilities to ensure that loca l energy, resource conservation, and development objectives are identified and cons idered in proposed utility deve lopment. This may include joint participation and collaboration with other affected municipalities and the Bennington County Regional Commission for projects that may have significant regiona l impact. It is acknowledged that the PU C's primary focus is on administering state publ ic policy and regulating actions that are directed at ensuring that utility services promote the general good of the state.
The Planning Commission, in consu ltation with the Bennington Select Board, should develop guidelines t o direct loca l participation in Section 248 proceedings related t o sola r facilities located in Bennington or in neighboring communities which may affect the t own. The guidelines should reflect leve ls of participation or formal intervention in relation to the type, location, scale, operation, and magnitude of a proposed project, and its potential benefits, detriments to, and impacts on the community.
Community Standards
The following community standards are to be considered in undertaking municipal solar elect ricity projects and programs, in updating Bennington's Land Use and Development Regu lations to address solar facilities subject to loca l regu lation, and in the review of new or upgraded solar facilities by the Town of Bennington and the Public Service Board {Section 248 review).
• Plan Conformance: New solar facilities and proposed system upgrades should be consistent w ith the Vermont Comprehensive Energy Plan, the Vermont Long-Range Transmission Plan, and utilities Integrated Resource Planning (IRP).
23

DRAFT Bennington Town Plan Energy Element-August 7, 2017
• Benefits: A demonstrated statewide public need that outweighs adverse impacts to local residents and resources must be .documented for municipal support of new so lar facilities located within or which may otherwise affect Bennington. Facility development must benefit Town of Bennington and State residents, businesses, and property owners in direct proportion to the impacts of the proposed development.
• Impacts: New solar facilities must be evaluated for consistency with community and regional development objectives and sha ll avoid undue adverse impacts to significant cultura l, natural, and scenic resources and aesthetic values identified by the community in the Bennington Town Plan and the Scenic Resources Inventory. When evaluating impacts of a proposed solar facility under the criteria set forth in this Town Plan, the cumulative impact of existing solar facilities, approved pending solar facilities and the proposed solar facility shall be considered. It is explicitly understood that a proposed solar facility which by itself may not have an adverse impact may be deemed to have an adverse impact when considered in light of the cumulative impacts of the proposed so lar facility and existing solar facilities and pending already approved solar facilities.
• Decommissioning: All facility certificates shall specify conditions for system decommissioning, in cluding required sureties (bonds) for facility removal and site restoration to a safe, useful, and environmentally stable condition. All hazardous materials and structures, including foundations, pads and accessory structures, must be removed from the site and safely disposed of in accordance with regu lations and best practices current at the time of decommissioning
Solar Facility Siting Criteria
Bennington supports development of solar energy generation facilities consistent with the policies and guidelines set forth in this plan. It recognizes that financial considerations require projects to be located in close proximity to electric power lines capable of distributing the load proposed to be generated and to have conven ient access from major transportation networks for construction. However, the town desires to maintain the open landscape and scenic views important to Bennington's sense of place, tourism economy, and rural cu ltural aesthetic. Not all solar facilities proposed can meet this st andard. Projects must meet the following criteria in order to be supported by this Town Plan:
• Siting Requirements: New solar facilities shall be sited in locations that do not adversely impact the community's traditional and planned patterns of growth, of compact (downtown/village) centers surrounded by a rural countryside, including working farms and forest land. Solar facilities sha ll, therefore, not be sited in locations that adversely impact scenic views, roads, or other areas identified in the Scenic Resources Inventory, nor shall solar facilities be sited in locations that adversely impact any of the following scenic attributes identified in the Scenic Resource Inventory: views across open fields, especially when those fields form an important foreground; prominent ridgelines or hillsides that can be seen from many public vantage points and thus form a natural backdrop for many landscapes; historic buildings and districts and gateways to historic districts; and, scenes that include important contrasting elements such as water. The impact on prime and statewide agricultural so ils curren.tly in production sha ll be minimized during project design.
• Preferred Areas: The following areas are specifi cal ly identified as preferred areas for solar facilities, as they are most likely to meet the siting requirements:
0 Roof-mounted systems; 0 Systems located in proximity to existing large scale, commercial or industrial buildings;
24
DRAFT Bennington Town Plan Energy Element-August 7, 2017
0 Proximity to existing hedgerows or other topographical features that naturally screen the entire proposed array;
0 Reuse of former brownfields; 0 Facilities that are sit ed in disturbed areas, such as gravel pits, closed landfills, or former
quarries; 0 Areas specifically identified as suitable for solar facilities on the Solar Energy Resource Map
(Figure 7).
• Prohibited (Exclusion) Areas: In addition to those areas that do not meet the siting requirements set forth above, development of so lar generating facilities shall be excluded from (prohibited within), and shall not be supported by the Town, in the following locations:
0 Floodways shown on Flood Insurance Rate Maps (FIRMs); 0 Fluvial erosion hazard areas (river corridors) as shown in the Town of Bennington Land Use
and Development Regulations; 0 Class I or II wetlands; 0 A location that would significantly diminish the economic viability or potential economic
viability of the town's working landscape, including productive forest la nd and primary agricultural soils (as defined in Act 250 and as mapped by the U.S. Natural Resource Conservation Service);
0 Rare, threatened, or endangered species habitat or communities as mapped or identifi ed through site investigation, and core habitat areas, migratory routes and travel corridors;
0 Ridge lines: Mount Anthony, Whipstock Hill, Ba ld Mountain (Green Mountains); 0 Steep slopes (>25%) 0 Surface waters and riparian buffer areas (except for stream crossings); 0 Topography that causes a facility to be prominently visible against the skyline from public
and private vantage points such as roads, homes, and neighborhoods; 0 A site in proximity to and interfering with a significant viewshed identified in the Scenic
Resource Inventory; 0 A site on which a solar facility project cannot comply with Bennington's prescribed siting
and screening standards, including the screening requirements set forth in Bennington's Screening of Solar Facilities Ordinance;
0 A site that causes adverse impacts to historical or cu ltural resources, including state or federal designated historic districts, sites and structures, and loca lly significant cultural resources identified in the municipa l plan. Prohib ited impacts to historica l and cultural resources include:
* removal or demolition; * physical or structural damage, significant visua l intrusion, or threat to the use; * significant intrusion in a rural historic district or historic landscape with a high de
gree of integrity; * significant visual intrusion into a hillside that serves as a backdrop to a historic site
or structure; * creating a focal point that would disrupt or distract from elements of a historic
landscape; * a significant intrusion in a rural historic district or historic landscape that has a high
degree of integrity; * impairing a vista or viewshed from a historic resource that is a significant compo
nent of its historic character and history of use; * visually overwhelming a historic setting, such as by being dramatically out of scale;
25

DRAFT Bennington Town Plan Energy Element-August 7, 2017
* isolating a historic resou rce from its historic setting, or introducing incongruous or incompatible uses, or new visual, audible or atmospheric elements.
• Mass and Scale: Except for projects located on preferred sites, so lar fac ilities larger than 10 acres, ind ividually or cumu latively, cannot be adequately screened or mitigated to blend into the municipa lity's landscape and are, therefore, explicit ly prohibited.
26
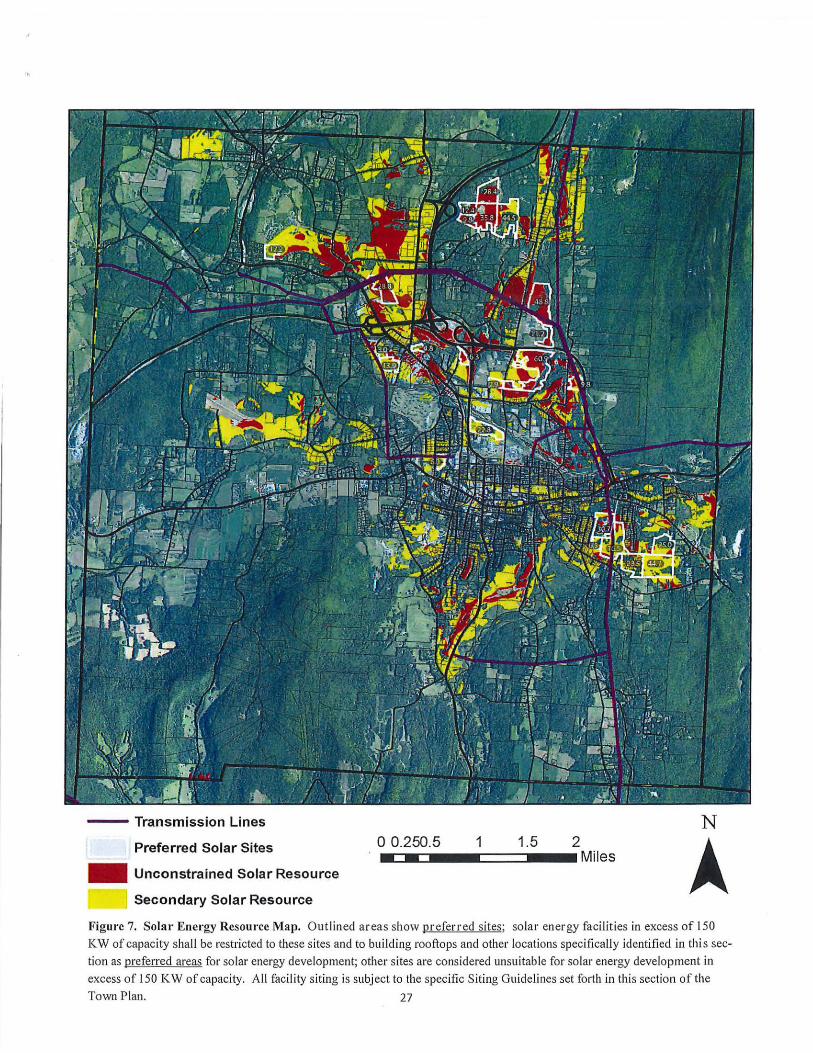
--- Transmission Lines
Preferred Solar Sites
- Unconstrained Solar Resource
Secondary Solar Resource
0 0.250.5 1.5 2 -==-=--.:====:.-• Miles
1 N
A Figure 7. Solar Energy Resource Map. Outlined areas show prefer red sites; solar energy facilities in excess of 150
KW of capacity shall be restricted to these sites and to building rooftops and other locations specifically identified in this sec
tion as preferred areas for solar energy development; other sites are considered unsuitable for solar energy development in
excess o f 150 KW of capacity. All facility siting is subj ect to the specific Siting Guidelines set forth in this section of the
Town Plan. 27