Embed Size (px)
Citation preview

DRAFT-Algebra I Unit 3: Descriptive Statistics
Algebra IUnit 3 Snap Shot
Unit Title Cluster Statements Standards in this Unit
Unit 3Descriptive Statistics★
• Summarize, represent, and interpret data on a single count or measurement variable.
• Summarize, represent, and interpret data on two categorical and quantitative variables.
• Interpret linear models.
• S.ID.1★ (additional)
• S.ID.2 ★ (additional)
• S.ID.3★ (additional)
• S.ID.5 ★ (supporting)
• S.ID.6★ (supporting)(cross-cutting)
• S.ID.7 ★ (major)
• S.ID.8★ (major)
• S.ID.9★ (major)
PARCC has designated standards as Major, Supporting or Additional Standards. PARCC has defined Major Standards to be those which should receive greater emphasis because of the time they require to master, the depth of the ideas and/or importance in future mathematics. Supporting standards are those which support the development of the major standards. Standards which are designated as additional are important but should receive less emphasis.
OverviewThe overview is intended to provide a summary of major themes in this unit.
Experience with descriptive statistics began as early as Grade 6. Students were expected to display numerical data and summarize it using measures of center and variability. By the end of middle school they were creating scatter plots and recognizing linear trends in data. This unit builds upon that prior experience, providing students with more formal means of assessing how well a model fits data. Students use regression techniques to describe approximately linear functional relationships between quantities. They use graphical representations and knowledge of the context to make judgments about the appropriateness of linear models. With linear models, they look at residuals to analyze the goodness of fit.
Enduring UnderstandingsDRAFT Maryland Common Core State Curriculum Unit Plan for Algebra I January 2013 Page 1 of 46★ Modeling standard

DRAFT-Algebra I Unit 3: Descriptive Statistics
Enduring understandings go beyond discrete facts or skills. They focus on larger concepts, principles, or processes. They are transferable and apply to new situations within or beyond the subject . Bolded statements represent Enduring Understandings that span many units and courses. The statements shown in italics represent how the Enduring Understandings might apply to the content in Unit 3 of Algebra I.
Mathematics can be used to solve real world problems and can be used to communicate solutions. o Collecting and analyzing data can be used to answer questions.o Misuse of data and statistics is common, making it important to be well informed of the appropriate ways to interpret data.
Relationships between quantities can be represented symbolically, numerically, graphically and verbally in the exploration of real world situations.
o The context of a question will determine the data that needs to be collected and analyzed and will provide insight on the best method for analyzing the data.
o The type of data determines the best choice of representation (equations, tables, charts, graphs or words).
Essential Question(s)
DRAFT Maryland Common Core State Curriculum Unit Plan for Algebra I January 2013 Page 2 of 46★ Modeling standard

DRAFT-Algebra I Unit 3: Descriptive Statistics
A question is essential when it stimulates multi-layered inquiry, provokes deep thought and lively discussion, requires students to consider alternatives and justify their reasoning, encourages re-thinking of big ideas, makes meaningful connections with prior learning, and provides students with opportunities to apply problem-solving skills to authentic situations. Bolded statements represent Essential Questions that span many units and courses. The statements shown in italics represent Essential Questions that are applicable specifically to the content in Unit 3 of Algebra I.
When is mathematics an appropriate tool to use in problem solving?o When is it important to analyze data?
What characteristics of problems determine how to model a situation and develop a problem solving strategy?o What characteristics of a problem lead to determining if a problem should be represented by single count/measurement
variables or two categorical/quantitative variables?o What characteristics of a problem influence the choice of representation and analysis of the data? o What characteristics of a problem determine the type of function that would serve as an appropriate model for the
problem?
How can mathematical representations be used to communicate information effectively?o How can data be represented to best communicate important information about a problem?
Possible Student Outcomes DRAFT Maryland Common Core State Curriculum Unit Plan for Algebra I January 2013 Page 3 of 46★ Modeling standard
DRAFT-Algebra I Unit 3: Descriptive Statistics
The following list provides outcomes that describe the knowledge and skills that students should understand and be able to do when the unit is completed. The outcomes are often components of more broadly-worded standards and sometimes address knowledge and skills necessarily related to the standards. The lists of outcomes are not exhaustive, and the outcomes should not supplant the standards themselves. Rather, they are designed to help teachers “drill down” from the standards and augment as necessary, providing added focus and clarity for lesson planning purposes. This list is not intended to imply any particular scope or sequence.
S.ID.1 Represent data with plots on the real number line (dot plots, histograms, and box plots). (additional)
The student will: represent single count data using a plot appropriate to a given real-world scenario.
S.ID.2 Use statistics appropriate to the shape of the data distribution to compare center (median, mean) and spread (interquartile range, standard deviation) of two or more different data sets. (additional)
The student will: analyze the shape of a data distribution to determine if the mean or the median is the better statistic to use to represent the
center. analyze the shapes of data distributions to compare the range, the interquartile range and standard deviation compare the center and spread of two or more data sets.
S.ID.3 Interpret differences in shape, center, and spread in the context of the data sets, accounting for possible effects of extreme data points (outliers). (additional)
The student will: compare two or more data sets using summary statistics appropriate to the shape of the data sets. explain the effects of extreme data points (outliers) on the summary statistics for a set of single count data. communicate what an analysis of the summary statistics of a set of single count data reveals.
S.ID.5 Summarize categorical data for two categories in two-way frequency tables. Interpret relative frequencies in the context
DRAFT Maryland Common Core State Curriculum Unit Plan for Algebra I January 2013 Page 4 of 46★ Modeling standard

DRAFT-Algebra I Unit 3: Descriptive Statistics
of the data (including joint, marginal, and conditional relative frequencies). Recognize possible associations and trends in the data. (supporting)
The student will: create a two-way frequency table for a set of categorical data. interpret relative frequencies in the context of a given data set. recognize possible associations and trends in data.
S.ID.6 Represent data on two quantitative variables on a scatter plot, and describe how the variables are related. (supporting)
The student will: create a scatter plot for a given set of data. determine if the data represented in a scatter plot could be modeled by a linear or exponential function.
a. Fit a function to the data; use functions fitted to data to solve problems in the context of the data. Use given functions or choose a function suggested by the context. Emphasize linear and exponential models. (supporting)
The student will: determine a linear regression model for a set of data that suggests a linear relationship.
b. Informally assess the fit of a function by plotting and analyzing residuals. (supporting)
The student will: determine how well a linear model fits a data set by analyzing residuals.
Teacher Note: suggest by hand for small data set – otherwise, use technology
c. Fit a linear function for a scatter plot that suggests a linear association. (supporting)
DRAFT Maryland Common Core State Curriculum Unit Plan for Algebra I January 2013 Page 5 of 46★ Modeling standard

DRAFT-Algebra I Unit 3: Descriptive Statistics
The student will: determine the equation of a line of best fit by hand. determine a linear regression equation from data presented in a scatter plot using the capabilities of a calculator.
S.ID.7 Interpret the slope (rate of change) and the intercept (constant term) of a linear model in the context of the data. (major)
The student will: interpret the rate of change of a linear model in the context of the data. interpret the y-intercept of a linear model to the context of the data. identify situations where the interpretation of the y-intercept in a particular situation does not make sense in the context of
the problem..
S.ID.8 Compute (using technology) and interpret the correlation coefficient of a linear fit. (major)
The student will: compute (using technology) the correlation coefficient of a line of best fit/ linear regression model/linear fit. use the correlation coefficient of a line of best fit/ linear regression model/linear fit to determine how well the model fits the
data set from which it was derived.
S.ID.9 Distinguish between correlation and causation. (major)
The student will: identify an action that causes another action. identify variables that correlate to other variables. distinguish between correlation and causation.
Possible Organization/Groupings of Standards
DRAFT Maryland Common Core State Curriculum Unit Plan for Algebra I January 2013 Page 6 of 46★ Modeling standard

DRAFT-Algebra I Unit 3: Descriptive Statistics
The following charts provide one possible way of how the standards in this unit might be organized. The following organizational charts are intended to demonstrate how some standards will be used to support the development of other standards. This organization is not intended to suggest any particular scope or sequence.
Algebra IUnit 3:Descriptive Statistics
Topic #1Data represented by Single Count or Measurement Variables
The standards to the right should be used to develop Topic # 1
S.ID.1 Represent data with plots on the real number line (dot plots, histograms, and box plots). (additional)
S.ID.2 Use statistics appropriate to the shape of the data distribution to compare center (median, mean) and spread (interquartile range, standard deviation) of two or more different data sets. (additional)
S.ID.3 Interpret differences in shape, center, and spread in the context of the data sets, accounting for possible effects of extreme data points (outliers). (additional)
DRAFT Maryland Common Core State Curriculum Unit Plan for Algebra I January 2013 Page 7 of 46★ Modeling standard

DRAFT-Algebra I Unit 3: Descriptive Statistics
Algebra IUnit 3:Descriptive Statistics
Topic #2Two Categorical and Quantitative Variables
The standards to the right should be used to develop Topic #2
S.ID.5 Summarize categorical data for two categories in two-way frequency tables. Interpret relative frequencies in the context of the data (including joint, marginal, and conditional relative frequencies). Recognize possible associations and trends in the data. (supporting)
S.ID.6 Represent data on two quantitative variables on a scatter plot, and describe how the variables are related. (supporting)
Note: S.ID.6.a.b. & c Students take a more sophisticated look at using a linear function to model the relationship between two numerical variables. In addition to fitting a line to data, students assess how well the model fits by analyzing residuals.
a. Fit a function to the data; use functions fitted to data to solve problems in the context of the data. Use given functions or choose a function suggested by the context. Emphasize linear and exponential models. (supporting)
b. Informally assess the fit of a function by plotting and analyzing residuals. (supporting)
Note: Focus on linear models, but may use this standard to preview quadratic functions in Unit 5 of this course
c. Fit a linear function for a scatter plot that suggests a linear association. (supporting)
DRAFT Maryland Common Core State Curriculum Unit Plan for Algebra I January 2013 Page 8 of 46★ Modeling standard

DRAFT-Algebra I Unit 3: Descriptive Statistics
Algebra IUnit 3:Descriptive Statistics
Topic #3Interpreting Linear Models
The standards to the right should be used to develop Topic #3
S.ID.7 Interpret the slope (rate of change) and the intercept (constant term) of a linear model in the context of the data. (major)
S.ID.8 Compute (using technology) and interpret the correlation coefficient of a linear fit. (major)
Notes: Build on student experience with linear relationships in eighth grade and introduce the correlation coefficient.The focus here is on the computation and interpretation of the correlation coefficient as a measure of how well the data fit the relationship. The important distinction between a statistical relationship and a cause-and-effect relationship arises in S.ID.9.
S.ID.9 Distinguish between correlation and causation. (major)
DRAFT Maryland Common Core State Curriculum Unit Plan for Algebra I January 2013 Page 9 of 46★ Modeling standard

DRAFT-Algebra I Unit 3: Descriptive Statistics
Connections to the Standards for Mathematical PracticeThis section provides examples of learning experiences for this unit that support the development of the proficiencies described in the Standards for Mathematical Practice. These proficiencies correspond to those developed through the Literacy Standards. The statements provided offer a few examples of connections between the Standards for Mathematical Practice and the Content Standards of this unit. The list is not exhaustive and will hopefully prompt further reflection and discussion.
In this unit, educators should consider implementing learning experiences which provide opportunities for students to:
1. Make sense of problems and persevere in solving them. Use the context of the data to choose a method of display or analysis. Check solutions to determine if conclusions are reasonable.
2. Reason abstractly and quantitatively. Assign meaning to the slope and y-intercept of a linear model using the context of the problem. Determine if the mean or median is the better measure of center.
3. Construct viable arguments and critique the reasoning of others. Justify the choice of data display. Justify why a linear or exponential function is chosen for modeling a given scenario. Distinguish between correlation and causation. Analyze the goodness of fit of a function to the data.
4. Model with Mathematics. Write an equation to model the relationship between two variables.
5. Use appropriate tools strategically. Use interactive software to observe dynamic changes to data displays. Use a graphing calculator to:
i. Calculate measures of center and spread.ii. Create graphical displays (scatter plots, residual plots, box plots, histograms).iii. Compute correlation coefficients. iv. Calculate residuals.
DRAFT Maryland Common Core State Curriculum Unit Plan for Algebra I January 2013 Page 10 of 46★ Modeling standard

DRAFT-Algebra I Unit 3: Descriptive Statistics
6. Attend to precision. Use mathematical vocabulary properly while discussing results. Use rounding appropriately while performing statistical calculations. Label the axes of graphs and use appropriate scales. Determine whether data points are outliers.
7. Look for and make use of structure. Identify patterns in residual plots that indicate a linear model is not appropriate.
8. Look for and express regularity in repeated reasoning.
DRAFT Maryland Common Core State Curriculum Unit Plan for Algebra I January 2013 Page 11 of 46★ Modeling standard

DRAFT-Algebra I Unit 3: Descriptive Statistics
Content Standards with Essential Skills and Knowledge Statements and Clarifications/Teacher Notes The Content Standards and Essential Skills and Knowledge statements shown in this section come directly from the Algebra I framework document. Clarifications and teacher notes were added to provide additional support as needed. Educators should be cautioned against perceiving this as a checklist. Formatting Notes
Red Bold- items unique to Maryland Common Core State Curriculum Frameworks Blue bold – words/phrases that are linked to clarifications Black bold underline - words within repeated standards that indicate the portion of the statement that is emphasized at this point in the
curriculum or words that draw attention to an area of focus Black bold- Cluster Notes-notes that pertain to all of the standards within the cluster Green bold – standard codes from other courses that are referenced and are hot linked to a full description
DRAFT Maryland Common Core State Curriculum Unit Plan for Algebra I January 2013 Page 12 of 46★ Modeling standard

DRAFT-Algebra I Unit 3: Descriptive Statistics
Standard Essential Skills and Knowledge Clarifications/Teacher Notes
Cluster Note: In grades 6 – 8, students describe center and spread in a data distribution. Here they choose a summary statistic appropriate to the characteristics of the data distribution, such as the shape of the distribution or the existence of extreme data pointsS.ID.1 Represent data with plots on the real number line (dot plots, histograms, and box plots). (additional)
Ability to determine the best data representation to use for a given situation
Knowledge of key features of each plot Ability to correctly display given data in
an appropriate plot Ability to analyze data given in different
formats
A dot plot is synonymous with a line plot. A box plot is synonymous with a box-and-whisker
plot. Dot plots, histograms, and box plots are all
graphical displays of a single quantitative (as opposed to categorical/qualitative) variable. They display univariate quantitative data.
Histograms and box plots can be used for continuous or discrete data.
Dot plots are used for discrete data. Histograms and box plots are appropriate for very
large data sets. Dot plots are more typically used for smaller data sets (e.g., 25 or fewer values)
Box plots separate a data set into quartiles, displaying also its minimum and maximum values.
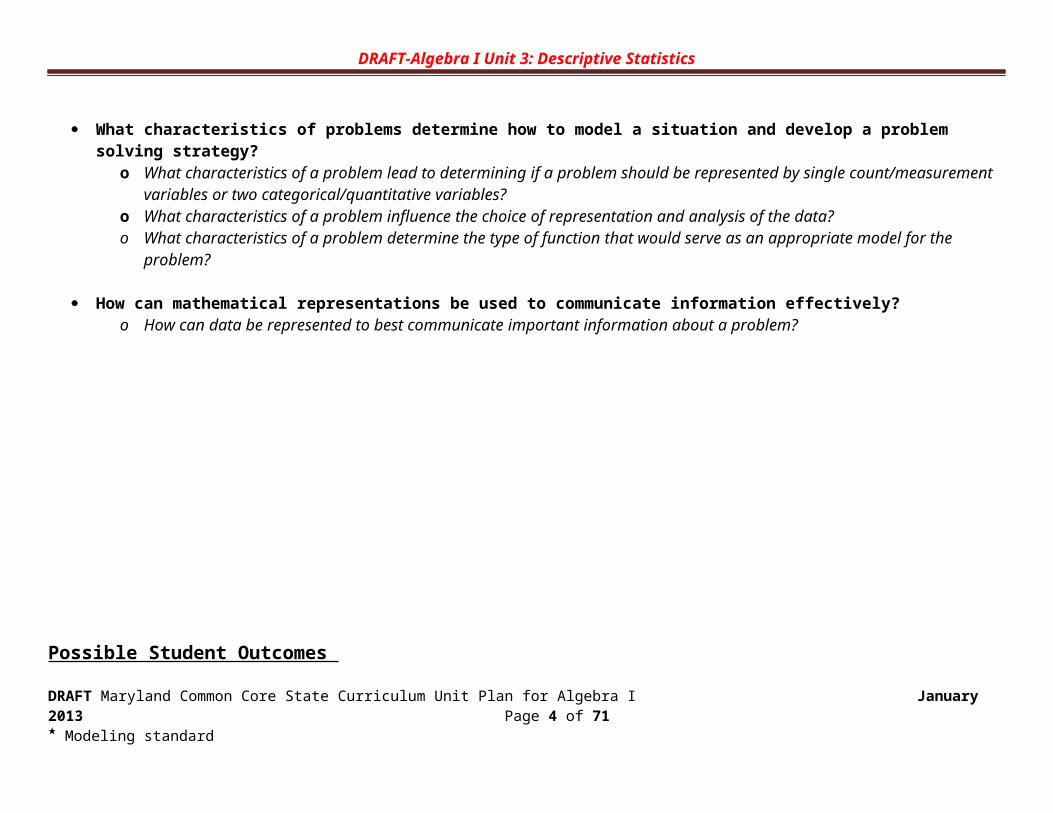
For histograms and dot plots, data values are typically graphed on the horizontal axis, while frequency of data values is indicated by the vertical dimension of the graph. Histograms have a vertical axis showing frequency, whereas for dot plots, no vertical axis is drawn; frequency is indicated by the number of marks or dots that lie above the data value on the horizontal axis.
Box plots are one-dimensional, typically oriented horizontally.
Raw data cannot be identified from a box plot or a histogram that uses intervals.
DRAFT Maryland Common Core State Curriculum Unit Plan for Algebra I January 2013 Page 13 of 46★ Modeling standard

DRAFT-Algebra I Unit 3: Descriptive Statistics
Standard Essential Skills and Knowledge Clarifications/Teacher Notes
S.ID.2 Use statistics appropriate to the shape of the data distribution to compare center (median, mean) and spread (interquartile range, standard deviation) of two or more different data sets. (additional)
Ability to interpret measures of center and spread (variability) as they relate to several data sets
Ability to identify shapes of distributions (skewed left or right, bell, uniform, symmetric)
Ability to recognize appropriateness of mean/standard deviation; versus the 5 number summary
S.ID.1 compared data displays for one set of univariate data. S.ID.2 compares multiples sets of bivariate data.
S.ID.3 Interpret differences in shape, center, and spread in the context of the data sets, accounting for possible effects of extreme data points (outliers). (additional)
Ability to recognize gaps, clusters, and trends in the data set
Ability to recognize extreme data points (outliers) and their impact on center
Ability to effectively communicate what the data reveals
Knowledge that when comparing distributions there must be common scales and units
To determine whether an observation is an outlier:
o Find the Interquartile range (IQR) =
o Multiply o Outliers are points that are either:
o above
o below
DRAFT Maryland Common Core State Curriculum Unit Plan for Algebra I January 2013 Page 14 of 46★ Modeling standard

DRAFT-Algebra I Unit 3: Descriptive Statistics
Standard Essential Skills and Knowledge Clarifications/Teacher Notes
S.ID.5 Summarize categorical data for two categories in two-way frequency tables. Interpret relative frequencies in the context of the data (including joint, marginal, and conditional relative frequencies). Recognize possible associations and trends in the data. (supporting)
Knowledge of the characteristics of categorical data
Ability to read and use a two-way frequency table
Ability to use and to compute joint, marginal, and conditional relative frequencies
Ability to read a segmented bar graph
In Grade 8, students constructed two-way tables of bivariate data without computing joint, marginal, or relative frequencies (8.SP.4).
DRAFT Maryland Common Core State Curriculum Unit Plan for Algebra I January 2013 Page 15 of 46★ Modeling standard

DRAFT-Algebra I Unit 3: Descriptive Statistics
Standard Essential Skills and Knowledge Clarifications/Teacher Notes
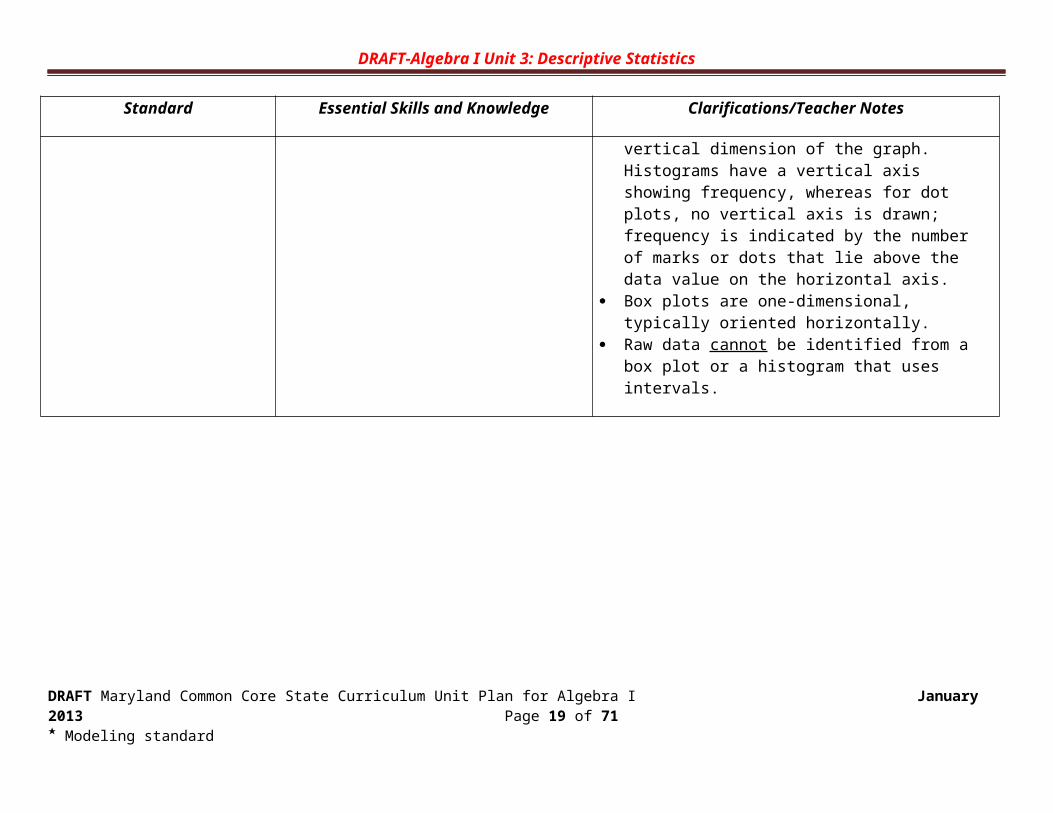
S.ID.6 Represent data on two quantitative variables on a scatter plot, and describe how the variables are related.
Note: S.ID.6.a.b. & c Students take a more sophisticated look at using a linear function to model the relationship between two numerical variables. In addition to fitting a line to data, students assess how well the model fits by analyzing residuals.
a. Fit a function to the data; use functions fitted to data to solve problems in the context of the data. Use given functions or choose a function suggested by the context. Emphasize linear and exponential models. (supporting)
Ability to recognize types of relationships that lend themselves to linear and exponential models
Ability to create and use regression models to represent a contextual situation
Standard S.ID.6a focuses on using information such as a given function or the context of the problem to solve problems compared to standard S.ID.6.c that more specifically asks to fit a linear function to a scatter plot.
o Note any limitations on interpolation and extrapolation.
o Predictions from an equation should only be made about the population from which the sample was drawn.
Example: Using the relationship about the height and weight of college women should not be used to predict the weight of professional athletes.
o The equation should only be used over a sample domain of the input variable. Any extrapolation is questionable.
Example: A person’s height and weight at age 25 cannot be determined based on data from first 10 years of life.
DRAFT Maryland Common Core State Curriculum Unit Plan for Algebra I January 2013 Page 16 of 46★ Modeling standard

DRAFT-Algebra I Unit 3: Descriptive Statistics
Standard Essential Skills and Knowledge Clarifications/Teacher Notes
b. Informally assess the fit of a function by plotting and analyzing residuals. (supporting)
Note: Focus on linear models, but may use this standard to preview quadratic functions in Unit 5 of this course
Ability to create a graphic display of residuals
Ability to recognize patterns in residual plots
Ability to analyze the meaning of patterns in residual plots.
Plots of residuals should show no pattern in order for the linear model to be appropriate. A relatively high correlation coefficient is no guarantee that the model is appropriate.
c. Fit a linear function for a scatter plot that suggests a linear association (supporting)
Ability to recognize a linear relationship displayed in a scatter plot
Ability to determine an equation for the line of best fit for a set of data points
S.ID.7 Interpret the slope (rate of change) and the intercept (constant term) of a linear model in the context of the data. (major)
See the skills and knowledge that are stated in the Standard.
Students should be able to analyze the reasonableness of the y-intercept in the context of the situation.
Slope should be interpreted in the context of the situation.
DRAFT Maryland Common Core State Curriculum Unit Plan for Algebra I January 2013 Page 17 of 46★ Modeling standard

DRAFT-Algebra I Unit 3: Descriptive Statistics
Standard Essential Skills and Knowledge Clarifications/Teacher Notes
S.ID.8 Compute (using technology) and interpret the correlation coefficient of a linear fit. (major)
Notes: Build on student experience with linear relationships in eighth grade and introduce the correlation coefficient.The focus here is on the computation and interpretation of the correlation coefficient as a measure of how well the data fit the relationship. The important distinction between a statistical relationship and a cause-and-effect relationship arises in S.ID.9.
Knowledge of the range of the values ( )and the interpretation of those values for correlation coefficients
Ability to compute and analyze the correlation coefficient for the purpose of communicating the goodness of fit of a linear model for a given data set
Use a scatter plot to check that the data appears to be linear.
Only use “r” for linear relationships If all data points satisfy a linear equation (y=mx
+b) then the value of r will be +1 (or -1)
DRAFT Maryland Common Core State Curriculum Unit Plan for Algebra I January 2013 Page 18 of 46★ Modeling standard
DRAFT-Algebra I Unit 3: Descriptive Statistics
Standard Essential Skills and Knowledge Clarifications/Teacher Notes
S.ID.9 Distinguish between correlation and causation. (major)
Ability to provide examples of two variables that have a strong correlation but one does not cause the other.
Examples where a strong correlation does not indicate causation:
Example 1: A recent study found a high correlation (r = 0.843) between
the number of ice cream sales at an Annapolis store and the number of vehicles that traveled across the Chesapeake Bay Bridge on Saturdays. However, buying ice cream does not likely cause one to travel over the Bay Bridge, and likewise traveling over the bridge does not likely cause one to want to buy ice cream. However, the extraneous variable temperature could explain an increase in both ice cream sales and number of vehicles traveling across the bridge. Remember the bridge is the main route to Maryland’s beaches.
Example 2: In Bavarian towns there is a high correlation between the
number of storks and the number of baby born each year (r = 0.917). Unlike popular fairy tales, the number of storks is not causing the number of babies to increase. It turns out the storks like to nest on man-made structures. The larger the town’s population, the more man-made structures and the more babies.
DRAFT Maryland Common Core State Curriculum Unit Plan for Algebra I January 2013 Page 19 of 46★ Modeling standard

DRAFT-Algebra I Unit 3: Descriptive Statistics
Vocabulary/Terminology/ConceptsThe following definitions/examples are provided to help the reader decode the language used in the standard or the Essential Skills and Knowledge statements. This list is not intended to serve as a complete list of the mathematical vocabulary that students would need in order to gain full understanding of the concepts in the unit.
Term Standard Definitionbox plot S.ID.1 Represent
data with plots on the real number line (dot plots, histograms, and box plots).
A box plot also know as a box-and-whisker plot is a visual display of the five-number summary where the data is displayed into quartiles where:
The bottom whisker extends to the minimum value. The leftmost end of the box starts at the lower (first) quartile. A line is drawn through the box at the median. The rightmost end of the box ends at the upper (third) quartile. The top whisker extends to the maximum value.
Editor’s Note: Please ensure that the entire graphic is shown. Example
DRAFT Maryland Common Core State Curriculum Unit Plan for Algebra I January 2013 Page 20 of 46★ Modeling standard
Minimum
Value
Maximum
Value

DRAFT-Algebra I Unit 3: Descriptive Statistics
Term Standard Definition
categorical data S.ID.5 Summarize categorical data for two categories in two-way frequency tables. Interpret relative frequencies in the context of the data (including joint, marginal, and conditional relative frequencies). Recognize possible associations and trends in the data.
Categorical data is data that fits into a small number of discrete categories. Categorical data is either non-ordered (nominal) such as gender or city, or ordered (ordinal) such as high, medium, or low temperature. A category can be a descriptive value such as color.
causation S.ID.9 Distinguish between correlation and causation.
Causation can only be determined via a well-designed experiment, which demonstrates a strong correlation between variables. If one action causes another, then they are most certainly correlated.
DRAFT Maryland Common Core State Curriculum Unit Plan for Algebra I January 2013 Page 21 of 46★ Modeling standard

DRAFT-Algebra I Unit 3: Descriptive Statistics
Term Standard Definitionconditional relative frequencies
S.ID.5 Summarize categorical data for two categories in two-way frequency tables. Interpret relative frequencies in the context of the data (including joint, marginal, and conditional relative frequencies). Recognize possible associations and trends in the data
Conditional relative frequencies occur in the body of a two-way relative frequency table. To change from a frequency table to a relative frequency table each of the joint frequencies need to be divided by the total sample size.
correlation S.ID.9 Distinguish between correlation and causation.
Correlation refers to a quantitative relationship between two variables. Correlation does not imply causation, rather it implies an association between two variables.
correlation coefficient
S.ID.8 Compute (using technology) and interpret the correlation coefficient of a linear fit.
Correlation does not imply causation, rather it implies an association between two variables. The strength of a correlation can be indicated by the correlation coefficient.
The correlation coefficient (denoted by r) is a statistic that is calculated from sample data and is used to estimate the corresponding population correlation coefficient. Correlation coefficients take on values between −1 and +1. A negative value of r indicates a negative relationship (as values of x increase, values of y decrease); a positive value of r indicates a positive relationship (as values of x increase, values of y increase); a zero value of r indicates that the two variables are independent of each other; the closer r is to +1 or -1, the stronger the relationship between the two variables.
DRAFT Maryland Common Core State Curriculum Unit Plan for Algebra I January 2013 Page 22 of 46★ Modeling standard
Two-Way Frequency TableDance Sports TV Total
Male 2 10 8 20Female 16 6 8 30Total 18 16 16 50
Two-Way Relative Frequency TableDance Sports TV Total
Male 0.04 0.20 0.16 0.40Female 0.32 0.12 0.16 0.60Total 0.36 0.32 0.32 1.00
.
The conditional relative frequencies are shown in the shaded region in the table.
Total Sample Size
versus
DRAFT-Algebra I Unit 3: Descriptive Statistics
Term Standard Definition
dot plot S.ID.1 Represent data with plots on the real number line (dot plots, histograms, and box plots).
A dot plot is a visual display that places x’s, dots or marks for values that are of approximately the same value on top of each other on a horizontal scale
Example
experiment Not in a standard-but this word is used in many places throughout this document.
In an experiment, a researcher deliberately imposes values of the explanatory (independent) variable to subjects. A well-designed experiment usually involves random allocation of subjects to groups, followed by researcher imposed treatment levels of the explanatory (independent) variable assigned to each group. Example: A researcher is interested in finding a relationship between time spent memorizing a list of words and how many words the students can recall. In an experiment, the researcher randomly allocates students into three groups.
o Group 1 – after reading the list of words members of this group are given no additional time to memorize the words.
o Group 2 – after reading the list of words, members of this group are given 5 minutes with the list in order to memorize the words.
o Group 3 – after reading the list of words, members of this group are given 10 minutes with the list in order to memorize the words.
Group members are asked to record as many words as they can recall:o immediately after the list is taken from them.o one hour after the list is taken from themo one day after the list is taken from them.
DRAFT Maryland Common Core State Curriculum Unit Plan for Algebra I January 2013 Page 23 of 46★ Modeling standard

DRAFT-Algebra I Unit 3: Descriptive Statistics
Term Standard Definition
exponential model
S.ID.6 Represent data on two quantitative variables on a scatter plot, and describe how the variables are related.
a. Fit a function to the data; use functions fitted to data to solve problems in the context of the data. Use given functions or choose a function suggested by the context. Emphasize linear and exponential models.
An exponential model is a relationship between two quantitative variables whose scatter plot shows a growth or decay relationship exponential in form. y=abx
extrapolation See Clarifications/Teacher Notes for S.ID.6
Using a model to make a prediction for an unknown value outside the range of a given data set is known as extrapolation. Note: there are limitations when using extrapolation
DRAFT Maryland Common Core State Curriculum Unit Plan for Algebra I January 2013 Page 24 of 46★ Modeling standard

DRAFT-Algebra I Unit 3: Descriptive Statistics
Term Standard Definition
frequency S.ID.5 Summarize categorical data for two categories in two-way frequency tables. Interpret relative frequencies in the context of the data (including joint, marginal, and conditional relative frequencies). Recognize possible associations and trends in the data
A frequency is a count of how often the value of the variable occurs.
DRAFT Maryland Common Core State Curriculum Unit Plan for Algebra I January 2013 Page 25 of 46★ Modeling standard

DRAFT-Algebra I Unit 3: Descriptive Statistics
Term Standard Definition
histogram S.ID.1 Represent data with plots on the real number line (dot plots, histograms, and box plots).
A histogram is a visual display (particularly useful with very large data sets) that can be produced by dividing the range of the data into subintervals of equal length, counting the number (frequency) of observations in each subinterval and constructing rectangles whose heights correspond to the counts in each subinterval. The rectangles can be made corresponding to the proportions (relative frequency) of the observations in the subintervals.
interpolation See Clarifications/Teacher Notes for S.ID.6
Using a model to make a prediction for an unknown value within the range of a given set of discrete data is known as interpoltation.
DRAFT Maryland Common Core State Curriculum Unit Plan for Algebra I January 2013 Page 26 of 46★ Modeling standard

DRAFT-Algebra I Unit 3: Descriptive Statistics
Term Standard Definition
joint frequencies S.ID.5 Summarize categorical data for two categories in two-way frequency tables. Interpret relative frequencies in the context of the data (including joint, marginal, and conditional relative frequencies). Recognize possible associations and trends in the data
Joint frequencies are entries in the body of a two way frequency table.
Example: What is the frequency of males that dance? Answer: 2
Student Activities
line of best fit See Student Outcome for S.ID.8
A line of best fit is a straight line that best represents the data on a scatter plot. This line may pass through some of the points, none of the points, or all of the points. For a given set of data there may be several different equations for the line of best fit. The various equations are dependent of the two point used to calculate the equation.
DRAFT Maryland Common Core State Curriculum Unit Plan for Algebra I January 2013 Page 27 of 46★ Modeling standard
Dance Sports TV TotalMale 2 10 8 20Female 16 6 8 30Total 18 16 16 50
Joint Frequencies are shown in the shaded region of the table.

DRAFT-Algebra I Unit 3: Descriptive Statistics
Term Standard Definition
linear model S.ID.6 Represent data on two quantitative variables on a scatter plot, and describe how the variables are related.
a. Fit a function to the data; use functions fitted to data to solve problems in the context of the data. Use given functions or choose a function suggested by the context. Emphasize linear and exponential models.
A linear model is used to represent a relationship between two quantitative variables whose scatter plot shows a straight line relationship or linear in form. A linear model which is often referred to as a linear regression model is usually thought to be a more precise line of best fit for a given data set. The process for determining a linear regression model is based upon a least squares regression process and is usually determined using the regression capabilities of a graphing calculator.
DRAFT Maryland Common Core State Curriculum Unit Plan for Algebra I January 2013 Page 28 of 46★ Modeling standard

DRAFT-Algebra I Unit 3: Descriptive Statistics
Term Standard Definition
marginal frequencies
S.ID.5 Summarize categorical data for two categories in two-way frequency tables. Interpret relative frequencies in the context of the data (including joint, marginal, and conditional relative frequencies). Recognize possible associations and trends in the data
Marginal frequencies are frequencies that appear at the right and bottom margins of atwo-way frequency table, representing the total row and total column entries.
Student Activities
observational study
See Clarifications/Teacher Notes for S.ID.9
In an observational study a researcher observes subjects and measures variables of interest but does not attempt to influence the responses. Example: In an observational study a researcher is interested in finding a relationship between time spent memorizing a list of words and how many words the students can recall. Students are told to record the amount of time they spent memorizing the list and then the next day are asked to record as many words as they can recall.
population See Clarifications/Teacher Notes for S.ID.6
The entire set of items from which data can be selected is the population. For example, the population of all voters in a district, or a crop of apples that might be weighed or sorted in some manner.
quantitative data See the third Quantitative data consists of numbers representing counts or measurements. Mathematical
DRAFT Maryland Common Core State Curriculum Unit Plan for Algebra I January 2013 Page 29 of 46★ Modeling standard
Dance Sports TV TotalMale 2 10 8 20Female 16 6 8 30Total 18 16 16 50
Marginal Frequencies
Marginal Frequencies

DRAFT-Algebra I Unit 3: Descriptive Statistics
Term Standard Definitioncolumn of the “Unit 3 Snap Shot”
operations can be performed on these in a meaningful way. Example: average height is quantitative
relative frequency
S.ID.5 Summarize categorical data for two categories in two-way frequency tables. Interpret relative frequencies in the context of the data (including joint, marginal, and conditional relative frequencies). Recognize possible associations and trends in the data
Relative frequency is the ratio of the actual number of favorable events to the total possible number of events; often taken as an estimate of probability
Example: If a coin is tossed 50 times and the coin lands with Heads-up 30 times, the
relative frequency with which a coin lands Heads-up in this experiment is .
DRAFT Maryland Common Core State Curriculum Unit Plan for Algebra I January 2013 Page 30 of 46★ Modeling standard

DRAFT-Algebra I Unit 3: Descriptive Statistics
Term Standard Definition
residual S.ID.6 Represent data on two quantitative variables on a scatter plot, and describe how the variables are related.
b. Informally assess the fit of a function by plotting and analyzing residuals.
The residual in a regression model is the difference between the observed value of the dependent variable and its predicted value. Each data point has one residual.
Residual = Observed value - Predicted value
ExampleGiven the regression equation and the data point (1, 2.5).The residual for the data point (1,2.5) would be
Residual = Observed value - Predicted value
sample See Clarifications/Teacher Notes for S.ID.6
A sample is a subset of a population.
Examples:
DRAFT Maryland Common Core State Curriculum Unit Plan for Algebra I January 2013 Page 31 of 46★ Modeling standard
Residual
Population SampleRegistered Voters Registered voters who are womenHigh School students at North HS Seniors at North HS

DRAFT-Algebra I Unit 3: Descriptive Statistics
Term Standard Definition
segmented bar graph
This appears in the Essential Skills and Knowledge statement for S.ID.5
A segmented bar graph shows how multiple groups contribute to an overall total. This graph is usually constructed for nominal or ordinal data and is a useful adjunct to a bar-graph. Example
summary statistic
Cluster Note: In grades 6 – 8, students describe center and spread in a data distribution. Here they choose a summary statistic appropriate to the characteristics of the data distribution, such as the shape of the distribution or the existence of
Information given for a quick and simple description of the data, such as mean, median, mode, range and standard deviation are called summary statistics.
In descriptive statistics, summary statistics are used to summarize a set of observations, in order to communicate the largest amount of information about the data as simply as possible. Statisticians commonly try to describe the observations in
a measure of location, or central tendency, such as the arithmetic mean a measure of statistical dispersion like the standard deviation a measure of the shape of the distribution like skewness or kurtosis if more than one variable is measured, a measure of statistical dependence such as a
correlation coefficient
DRAFT Maryland Common Core State Curriculum Unit Plan for Algebra I January 2013 Page 32 of 46★ Modeling standard

DRAFT-Algebra I Unit 3: Descriptive Statistics
Term Standard Definitionextreme data points.
trend S.ID.5 Summarize categorical data for two categories in two-way frequency tables. Interpret relative frequencies in the context of the data (including joint, marginal, and conditional relative frequencies). Recognize possible associations and trends in the data.
A trend is a perceived pattern in numerical data. Trends are frequently shown visually with a graph.
Progressions from the Common Core State Standards in MathematicsFor an in-depth discussion of overarching, “big picture” perspective on student learning of the Common Core State Standards please access the documents found at the site below.
http://ime.math.arizona.edu/progressions/
Draft High School Progression on Statistics and Probability http://commoncoretools.me/wp-content/uploads/2012/06/ccss_progression_sp_hs_2012_04_21_bis.pdf
DRAFT Maryland Common Core State Curriculum Unit Plan for Algebra I January 2013 Page 33 of 46★ Modeling standard

DRAFT-Algebra I Unit 3: Descriptive Statistics
Vertical AlignmentVertical curriculum alignment provides two pieces of information:
A description of prior learning that should support the learning of the concepts in this unit A description of how the concepts studied in this unit will support the learning of other mathematical concepts.
Previous Mathematics Algebra I Unit 3 Future Mathematics
Concepts developed in previous mathematics course/units which serve as a foundation for the development of the “Key Concept”
Key Concept(s) Concepts that a student will study either later in Algebra I or in another high school mathematics course for which this “Key Concept” will be a foundation.
In 6th grade students display numerical data in dot plots, histograms and box plots. (6.SP.4)
Represent data with plots on the real number line (dot plots, histograms, and box plots).
In Algebra II Unit 4 students will study standard S.ID.4. The study of this standard will include cases where students fit a data set to a normal distribution by using the mean and standard deviation of the data set.
In 6th grade students compute measures of center and variability. They must relate the choice of measure of center and variability to the shape of the data distribution and the context. (6.SP 1-5)In 7th grade students draw informal comparative inferences about two populations.(7.SP.3-4)
Use statistics appropriate to the shape of the data distribution to compare center (median, mean) and spread (interquartile range, standard deviation) of two or more different data sets.
In Algebra II Unit 4 students will study standard S.ID.4. The study of this standard will include cases where students fit a data set to a normal distribution by using the mean and standard deviation of the data set.
DRAFT Maryland Common Core State Curriculum Unit Plan for Algebra I January 2013 Page 34 of 46★ Modeling standard

DRAFT-Algebra I Unit 3: Descriptive Statistics
Previous Mathematics Algebra I Unit 3 Future Mathematics
Concepts developed in previous mathematics course/units which serve as a foundation for the development of the “Key Concept”
Key Concept(s) Concepts that a student will study either later in Algebra I or in another high school mathematics course for which this “Key Concept” will be a foundation.
In 6th grade students compute measures of center and variability. They must relate the choice of measure of center and variability to the shape of the data distribution and the context. (6.SP 1-5)In 7th grade students draw informal comparative inferences about two populations.(7.SP.3-4)
Interpret differences in shape, center, and spread in the context of the data sets, accounting for possible effects of extreme data points (outliers).
In Algebra II Unit 4 students will study standard S.ID.4. The study of this standard will include cases where students fit a data set to a normal distribution by using the mean and standard deviation of the data set.
In 7th grade students draw informal comparative inferences about two populations.(7.SP.3)In 8th grade students display frequencies and relative frequencies in two-way tables.(8.SP.4)
Summarize categorical data for two categories in two-way frequency tables. Interpret relative frequencies in the context of the data (including joint, marginal, and conditional relative frequencies). Recognize possible associations and trends in the data.
In Algebra II Unit 4 students make inferences and justify conclusions from sample surveys, experiments, and observational studies.(S.IC.1-6)
In 6th grade students use variables to represent two-quantities that change in relationship to one another.(6.EE.9)In 8th grade students construct and interpret scatter plots and investigate patterns of association between the two quantities. (8.SP.1)
Represent data on two quantitative variables on a scatter plot, and describe how the variables are related.
In Algebra II Unit 3 students will write functions that describe the relationship between two quantities. (F.BF.1)
DRAFT Maryland Common Core State Curriculum Unit Plan for Algebra I January 2013 Page 35 of 46★ Modeling standard

DRAFT-Algebra I Unit 3: Descriptive Statistics
Previous Mathematics Algebra I Unit 3 Future Mathematics
Concepts developed in previous mathematics course/units which serve as a foundation for the development of the “Key Concept”
Key Concept(s) Concepts that a student will study either later in Algebra I or in another high school mathematics course for which this “Key Concept” will be a foundation.
In 8th grade students find a line of best fit and discuss the fit based on how close the data points are to the line (8.SP.2)
Fit a function to the data; use functions fitted to data to solve problems in the context of the data. Use given functions or choose a function suggested by the context. Emphasize linear and exponential models. Restrict the domain of exponential functions to the set of integers.
In Algebra I Unit 5, students will fit quadratic functions to data. In Algebra II Unit 2, students will fit trigonometric functions to data.In Algebra II Unit 3 students will:
interpret functions that arise in applications in terms of a context. (F.IF.4)
construct and compare linear, quadratic, and exponential models and solve problems.
In 8th grade students find a line of best fit and discuss the fit based on how close the data points are to the line (8.SP.2)
Informally assess the fit of a function by plotting and analyzing residuals.
In 8th grade students construct and interpret scatter plots. They also find lines of best-fit. (8.SP1& 2)
Fit a linear function for a scatter plot that suggests a linear association
In Algebra II Unit 3 students will: interpret functions that arise in
applications in terms of a context. (F.IF.4)
construct and compare linear, quadratic, and exponential models and solve problems.
DRAFT Maryland Common Core State Curriculum Unit Plan for Algebra I January 2013 Page 36 of 46★ Modeling standard

DRAFT-Algebra I Unit 3: Descriptive Statistics
Previous Mathematics Algebra I Unit 3 Future Mathematics
Concepts developed in previous mathematics course/units which serve as a foundation for the development of the “Key Concept”
Key Concept(s) Concepts that a student will study either later in Algebra I or in another high school mathematics course for which this “Key Concept” will be a foundation.
In 6th grade students demonstrate that they understand ratio concepts and use ratio reasoning to solve problems.(6.RP.1-3)In 7th grade students compute unit rates and identified the constant of proportionality from verbal descriptions.(7.RP.2)In 8th grade students interpret the unit rate of a proportional relationship as the slope of the graph of the proportional relationship. (8.EE.5-6). In 8th grade students use the equation of a linear model to solve problems in context and interpret the slope and intercept. (8.SP.3)
Interpret the slope (rate of change) and the intercept (constant term) of a linear model in the context of the data.
In Algebra II Unit 3 students will interpret functions that arise in applicationsin terms of a context. (F.IF.6)In Algebra II Unit 3 students will also write functions that describe the relationship between two quantities. (F.BF.1)
In 8th grade students find a line of best fit and discuss the fit based on how close the data points are to the line (8.SP.2)
Compute (using technology) and interpret the correlation coefficient of a linear fit.
In 8th grade students interpret two-way tables and look for possible associations between two variables. (8.SP.4)
Distinguish between correlation and causation.
DRAFT Maryland Common Core State Curriculum Unit Plan for Algebra I January 2013 Page 37 of 46★ Modeling standard

DRAFT-Algebra I Unit 3: Descriptive Statistics
Common MisconceptionsThis list includes general misunderstandings and issues that frequently hinder student mastery of concepts regarding the content of this unit.
Topic/Standard/Concept Misconception Strategies to Address Misconception Dot Plots/S.ID.1 Represent data with plots on the real number line (dot plots, histograms, and box plots).
When asked to represent data using a plot students believe that any plot can be used in any situation.
See Lesson Seed “Representing Data with Plots” for an activity that requires students to analyze which type of plot is the best plot for a given data set.
Dot plots and histograms/S.ID.1 Represent data with plots on the real number line (dot plots, histograms, and box plots).
Students cannot tell the difference between a histogram and a bar graph.
Have students complete a compare and contrast activity whereby students analyze the similarities and differences between a histogram and a bar graph.
Histograms/S.ID.1 Represent data with plots on the real number line (dot plots, histograms, and box plots).
When interpreting histograms students may be confused as to which axis represents the data and which represents the frequency.
Require students to describe the attributes of a given histogram and justify the frequency with which a particular data set occurs.
Histograms/S.ID.1 Represent data with plots on the real number line (dot plots, histograms, and box plots).
When interpreting histograms students may not recognize that a break in the scale (little squiggle near 0) results in a visual misperception of the heights of the bar being different from the actual numerical differences of those intervals.
Provide examples of the histogram both with and without a break in the scale. Ask key questions about first impressions someone would get when analyzing data in a histogram with a broken vertical scale versus without a broken vertical scale.
Box plots/S.ID.1 Represent data with plots on the real number line (dot plots, histograms, and box plots).
Median line is mistaken for mean. Emphasize that a box plot is a representation of the five number summary. Ask students to differentiate between mean and median concepts.
DRAFT Maryland Common Core State Curriculum Unit Plan for Algebra I January 2013 Page 38 of 46★ Modeling standard

DRAFT-Algebra I Unit 3: Descriptive Statistics
Topic/Standard/Concept Misconception Strategies to Address Misconception Box plots/S.ID.1 Represent data with plots on the real number line (dot plots, histograms, and box plots).
The quartile, as represented on the box plot, with the greatest length is interpreted as a quartile with the greatest number of values.
See Lesson Seed “Human Box Plot” for an activity that might help students remember this concept.
Appropriateness of measures of center and spread/S.ID.2 Use statistics appropriate to the shape of the data distribution to compare center (median, mean) and spread (interquartile range, standard deviation) of two or more different data sets.
Students may believe the mean and standard deviation are the best measures of center and spread, respectively, regardless of shape of data.
See Lesson Seed “Effect of Outliers” for an activity that might help students to better understand the impact that an outlier has on the summary statistics for a data set.
Appropriateness of measure of center/S.ID.3 Interpret differences in shape, center, and spread in the context of the data sets, accounting for possible effects of extreme data points (outliers).
Students may believe that the median is always the preferable measure of center whenever outliers are present.
While it is true that extreme values on one side of the data set would indicate appropriateness of the median, a simple rule of “extreme values indicate use the median” is over simplistic. Provide an example of a data set that has one very low extreme value and one very high extreme value. Have students compute the summary statistics for this data set and explain why the extreme values did not seem to skew the data. They should conclude that the two extreme values balance each other.
Skewness /S.ID.2 Use statistics appropriate to the shape of the data distribution to compare center (median, mean) and spread (interquartile range, standard deviation) of two or more different data sets.
Students confuse the direction of skewness.
Have students complete a Frayer Model for the concept of Skewed Left and Skewed Right. Post several of the students’ examples around the room. Having students complete such an activity may help them to better internalize the concepts.
DRAFT Maryland Common Core State Curriculum Unit Plan for Algebra I January 2013 Page 39 of 46★ Modeling standard

DRAFT-Algebra I Unit 3: Descriptive Statistics
Model Lesson Plans
The lesson plan(s) have been written with specific standards in mind. Each model lesson plan is only a MODEL – one way the lesson could be developed. We have NOT included any references to the timing associated with delivering this model. Each teacher will need to make decisions related ot the timing of the lesson plan based on the learning needs of students in the class. The model lesson plans are designed to generate evidence of student understanding. This chart indicates one or more lesson plans which have been developed for this unit. Lesson plans are being written and posted on the Curriculum Management System as they are completed. Please check back periodically for additional postings.
Standard(s) Addressed
Title Suggested Use/Description
S.ID.6S.ID.7S.ID.8S.ID.9
Introduction to the Correlation Coefficient and
Its Properties
This is a lengthy lesson plan which would take several days to complete if all of the activities are used. The various activities begin by developing linear regression model and using this model to develop the concept of the correlation coefficient and then ends with a discussion of correlation versus causation.
DRAFT Maryland Common Core State Curriculum Unit Plan for Algebra I January 2013 Page 40 of 46★ Modeling standard

DRAFT-Algebra I Unit 3: Descriptive Statistics
Lesson SeedsThe lesson seeds have been written particularly for the unit, with specific standards in mind. The suggested activities are not intended to be prescriptive, exhaustive, or sequential; they simply demonstrate how specific content can be used to help students learn the skills described in the standards. They are designed to generate evidence of student understanding and give teachers ideas for developing their own activities.
This chart indicates one or more lesson seeds which have been developed for this unit. Lesson seeds are being written and posted on the Curriculum Management System as they are completed. Please check back periodically for additional postings.
Standards Addressed
Title Description
S.ID.1 Can You Speak the Language of Statistics?
Developmental As students select the best word from a word bank which contains words connected to various data plots, they are demonstrating their prior knowledge and at the same time previewing the lesson.
S.ID.1S.ID.3
Human Box Plot MotivationThis introductory activity provides a kinesthetic way of having students become familiar with the attributes of a box plot.
S.ID.1S.ID.2
Representing Data With Plots ReinforcementStudents work in groups to make a plot for a set of collected data. They then decide if the plot that they created was the best one for the given data set.
S.ID.3 Beans, Buttons and Popcorn InvestigationStudents will collect data, create a plot, compute measures of center and variability and share findings of an investigation.
S.ID.3 Comparing Two Quantitative Data Sets
PracticeThis activity provides two data sets for which students draw two box plots on the same axis. Students are then required to compare the data sets using the plots.
DRAFT Maryland Common Core State Curriculum Unit Plan for Algebra I January 2013 Page 41 of 46★ Modeling standard

DRAFT-Algebra I Unit 3: Descriptive Statistics
Standards Addressed
Title Description
S.ID.3 The Effects of Outliers InvestigationThis activity provides a data set which has an outlier. Students investigate what happens to the summary statistics if the outlier is removed from the data set.
S.ID.7S.ID.8
Falling Objects InvestigationStudents will do an experiment to collect data. They will then find a line of best fit for the data and interpret the slope, y-intercept and correlation coefficient in terms of the context.
S.ID.9 Correlation, Causation, Confused Developmental Activity Students will read an article and then compare and contrast correlation and causation.
DRAFT Maryland Common Core State Curriculum Unit Plan for Algebra I January 2013 Page 42 of 46★ Modeling standard

DRAFT-Algebra I Unit 3: Descriptive Statistics
Sample Assessment ItemsThe items included in this component will be aligned to the standards in the unit.
Topic Standards Addressed
Link Notes
General General http://parcconline.org/samples/mathematics/high-school-mathematics
This page contains descriptions of the PARCC task types and what the tasks will ask students to do.
General General http://www.ccsstoolbox.com/parcc/PARCCPrototype_main.html
This page will contain sample items as they become available.
Single count or
Measurement Variables
S.ID.1S.ID.2S.ID.3
http://illustrativemathematics.org/illustrations/942
This site gives a possible assessment item that addresses describing and comparing distributions using box plots.
Two Categorical
and Quantitative
Variable
S.ID. 5S.ID. 6
http://map.mathshell.org/materials//tasks.php?taskid=262&subpage=apprentice
This site shows an example of an apprentice task for describing a scatterplot.
Linear ModelsS.ID.9 http://illustrativemathematics.org/
illustrations/44This site gives a possible assessment item that addresses distinguishing between correlation and causation.
DRAFT Maryland Common Core State Curriculum Unit Plan for Algebra I January 2013 Page 43 of 46★ Modeling standard

DRAFT-Algebra I Unit 3: Descriptive Statistics
ResourcesThis section contains links to materials that are intended to support content instruction in this unit.
Topic Standards Addressed
Link Notes
PlotsS.ID.1 http://www.sascurriculumpathways.com/
portal/courses/algebra.jsfUnit 5, Lesson 5-1 begins by exploring the various plots, frequency tables and reviews the 5-number summary.
Single Count or
Measurement Variable
S.ID.2S.ID.3
http://www.sascurriculumpathways.com/portal/courses/algebra.jsf
Unit 5, Lesson 5-2 walks the user through a lesson focused on shape, center and spread of data distributions.
Two Variable Categorical
Data
S.ID.5 http://www.sascurriculumpathways.com/portal/courses/algebra.jsf
Unit 5, lesson 5-3 develops the concept of summarizing categorical data in two-way frequency tables. Joint, marginal and relative frequencies are explored.
Interpreting Linear Models
S.ID.7 http://illuminations.nctm.org/LessonDetail.aspx?ID=L393
This is a link to a NCTM’s Illuminations unit on Least Square Regression. The unit offers lessons which are set in context. These lessons require the user to interpret the slope, y-intercept and correlation coefficient of linear models.
Two Variable Quantitative
Data
S.ID.6.a,b & c S.ID.8S.ID.9
http://www.sascurriculumpathways.com/portal/courses/algebra.jsf
Unit 5, lesson 5-4 provides resources that pertain to plotting residuals, correlation coefficients and the difference between correlation and causation.
All Topics All standards http://www.mathematicsvisionproject.org/ This is a link to resources developed by the Mathematics Vision Project in conjunction with the Utah State Department of Education. The resources were developed for the integrated pathway but many have application in the traditional pathway.
All Topics All standards http://nsdl.org/commcore/math?id=HS.F This is a link to the NSDL Math Common Core Collection. This collection contains digital learning objects that are related to specific Math Common Core State Standards.
DRAFT Maryland Common Core State Curriculum Unit Plan for Algebra I January 2013 Page 44 of 46★ Modeling standard

DRAFT-Algebra I Unit 3: Descriptive Statistics
Topic Standards Addressed
Link Notes
All Topics All standards http://www.ccsstoolbox.org/ Check this site periodically for new additionsClick on:
Resources for Implementation PARCC Prototyping Project High School Tasks Name of the task
All Topics All standards https://www.desmos.com/ This is a link to an online graphing calculator that has many different types of applications
All Topics All standards http://insidemathematics.org/index.php/mathematical-content-standards
This site features classroom examples of innovative teaching methods and insights into student learning, tools for mathematics instruction that teachers can use immediately, and video tours of the ideas and materials on the site.
All Topics All standards http://www.parcconline.org/samples/mathematics/high-school-mathematics
This is a link to the PARCC Prototype items. Check this site periodically for new items and assessment information.
All Topics All standards http://www.parcconline.org/sites/parcc/files/PARCCMCFMathematicsNovember2012V3_FINAL.pdf
This is a link to the PARCC Model Content Frameworks. Pages 39 through 59 of the PARCC Model Content Frameworks provide valuable information about the standards and assessments.
PARCC ComponentsKey Advances from Grades K–8 According to the Partnership for Assessment of Readiness for College and Careers (PARCC), these standards highlight major steps in aprogression of increasing knowledge and skill.
DRAFT Maryland Common Core State Curriculum Unit Plan for Algebra I January 2013 Page 45 of 46★ Modeling standard

DRAFT-Algebra I Unit 3: Descriptive Statistics
PARCC cited the following areas from which the study of the content in Algebra I Unit 3 should progress:
As students acquire mathematical tools from their study of algebra and functions, they apply these tools in statistical contexts (e.g., S-ID.6). In a modeling context, they might informally fit linear, quadratic and or exponential functions to a set of data, graphing the data and the model function on the same coordinate axes. They also draw on skills they first learned in middle school to apply basic statistics and simple probability in a modeling context. For example, they might estimate a measure of center or variation and use it as an input for a rough calculation.
Assessment Limits for Standards Assessed on More Than One End-Of-Year Test
CCSSM Cluster CCSSM Key
CCSSM Standard Algebra I Assessment Limits and Clarifications
Algebra II Assessment Limits and Clarifications
Summarize, represent, and interpret data on two categorical and quantitative variables
S.ID.6a
Represent data on two quantitative variables on a scatter plot, and describe how the variables are related.
a) Fit a function to the data to solve problems in the context of the data. Use given functions or choose a function suggested by the context. Emphasize linear, quadratic , and exponential models.
i) Tasks have real-world context.
ii) Exponential functions are limited to those with domains in the integers.
i) Tasks have a real-world context.
ii) Tasks are limited to exponential functions with domains NOT in the integers and trigonometric functions.
DRAFT Maryland Common Core State Curriculum Unit Plan for Algebra I January 2013 Page 46 of 46★ Modeling standard