Embed Size (px)
Citation preview

Budget Document No. 3
Government of Malawi
DRAFT
2018/19 FINANCIAL STATEMENT
Ministry of Finance, Economic Planning and Development
P.O. Box 30049
Lilongwe

ii 2018-19 Financial Statement

iii 2018-19 Financial Statement
DRAFT
2018/19 FINANCIAL STATEMENT

iv 2018-19 Financial Statement

v 2018-19 Financial Statement
Table of Contents
Abbreviations and Acronyms .......................................................................................................................... viii
1. INTRODUCTION .......................................................................................................................................... 9
2. THE 2016/17 FISCAL YEAR PERFORMANCE.............................................................................................. 10
2.1 Revenue and Grants ......................................................................................................................... 12
2.1.1 Domestic Revenue ................................................................................................................... 12
2.1.2 Grants ....................................................................................................................................... 13
2.2 Expenditure and Net Lending .......................................................................................................... 14
2.2.1 Recurrent Expenditure ............................................................................................................. 15
2.2.2 Development Expenditures ...................................................................................................... 15
2.3 Overall Balance ................................................................................................................................ 15
3. THE 2017/18 FISCAL YEAR PERFOMANCE ................................................................................................ 16
3.1 Revenue and Grants ............................................................................................................................... 18
3.1.1 Domestic Revenue .......................................................................................................................... 18
3.1.2 Grants .............................................................................................................................................. 19
3.2 Expenditure and Net Lending ................................................................................................................ 20
3.2.1 Recurrent Expenditure .................................................................................................................... 20
4 THE 2018/19 BUDGET ESTIMATES ................................................................................................................ 22
4.1 Revenue and Grants ......................................................................................................................... 24
4.1.1 Domestic Revenue ................................................................................................................... 24
4.1.2 Grants ....................................................................................................................................... 24
4.2 Expenditure and Net Lending .......................................................................................................... 24
4.2.1 Recurrent Expenditure ............................................................................................................. 24
4.2.1 Transfers to Local Councils ....................................................................................................... 25
4.2.2 Development Expenditures ..................................................................................................... 26
4.3 Overall Balance ................................................................................................................................ 26
5 PUBLIC DEBT PORTFOLIO AS AT 31ST DECEMBER 2017 ........................................................................... 27
External Public Debt (EPD) ......................................................................................................................... 27
5.1.1 External Debt by Holder. ................................................................................................................. 27
5.2 Domestic Public Debt (DPD) ................................................................................................................. 28
5.3 External Debt Sustainability .................................................................................................................. 30
5.4 Cost and Risk Analysis ........................................................................................................................ 30
5.5 Domestic Contingent Liabilities ............................................................................................................ 32

vi 2018-19 Financial Statement
Tables
Table 1: 2016/17 Budget Estimates and Outturn (K' millions) ........................................................................ 10
Table 2: 2017/18 Budget Performance (K' millions) ........................................................................................ 17
Table 3: 2018/19 Budget Framework (K' millions) .......................................................................................... 22
Table 4: Transfer to Councils by Sector in the 2018/19 Financial Year (K) ...................................................... 25
Table 5: Evolution of Public Debt (in Millions) ................................................................................................. 27
Table 6: Total External Debt by Holder as at End-December 2017 (USD) ....................................................... 28
Table 7: External Debt Burden Indicators (using current external debt as of December 2017....................... 30
Table 8: Interest rates ...................................................................................................................................... 30
Table 9: Cost and Risk Indicators for existing debt (end-December 2017) ..................................................... 31
Figures
Figure 1: Domestic Revenue ............................................................................................................................ 13
Figure 2: Grants Performance by Category...................................................................................................... 14
Figure 3: Expenditure Performance by Category ............................................................................................. 14
Figure 4: Domestic Revenue by Category ........................................................................................................ 19
Figure 5: Grants by Category ........................................................................................................................... 19
Figure 6: Total Expenditure and Net Lending .................................................................................................. 20
Figure 7: Domestic Debt Stock by Instrument as at end-December 2017 ...................................................... 29
Figure 8: Gross Domestic Borrowing by Holder end December 2017 ............................................................. 29
Figure 9: Maturity (Redemption profile) ......................................................................................................... 31
Annexes
ANNEX 1: 2017/18 APPROVED ESTIMATE, REVISED BUDGET, AND 2018/19 MEDIUM TERM EXPENDITURE
FRAMEWORK (K’ MILLIONS) ............................................................................................................................ 33
ANNEX 2: SUMMARY OF 2017/18 APPROVED, REVISED BUDGET AND 2018/19 MEDIUM TERM
EXPENDITURE FRAMEWORK: PERSONAL EMOLUMENTS ................................................................................ 35
ANNEX 3: SUMMARY OF 2017/18 APPROVED, REVISED BUDGET AND 2018/19 MEDIUM TERM
EXPENDITURE FRAMEWORK: ORT ................................................................................................................... 38
ANNEX 4: SUMMARY OF 2017/18 APPROVED, REVISED BUDGET AND 2018/19 MEDIUM TERM
EXPENDITURE FRAMEWORK: TRANSFERS TO SUBVENTED ORGANISATIONS ................................................. 41
ANNEX 5: SUMMARY OF 2017/18 APPROVED, 2017/18 REVISED AND 2018/19 ESTIMATES: DEVELOPMENT
......................................................................................................................................................................... 42
ANNEX 6 : SUMMARY OF EXPENDITURE BY PROGRAM (K‘MILLION) .............................................................. 62
ANNEX 7: OVERALL SUMMARY OF ESTIMATES AT ITEM LEVEL 2018/19 FINANCIAL YEAR (K’ MILLION) ....... 66
ANNEX 8: REVENUE OVERVIEW ....................................................................................................................... 68
vii 2018-19 Financial Statement
ANNEX 9: DEPARTMENTAL RECEIPTS OVERVIEW ............................................................................................ 69
ANNEX 10: PUBLIC DEBT DEFINITIONS ............................................................................................................ 70
ANNEX 11: SUMMARY OF 2018/19 OFF-BUDGET SUPPORT ........................................................................... 72
ANNEX 12: SUMMARY OF 2018/19 OFF-BUDGET SUPPORT ........................................................................... 73

viii 2018-19 Financial Statement
Abbreviations and Acronyms
AfDB African Development Bank
DfID Department for International Development
EU European Union
FISP Farm Input Subsidy Programme
GDP Gross Domestic Product
IDA International Development Assistance (IDA)
IMF International Monetary Fund
KPA Key Priority Area
LDF Local Development Fund
LUANAR Lilongwe University of Agriculture and Natural Resources
MDG Millennium Development Goal
MGDS Malawi Growth and Development Strategy
MRA Malawi Revenue Authority
MTEF Medium-Term Expenditure Framework
MUST Malawi University of Science and Technology
NAC National AIDS Commission
ORT Other Recurrent Transactions
PE Personal Emoluments
PFMA Public Finance Management Act
SWAP Sector Wide Approach
USAID United States Agency for International Development

9 2018-19 Financial Statement
1. INTRODUCTION
This Financial Statement aims to present the budget estimates in broad aggregates to facilitate easy
understanding of the detailed budget documents. The document therefore sets out the summary of
Government revenues and expenditures for the preceding Financial Years, in this case 2016/17 and
2017/18 Financial Years and projections for the forthcoming financial year and the two outer years,
thus, 2018/19 through to 2020/21. It also briefly discusses the relationship between the expenditures
of Government and key policy documents such as the Malawi Growth and Development Strategy
(MGDS) III.

10 2018-19 Financial Statement
2. THE 2016/17 FISCAL YEAR PERFORMANCE
The 2016/17 Budget was formulated with consideration to national priorities and budget policy
reforms which were implemented to sustain macroeconomic stability and spur growth. The Budget
also considered prospects in the global, sub regional and domestic economy. The Global economic
growth was projected at 3.1 percent in 2016 and 3.5 percent in 2017 (Annual Economic Report
2017). The 2017 estimate remained on track while the estimate for 2016 was revised upward to 3.2
percent (WEO Update July 2017) largely on the back of wearing off of political uncertainties in
some advanced economies. There was a rebounded in economic activities in the United States of
America and, despite the Brexit vote, in the United Kingdom the economy remained resilient
(Annual Economic Report 2017).
Growth in sub-Saharan Africa was projected at 1.4 percent in 2016, a slowdown from 3.4 percent in
2015 on account of a decline in commodity prices as well as lower demand from China which is the
major commodity trading partner for the region (IMF World Economic Outlook April 2017). In
South Africa, weaker investment confidence driven by policy uncertainties also dampened the
regional outlook. In 2017, growth for the region was expected to rebound to 2.6 percent on the back
of a recovery in oil production in Nigeria and the easing of drought conditions in eastern and
southern Africa (IMF World Economic Outlook April 2017).
In line with the macroeconomic outlook backed by the policy framework, the 2016/17 Budget was
formulated with a projected rebound in GDP growth of 5.1 percent from 3.3 percent in 2015. This
was to be achieved through continued tight monetary and fiscal policies with an emphasis on
resilience-building investments. However, economic growth rate closed at 2.7 percent in 2016 on
account of unfavorable weather conditions. Table 1 highlights the allocations and outturn for
2016/17 Budget.
Table 1: 2016/17 Budget Estimates and Outturn (K' millions)
Category
2016/17
Approved
Estimates
2016/17 Revised
Estimates
2016/17 Actual
Outturn
Revenue and Grants 978,017 984,065 971,056
Revenue 783,291 840,463 823,350
Tax revenue 708,837 754,909 750,144
Non-tax revenue 74,454 85,554 73,206
Grants 194,726 143,602 147,706
Program grants 13,583 7,500 11,768

11 2018-19 Financial Statement
Category
2016/17
Approved
Estimates
2016/17 Revised
Estimates
2016/17 Actual
Outturn
Dedicated grants 53,822 43,544 62,433
PFEM Pool Trust Fund 8,995 - -
Agriculture SWAP 19,927 18,502 9,851
WB Recovery Resources 7,263 7,263 45,324
FISP 3,750 3,750 -
NAC grants 3,769 3,215 2,657
Health Joint Fund 6,349 7,045 4,601
Education Joint Fund 3,769 3,769 -
Project grants 127,321 92,558 73,505
Total expenditure and Net Lending 1,149,212 1,137,465 1,124,641
Recurrent expenditure 823,280 884,092 847,351
Wages and salaries 272,269 264,889 265,128
Interest on debt 143,519 197,078 185,141
Foreign 11,408 14,175 12,439
Domestic 132,111 182,903 172,703
Goods, services and transfers 239,867 252,244 232,066
Generic goods and services 93,441 116,156 96,193
Storage Levy 1,375 1,595 1,590
Roads Maintenance 19,160 22,622 24,002
Other Statutory Expenditures 5,417 5,417 5,417
Agriculture Sector 3,961 3,923 3,861
Health Sector 35,025 35,397 36,882
Education Sector 22,686 23,945 23,925
Elections 1,500 887 1,017
PFEM 8,995 - 302
NAC 12,807 12,807 8,124
of which NAC grants 11,307 11,307 838
Winter Cropping (Irrigation) 6,000 - -
Maize Purchases 29,500 29,500 30,754
Subsidies and Transfers 162,625 166,882 162,115
Pensions and Gratuities 50,155 52,247 52,247
Transfer to Revenue Authorities 20,631 22,647 23,040
FISP 33,150 33,000 29,400
of which Fertilizer Purchases 27,000 27,000 27,000
Seed Subsidy 5,150 5,000 1,400
Of Which: Donor Support 3,750 3,750 -
Logistics 1,000 1,000 1,000
Transfer to public entities 48,340 50,140 50,140
Iron Sheet Subsidy 7,000 5,500 5,500
WB reconstruction (PIU &DODMA) 3,349 3,349 -
Legumes - - 1,789

12 2018-19 Financial Statement
Category
2016/17
Approved
Estimates
2016/17 Revised
Estimates
2016/17 Actual
Outturn
Arrears (Small scale) 5,000 3,000 2,900
Development expenditure 322,472 249,913 273,831
Domestically financed projects (Part II) 38,581 32,084 28,032
Foreign financed projects (Part I) 283,891 217,829 245,799
Net Lending 3,460 3,460 3,460
Overall balance (171,195) (153,400) (153,585)
Total financing 171,195 153,400 153,585
Foreign (net) 111,195 76,603 104,485
Borrowing 136,716 105,123 129,031
Program Loans 23,731 31,937 22,909
Project Loans 112,985 73,186 106,122
Amortization (25,521) (28,521) ( 24,546)
Domestic Borrowing (Net) 60,000 65,471 37,228
Privatization Proceeds - 11,325 11,872
2.1 Revenue and Grants
In the 2016/17 Financial Year, Revenue and Grants were estimated at K978.0 billion comprising
K783.3 billion Domestic Revenue and K194.7 billion Grants. At the midyear review, the projection
was revised upwards to K984.1 billion of which K840.5 billion was Domestic Revenue and K143.6
billion was Grants.
At the end of the Financial Year, Revenue and Grants amounted to K971.1 billion against a revised
projection of K984.1 billion. The variance of K13.0 billion was due to underperformance on
domestic revenues. On the other hand, Grants over performed by K4.1 billion where a total of
K147.7 billion was disbursed as compared to midyear target of K143.6 billion.
2.1.1 Domestic Revenue
In the 2016/17 Financial Year, Domestic Revenues were projected at K783.3 billion comprising
K708.8 billion Tax Revenue and K74.5 billion Non Tax Revenue. This projection was revised
upwards to K840.5 billion of which Tax Revenues and Non Tax Revenues were projected at K46.1
billion and K11.1 billion, respectively.
At the end of the financial year, total Domestic Revenue of K823.1 billion was collected against a
midyear target of K840.5 billion there by underperforming by K17.1 billion. This is explained by

13 2018-19 Financial Statement
under collection in both Tax Revenue and Non Tax Revenue of K4.8 billion and K12.3 billion,
respectively. Figure 1 below provides a detailed performance of Domestic Revenue by category.
Figure 1: Domestic Revenue
2.1.2 Grants
Grants which were projected at K194.7 billion comprised K13.6 billion Programme Grants, K53.8
billion Dedicated Grants and K127.3 billion Project Grants. At midyear, Grants were revised
downwards to K143.6 billion comprising K7.5 billion Programme Grants, K43.5 billion Dedicated
Grants and K92.6 billion Project Grants.
At the end of the Financial Year, Grants registered an over performance of K4.1 billion. A total of
K147.7 billion was disbursed against a midyear target of K143.6 billion. Despite most of the grant
categories underperforming, World Bank disaster recovery resources totalling K45.3 billion were
disbursed against a midyear projection of K7.3 billion. The resources were for emergency response
to disasters that affected the country. Figure 2 below provides details on Grants.

14 2018-19 Financial Statement
Figure 2: Grants Performance by Category
2.2 Expenditure and Net Lending
In the 2016/17 Financial Year, total Expenditure and Net Lending was estimated at K1,149.2
billion comprising Recurrent Expenditure of K823.3 billion and Development Expenditure of
K322.5 billion. At midyear, the projection was revised to K1,137.5 billion of which K884.1 billion
was Recurrent Expenditure and K249.9 billion was Development Expenditure. At the end of the
financial year, Total Expenditure and Net Lending amounted to K1,124.6 billion against a midyear
projection of K1, 137.5 billion. This was due to a reduction on overall expenditure by K36.7 billion.
Figure 3 below provides detailed breakdown of the performance of expenditure by category.
Figure 3: Expenditure Performance by Category

15 2018-19 Financial Statement
2.2.1 Recurrent Expenditure
The Recurrent Expenditure which was projected at K823.4 billion in 2016/17 Financial Year
included K272.3 billion Wages and Salaries, K143.5 billion Interest on Public Debt and K162.6
billion Subsidies and Transfers. At midyear, the projection was revised to K884.1 billion of which
K264.9 billion was for Wages and Salaries, K166.9 billion Subsidies and Transfers and K197 .1
billion was for Interest on Public Debt.
Total Recurrent Expenditure at the end of the financial year amounted to K847.4 billion thereby
registering an under expenditure of K36.1 billion. This was largely as a result of reduced
expenditures of K20.9 billion in Generic Goods and Services and of K11.9 billion on Public Debt
Interest.
2.2.2 Development Expenditure
In the 2016/17 Financial Year, Development Expenditure was projected at K322.5 billion of which
K38.6 billion was for domestically financed projects while K283.9 billion was for foreign financed
projects. At Midyear, the projection was reduced to K249.9 billion with domestically financed
projects projected at K32.1 billion while foreign financed projects were revised to K217 billion. At
the end of the Financial Year, Development Expenditure amounted to K273.8 billion thereby
registering an over performance due to more disbursement on Foreign Financed projects by K28
billion.
2.3 Overall Balance
In the 2016/17 Financial Year, the initial projected fiscal deficit of K171.2 billion was revised
downwards at midyear to K153.4 billion on account of anticipated over performance in Domestic
Revenue and underperformance in Project Loans. The midyear revised projection was largely met
with the financial year closing with a deficit of K153.6 billion.

16 2018-19 Financial Statement
3. THE 2017/18 FISCAL YEAR PERFOMANCE
The 2017/18 Budget was formulated with consideration to national priorities and against a
background of various fundamentals of the global, regional and domestic economy. In 2017, the
World economy was projected to grow by 3.4 percent. With a pickup in global activities and
continued recovery in investment, trade and industrial production, the economy grew by 3.5 percent
in 2017 from 3.1 percent in 2016 (World Economic Outlook, October, 2017). In 2018 the global
economy is projected to grow by 3.6 percent on account of a buoyant world financial market, a
recovery in manufacturing and trade in major economies such as Japan, Germany and the US
(World Economic Outlook April 2017).
Growth in Emerging and Developing Economies was expected to pick up from 4.3 percent in 2016
to 4.5 percent in 2017 after a constant decline in the last five years. The economy grew by 4.6
percent in 2017 mainly due to improving conditions in large commodity exporters. Although
growth in countries such as China remained strong on the back of sound policy support, economic
activities in other economies such as India slowed down on account of the impact of the currency
exchange initiative and an enduring deep recession experienced in countries like Brazil. In 2018,
growth is expected to improve further to 4.8 percent.
There was a prospect for recovery for the Sub-Saharan Africa region with growth projected to rise
from 1.4 percent in 2016 to 2.6 percent in 2017 and 3.5 percent in 2018. This was expected to be
driven largely by a modest recovery in commodity prices in the region’s major economies such as
South Africa, Nigeria and Angola, and the easing of drought conditions resulting in higher
agriculture yield. Many non-resource-intensive countries which had previously relied on higher
public capital spending were expected to grow at a slower pace due to rising public debt and a
slowing credit cycle.
GDP growth for Malawi was projected at 6.1 percent for 2017 up from 2.7 percent in 2016. In 2017
the economy showed signs of recovery from weather related shocks which resulted in poor
agricultural season the year before. The favorable onset of rains at the beginning of 2017 was the
major factor for the upward growth projection. Other sectors that were expected to contribute to the
growth included manufacturing, wholesale and retail and transport. Table 2 highlights 2017/18
Budget Framework.

17 2018-19 Financial Statement
Table 2: 2017/18 Budget Performance (K' millions)
Category
2017/18
Approved
Estimates
2017/18
Revised
Estimates
2017/18 Likely
Outturn
Revenue and Grants 1,127,743 1,130,347 1,096,798
Revenue 980,157 953,120 978,773
Tax revenue 900,714 873,685 877,780
Non-tax revenue 79,444 79,435 100,993
Grants 147,586 177,227 118,025
Program grants 55,752 60,000 -
Dedicated grants 32,539 30,531 31,329
PFEM Pool Trust Fund 7,007 5,000 5,798
Agriculture SWAP 5,806 5,806 5,806
NAC grants 6,169 6,169 6,169
Health Joint Fund 6,569 6,569 6,569
Education Joint Fund 6,987 6,987 6,987
Project grants 59,295 86,696 86,696
Total expenditure and Net Lending 1,323,313 1,313,968 1,321,301
Recurrent expenditure 966,318 998,146 1,028,570
Wages and salaries 309,576 315,215 316,223
Interest on debt 177,319 167,512 190,446
Foreign 13,880 13,880 14,215
Domestic 163,439 153,632 176,231
Goods, services and transfers 278,965 319,351 315,351
Generic goods and services 128,246 134,899 135,899
Storage Levy 1,851 1,851 1,851
Roads Maintainance 16,229 16,229 16,229
Other Statutory Expenditures 2,000 2,000 2,000
Agriculture Sector 4,984 7,015 7,015
Health Sector 36,635 36,236 36,236
Education Sector 25,255 25,255 25,255
Elections 10,850 10,061 10,061
PFEM 7,007 5,000 -
NAC 7,669 7,669 7,669
of which NAC grants 6,169 6,169 6,169
Maize Purchases 35,000 69,897 69,897
Housing and Population Census 3,240 3,240 3,240
Subsidies and Transfers 196,459 192,068 202,550
Pensions and Gratuities 68,601 68,601 76,101
of which Govt Contribution to NPS 7,615 7,615 7,615
Transfer to Revenue Authorities 27,021 25,403 25,403
FISP 33,150 33,150 33,150
of which Fertilizer Purchases 27,000 27,000 27,000

18 2018-19 Financial Statement
Category
2017/18
Approved
Estimates
2017/18
Revised
Estimates
2017/18 Likely
Outturn
Seed Subsidy 5,150 5,150 5,150
Logistics 1,000 1,000 1,000
Transfer to public entities 57,326 54,554 54,536
Iron Sheet Subsidy 7,000 7,000 10,000
WB reconstruction (PIU &DODMA) 3,360 3,360 3,360
Arrears (Small scale) 4,000 4,000 4,000
Development expenditure 352,995 311,822 288,731
Domestically financed projects (Part II) 134,856 103,683 80,592
Foreign financed projects (Part I) 218,139 208,139 208,139
Net Lending 4,000 4,000 4,000
Overall balance (195,570) (183,621) (224,503)
Total financing 195,570 183,621 224,503
Foreign (net) 167,761 152,921 152,921
Borrowing 196,282 181,442 181,442
Program Loans 71,290 66,450 66,450
Project Loans 124,992 114,992 114,992
Amortisation (28,521) (28,521) (28,521)
Domestic Borrowing (Net) 27,809 30,700 71,582
3.1 Revenue and Grants
In the 2017/18 Financial Year, Revenue and Grants were projected at K1,127.7 billion comprising
K980.2 billion Domestic Revenue and K147.6 billion Grants. At midyear, the estimates were
revised upwards to K1,130.3 billion of which K953.1 billion were Domestic Revenue and K177.2
billion were Grants.
3.1.1 Domestic Revenue
Domestic Revenues are expected to amount to K978.8 billion against a midyear target of K953.1
billion thereby registering an over performance of K25.7 billion. Tax Revenues are pegged at
K877.9 billion against a midyear target of K873.7 billion reflecting an over performance of K4.1
billion while Non Tax Revenues are projected to amount to K101.0 billion against a midyear
allocation of K79.4 billion thereby surpassing the target by K21.6 billion.

19 2018-19 Financial Statement
Figure 4: Domestic Revenue by Category
3.1.2 Grants
The 2017/18 Financial Year projected Grants of K147.6 billion comprised K55.8 billion
Programme Grants, K32.5 billion Dedicated Grants and K59.3 billion Project Grants. At midyear,
total Grants were revised upwards by K29.6 billion. It is anticipated that a total of K118.0 billion
will be disbursed comprising K31.3 billion Dedicated Grants and K86.7 billion Project Grants
representing an overall underperformance of K59.2 billion. Figure 5 below provides details on
Grants.
Figure 5: Grants by Category

20 2018-19 Financial Statement
3.2 Expenditure and Net Lending
In the 2017/18 Financial Year, total Expenditure and Net Lending was estimated at K1,323.3 billion
comprising Recurrent Expenditure of K966.3 billion and Development Expenditure of K353.0
billion. At midyear, the projection was revised to K1,314.0 billion of which K998.1 billion was
Recurrent Expenditure and K311.8 billion Development Expenditure. It is estimated that total
Expenditure and Net Lending will amount to K1,321.3 billion reflecting an over expenditure of
K7.3 billion. Figure 6 below highlights the pattern of Expenditure by different categories.
Figure 6: Total Expenditure and Net Lending
3.2.1 Recurrent Expenditure
Recurrent Expenditures are projected to amount to K1,028.6 billion against midyear provision of
K998.1 billion reflecting an over expenditure of K30.4 billion. This is mainly on account of over
expenditures on Interest on Public Debt and Pensions and Gratuities amounting to K22.9 billion and
K7.5 billion respectively.
3.2.2 Development Expenditure
Development Expenditure is estimated to amount to K288.7 billion against the midyear target of
K311.8 billion reflecting an under expenditure of K23.1 billion. This outturn is mainly on account
of reduced expenditures on domestically financed projects.

21 2018-19 Financial Statement
3.3 Overall Balance
The 2017/18 Financial Year is estimated to end with a fiscal deficit position of K224.5 billion
against midyear projection of K183.6 billion. The deficit position is largely explained by poor
performance of Grants which are likely to miss the target by K59.2 billion.

22 2018-19 Financial Statement
4 THE 2018/19 BUDGET ESTIMATES
The 2018/19 Budget has been prepared in line with MGDS III which provides the overriding
guidance in policy formulation. The emphasis is on building a competitive and resilient economy in
the face of frequent natural disasters that have in recent years dampened regional and domestic
economic growth. The Budget has also been formulated against a background of accelerated global
economic growth. World output is projected to grow at 3.9 percent in both 2018 and 2019 (WEO
Update, January 2018). This output will mainly be driven by growth in the advanced economies
where output is expected to exceed 2 percent in 2018 and 2019. In the Sub Saharan Africa region,
growth is projected at 3.3 percent in 2018, an increase from 2.7 percent in 2017 and is expected to
remain relatively stable at 3.5 percent in 2019. The Growth is expected to be supported by
improvement in commodity prices and slowing down of inflation that has in lifting household
demand. This output reflected a modest recovery in countries such as Angola, Nigeria and South
Africa.
In Malawi, the economy is projected to grow by 4 percent in 2018 which is higher than the regional
projection but lower than growth in 2017. The slowdown is primarily attributed to the erratic
weather conditions and natural disasters that have adversely affected the harvest. In 2019 the
economy is projected to grow by 6 percent anchored by continued tight monetary and fiscal policies
and resilience-building investments. Table 3 provides 2018/19 Budget Framework including
2017/18 revised Estimates and two outer years’ projections.
Table 3: 2018/19 Budget Framework (K' millions)
Category
2017/18
Approved
Estimates
2017/18
Revised
Estimates
2018/19
Estimates
2019/20
Projections
2020/21
Projections
Revenue and Grants 1,127,743 1,130,347 1,261,331 1,153,536 1,260,089
Revenue 980,157 953,120 1,052,250 1,126,390 1,239,029
Tax revenue 900,714 873,685 940,040 1,034,044 1,137,448
Non-tax revenue 79,444 79,435 112,210 92,347 101,581
Grants 147,586 177,227 209,081 27,146 21,059
Program grants 55,752 60,000 60,000 - -
Dedicated grants 32,539 30,531 62,720 - -
PFEM Pool Trust Fund 7,007 5,000 2,250 - -
Agriculture SWAP 5,806 5,806 27,000 - -
WB Recovery Resources - - 7,005 - -
NAC grants 6,169 6,169 - - -
Health Joint Fund 6,569 6,569 9,153 - -
Education Joint Fund 6,987 6,987 17,311 - -

23 2018-19 Financial Statement
Category
2017/18
Approved
Estimates
2017/18
Revised
Estimates
2018/19
Estimates
2019/20
Projections
2020/21
Projections
Project grants 59,295 86,696 86,361 27,146 21,059
Total expenditure and Net Lending 1,323,313 1,313,968 1,504,191 1,429,237 1,530,418
Recurrent expenditure 966,318 998,146 1,104,509 1,169,756 1,303,268
Wages and salaries 309,576 315,215 392,939 478,569 572,903
Interest on debt 177,319 167,512 182,904 201,195 221,314
Foreign 13,880 13,880 14,341 15,776 17,353
Domestic 163,439 153,632 168,563 185,419 203,961
Goods, services and transfers 278,965 319,351 305,297 253,450 262,713
Generic goods and services 128,246 134,899 143,376 134,280 139,151
Storage Levy 1,851 1,851 1,980 2,178 2,396
Roads Maintenance 16,229 16,229 20,180 20,314 21,295
Other Statutory Expenditures 2,000 2,000 1,500 1,550 1,603
Agriculture Sector 4,984 7,015 7,066 7,181 7,490
Health Sector 36,635 36,236 45,116 46,407 47,762
Education Sector 25,255 25,255 28,133 29,540 31,017
Elections 10,850 10,061 31,462 2,000 2,000
PFEM 7,007 5,000 80 - -
NAC 7,669 7,669 - - -
Maize Purchases 35,000 69,897 20,000 10,000 10,000
Housing and Population Census 3,240 3,240 6,402 - -
Subsidies and Transfers 196,459 192,068 219,369 232,543 242,338
Pensions and Gratuities 68,601 68,601 80,639 85,239 90,126
of which Govt Contribution to NPS 7,615 7,615 11,362 12,498 13,748
Transfer to Revenue Authorities 27,021 25,403 27,600 28,980 30,429
FISP 33,150 33,150 41,250 39,150 39,150
of which Fertilizer Purchases 27,000 27,000 30,000 30,000 30,000
Seed Subsidy 5,150 5,150 10,150 8,050 8,050
Logistics 1,000 1,000 1,100 1,100 1,100
Transfer to public entities 57,326 54,554 65,880 69,174 72,633
Iron Sheet Subsidy 7,000 7,000 - 10,000 10,000
WB reconstruction (PIU
&DODMA) 3,360 3,360 4,000 - -
Arrears (Small scale) 4,000 4,000 4,000 4,000 4,000
Development expenditure 352,995 311,822 391,682 252,581 220,251
Domestically financed projects (Part
II) 134,856 103,683 158,350 110,315 111,897
Foreign financed projects (Part I) 218,139 208,139 233,332 142,266 108,354
Net Lending 4,000 4,000 8,000 6,900 6,900
Overall balance (195,570) (183,621) (242,860) (275,701) (270,330)
Total financing 195,570 183,621 242,860 275,701 270,330
Foreign (net) 167,761 152,921 66,777 40,563 30,648
Borrowing 196,282 181,442 107,262 81,048 71,133
Program Loans 71,290 66,450 3,005 - -

24 2018-19 Financial Statement
Category
2017/18
Approved
Estimates
2017/18
Revised
Estimates
2018/19
Estimates
2019/20
Projections
2020/21
Projections
Project Loans 124,992 114,992 104,257 81,048 71,133
Amortisation (28,521) (28,521) (40,485) (40,485) (40,485)
Domestic Borrowing (Net) 27,809 30,700 176,084 235,139 239,682
4.1 Revenue and Grants
In the 2018/19 Financial Year, Revenue and Grants are projected at K1,261.3 billion of which
K1,052.3 billion are Domestic Revenues and K209.1 billion are Grants.
4.1.1 Domestic Revenue
The 2018/19 projected Domestic Revenue of K1,052.3 billion comprises K940.0 billion Tax
Revenue and K112.2 billion Non Tax Revenue.
4.1.2 Grants
Total Grants for the 2018/19 Financial Year is projected at K209.1 billion and comprises K60.0
billion Programme Grants, K62.7 billion Dedicated Grants and K86.4 billion Project Grants.
4.2 Expenditure and Net Lending
In the 2018/19 Financial Year, Total Expenditure and Net Lending is estimated at K1,504.2 billion
of which K1,104.5 billion is Recurrent Expenditure and K391.7 billion is Development
Expenditure.
4.2.1 Recurrent Expenditure
The proposed Recurrent Expenditure of K1,104.5 billion comprises Wages and Salaries of K392.9
billion, K182.9 billion Interest payments and K305.3 billion Goods, services and transfers. The
Goods, services and transfers also includes K80.6 billion Pensions and Gratuities, K45.1 billion
Health Sector, K31.5 billion Elections and K28.1 billion Education Sector.

25 2018-19 Financial Statement
4.2.1 Transfers to Local Councils
As indicated in Table 4 below, a total of K219.1 billion is projected to be transferred to District and
City Councils for the 2018/19 Financial Year. Personal Emoluments out of this projection amount
to K173.5 billion. Education and Health Sectors continue to get the lion’s share of ORT resources
compared to all the other sectors. Education Sector has been allocated K9.5 billion and Health
Sector K8.4 billion. The Health Sector allocation excludes K14.3 billion for drugs in the district
hospitals allocated under the National Local Government Finance Committee. The Development
Budget of K20.7 billion allocated to the District Councils comprises K10 billion for upgrading of
city roads and K10.7 billion for other rural projects including Constituency Development Fund
CDF) financed projects.
Table 4: Transfer to Councils by Sector in the 2018/19 Financial Year (K)
Category
2017-18
Approved
Estimates
2018/19
Estimates
2019/20
Projections
2020/21
Projections
Personal Emoluments
134,364,643,447
173,483,790,752
206,293,800,902
247,205,773,083
Agricultural Sector
1,461,804,184
1,534,894,394
1,611,639,113
1,692,221,069
Education Sector
9,080,959,485
9,535,007,460
10,011,757,833
10,512,345,724
Health Sector 7,979,637,400 8,378,619,270 8,797,550,234 9,237,427,745
General Resource Fund
2,600,291,656
2,730,306,239
2,866,821,551
3,010,162,629
Youth
157,500,000
165,375,000
173,643,750
182,325,937
Sports
150,000,000
157,500,000
165,375,000
173,643,750
Housing
157,500,000
165,375,000
173,643,750
182,325,937
Trade
157,500,000
165,375,000
173,643,750
182,325,937
Water
187,500,000
196,875,000
206,718,750
217,054,687
Gender
420,000,000
220,500,000
231,525,000
243,101,250
Community Development
220,500,000
2,780,026,195
2,919,027,505
Environment
157,500,000
165,375,000
173,643,750
182,325,938
Forestry
157,500,000
165,375,000
173,643,750
182,325,938
Fisheries
157,500,000
165,375,001
173,643,751
182,325,938
OPC-NRB
207,500,000
217,875,000
228,768,750
240,207,188
Labour
210,000,000
220,500,000
231,525,000
243,101,250

26 2018-19 Financial Statement
Category
2017-18
Approved
Estimates
2018/19
Estimates
2019/20
Projections
2020/21
Projections
Immigration
210,000,000
220,500,000
231,525,000
243,101,250
Irrigation
210,000,000
220,500,000
231,525,000
243,101,250
Constituency Development Fund
3,860,000,000
-
-
-
Infrastructure Development Fund
771,913,750
-
-
-
Personal Emoluments
134,364,643,447
173,483,790,752
206,293,800,902
247,205,773,083
Other Recurrent Transactions
28,294,606,476
24,845,827,361
28,636,619,925
30,068,450,921
Total Recurrent
162,659,249,923
198,329,618,113
234,930,420,827
277,274,224,003
Locally Funded Projects (Part II)
17,300,000,000
20,749,509,438
15,000,000,000
15,000,000,000
Total Capital
17,300,000,000
20,749,509,438
15,000,000,000
15,000,000,000
Total Local Councils
179,959,249,923
219,079,127,551
249,930,420,827
292,274,224,003
4.2.2 Development Expenditure
The projected Development Expenditure of K391.7 billion comprises K158.4 billion for
domestically financed projects and K233.3 billion for foreign financed projects.
4.3 Overall Balance
On the basis of the proposed estimates, the 2018/19 Financial Year is expected to end with a fiscal
deficit of K242.9 billion. The deficit is to be financed by net external borrowing of K66.8 billion
and domestic borrowing of K176.1 billion.

27 2018-19 Financial Statement
5 PUBLIC DEBT PORTFOLIO AS AT 31ST
DECEMBER 2017
This chapter provides an update on the status of public debt in Malawi as at end December 2017
and reviews recent economic developments in the country that will affect Malawi’s future debt
trajectory.
As of end December 2017, the total public debt (TPD) amounted to MK2.7 trillion. This accounted
for 55 percent of Gross Domestic Product (GDP) with External Debt accounting for 29 percent
(MK1.466 trillion1) and Domestic Debt accounting for 26 percent (MK1.285 trillion) of GDP.
Table 5: Evolution of Public Debt (in Millions)
2005
2006
(HIPC) 2014 2015 2016 2017
Total Public Debt
(MK) 426,592 130,846 1,336,403 1,710,358 2,082,208 2,752,019
External (USD) 2,969 452 1,804 1,783 1,790 2,021
Domestic (MK) CV 73,337 68,957 487,022 526,446 806,223 1,285,596
GDP 326,957 430,522 2,534,656 3,108,177 3,892,000 5,002,500
Domestic Revenue 62,062 75,805 467,450 592,265 751,635 930,000
5.1 External Public Debt (EPD)
Of the total outstanding external debt stock of USD2.021 billion, multilateral creditors continued to
account for the largest proportion of the external debt. A total of US$1.564 billion representing 77.4
percent of total external debt is from the multilateral creditors while US$457.3 million is from the
bilateral donors representing 22.6 percent.
5.1.1 External Debt by Holder.
The top five external creditors are the World Bank, presented as the International Development
Association (IDA), the African Development Fund, the International Monetary Fund, the People’s
Republic of China and India. While the IDA remains the largest creditor, bilateral donors India and
China have increased their loans to the country in recent years.
1 Exchange rate used US$1=MK 725.584

28 2018-19 Financial Statement
Table 6: Total External Debt by Holder as at End-December 2017 (USD)
Creditor Debt Outstanding % of Total
External Debt
International Development Association 860,087,239.60 42.56
African Development Fund 290,310,053.98 14.36
Export-Import Bank of China (Main-Land) 236,412,402.38 11.70
International Monetary Fund 223,838,296.00 11.08
Export Import Bank of India 142,124,420.89 7.03
International Fund for Agric. Development 77,462,151.44 3.83
OPEC Fund for International Development 55,034,511.19 2.72
Kuwait Fund for Arab Economic Development 42,449,070.45 2.10
Arab Bank for Economic Development in Africa 40,724,413.48 2.02
Nordic Development Fund 20,575,685.69 1.02
European Investment Bank 16,245,254.27 0.80
Saudi Fund for Development 6,717,939.81 0.33
Abu Dhabi Fund for Development 5,800,832.03 0.29
Government of Belgium 1,731,832.71 0.09
Export and Import Bank of China 1,509,750.00 0.07
Total External Debt 2,021,023,853.91 100.00
5.2 Domestic Public Debt (DPD)
The Government contracted domestic debt in order to finance the budget deficit so as to meet its
expenditure commitments. The domestic debt was also contracted to implement monetary policy
through open market operations. In addition, the domestic debt instruments were important in
financial market development in cases where the debt was contracted as a means to further develop
Malawi’s domestic debt market.
During the period in review, the principal on domestic debt stock amounted to MK1, 036 billion
(including zero coupon promissory notes)2, of which 66 percent were Treasury Notes, 25 percent
Treasury Bills (T-bills), 5 percent Zero Coupon Promissory Notes and 4 percent Ways and Means
Advances and less than 1percent of the debt composed of Promissory Notes.
2In terms of face value (principal plus interest) Malawi’s domestic debt stock amounted to MK1.328
trillion.

29 2018-19 Financial Statement
Figure 7: Domestic Debt Stock by Instrument as at end-December 2017
T-bill
25%
T-Notes
66%
P-Notes
0%
Ways and
Means
4%
ZCPNs
5%
T-bill T-Notes P-Notes Ways and Means ZCPNs
During the same period, domestic securities amounted to MK984.7 billion in cost value (excluding
zero coupon promissory notes). Of this figure, 58 percent were held by RBM, 19 percent by
commercial banks and 15 percent by insurance companies and pension funds while the discount
houses, the foreign sector and the corporate sector made up the majority of the “other” holders of
Government domestic debt. Other financial institutions, Households and Government/parastatal
institutions combined held less than a quarter of a percent of domestic debt and as such were
omitted from Figure 8 below.
Figure 8: Gross Domestic Borrowing by Holder end December 2017
Reserve
Bank of
Malawi58%
Commercial
Banks
19%
Discount
Houses
1%
Pension
Funds
5%
Insurance
companies
10%
Corporate
Sector
2%
Foreign
Sector
5%

30 2018-19 Financial Statement
5.3 External Debt Sustainability
As at end-December 2017, Malawi’s external debt portfolio remains sustainable over the medium
term with all sustainability indicators falling below their recommended thresholds. However, the
country does face a moderate risk of external debt distress as it is highly vulnerable to export
related shocks.
Table 7: External Debt Burden Indicators (using current external debt as of December 2017)
Category Threshold 2017 2018 2019 2020 2021
PV of debt - GDP 30% 21.4% 21.7% 22.5% 22.9% 23.3%
PV of debt - exports 100% 72.7% 76.6% 83.8% 89.7% 95.3%
PV of debt - revenue 200% 90.4% 98.5% 101.7% 102.9% 104.5%
Debt service - exports 15%
10.9% 5.6% 5.9% 6.1%
Debt service - revenue 18%
14.0% 6.8% 6.8% 6.7%
5.4 Cost and Risk Analysis
Between July-December 2017, domestic and external debt interest payments amounted to MK78,
260 million (1.9 percent of GDP) and MK5, 474 million (0.1 percent of GDP), respectively.
Domestic interest payments totaled 93.5 percent of the total interest paid in 2017 with a weighted
average interest rate of 12.3 percent; whilst the weighted average for external debt interest rates was
0.6 percent, resulting in a country average of 6.1 percent for the total public debt portfolio. In terms
of interest rate structure, all external loans and domestic debt securities are contracted on fixed rate
basis. The Table below presents interest rate for the loan instruments.
Table 8: Interest rates
Loan instruments Interest Rate (Average over period of
analysis)
Existing & new AfDF/Existing IDA 0.75%
Concessional 0.75%
Semi-concessional (USD) 2.00%
Semi-concessional (CNY) 2.00%
Non-Concessional (Commerical) 9.65%
ZCPNs (FX denominated) 0.00%
T-bills 15.50%
T-bonds (2 year) 15.80%
T-bonds (3 year) 16.08%
T-bonds (5 year) 16.49%
T-bonds (7 year) 17.00%

31 2018-19 Financial Statement
Loan instruments Interest Rate (Average over period of
analysis)
ZCPNs (MWK denominated) 0.00%
In terms of risk, Malawi’s public debt is exposed to significant re-financing, interest and exchange
rate risks. The refinancing (and/or roll-over) risk and interest rate risk are on account of the
domestic debt portfolio which is dominated by short-term instruments, with 39.9% of domestic debt
maturing in 2018 (refer to Figure below). It is for this reason that Government is moving to long-
term instruments.
Figure 9: Maturity (Redemption profile)
As of end-December 2017, 52.6 percent of the debt stock was denominated in foreign currency.
This means that over half of the debt is susceptible to fluctuations in the exchange rate, leaving the
country susceptible to exchange rate shocks as well as changes in the demand for, and the prices of,
the country’s exports.
Table 9: Cost and Risk Indicators for existing debt (end-December 2017)
Risk Indicators External debt
Domestic
debt
Total
debt
Amount (in millions of MWK) 1,466,423 1,320,597 2,787,019
Amount (in millions of USD) 2,021 1,820.0 3,841
Nominal debt as % GDP 35.1 31.6 66.6
PV as % of GDP 20.3 31.6 51.8
Cost of debt Interest payment as % GDP 0.2 3.9 4.1

32 2018-19 Financial Statement
Risk Indicators External debt
Domestic
debt
Total
debt
Weighted Av. IR (%) 0.6 12.3 6.1
Refinancing risk
ATM (years) 14.3 2.9 8.9
Debt maturing in 1yr (% of total) 5.9 39.9 22.0
Debt maturing in 1yr (% of GDP) 2.1 12.6 14.7
Interest rate risk
ATR (years) 14.3 2.9 8.9
Debt re-fixing in 1yr (% of total) 5.9 39.9 22.0
Fixed rate debt (% of total) 100.0 100.0 100.0
FX risk FX debt (% of total debt) 52.6
5.5 Domestic Contingent Liabilities
Contingent liabilities are potential obligations that could arise from Government guarantees for
non-sovereign borrowings, including liabilities of local governments and public and private sector
enterprises, government insurance schemes, payments of arrears arising from goods and services
rendered to government but not yet paid, and bank failures and other financial sector bail-outs.
Contingent liabilities are a potential risk to the Government. Our key contingent liabilities arise
from Government issuing guarantees and consent letters that are issued to state owned enterprises
that provide social and essential services to the society.
During the period under review, Government bailed out ADMARC for maize purchased for MK45
billion. The guarantees to ADMARC were to local commercial banks and it is hoped that the cost
will be recouped once the maize is sold. Although quantifying contingent liabilities is challenging
because of the complexity of determining the probability of materialization, Government has
devised means of monitoring contingent liabilities through periodic assessment of the financial
performance of the institutions that have guarantees.

33 2018-19 Financial Statement
ANNEX 1: 2017/18 APPROVED ESTIMATE, REVISED BUDGET, AND 2018/19 MEDIUM
TERM EXPENDITURE FRAMEWORK (K’ MILLIONS)
Category
2017/18
Approved
Estimates
2017/18
Revised
Estimates
2018/19
Estimates
2019/20
Projections
2020/21
Projections
Revenue and Grants 1,127,743 1,130,347 1,261,331 1,153,536 1,260,089
Revenue 980,157 953,120 1,052,250 1,126,390 1,239,029
Tax revenue 900,714 873,685 940,040 1,034,044 1,137,448
Non-tax revenue 79,444 79,435 112,210 92,347 101,581
Grants 147,586 177,227 209,081 27,146 21,059
Program grants 55,752 60,000 60,000 - -
Dedicated grants 32,539 30,531 62,720 - -
PFEM Pool Trust Fund 7,007 5,000 2,250 - -
Agriculture SWAP 5,806 5,806 27,000 - -
WB Recovery Resources - - 7,005 - -
NAC grants 6,169 6,169 - - -
Health Joint Fund 6,569 6,569 9,153 - -
Education Joint Fund 6,987 6,987 17,311 - -
Project grants 59,295 86,696 86,361 27,146 21,059
Total expenditure and Net Lending 1,323,313 1,313,968 1,504,191 1,429,237 1,530,418
Recurrent expenditure 966,318 998,146 1,104,509 1,169,756 1,303,268
Wages and salaries 309,576 315,215 392,939 478,569 572,903
Interest on debt 177,319 167,512 182,904 201,195 221,314
Foreign 13,880 13,880 14,341 15,776 17,353
Domestic 163,439 153,632 168,563 185,419 203,961
Goods, services and transfers 278,965 319,351 305,297 253,450 262,713
Generic goods and services 128,246 134,899 143,376 134,280 139,151
Storage Levy 1,851 1,851 1,980 2,178 2,396
Roads Maintenance 16,229 16,229 20,180 20,314 21,295
Other Statutory Expenditures 2,000 2,000 1,500 1,550 1,603
Agriculture Sector 4,984 7,015 7,066 7,181 7,490
Health Sector 36,635 36,236 45,116 46,407 47,762
Education Sector 25,255 25,255 28,133 29,540 31,017
Elections 10,850 10,061 31,462 2,000 2,000
PFEM 7,007 5,000 80 - -
NAC 7,669 7,669 - - -
of which NAC grants 6,169 6,169 - - -
Winter Cropping (Irrigation)
-
Maize Purchases 35,000 69,897 20,000 10,000 10,000
Housing and Population Census 3,240 3,240 6,402 - -
Subsidies and Transfers 196,459 192,068 219,369 232,543 242,338
Pensions and Gratuities 68,601 68,601 80,639 85,239 90,126
of which Govt Contribution to NPS 7,615 7,615 11,362 12,498 13,748
Transfer to Revenue Authorities 27,021 25,403 27,600 28,980 30,429

34 2018-19 Financial Statement
Category
2017/18
Approved
Estimates
2017/18
Revised
Estimates
2018/19
Estimates
2019/20
Projections
2020/21
Projections
FISP 33,150 33,150 41,250 39,150 39,150
of which Fertilizer Purchases 27,000 27,000 30,000 30,000 30,000
Seed Subsidy 5,150 5,150 10,150 8,050 8,050
Of Which: Donor Support 3,750 3,750 - - -
Logistics 1,000 1,000 1,100 1,100 1,100
Transfer to public entities 57,326 54,554 65,880 69,174 72,633
Iron Sheet Subsidy 7,000 7,000 - 10,000 10,000
WB reconstruction (PIU
&DODMA) 3,360 3,360 4,000 - -
Arrears (Small scale) 4,000 4,000 4,000 4,000 4,000
Development expenditure 352,995 311,822 391,682 252,581 220,251
Domestically financed projects (Part
II) 134,856 103,683 158,350 110,315 111,897
Foreign financed projects (Part I) 218,139 208,139 233,332 142,266 108,354
Net Lending 4,000 4,000 8,000 6,900 6,900
Overall balance (195,570) (183,621) (242,860) (275,701) (270,330)
Total financing 195,570 183,621 242,860 275,701 270,330
Foreign (net) 167,761 152,921 66,777 40,563 30,648
Borrowing 196,282 181,442 107,262 81,048 71,133
Program Loans 71,290 66,450 3,005 - -
Project Loans 124,992 114,992 104,257 81,048 71,133
Amortisation (28,521) (28,521) (40,485) (40,485) (40,485)
Domestic Borrowing (Net) 27,809 30,700 176,084 235,139 239,682

35 2018-19 Financial Statement
ANNEX 2: SUMMARY OF 2017/18 APPROVED, REVISED BUDGET AND 2018/19
MEDIUM TERM EXPENDITURE FRAMEWORK: PERSONAL EMOLUMENTS
Category
2017/18
Approved
Estimates
2017/18
Revised
Estimates
2018/19
Estimates
2019/20
Projections
2020/21
Projections
Vote 010-The Presidency
54,000,000
54,000,000
54,000,000
54,000,000
54,000,000
Vote 050-State Residences
2,045,195,344
2,045,195,344
1,979,717,722
2,375,661,266
2,850,793,519
Vote 060-National Audit Office
590,542,791
602,148,964
625,064,493
750,077,392
900,092,870
Vote 070-The Judiciary
4,378,617,543
4,544,740,948
4,437,329,567
4,934,795,481
5,921,754,577
Vote 080-National Assembly
3,733,535,846
4,735,300,836
4,500,801,777
5,400,962,132
6,481,154,558
Vote 081-Directorate Of Public
Officer’s Declarations
116,342,000
84,538,156
105,976,563
97,051,876
116,462,251
Vote 090-Office of the President
and Cabinet
2,242,586,641
2,788,631,748
2,753,511,171
3,304,213,406
3,965,056,087
Vote 093-Department Human
Resources Management and
Development
33,770,087,041
587,621,565
61,793,199,195
84,298,152,323
100,157,782,788
Vote 097-Civil Service
Commission
268,698,656
212,412,352
177,928,015
213,513,618
256,216,342
Vote 098-Greenbelt Authority
137,500,000
73,000,000
-
-
-
Vote 099-Public Procurement
and Disposal of Assets Authority
257,156,696
221,877,047
238,052,713
266,463,256
319,755,907
Vote 100-Ministry of Defence
188,405,291
122,205,877
128,540,690
154,248,827
185,098,593
Vote 101-Malawi Defence
Force
16,487,274,851
20,554,008,849
20,557,911,782
24,669,494,139
29,603,392,967
Vote 120-Ministry of Local
Government and Rural
Development
2,150,910,935
1,770,763,082
1,805,760,012
2,166,912,014
2,600,294,417
Vote 121-National Local
Government Finance
Commission
1,742,863,039
439,781,637
439,781,637
644,623,330
773,547,996
Vote 130-Ministry of Lands,
Housing and Urban
Development
1,799,623,026
1,442,490,405
1,458,915,830
1,750,698,997
2,100,838,796
Vote 170-Ministry of Civic
Education, Culture and
Community Development
916,937,750
720,200,312
653,872,509
784,647,010
941,576,412
Vote 190-Ministry of
Agriculture, Irrigation and Water
Development
5,753,229,473
6,456,704,650
6,846,749,576
8,216,099,491
9,859,319,389
Vote 240-Office of the Vice
President
674,818,884
674,818,884
582,135,407
661,362,489
793,634,987
Vote 250-Ministry of Education,
Science and Technology
19,900,667,657
20,437,639,574
24,186,811,753
29,024,174,104
34,829,008,925
Vote 260-Ministry of Foreign
Affairs and International
Cooperation
10,746,482,331
7,987,964,001
7,621,619,740
9,145,943,688
10,975,132,426
Vote 270-Ministry of Finance,
Economic Planning and
Development
1,119,098,616
1,105,602,022
1,190,098,421
1,428,118,105
1,713,741,726
Vote 271-Accountant General's
Department
1,252,584,819
1,252,584,819
642,624,510
771,149,412
925,379,294
Vote 272-Local Development
Fund
-
-
137,404,471
144,274,695
151,488,430
Vote 276-National Statistics
Office
485,871,935
378,021,436
452,990,585
543,588,702
652,306,442

36 2018-19 Financial Statement
Category
2017/18
Approved
Estimates
2017/18
Revised
Estimates
2018/19
Estimates
2019/20
Projections
2020/21
Projections
Vote 277-National Planning
Commission
200,000,000
100,000,000
100,000,000
240,000,000
288,000,000
Vote 279-Financial Intelligence
Authority
285,278,556
269,049,920
287,844,242
345,413,090
414,495,708
Vote 310-Ministry of Health
23,216,553,519
25,293,001,608
27,250,452,228
32,700,542,674
39,240,651,209
Vote 320-Ministry of Gender,
Children, Disability and Social
Welfare
1,587,515,055
1,255,336,623
1,229,223,050
1,475,067,660
1,770,081,193
Vote 330-Ministry of
Information and
Communications Technology
762,610,625
879,189,667
882,666,758
1,059,200,110
1,271,040,132
Vote 340-Ministry of Home
Affairs and Internal Security
453,166,183
750,656,296
393,777,531
472,533,037
567,039,644
Vote 341-Malawi Police Service
18,545,203,216
25,721,507,572
24,187,382,563
28,939,880,824
34,727,856,989
Vote 342-Malawi Prisons
Service
3,073,537,783
4,035,371,409
4,111,879,148
4,934,254,978
5,921,105,973
Vote 343-Immigration
Department
1,209,636,381
1,569,527,072
1,548,979,501
1,858,775,401
2,230,530,482
Vote 350-Ministry of Justice
and Constitutional Affairs
354,531,384
295,302,611
295,495,005
354,594,006
425,512,807
Vote 351-Directorate of Public
Prosecution and State Advocate
250,491,425
270,993,045
275,185,378
330,222,454
396,266,944
Vote 352-Registrar General's
Department
126,550,408
141,982,460
141,602,166
169,922,599
203,907,119
Vote 353-Administrator
General's Department
120,347,685
120,347,685
131,392,311
157,670,773
189,204,927
Vote 370-Ministry of Labour,
Youth, Sports and Manpower
Development
1,614,616,024
1,661,049,373
1,942,219,000
2,198,794,800
2,638,553,760
Vote 390-Ministry of Industry,
Trade and Tourism
858,398,381
751,119,699
730,046,694
876,056,033
1,051,267,239
Vote 400-Ministry of Transport
and Public Works
2,483,877,036
2,836,665,777
2,931,510,383
3,241,812,460
3,890,174,952
Vote 430-Malawi Human Rights
Commission
370,566,452
389,793,903
414,760,095
497,712,114
597,254,537
Vote 460-Malawi Electoral
Commission
1,037,964,079
939,624,399
1,086,870,002
1,184,244,003
1,421,092,803
Vote 470-Ministry of Natural
Resources, Energy and Mining
6,008,354,406
7,125,768,438
6,286,505,971
7,543,807,166
9,052,568,599
Vote 510-Anti Corruption
Bureau
1,065,981,031
937,970,533
1,063,842,571
956,211,085
1,147,453,302
Vote 520-Legal Aid Bureau
214,387,232
281,764,057
298,373,309
358,047,970
429,657,564
Vote 550-Office of the
Ombudsman
343,366,540
260,371,146
250,624,554
300,749,465
360,899,357
Vote 560-Law Commission
215,247,423
231,184,327
243,779,080
279,389,945
335,267,934
Vote 901 - Balaka District
Council
3,823,466,391
4,566,358,395
5,829,051,741
6,922,574,089
8,293,840,907
Vote 902 - Blantyre District
Council
5,840,728,680
8,782,668,616
9,117,569,090
10,862,674,909
13,020,881,890
Vote 903 - Chikwawa District
Council
4,275,181,034
5,192,148,323
6,612,332,886
7,874,751,463
9,438,613,755
Vote 904 - Chiradzulu District
Council
3,762,897,223
4,172,154,796
5,261,275,384
6,269,010,461
7,514,532,553
Vote 905 - Chitipa District
Council
2,659,377,300
3,108,309,540
3,277,818,571
3,869,254,285
4,631,297,142
Vote 906 - Dedza District
37 2018-19 Financial Statement
Category
2017/18
Approved
Estimates
2017/18
Revised
Estimates
2018/19
Estimates
2019/20
Projections
2020/21
Projections
Council 7,534,464,188 7,063,901,648 7,266,208,520 8,659,402,224 10,380,194,669
Vote 907 - Dowa District
Council
5,781,744,124
6,550,043,923
6,819,004,865
8,108,477,838
9,716,565,406
Vote 908 - Karonga District
Council
3,441,345,611
4,027,737,776
4,170,626,847
4,948,784,217
5,928,173,060
Vote 909 - Kasungu District
Council
6,506,048,725
9,404,381,781
8,567,303,914
10,210,516,696
12,239,732,036
Vote 910 - Likoma District
Council
148,081,874
212,634,474
231,980,231
271,344,278
324,245,133
Vote 911 - Lilongwe District
Council
17,087,759,481
18,004,727,451
24,783,888,525
29,590,426,230
35,481,151,476
Vote 912 - Machinga District
Council
4,410,418,746
5,800,976,653
5,915,960,247
7,016,664,297
8,404,949,156
Vote 913 - Mangochi District
Council
6,796,231,196
8,325,916,814
8,690,430,454
10,341,948,545
12,394,570,254
Vote 914 - Mchinji District
Council
4,619,571,541
5,488,711,813
6,829,631,830
8,125,310,196
9,737,484,235
Vote 915 - M'mbelwa District
Council
9,199,538,126
11,163,327,599
8,443,531,323
10,022,797,587
12,007,197,104
Vote 916 - Mulanje District
Council
5,634,723,627
6,580,544,661
6,820,850,249
8,104,572,298
9,710,798,758
Vote 917 - Mwanza District
Council
1,668,558,594
1,971,501,438
1,846,804,388
2,173,685,265
2,600,502,318
Vote 918 - Neno District
Council
1,350,785,501
1,814,445,745
1,918,564,419
2,263,877,303
2,709,452,764
Vote 919 - Nkhata Bay District
Council
2,673,757,104
3,488,044,172
3,659,811,746
4,317,446,095
5,167,327,314
Vote 920 - Nkhotakota District
Council
3,475,502,878
4,176,824,517
4,325,488,973
5,128,498,768
6,142,750,521
Vote 921 - Nsanje District
Council
2,924,792,623
3,359,986,290
3,496,695,326
4,153,554,392
4,976,345,270
Vote 922 - Ntcheu District
Council
5,670,799,604
6,383,595,962
7,368,053,839
8,785,696,607
10,532,467,928
Vote 923 - Ntchisi District
Council
2,901,920,649
3,492,296,696
4,350,955,074
5,149,470,088
6,166,224,106
Vote 924 - Phalombe District
Council
3,313,445,447
4,220,847,769
4,481,450,334
5,307,492,401
6,356,102,881
Vote 925 - Rumphi District
Council
2,543,764,800
2,890,316,600
3,061,357,032
3,607,460,439
4,316,784,526
Vote 926 - Salima District
Council
3,855,197,354
4,788,109,764
5,011,965,848
5,942,071,018
7,117,237,222
Vote 927 - Thyolo District
Council
5,768,139,790
6,730,822,003
6,999,680,011
8,329,368,013
9,982,353,616
Vote 928 - Zomba District
Council
6,696,401,236
8,043,416,323
8,325,499,084
9,936,670,901
11,913,997,081
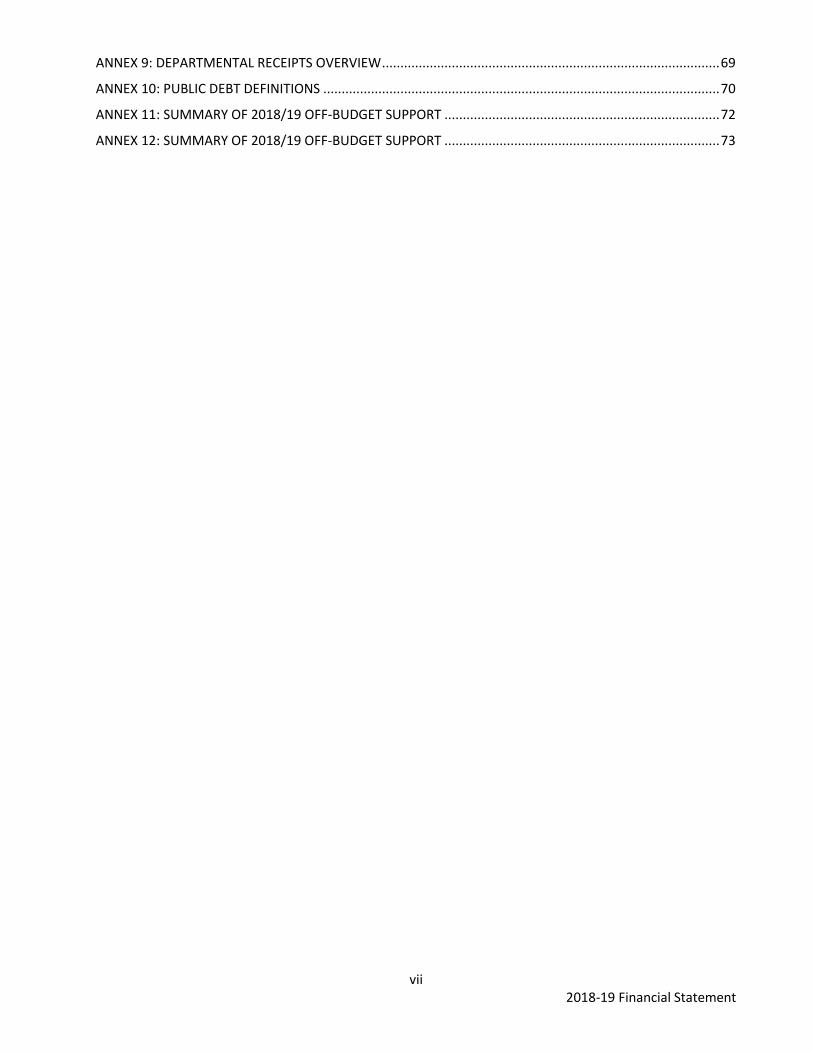
Total
309,575,855,436
315,214,581,668
392,939,000,433
478,568,929,301
572,903,485,957

38 2018-19 Financial Statement
ANNEX 3: SUMMARY OF 2017/18 APPROVED, REVISED BUDGET AND 2018/19
MEDIUM TERM EXPENDITURE FRAMEWORK: ORT
Category
2017/18
Approved
2017/18
Revised
2018/19
Estimates
2019/20
Projections
2020/21
Projections
Vote 020-Miscellaneous Other Statutory Payments 10,000,000,000
10,000,000,000
13,500,000,000
12,450,000,000 12,502,500,000
Vote 030-Pensions and Gratuities 68,601,286,002
68,601,286,002
80,638,628,500
85,238,659,925 90,125,502,921
Vote 040-Public Debt Charges 177,318,682,137
167,512,361,208
182,904,330,123
201,194,763,136 221,314,239,449
Vote 050-State Residences
4,205,000,000
4,205,000,000
4,700,000,000
4,885,000,000 5,079,250,000
Vote 060-National Audit Office
1,500,000,000
1,350,000,000
1,620,000,000
1,659,000,000 1,741,950,000
Vote 070-The Judiciary
3,930,100,000
3,930,100,000
5,401,500,000
5,671,575,000 5,955,153,750
Vote 080-National Assembly
8,550,000,000
8,550,000,000
9,425,500,000
9,321,375,000 9,787,443,750
Vote 081-Directorate Of Public
Officer’s Declarations
620,000,000
620,000,000
670,000,000
670,875,000 701,718,750
Vote 090-Office of the President and
Cabinet
2,530,250,000
2,530,250,000
3,399,813,426
3,569,804,098 3,748,294,302
Vote 093-Department Human
Resources Management and
Development
437,972,500
416,500,000
3,447,759,875
544,776,619 572,015,450
Vote 097-Civil Service Commission
175,000,000
175,000,000
313,700,000
285,885,000 268,679,250
Vote 098-Greenbelt Authority
315,000,000
283,500,000
-
- -
Vote 099-Public Procurement and
Disposal of Assets Authority
600,000,000
540,000,000
684,000,000
609,000,000 639,450,000
Vote 100-Ministry of Defence
352,500,000
337,250,000
409,412,500
429,883,125 451,377,281
Vote 101-Malawi Defence Force 14,991,000,000
14,991,000,000
21,544,001,940
16,993,509,991 17,496,377,904
Vote 120-Ministry of Local Government and Rural Development
738,200,001
676,380,001
704,200,001
718,410,001 754,330,501
Vote 121-National Local Government
Finance Commission 12,102,500,000
12,102,500,000
15,423,157,764
15,456,285,264 15,491,069,139
Vote 130-Ministry of Lands, Housing and Urban Development 13,397,000,000
16,307,300,000
7,224,720,000
21,075,931,000 21,128,702,550
Vote 170-Ministry of Civic Education,
Culture and Community Development
1,335,574,559
1,202,017,103
1,524,870,187
1,483,513,697 1,545,089,381
Vote 190-Ministry of Agriculture, Irrigation and Water Development 71,441,267,718
108,390,160,299
66,781,419,206
54,718,990,166 54,947,439,675
Vote 240-Office of the Vice President
4,532,000,000
4,532,000,000
5,710,600,000
1,697,474,182 1,757,347,891
Vote 250-Ministry of Education, Science and Technology 16,173,700,000
16,173,700,000
18,598,440,000
19,528,362,000 20,504,780,100
Vote 260-Ministry of Foreign Affairs
and International Cooperation 10,629,283,887
10,629,283,887
12,144,855,000
12,546,173,881 12,967,558,706
Vote 270-Ministry of Finance, Economic Planning and Development
5,568,350,000
5,218,350,000
3,664,005,000
2,789,705,250 2,771,690,513
Vote 271-Accountant General's
Department 16,142,681,266
13,249,001,688
8,511,925,000
7,758,371,250 8,146,289,812
Vote 272-Local Development Fund
-
-
100,000,000
105,000,000 110,250,000
Vote 273-Malawi Revenue Authority 27,021,424,917
25,402,850,000
27,600,000,000
28,980,000,000 30,429,000,000
Vote 274-Road Fund Administration 15,079,815,039
15,079,815,039
16,980,136,000
17,829,142,800 18,720,599,940
Vote 275-Subvented Organisations 57,326,130,410
54,553,553,889
65,879,928,793
69,173,925,232 72,632,621,494
Vote 276-National Statistics Office
3,534,000,000
3,519,300,000
6,695,265,000
307,928,250 323,324,662
Vote 277-National Planning
Commission
200,000,000
100,000,000
500,000,000
299,750,000 237,840,250
Vote 278-Unforeseen Expenditures
1,800,000,000
11,800,000,000
2,000,000,000
2,000,000,000 2,000,000,000
Vote 279-Financial Intelligence 503,336,725
39 2018-19 Financial Statement
Category
2017/18
Approved
2017/18
Revised
2018/19
Estimates
2019/20
Projections
2020/21
Projections
Authority 400,000,000 364,460,000 545,915,000 484,169,500
Vote 310-Ministry of Health 25,123,492,453
25,123,492,453
22,437,508,570
23,309,383,999 24,224,853,199
Vote 320-Ministry of Gender, Children,
Disability and Social Welfare
2,888,750,000
2,754,925,000
3,138,162,500
3,060,045,625 3,135,522,906
Vote 330-Ministry of Information and
Communications Technology
722,768,950
650,492,055
1,535,059,897
1,946,281,642 1,986,283,224
Vote 340-Ministry of Home Affairs and
Internal Security 10,584,000,000
11,004,000,000
2,550,000,000
1,680,000,000 1,764,000,000
Vote 341-Malawi Police Service
9,658,200,000
9,658,200,000
16,703,200,000
12,386,200,000 12,856,600,000
Vote 342-Malawi Prisons Service
3,731,250,000
3,731,250,000
4,360,737,649
4,201,274,531 4,401,338,258
Vote 343-Immigration Department
1,000,000,000
1,000,000,000
2,000,000,000
2,100,000,000 2,205,000,000
Vote 350-Ministry of Justice and
Constitutional Affairs
759,340,588
708,406,530
744,807,617
1,007,270,452 1,107,167,343
Vote 351-Directorate of Public
Prosecution and State Advocate
800,000,000
800,000,000
1,020,000,000
882,000,000 926,100,000
Vote 352-Registrar General's
Department
425,000,000
425,000,000
546,250,000
573,562,500 602,240,625
Vote 353-Administrator General's
Department
245,750,000
221,175,000
351,162,500
368,720,625 387,156,656
Vote 370-Ministry of Labour, Youth,
Sports and Manpower Development
1,785,240,812
1,661,716,731
1,984,502,853
2,083,727,995 2,187,914,395
Vote 390-Ministry of Industry, Trade
and Tourism
1,894,000,000
1,780,900,000
2,201,550,000
2,271,627,500 2,345,208,875
Vote 400-Ministry of Transport and
Public Works
1,034,671,763
963,204,586
1,755,125,000
1,732,881,250 1,814,525,312
Vote 420-Roads Authority
3,000,000,000
3,000,000,000
3,200,000,000
2,485,000,000 2,574,250,000
Vote 430-Malawi Human Rights
Commission
185,500,000
166,950,000
344,304,421
235,519,642 247,295,624
Vote 460-Malawi Electoral Commission 11,215,000,000
10,425,500,000
32,362,458,958
2,945,000,000 2,992,250,000
Vote 470-Ministry of Natural
Resources, Energy and Mining
1,894,500,000
1,712,050,000
4,181,125,000
4,480,181,250 4,804,090,313
Vote 510-Anti Corruption Bureau
2,000,000,000
2,000,000,000
2,230,000,000
2,092,999,999 2,190,649,999
Vote 520-Legal Aid Bureau
500,000,000
450,000,000
730,000,000
682,500,000 716,625,000
Vote 550-Office of the Ombudsman
272,500,000
245,250,000
380,000,000
315,000,000 330,750,000
Vote 560-Law Commission
600,000,000
540,000,000
720,000,000
682,500,000 716,625,000
Vote 601 - Blantyre City Council
683,664,756
678,058,242
330,470,393
346,993,912 364,343,608
Vote 602 - Lilongwe City Council
626,587,295
620,747,635
344,540,493
361,767,518 379,855,894
Vote 603 - Mzuzu City council
390,234,038
387,043,246
193,903,549
203,598,726 213,778,663
Vote 604 - Zomba City Council
303,318,106
301,227,750
106,817,445
112,158,317 117,766,233
Vote 804 - Kasungu Municipal
50,693,800
49,246,312
30,397,238
31,917,100 33,512,955
Vote 805 - Luchenza Municipal
49,911,785
48,503,399
29,576,123
31,054,929 32,607,675
Vote 807 - Mangochi Town
52,985,236
51,423,177
32,803,246
34,443,408 36,165,579
Vote 901 - Balaka District Council
747,833,893
727,561,897
689,809,961
724,300,459 760,515,482
Vote 902 - Blantyre District Council
1,164,486,144
1,127,218,547
1,117,710,451
1,173,595,973 1,232,275,772
Vote 903 - Chikwawa District Council
898,755,071
873,719,239
817,692,825
858,577,466 901,506,339
Vote 904 - Chiradzulu District Council
678,307,377
657,790,359
607,222,745
637,583,883 669,463,077
Vote 905 - Chitipa District Council 670,778,497

40 2018-19 Financial Statement
Category
2017/18
Approved
2017/18
Revised
2018/19
Estimates
2019/20
Projections
2020/21
Projections
679,443,686 661,911,552 608,415,870 638,836,664
Vote 906 - Dedza District Council
1,185,732,834
1,154,877,781
1,065,603,849
1,118,884,042 1,174,828,244
Vote 907 - Dowa District Council
1,066,729,877
1,039,144,471
973,066,371
1,021,719,689 1,072,805,674
Vote 908 - Karonga District Council
737,599,827
718,666,485
658,064,193
690,967,402 725,515,772
Vote 909 - Kasungu District Council
1,298,645,434
1,268,564,893
1,174,577,705
1,233,306,591 1,294,971,920
Vote 910 - Likoma District Council
177,369,431
170,756,339
165,237,902
173,499,797 182,174,787
Vote 911 - Lilongwe District Council
2,183,787,607
2,123,683,253
2,064,301,961
2,167,517,059 2,275,892,912
Vote 912 - Machinga District Council
931,385,161
906,336,219
819,538,793
860,515,733 903,541,519
Vote 913 - Mangochi District Council
1,417,341,889
1,380,133,174
1,236,208,984
1,298,019,433 1,362,920,404
Vote 914 - Mchinji District Council
927,259,579
902,578,420
847,622,558
890,003,686 934,503,870
Vote 915 - M'mbelwa District Council
1,751,827,015
1,713,826,456
1,608,418,366
1,688,839,284 1,773,281,248
Vote 916 - Mulanje District Council
1,061,011,830
1,033,130,755
925,062,421
971,315,542 1,019,881,319
Vote 917 - Mwanza District Council
406,505,975
392,423,770
384,831,274
404,072,837 424,276,479
Vote 918 - Neno District Council
454,940,279
439,740,227
435,687,293
457,471,657 480,345,240
Vote 919 - Nkhata Bay District Council
867,695,129
844,352,337
785,079,886
824,333,880 865,550,574
Vote 920 - Nkhotakota District Council
831,143,242
807,201,081
767,700,404
806,085,425 846,389,696
Vote 921 - Nsanje District Council
656,789,802
637,769,551
584,629,292
613,860,756 644,553,794
Vote 922 - Ntcheu District Council
1,040,169,374
1,013,137,660
945,177,843
992,436,735 1,042,058,572
Vote 923 - Ntchisi District Council
649,580,045
632,121,637
598,059,047
627,962,000 659,360,100
Vote 924 - Phalombe District Council
672,386,938
653,046,055
601,006,285
631,056,599 662,609,429
Vote 925 - Rumphi District Council
673,725,548
656,226,580
623,411,826
654,582,417 687,311,538
Vote 926 - Salima District Council
792,827,721
770,052,783
716,053,482
751,856,156 789,448,964
Vote 927 - Thyolo District Council
1,058,154,107
1,028,109,192
964,061,812
1,012,264,903 1,062,878,148
Vote 928 - Zomba District Council
1,125,776,645
1,095,189,339
993,065,477
1,042,718,751 1,094,854,688
Total 660,163,289,478
689,930,951,285
719,569,865,641
698,087,035,106 737,264,195,542
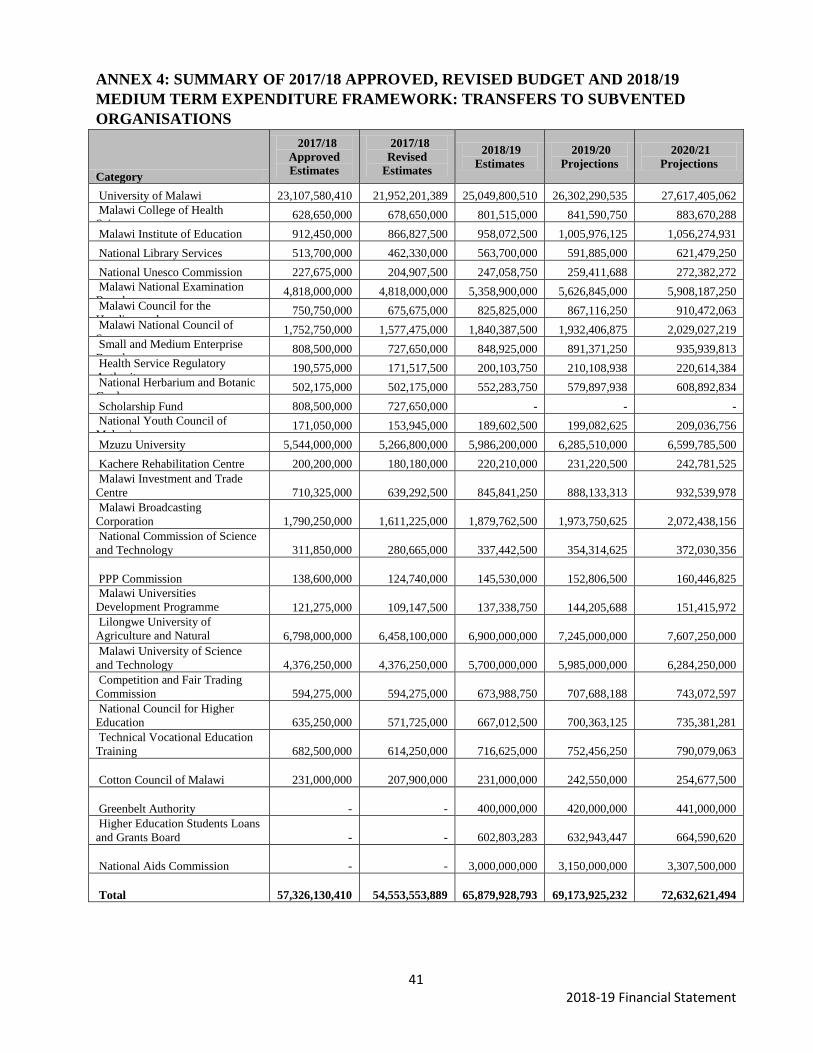
41 2018-19 Financial Statement
ANNEX 4: SUMMARY OF 2017/18 APPROVED, REVISED BUDGET AND 2018/19
MEDIUM TERM EXPENDITURE FRAMEWORK: TRANSFERS TO SUBVENTED
ORGANISATIONS
Category
2017/18
Approved
Estimates
2017/18
Revised
Estimates
2018/19
Estimates
2019/20
Projections
2020/21
Projections
University of Malawi 23,107,580,410 21,952,201,389 25,049,800,510 26,302,290,535 27,617,405,062
Malawi College of Health
Sciences 628,650,000 678,650,000 801,515,000 841,590,750 883,670,288
Malawi Institute of Education 912,450,000 866,827,500 958,072,500 1,005,976,125 1,056,274,931
National Library Services 513,700,000 462,330,000 563,700,000 591,885,000 621,479,250
National Unesco Commission 227,675,000 204,907,500 247,058,750 259,411,688 272,382,272
Malawi National Examination
Board 4,818,000,000 4,818,000,000 5,358,900,000 5,626,845,000 5,908,187,250
Malawi Council for the
Handicapped 750,750,000 675,675,000 825,825,000 867,116,250 910,472,063
Malawi National Council of
Sports 1,752,750,000 1,577,475,000 1,840,387,500 1,932,406,875 2,029,027,219
Small and Medium Enterprise
Board 808,500,000 727,650,000 848,925,000 891,371,250 935,939,813
Health Service Regulatory
Authority 190,575,000 171,517,500 200,103,750 210,108,938 220,614,384
National Herbarium and Botanic
Gardens 502,175,000 502,175,000 552,283,750 579,897,938 608,892,834
Scholarship Fund 808,500,000 727,650,000 - - -
National Youth Council of
Malawi 171,050,000 153,945,000 189,602,500 199,082,625 209,036,756
Mzuzu University 5,544,000,000 5,266,800,000 5,986,200,000 6,285,510,000 6,599,785,500
Kachere Rehabilitation Centre 200,200,000 180,180,000 220,210,000 231,220,500 242,781,525
Malawi Investment and Trade
Centre
710,325,000
639,292,500
845,841,250
888,133,313 932,539,978
Malawi Broadcasting
Corporation
1,790,250,000
1,611,225,000
1,879,762,500
1,973,750,625 2,072,438,156
National Commission of Science
and Technology
311,850,000
280,665,000
337,442,500
354,314,625 372,030,356
PPP Commission
138,600,000
124,740,000
145,530,000
152,806,500 160,446,825
Malawi Universities
Development Programme
(MUDP)
121,275,000
109,147,500
137,338,750
144,205,688 151,415,972
Lilongwe University of
Agriculture and Natural
Resources
6,798,000,000
6,458,100,000
6,900,000,000
7,245,000,000 7,607,250,000
Malawi University of Science
and Technology
4,376,250,000
4,376,250,000
5,700,000,000
5,985,000,000 6,284,250,000
Competition and Fair Trading
Commission
594,275,000
594,275,000
673,988,750
707,688,188 743,072,597
National Council for Higher
Education
635,250,000
571,725,000
667,012,500
700,363,125 735,381,281
Technical Vocational Education
Training
682,500,000
614,250,000
716,625,000
752,456,250 790,079,063
Cotton Council of Malawi
231,000,000
207,900,000
231,000,000
242,550,000 254,677,500
Greenbelt Authority
-
-
400,000,000
420,000,000 441,000,000
Higher Education Students Loans
and Grants Board
-
-
602,803,283
632,943,447 664,590,620
National Aids Commission
-
-
3,000,000,000
3,150,000,000 3,307,500,000
Total
57,326,130,410
54,553,553,889
65,879,928,793
69,173,925,232 72,632,621,494
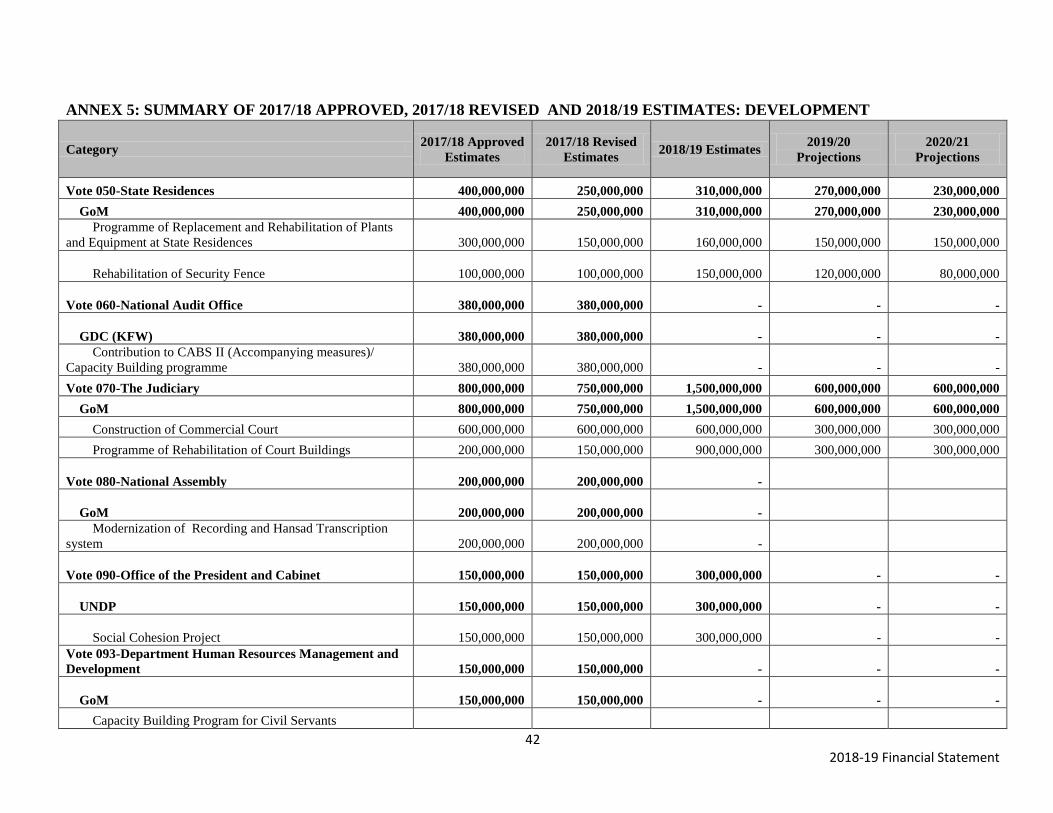
42 2018-19 Financial Statement
ANNEX 5: SUMMARY OF 2017/18 APPROVED, 2017/18 REVISED AND 2018/19 ESTIMATES: DEVELOPMENT
Category 2017/18 Approved
Estimates
2017/18 Revised
Estimates 2018/19 Estimates
2019/20
Projections
2020/21
Projections
Vote 050-State Residences 400,000,000 250,000,000 310,000,000 270,000,000 230,000,000
GoM 400,000,000 250,000,000 310,000,000 270,000,000 230,000,000
Programme of Replacement and Rehabilitation of Plants
and Equipment at State Residences 300,000,000 150,000,000 160,000,000 150,000,000 150,000,000
Rehabilitation of Security Fence 100,000,000 100,000,000 150,000,000 120,000,000
80,000,000
Vote 060-National Audit Office 380,000,000 380,000,000
-
-
-
GDC (KFW) 380,000,000 380,000,000
-
-
-
Contribution to CABS II (Accompanying measures)/
Capacity Building programme 380,000,000 380,000,000
-
-
-
Vote 070-The Judiciary 800,000,000 750,000,000 1,500,000,000 600,000,000 600,000,000
GoM 800,000,000 750,000,000 1,500,000,000 600,000,000 600,000,000
Construction of Commercial Court 600,000,000 600,000,000 600,000,000 300,000,000 300,000,000
Programme of Rehabilitation of Court Buildings 200,000,000 150,000,000 900,000,000 300,000,000 300,000,000
Vote 080-National Assembly 200,000,000 200,000,000
-
GoM 200,000,000 200,000,000
-
Modernization of Recording and Hansad Transcription
system 200,000,000 200,000,000
-
Vote 090-Office of the President and Cabinet 150,000,000 150,000,000 300,000,000
-
-
UNDP 150,000,000 150,000,000 300,000,000
-
-
Social Cohesion Project 150,000,000 150,000,000 300,000,000
-
-
Vote 093-Department Human Resources Management and
Development 150,000,000 150,000,000
-
-
-
GoM 150,000,000 150,000,000
-
-
-
Capacity Building Program for Civil Servants

43 2018-19 Financial Statement
Category 2017/18 Approved
Estimates
2017/18 Revised
Estimates 2018/19 Estimates
2019/20
Projections
2020/21
Projections
- - -
The Rehabilitation of Access Road at Staff Development
Institute 150,000,000 150,000,000
-
-
-
Vote 098-Greenbelt Authority 2,270,000,000 770,000,000
-
-
-
EU 270,000,000 270,000,000
-
-
-
Green Belt Initiative (ASWAp Component) 270,000,000 270,000,000
-
-
-
GoM 2,000,000,000 500,000,000
-
-
-
Green Belt Initiative 2,000,000,000 500,000,000
-
-
-
Vote 100-Ministry of Defence 5,100,000,000 1,300,000,000 1,800,000,000 1,900,000,000 2,200,000,000
GoM 5,100,000,000 1,300,000,000 1,800,000,000 1,900,000,000 2,200,000,000
Extension of Dwelling Units at Marine Unit 150,000,000 100,000,000
-
-
-
Construction and Rehabilitation of Water Works - Mvera 150,000,000 100,000,000 300,000,000 150,000,000 100,000,000
Programme of Construction and Rehabilitation of 200
Apartments 1,000,000,000 200,000,000 200,000,000 500,000,000 700,000,000
Programme of Construction of Military Hospital 3,000,000,000 500,000,000 200,000,000
Rehabilitation of Road Network at Cobbe Barracks 800,000,000 400,000,000 800,000,000 750,000,000 700,000,000
Water Reticulation Project for Barracks 300,000,000 500,000,000 700,000,000
Vote 120-Ministry of Local Government and Rural
Development 8,520,000,000 11,170,000,000 9,876,967,994 7,050,000,000 8,750,000,000
GoM 7,900,000,000 10,550,000,000 8,500,000,000 7,050,000,000 8,750,000,000
Area Development Committee Rural Micro Projects 4,000,000,000
-
Construction of Chiweta - Mlowe Road 200,000,000
50,000,000 1,000,000,000 2,000,000,000 2,000,000,000
Construction of Mzuzu Civic Office 500,000,000
- 500,000,000
Construction of Rural Roads 3,000,000,000 3,000,000,000 1,000,000,000 800,000,000 2,500,000,000

44 2018-19 Financial Statement
Category 2017/18 Approved
Estimates
2017/18 Revised
Estimates 2018/19 Estimates
2019/20
Projections
2020/21
Projections
Programme of Construction and Rehabilitation of Urban
and Rural Markets 1,000,000,000 500,000,000 500,000,000 750,000,000 750,000,000
Programme of Construction of DCs Offices (Mzimba,
Ntcheu and Thyolo) - Phase 1 1,200,000,000 1,200,000,000 1,500,000,000 1,000,000,000 1,000,000,000
Programme of Construction of Stadiums at District
Headquarters 1,000,000,000 1,000,000,000 1,500,000,000 1,000,000,000 1,000,000,000
Programme of Development of Rural Growth Centres 1,000,000,000 800,000,000 1,000,000,000 1,000,000,000 1,000,000,000
Recapitalisation of Development Fund for Local
Authorities 500,000,000 500,000,000 500,000,000
Rehabilitation of Boma Roads to Bitumen Standard
(Commencing with Balaka, Chitipa, Dedza, Kasungu,
Mangochi, Mulanje, Mzimba)
-
- 1,000,000,000
-
-
ICEDA 1,123,050,694
-
-
Mangochi Basic Services Programme 1,123,050,694
-
-
IFAD & OFID 620,000,000 620,000,000 253,917,300
-
-
Rural Livelihood and Economic Enhancement 300,000,000 300,000,000 108,821,700
-
-
Rural Livelihoods and Economic Enhancement
Programme 320,000,000 320,000,000 145,095,600
-
-
Vote 121-National Local Government Finance Commission 7,000,000,000
-
-
GoM 7,000,000,000
-
-
Area Development Committee Rural Micro Projects 7,000,000,000
Vote 130-Ministry of Lands, Housing and Urban
Development 2,350,000,000 950,000,000 11,900,000,000 1,000,000,000 1,000,000,000
EU 300,000,000 300,000,000
-
Strengthen National Capacity in Land Policies 300,000,000 300,000,000
-
GoM 2,050,000,000 650,000,000 11,900,000,000 1,000,000,000 1,000,000,000
Completion of Construction of Clinic and Food Court and
Equipment at Capital hill 300,000,000
50,000,000 200,000,000
-
-

45 2018-19 Financial Statement
Category 2017/18 Approved
Estimates
2017/18 Revised
Estimates 2018/19 Estimates
2019/20
Projections
2020/21
Projections
Construction of Conference Rooms for Government
Offices 250,000,000
- 500,000,000 500,000,000 500,000,000
Construction of Government Office at Capital Hill
(GOCH7)-Retention 500,000,000 500,000,000 200,000,000
-
-
Decent and Affordable Rural Housing Program 10,000,000,000
-
-
Mentainance of Capital Hill Government Buildings 300,000,000
50,000,000
-
-
-
Public Land Infrastructure Development in Cities 700,000,000
50,000,000 1,000,000,000 500,000,000 500,000,000
Vote 170-Ministry of Civic Education, Culture and
Community Development 2,330,000,000 1,980,000,000 1,787,297,100 2,360,000,000 2,330,000,000
EU 1,600,000,000 1,600,000,000 1,000,000,000 1,600,000,000 1,600,000,000
Chilungamo Programme (NICE) 1,600,000,000 1,600,000,000 1,000,000,000 1,600,000,000 1,600,000,000
GoM 730,000,000 380,000,000 650,000,000 460,000,000 430,000,000
Chilungamo Programme (NICE) - Counterpart 150,000,000
50,000,000 100,000,000
80,000,000
80,000,000
Completion of Chongoni Rock Art World Heritage Site 150,000,000 100,000,000 100,000,000
80,000,000
50,000,000
Construction of Library and Lecture Theatre at Magomero
College 130,000,000
80,000,000 200,000,000 300,000,000 300,000,000
Rehabillitation of Blantyre Cultural Centre 300,000,000 150,000,000 250,000,000
-
-
Norway 137,297,100 300,000,000 300,000,000
Culture Fund for Malawi 137,297,100 300,000,000 300,000,000
Vote 190-Ministry of Agriculture, Irrigation and Water
Development 59,700,000,000 58,221,000,000 78,353,542,142 57,150,034,393 46,650,036,113
AFDB 8,335,841,884 8,335,841,884 5,278,720,352
0
0
Mzimba Integrated Urban Water and Sanitation Project 3,611,718,252
-
-
Shire Valley Irrigation Project 8,335,841,884 8,335,841,884
0
0
0
Smallholder Irrigation and and Value Addition (GAFSP) 1,667,002,100

46 2018-19 Financial Statement
Category 2017/18 Approved
Estimates
2017/18 Revised
Estimates 2018/19 Estimates
2019/20
Projections
2020/21
Projections
AfDB/WB 1,200,000,000 1,200,000,000 4,825,726,940 18,000,000,000 18,000,000,000
Sustainable Rural Water Supply and Sanitation 1,200,000,000 1,200,000,000 645,414,508 6,000,000,000 6,000,000,000
Sustainable Rural Water Supply and Sanitation (ADF) 3,556,002,800 6,000,000,000 6,000,000,000
Sustainable Rural Water Supply and Sanitation (NTF) 624,309,632 6,000,000,000 6,000,000,000
BADEA 11,500,000,000 11,500,000,000 4,617,519,000 1,904,379,750 1,999,598,738
Mzimba Integrated Urban Water and Sanitation Project 6,500,000,000 6,500,000,000 2,803,824,000
-
-
Small Farms Irrigation Project - Phase II (SFIP II) 5,000,000,000 5,000,000,000 1,813,695,000 1,904,379,750 1,999,598,738
EU 2,850,000,000 2,850,000,000
-
-
-
Construction of Bwanje Dam 1,700,000,000 1,700,000,000
-
-
-
Farm Income Diversification Program 650,000,000 650,000,000
-
-
-
Long term Technical Assistance to the Department of
Irrigation in Malawi 500,000,000 500,000,000
-
-
-
GoM 3,550,000,000 2,071,000,000 2,560,000,000 2,040,500,000 1,872,525,000
Agricultural Extension and Advisory Services
Infrastructure Project 150,000,000
25,000,000
-
-
-
Alternative Water source for Zomba (Feasibility Study) 250,000,000
30,000,000 150,000,000 157,500,000 165,375,000
Aquaculture Development Project (ADP) 150,000,000 200,000,000 210,000,000 220,500,000 231,525,000
Chitipa Water Supply 1,100,000,000 1,100,000,000 250,000,000 262,500,000 275,625,000
Ground Water Extraction for Rural Piped
WaterDevelopment Programme 200,000,000
46,000,000 100,000,000 150,000,000
50,000,000
Mikolongwe Livestock Improvement Project 100,000,000 100,000,000 200,000,000
50,000,000
50,000,000
Mzimba Integrated Urban Water and Sanitation Project 100,000,000
80,000,000 100,000,000 100,000,000 100,000,000
Programme for Rural Irrigation Development 200,000,000
Rehabilitation of Research Stations 500,000,000
-
-
-
-
Shire Valley Irrigation Project 100,000,000

47 2018-19 Financial Statement
Category 2017/18 Approved
Estimates
2017/18 Revised
Estimates 2018/19 Estimates
2019/20
Projections
2020/21
Projections
80,000,000 -
Shire Valley Transformation Project - Phase 1 250,000,000
Small Farms Irrigation Project - Phase II (SFIP II) 500,000,000 200,000,000 800,000,000 800,000,000 800,000,000
Solar Powered Groundwater Supply Pilot Project
-
Songwe River Basin Development Programme 250,000,000 160,000,000 200,000,000 200,000,000 100,000,000
Sustainable Rural Water Supply and Sanitation 150,000,000
50,000,000 100,000,000 100,000,000 100,000,000
IDA 5,800,000,000 5,800,000,000 5,750,000,000
-
-
Agriculture Commercialisation 5,750,000,000
Agriculture Sector Wide Approach - Support Project 5,800,000,000 5,800,000,000
-
-
-
IDA/WB 4,800,000,000 4,800,000,000 2,850,000,000
Agriculture Productivity Program for Southern Africa
(APPSA) 4,800,000,000 4,800,000,000 2,850,000,000
IFAD 9,400,000,000 9,400,000,000 6,965,839,850 7,314,131,843 7,679,838,435
Rural Irrigation Development Programme 5,600,000,000 5,600,000,000 4,702,619,819 4,937,750,810 5,184,638,350
Sustainable Agricultural Production Programme (SAPP) 3,800,000,000 3,800,000,000 2,263,220,031 2,376,381,033 2,495,200,084
WB 12,264,158,116 12,264,158,116 45,505,736,000 27,891,022,800 17,098,073,940
Agriculture Sector Wide Approach - Support Project 27,000,000,000 18,750,000,000 7,500,000,000
Diamphwe Water Supply and Dzalanyama Project 5,600,000,000 5,600,000,000
-
-
-
Lilongwe Water and Sanitation 900,000,000
Lower Shire Valley Landscape Project 900,000,000
Shire River Basin Management Program - Phase 1 Project 3,000,000,000
Shire Valley Irrigation Project 6,664,158,116 6,664,158,116 8,705,736,000 9,141,022,800 9,598,073,940
Shire Valley Transformation Project - Phase 1 5,000,000,000
Vote 240-Office of the Vice President 3,090,000,000 3,090,000,000 6,010,000,000
WB 3,090,000,000 3,090,000,000 6,010,000,000

48 2018-19 Financial Statement
Category 2017/18 Approved
Estimates
2017/18 Revised
Estimates 2018/19 Estimates
2019/20
Projections
2020/21
Projections
Malawi Flood Recovery Program (MFERP) 3,090,000,000 3,090,000,000 6,010,000,000
Vote 250-Ministry of Education, Science and Technology 38,700,000,000 38,700,000,000 43,603,579,454 22,400,000,000 16,200,000,000
AFDB 11,000,000,000 11,000,000,000 1,382,745,454
Support to Higher Education, Science and Technology 2,500,000,000 2,500,000,000
-
Support to Higher Education, Science and Technology 8,500,000,000 8,500,000,000 1,382,745,454
BADEA 7,000,000,000 7,000,000,000 2,176,434,000
Construction of Three (3) Teachers Training Colleges for
Primary School Teachers 7,000,000,000 7,000,000,000 2,176,434,000
ESJF 8,301,403,000 8,000,000,000 5,000,000,000
Education Services Joint Fund 8,301,403,000 8,000,000,000 5,000,000,000
GDC 1,450,956,000 8,000,000,000 5,000,000,000
Nutrition and Access to Primary Education 1,450,956,000 8,000,000,000 5,000,000,000
GoM 20,700,000,000 20,700,000,000 21,400,000,000 6,400,000,000 6,200,000,000
Construction of Three (3) Teachers Training Colleges for
Primary School Teachers 2,000,000,000 2,000,000,000 1,000,000,000 1,000,000,000 800,000,000
Construction of Machinga Secondary Schools 800,000,000 800,000,000 700,000,000 700,000,000 700,000,000
Construction of Nalikule TTC 400,000,000 400,000,000
Construction of Primary Schools and Provision of
Equipment in Urban and Rural Areas 5,000,000,000 5,000,000,000 4,500,000,000 1,000,000,000 1,000,000,000
Construction of Thumbwe Secondary Schools 700,000,000 700,000,000 700,000,000
Desks for Primary and CDSSs 2,500,000,000 2,500,000,000 4,000,000,000
Programme of Construction of 100 Girls Hostels in
Community Day Secondary Schools 3,000,000,000 3,000,000,000 5,000,000,000 750,000,000 750,000,000
Programme of Construction of Science Laboratories and
Libraries - Phase 1 1,000,000,000 1,000,000,000 1,000,000,000 750,000,000 750,000,000
Programme of Rehabilitation of Conventional Secondary
Schools - Phase 2 4,000,000,000 4,000,000,000 4,500,000,000 500,000,000 500,000,000
Support to Higher Education, Science and Technology 2,000,000,000 2,000,000,000
- 1,000,000,000 1,000,000,000
OFID 2,901,912,000

49 2018-19 Financial Statement
Category 2017/18 Approved
Estimates
2017/18 Revised
Estimates 2018/19 Estimates
2019/20
Projections
2020/21
Projections
Construction of Three (3) Teachers Training Colleges for
Primary School Teachers 2,901,912,000
SAUDI Fund 3,990,129,000
Construction of Three (3) Teachers Training Colleges for
Primary School Teachers 3,990,129,000
WB 2,000,000,000
Equity with Quality and Learning at Secondary 1,000,000,000
Malawi Education Sector Improvement Project 1,000,000,000
Vote 260-Ministry of Foreign Affairs and International
Cooperation 4,100,000,000 3,600,000,000 1,000,000,000 1,000,000,000 800,000,000
GoM 4,100,000,000 3,600,000,000 1,000,000,000 1,000,000,000 800,000,000
Acquisition of Chancery in New York 3,500,000,000 3,500,000,000
Rehabilitation of Kwacha House (chancery) in London 500,000,000
- 1,000,000,000 1,000,000,000 800,000,000
Rehabilitation of Official Residences and Missions 100,000,000 100,000,000
Vote 270-Ministry of Finance, Economic Planning and
Development 2,425,000,000 2,225,000,000 9,917,326,838 400,000,000 300,000,000
EU 750,000,000 750,000,000
Support for the Management of EDF Resources 750,000,000 750,000,000
EU
80,000,000
80,000,000
NAO-SU Programme Estimate PE6
80,000,000
80,000,000
GoM 1,195,000,000 995,000,000 200,000,000 400,000,000 300,000,000
Coordination of National Population Policy
55,000,000
55,000,000
Malawi Public Policy Research and Analysis Project
(MPPRAP)
40,000,000
40,000,000
Recapitalisation of Malawi Enterprise Development Fund
(MEDEF) 1,000,000,000 800,000,000
Strengthening Public Sector Investment Management 100,000,000 100,000,000 200,000,000 400,000,000 300,000,000
IFAD 500,579,820

50 2018-19 Financial Statement
Category 2017/18 Approved
Estimates
2017/18 Revised
Estimates 2018/19 Estimates
2019/20
Projections
2020/21
Projections
Financial Access for Rural Markets, Smallholders and
Enterprise Programme (FARMSE) 500,579,820
UNDP/EU 400,000,000 400,000,000 1,284,247,018
Development Effectiveness & Accountability Programme
(DEAP) 400,000,000 400,000,000 1,284,247,018
WB 7,932,500,000
-
-
Financial Reporting and Oversight Improvement 2,250,000,000
Malawi Drought Recovery and Resilience Project
(MDRRP) 3,932,500,000
Malawi Public Administration Modernisation Project 1,750,000,000
-
-
Vote 271-Accountant General's Department 300,000,000 300,000,000 5,110,000,000
GoM 300,000,000 300,000,000 5,110,000,000
Completion of Construction of Lilongwe Treasury Cashier 300,000,000 300,000,000 110,000,000
Procurement of New IFMIS 5,000,000,000
Vote 272-Local Development Fund 37,440,000,000 37,290,000,000 21,054,004,200 2,000,000,000 2,000,000,000
GDC (KFW) 2,334,004,200 2,000,000,000 2,000,000,000
More Employment and Income to Rural Areas Programme 2,334,004,200 2,000,000,000 2,000,000,000
GoM 350,000,000 200,000,000 470,000,000
Community Social Infrastructure 250,000,000 150,000,000
-
More Employment and Income to Rural Areas Program -
Counterpart 200,000,000
Support to Local Economic Development (MASAF) -
KfW MIERA 100,000,000
50,000,000 270,000,000
IDA 36,700,000,000 36,700,000,000 18,250,000,000
Malawi Strengthening Safety Nets System (MASAF 4) 36,700,000,000 36,700,000,000 18,250,000,000
KfW 390,000,000 390,000,000
Support to Local Economic Development (MASAF) -
KfW MIERA 390,000,000 390,000,000
Vote 274-Road Fund Administration 71,050,000,000 64,050,000,000 69,373,044,800 56,258,973,417 56,258,973,417

51 2018-19 Financial Statement
Category 2017/18 Approved
Estimates
2017/18 Revised
Estimates 2018/19 Estimates
2019/20
Projections
2020/21
Projections
ADFD 4,200,000,000 4,200,000,000
-
Jenda -Embangweni- Edingeni 4,200,000,000 4,200,000,000
-
AFDB 15,600,000,000 15,600,000,000 4,352,868,000
-
-
Liwonde - Mangochi rehab road 5,000,000,000 5,000,000,000
-
Mzuzu-Nkhatabay Road 6,400,000,000 6,400,000,000
-
-
-
Nacala Corridor Project Phase IV 4,200,000,000 4,200,000,000 4,352,868,000
China 4,000,000,000 4,000,000,000
-
Neno - Mwanza Road 4,000,000,000 4,000,000,000
-
EIB 5,000,000,000
Rehabilitation of Chiweta-Bwengu-Kacheche Road 5,000,000,000
EU 5,000,000,000
Rehabilitation of Lilongwe-Kasungu-Mzimba turn-off
Road (M1) 5,000,000,000
GoM 30,350,000,000 23,350,000,000 38,850,000,000 43,925,000,000 43,925,000,000
Blantyre- Zomba End point 800,000,000 800,000,000 1,000,000,000
Chikwawa - Chapananga - Mwanza 3,000,000,000 600,000,000 1,500,000,000 3,800,000,000 3,800,000,000
Chiringa-Muloza Road (Designs) 500,000,000
Completion of Lilongwe Old Airport- Kasiya - Santhe
road 4,000,000,000 4,000,000,000 500,000,000 5,000,000,000 5,000,000,000
Construction of Chiringa-Miseu Folo Chiradzulu-Road 700,000,000 140,000,000
Construction of Dual Carriage from Mchenga utuwa-
Katoto Roundabout-Mzuzu University (Design) 200,000,000
Construction of Rumphi - Nyika Turn-Off - Hewe Road 4,000,000,000 200,000,000 5,000,000,000 1,000,000,000 1,000,000,000
Dowa - Chezi Road 800,000,000 1,200,000,000 2,000,000,000
Dualisation of Chileka-Blantyre Road 1,000,000,000 1,500,000,000
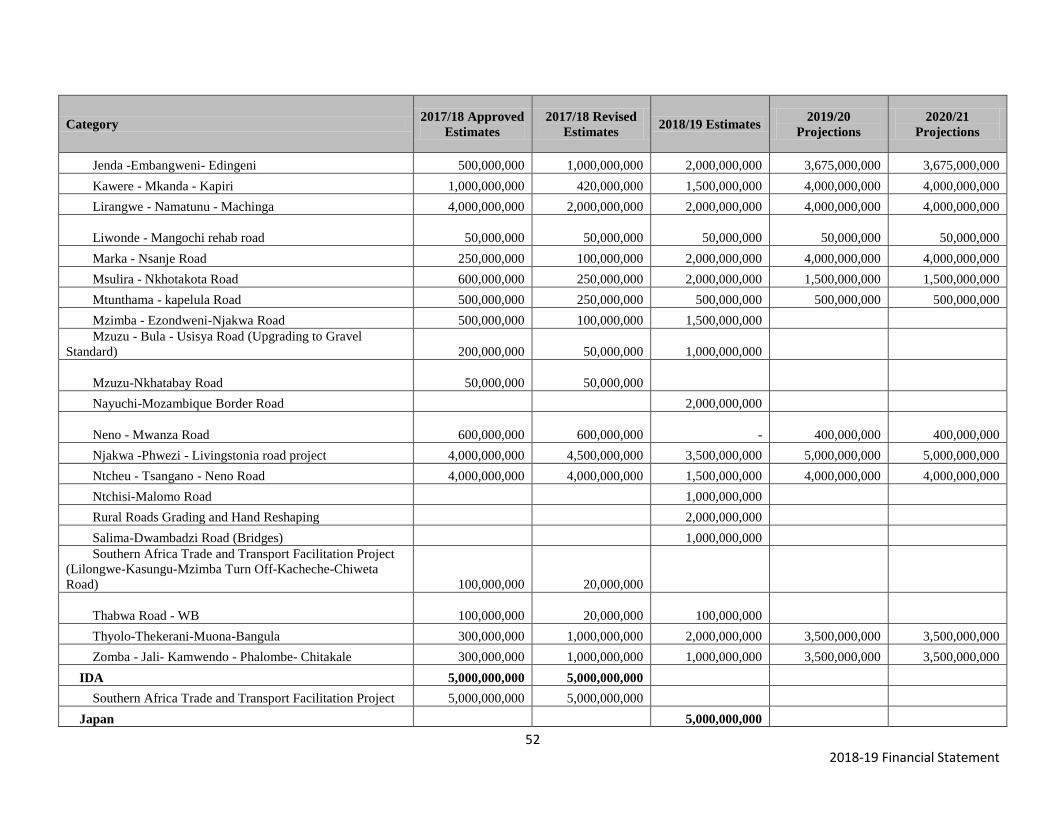
52 2018-19 Financial Statement
Category 2017/18 Approved
Estimates
2017/18 Revised
Estimates 2018/19 Estimates
2019/20
Projections
2020/21
Projections
Jenda -Embangweni- Edingeni 500,000,000 1,000,000,000 2,000,000,000 3,675,000,000 3,675,000,000
Kawere - Mkanda - Kapiri 1,000,000,000 420,000,000 1,500,000,000 4,000,000,000 4,000,000,000
Lirangwe - Namatunu - Machinga 4,000,000,000 2,000,000,000 2,000,000,000 4,000,000,000 4,000,000,000
Liwonde - Mangochi rehab road
50,000,000
50,000,000
50,000,000
50,000,000
50,000,000
Marka - Nsanje Road 250,000,000 100,000,000 2,000,000,000 4,000,000,000 4,000,000,000
Msulira - Nkhotakota Road 600,000,000 250,000,000 2,000,000,000 1,500,000,000 1,500,000,000
Mtunthama - kapelula Road 500,000,000 250,000,000 500,000,000 500,000,000 500,000,000
Mzimba - Ezondweni-Njakwa Road 500,000,000 100,000,000 1,500,000,000
Mzuzu - Bula - Usisya Road (Upgrading to Gravel
Standard) 200,000,000
50,000,000 1,000,000,000
Mzuzu-Nkhatabay Road
50,000,000
50,000,000
Nayuchi-Mozambique Border Road 2,000,000,000
Neno - Mwanza Road 600,000,000 600,000,000
- 400,000,000 400,000,000
Njakwa -Phwezi - Livingstonia road project 4,000,000,000 4,500,000,000 3,500,000,000 5,000,000,000 5,000,000,000
Ntcheu - Tsangano - Neno Road 4,000,000,000 4,000,000,000 1,500,000,000 4,000,000,000 4,000,000,000
Ntchisi-Malomo Road 1,000,000,000
Rural Roads Grading and Hand Reshaping 2,000,000,000
Salima-Dwambadzi Road (Bridges) 1,000,000,000
Southern Africa Trade and Transport Facilitation Project
(Lilongwe-Kasungu-Mzimba Turn Off-Kacheche-Chiweta
Road) 100,000,000
20,000,000
Thabwa Road - WB 100,000,000
20,000,000 100,000,000
Thyolo-Thekerani-Muona-Bangula 300,000,000 1,000,000,000 2,000,000,000 3,500,000,000 3,500,000,000
Zomba - Jali- Kamwendo - Phalombe- Chitakale 300,000,000 1,000,000,000 1,000,000,000 3,500,000,000 3,500,000,000
IDA 5,000,000,000 5,000,000,000
Southern Africa Trade and Transport Facilitation Project 5,000,000,000 5,000,000,000
Japan 5,000,000,000

53 2018-19 Financial Statement
Category 2017/18 Approved
Estimates
2017/18 Revised
Estimates 2018/19 Estimates
2019/20
Projections
2020/21
Projections
Dualisation of Chidzanja Junction -Mchinji Roundabout
Road 5,000,000,000
Kuwait/ BADEA/ OFID 2,500,000,000 2,500,000,000 4,062,676,800 12,333,973,417 12,333,973,417
Thyolo-Thekerani-Muona-Bangula 2,500,000,000 2,500,000,000 4,062,676,800 12,333,973,417 12,333,973,417
Saudi 4,500,000,000 4,500,000,000
-
Zomba - Jali- Kamwendo - Phalombe- Chitakale 4,500,000,000 4,500,000,000
-
WB 4,900,000,000 4,900,000,000 7,107,500,000
Southern Africa Trade and Transport Facilitation Project 3,800,000,000
Thabwa Road - WB 4,900,000,000 4,900,000,000 3,307,500,000
Vote 275-Subvented Organisations 20,527,000,000 15,176,000,000 20,305,237,764 25,895,549,443 22,147,774,722
EU 3,200,000,000 3,200,000,000
-
-
Development of a Robust Standardisation, Quality
Assurance, Accreditation and Metrology (SQAM)
Infrastructure in Malawi 200,000,000 200,000,000
-
-
Rehabilitation works and supply tender equipment TVET 3,000,000,000 3,000,000,000
-
-
GoM 16,097,000,000 10,746,000,000 15,250,000,000 13,320,000,000 13,860,000,000
College of Medicine Residency Program OB/GYN
Malawi 300,000,000 160,000,000
-
-
Completion of Expansion of Chancellor College School of
Economics 500,000,000 500,000,000 700,000,000 560,000,000 280,000,000
Completion of Kamuzu College of Nursing New Blantyre
Campus 200,000,000 100,000,000 300,000,000 300,000,000 300,000,000
Construction of a Training Complex at Malawi Institute of
Education
97,000,000 100,000,000 300,000,000 300,000,000 300,000,000
Construction of Administration Block for College of
Medicine
75,000,000
60,000,000
30,000,000
Construction of Administration Block for LUANAR 700,000,000 700,000,000 1,000,000,000 800,000,000 800,000,000
Construction of Burnt Mzuzu University Library 400,000,000 400,000,000 500,000,000 400,000,000 500,000,000
Construction of Examinations Marking Centre Complex
Building 150,000,000 100,000,000 500,000,000 400,000,000 200,000,000

54 2018-19 Financial Statement
Category 2017/18 Approved
Estimates
2017/18 Revised
Estimates 2018/19 Estimates
2019/20
Projections
2020/21
Projections
Construction of Facilities at Malawi University of Science
and Technology 500,000,000 600,000,000 500,000,000 500,000,000 500,000,000
Construction of Mombera University 5,000,000,000 2,626,000,000 3,000,000,000 2,400,000,000 6,000,000,000
Conversion of ex-contractor premises into student hostels
in MUST 200,000,000 200,000,000 200,000,000 160,000,000
80,000,000
Development of a Robust Standardisation, Quality
Assurance, Accreditation and Metrology (SQAM)
Infrastructure in Malawi 4,000,000,000 3,000,000,000 4,000,000,000 3,200,000,000 2,000,000,000
Establishment and development of National Botanical
Gardens Infrastructure 300,000,000 100,000,000 300,000,000 300,000,000 200,000,000
Expansion and Rehabilitation of Chancellor College 1,000,000,000 500,000,000 500,000,000 500,000,000 500,000,000
Expansion and Rehabilitation of Public Universities -
Polytechnic 800,000,000 800,000,000 500,000,000 400,000,000 400,000,000
General Rehabilitation of College Of Medicine Premises-
Blantyre and Lilongwe Campuses 800,000,000 360,000,000
-
-
Green Belt Initiative 1,500,000,000 2,000,000,000 1,000,000,000
Malawi College of Health Sciences Lilongwe Campus 100,000,000
80,000,000
40,000,000
Mangochi University (Designs) 200,000,000
50,000,000
-
-
Micro, Small And Medium Enterprise Business Incubator
- 200,000,000
National Hockey Stadium 325,000,000 260,000,000 130,000,000
Rehabilitation and Expansion of MBC Studio
Infrastructure 250,000,000 150,000,000 250,000,000 200,000,000 100,000,000
Rehabilitation of Mzuzu University 700,000,000 300,000,000 500,000,000 500,000,000 500,000,000
Norway 1,230,000,000 1,230,000,000 1,305,237,764 2,575,549,443 1,287,774,722
College of Medicine Residency Program OB/GYN
Malawi 150,000,000 150,000,000 170,248,404 136,198,723
68,099,362
Construction of Administration Block for LUANAR 560,000,000 560,000,000
-
-
LUANAR Capacity Building for Managing Climate
Change Programme 520,000,000 520,000,000 549,188,400 439,350,720 219,675,360
LUANAR Infrastructure Development Program 585,800,960 2,000,000,000 1,000,000,000

55 2018-19 Financial Statement
Category 2017/18 Approved
Estimates
2017/18 Revised
Estimates 2018/19 Estimates
2019/20
Projections
2020/21
Projections
WB 3,750,000,000 10,000,000,000 7,000,000,000
Eastern and Southern Africa Higher Education Centers of
Excellence Project 1,500,000,000 8,000,000,000 5,000,000,000
Skills development programme 2,250,000,000 2,000,000,000 2,000,000,000
Vote 276-National Statistics Office 180,000,000
10,000,000
GoM 180,000,000
10,000,000
Construction of NSO Headquarters in Lilongwe 180,000,000
10,000,000
Vote 277-National Planning Commission 1,000,000,000
-
GoM 1,000,000,000
-
Programme of Construction of National Planning
Commission Office and Apartments 1,000,000,000
-
Vote 310-Ministry of Health 25,959,000,000 25,959,000,000 25,445,852,700 20,356,682,160 12,323,899,008
BADEA 4,000,000,000 4,000,000,000 1,450,956,000 1,160,764,800 580,382,400
Construction of New Phalombe District Hospital 4,000,000,000 4,000,000,000 1,450,956,000 1,160,764,800 580,382,400
GCD (KFW) 2,201,006,300 1,760,805,040 548,960,448
Malawi/German/Norway Initiative on Maternal mortality 622,401,120 497,920,896 248,960,448
Strengthening PPP for Reproductive Health and Rights
(PSI) 1,578,605,180 1,262,884,144 300,000,000
GDC 2,500,000,000 2,500,000,000 1,094,077,400 875,261,920 437,630,960
Food and Nutrition Security Programme 2,500,000,000 2,500,000,000 1,094,077,400 875,261,920 437,630,960
GoM 6,230,000,000 6,230,000,000 6,400,000,000 5,120,000,000 5,180,000,000
Completion of Construction of Nkhatabay District
Hospital 1,150,000,000 670,465,024
-
-
Construction of Blantyre District Hospital 800,000,000 800,000,000
-
-
-
Construction of Cancer Centre 500,000,000 1,500,000,000 2,800,000,000 2,240,000,000 400,000,000
Construction of Domasi Community Hospital 2,100,000,000 2,100,000,000 1,500,000,000 1,200,000,000 2,000,000,000

56 2018-19 Financial Statement
Category 2017/18 Approved
Estimates
2017/18 Revised
Estimates 2018/19 Estimates
2019/20
Projections
2020/21
Projections
Construction of Expanded Programme on Immunisation
(EPI) and Malaria Block 700,000,000
-
-
-
Construction of Mponela Hospital (Designs) 200,000,000 200,000,000 160,000,000 2,000,000,000
Construction of New Phalombe District Hospital
80,000,000 800,000,000 1,200,000,000 960,000,000 480,000,000
Construction of Staff Houses (Umoyo) 650,000,000 159,534,976
-
-
Lilongwe Institute of Orthopaedic and Neuro-Surgery
(Lion)
50,000,000
-
-
-
Rehabilitation of District Hospitals (Kasungu, Dowa,
Mzimba, Chikwawa, Likoma, Balaka, Chitipa) 700,000,000 560,000,000 300,000,000
Support to Mission Hospitals (Nguludi and Livingstonia ) 200,000,000
-
-
-
Norway 1,200,000,000 1,200,000,000
-
-
Malawi/German/Norway Initiative on Maternal mortality 1,200,000,000 1,200,000,000
-
-
Norway/GIZ 460,000,000 460,000,000
-
Lilongwe Institute of Orthopaedic and Neuro-Surgery
(Lion) 460,000,000 460,000,000
-
OPEC 5,000,000,000 5,000,000,000
-
-
Construction of Cancer Centre 5,000,000,000 5,000,000,000
-
-
SAUDI Fund 2,539,173,000 2,031,338,400 1,015,669,200
Construction of New Phalombe District Hospital 2,539,173,000 2,031,338,400 1,015,669,200
WB 6,569,000,000 6,569,000,000 11,760,640,000 9,408,512,000 4,561,256,000
Joint Health Fund 6,569,000,000 6,569,000,000 9,153,140,000 7,322,512,000 3,661,256,000
Malawi Nutrition and HIV/AIDS Project 645,000,000 516,000,000 300,000,000
Southern Africa Tuberculosis and Health System Support 1,962,500,000 1,570,000,000 600,000,000
Vote 320-Ministry of Gender, Children, Disability and
Social Welfare 123,000,000
50,000,000 11,425,388,631
GDC (GIZ) 1,955,801,540

57 2018-19 Financial Statement
Category 2017/18 Approved
Estimates
2017/18 Revised
Estimates 2018/19 Estimates
2019/20
Projections
2020/21
Projections
Social Protections 1,955,801,540
GDC (KFW) 6,519,587,091
Social Cash Transfer Programme 6,519,587,091
GoM 123,000,000
50,000,000 100,000,000
Construction of Girls Hostels at Mpemba and Chilwa
Reformatory 123,000,000
50,000,000 100,000,000
WB 2,850,000,000
Investing in Early Years for Growth and Productivity in
Malawi 2,850,000,000
Vote 330-Ministry of Information and Communications
Technology 8,150,000,000 8,150,000,000 8,097,500,000 960,000,000 840,000,000
China 7,000,000,000 7,000,000,000 3,500,000,000
-
-
Backbone Fibre Project 7,000,000,000 7,000,000,000
-
-
Digital Migration Projects 3,500,000,000
GoM 1,150,000,000 1,150,000,000 1,300,000,000 960,000,000 840,000,000
Digital Migration Projects 550,000,000 550,000,000 1,100,000,000 880,000,000 800,000,000
District Information Capacity Enhancement Project 200,000,000 200,000,000 100,000,000
GWAN Enhancement 250,000,000 250,000,000
-
-
NACIT Enhancement 150,000,000 150,000,000 100,000,000
80,000,000
40,000,000
WB 3,297,500,000
Digital Malawi Project 3,297,500,000
Vote 340-Ministry of Home Affairs and Internal Security 500,000,000 400,000,000 1,000,000,000 800,000,000 400,000,000
GoM 500,000,000 400,000,000 1,000,000,000 800,000,000 400,000,000
Construction of New Blantyre Police Station 500,000,000 400,000,000 700,000,000 560,000,000 200,000,000
Katiri Refugee Camp 300,000,000 240,000,000 200,000,000
Vote 341-Malawi Police Service 1,000,000,000 450,000,000 200,000,000 160,000,000 800,000,000

58 2018-19 Financial Statement
Category 2017/18 Approved
Estimates
2017/18 Revised
Estimates 2018/19 Estimates
2019/20
Projections
2020/21
Projections
GoM 1,000,000,000 450,000,000 200,000,000 160,000,000 800,000,000
Programme of Construction of 200 Appartments 1,000,000,000 450,000,000 200,000,000 160,000,000 800,000,000
Vote 342-Malawi Prisons Service 1,250,000,000 320,000,000 700,000,000 560,000,000 500,000,000
GoM 1,250,000,000 320,000,000 700,000,000 560,000,000 500,000,000
Construction of Maximum Security Prison in Lilongwe 500,000,000
90,000,000
-
-
Programme for Self Constructed and Rehabilitation of
Prison cells and staff houses 500,000,000 200,000,000 500,000,000 400,000,000 400,000,000
Sewerage Ponds in Prison 250,000,000
30,000,000 200,000,000 160,000,000 100,000,000
Vote 343-Immigration Department 250,000,000
50,000,000 100,000,000
80,000,000 100,000,000
GoM 250,000,000
50,000,000 100,000,000
80,000,000 100,000,000
Construction and Rehabilitation of Staff Houses 150,000,000
50,000,000 100,000,000
80,000,000 100,000,000
Establishment of 7 Border Posts 100,000,000
-
Vote 353-Administrator General's Department 150,000,000 150,000,000 150,000,000
GoM 150,000,000 150,000,000 150,000,000
Automation of the Deceased Estates Record Management
System 150,000,000 150,000,000 150,000,000
Vote 370-Ministry of Labour, Youth, Sports and
Manpower Development 8,180,000,000 6,450,000,000 10,873,630,050 17,910,523,138 18,350,523,138
AFDB 3,200,000,000 3,200,000,000
-
-
Establishment of Community Colleges and Technical
Tools and Equipment for Trained Youth 3,200,000,000 3,200,000,000
-
-
AfDB/WB 1,333,501,050 8,255,261,569 8,255,261,569
Jobs for Youth 1,333,501,050 8,255,261,569 8,255,261,569
GoM 4,980,000,000 3,250,000,000 6,550,000,000 1,400,000,000 1,840,000,000
Construction of New National Stadium in Blantyre 500,000,000 400,000,000 200,000,000
Construction of Youth Centre in Mzuzu 1,000,000,000 100,000,000

59 2018-19 Financial Statement
Category 2017/18 Approved
Estimates
2017/18 Revised
Estimates 2018/19 Estimates
2019/20
Projections
2020/21
Projections
- - -
Design and Construction of Youth Centre in Blantyre 800,000,000
-
-
-
Establishment of Community Colleges and Technical
Tools and Equipment for Trained Youth 930,000,000 1,500,000,000 1,000,000,000 800,000,000 640,000,000
Rehabilitation of Kamuzu Stadium 1,500,000,000 1,500,000,000
-
-
Rehabilitation of Sports Faciities 150,000,000
50,000,000
-
-
Rehabilitation of Workshop in 7 Technical Schools and
Modernisation of Trade Test Workshops and Infrastructure 400,000,000
-
-
-
Rehabilitation of Youth Centre in Lilongwe 200,000,000 100,000,000 250,000,000 200,000,000 1,000,000,000
Youth Internship Program 4,800,000,000
-
-
WB 2,990,129,000 8,255,261,569 8,255,261,569
Skills Development Program 2,990,129,000 8,255,261,569 8,255,261,569
Vote 390-Ministry of Industry, Trade and Tourism 1,300,000,000 1,030,000,000 2,089,000,700 1,200,000,000 800,000,000
AFDB 889,000,700 100,000,000 100,000,000
Competitiveness and Job Creation Support project 889,000,700 100,000,000 100,000,000
GoM 1,300,000,000 1,030,000,000 1,200,000,000 1,000,000,000 600,000,000
Improvement of Acess Roads to Resort Areas-Salima 700,000,000 230,000,000 1,000,000,000 800,000,000 400,000,000
Micro, Small And Medium Enterprise Business Incubator 300,000,000 300,000,000
-
-
-
Promotion of Agriculture and Development of
Agribusinesses for Small and Medium-sized Enterprises in
Malawi (USADF) 200,000,000 100,000,000 100,000,000 100,000,000
Rural Industralisation- One Village One Product
Programme 300,000,000 300,000,000 100,000,000 100,000,000 100,000,000
USADF
-
- 100,000,000 100,000,000
Promotion of Agriculture and Development of
Agribusinesses for Small and Medium-sized Enterprises in
Malawi (USADF)
-
- 100,000,000 100,000,000
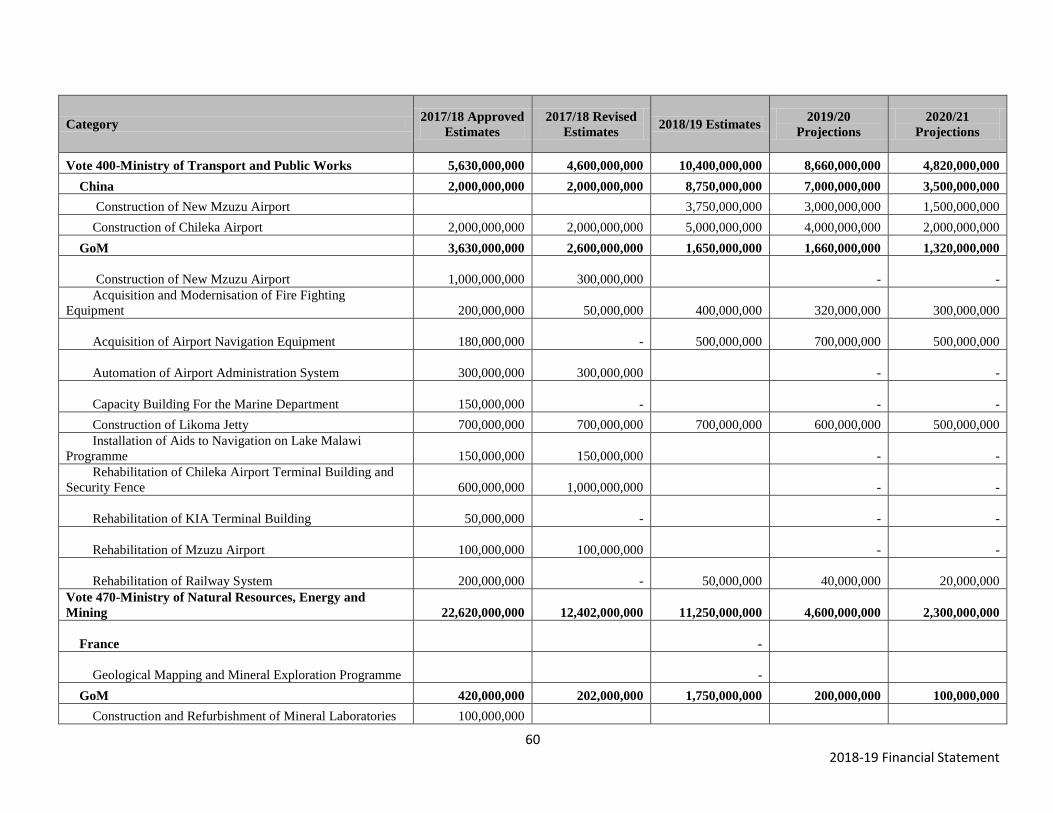
60 2018-19 Financial Statement
Category 2017/18 Approved
Estimates
2017/18 Revised
Estimates 2018/19 Estimates
2019/20
Projections
2020/21
Projections
Vote 400-Ministry of Transport and Public Works 5,630,000,000 4,600,000,000 10,400,000,000 8,660,000,000 4,820,000,000
China 2,000,000,000 2,000,000,000 8,750,000,000 7,000,000,000 3,500,000,000
Construction of New Mzuzu Airport 3,750,000,000 3,000,000,000 1,500,000,000
Construction of Chileka Airport 2,000,000,000 2,000,000,000 5,000,000,000 4,000,000,000 2,000,000,000
GoM 3,630,000,000 2,600,000,000 1,650,000,000 1,660,000,000 1,320,000,000
Construction of New Mzuzu Airport 1,000,000,000 300,000,000
-
-
Acquisition and Modernisation of Fire Fighting
Equipment 200,000,000
50,000,000 400,000,000 320,000,000 300,000,000
Acquisition of Airport Navigation Equipment 180,000,000
- 500,000,000 700,000,000 500,000,000
Automation of Airport Administration System 300,000,000 300,000,000
-
-
Capacity Building For the Marine Department 150,000,000
-
-
-
Construction of Likoma Jetty 700,000,000 700,000,000 700,000,000 600,000,000 500,000,000
Installation of Aids to Navigation on Lake Malawi
Programme 150,000,000 150,000,000
-
-
Rehabilitation of Chileka Airport Terminal Building and
Security Fence 600,000,000 1,000,000,000
-
-
Rehabilitation of KIA Terminal Building
50,000,000
-
-
-
Rehabilitation of Mzuzu Airport 100,000,000 100,000,000
-
-
Rehabilitation of Railway System 200,000,000
-
50,000,000
40,000,000
20,000,000
Vote 470-Ministry of Natural Resources, Energy and
Mining 22,620,000,000 12,402,000,000 11,250,000,000 4,600,000,000 2,300,000,000
France
-
Geological Mapping and Mineral Exploration Programme
-
GoM 420,000,000 202,000,000 1,750,000,000 200,000,000 100,000,000
Construction and Refurbishment of Mineral Laboratories 100,000,000

61 2018-19 Financial Statement
Category 2017/18 Approved
Estimates
2017/18 Revised
Estimates 2018/19 Estimates
2019/20
Projections
2020/21
Projections
10,000,000 50,000,000 40,000,000 20,000,000
Development of Parks and Sanctuaries 100,000,000
20,000,000
-
-
Energy Sector Support Project
50,000,000
50,000,000
-
-
Geological Mapping and Mineral Exploration Programme
50,000,000
30,000,000 200,000,000 160,000,000
80,000,000
Integrated Waste Management 120,000,000
92,000,000
-
-
Youth Tree Planting Program 1,500,000,000
-
-
WB 22,200,000,000 12,200,000,000 9,500,000,000 4,400,000,000 2,200,000,000
Energy Sector Support Project 9,500,000,000 9,500,000,000 4,000,000,000
-
-
Energy Sector Support Projects 2,700,000,000 2,700,000,000
General Electrification Programme 10,000,000,000
-
-
-
Malawi Electricity Access Project
- 5,500,000,000 4,400,000,000 2,200,000,000
601-628: Local Councils Development Budget 17,300,000,000 11,099,148,027 20,749,509,438 22,755,000,000 22,755,000,000
GoM 17,300,000,000 11,099,148,027 20,749,509,438 22,755,000,000 22,755,000,000
Constituency Development Fund 4,439,000,000 4,439,000,000 4,439,000,000
Construction of Water Structures 2,148,000,000
1,391,520,000
2,316,000,000 2,316,000,000 2,316,000,000
Construction of City Roads 10,000,000,000 7,000,000,000
10,000,000,000
10,000,000,000
10,000,000,000
Infrastructure Development Fund 810,509,438 810,509,438 810,509,438
Local Councils Development Part 2 (DDF) 5,152,000,000 2,707,628,027 3,184,000,000 3,184,000,000 3,184,000,000
Grand Total 353,574,000,000 311,822,148,027 391,681,881,811 253,821,271,989 220,950,715,835

62 2018-19 Financial Statement
ANNEX 6 : SUMMARY OF EXPENDITURE BY PROGRAM (K‘MILLION)
Category
2017-18
Approved
2017-18
Revised
2018-19
Estimates
- - - -
20. Management and Administration 140,531
154,790 138,130
30. Presidency Office and Residence Management 3,966
3,966 4,608
31. Presidency Infrastructure and Technical Services 1,169
1,019 1,074
32. Audit Services 1,399
1,244 1,379
33. Adjudication and Case Management 6,344
6,472 8,647
34. Judiciary/Legal Services 544
544 547
35. Legislative and Oversight 9,286
10,464 10,093
97. Governance 3,784
3,543 4,013
36. Executive and Cabinet Support 1,489
1,740 1,892
37. Performance Management and Enforcement 208
208 325
38. National Intelligence Services 1,007
1,007 1,359
39. Special Interventions 235
235 247
40. Public Sector Human Resource Management 34,245
577 64,841
41. Recruitment and Disciplinary Case Management 37
27 179
42. Institutional Support to the Malawi Defence Force 5,304
1,476 1,800
44. Military Service and Operational Support 267
267 365
43. Defence Security 13,249
13,249 20,052
45. Local Government Services 2,163
1,768 1,892
96. Sustainable Rural Development 209,025
228,428 286,517
46. Financial Management 1,832
582 525
65. Primary Health Care 12,574
12,512 14,300
47. Land Administration and Management 2,714
1,814 2,580
48. Housing Management 14,271
13,461 17,502
70. Community and Child Development 601
551 679
03. Tourism and Cultural Development 2,861
2,457 2,527
50. Livestock and Fisheries Production 2,409 4,330

63 2018-19 Financial Statement
Category
2017-18
Approved
2017-18
Revised
2018-19
Estimates
2,459
04. Water Resources Development, Management and Supply 17,679
17,095 16,592
51. Delegated Functions Management 6,806
6,803 14,507
23. Basic Education 33,862
34,102 35,197
24. Secondary Education 33,235
33,370 39,188
52. International Cooperation 20,398
17,325 13,688
53. Public Resource Management 1,162
1,126 798
54. Resource Mobilisation 2,051
1,855 167
55. Economic Management Services 95,769
94,162 113,128
56. Planning and Development 1,095
1,091 2,698
57. Accounting System 13,056
11,008 8,291
58. Cash Management Services 3,492
2,393 1,885
59. Pay Services 29
73 3,194
61. Urban Development 490
440 2,790
60. Local Development 21,736
21,636 15,202
96. Roads Fund Management 13,686
13,686 -
62. Road Infrastructure Management 71,050
64,050 85,953
63. Statistical Services 3,775
3,590 6,869
64. Financial Intelligence Services 392
382 558
26. Support to Service Delivery 29,821
29,799 29,802
66. Secondary Health Care 439
425 -
67. Tertiary Health Care 8,252
8,409 -
68. National Level Health Programs 714
724 -
21. Health Services - - 35,326
22. Services for Environmental and Social Determinats of
Health - - 545
69. Gender Equality and Economic Empowerment 130
130 69
71. Social Protection and Development 2,582
2,275 2,746
99. Child Development and Protection 680
680 763

64 2018-19 Financial Statement
Category
2017-18
Approved
2017-18
Revised
2018-19
Estimates
11. Communication and Technology Services 1,139
1,117 9,143
72. Information and Civic Education 259
259 204
15. Security Services 10,500
10,710 2,354
74. Public Safety and Security Services 21,348
21,348 34,281
75. Prison Security, Humane Treatment and Skills
Development 6,512
5,582 7,433
76. Immigration Services 1,431
1,444 1,504
77. Civil Litigation Services and Legal Advice 353
322 339
78. Legislative Drafting Services 204
204 234
79. Democratic Governance 100
94 53
80. Public Prosecutions 1,000
1,020 1,223
81. Deceased Estates Management 353
349 320
18. Labour Employment and Manpower Development 662
695 5,585
84. Technical and Vocational Training 2,913
3,038 5,688
83. Youth Development 5,039
3,539 1,560
95. Sports and Culture 2,352
1,952 1,252
85. Trade Development and Facilitation 1,218
1,037 906
86. Industrial Development 173
151 112
87. Private Sector Development 60
43 961
88. Small Scale Business Development 765
927 402
73. Tourism Development 1,089
632 1,361
89. Transport Infrastructure 10,353
9,272 15,923
98 - Human rights 305
286 480
90. Electoral Services 9,724
8,934 28,434
92. Environment and Climate Change Management 4,077
4,964 6,642
91. Mining and Geological Services 694
559 1,238
13. Energy Generation and Supply 22,417
12,417 11,766
93. Wild Conservation and Management 1,212
1,132 1,340

65 2018-19 Financial Statement
Category
2017-18
Approved
2017-18
Revised
2018-19
Estimates
82. Legal Assistance 292
293 456
94. Public Complaints and Resolution 296
259 310
49. Agricultural Productivity and Risk Management 94,856
130,087 52,677
25. Higher Education 749
765 5,061
19. Statutory Services 189,119
189,312 198,404
17.Subvented Organisations 77,853
69,730 86,185
Grand Total 1,323,313 1,313,966 1,504,191

66 2018-19 Financial Statement
ANNEX 7: OVERALL SUMMARY OF ESTIMATES AT ITEM LEVEL 2018/19
FINANCIAL YEAR (K’ MILLION)
Category 2017-18 Approved. 2017-18 Revised. 2018-19 Estimates.
01 - Domestic Interest Payments
163,439
153,632
168,563
02 - Foreign Interest Payments
13,880
13,880
14,341
05 - Pensions
48,601
48,601
50,639
06 - Gratuities
20,009
20,017
30,000
07 - Compensations
5,000
5,315
5,010
08 - Refunds
3
2
20
10 - Salaries
159,290
141,771
205,523
11 - Other allowances
9,233
9,374
15,660
12 - Foreign allowance and benefits
7,455
5,096
4,225
21 - Internal travel
27,665
28,745
40,850
22 - External travel
7,625
7,781
8,567
23 - Public Utilities
11,243
11,172
14,714
24 - Office supplies and expenses
26,848
28,213
31,829
25 - Medical supplies and expense
23,711
23,741
25,302
26 - Rents
9,003
11,942
10,732
27 - Education supplies and services
10,132
10,277
14,395
28 - Training expenses
8,938
8,508
7,642
29 - Acquisition of technical services
99,265
86,746
100,553
30 - Insurance expenses
286
277
306
31 - Agricultural Inputs
42,424
79,958
27,087
32 - Food and rations
8,151
8,140
9,961
33 - Other goods and services
9,495
12,740
24,833
34 - Motor vehicle running expenses
16,922
16,918
20,159
35 - Routine Maintenance of Assets
8,667
7,669
28,996
36 - Agricultural Subsidies
27,021
26,400
42,089
39 - Grants to International Organisations
9,343
8,026
6,652

67 2018-19 Financial Statement
Category 2017-18 Approved. 2017-18 Revised. 2018-19 Estimates.
40 - Grants and Subventions
316,333
332,628
359,998
41 - Acquisition of Fixed Assets
226,185
199,914
222,820
61 - Loans to Domestic Non-Financial
Institutions
7,146
6,481
12,724
Grand Total
1,323,313
1,313,966
1,504,191

68 2018-19 Financial Statement
ANNEX 8: REVENUE OVERVIEW
Type of Tax
Approved
2017/18
Revised
2017/18 Estimate 2018/19
Projection
2019/20
Projection
2020/21
1. PAYE 254,578,359,409 237,944,979,536 261,178,527,670 287,296,380,437 316,026,018,481
2. COMPANY TAX
a. Company Assessment 27,293,543,715 30,345,366,087 38,141,431,816 41,955,574,997 46,151,132,497
b. Provisional Tax 76,264,688,377 72,767,205,189 82,221,098,626 90,443,208,489 99,487,529,338
3. WITHHOLDING TAX 78,103,185,878 72,295,772,256 75,137,639,024 82,651,402,926 90,916,543,219
4. IMPORT DUTY 85,005,622,306 78,336,130,257 78,033,525,246 85,836,877,770 94,420,565,547
5. VAT
a. Import VAT 157,715,203,181 149,031,226,234 145,506,706,010 160,057,376,611 176,063,114,273
b. Domestic VAT 134,019,048,128 144,411,168,944 169,006,453,094 185,907,098,404 204,497,808,244
6. MISCELLANEOUS DUTIES 1,012,303,810 1,360,478,886 3,998,249,201 4,398,074,121 4,837,881,534
7. EXCISE DUTIES
a. Import Excise 50,559,885,608 46,853,733,703 48,510,648,469 53,361,713,316 58,697,884,648
b. Local Excise 32,535,287,856 36,173,263,482 38,873,934,133 42,761,327,546 47,037,460,301
8. OTHER TAXES
a. Fringe Benefit 10,688,124,934 10,461,879,823 12,099,965,490 13,309,962,040 14,640,958,243
b. Non-Resident Tax 9,753,247,940 11,915,664,686 8,597,807,477 9,457,588,225 10,403,347,047
c. Penalties 2,263,508,081 1,863,735,010 2,061,682,318 2,267,850,549 2,494,635,604
d. Dividend Tax 3,106,687,567 3,952,548,482 5,667,420,737 6,234,162,811 6,857,579,092
e. Turnover tax 19,586,060 28,313,093 32,847,345 36,132,080 39,745,288
f. Tax arrears
g. Prepayments 891,116,027 185,466,461 45,160,880 49,676,968 54,644,664
Gross Collection 923,809,398,875 897,926,932,126 969,113,097,537 1,066,024,407,291 1,172,626,848,020
Tax Refunds 23,095,234,972 24,241,426,018 29,073,392,926 31,980,732,219 35,178,805,441
Net tax collection 900,714,163,903 873,685,506,108 940,039,704,611 1,034,043,675,072 1,137,448,042,580
Departmental Receipts and Treasury Fund 25,233,171,951 24,418,073,588 30,972,800,000 29,545,869,042 32,500,455,946
Road Levy 26,228,922,911 28,131,399,258 32,780,136,000 32,758,149,600 36,033,964,560
Parastatal dividends 20,649,040,462 19,391,352,296 24,918,433,243 21,330,487,525 23,463,536,278
Rural Electrification Levy -
15,618,664,000 17,180,530,400 18,898,583,440
Storage Levy 1,850,892,127 1,873,419,094 1,980,000,000 2,178,000,000 2,395,800,000
Road Tax 5,482,473,069 5,620,256,285 5,940,000,000 6,534,000,000 7,187,400,000
Proceeds from Privatisation
Non Tax Total 79,444,500,520 79,434,500,520 112,210,033,243 109,527,036,567 120,479,740,224
Total Revenue (Net) 980,158,664,423 953,120,006,628 1,052,249,737,854 1,143,570,711,640 1,257,927,782,803

69 2018-19 Financial Statement
ANNEX 9: DEPARTMENTAL RECEIPTS OVERVIEW
MDA
2017/18
Approved 2017/18-Revised
2018/19
Estimate
2019/20
Projection
2020/21
Projection
Accountant General Department
138,900,000
138,900,000
150,000,000
165,000,000
181,500,000
Administrator General
Department
300,000 -
300,000
330,000
363,000
Ministry of Agriculture, Irrigation
and Water Development
200,000,000
200,000,000
195,000,000
214,500,000
235,950,000
Department of Civil Aviation
5,300,000,000
5,300,000,000
6,600,000,000
7,260,000,000
7,986,000,000
Ministry of Civic Education,
Culture and Community
Development
54,217,200
54,217,200
20,000,000
22,000,000
24,200,000
Ministry of Education, Science
and Technology
900,000,000
534,484,404
580,000,000
638,000,000
701,800,000
Ministry of Finance, Economic
Planning and Development
100,000,000
100,000,000
175,000,000
192,500,000
211,750,000
Fisheries Department
20,000,000
20,000,000
20,000,000
22,000,000
24,200,000
Department of Geological Survey
16,000,000
16,000,000
10,000,000
11,000,000
12,100,000
Ministry of Health and Population
250,000,000
250,000,000
257,000,000
282,700,000
310,970,000
Department of Immigration
9,500,000,000
9,500,000,000
13,000,000,000
14,300,000,000
15,730,000,000
Information
25,000,000
25,000,000
26,000,000
28,600,000
31,460,000
Judiciary
40,000,000
40,000,000
81,000,000
89,100,000
98,010,000
Ministry of Labour and Social
Services,Youth Sports
304,750,000
304,750,000
305,000,000
335,500,000
369,050,000
Lands, Housing and Physical
Planning
1,200,000,000
1,200,000,000
1,450,000,000
1,595,000,000
1,754,500,000
Marine Department
12,500,000
12,500,000
12,500,000
13,750,000
15,125,000
Meteorogical services
1,500,000
1,500,000
1,500,000
1,650,000
1,815,000
Department of Mines
400,000,000
450,000,000
500,000,000
550,000,000
605,000,000
the National Statistical
Office(NSO)
1,000,000
1,000,000
1,000,000
1,100,000
1,210,000
ODPP
28,000,000
30,000,000
30,000,000
33,000,000
36,300,000
Police
2,500,000,000
2,500,000,000
2,500,000,000
2,750,000,000
3,025,000,000
Prisons
13,500,000
13,500,000
13,500,000
14,850,000
16,335,000
Railway Services
750,000,000
750,000,000
800,000,000
880,000,000
968,000,000
Registrar General
1,710,000,000
1,710,000,000
2,500,000,000
2,750,000,000
3,025,000,000
Trade and Industry
245,000,000
245,000,000
245,000,000
269,500,000
296,450,000
Treasury Funds
1,500,000,000
1,650,000,000
1,815,000,000
TOTAL
23,732,667,200
23,396,851,604
30,972,800,000
32,420,080,000
35,662,088,000

70 2018-19 Financial Statement
ANNEX 10: PUBLIC DEBT DEFINITIONS
Definition of risk
Risk refers to the potential for the cost of debt to deviate from its expected outcome. This stems from
unexpected variations of different economic variables such as interest rate and exchange rate. Market risk,
operational risk and liquidity risk are the types of risks associated with Malawi’s public debt portfolio. It is
important to assess the risks associated with the debt portfolio because such information enables decision
makers to design forward-looking strategies on the optimal debt structure in terms of maturity, interest rate
and exchange rate. In this analysis, exposure of the debt portfolio to risk is captured using the following risk
indicators: refinancing risk, interest risk and exchange risk.
Refinancing risk
Refinancing (rollover) risk is the possibility of having the debt to be rolled over at a higher interest
rate. Two measures are used to assess the exposure of Malawi’s public debt to refinancing risk,
namely: the maturity/redemption profile of debt and the Average Time to Maturity (ATM) of the
debt stock as discussed below.
Refinancing Risk Analysis using Redemption Profile
The redemption profile refers to the outstanding debt stock or the amount of debt that is falling due
in a given period of time. This indicator shows the specific points of a country’s vulnerability which
is manifested by high debt service payments in the debt repayment schedule. With new loans, it is
feasible to choose repayment profile which does not coincide with humps in the redemption profile.
When choosing the maturity of new borrowing, the redemption profile is useful in highlighting the
specific points of a country’s vulnerability, which is manifested by high debt service payments in
the debt repayment schedule.
Refinancing Risk Using Average Time Maturity
The average time to maturity (ATM) of the debt portfolio is a measure of the refinancing risk of
debt portfolio.ATM measures how long on average it will take to finish paying back the entire
disbursed outstanding dent (roll over).Therefore a low ATM implies higher refinancing risk and
vice versa. It is worth noting that more concessional loans in the debt portfolio will raise ATM
hence reduce the refinancing risk. More domestic short term debt stock e.g. T bills will however
lower ATM and raise refinancing risk.

71 2018-19 Financial Statement
Interest Rate Risk
Interest rate risk is the risk associated with changes in interest rates on the maturing debt. This risk
is measured by Average Time to Re-fixing (ATR). ATR measures the exposure of the debt
portfolio to changes in interest rates. High ATR will indicate low risk, because this will imply that
it will take long to change the interest rate either on variable or fixed interest rate debt. Low ATR
means high interest rate risk because it will take short time to change the interest rate. The longer
the maturity period of debt stock the higher the ATR and low refinancing risk. Conversely short
maturity period associated with T bills will lower ATR and raise refinancing risk
Exchange risk
Exchange risk refers to the exposure of the debt portfolio to changes in exchange rate or the
mismatch between the repayment obligations and the sources of foreign exchange. There are three
methods of quantifying exchange risk of the debt portfolio, namely: the share of external debt in
total debt; the currency composition of the debt portfolio; and degree of currency mismatch
between the debt service obligations and the composition foreign exchange for a given country.

72 2018-19 Financial Statement
ANNEX 11: SUMMARY OF 2018/19 OFF-BUDGET SUPPORT
Off-Budget support is defined, as project support from development partners whose finances are not
directly managed by the Government. In Malawi, a significant proportion of donor support forms
part of Off-Budget support. When Development Partners are providing project support to the
Government of Malawi, they engage Government in different forms as outlined below:
a) The Government directly manages all project activities and implementation, as well as
directly managing all financing issues.
b) The Government directly manages project implementation and procurements, but not
the payments, which are made by the Development Partners agency.
c) The Government manages only the project implementation, while procurement and
payments are managed by the Development Partners organization.
d) The Government manages neither project implementation nor project financing,
which are managed by a Non-Governmental Organization (NGO) or by the donor
organization itself.
Support to Malawi is categorized under Off-Budget if it falls under category b, c and d. Since Off-
Budget support partially uses or does not use country systems at all, it violets the Aid Effectiveness
principles of the Paris Declaration, 2005; the Accra Agenda for Action, 2008; and the Busan
Outcome Document (the Global Partnership for Effective Development Cooperation. (2011). In all
these global agreements, the use of country systems by development partners in the delivery and
management of aid is regarded as a best practice in development cooperation. To this effect,
Government and Development Partners should collaborate to increase support delivered through
government systems and reduce Off-budget support without necessarily reducing the volume of
resources, at the same time maintaining the same level of accountability. The Government must
work to strengthen the systems while Development Partners should support the initiative and use
the system as a first option.

73 2018-19 Financial Statement
ANNEX 12: SUMMARY OF 2018/19 OFF-BUDGET SUPPORT
PROJECT NAME Donor
Grant
or
Loan? Currency
2018/19 FY
Projection
(Donor
Currency)
2018/19FY
Projection (MK) Implementing Agency
Construction of One UN House in Malawi
One UN Grant USD
16,000,000
11,616,611,200
Ministry of Lands,
Housing and Urban
Development
We Effect - Malawi Lake Basin Programme III
Norway Grant NOK
8,000,000
717,473,600
The Development Fund
of Norway
TLC - Management for Adaptation to Climate
Change II Norway Grant NOK
3,500,000
313,894,700
TLC
DF - Sustainable Agriculture Lead Farmer
Programme Norway Grant NOK
5,000,000
448,421,000
The Development Fund
of Norway
CHRR/CEDEP Promotion of LGBT Rights ph. II
Norway Grant NOK
3,231,182
289,785,973
CHRR/CEDEP
AICC - Malawi Agriculture Partnership (MAP) II
Norway Grant NOK
11,100,000
995,494,620
AICC
Malawi Parliament Strengthening Project
Norway Grant NOK
5,000,000
448,421,000
Save the children: Support to inclusive education
Norway Grant NOK
5,000,000
448,421,000
Save the Children
Policy Support for Prioritized Areas for Food
Security and Livelihoods Norway Grant NOK
3,300,000
295,957,860
FAO
Scaling up the Unlocking talent results in reading
and math Norway Grant NOK
10,000,000
896,842,000
Election Support 2019
Norway Grant NOK
18,000,000
1,614,315,600
UNDP/GoM
UNODC Prison Reform Program Norway Grant NOK 7,000,000 627,789,400 UNODC
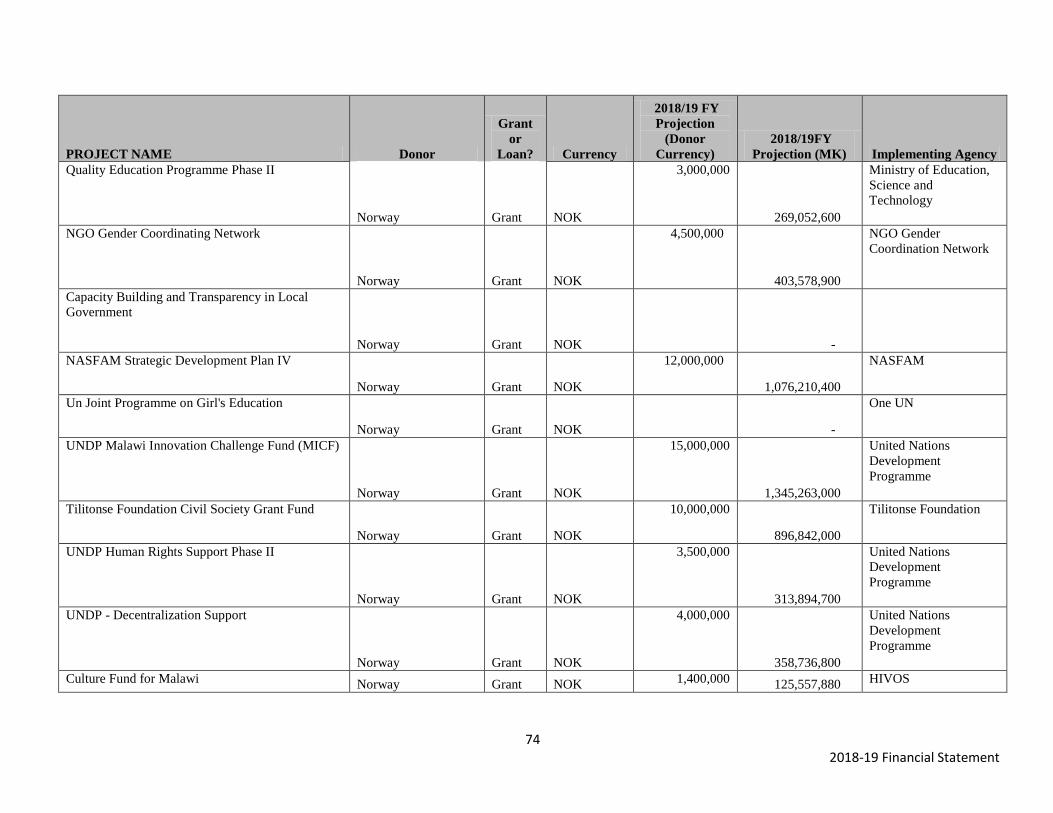
74 2018-19 Financial Statement
PROJECT NAME Donor
Grant
or
Loan? Currency
2018/19 FY
Projection
(Donor
Currency)
2018/19FY
Projection (MK) Implementing Agency
Quality Education Programme Phase II
Norway Grant NOK
3,000,000
269,052,600
Ministry of Education,
Science and
Technology
NGO Gender Coordinating Network
Norway Grant NOK
4,500,000
403,578,900
NGO Gender
Coordination Network
Capacity Building and Transparency in Local
Government
Norway Grant NOK
-
NASFAM Strategic Development Plan IV
Norway Grant NOK
12,000,000
1,076,210,400
NASFAM
Un Joint Programme on Girl's Education
Norway Grant NOK
-
One UN
UNDP Malawi Innovation Challenge Fund (MICF)
Norway Grant NOK
15,000,000
1,345,263,000
United Nations
Development
Programme
Tilitonse Foundation Civil Society Grant Fund
Norway Grant NOK
10,000,000
896,842,000
Tilitonse Foundation
UNDP Human Rights Support Phase II
Norway Grant NOK
3,500,000
313,894,700
United Nations
Development
Programme
UNDP - Decentralization Support
Norway Grant NOK
4,000,000
358,736,800
United Nations
Development
Programme
Culture Fund for Malawi Norway Grant NOK 1,400,000 125,557,880 HIVOS

75 2018-19 Financial Statement
PROJECT NAME Donor
Grant
or
Loan? Currency
2018/19 FY
Projection
(Donor
Currency)
2018/19FY
Projection (MK) Implementing Agency
Establishment of Music Crossroads Academy. in
Malawi, Mozambique and Zim
Norway Grant NOK
1,600,000
143,494,720
Music Crossroads
International
Action Aid Malawi Political Empowerment of
Women Norway Grant NOK
8,000,000
717,473,600
Action Aid
UN Women Women's Empowerment Program
Norway Grant NOK
9,000,000
807,157,800
UN Women
NCA Gender Based Program
Norway Grant NOK
3,000,000
269,052,600
Norwegian Church Aid
Improved local Government and Community
Action in Malawi
EU Grant Euro 43,882 37,741,368
Civil Society
Organizations
Promoting the demand and supply of
transformational local governance in Malawi EU Grant Euro 14,985 12,888,073
Civil Society
Organizations
Strengthening Land Governance System for
Smallholder Farmers in Malawi EU Grant Euro 225,000 193,514,603
Civil Society
Organizations
Technical Cooperation to Strengthen National
Capacity in Implementing Land Policies and Laws
Efficiently and Effectively
EU Grant Euro 200,000 172,012,980
Civil Society
Organizations
Monitoring and Evaluating Global Climate Change
Alliance Activities in Malawi EU Grant Euro 32,011 27,531,538
Civil Society
Organizations
Strengthening Community Resilience to Climate
Change in Blantyre, Zomba, Neno and Phalombe
Districts
EU Grant Euro 693,750 596,670,024
Civil Society
Organizations

76 2018-19 Financial Statement
PROJECT NAME Donor
Grant
or
Loan? Currency
2018/19 FY
Projection
(Donor
Currency)
2018/19FY
Projection (MK) Implementing Agency
Improved Access to Justice for Unrepresented
Accused Persons in the Criminal Justice System in
the Central Region of Malawi
EU Grant Euro 40,000 34,402,596
Civil Society
Organizations
Enhancing the capacity of Civil Society
Organizations (CSOs), district level staff and
communities in Scaling Up Nutrition (SUN)
initiative in Malawi EU Grant Euro 221,211 190,255,817
Civil Society
Organizations
Enhance farmers' capacity to Scale Up Nutrition
(SUN) in Malawi EU Grant Euro 202,493 174,157,122
Civil Society
Organizations
DIVERSIFY - Developing Integrated Value Chains
to Enhance Rural Smallholders' Income and Food
Security Year Round
EU Grant Euro 86,723 74,587,408
GoM
Support to EU Visibility and Communication
EU Grant Euro 41,400 35,606,687
EU
Empowering forest dependent communities
through commercialisation of small-scale forestry
EU Grant Euro 94,573 81,338,918
Department of Forestry
Enhancing Forests for Sustainable Livelihoods
EU Grant Euro -
Contribution Agreement with UNDP for the
Elections Basket Fund EU Grant Euro 1,355,749 1,166,032,128
UNDP/GoM
Contribution to the Improved Trade Statistics and
Information System in Malawi (Contribution
Agreement with International Trade Centre)
EU Grant Euro 29,901 25,716,801
MoITT
ASWAp-GBI - Expenditure Verification and
Financial Audit GBI PE3
EU Grant Euro 12,500 10,750,811
Greenbelt Authority

77 2018-19 Financial Statement
PROJECT NAME Donor
Grant
or
Loan? Currency
2018/19 FY
Projection
(Donor
Currency)
2018/19FY
Projection (MK) Implementing Agency
Long term technical assistance to Department of
Irrigation in Malawi
EU Grant Euro 292,845 251,865,706
Department of
Irrigation (MoAIWD)
Improving water supply, sanitation, hygiene and
solid waste management services to low income
areas of Blantyre
EU Grant Euro 43,116 37,082,558
Blantyre City Council
Poverty Reduction and Improved Health In Peri-
Urban Malawi EU Grant Euro -
MoHP
Provision of Technical Assistance to improving
Secondary Education in Malawi (ISEM)
EU Grant Euro 201,750 173,518,094
MoEST
TA to RRImP EU Grant Euro 300,000 258,019,470
11th EDF identification and formulation
(GROWTH) EU Grant Euro 36,000 30,962,336
National Authorizing
Office (MoFEPD)
Gender sector analysis infrastructure EU Grant Euro 32,000 27,522,077
MoGCDSW
Multi annual programme estimate for public
institutions
EU Grant Euro 1,846,248 1,587,893,101
National Authorizing
Office (MoFEPD)
Visibility and Communication Support Measures
EU Grant Euro 450,000 387,029,205
National Authorizing
Office (MoFEPD)
Production of documentary on Population Growth
in Malawi
EU Grant Euro 83,750 72,030,435
MoHP
Technical assistance to track the legislative process
in Malawi and conduct legal analysis of the Bills
taken to Parliament
EU Grant Euro 12,060 10,372,383
MoJCA

78 2018-19 Financial Statement
PROJECT NAME Donor
Grant
or
Loan? Currency
2018/19 FY
Projection
(Donor
Currency)
2018/19FY
Projection (MK) Implementing Agency
Financial Audit of Peri-urban Sanitation and
Hygiene Project in Mzuzu City
EU Grant Euro 7,470 6,424,685
Mzuzu city council
Monitoring and evaluation of Global Climate
Change Alliance Activities in Malawi
EU Grant Euro 32,011 27,531,538
Department of Climate
Change
Strengthening Community Resilience to Climate
Change in Blantyre, Zomba, Neno and Phalombe
Districts EU Grant Euro 693,750 596,670,024
MoLGRD
UNESCO PAGODA Agreement for the
implementation of parts of the Skills and Technical
Education Programme (STEP)
EU Grant Euro 1,511,246 1,299,769,640
UNESCO
ICRAF - Agro forestry Food Security Programme
Phase II Extended Flanders Grant Euro 340,000 292,422,066
ICRAF
Farm Radio Trust - Scaling up Radio and ICT in
Enhancing Extension Delivery Flanders Grant Euro 25,000 21,501,623
Farm Radio Trust
One UN Fund for the Right to Food Flanders Grant Euro 125,000 107,508,113 UNDP
FAO - Marketing Capacity Building Project for
Smallholder Farmers in Mzimba and Kasungu
Districts Flanders Grant Euro 900,000 774,058,410
Farmers Union of
Malawi
ACE & WFP - Strengthening Farmer Organizations
and Rural Structured Trade Mechanisms in Malawi Flanders Grant Euro 79,141 68,066,396
ACE &WFP
IFPRI - Assessing and enhancing the capacity,
performance and impact of the agricultural
extension system in Malawi Flanders Grant Euro 260,000 223,616,874
International Food
Policy Research
(IFRIP)
Trade line Corporation Limited-Tools for Market
Access Flanders Grant Euro 460,000 395,629,854
Tradeline Corporation
Limited
Malawian German Health programme GDC (GIZ) Grant Euro -
German GIZ

79 2018-19 Financial Statement
PROJECT NAME Donor
Grant
or
Loan? Currency
2018/19 FY
Projection
(Donor
Currency)
2018/19FY
Projection (MK) Implementing Agency
Protracted Relief and Recovery Operations
(PRRO200692) Germany Grant Euro 1,010,031 868,692,316
World Food Program
(WFP)
ARISE ILO Grant USD 250,000 181,509,550
International Labor
Organization
Social Protection ILO Grant USD 150,000 108,905,730
International Labor
Organization
Addressing Irregular Migration - BW10 IOM Grant USD 28,500 20,692,081
Pilot action on AVRR IOM Grant USD -
SRHR IOM Grant USD 86,375 62,711,666
Health Assessment in Africa IOM Grant USD 19,670 14,281,171
Resettlement from Africa IOM Grant USD 9,795 7,111,544
Japan Overseas Cooperation Volunteers (JOCV) JICA Grant Japanese Yen 281,293,000 1,854,114,680 JICA
Project for Promoting Catchment Management
Activities in the Middle Shire (COVAMS) JICA Grant Japanese Yen 92,196,000 607,700,714 JICA
Project for Conservation and Sustainable
Management of Dzalanyama Forest Reserve. JICA Grant Japanese Yen 94,992,000 626,130,269 JICA
Expansion of Domasi College of Education JICA Grant Japanese Yen 486,750,000 3,208,363,950 JICA
Project for Strengthening Early Numeracy Grade
Numeracy JICA T/C Japanese Yen 0 - JICA
Knowledge Co-Creation Training Programme
(KCCP). JICA T/C Japanese Yen 122,566,640 807,885,751 JICA
Market –Oriented Smallholder Horticulture
Empowerment and Promotion Project (MA-SHEP) JICA T/C Japanese Yen 89,014,000 586,726,880 JICA
Capacity Building Project for Sustainable Utilizing
Agriculture Water Management Technologies in
the Republic of Malawi. JICA T/C Japanese Yen 18,900,000 124,577,460 JICA

80 2018-19 Financial Statement
PROJECT NAME Donor
Grant
or
Loan? Currency
2018/19 FY
Projection
(Donor
Currency)
2018/19FY
Projection (MK) Implementing Agency
Project for Enhancing Capacity for Medium
Schemes Development Operation and Maintenance. JICA T/C Japanese Yen 107,414,000 708,008,640 JICA
Water Resource Advisor JICA T/C Japanese Yen 54,491,000 359,171,977 JICA
The Project for Strengthening the Capacity of Non
–Revenue Water Reduction for Lilongwe Water
Board. JICA T/C Japanese Yen 73,338,000 483,400,093 JICA
Project for Expansion of Tedzani Four Hydro
Power station. JICA Grant Japanese Yen 671,800,000 4,428,102,520 JICA
The Project for Capacity Development of Radar
Control Services at KIA JICA T/C Japanese Yen 45,680,000 301,095,152 JICA
Project for Expansion of Terminal Building at KIA JICA Grant Japanese Yen 906,183,333 5,973,016,821 JICA
Project on Capacity Development in Mining Sector JICA TC Japanese Yen 7,500,000 49,435,500 JICA
Private Sector Policy Advisor JICA TC Japanese Yen 24,046,000 158,496,804 JICA
The Project for the Improvement of TV
Broadcasting Equipment and TV Programmes of
MBC JICA Grant Japanese Yen 23,733,333 156,435,891 JICA
Preparatory Survey for the project for improvement
of substations in Lilongwe City JICA Grant Japanese Yen 80,000,000 527,312,000 JICA
Preparatory Survey for the Improvement of Major
Roads in City of Lilongwe JICA Grant Japanese Yen 92,781,000 611,556,683 JICA
African Business Education-ABE (Imitative for
the Youth) JICA TC Japanese Yen 100,000,000 659,140,000 JICA
Expert on 5S KAIZEN –TQM for Hospital
Management JICA TC Japanese Yen 0 - JICA
HIV Prevention USAID Grant USD 27,669 20,088,751
Ministry of Health and
Population

81 2018-19 Financial Statement
PROJECT NAME Donor
Grant
or
Loan? Currency
2018/19 FY
Projection
(Donor
Currency)
2018/19FY
Projection (MK) Implementing Agency
HIV Treatment USAID Grant USD 47,113 34,205,838
Ministry of Health and
Population
Nutrition Services USAID Grant USD 5,000 3,630,191
Ministry of Health and
Population
Curative Health Services-Reproductive Health USAID Grant USD 14,500 10,527,554
Ministry of Health and
Population
Disease Control Services-Malaria USAID Grant USD 22,000 15,972,840
Ministry of Health and
Population
Disease Control Services-TB USAID Grant USD 1,500 1,089,057
Ministry of Health and
Population
Monitoring & Evaluation and Economics for Power
Sector Revitalization Project - MCC/MCA-Malawi MCA Grant USD 1,006,869 731,025,356
Millennium Challenge
Account-Malawi
Programme Administration for Power Sector
Revitalization Project - MCC/MCA-Malawi MCA Grant USD 1,103,810 801,408,226
Millennium Challenge
Account-Malawi
Power Sector Reform Project MCA Grant USD - -
Millennium Challenge
Account-Malawi
Infrastructure Development Project MCA Grant USD 1,167,456 847,617,653
Millennium Challenge
Account-Malawi
Environment and Natural Resources Management
Project MCA Grant USD 536,656 389,632,756
Millennium Challenge
Account-Malawi

82 2018-19 Financial Statement
PROJECT NAME Donor
Grant
or
Loan? Currency
2018/19 FY
Projection
(Donor
Currency)
2018/19FY
Projection (MK) Implementing Agency
Camp Management, Favourable Protection
Environment and Fair Protection Processes Projects
in Dzaleka and Luwani Camps UNHCR Grant USD 140,093 101,712,821
Ministry of Home
Affairs and Internal
Security
Education, Skills Development, WASH,
Environment Protection and Energy Projects in
Dzaleka and Luwani Camps and Surrounding
Communities UNHCR Grant USD 356,350 258,723,387 Jesuit Refugee Service
Core Relief Items and Food Distribution in Dzaleka
and Luwani Camps and Urban UNHCR Grant USD 184,189 133,728,160 Plan International
Primary Health Care, Reproductive Health and HIV
Services in Dzaleka and Luwani Camps and
Surrounding Host Communities UNHCR Grant USD 39,748 28,858,687 Ministry of Health
Self Reliance Project in Dzaleka Camp and
Surrounding Host Communities UNHCR Grant USD 92,154 66,906,997 UNHCR
TOTAL OFF-BUDGET SUPPORT 61,862,148,531